Kimball, TN Map & Demographics
Kimball Map
Kimball Overview
$32,225
PER CAPITA INCOME
$75,833
AVG FAMILY INCOME
$55,815
AVG HOUSEHOLD INCOME
30.7%
WAGE / INCOME GAP [ % ]
69.3¢/ $1
WAGE / INCOME GAP [ $ ]
0.36
INEQUALITY / GINI INDEX
1,438
TOTAL POPULATION
693
MALE POPULATION
745
FEMALE POPULATION
93.02
MALES / 100 FEMALES
107.50
FEMALES / 100 MALES
44.2
MEDIAN AGE
2.8
AVG FAMILY SIZE
2.2
AVG HOUSEHOLD SIZE
749
LABOR FORCE [ PEOPLE ]
62.4%
PERCENT IN LABOR FORCE
3.9%
UNEMPLOYMENT RATE
Kimball Area Codes
Income in Kimball
Income Overview in Kimball
Per Capita Income in Kimball is $32,225, while median incomes of families and households are $75,833 and $55,815 respectively.
| Characteristic | Number | Measure |
| Per Capita Income | 1,438 | $32,225 |
| Median Family Income | 388 | $75,833 |
| Mean Family Income | 388 | $87,190 |
| Median Household Income | 657 | $55,815 |
| Mean Household Income | 657 | $69,724 |
| Income Deficit | 388 | $0 |
| Wage / Income Gap (%) | 1,438 | 30.72% |
| Wage / Income Gap ($) | 1,438 | 69.28¢ per $1 |
| Gini / Inequality Index | 1,438 | 0.36 |
Earnings by Sex in Kimball
Average Earnings in Kimball are $40,300, $44,093 for men and $30,547 for women, a difference of 30.7%.
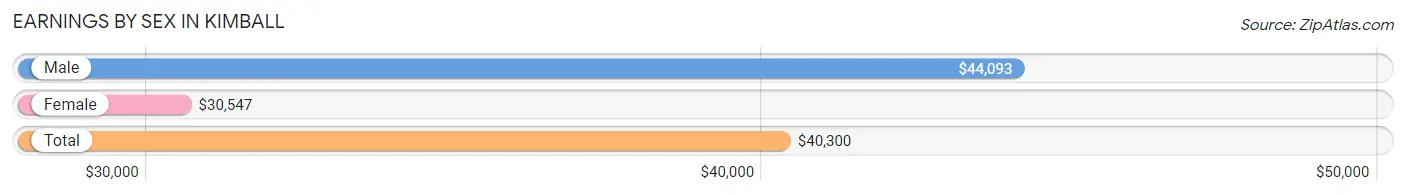
| Sex | Number | Average Earnings |
| Male | 467 (57.1%) | $44,093 |
| Female | 351 (42.9%) | $30,547 |
| Total | 818 (100.0%) | $40,300 |
Earnings by Sex by Income Bracket in Kimball
The most common earnings brackets in Kimball are $40,000 to $44,999 for men (69 | 14.8%) and $55,000 to $64,999 for women (35 | 10.0%).
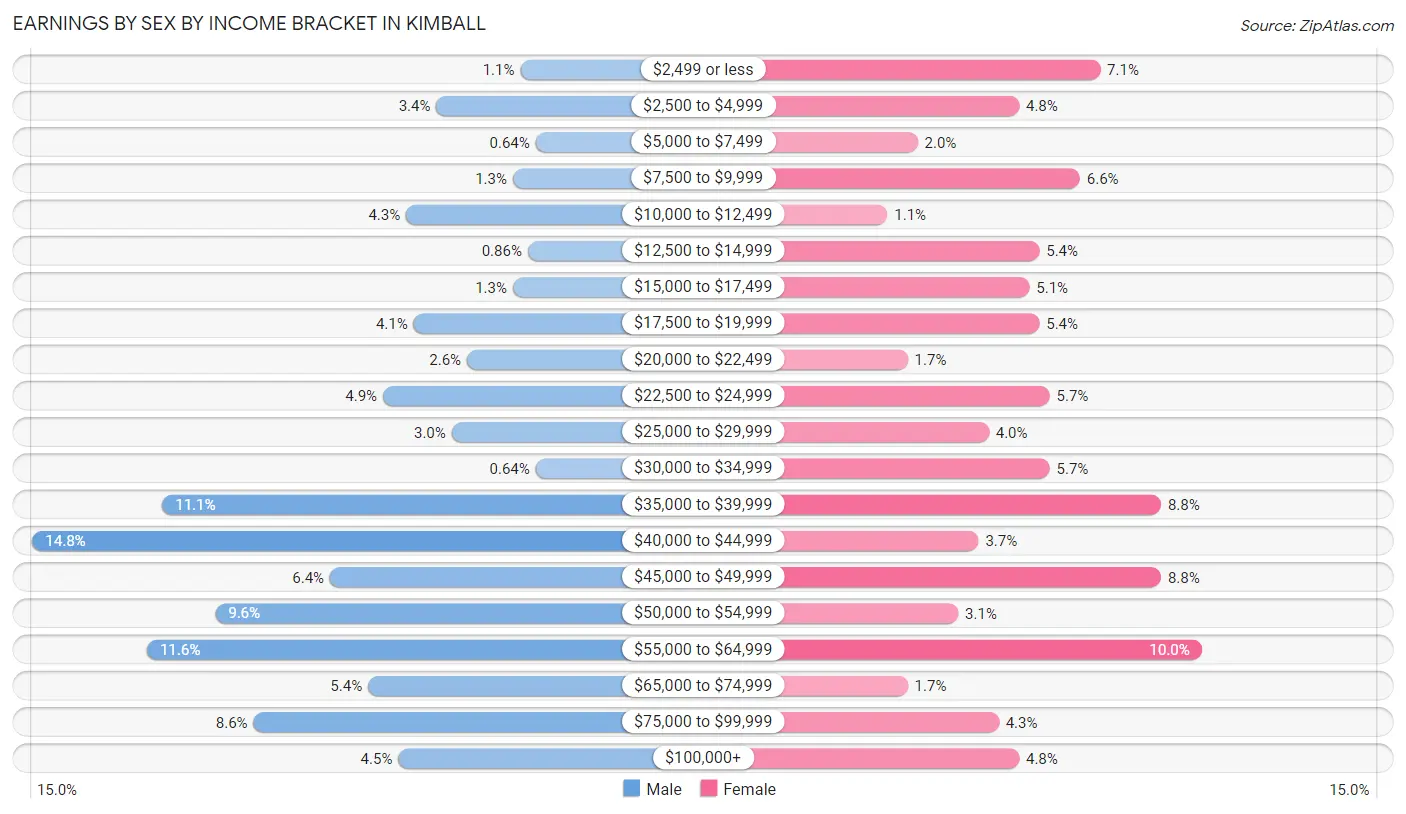
| Income | Male | Female |
| $2,499 or less | 5 (1.1%) | 25 (7.1%) |
| $2,500 to $4,999 | 16 (3.4%) | 17 (4.8%) |
| $5,000 to $7,499 | 3 (0.6%) | 7 (2.0%) |
| $7,500 to $9,999 | 6 (1.3%) | 23 (6.6%) |
| $10,000 to $12,499 | 20 (4.3%) | 4 (1.1%) |
| $12,500 to $14,999 | 4 (0.9%) | 19 (5.4%) |
| $15,000 to $17,499 | 6 (1.3%) | 18 (5.1%) |
| $17,500 to $19,999 | 19 (4.1%) | 19 (5.4%) |
| $20,000 to $22,499 | 12 (2.6%) | 6 (1.7%) |
| $22,500 to $24,999 | 23 (4.9%) | 20 (5.7%) |
| $25,000 to $29,999 | 14 (3.0%) | 14 (4.0%) |
| $30,000 to $34,999 | 3 (0.6%) | 20 (5.7%) |
| $35,000 to $39,999 | 52 (11.1%) | 31 (8.8%) |
| $40,000 to $44,999 | 69 (14.8%) | 13 (3.7%) |
| $45,000 to $49,999 | 30 (6.4%) | 31 (8.8%) |
| $50,000 to $54,999 | 45 (9.6%) | 11 (3.1%) |
| $55,000 to $64,999 | 54 (11.6%) | 35 (10.0%) |
| $65,000 to $74,999 | 25 (5.3%) | 6 (1.7%) |
| $75,000 to $99,999 | 40 (8.6%) | 15 (4.3%) |
| $100,000+ | 21 (4.5%) | 17 (4.8%) |
| Total | 467 (100.0%) | 351 (100.0%) |
Earnings by Sex by Educational Attainment in Kimball
Average earnings in Kimball are $46,346 for men and $36,000 for women, a difference of 22.3%. Men with an educational attainment of graduate degree enjoy the highest average annual earnings of $72,679, while those with less than high school education earn the least with $42,411. Women with an educational attainment of graduate degree earn the most with the average annual earnings of $42,083, while those with bachelor's degree education have the smallest earnings of $35,250.
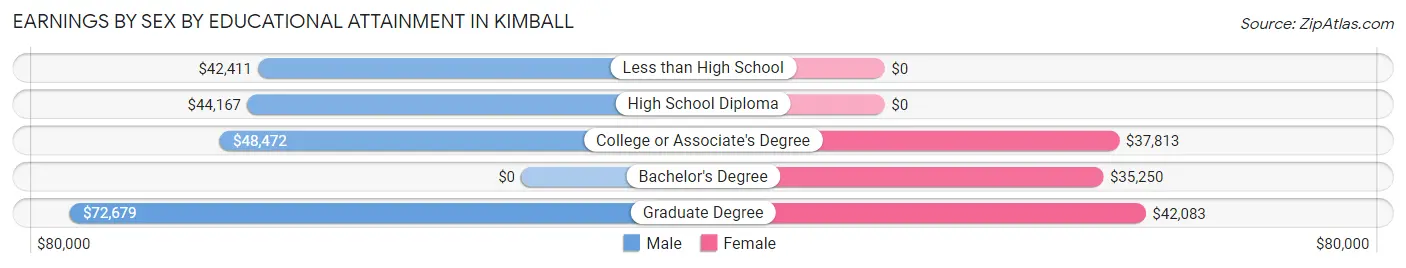
| Educational Attainment | Male Income | Female Income |
| Less than High School | $42,411 | $0 |
| High School Diploma | $44,167 | $0 |
| College or Associate's Degree | $48,472 | $37,813 |
| Bachelor's Degree | - | - |
| Graduate Degree | $72,679 | $42,083 |
| Total | $46,346 | $36,000 |
Family Income in Kimball
Family Income Brackets in Kimball
According to the Kimball family income data, there are 99 families falling into the $50,000 to $74,999 income range, which is the most common income bracket and makes up 25.5% of all families. Conversely, the less than $10,000 income bracket is the least frequent group with only 3 families (0.8%) belonging to this category.
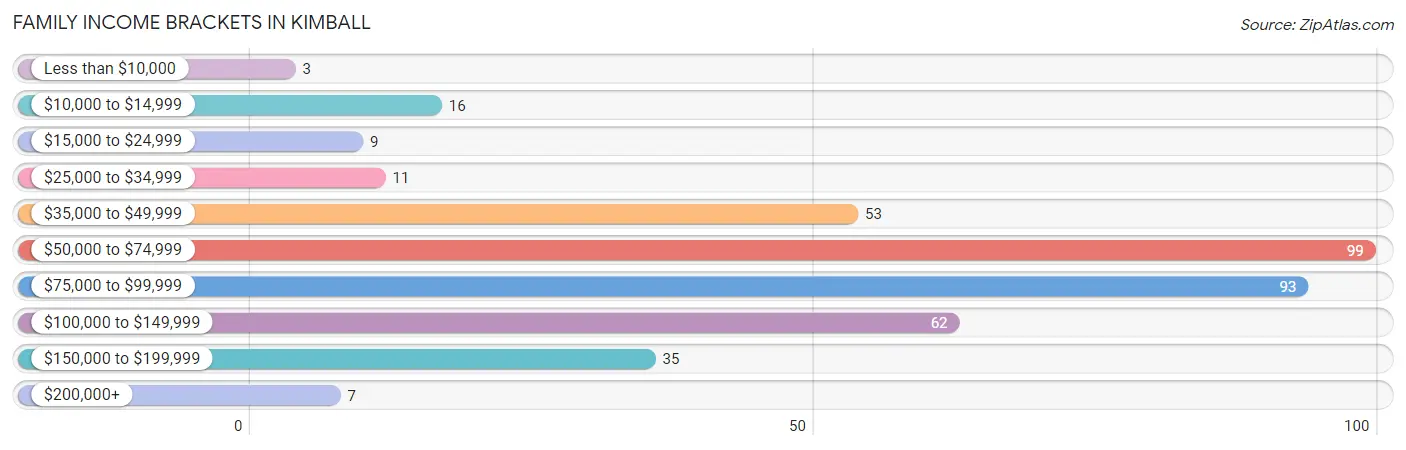
| Income Bracket | # Families | % Families |
| Less than $10,000 | 3 | 0.8% |
| $10,000 to $14,999 | 16 | 4.1% |
| $15,000 to $24,999 | 9 | 2.3% |
| $25,000 to $34,999 | 11 | 2.8% |
| $35,000 to $49,999 | 53 | 13.7% |
| $50,000 to $74,999 | 99 | 25.5% |
| $75,000 to $99,999 | 93 | 24.0% |
| $100,000 to $149,999 | 62 | 16.0% |
| $150,000 to $199,999 | 35 | 9.0% |
| $200,000+ | 7 | 1.8% |
Family Income by Famaliy Size in Kimball
5-person families (14 | 3.6%) account for the highest median family income in Kimball with $83,611 per family, while 2-person families (218 | 56.2%) have the highest median income of $36,875 per family member.
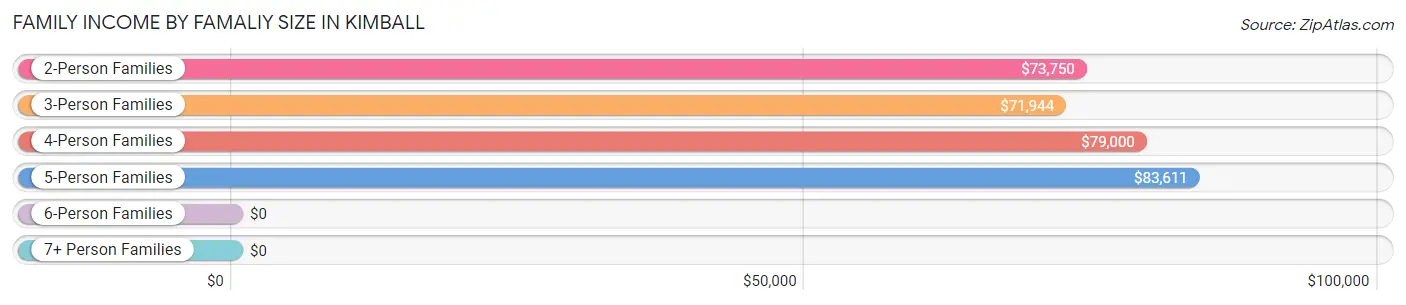
| Income Bracket | # Families | Median Income |
| 2-Person Families | 218 (56.2%) | $73,750 |
| 3-Person Families | 98 (25.3%) | $71,944 |
| 4-Person Families | 46 (11.9%) | $79,000 |
| 5-Person Families | 14 (3.6%) | $83,611 |
| 6-Person Families | 4 (1.0%) | $0 |
| 7+ Person Families | 8 (2.1%) | $0 |
| Total | 388 (100.0%) | $75,833 |
Family Income by Number of Earners in Kimball
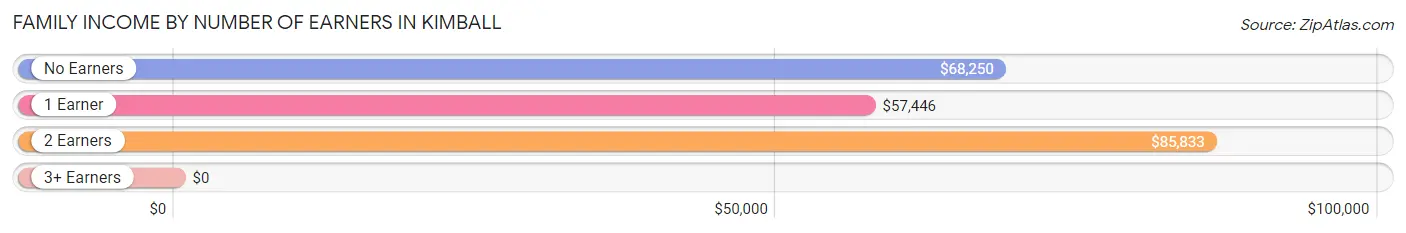
| Number of Earners | # Families | Median Income |
| No Earners | 50 (12.9%) | $68,250 |
| 1 Earner | 143 (36.9%) | $57,446 |
| 2 Earners | 158 (40.7%) | $85,833 |
| 3+ Earners | 37 (9.5%) | $0 |
| Total | 388 (100.0%) | $75,833 |
Household Income in Kimball
Household Income Brackets in Kimball
With 166 households falling in the category, the $50,000 to $74,999 income range is the most frequent in Kimball, accounting for 25.3% of all households. In contrast, only 8 households (1.2%) fall into the $200,000+ income bracket, making it the least populous group.
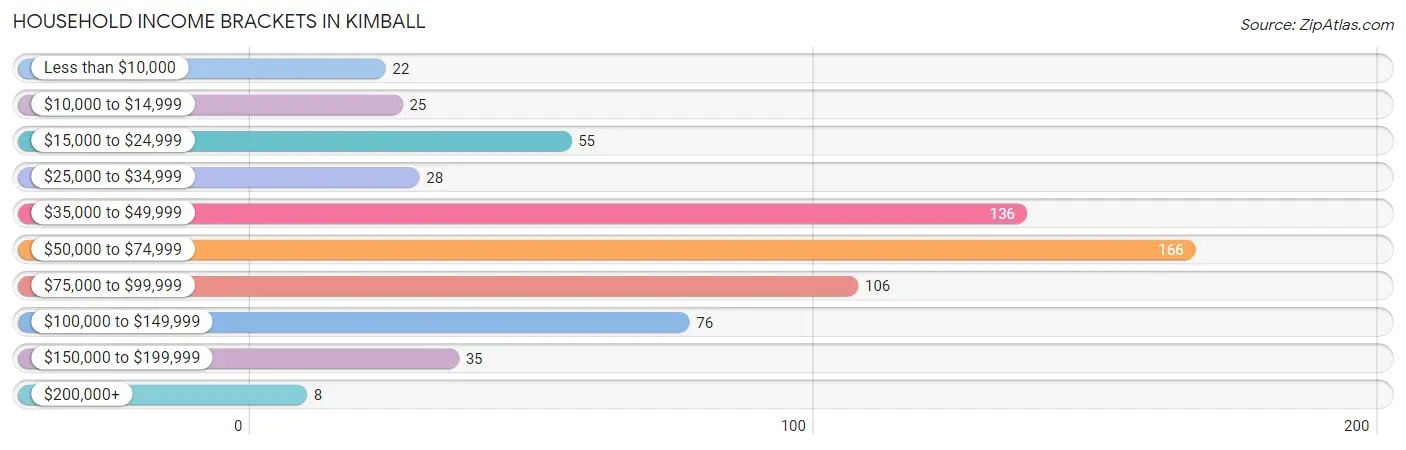
| Income Bracket | # Households | % Households |
| Less than $10,000 | 22 | 3.3% |
| $10,000 to $14,999 | 25 | 3.8% |
| $15,000 to $24,999 | 55 | 8.4% |
| $25,000 to $34,999 | 28 | 4.3% |
| $35,000 to $49,999 | 136 | 20.7% |
| $50,000 to $74,999 | 166 | 25.3% |
| $75,000 to $99,999 | 106 | 16.1% |
| $100,000 to $149,999 | 76 | 11.6% |
| $150,000 to $199,999 | 35 | 5.3% |
| $200,000+ | 8 | 1.2% |
Household Income by Householder Age in Kimball
The median household income in Kimball is $55,815, with the highest median household income of $68,500 found in the 45 to 64 years age bracket for the primary householder. A total of 226 households (34.4%) fall into this category. Meanwhile, the 15 to 24 years age bracket for the primary householder has the lowest median household income of $0, with 27 households (4.1%) in this group.
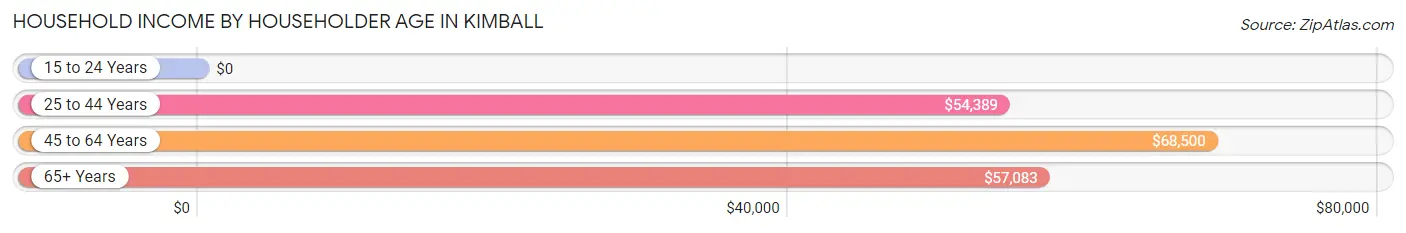
| Income Bracket | # Households | Median Income |
| 15 to 24 Years | 27 (4.1%) | $0 |
| 25 to 44 Years | 188 (28.6%) | $54,389 |
| 45 to 64 Years | 226 (34.4%) | $68,500 |
| 65+ Years | 216 (32.9%) | $57,083 |
| Total | 657 (100.0%) | $55,815 |
Poverty in Kimball
Income Below Poverty by Sex and Age in Kimball
With 7.8% poverty level for males and 7.8% for females among the residents of Kimball, 18 to 24 year old males and under 5 year old females are the most vulnerable to poverty, with 14 males (28.0%) and 11 females (44.0%) in their respective age groups living below the poverty level.
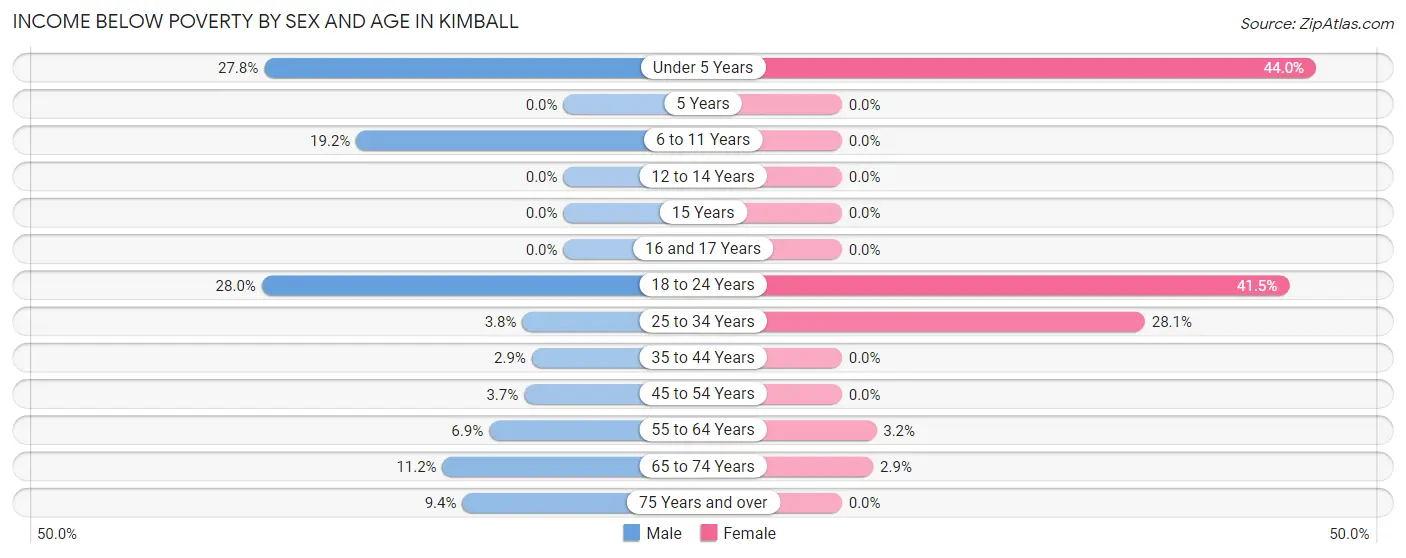
| Age Bracket | Male | Female |
| Under 5 Years | 5 (27.8%) | 11 (44.0%) |
| 5 Years | 0 (0.0%) | 0 (0.0%) |
| 6 to 11 Years | 5 (19.2%) | 0 (0.0%) |
| 12 to 14 Years | 0 (0.0%) | 0 (0.0%) |
| 15 Years | 0 (0.0%) | 0 (0.0%) |
| 16 and 17 Years | 0 (0.0%) | 0 (0.0%) |
| 18 to 24 Years | 14 (28.0%) | 22 (41.5%) |
| 25 to 34 Years | 4 (3.8%) | 18 (28.1%) |
| 35 to 44 Years | 3 (2.9%) | 0 (0.0%) |
| 45 to 54 Years | 5 (3.6%) | 0 (0.0%) |
| 55 to 64 Years | 4 (6.9%) | 4 (3.2%) |
| 65 to 74 Years | 11 (11.2%) | 3 (2.9%) |
| 75 Years and over | 3 (9.4%) | 0 (0.0%) |
| Total | 54 (7.8%) | 58 (7.8%) |
Income Above Poverty by Sex and Age in Kimball
According to the poverty statistics in Kimball, males aged 5 years and females aged 5 years are the age groups that are most secure financially, with 100.0% of males and 100.0% of females in these age groups living above the poverty line.
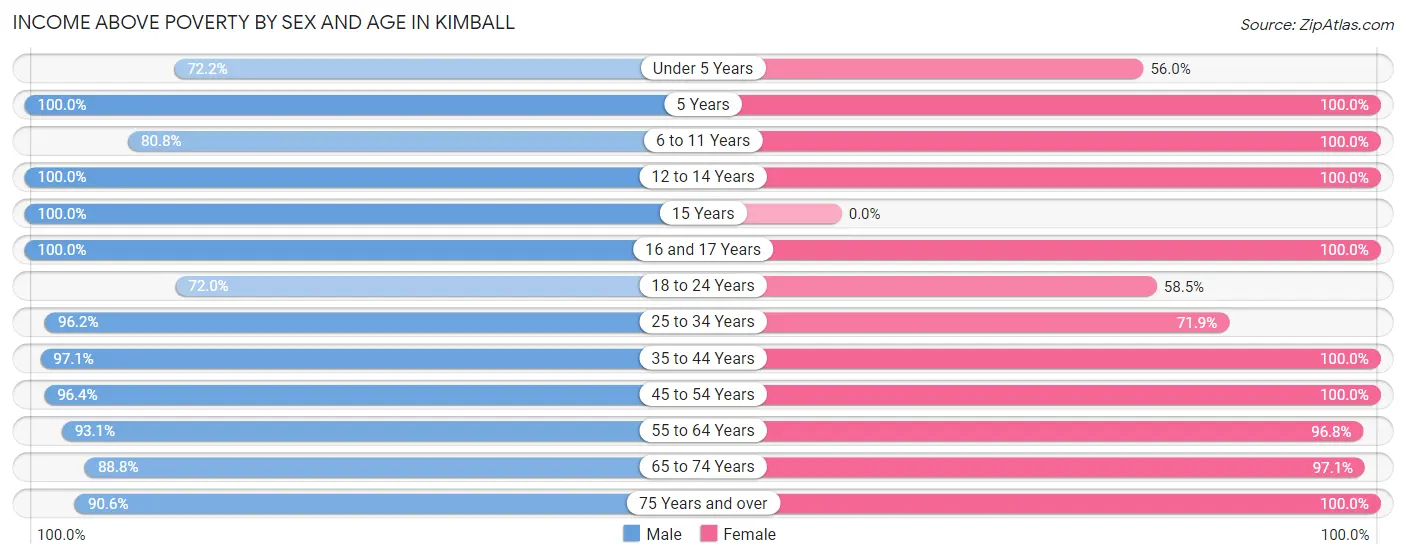
| Age Bracket | Male | Female |
| Under 5 Years | 13 (72.2%) | 14 (56.0%) |
| 5 Years | 2 (100.0%) | 5 (100.0%) |
| 6 to 11 Years | 21 (80.8%) | 68 (100.0%) |
| 12 to 14 Years | 39 (100.0%) | 46 (100.0%) |
| 15 Years | 8 (100.0%) | 0 (0.0%) |
| 16 and 17 Years | 18 (100.0%) | 26 (100.0%) |
| 18 to 24 Years | 36 (72.0%) | 31 (58.5%) |
| 25 to 34 Years | 101 (96.2%) | 46 (71.9%) |
| 35 to 44 Years | 99 (97.1%) | 80 (100.0%) |
| 45 to 54 Years | 132 (96.4%) | 60 (100.0%) |
| 55 to 64 Years | 54 (93.1%) | 121 (96.8%) |
| 65 to 74 Years | 87 (88.8%) | 100 (97.1%) |
| 75 Years and over | 29 (90.6%) | 90 (100.0%) |
| Total | 639 (92.2%) | 687 (92.2%) |
Income Below Poverty Among Married-Couple Families in Kimball
The poverty statistics for married-couple families in Kimball show that 6.6% or 19 of the total 287 families live below the poverty line. Families with 1 or 2 children have the highest poverty rate of 17.5%, comprising of 17 families. On the other hand, families with 3 or 4 children have the lowest poverty rate of 0.0%, which includes 0 families.
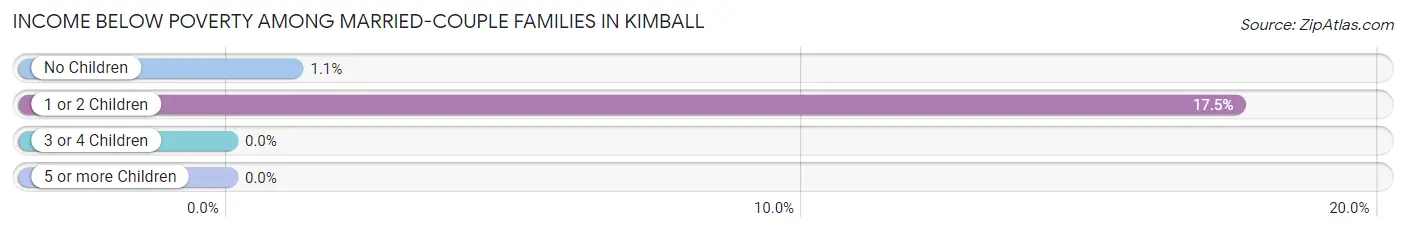
| Children | Above Poverty | Below Poverty |
| No Children | 174 (98.9%) | 2 (1.1%) |
| 1 or 2 Children | 80 (82.5%) | 17 (17.5%) |
| 3 or 4 Children | 6 (100.0%) | 0 (0.0%) |
| 5 or more Children | 8 (100.0%) | 0 (0.0%) |
| Total | 268 (93.4%) | 19 (6.6%) |
Income Below Poverty Among Single-Parent Households in Kimball
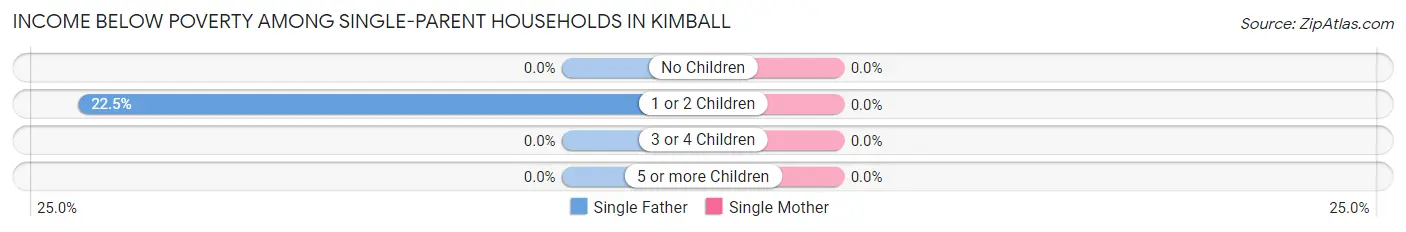
| Children | Single Father | Single Mother |
| No Children | 0 (0.0%) | 0 (0.0%) |
| 1 or 2 Children | 9 (22.5%) | 0 (0.0%) |
| 3 or 4 Children | 0 (0.0%) | 0 (0.0%) |
| 5 or more Children | 0 (0.0%) | 0 (0.0%) |
| Total | 9 (22.0%) | 0 (0.0%) |
Income Below Poverty Among Married-Couple vs Single-Parent Households in Kimball
The poverty data for Kimball shows that 19 of the married-couple family households (6.6%) and 9 of the single-parent households (8.9%) are living below the poverty level. Within the married-couple family households, those with 1 or 2 children have the highest poverty rate, with 17 households (17.5%) falling below the poverty line. Among the single-parent households, those with 1 or 2 children have the highest poverty rate, with 9 household (17.6%) living below poverty.
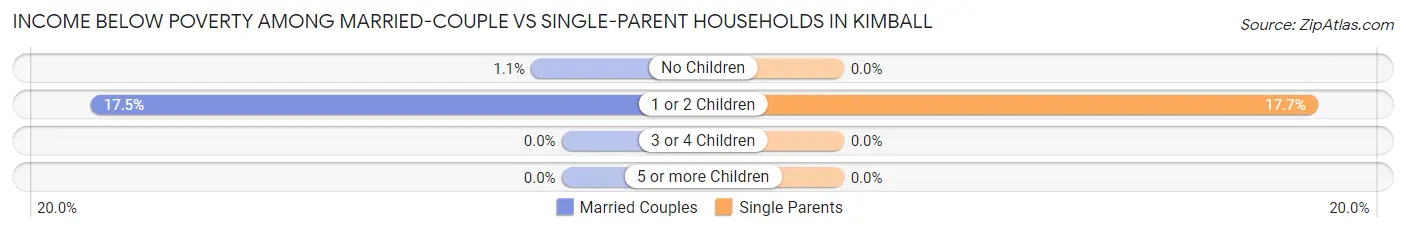
| Children | Married-Couple Families | Single-Parent Households |
| No Children | 2 (1.1%) | 0 (0.0%) |
| 1 or 2 Children | 17 (17.5%) | 9 (17.6%) |
| 3 or 4 Children | 0 (0.0%) | 0 (0.0%) |
| 5 or more Children | 0 (0.0%) | 0 (0.0%) |
| Total | 19 (6.6%) | 9 (8.9%) |
Race in Kimball
The most populous races in Kimball are White / Caucasian (1,324 | 92.1%), Hispanic or Latino (67 | 4.7%), and Asian (43 | 3.0%).
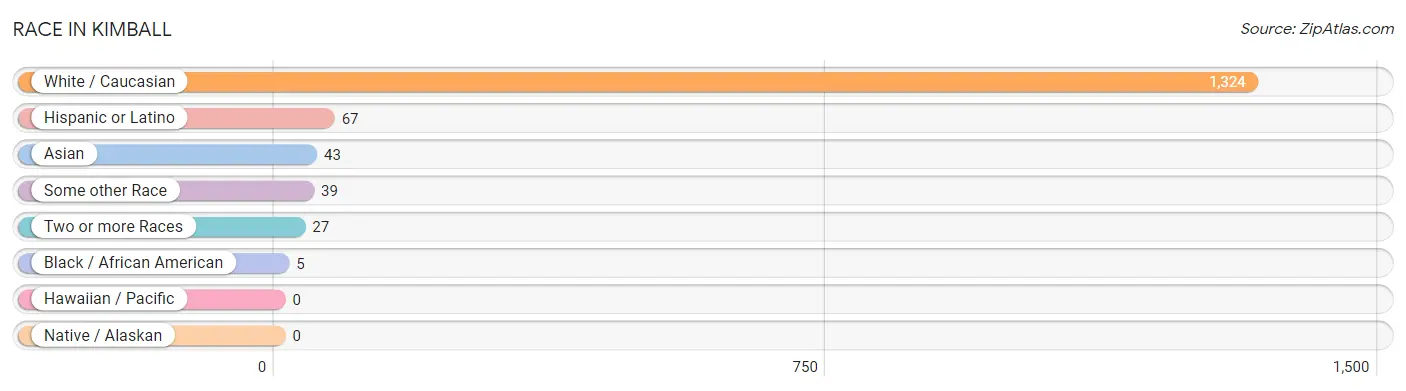
| Race | # Population | % Population |
| Asian | 43 | 3.0% |
| Black / African American | 5 | 0.4% |
| Hawaiian / Pacific | 0 | 0.0% |
| Hispanic or Latino | 67 | 4.7% |
| Native / Alaskan | 0 | 0.0% |
| White / Caucasian | 1,324 | 92.1% |
| Two or more Races | 27 | 1.9% |
| Some other Race | 39 | 2.7% |
| Total | 1,438 | 100.0% |
Ancestry in Kimball
The most populous ancestries reported in Kimball are American (170 | 11.8%), English (107 | 7.4%), German (107 | 7.4%), Irish (107 | 7.4%), and Mexican (39 | 2.7%), together accounting for 36.9% of all Kimball residents.
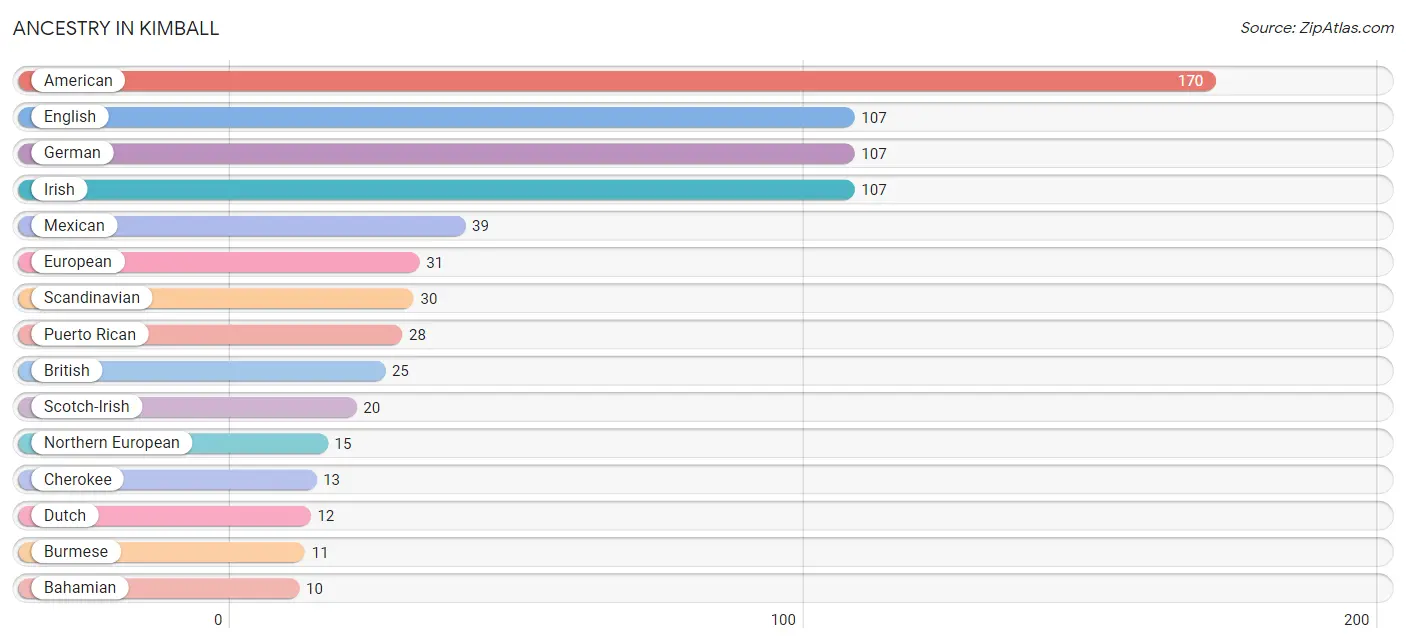
| Ancestry | # Population | % Population |
| American | 170 | 11.8% |
| Bahamian | 10 | 0.7% |
| Blackfeet | 9 | 0.6% |
| British | 25 | 1.7% |
| Burmese | 11 | 0.8% |
| Cherokee | 13 | 0.9% |
| Czech | 2 | 0.1% |
| Danish | 3 | 0.2% |
| Dutch | 12 | 0.8% |
| English | 107 | 7.4% |
| European | 31 | 2.2% |
| French | 5 | 0.4% |
| German | 107 | 7.4% |
| Irish | 107 | 7.4% |
| Italian | 9 | 0.6% |
| Korean | 3 | 0.2% |
| Mexican | 39 | 2.7% |
| Mongolian | 3 | 0.2% |
| Northern European | 15 | 1.0% |
| Puerto Rican | 28 | 1.9% |
| Scandinavian | 30 | 2.1% |
| Scotch-Irish | 20 | 1.4% |
| Scottish | 5 | 0.4% |
| Swiss | 4 | 0.3% |
| Welsh | 3 | 0.2% | View All 25 Rows |
Immigrants in Kimball
The most numerous immigrant groups reported in Kimball came from Asia (43 | 3.0%), Bangladesh (26 | 1.8%), South Central Asia (26 | 1.8%), Central America (24 | 1.7%), and Latin America (24 | 1.7%), together accounting for 10.0% of all Kimball residents.
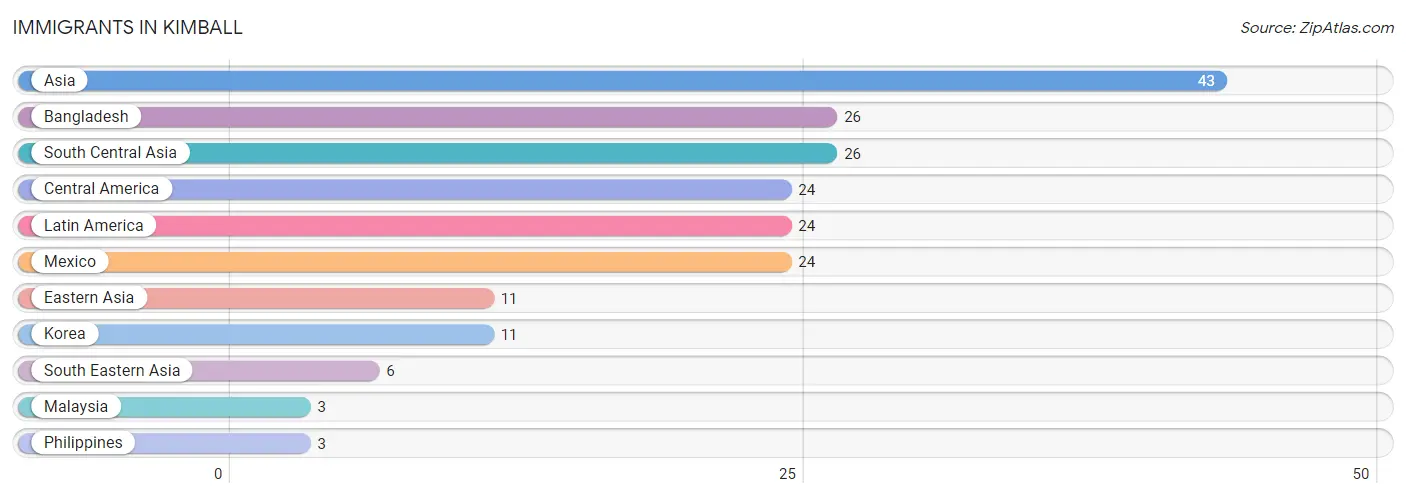
| Immigration Origin | # Population | % Population |
| Asia | 43 | 3.0% |
| Bangladesh | 26 | 1.8% |
| Central America | 24 | 1.7% |
| Eastern Asia | 11 | 0.8% |
| Korea | 11 | 0.8% |
| Latin America | 24 | 1.7% |
| Malaysia | 3 | 0.2% |
| Mexico | 24 | 1.7% |
| Philippines | 3 | 0.2% |
| South Central Asia | 26 | 1.8% |
| South Eastern Asia | 6 | 0.4% | View All 11 Rows |
Sex and Age in Kimball
Sex and Age in Kimball
The most populous age groups in Kimball are 45 to 49 Years (81 | 11.7%) for men and 10 to 14 Years (80 | 10.7%) for women.
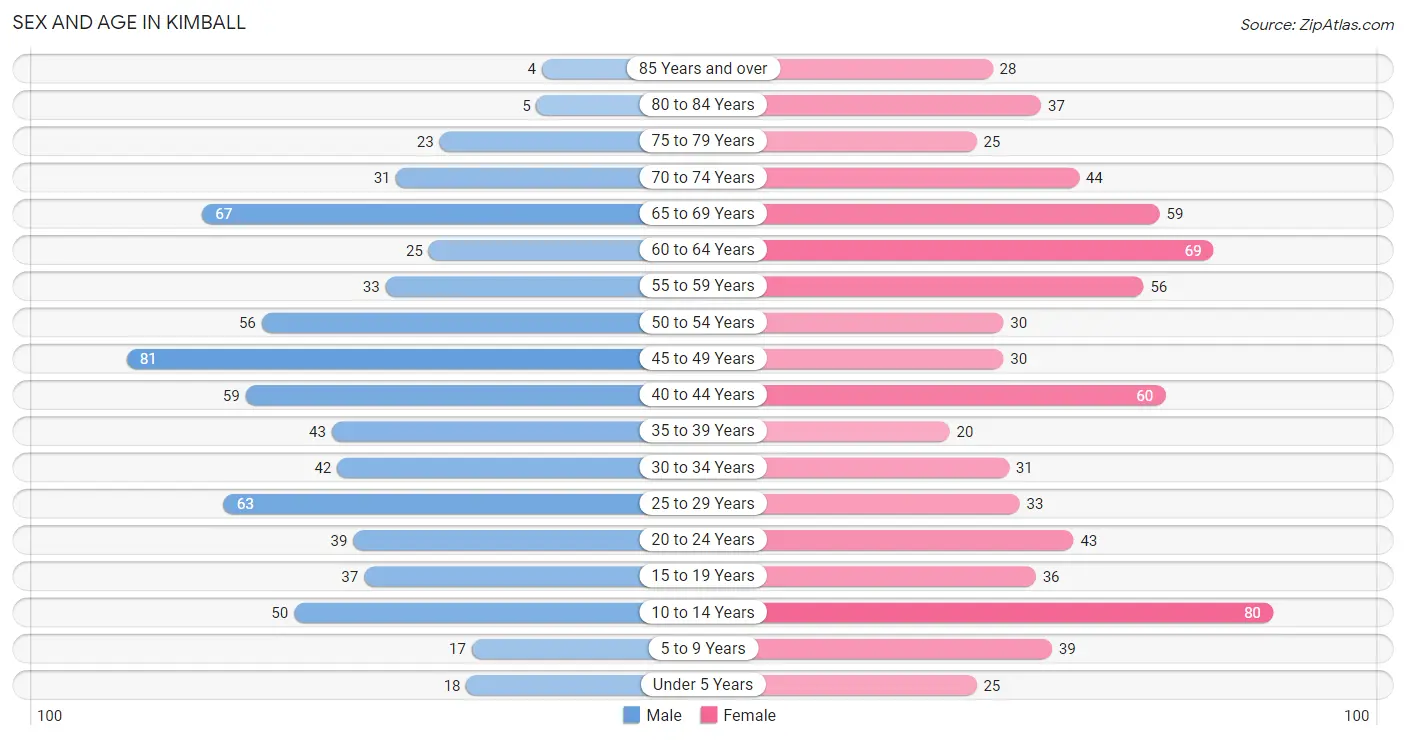
| Age Bracket | Male | Female |
| Under 5 Years | 18 (2.6%) | 25 (3.4%) |
| 5 to 9 Years | 17 (2.5%) | 39 (5.2%) |
| 10 to 14 Years | 50 (7.2%) | 80 (10.7%) |
| 15 to 19 Years | 37 (5.3%) | 36 (4.8%) |
| 20 to 24 Years | 39 (5.6%) | 43 (5.8%) |
| 25 to 29 Years | 63 (9.1%) | 33 (4.4%) |
| 30 to 34 Years | 42 (6.1%) | 31 (4.2%) |
| 35 to 39 Years | 43 (6.2%) | 20 (2.7%) |
| 40 to 44 Years | 59 (8.5%) | 60 (8.1%) |
| 45 to 49 Years | 81 (11.7%) | 30 (4.0%) |
| 50 to 54 Years | 56 (8.1%) | 30 (4.0%) |
| 55 to 59 Years | 33 (4.8%) | 56 (7.5%) |
| 60 to 64 Years | 25 (3.6%) | 69 (9.3%) |
| 65 to 69 Years | 67 (9.7%) | 59 (7.9%) |
| 70 to 74 Years | 31 (4.5%) | 44 (5.9%) |
| 75 to 79 Years | 23 (3.3%) | 25 (3.4%) |
| 80 to 84 Years | 5 (0.7%) | 37 (5.0%) |
| 85 Years and over | 4 (0.6%) | 28 (3.8%) |
| Total | 693 (100.0%) | 745 (100.0%) |
Families and Households in Kimball
Median Family Size in Kimball
The median family size in Kimball is 2.83 persons per family, with married-couple families (287 | 74.0%) accounting for the largest median family size of 2.92 persons per family. On the other hand, single female/mother families (60 | 15.5%) represent the smallest median family size with 2.53 persons per family.
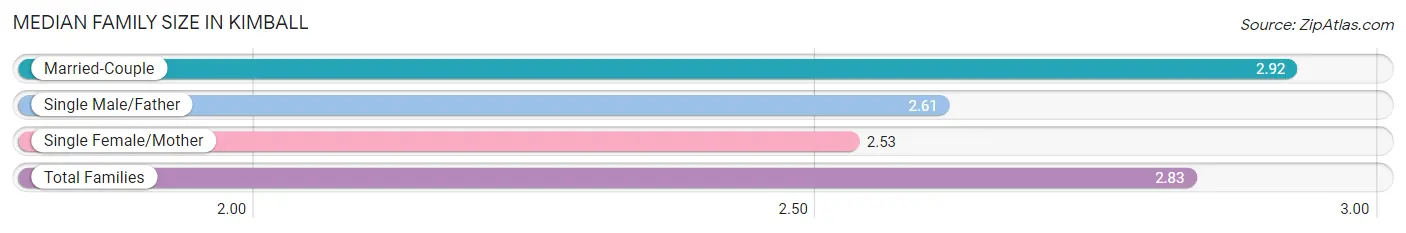
| Family Type | # Families | Family Size |
| Married-Couple | 287 (74.0%) | 2.92 |
| Single Male/Father | 41 (10.6%) | 2.61 |
| Single Female/Mother | 60 (15.5%) | 2.53 |
| Total Families | 388 (100.0%) | 2.83 |
Median Household Size in Kimball
The median household size in Kimball is 2.19 persons per household, with single male/father households (41 | 6.2%) accounting for the largest median household size of 3.1 persons per household. non-family households (269 | 40.9%) represent the smallest median household size with 1.16 persons per household.
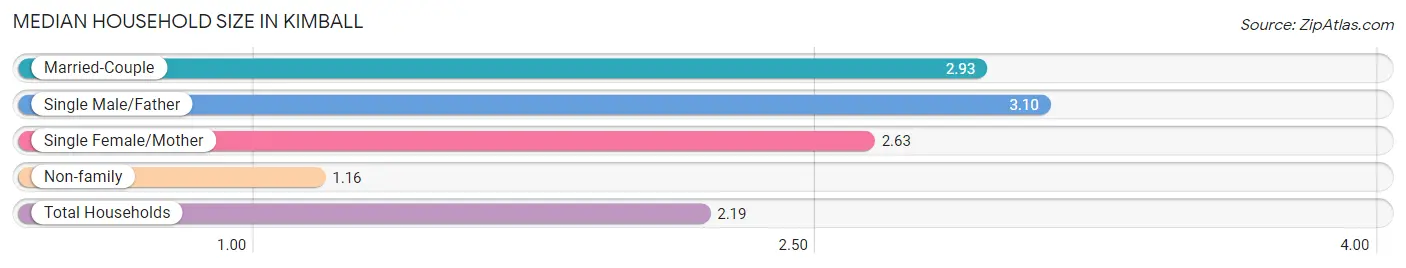
| Household Type | # Households | Household Size |
| Married-Couple | 287 (43.7%) | 2.93 |
| Single Male/Father | 41 (6.2%) | 3.10 |
| Single Female/Mother | 60 (9.1%) | 2.63 |
| Non-family | 269 (40.9%) | 1.16 |
| Total Households | 657 (100.0%) | 2.19 |
Household Size by Marriage Status in Kimball
Out of a total of 657 households in Kimball, 388 (59.1%) are family households, while 269 (40.9%) are nonfamily households. The most numerous type of family households are 2-person households, comprising 204, and the most common type of nonfamily households are 1-person households, comprising 227.
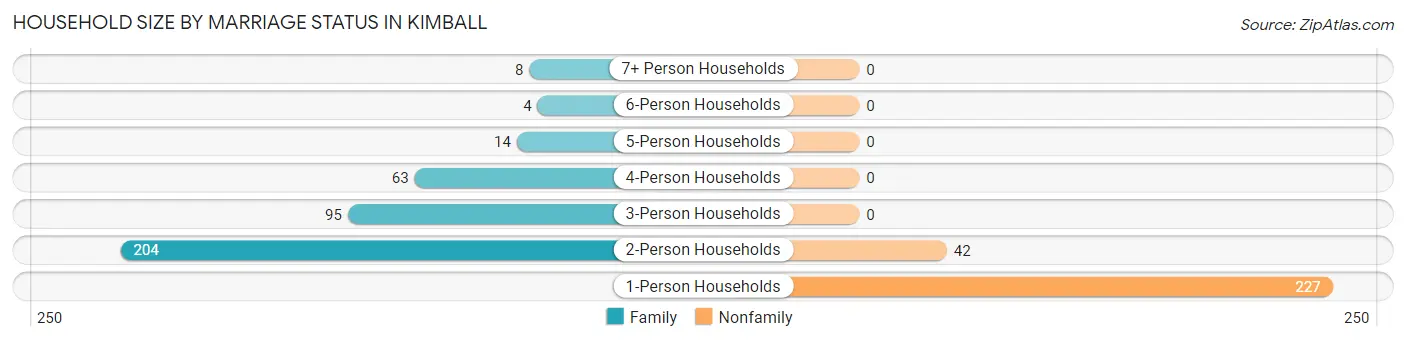
| Household Size | Family Households | Nonfamily Households |
| 1-Person Households | - | 227 (34.5%) |
| 2-Person Households | 204 (31.0%) | 42 (6.4%) |
| 3-Person Households | 95 (14.5%) | 0 (0.0%) |
| 4-Person Households | 63 (9.6%) | 0 (0.0%) |
| 5-Person Households | 14 (2.1%) | 0 (0.0%) |
| 6-Person Households | 4 (0.6%) | 0 (0.0%) |
| 7+ Person Households | 8 (1.2%) | 0 (0.0%) |
| Total | 388 (59.1%) | 269 (40.9%) |
Female Fertility in Kimball
Fertility by Age in Kimball
Average fertility rate in Kimball is 63.0 births per 1,000 women. Women in the age bracket of 20 to 34 years have the highest fertility rate with 150.0 births per 1,000 women. Women in the age bracket of 20 to 34 years acount for 100.0% of all women with births.
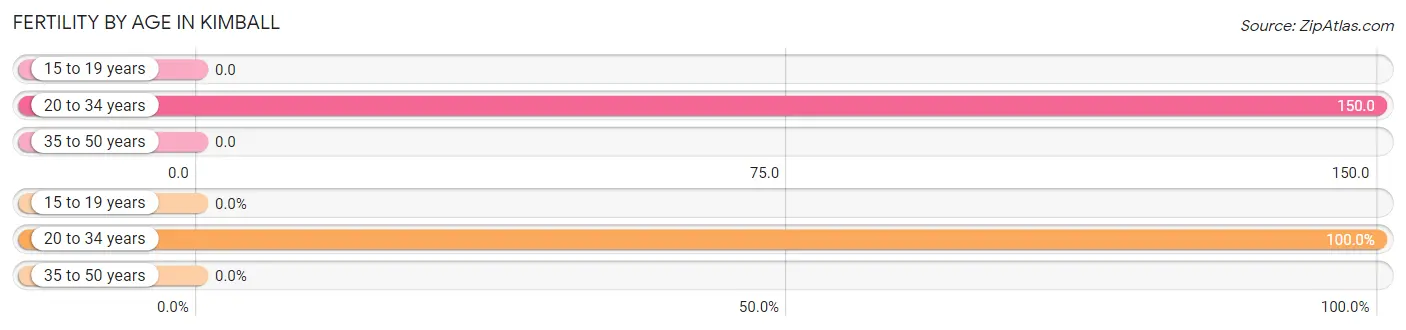
| Age Bracket | Women with Births | Births / 1,000 Women |
| 15 to 19 years | 0 (0.0%) | 0.0 |
| 20 to 34 years | 16 (100.0%) | 150.0 |
| 35 to 50 years | 0 (0.0%) | 0.0 |
| Total | 16 (100.0%) | 63.0 |
Fertility by Age by Marriage Status in Kimball
75.0% of women with births (16) in Kimball are married. The highest percentage of unmarried women with births falls into 20 to 34 years age bracket with 25.0% of them unmarried at the time of birth, while the lowest percentage of unmarried women with births belong to 20 to 34 years age bracket with 25.0% of them unmarried.
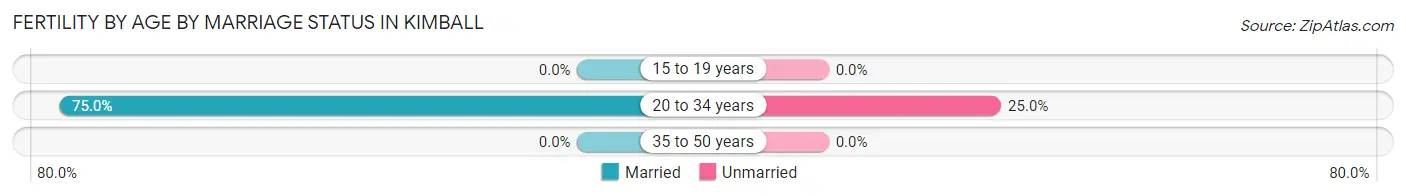
| Age Bracket | Married | Unmarried |
| 15 to 19 years | 0 (0.0%) | 0 (0.0%) |
| 20 to 34 years | 12 (75.0%) | 4 (25.0%) |
| 35 to 50 years | 0 (0.0%) | 0 (0.0%) |
| Total | 12 (75.0%) | 4 (25.0%) |
Fertility by Education in Kimball
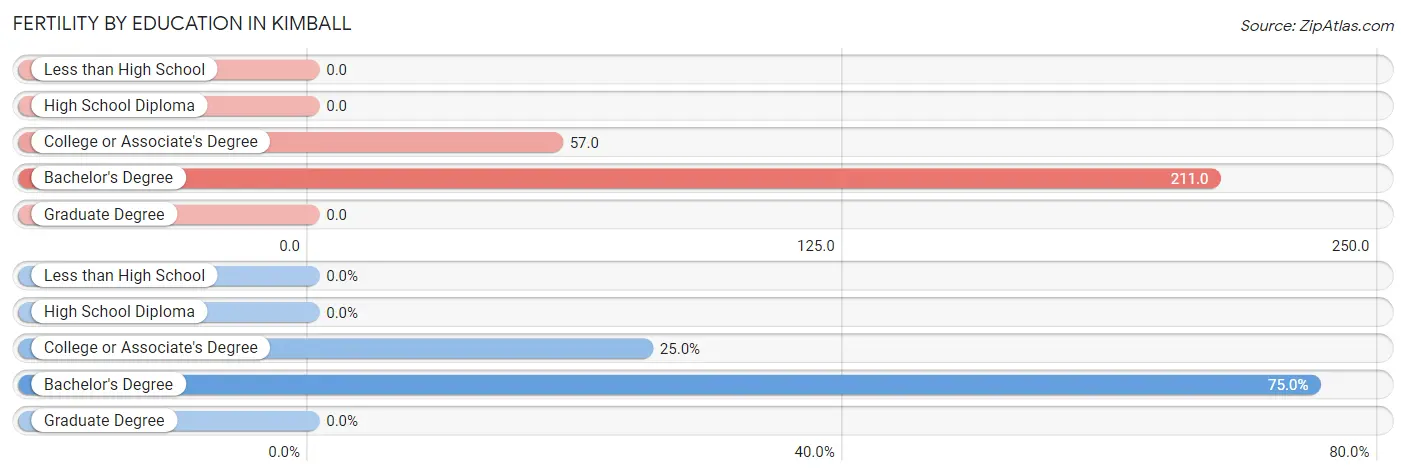
| Educational Attainment | Women with Births | Births / 1,000 Women |
| Less than High School | 0 (0.0%) | 0.0 |
| High School Diploma | 0 (0.0%) | 0.0 |
| College or Associate's Degree | 4 (25.0%) | 57.0 |
| Bachelor's Degree | 12 (75.0%) | 211.0 |
| Graduate Degree | 0 (0.0%) | 0.0 |
| Total | 16 (100.0%) | 63.0 |
Fertility by Education by Marriage Status in Kimball
25.0% of women with births in Kimball are unmarried. Women with the educational attainment of bachelor's degree are most likely to be married with 100.0% of them married at childbirth, while women with the educational attainment of college or associate's degree are least likely to be married with 100.0% of them unmarried at childbirth.
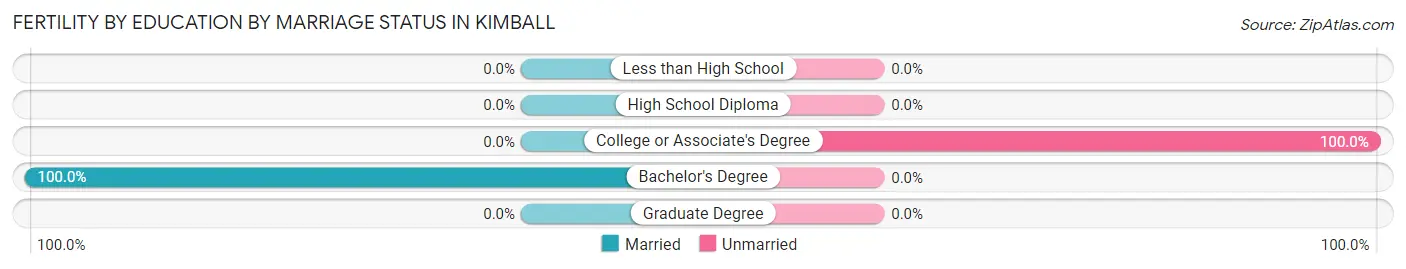
| Educational Attainment | Married | Unmarried |
| Less than High School | 0 (0.0%) | 0 (0.0%) |
| High School Diploma | 0 (0.0%) | 0 (0.0%) |
| College or Associate's Degree | 0 (0.0%) | 4 (100.0%) |
| Bachelor's Degree | 12 (100.0%) | 0 (0.0%) |
| Graduate Degree | 0 (0.0%) | 0 (0.0%) |
| Total | 12 (75.0%) | 4 (25.0%) |
Employment Characteristics in Kimball
Employment by Class of Employer in Kimball
Among the 699 employed individuals in Kimball, private company employees (531 | 76.0%), not-for-profit organizations (63 | 9.0%), and local government employees (39 | 5.6%) make up the most common classes of employment.
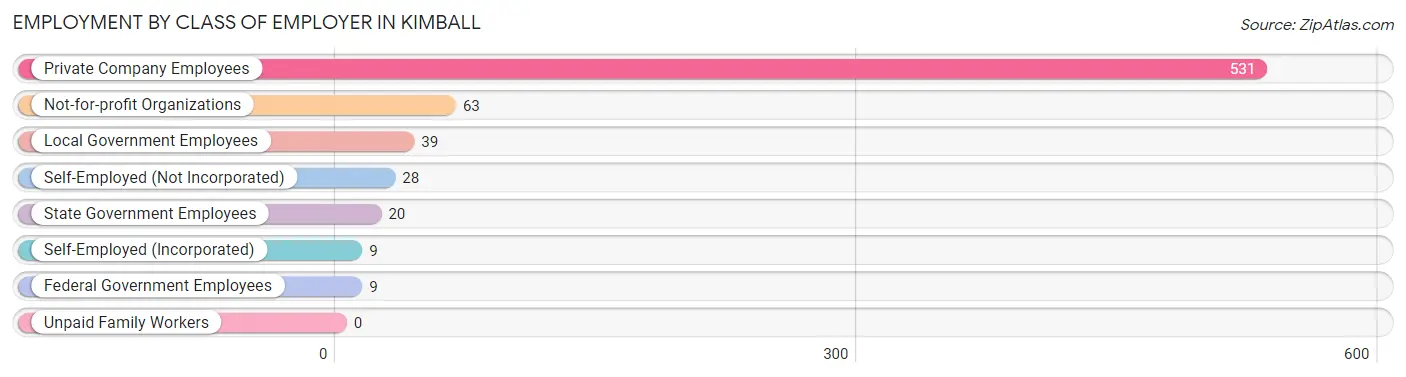
| Employer Class | # Employees | % Employees |
| Private Company Employees | 531 | 76.0% |
| Self-Employed (Incorporated) | 9 | 1.3% |
| Self-Employed (Not Incorporated) | 28 | 4.0% |
| Not-for-profit Organizations | 63 | 9.0% |
| Local Government Employees | 39 | 5.6% |
| State Government Employees | 20 | 2.9% |
| Federal Government Employees | 9 | 1.3% |
| Unpaid Family Workers | 0 | 0.0% |
| Total | 699 | 100.0% |
Employment Status by Age in Kimball
According to the labor force statistics for Kimball, out of the total population over 16 years of age (1,201), 62.4% or 749 individuals are in the labor force, with 3.9% or 29 of them unemployed. The age group with the highest labor force participation rate is 45 to 54 years, with 92.9% or 183 individuals in the labor force. Within the labor force, the 25 to 29 years age range has the highest percentage of unemployed individuals, with 18.4% or 16 of them being unemployed.
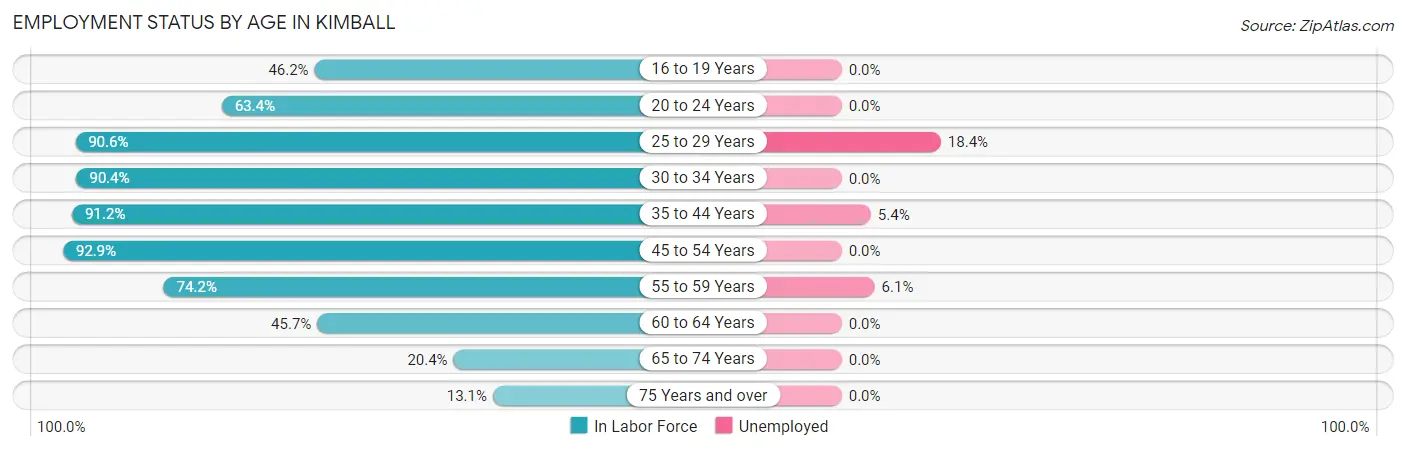
| Age Bracket | In Labor Force | Unemployed |
| 16 to 19 Years | 30 (46.2%) | 0 (0.0%) |
| 20 to 24 Years | 52 (63.4%) | 0 (0.0%) |
| 25 to 29 Years | 87 (90.6%) | 16 (18.4%) |
| 30 to 34 Years | 66 (90.4%) | 0 (0.0%) |
| 35 to 44 Years | 166 (91.2%) | 9 (5.4%) |
| 45 to 54 Years | 183 (92.9%) | 0 (0.0%) |
| 55 to 59 Years | 66 (74.2%) | 4 (6.1%) |
| 60 to 64 Years | 43 (45.7%) | 0 (0.0%) |
| 65 to 74 Years | 41 (20.4%) | 0 (0.0%) |
| 75 Years and over | 16 (13.1%) | 0 (0.0%) |
| Total | 749 (62.4%) | 29 (3.9%) |
Employment Status by Educational Attainment in Kimball
According to labor force statistics for Kimball, 83.6% of individuals (611) out of the total population between 25 and 64 years of age (731) are in the labor force, with 4.7% or 29 of them being unemployed. The group with the highest labor force participation rate are those with the educational attainment of high school diploma, with 84.8% or 296 individuals in the labor force. Within the labor force, individuals with college / associate degree education have the highest percentage of unemployment, with 6.1% or 12 of them being unemployed.
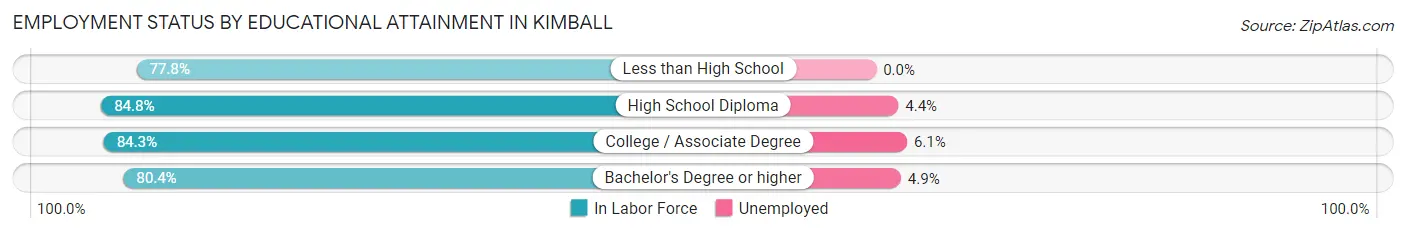
| Educational Attainment | In Labor Force | Unemployed |
| Less than High School | 35 (77.8%) | 0 (0.0%) |
| High School Diploma | 296 (84.8%) | 15 (4.4%) |
| College / Associate Degree | 198 (84.3%) | 14 (6.1%) |
| Bachelor's Degree or higher | 82 (80.4%) | 5 (4.9%) |
| Total | 611 (83.6%) | 34 (4.7%) |
Employment Occupations by Sex in Kimball
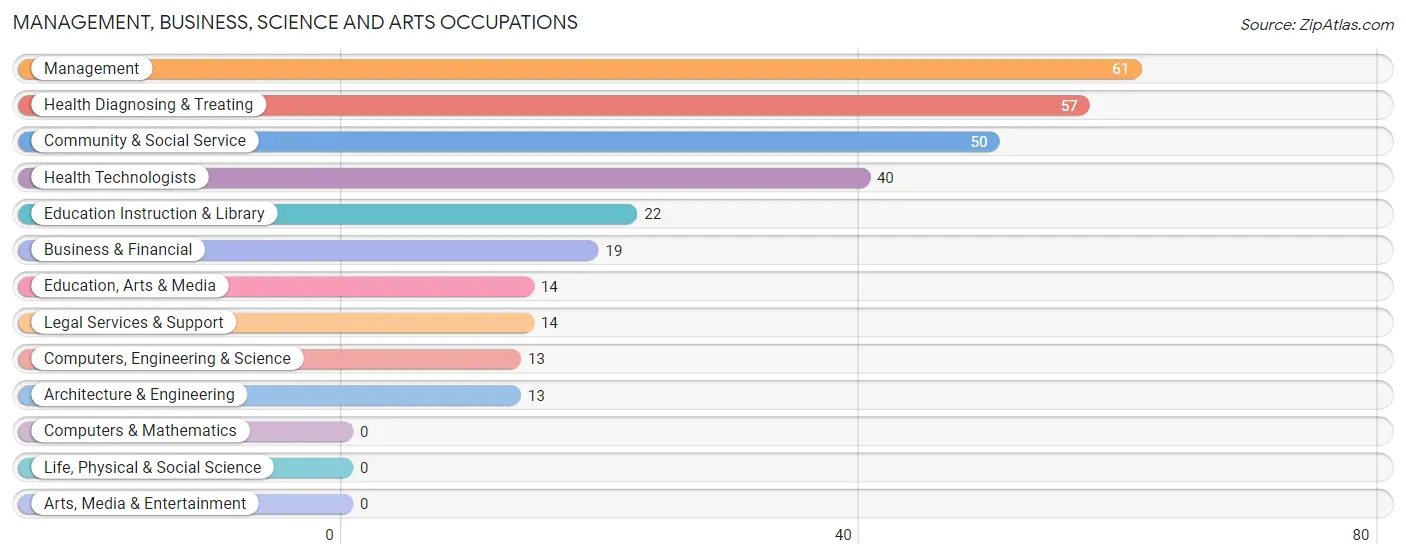
Management, Business, Science and Arts Occupations
The most common Management, Business, Science and Arts occupations in Kimball are Management (61 | 8.5%), Health Diagnosing & Treating (57 | 7.9%), Community & Social Service (50 | 6.9%), Health Technologists (40 | 5.6%), and Education Instruction & Library (22 | 3.0%).
Management, Business, Science and Arts Occupations by Sex
Within the Management, Business, Science and Arts occupations in Kimball, the most male-oriented occupations are Legal Services & Support (100.0%), Management (82.0%), and Computers, Engineering & Science (76.9%), while the most female-oriented occupations are Business & Financial (100.0%), Health Diagnosing & Treating (94.7%), and Health Technologists (92.5%).
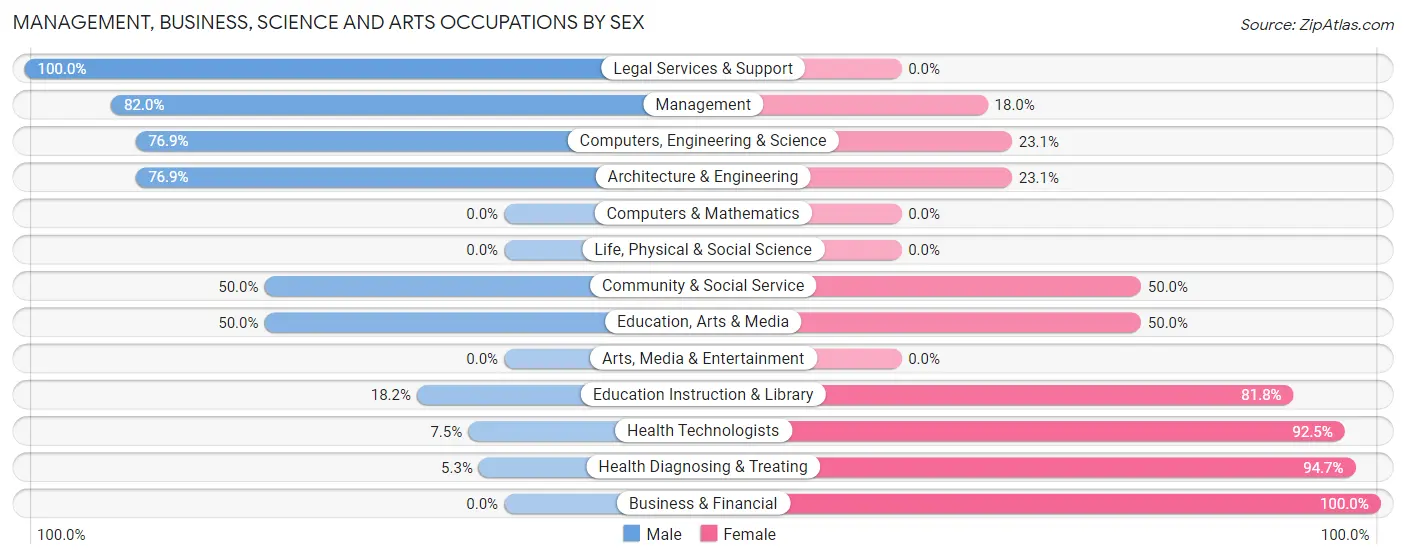
| Occupation | Male | Female |
| Management | 50 (82.0%) | 11 (18.0%) |
| Business & Financial | 0 (0.0%) | 19 (100.0%) |
| Computers, Engineering & Science | 10 (76.9%) | 3 (23.1%) |
| Computers & Mathematics | 0 (0.0%) | 0 (0.0%) |
| Architecture & Engineering | 10 (76.9%) | 3 (23.1%) |
| Life, Physical & Social Science | 0 (0.0%) | 0 (0.0%) |
| Community & Social Service | 25 (50.0%) | 25 (50.0%) |
| Education, Arts & Media | 7 (50.0%) | 7 (50.0%) |
| Legal Services & Support | 14 (100.0%) | 0 (0.0%) |
| Education Instruction & Library | 4 (18.2%) | 18 (81.8%) |
| Arts, Media & Entertainment | 0 (0.0%) | 0 (0.0%) |
| Health Diagnosing & Treating | 3 (5.3%) | 54 (94.7%) |
| Health Technologists | 3 (7.5%) | 37 (92.5%) |
| Total (Category) | 88 (44.0%) | 112 (56.0%) |
| Total (Overall) | 422 (58.5%) | 299 (41.5%) |
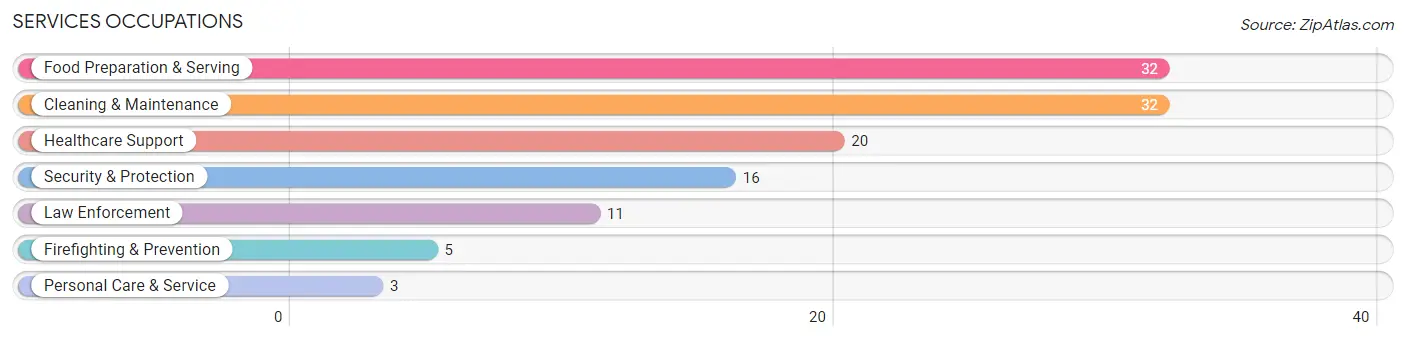
Services Occupations
The most common Services occupations in Kimball are Food Preparation & Serving (32 | 4.4%), Cleaning & Maintenance (32 | 4.4%), Healthcare Support (20 | 2.8%), Security & Protection (16 | 2.2%), and Law Enforcement (11 | 1.5%).
Services Occupations by Sex
Within the Services occupations in Kimball, the most male-oriented occupations are Security & Protection (100.0%), Firefighting & Prevention (100.0%), and Law Enforcement (100.0%), while the most female-oriented occupations are Healthcare Support (100.0%), Personal Care & Service (100.0%), and Food Preparation & Serving (68.8%).
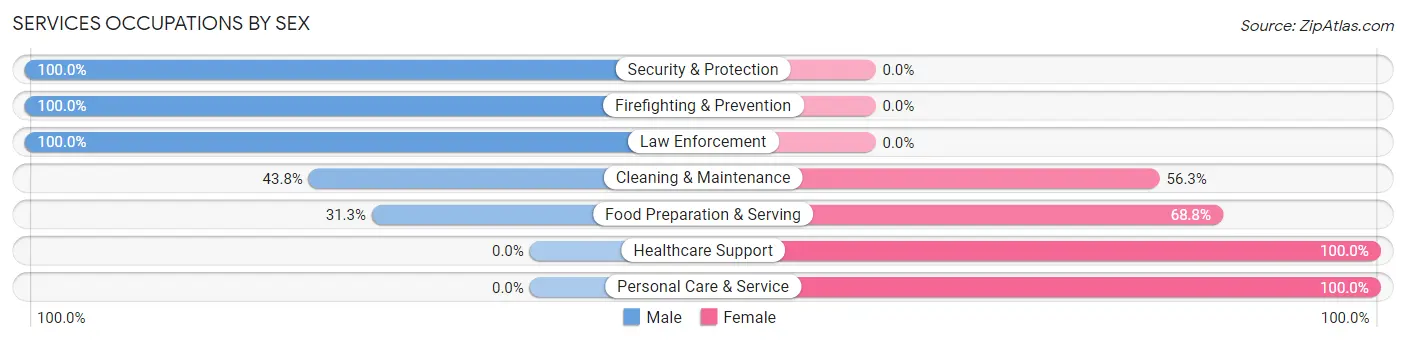
| Occupation | Male | Female |
| Healthcare Support | 0 (0.0%) | 20 (100.0%) |
| Security & Protection | 16 (100.0%) | 0 (0.0%) |
| Firefighting & Prevention | 5 (100.0%) | 0 (0.0%) |
| Law Enforcement | 11 (100.0%) | 0 (0.0%) |
| Food Preparation & Serving | 10 (31.2%) | 22 (68.8%) |
| Cleaning & Maintenance | 14 (43.8%) | 18 (56.2%) |
| Personal Care & Service | 0 (0.0%) | 3 (100.0%) |
| Total (Category) | 40 (38.8%) | 63 (61.2%) |
| Total (Overall) | 422 (58.5%) | 299 (41.5%) |
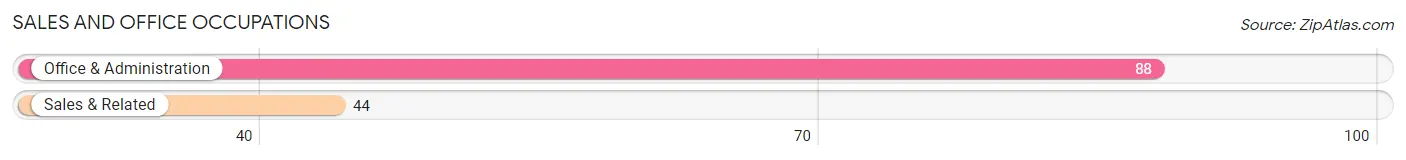
Sales and Office Occupations
The most common Sales and Office occupations in Kimball are Office & Administration (88 | 12.2%), and Sales & Related (44 | 6.1%).
Sales and Office Occupations by Sex
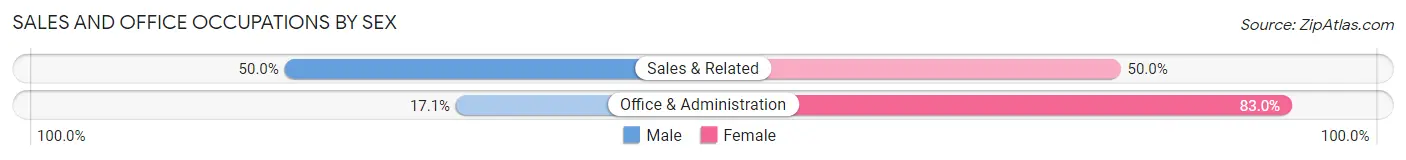
| Occupation | Male | Female |
| Sales & Related | 22 (50.0%) | 22 (50.0%) |
| Office & Administration | 15 (17.1%) | 73 (83.0%) |
| Total (Category) | 37 (28.0%) | 95 (72.0%) |
| Total (Overall) | 422 (58.5%) | 299 (41.5%) |
Natural Resources, Construction and Maintenance Occupations
The most common Natural Resources, Construction and Maintenance occupations in Kimball are Construction & Extraction (24 | 3.3%), Installation, Maintenance & Repair (12 | 1.7%), and Farming, Fishing & Forestry (4 | 0.5%).
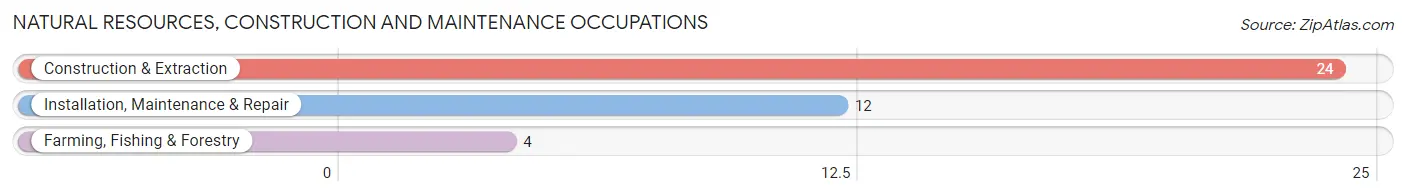
Natural Resources, Construction and Maintenance Occupations by Sex
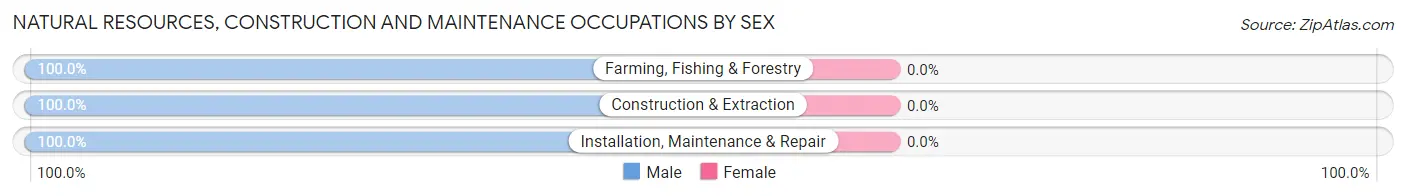
| Occupation | Male | Female |
| Farming, Fishing & Forestry | 4 (100.0%) | 0 (0.0%) |
| Construction & Extraction | 24 (100.0%) | 0 (0.0%) |
| Installation, Maintenance & Repair | 12 (100.0%) | 0 (0.0%) |
| Total (Category) | 40 (100.0%) | 0 (0.0%) |
| Total (Overall) | 422 (58.5%) | 299 (41.5%) |
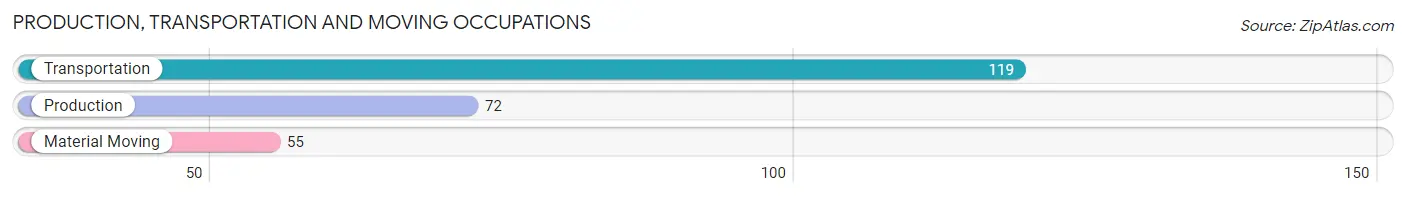
Production, Transportation and Moving Occupations
The most common Production, Transportation and Moving occupations in Kimball are Transportation (119 | 16.5%), Production (72 | 10.0%), and Material Moving (55 | 7.6%).
Production, Transportation and Moving Occupations by Sex
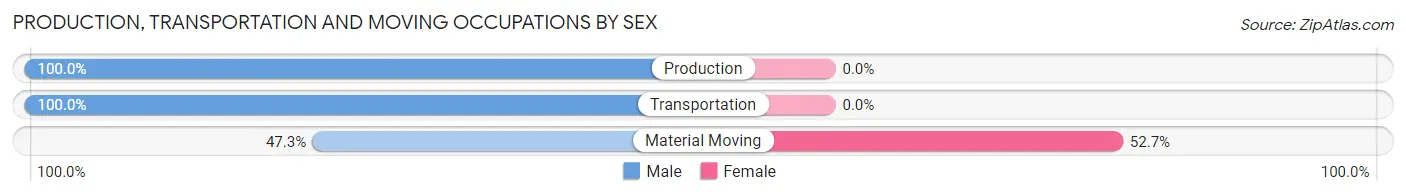
| Occupation | Male | Female |
| Production | 72 (100.0%) | 0 (0.0%) |
| Transportation | 119 (100.0%) | 0 (0.0%) |
| Material Moving | 26 (47.3%) | 29 (52.7%) |
| Total (Category) | 217 (88.2%) | 29 (11.8%) |
| Total (Overall) | 422 (58.5%) | 299 (41.5%) |
Employment Industries by Sex in Kimball
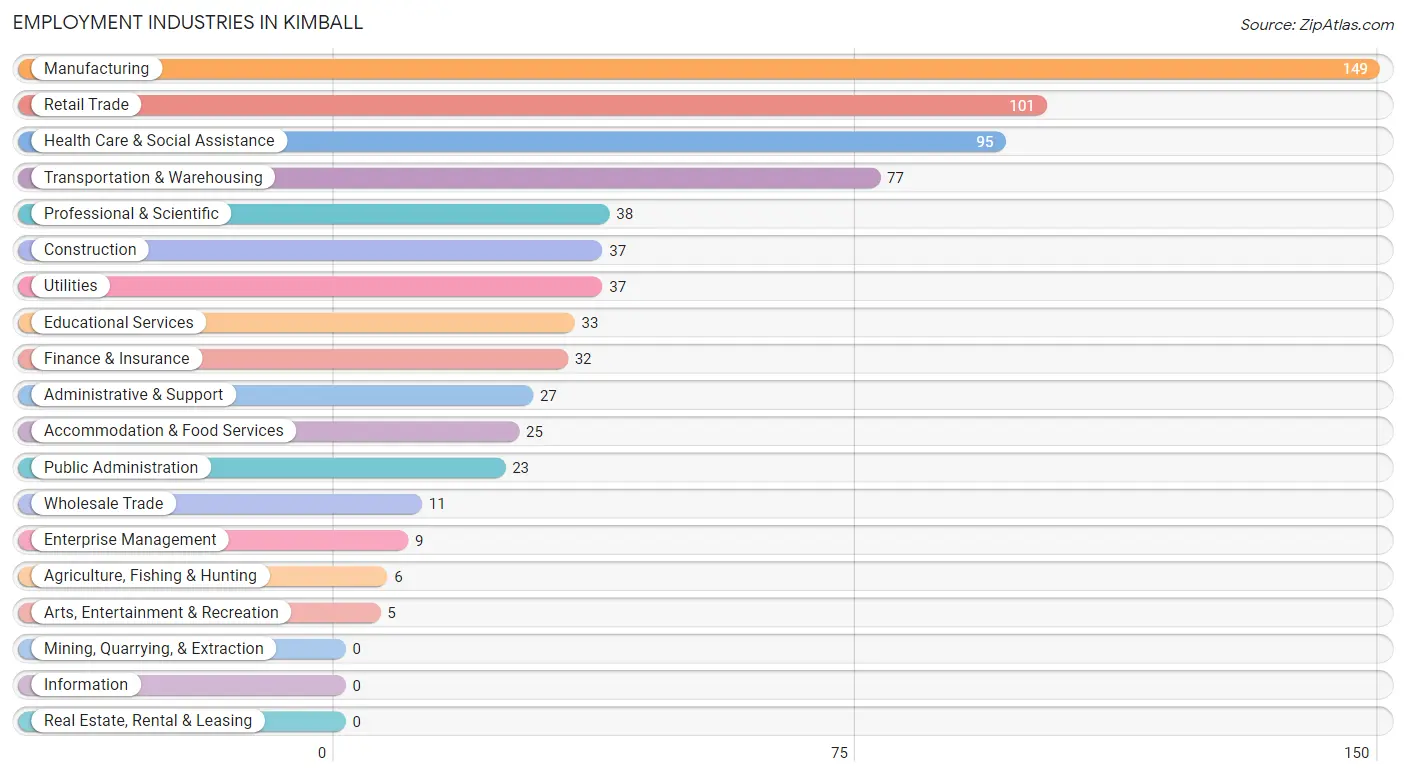
Employment Industries in Kimball
The major employment industries in Kimball include Manufacturing (149 | 20.7%), Retail Trade (101 | 14.0%), Health Care & Social Assistance (95 | 13.2%), Transportation & Warehousing (77 | 10.7%), and Professional & Scientific (38 | 5.3%).
Employment Industries by Sex in Kimball
The Kimball industries that see more men than women are Construction (100.0%), Transportation & Warehousing (100.0%), and Manufacturing (88.6%), whereas the industries that tend to have a higher number of women are Enterprise Management (100.0%), Arts, Entertainment & Recreation (100.0%), and Health Care & Social Assistance (89.5%).
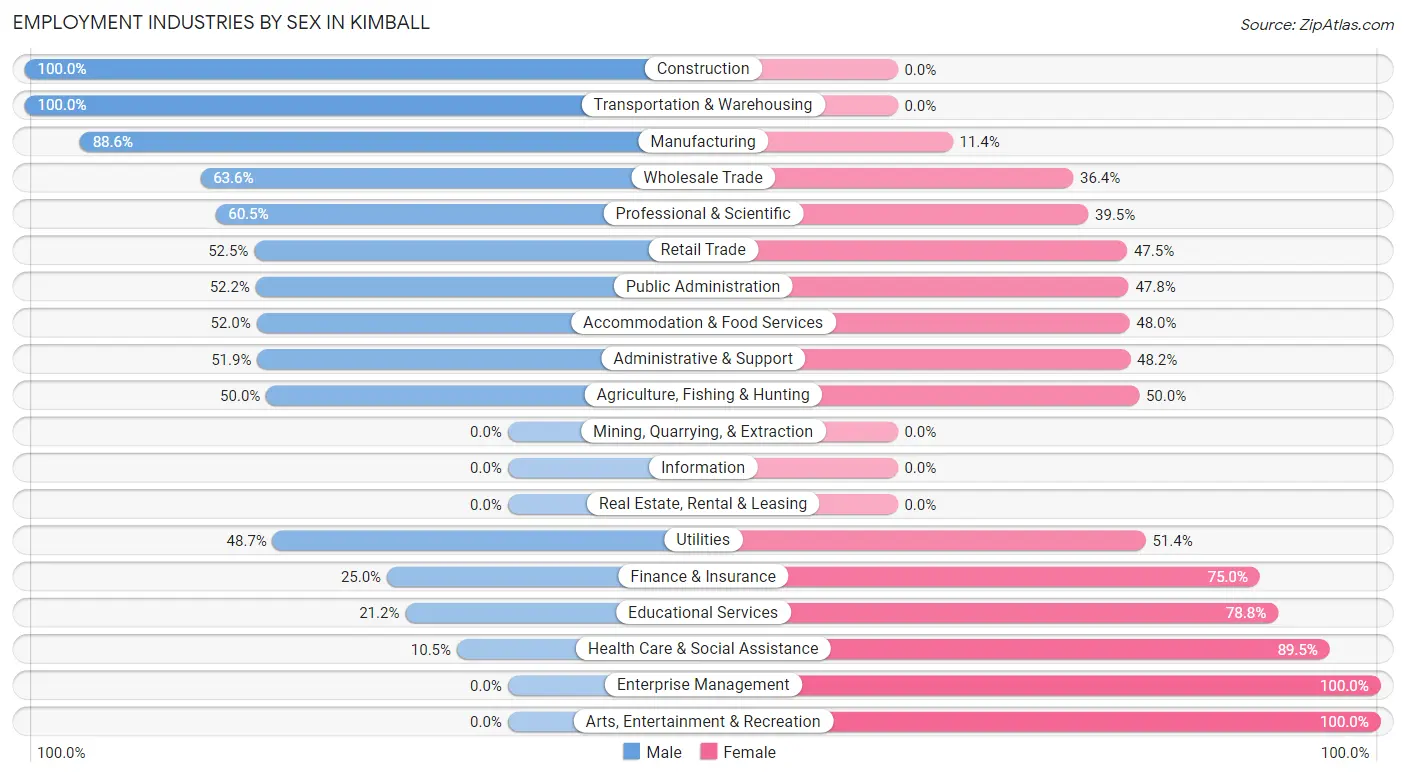
| Industry | Male | Female |
| Agriculture, Fishing & Hunting | 3 (50.0%) | 3 (50.0%) |
| Mining, Quarrying, & Extraction | 0 (0.0%) | 0 (0.0%) |
| Construction | 37 (100.0%) | 0 (0.0%) |
| Manufacturing | 132 (88.6%) | 17 (11.4%) |
| Wholesale Trade | 7 (63.6%) | 4 (36.4%) |
| Retail Trade | 53 (52.5%) | 48 (47.5%) |
| Transportation & Warehousing | 77 (100.0%) | 0 (0.0%) |
| Utilities | 18 (48.6%) | 19 (51.3%) |
| Information | 0 (0.0%) | 0 (0.0%) |
| Finance & Insurance | 8 (25.0%) | 24 (75.0%) |
| Real Estate, Rental & Leasing | 0 (0.0%) | 0 (0.0%) |
| Professional & Scientific | 23 (60.5%) | 15 (39.5%) |
| Enterprise Management | 0 (0.0%) | 9 (100.0%) |
| Administrative & Support | 14 (51.8%) | 13 (48.1%) |
| Educational Services | 7 (21.2%) | 26 (78.8%) |
| Health Care & Social Assistance | 10 (10.5%) | 85 (89.5%) |
| Arts, Entertainment & Recreation | 0 (0.0%) | 5 (100.0%) |
| Accommodation & Food Services | 13 (52.0%) | 12 (48.0%) |
| Public Administration | 12 (52.2%) | 11 (47.8%) |
| Total | 422 (58.5%) | 299 (41.5%) |
Education in Kimball
School Enrollment in Kimball
The most common levels of schooling among the 296 students in Kimball are high school (88 | 29.7%), middle school (80 | 27.0%), and elementary school (62 | 20.9%).
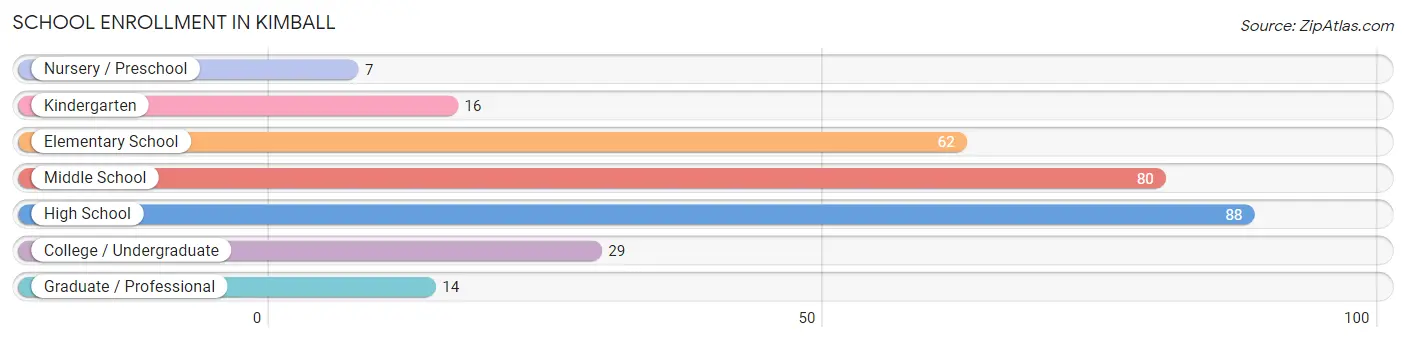
| School Level | # Students | % Students |
| Nursery / Preschool | 7 | 2.4% |
| Kindergarten | 16 | 5.4% |
| Elementary School | 62 | 20.9% |
| Middle School | 80 | 27.0% |
| High School | 88 | 29.7% |
| College / Undergraduate | 29 | 9.8% |
| Graduate / Professional | 14 | 4.7% |
| Total | 296 | 100.0% |
School Enrollment by Age by Funding Source in Kimball
Out of a total of 296 students who are enrolled in schools in Kimball, 35 (11.8%) attend a private institution, while the remaining 261 (88.2%) are enrolled in public schools. The age group of 35 years and over has the highest likelihood of being enrolled in private schools, with 3 (42.9% in the age bracket) enrolled. Conversely, the age group of 3 to 4 year olds has the lowest likelihood of being enrolled in a private school, with 2 (100.0% in the age bracket) attending a public institution.
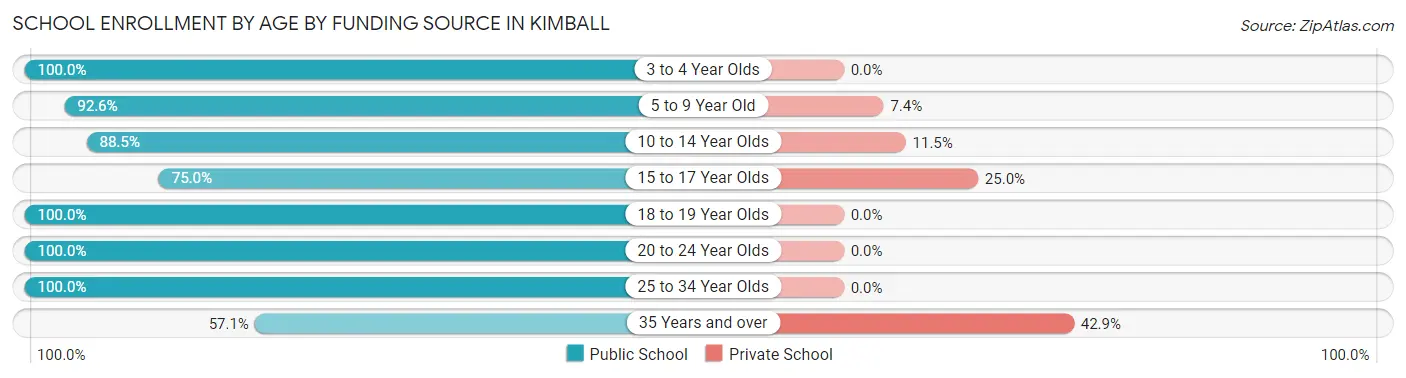
| Age Bracket | Public School | Private School |
| 3 to 4 Year Olds | 2 (100.0%) | 0 (0.0%) |
| 5 to 9 Year Old | 50 (92.6%) | 4 (7.4%) |
| 10 to 14 Year Olds | 115 (88.5%) | 15 (11.5%) |
| 15 to 17 Year Olds | 39 (75.0%) | 13 (25.0%) |
| 18 to 19 Year Olds | 19 (100.0%) | 0 (0.0%) |
| 20 to 24 Year Olds | 29 (100.0%) | 0 (0.0%) |
| 25 to 34 Year Olds | 3 (100.0%) | 0 (0.0%) |
| 35 Years and over | 4 (57.1%) | 3 (42.9%) |
| Total | 261 (88.2%) | 35 (11.8%) |
Educational Attainment by Field of Study in Kimball
Education (47 | 27.7%), business (33 | 19.4%), science & technology (30 | 17.6%), arts & humanities (17 | 10.0%), and bio, nature & agricultural (14 | 8.2%) are the most common fields of study among 170 individuals in Kimball who have obtained a bachelor's degree or higher.
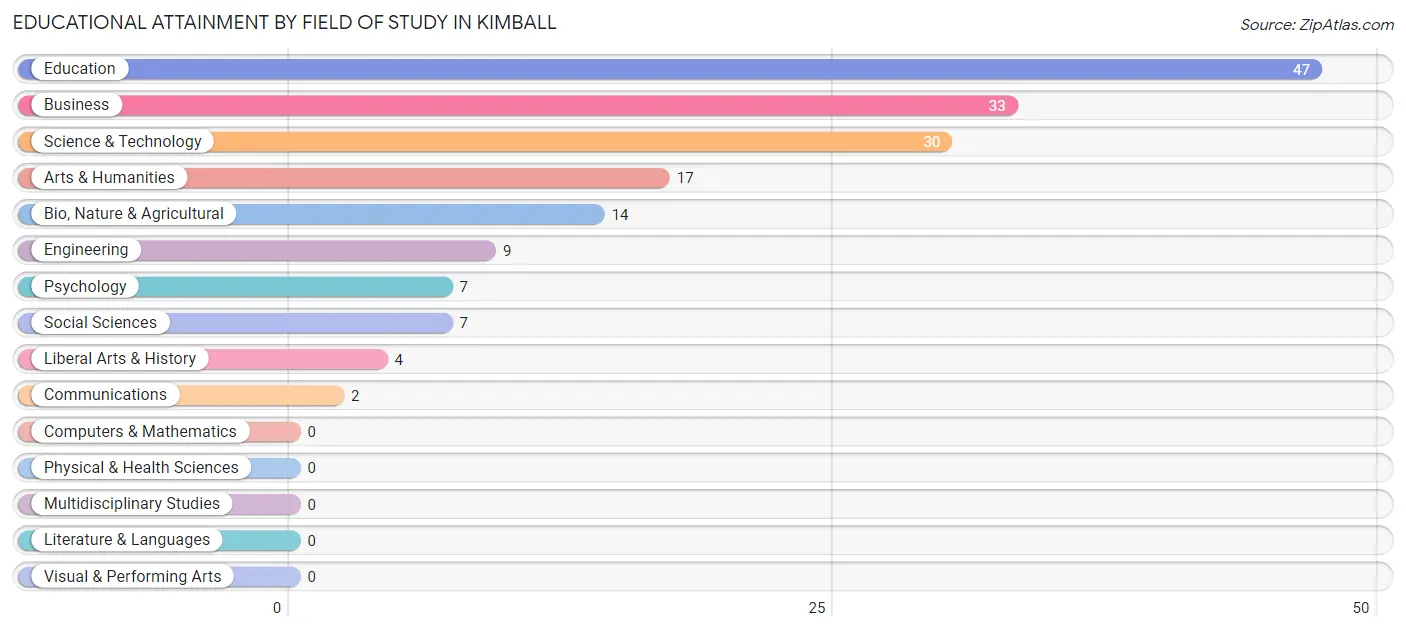
| Field of Study | # Graduates | % Graduates |
| Computers & Mathematics | 0 | 0.0% |
| Bio, Nature & Agricultural | 14 | 8.2% |
| Physical & Health Sciences | 0 | 0.0% |
| Psychology | 7 | 4.1% |
| Social Sciences | 7 | 4.1% |
| Engineering | 9 | 5.3% |
| Multidisciplinary Studies | 0 | 0.0% |
| Science & Technology | 30 | 17.6% |
| Business | 33 | 19.4% |
| Education | 47 | 27.7% |
| Literature & Languages | 0 | 0.0% |
| Liberal Arts & History | 4 | 2.4% |
| Visual & Performing Arts | 0 | 0.0% |
| Communications | 2 | 1.2% |
| Arts & Humanities | 17 | 10.0% |
| Total | 170 | 100.0% |
Transportation & Commute in Kimball
Vehicle Availability by Sex in Kimball
The most prevalent vehicle ownership categories in Kimball are males with 3 vehicles (126, accounting for 30.1%) and females with 3 vehicles (124, making up 44.8%).
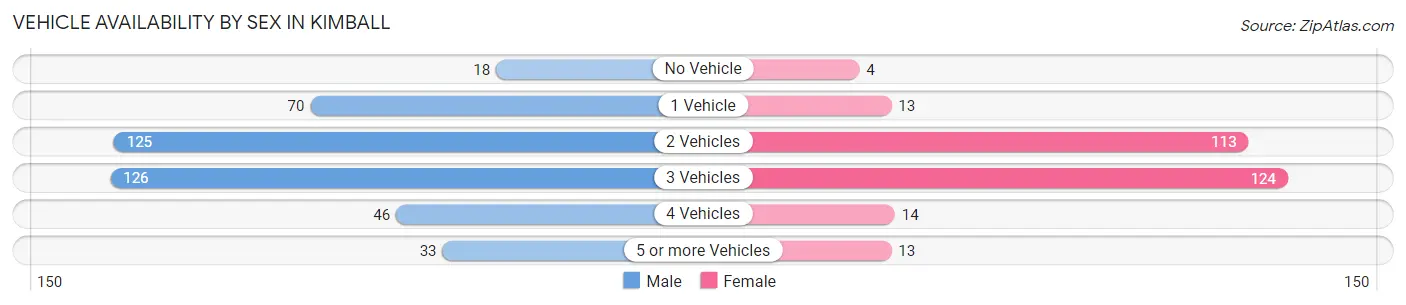
| Vehicles Available | Male | Female |
| No Vehicle | 18 (4.3%) | 4 (1.4%) |
| 1 Vehicle | 70 (16.8%) | 13 (4.6%) |
| 2 Vehicles | 125 (29.9%) | 113 (40.2%) |
| 3 Vehicles | 126 (30.1%) | 124 (44.1%) |
| 4 Vehicles | 46 (11.0%) | 14 (5.0%) |
| 5 or more Vehicles | 33 (7.9%) | 13 (4.6%) |
| Total | 418 (100.0%) | 281 (100.0%) |
Commute Time in Kimball
The most frequently occuring commute durations in Kimball are 5 to 9 minutes (159 commuters, 23.0%), 10 to 14 minutes (120 commuters, 17.4%), and 45 to 59 minutes (104 commuters, 15.1%).
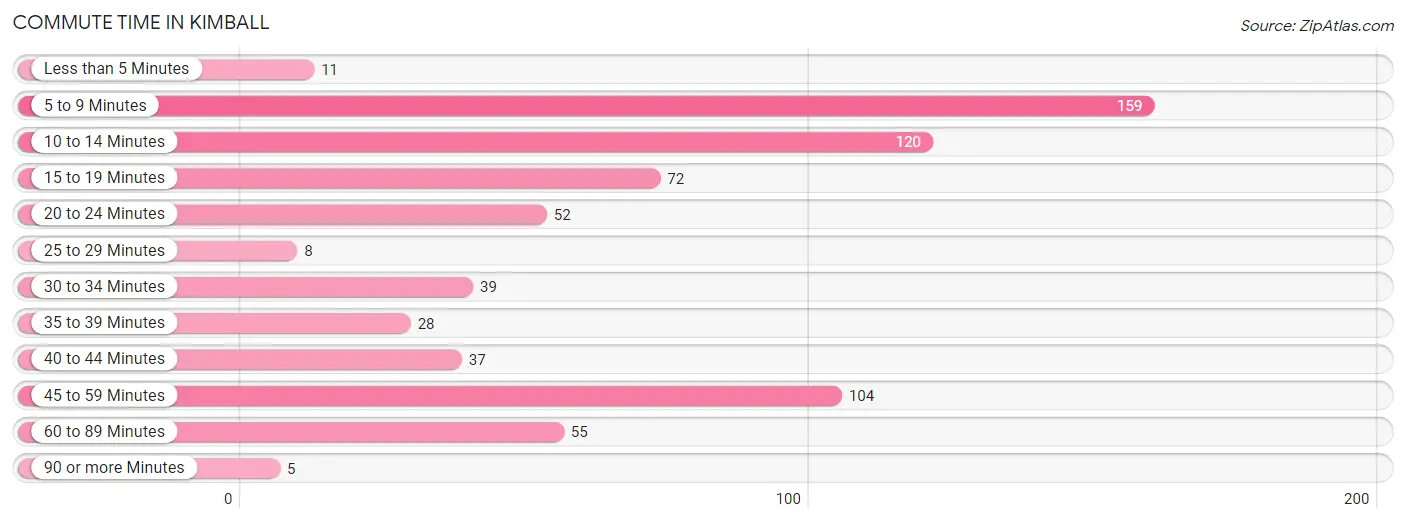
| Commute Time | # Commuters | % Commuters |
| Less than 5 Minutes | 11 | 1.6% |
| 5 to 9 Minutes | 159 | 23.0% |
| 10 to 14 Minutes | 120 | 17.4% |
| 15 to 19 Minutes | 72 | 10.4% |
| 20 to 24 Minutes | 52 | 7.5% |
| 25 to 29 Minutes | 8 | 1.2% |
| 30 to 34 Minutes | 39 | 5.7% |
| 35 to 39 Minutes | 28 | 4.1% |
| 40 to 44 Minutes | 37 | 5.4% |
| 45 to 59 Minutes | 104 | 15.1% |
| 60 to 89 Minutes | 55 | 8.0% |
| 90 or more Minutes | 5 | 0.7% |
Commute Time by Sex in Kimball
The most common commute times in Kimball are 5 to 9 minutes (84 commuters, 20.3%) for males and 5 to 9 minutes (75 commuters, 27.1%) for females.
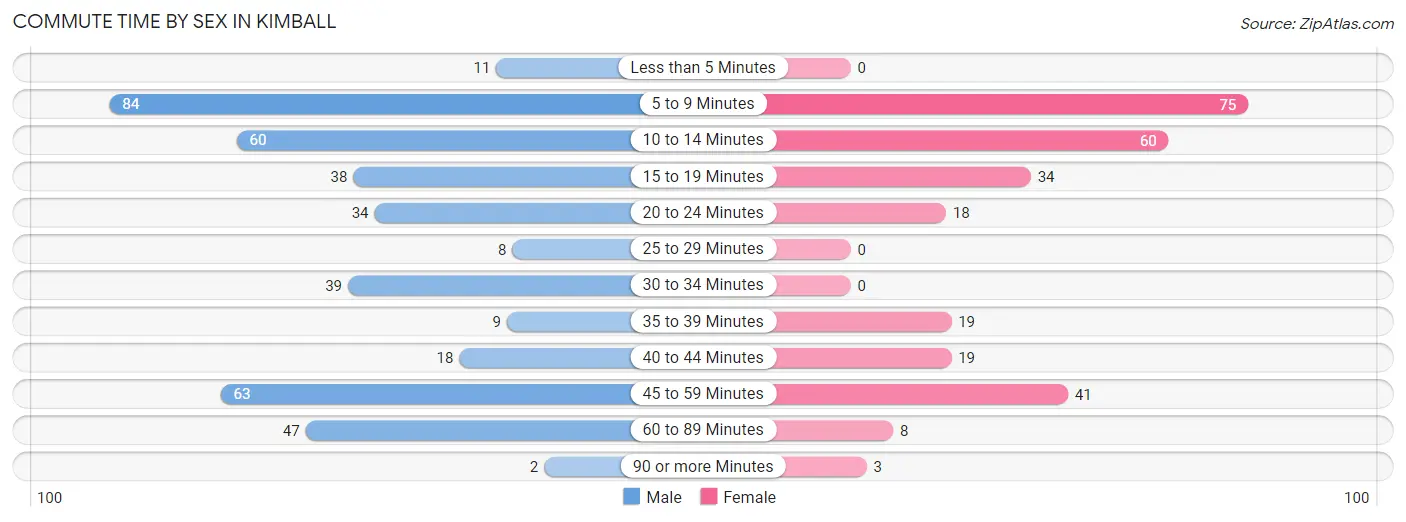
| Commute Time | Male | Female |
| Less than 5 Minutes | 11 (2.7%) | 0 (0.0%) |
| 5 to 9 Minutes | 84 (20.3%) | 75 (27.1%) |
| 10 to 14 Minutes | 60 (14.5%) | 60 (21.7%) |
| 15 to 19 Minutes | 38 (9.2%) | 34 (12.3%) |
| 20 to 24 Minutes | 34 (8.2%) | 18 (6.5%) |
| 25 to 29 Minutes | 8 (1.9%) | 0 (0.0%) |
| 30 to 34 Minutes | 39 (9.4%) | 0 (0.0%) |
| 35 to 39 Minutes | 9 (2.2%) | 19 (6.9%) |
| 40 to 44 Minutes | 18 (4.4%) | 19 (6.9%) |
| 45 to 59 Minutes | 63 (15.2%) | 41 (14.8%) |
| 60 to 89 Minutes | 47 (11.4%) | 8 (2.9%) |
| 90 or more Minutes | 2 (0.5%) | 3 (1.1%) |
Time of Departure to Work by Sex in Kimball
The most frequent times of departure to work in Kimball are 12:00 AM to 4:59 AM (89, 21.5%) for males and 4:00 PM to 11:59 PM (50, 18.0%) for females.
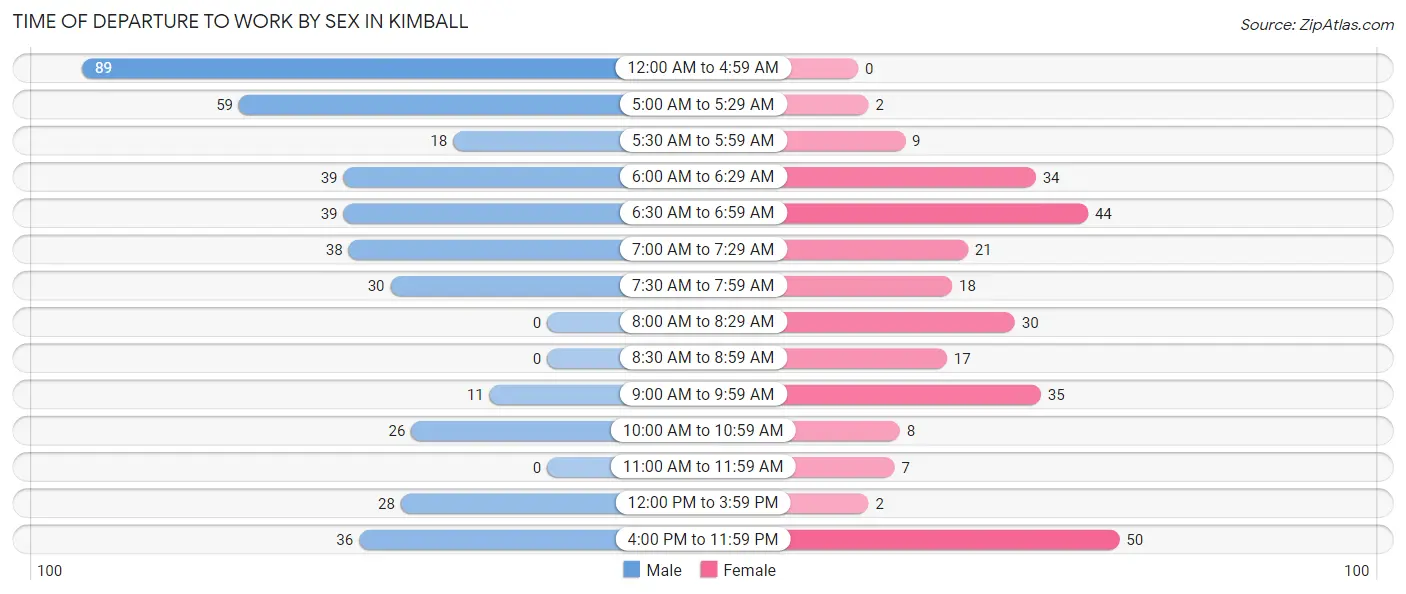
| Time of Departure | Male | Female |
| 12:00 AM to 4:59 AM | 89 (21.5%) | 0 (0.0%) |
| 5:00 AM to 5:29 AM | 59 (14.3%) | 2 (0.7%) |
| 5:30 AM to 5:59 AM | 18 (4.4%) | 9 (3.3%) |
| 6:00 AM to 6:29 AM | 39 (9.4%) | 34 (12.3%) |
| 6:30 AM to 6:59 AM | 39 (9.4%) | 44 (15.9%) |
| 7:00 AM to 7:29 AM | 38 (9.2%) | 21 (7.6%) |
| 7:30 AM to 7:59 AM | 30 (7.3%) | 18 (6.5%) |
| 8:00 AM to 8:29 AM | 0 (0.0%) | 30 (10.8%) |
| 8:30 AM to 8:59 AM | 0 (0.0%) | 17 (6.1%) |
| 9:00 AM to 9:59 AM | 11 (2.7%) | 35 (12.6%) |
| 10:00 AM to 10:59 AM | 26 (6.3%) | 8 (2.9%) |
| 11:00 AM to 11:59 AM | 0 (0.0%) | 7 (2.5%) |
| 12:00 PM to 3:59 PM | 28 (6.8%) | 2 (0.7%) |
| 4:00 PM to 11:59 PM | 36 (8.7%) | 50 (18.0%) |
| Total | 413 (100.0%) | 277 (100.0%) |
Housing Occupancy in Kimball
Occupancy by Ownership in Kimball
Of the total 657 dwellings in Kimball, owner-occupied units account for 445 (67.7%), while renter-occupied units make up 212 (32.3%).
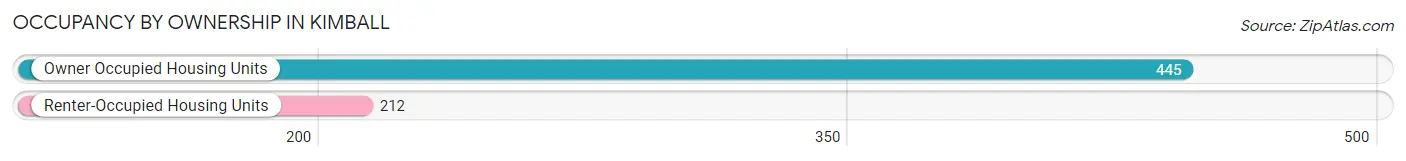
| Occupancy | # Housing Units | % Housing Units |
| Owner Occupied Housing Units | 445 | 67.7% |
| Renter-Occupied Housing Units | 212 | 32.3% |
| Total Occupied Housing Units | 657 | 100.0% |
Occupancy by Household Size in Kimball
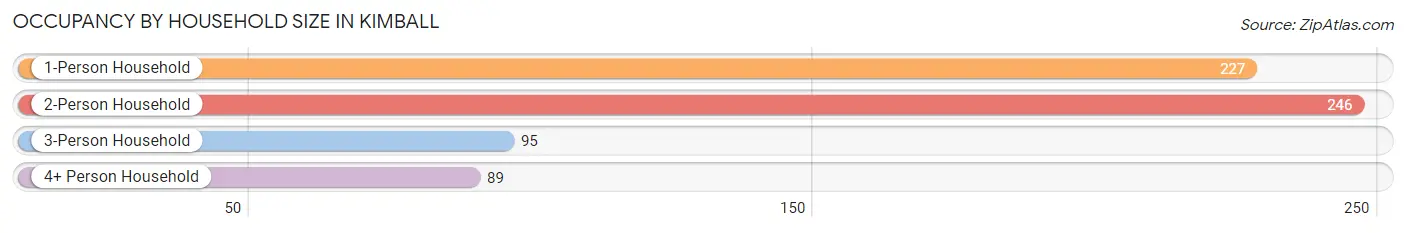
| Household Size | # Housing Units | % Housing Units |
| 1-Person Household | 227 | 34.5% |
| 2-Person Household | 246 | 37.4% |
| 3-Person Household | 95 | 14.5% |
| 4+ Person Household | 89 | 13.6% |
| Total Housing Units | 657 | 100.0% |
Occupancy by Ownership by Household Size in Kimball
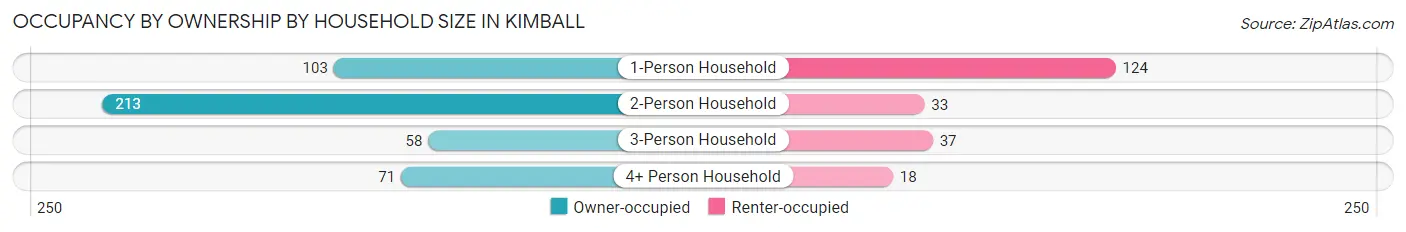
| Household Size | Owner-occupied | Renter-occupied |
| 1-Person Household | 103 (45.4%) | 124 (54.6%) |
| 2-Person Household | 213 (86.6%) | 33 (13.4%) |
| 3-Person Household | 58 (61.1%) | 37 (39.0%) |
| 4+ Person Household | 71 (79.8%) | 18 (20.2%) |
| Total Housing Units | 445 (67.7%) | 212 (32.3%) |
Occupancy by Educational Attainment in Kimball
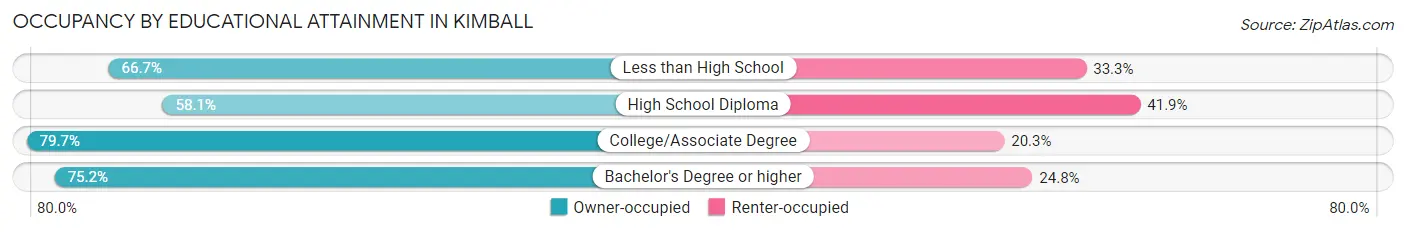
| Household Size | Owner-occupied | Renter-occupied |
| Less than High School | 28 (66.7%) | 14 (33.3%) |
| High School Diploma | 183 (58.1%) | 132 (41.9%) |
| College/Associate Degree | 149 (79.7%) | 38 (20.3%) |
| Bachelor's Degree or higher | 85 (75.2%) | 28 (24.8%) |
Occupancy by Age of Householder in Kimball
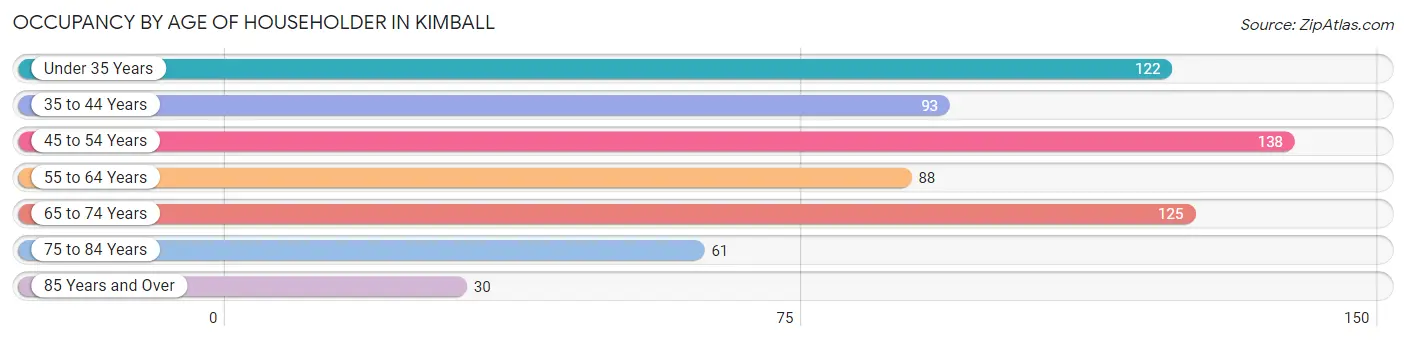
| Age Bracket | # Households | % Households |
| Under 35 Years | 122 | 18.6% |
| 35 to 44 Years | 93 | 14.2% |
| 45 to 54 Years | 138 | 21.0% |
| 55 to 64 Years | 88 | 13.4% |
| 65 to 74 Years | 125 | 19.0% |
| 75 to 84 Years | 61 | 9.3% |
| 85 Years and Over | 30 | 4.6% |
| Total | 657 | 100.0% |
Housing Finances in Kimball
Median Income by Occupancy in Kimball
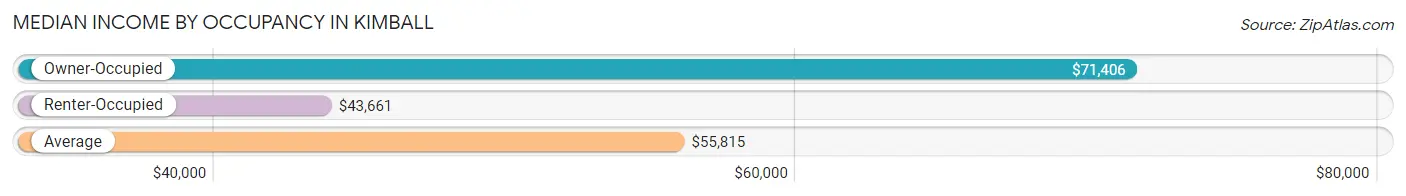
| Occupancy Type | # Households | Median Income |
| Owner-Occupied | 445 (67.7%) | $71,406 |
| Renter-Occupied | 212 (32.3%) | $43,661 |
| Average | 657 (100.0%) | $55,815 |
Occupancy by Householder Income Bracket in Kimball
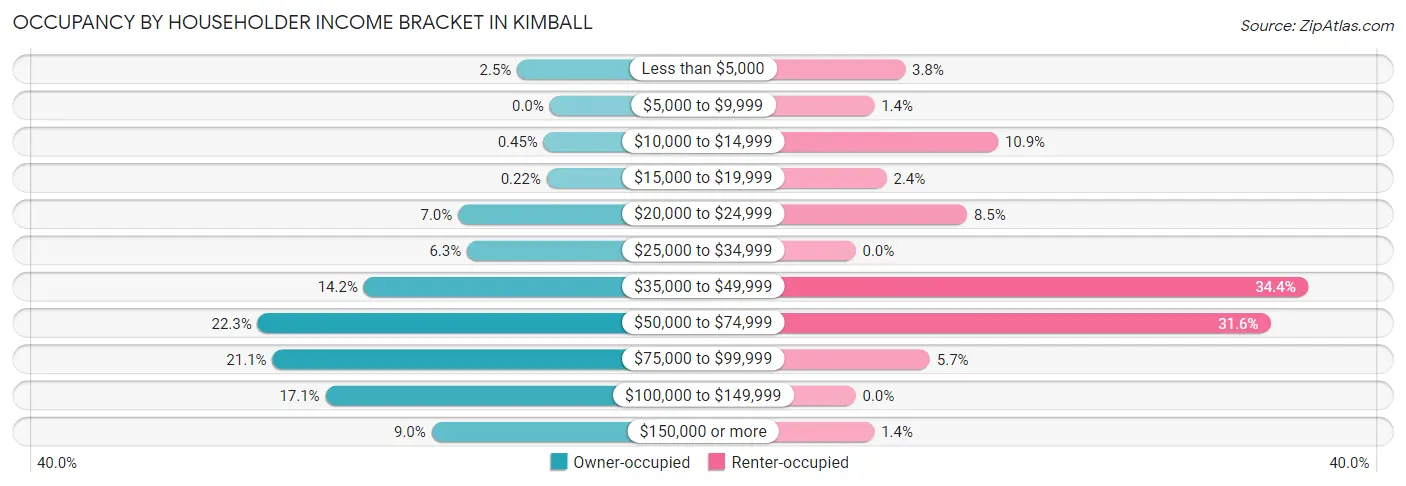
| Income Bracket | Owner-occupied | Renter-occupied |
| Less than $5,000 | 11 (2.5%) | 8 (3.8%) |
| $5,000 to $9,999 | 0 (0.0%) | 3 (1.4%) |
| $10,000 to $14,999 | 2 (0.4%) | 23 (10.8%) |
| $15,000 to $19,999 | 1 (0.2%) | 5 (2.4%) |
| $20,000 to $24,999 | 31 (7.0%) | 18 (8.5%) |
| $25,000 to $34,999 | 28 (6.3%) | 0 (0.0%) |
| $35,000 to $49,999 | 63 (14.2%) | 73 (34.4%) |
| $50,000 to $74,999 | 99 (22.3%) | 67 (31.6%) |
| $75,000 to $99,999 | 94 (21.1%) | 12 (5.7%) |
| $100,000 to $149,999 | 76 (17.1%) | 0 (0.0%) |
| $150,000 or more | 40 (9.0%) | 3 (1.4%) |
| Total | 445 (100.0%) | 212 (100.0%) |
Monthly Housing Cost Tiers in Kimball
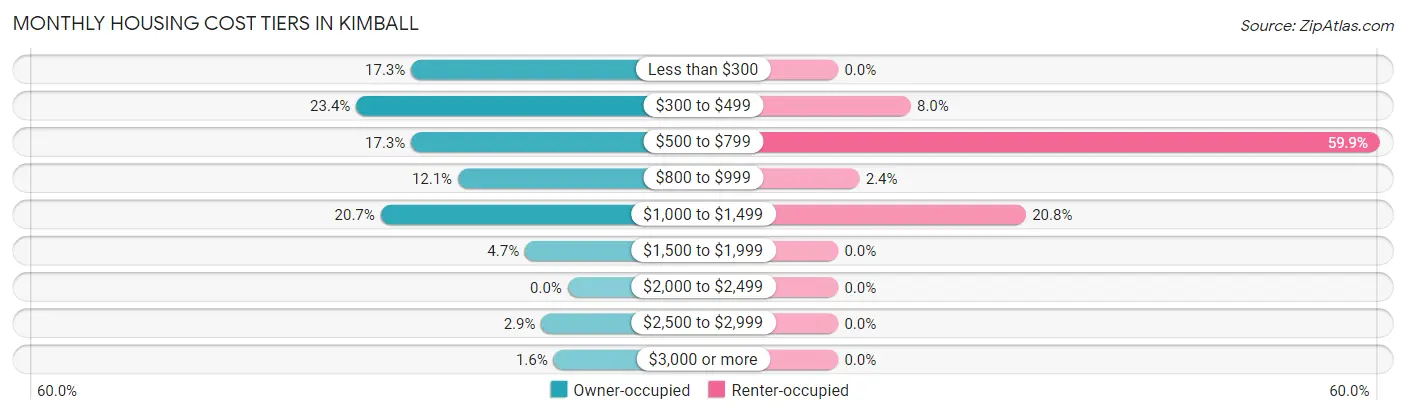
| Monthly Cost | Owner-occupied | Renter-occupied |
| Less than $300 | 77 (17.3%) | 0 (0.0%) |
| $300 to $499 | 104 (23.4%) | 17 (8.0%) |
| $500 to $799 | 77 (17.3%) | 127 (59.9%) |
| $800 to $999 | 54 (12.1%) | 5 (2.4%) |
| $1,000 to $1,499 | 92 (20.7%) | 44 (20.7%) |
| $1,500 to $1,999 | 21 (4.7%) | 0 (0.0%) |
| $2,000 to $2,499 | 0 (0.0%) | 0 (0.0%) |
| $2,500 to $2,999 | 13 (2.9%) | 0 (0.0%) |
| $3,000 or more | 7 (1.6%) | 0 (0.0%) |
| Total | 445 (100.0%) | 212 (100.0%) |
Physical Housing Characteristics in Kimball
Housing Structures in Kimball
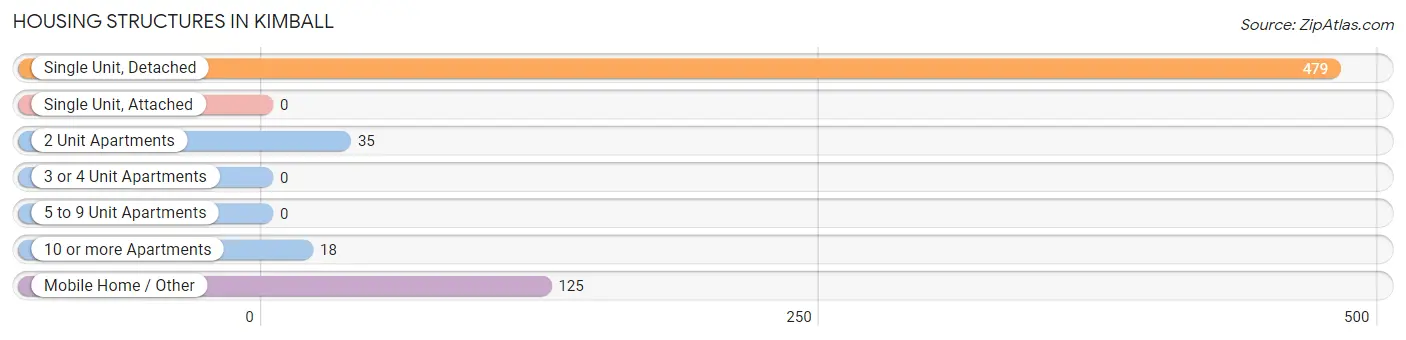
| Structure Type | # Housing Units | % Housing Units |
| Single Unit, Detached | 479 | 72.9% |
| Single Unit, Attached | 0 | 0.0% |
| 2 Unit Apartments | 35 | 5.3% |
| 3 or 4 Unit Apartments | 0 | 0.0% |
| 5 to 9 Unit Apartments | 0 | 0.0% |
| 10 or more Apartments | 18 | 2.7% |
| Mobile Home / Other | 125 | 19.0% |
| Total | 657 | 100.0% |
Housing Structures by Occupancy in Kimball
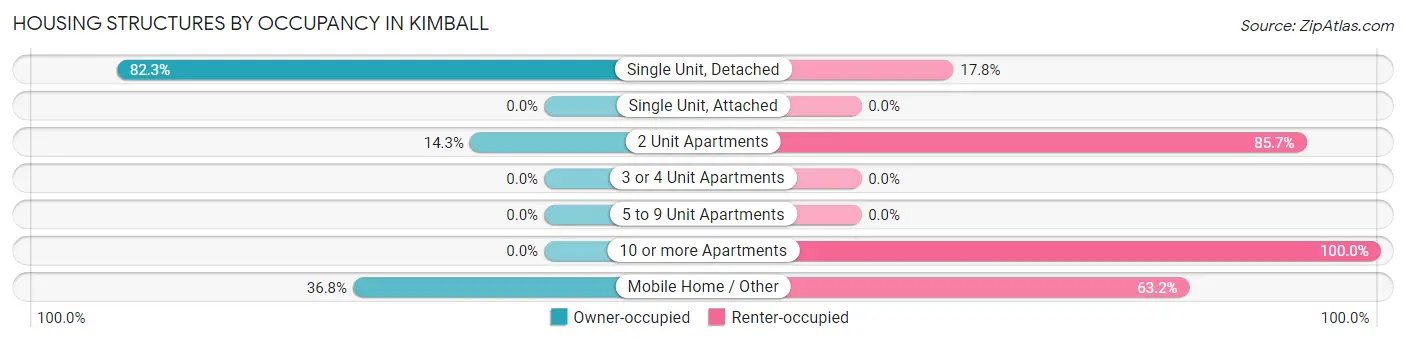
| Structure Type | Owner-occupied | Renter-occupied |
| Single Unit, Detached | 394 (82.3%) | 85 (17.7%) |
| Single Unit, Attached | 0 (0.0%) | 0 (0.0%) |
| 2 Unit Apartments | 5 (14.3%) | 30 (85.7%) |
| 3 or 4 Unit Apartments | 0 (0.0%) | 0 (0.0%) |
| 5 to 9 Unit Apartments | 0 (0.0%) | 0 (0.0%) |
| 10 or more Apartments | 0 (0.0%) | 18 (100.0%) |
| Mobile Home / Other | 46 (36.8%) | 79 (63.2%) |
| Total | 445 (67.7%) | 212 (32.3%) |
Housing Structures by Number of Rooms in Kimball
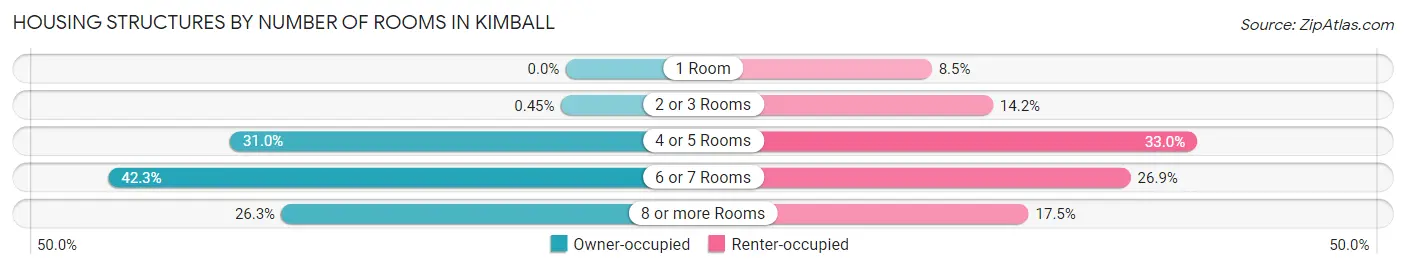
| Number of Rooms | Owner-occupied | Renter-occupied |
| 1 Room | 0 (0.0%) | 18 (8.5%) |
| 2 or 3 Rooms | 2 (0.4%) | 30 (14.1%) |
| 4 or 5 Rooms | 138 (31.0%) | 70 (33.0%) |
| 6 or 7 Rooms | 188 (42.2%) | 57 (26.9%) |
| 8 or more Rooms | 117 (26.3%) | 37 (17.4%) |
| Total | 445 (100.0%) | 212 (100.0%) |
Housing Structure by Heating Type in Kimball
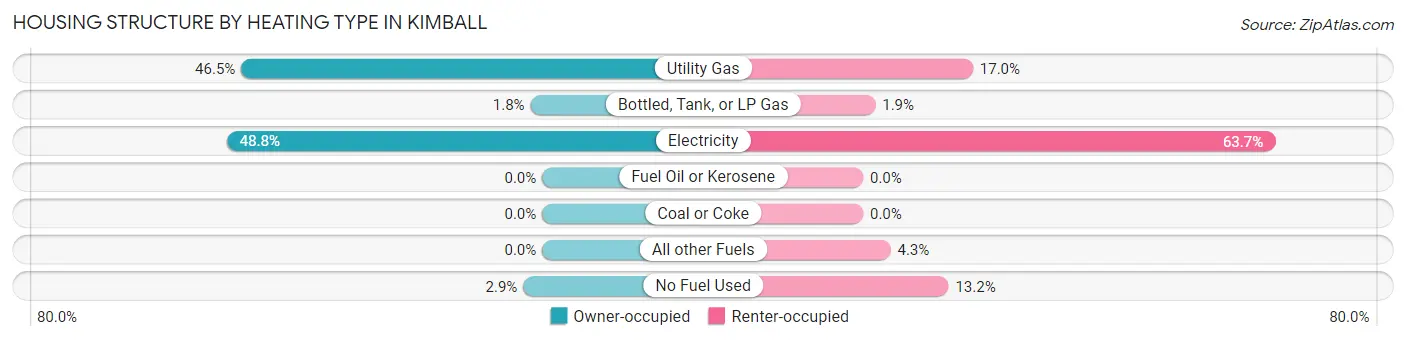
| Heating Type | Owner-occupied | Renter-occupied |
| Utility Gas | 207 (46.5%) | 36 (17.0%) |
| Bottled, Tank, or LP Gas | 8 (1.8%) | 4 (1.9%) |
| Electricity | 217 (48.8%) | 135 (63.7%) |
| Fuel Oil or Kerosene | 0 (0.0%) | 0 (0.0%) |
| Coal or Coke | 0 (0.0%) | 0 (0.0%) |
| All other Fuels | 0 (0.0%) | 9 (4.3%) |
| No Fuel Used | 13 (2.9%) | 28 (13.2%) |
| Total | 445 (100.0%) | 212 (100.0%) |
Household Vehicle Usage in Kimball
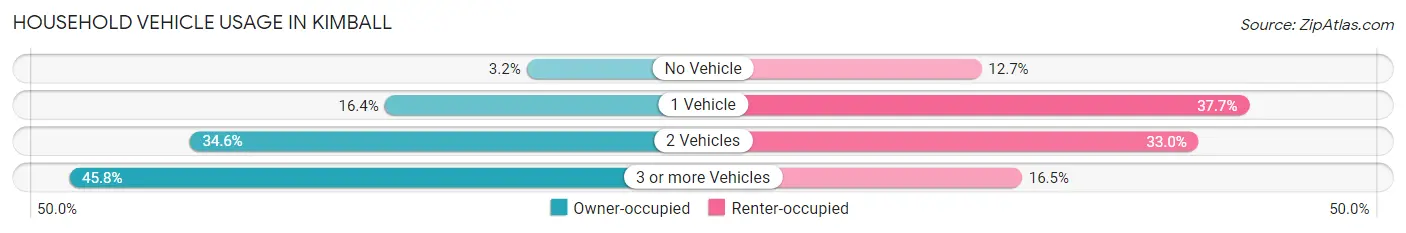
| Vehicles per Household | Owner-occupied | Renter-occupied |
| No Vehicle | 14 (3.2%) | 27 (12.7%) |
| 1 Vehicle | 73 (16.4%) | 80 (37.7%) |
| 2 Vehicles | 154 (34.6%) | 70 (33.0%) |
| 3 or more Vehicles | 204 (45.8%) | 35 (16.5%) |
| Total | 445 (100.0%) | 212 (100.0%) |
Real Estate & Mortgages in Kimball
Real Estate and Mortgage Overview in Kimball
| Characteristic | Without Mortgage | With Mortgage |
| Housing Units | 260 | 185 |
| Median Property Value | $180,300 | $190,900 |
| Median Household Income | $59,773 | $27 |
| Monthly Housing Costs | $385 | $7 |
| Real Estate Taxes | $883 | $7 |
Property Value by Mortgage Status in Kimball
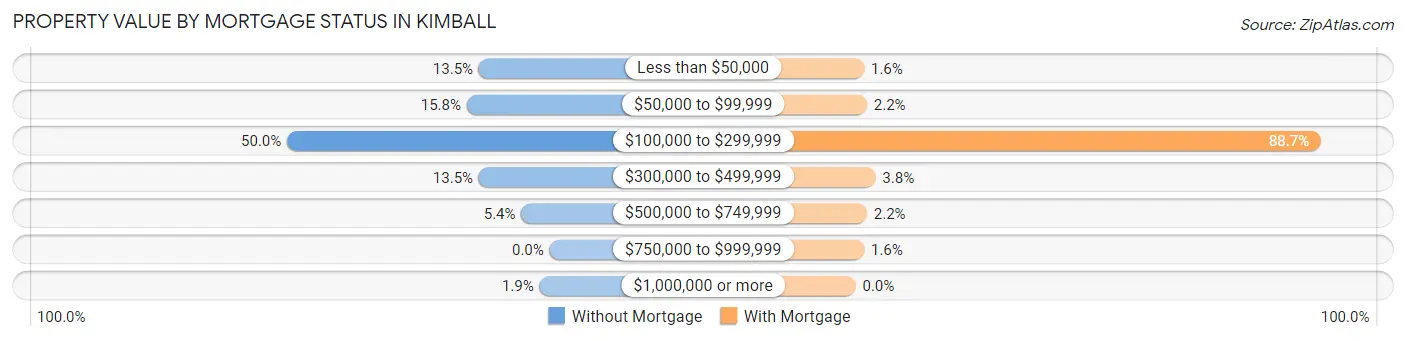
| Property Value | Without Mortgage | With Mortgage |
| Less than $50,000 | 35 (13.5%) | 3 (1.6%) |
| $50,000 to $99,999 | 41 (15.8%) | 4 (2.2%) |
| $100,000 to $299,999 | 130 (50.0%) | 164 (88.6%) |
| $300,000 to $499,999 | 35 (13.5%) | 7 (3.8%) |
| $500,000 to $749,999 | 14 (5.4%) | 4 (2.2%) |
| $750,000 to $999,999 | 0 (0.0%) | 3 (1.6%) |
| $1,000,000 or more | 5 (1.9%) | 0 (0.0%) |
| Total | 260 (100.0%) | 185 (100.0%) |
Household Income by Mortgage Status in Kimball
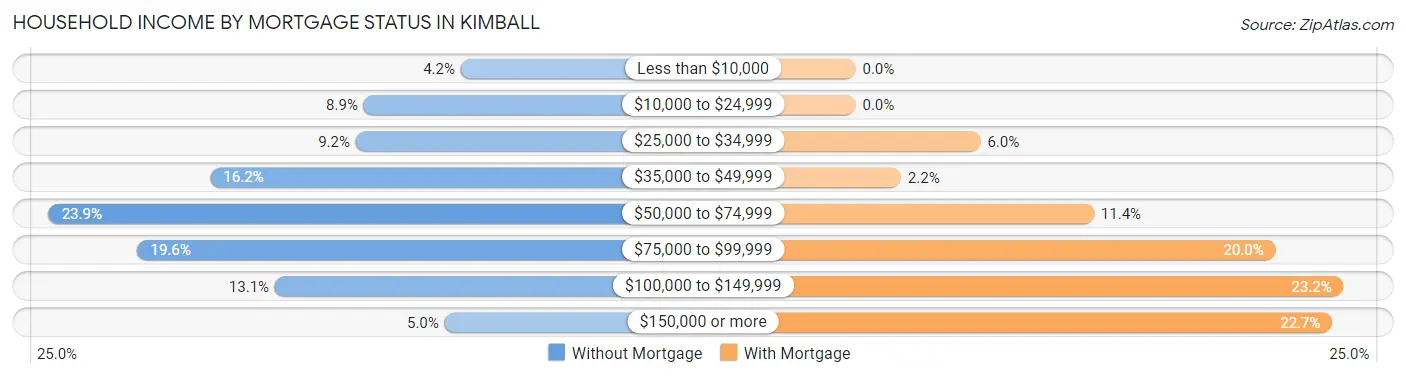
| Household Income | Without Mortgage | With Mortgage |
| Less than $10,000 | 11 (4.2%) | 0 (0.0%) |
| $10,000 to $24,999 | 23 (8.8%) | 0 (0.0%) |
| $25,000 to $34,999 | 24 (9.2%) | 11 (5.9%) |
| $35,000 to $49,999 | 42 (16.2%) | 4 (2.2%) |
| $50,000 to $74,999 | 62 (23.8%) | 21 (11.4%) |
| $75,000 to $99,999 | 51 (19.6%) | 37 (20.0%) |
| $100,000 to $149,999 | 34 (13.1%) | 43 (23.2%) |
| $150,000 or more | 13 (5.0%) | 42 (22.7%) |
| Total | 260 (100.0%) | 185 (100.0%) |
Property Value to Household Income Ratio in Kimball
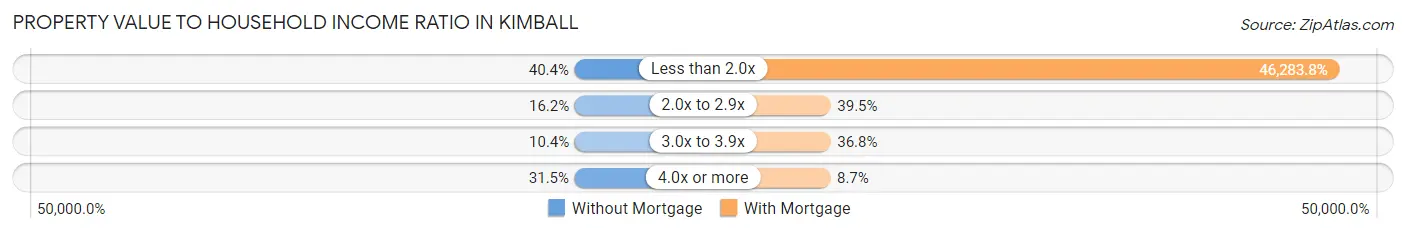
| Value-to-Income Ratio | Without Mortgage | With Mortgage |
| Less than 2.0x | 105 (40.4%) | 85,625 (46,283.8%) |
| 2.0x to 2.9x | 42 (16.2%) | 73 (39.5%) |
| 3.0x to 3.9x | 27 (10.4%) | 68 (36.8%) |
| 4.0x or more | 82 (31.5%) | 16 (8.6%) |
| Total | 260 (100.0%) | 185 (100.0%) |
Real Estate Taxes by Mortgage Status in Kimball
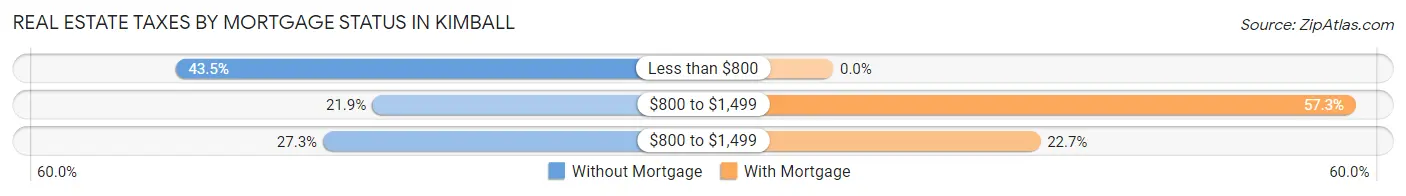
| Property Taxes | Without Mortgage | With Mortgage |
| Less than $800 | 113 (43.5%) | 0 (0.0%) |
| $800 to $1,499 | 57 (21.9%) | 106 (57.3%) |
| $800 to $1,499 | 71 (27.3%) | 42 (22.7%) |
| Total | 260 (100.0%) | 185 (100.0%) |
Health & Disability in Kimball
Health Insurance Coverage by Age in Kimball
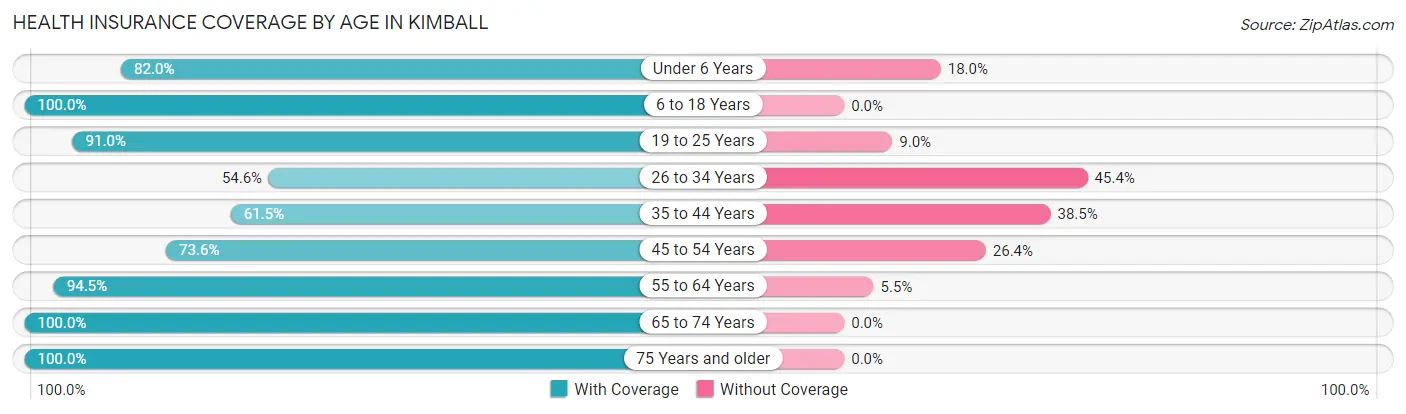
| Age Bracket | With Coverage | Without Coverage |
| Under 6 Years | 41 (82.0%) | 9 (18.0%) |
| 6 to 18 Years | 239 (100.0%) | 0 (0.0%) |
| 19 to 25 Years | 122 (91.0%) | 12 (9.0%) |
| 26 to 34 Years | 71 (54.6%) | 59 (45.4%) |
| 35 to 44 Years | 112 (61.5%) | 70 (38.5%) |
| 45 to 54 Years | 145 (73.6%) | 52 (26.4%) |
| 55 to 64 Years | 173 (94.5%) | 10 (5.5%) |
| 65 to 74 Years | 201 (100.0%) | 0 (0.0%) |
| 75 Years and older | 122 (100.0%) | 0 (0.0%) |
| Total | 1,226 (85.3%) | 212 (14.7%) |
Health Insurance Coverage by Citizenship Status in Kimball
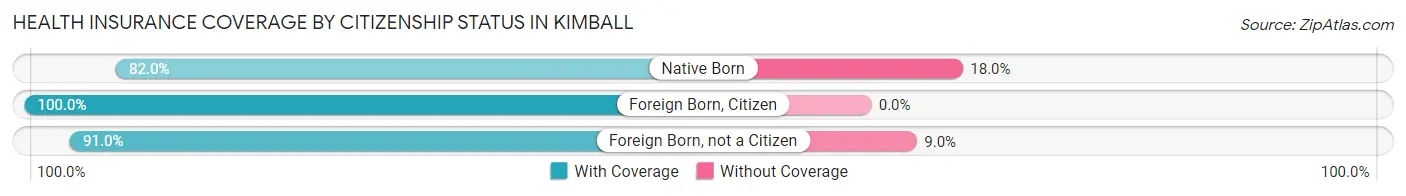
| Citizenship Status | With Coverage | Without Coverage |
| Native Born | 41 (82.0%) | 9 (18.0%) |
| Foreign Born, Citizen | 239 (100.0%) | 0 (0.0%) |
| Foreign Born, not a Citizen | 122 (91.0%) | 12 (9.0%) |
Health Insurance Coverage by Household Income in Kimball
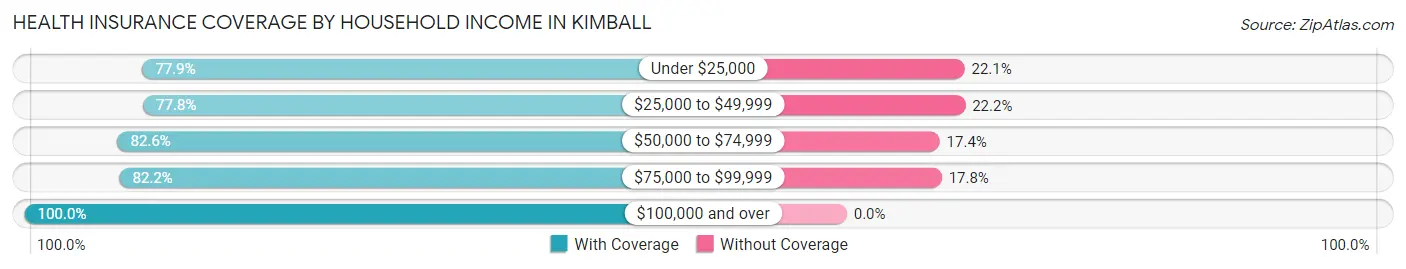
| Household Income | With Coverage | Without Coverage |
| Under $25,000 | 106 (77.9%) | 30 (22.1%) |
| $25,000 to $49,999 | 235 (77.8%) | 67 (22.2%) |
| $50,000 to $74,999 | 318 (82.6%) | 67 (17.4%) |
| $75,000 to $99,999 | 222 (82.2%) | 48 (17.8%) |
| $100,000 and over | 345 (100.0%) | 0 (0.0%) |
Public vs Private Health Insurance Coverage by Age in Kimball
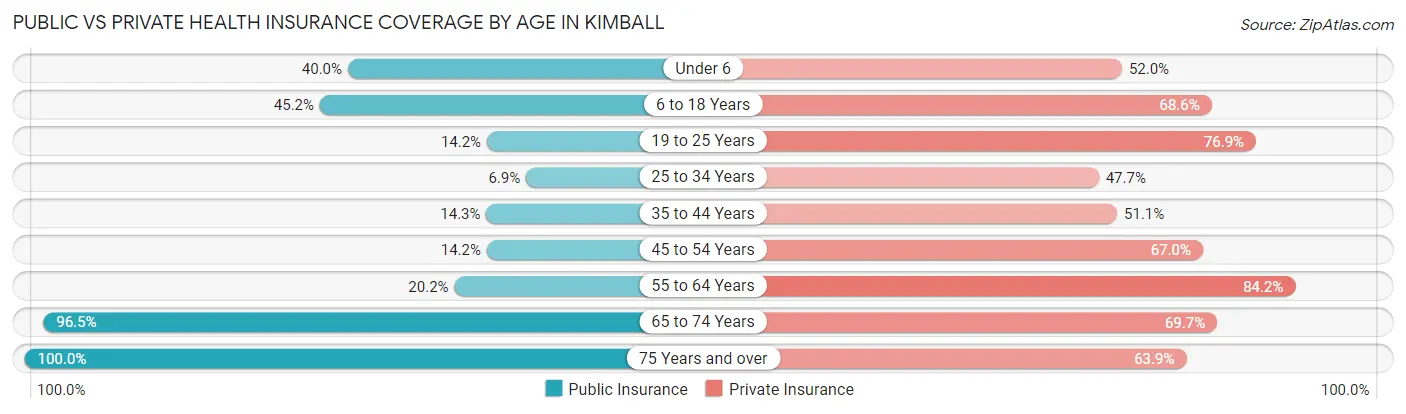
| Age Bracket | Public Insurance | Private Insurance |
| Under 6 | 20 (40.0%) | 26 (52.0%) |
| 6 to 18 Years | 108 (45.2%) | 164 (68.6%) |
| 19 to 25 Years | 19 (14.2%) | 103 (76.9%) |
| 25 to 34 Years | 9 (6.9%) | 62 (47.7%) |
| 35 to 44 Years | 26 (14.3%) | 93 (51.1%) |
| 45 to 54 Years | 28 (14.2%) | 132 (67.0%) |
| 55 to 64 Years | 37 (20.2%) | 154 (84.2%) |
| 65 to 74 Years | 194 (96.5%) | 140 (69.7%) |
| 75 Years and over | 122 (100.0%) | 78 (63.9%) |
| Total | 563 (39.2%) | 952 (66.2%) |
Disability Status by Sex by Age in Kimball
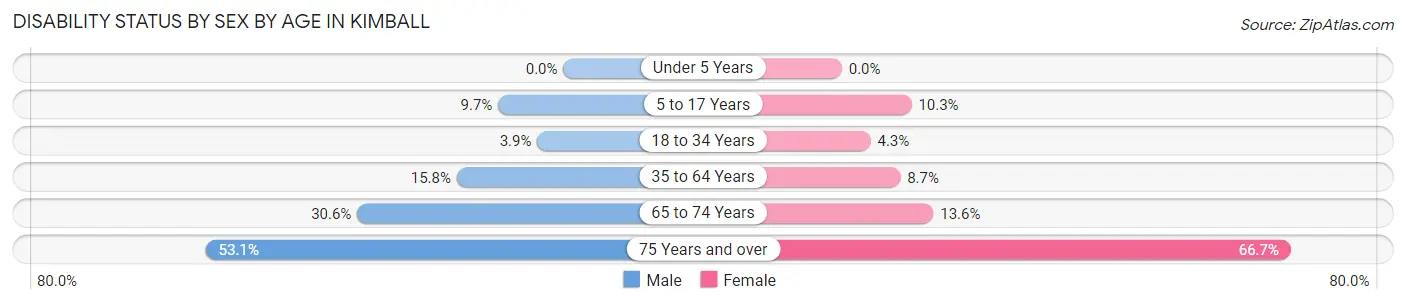
| Age Bracket | Male | Female |
| Under 5 Years | 0 (0.0%) | 0 (0.0%) |
| 5 to 17 Years | 9 (9.7%) | 15 (10.3%) |
| 18 to 34 Years | 6 (3.9%) | 5 (4.3%) |
| 35 to 64 Years | 47 (15.8%) | 23 (8.7%) |
| 65 to 74 Years | 30 (30.6%) | 14 (13.6%) |
| 75 Years and over | 17 (53.1%) | 60 (66.7%) |
Disability Class by Sex by Age in Kimball
Disability Class: Hearing Difficulty
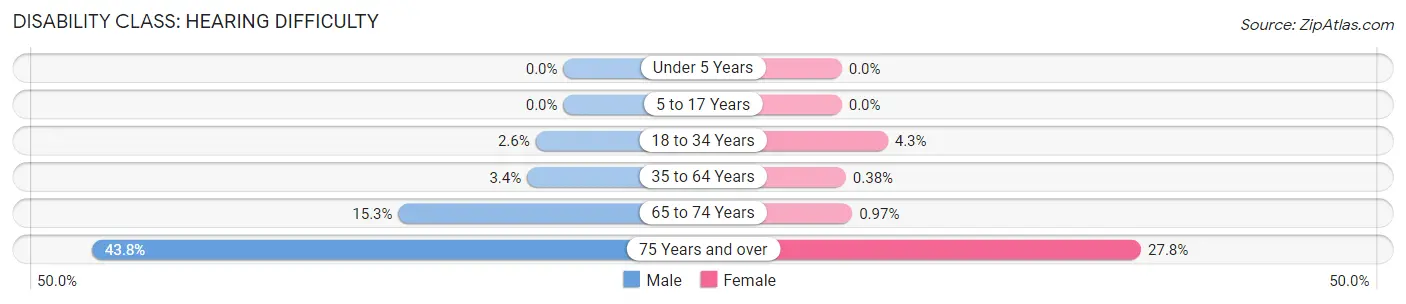
| Age Bracket | Male | Female |
| Under 5 Years | 0 (0.0%) | 0 (0.0%) |
| 5 to 17 Years | 0 (0.0%) | 0 (0.0%) |
| 18 to 34 Years | 4 (2.6%) | 5 (4.3%) |
| 35 to 64 Years | 10 (3.4%) | 1 (0.4%) |
| 65 to 74 Years | 15 (15.3%) | 1 (1.0%) |
| 75 Years and over | 14 (43.8%) | 25 (27.8%) |
Disability Class: Vision Difficulty
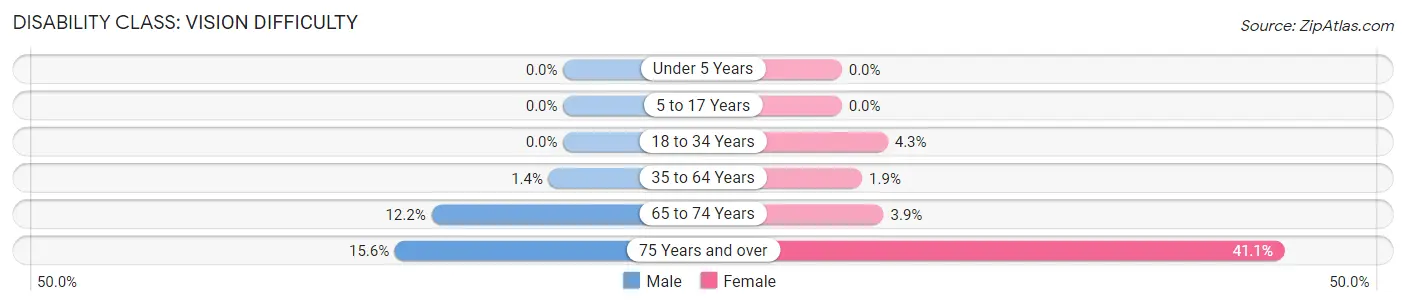
| Age Bracket | Male | Female |
| Under 5 Years | 0 (0.0%) | 0 (0.0%) |
| 5 to 17 Years | 0 (0.0%) | 0 (0.0%) |
| 18 to 34 Years | 0 (0.0%) | 5 (4.3%) |
| 35 to 64 Years | 4 (1.3%) | 5 (1.9%) |
| 65 to 74 Years | 12 (12.2%) | 4 (3.9%) |
| 75 Years and over | 5 (15.6%) | 37 (41.1%) |
Disability Class: Cognitive Difficulty
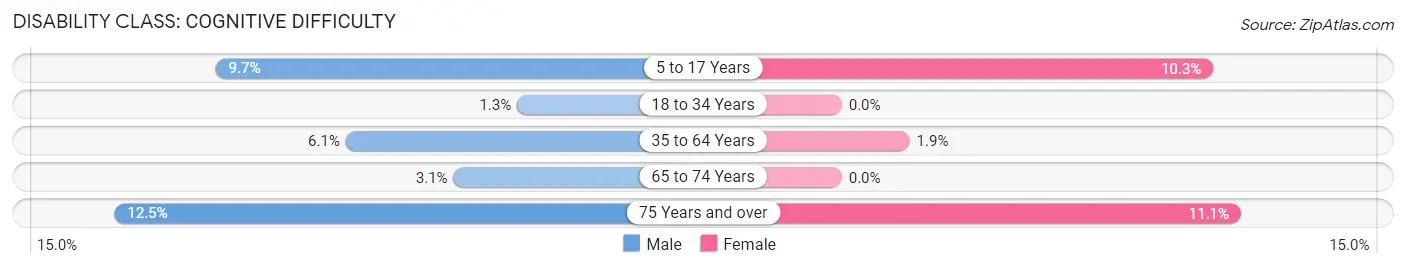
| Age Bracket | Male | Female |
| 5 to 17 Years | 9 (9.7%) | 15 (10.3%) |
| 18 to 34 Years | 2 (1.3%) | 0 (0.0%) |
| 35 to 64 Years | 18 (6.1%) | 5 (1.9%) |
| 65 to 74 Years | 3 (3.1%) | 0 (0.0%) |
| 75 Years and over | 4 (12.5%) | 10 (11.1%) |
Disability Class: Ambulatory Difficulty
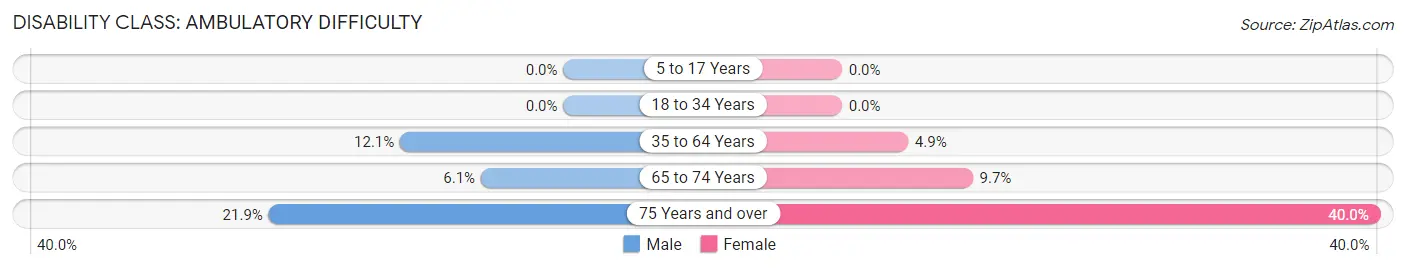
| Age Bracket | Male | Female |
| 5 to 17 Years | 0 (0.0%) | 0 (0.0%) |
| 18 to 34 Years | 0 (0.0%) | 0 (0.0%) |
| 35 to 64 Years | 36 (12.1%) | 13 (4.9%) |
| 65 to 74 Years | 6 (6.1%) | 10 (9.7%) |
| 75 Years and over | 7 (21.9%) | 36 (40.0%) |
Disability Class: Self-Care Difficulty
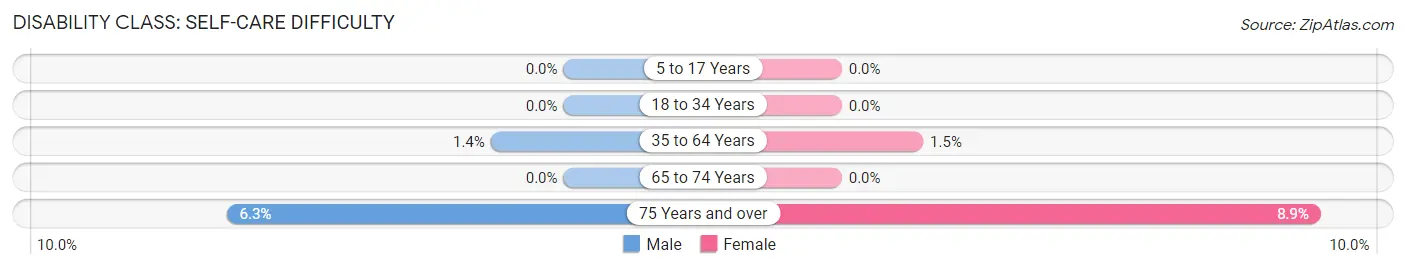
| Age Bracket | Male | Female |
| 5 to 17 Years | 0 (0.0%) | 0 (0.0%) |
| 18 to 34 Years | 0 (0.0%) | 0 (0.0%) |
| 35 to 64 Years | 4 (1.3%) | 4 (1.5%) |
| 65 to 74 Years | 0 (0.0%) | 0 (0.0%) |
| 75 Years and over | 2 (6.2%) | 8 (8.9%) |
Technology Access in Kimball
Computing Device Access in Kimball
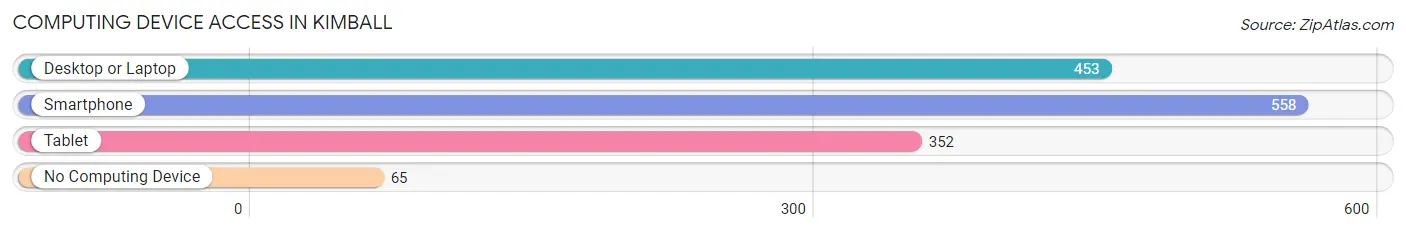
| Device Type | # Households | % Households |
| Desktop or Laptop | 453 | 69.0% |
| Smartphone | 558 | 84.9% |
| Tablet | 352 | 53.6% |
| No Computing Device | 65 | 9.9% |
| Total | 657 | 100.0% |
Internet Access in Kimball
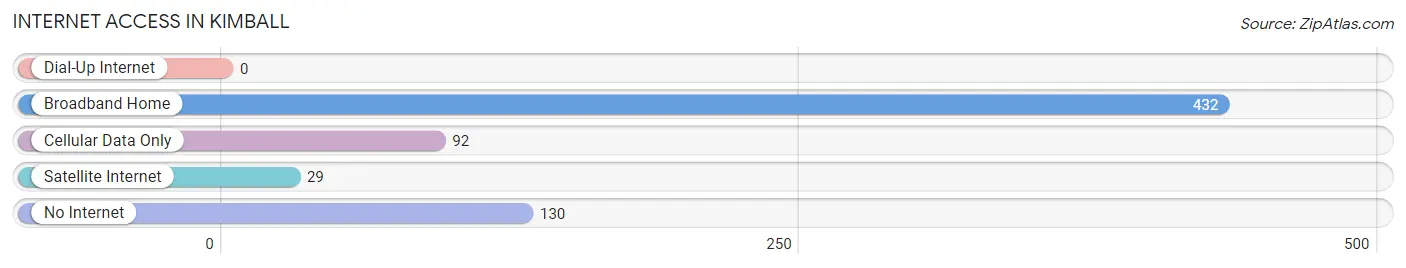
| Internet Type | # Households | % Households |
| Dial-Up Internet | 0 | 0.0% |
| Broadband Home | 432 | 65.7% |
| Cellular Data Only | 92 | 14.0% |
| Satellite Internet | 29 | 4.4% |
| No Internet | 130 | 19.8% |
| Total | 657 | 100.0% |
Kimball Summary
Kimball, Tennessee is a small town located in the foothills of the Appalachian Mountains in the southeastern United States. It is situated in the Sequatchie Valley, a narrow valley that runs through the Cumberland Plateau. The town is located in Marion County, Tennessee, and is part of the Chattanooga Metropolitan Statistical Area. As of the 2010 census, the population of Kimball was 1,845.
History
The area that is now Kimball was first settled in the early 1800s by settlers from North Carolina and Virginia. The town was originally known as “Kimball’s Crossroads”, named after the first settler, William Kimball. The town was officially incorporated in 1887.
Kimball was an important stop on the Nashville and Chattanooga Railroad, which ran through the town from 1854 to 1871. The railroad was a major factor in the growth of the town, as it allowed for the transportation of goods and people to and from the area.
Kimball was also an important stop on the Underground Railroad, a network of secret routes and safe houses used by African-American slaves to escape to freedom in the northern United States and Canada. The town was home to several prominent abolitionists, including the Reverend John Rankin, who operated a station on the Underground Railroad in Kimball.
Geography
Kimball is located in the Sequatchie Valley, a narrow valley that runs through the Cumberland Plateau. The town is situated at the intersection of U.S. Route 27 and State Route 111. The town is located approximately 25 miles south of Chattanooga, Tennessee, and approximately 75 miles northwest of Knoxville, Tennessee.
The terrain around Kimball is mostly hilly, with some flat areas. The town is located in a temperate climate, with hot summers and mild winters. The average annual temperature is around 60 degrees Fahrenheit.
Economy
Kimball’s economy is largely based on agriculture and manufacturing. The town is home to several small businesses, including a lumber mill, a furniture factory, and a dairy farm. The town is also home to several retail stores, including a grocery store, a hardware store, and a pharmacy.
Kimball is also home to several tourist attractions, including the Sequatchie Valley Railroad Museum, the Kimball Museum of Local History, and the Kimball Arts Center. The town is also home to several annual festivals, including the Kimball Bluegrass Festival and the Kimball Country Fair.
Demographics
As of the 2010 census, the population of Kimball was 1,845. The racial makeup of the town was 95.3% White, 1.2% African American, 0.3% Native American, 0.2% Asian, 0.1% Pacific Islander, and 2.9% from other races. The median household income in Kimball was $31,250, and the median family income was $37,500.
Kimball is home to several churches, including the First Baptist Church, the First United Methodist Church, and the Kimball Presbyterian Church. The town is also home to several schools, including Kimball Elementary School, Kimball Middle School, and Kimball High School.
Common Questions
What is Per Capita Income in Kimball?
Per Capita income in Kimball is $32,225.
What is the Median Family Income in Kimball?
Median Family Income in Kimball is $75,833.
What is the Median Household income in Kimball?
Median Household Income in Kimball is $55,815.
What is Income or Wage Gap in Kimball?
Income or Wage Gap in Kimball is 30.7%.
Women in Kimball earn 69.3 cents for every dollar earned by a man.
What is Inequality or Gini Index in Kimball?
Inequality or Gini Index in Kimball is 0.36.
What is the Total Population of Kimball?
Total Population of Kimball is 1,438.
What is the Total Male Population of Kimball?
Total Male Population of Kimball is 693.
What is the Total Female Population of Kimball?
Total Female Population of Kimball is 745.
What is the Ratio of Males per 100 Females in Kimball?
There are 93.02 Males per 100 Females in Kimball.
What is the Ratio of Females per 100 Males in Kimball?
There are 107.50 Females per 100 Males in Kimball.
What is the Median Population Age in Kimball?
Median Population Age in Kimball is 44.2 Years.
What is the Average Family Size in Kimball
Average Family Size in Kimball is 2.8 People.
What is the Average Household Size in Kimball
Average Household Size in Kimball is 2.2 People.
How Large is the Labor Force in Kimball?
There are 749 People in the Labor Forcein in Kimball.
What is the Percentage of People in the Labor Force in Kimball?
62.4% of People are in the Labor Force in Kimball.
What is the Unemployment Rate in Kimball?
Unemployment Rate in Kimball is 3.9%.