Washington Park, FL Map & Demographics
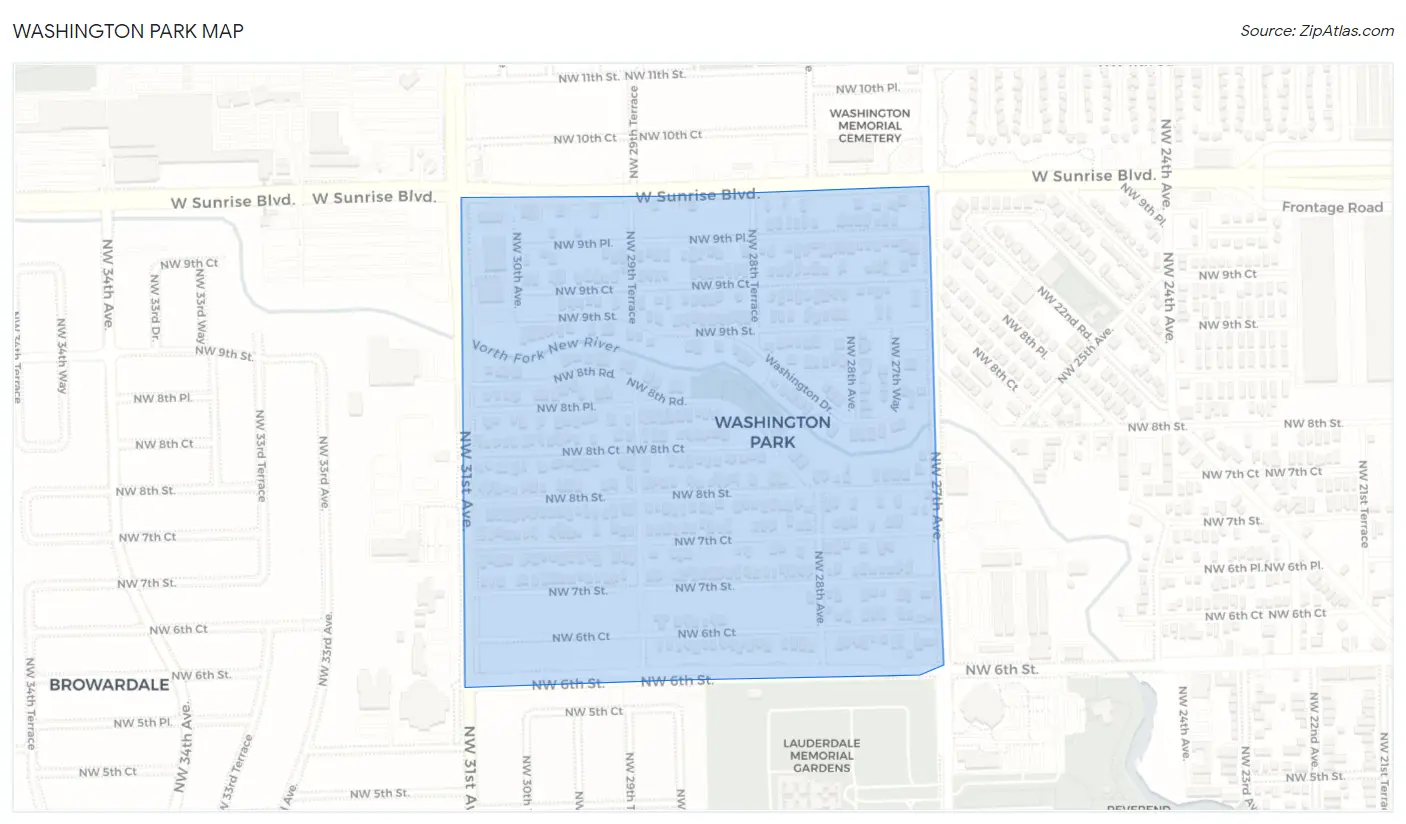
Washington Park Map
Washington Park Overview
$25,859
PER CAPITA INCOME
$66,900
AVG FAMILY INCOME
$52,944
AVG HOUSEHOLD INCOME
8.0%
WAGE / INCOME GAP [ % ]
92.0¢/ $1
WAGE / INCOME GAP [ $ ]
0.51
INEQUALITY / GINI INDEX
1,775
TOTAL POPULATION
619
MALE POPULATION
1,156
FEMALE POPULATION
53.55
MALES / 100 FEMALES
186.75
FEMALES / 100 MALES
38.8
MEDIAN AGE
4.2
AVG FAMILY SIZE
3.2
AVG HOUSEHOLD SIZE
759
LABOR FORCE [ PEOPLE ]
57.6%
PERCENT IN LABOR FORCE
3.4%
UNEMPLOYMENT RATE
Income in Washington Park
Income Overview in Washington Park
Per Capita Income in Washington Park is $25,859, while median incomes of families and households are $66,900 and $52,944 respectively.
| Characteristic | Number | Measure |
| Per Capita Income | 1,775 | $25,859 |
| Median Family Income | 344 | $66,900 |
| Mean Family Income | 344 | $96,030 |
| Median Household Income | 555 | $52,944 |
| Mean Household Income | 555 | $80,144 |
| Income Deficit | 344 | $0 |
| Wage / Income Gap (%) | 1,775 | 8.04% |
| Wage / Income Gap ($) | 1,775 | 91.96¢ per $1 |
| Gini / Inequality Index | 1,775 | 0.51 |
Earnings by Sex in Washington Park
Average Earnings in Washington Park are $31,607, $30,759 for men and $33,450 for women, a difference of 8.0%.
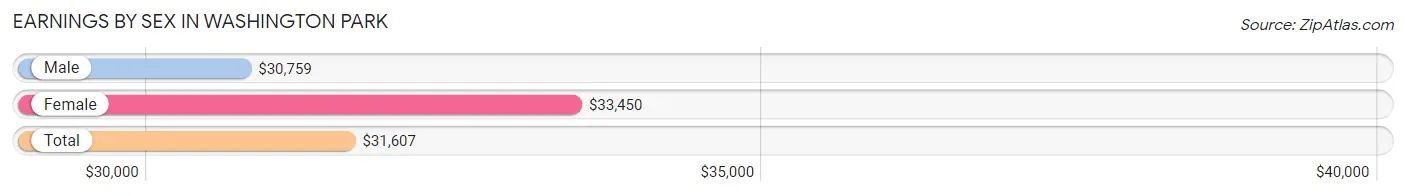
| Sex | Number | Average Earnings |
| Male | 241 (30.4%) | $30,759 |
| Female | 551 (69.6%) | $33,450 |
| Total | 792 (100.0%) | $31,607 |
Earnings by Sex by Income Bracket in Washington Park
The most common earnings brackets in Washington Park are $25,000 to $29,999 for men (61 | 25.3%) and $2,500 to $4,999 for women (101 | 18.3%).
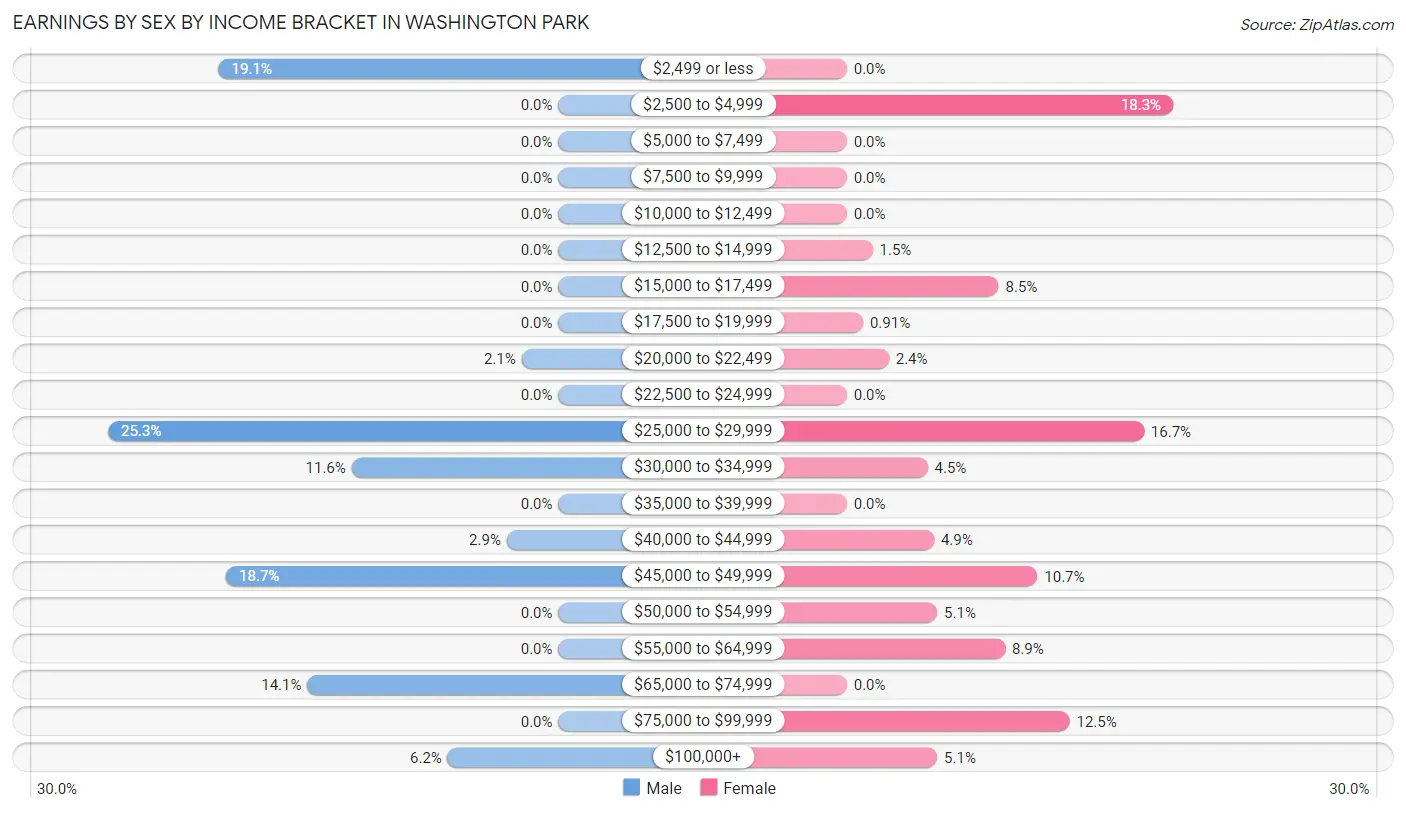
| Income | Male | Female |
| $2,499 or less | 46 (19.1%) | 0 (0.0%) |
| $2,500 to $4,999 | 0 (0.0%) | 101 (18.3%) |
| $5,000 to $7,499 | 0 (0.0%) | 0 (0.0%) |
| $7,500 to $9,999 | 0 (0.0%) | 0 (0.0%) |
| $10,000 to $12,499 | 0 (0.0%) | 0 (0.0%) |
| $12,500 to $14,999 | 0 (0.0%) | 8 (1.5%) |
| $15,000 to $17,499 | 0 (0.0%) | 47 (8.5%) |
| $17,500 to $19,999 | 0 (0.0%) | 5 (0.9%) |
| $20,000 to $22,499 | 5 (2.1%) | 13 (2.4%) |
| $22,500 to $24,999 | 0 (0.0%) | 0 (0.0%) |
| $25,000 to $29,999 | 61 (25.3%) | 92 (16.7%) |
| $30,000 to $34,999 | 28 (11.6%) | 25 (4.5%) |
| $35,000 to $39,999 | 0 (0.0%) | 0 (0.0%) |
| $40,000 to $44,999 | 7 (2.9%) | 27 (4.9%) |
| $45,000 to $49,999 | 45 (18.7%) | 59 (10.7%) |
| $50,000 to $54,999 | 0 (0.0%) | 28 (5.1%) |
| $55,000 to $64,999 | 0 (0.0%) | 49 (8.9%) |
| $65,000 to $74,999 | 34 (14.1%) | 0 (0.0%) |
| $75,000 to $99,999 | 0 (0.0%) | 69 (12.5%) |
| $100,000+ | 15 (6.2%) | 28 (5.1%) |
| Total | 241 (100.0%) | 551 (100.0%) |
Earnings by Sex by Educational Attainment in Washington Park
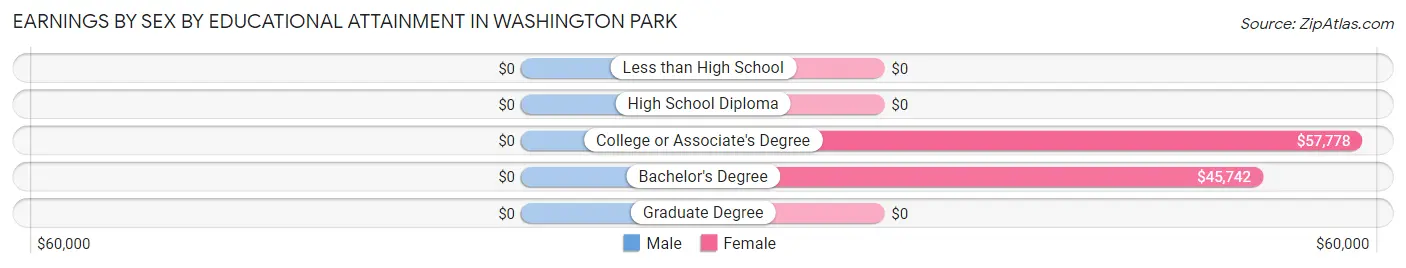
| Educational Attainment | Male Income | Female Income |
| Less than High School | - | - |
| High School Diploma | - | - |
| College or Associate's Degree | - | - |
| Bachelor's Degree | - | - |
| Graduate Degree | - | - |
| Total | $30,446 | $41,065 |
Family Income in Washington Park
Family Income Brackets in Washington Park
According to the Washington Park family income data, there are 116 families falling into the $50,000 to $74,999 income range, which is the most common income bracket and makes up 33.7% of all families.
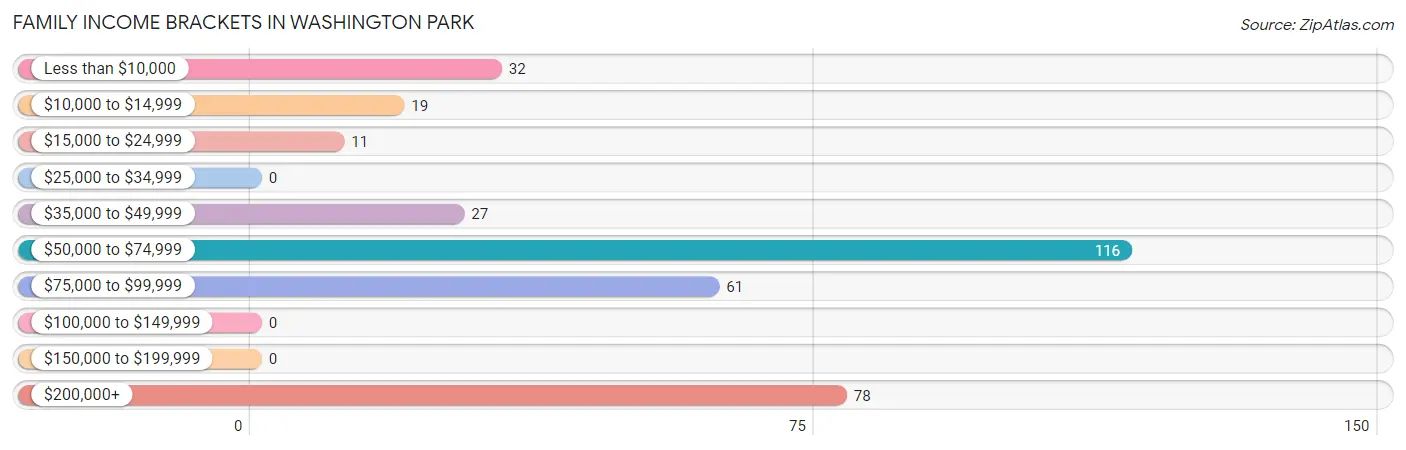
| Income Bracket | # Families | % Families |
| Less than $10,000 | 32 | 9.3% |
| $10,000 to $14,999 | 19 | 5.5% |
| $15,000 to $24,999 | 11 | 3.2% |
| $25,000 to $34,999 | 0 | 0.0% |
| $35,000 to $49,999 | 27 | 7.8% |
| $50,000 to $74,999 | 116 | 33.7% |
| $75,000 to $99,999 | 61 | 17.7% |
| $100,000 to $149,999 | 0 | 0.0% |
| $150,000 to $199,999 | 0 | 0.0% |
| $200,000+ | 78 | 22.7% |
Family Income by Famaliy Size in Washington Park
2-person families (168 | 48.8%) account for the highest median family income in Washington Park with $53,548 per family, while 2-person families (168 | 48.8%) have the highest median income of $26,774 per family member.
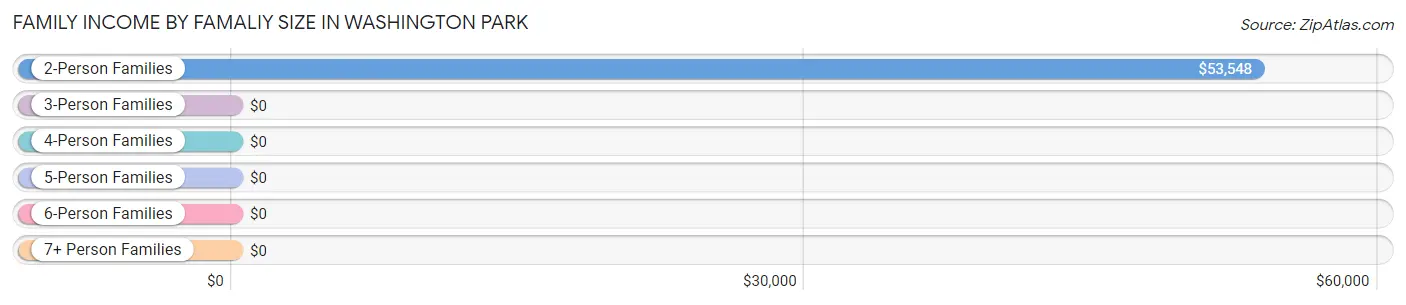
| Income Bracket | # Families | Median Income |
| 2-Person Families | 168 (48.8%) | $53,548 |
| 3-Person Families | 73 (21.2%) | $0 |
| 4-Person Families | 35 (10.2%) | $0 |
| 5-Person Families | 0 (0.0%) | $0 |
| 6-Person Families | 0 (0.0%) | $0 |
| 7+ Person Families | 68 (19.8%) | $0 |
| Total | 344 (100.0%) | $66,900 |
Family Income by Number of Earners in Washington Park
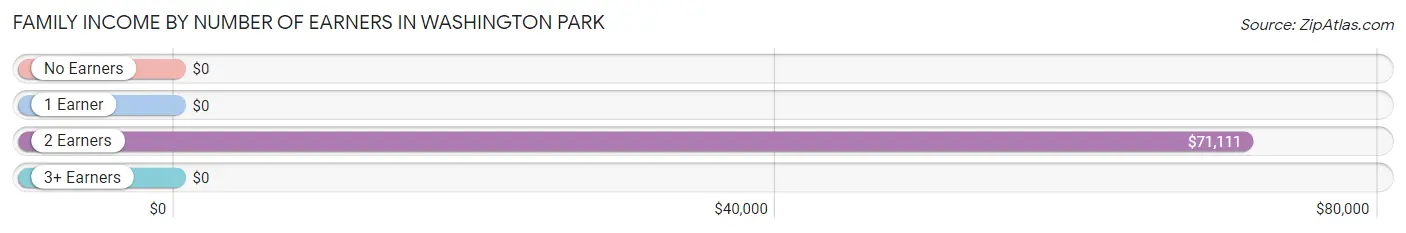
| Number of Earners | # Families | Median Income |
| No Earners | 73 (21.2%) | $0 |
| 1 Earner | 143 (41.6%) | $0 |
| 2 Earners | 84 (24.4%) | $71,111 |
| 3+ Earners | 44 (12.8%) | $0 |
| Total | 344 (100.0%) | $66,900 |
Household Income in Washington Park
Household Income Brackets in Washington Park
With 138 households falling in the category, the $50,000 to $74,999 income range is the most frequent in Washington Park, accounting for 24.9% of all households.
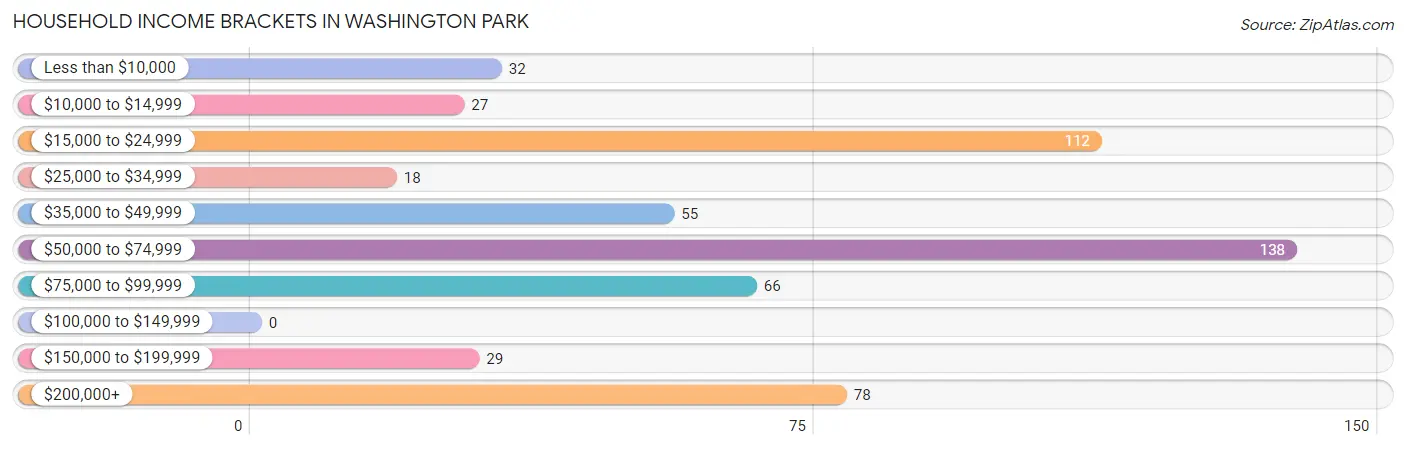
| Income Bracket | # Households | % Households |
| Less than $10,000 | 32 | 5.8% |
| $10,000 to $14,999 | 27 | 4.9% |
| $15,000 to $24,999 | 112 | 20.2% |
| $25,000 to $34,999 | 18 | 3.2% |
| $35,000 to $49,999 | 55 | 9.9% |
| $50,000 to $74,999 | 138 | 24.9% |
| $75,000 to $99,999 | 66 | 11.9% |
| $100,000 to $149,999 | 0 | 0.0% |
| $150,000 to $199,999 | 29 | 5.2% |
| $200,000+ | 78 | 14.1% |
Household Income by Householder Age in Washington Park
The median household income in Washington Park is $52,944, with the highest median household income of $66,150 found in the 25 to 44 years age bracket for the primary householder. A total of 159 households (28.6%) fall into this category.
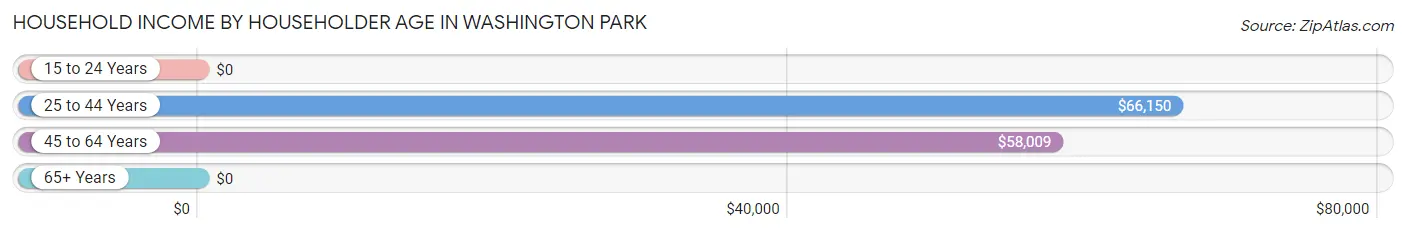
| Income Bracket | # Households | Median Income |
| 15 to 24 Years | 0 (0.0%) | $0 |
| 25 to 44 Years | 159 (28.6%) | $66,150 |
| 45 to 64 Years | 243 (43.8%) | $58,009 |
| 65+ Years | 153 (27.6%) | $0 |
| Total | 555 (100.0%) | $52,944 |
Poverty in Washington Park
Income Below Poverty by Sex and Age in Washington Park
With 9.4% poverty level for males and 13.5% for females among the residents of Washington Park, 55 to 64 year old males and 16 and 17 year old females are the most vulnerable to poverty, with 32 males (54.2%) and 72 females (66.7%) in their respective age groups living below the poverty level.
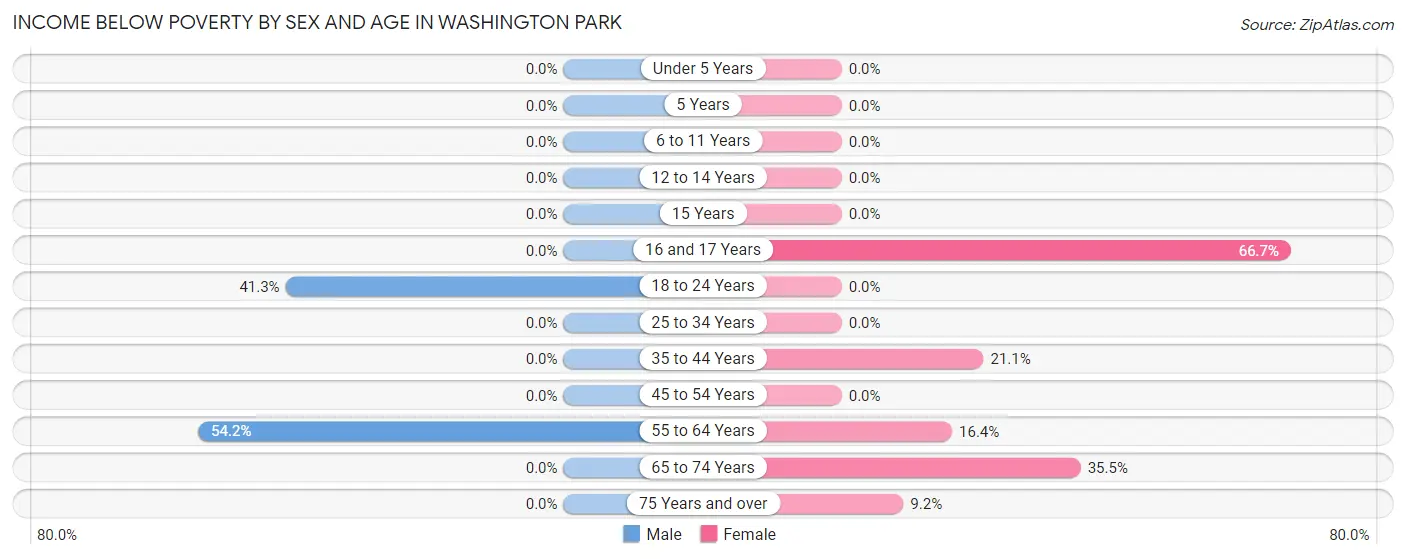
| Age Bracket | Male | Female |
| Under 5 Years | 0 (0.0%) | 0 (0.0%) |
| 5 Years | 0 (0.0%) | 0 (0.0%) |
| 6 to 11 Years | 0 (0.0%) | 0 (0.0%) |
| 12 to 14 Years | 0 (0.0%) | 0 (0.0%) |
| 15 Years | 0 (0.0%) | 0 (0.0%) |
| 16 and 17 Years | 0 (0.0%) | 72 (66.7%) |
| 18 to 24 Years | 26 (41.3%) | 0 (0.0%) |
| 25 to 34 Years | 0 (0.0%) | 0 (0.0%) |
| 35 to 44 Years | 0 (0.0%) | 40 (21.0%) |
| 45 to 54 Years | 0 (0.0%) | 0 (0.0%) |
| 55 to 64 Years | 32 (54.2%) | 19 (16.4%) |
| 65 to 74 Years | 0 (0.0%) | 11 (35.5%) |
| 75 Years and over | 0 (0.0%) | 14 (9.1%) |
| Total | 58 (9.4%) | 156 (13.5%) |
Income Above Poverty by Sex and Age in Washington Park
According to the poverty statistics in Washington Park, males aged under 5 years and females aged under 5 years are the age groups that are most secure financially, with 100.0% of males and 100.0% of females in these age groups living above the poverty line.
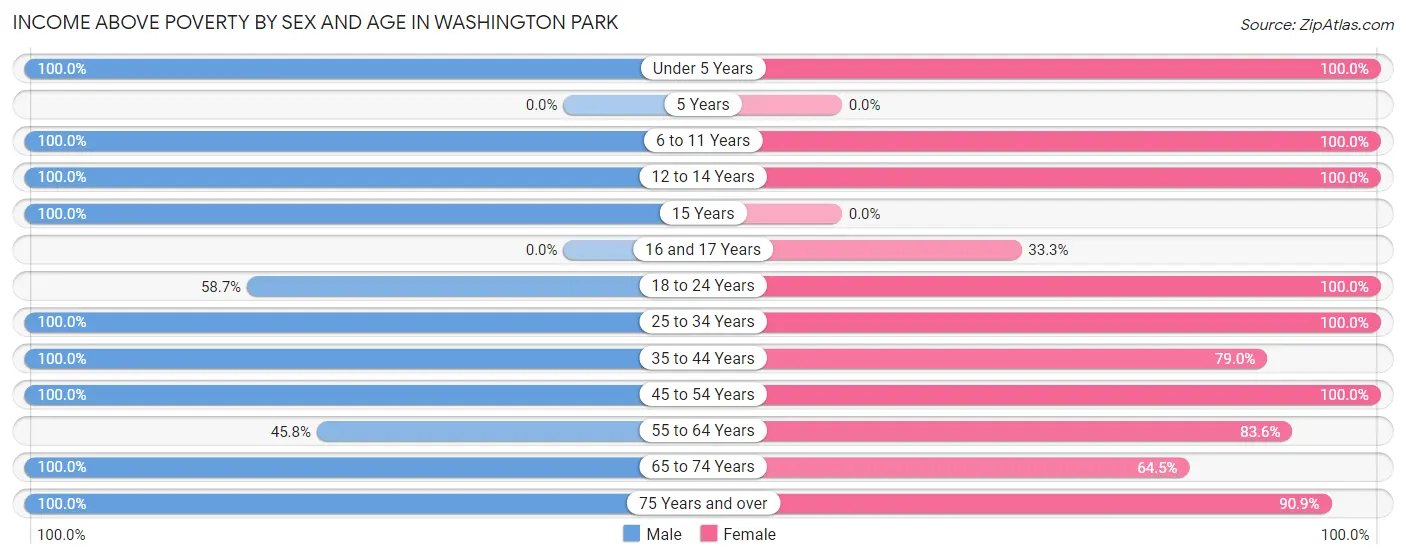
| Age Bracket | Male | Female |
| Under 5 Years | 81 (100.0%) | 91 (100.0%) |
| 5 Years | 0 (0.0%) | 0 (0.0%) |
| 6 to 11 Years | 39 (100.0%) | 120 (100.0%) |
| 12 to 14 Years | 39 (100.0%) | 38 (100.0%) |
| 15 Years | 49 (100.0%) | 0 (0.0%) |
| 16 and 17 Years | 0 (0.0%) | 36 (33.3%) |
| 18 to 24 Years | 37 (58.7%) | 96 (100.0%) |
| 25 to 34 Years | 5 (100.0%) | 42 (100.0%) |
| 35 to 44 Years | 125 (100.0%) | 150 (78.9%) |
| 45 to 54 Years | 85 (100.0%) | 171 (100.0%) |
| 55 to 64 Years | 27 (45.8%) | 97 (83.6%) |
| 65 to 74 Years | 61 (100.0%) | 20 (64.5%) |
| 75 Years and over | 13 (100.0%) | 139 (90.8%) |
| Total | 561 (90.6%) | 1,000 (86.5%) |
Income Below Poverty Among Married-Couple Families in Washington Park
The poverty statistics for married-couple families in Washington Park show that 12.7% or 19 of the total 150 families live below the poverty line. Families with no children have the highest poverty rate of 33.3%, comprising of 19 families. On the other hand, families with 1 or 2 children have the lowest poverty rate of 0.0%, which includes 0 families.
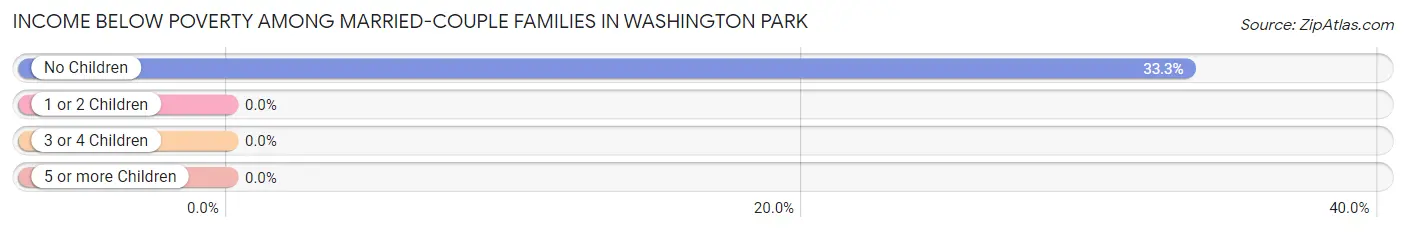
| Children | Above Poverty | Below Poverty |
| No Children | 38 (66.7%) | 19 (33.3%) |
| 1 or 2 Children | 25 (100.0%) | 0 (0.0%) |
| 3 or 4 Children | 34 (100.0%) | 0 (0.0%) |
| 5 or more Children | 34 (100.0%) | 0 (0.0%) |
| Total | 131 (87.3%) | 19 (12.7%) |
Income Below Poverty Among Single-Parent Households in Washington Park
According to the poverty data in Washington Park, 22.0% or 11 single-father households and 22.2% or 32 single-mother households are living below the poverty line. Among single-father households, those with no children have the highest poverty rate, with 11 households (22.0%) experiencing poverty. Likewise, among single-mother households, those with 1 or 2 children have the highest poverty rate, with 32 households (36.8%) falling below the poverty line.
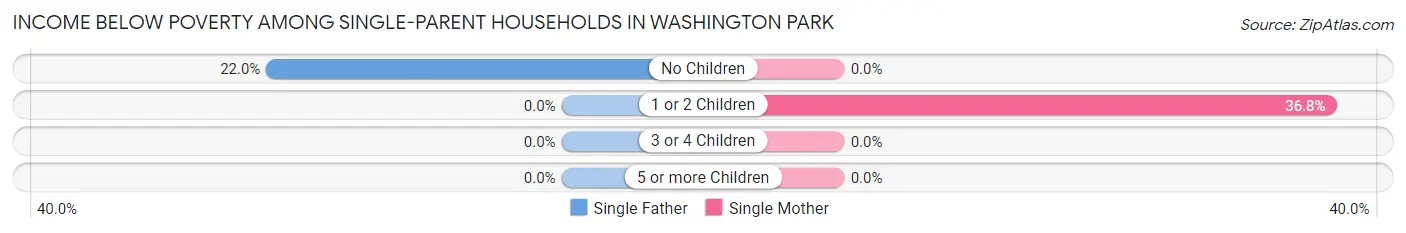
| Children | Single Father | Single Mother |
| No Children | 11 (22.0%) | 0 (0.0%) |
| 1 or 2 Children | 0 (0.0%) | 32 (36.8%) |
| 3 or 4 Children | 0 (0.0%) | 0 (0.0%) |
| 5 or more Children | 0 (0.0%) | 0 (0.0%) |
| Total | 11 (22.0%) | 32 (22.2%) |
Income Below Poverty Among Married-Couple vs Single-Parent Households in Washington Park
The poverty data for Washington Park shows that 19 of the married-couple family households (12.7%) and 43 of the single-parent households (22.2%) are living below the poverty level. Within the married-couple family households, those with no children have the highest poverty rate, with 19 households (33.3%) falling below the poverty line. Among the single-parent households, those with 1 or 2 children have the highest poverty rate, with 32 household (36.8%) living below poverty.
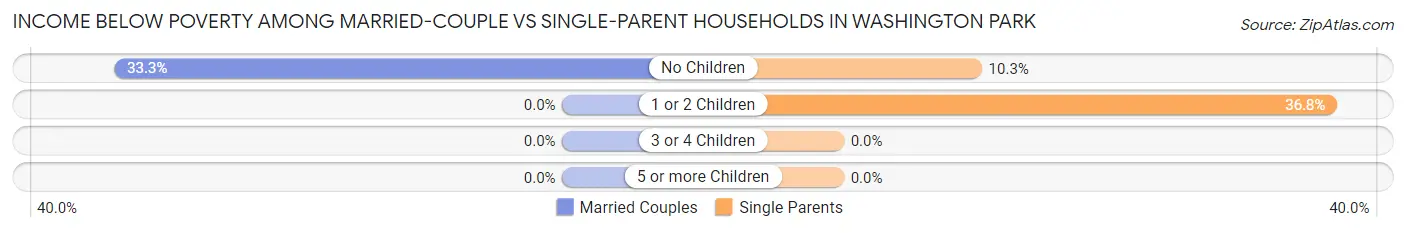
| Children | Married-Couple Families | Single-Parent Households |
| No Children | 19 (33.3%) | 11 (10.3%) |
| 1 or 2 Children | 0 (0.0%) | 32 (36.8%) |
| 3 or 4 Children | 0 (0.0%) | 0 (0.0%) |
| 5 or more Children | 0 (0.0%) | 0 (0.0%) |
| Total | 19 (12.7%) | 43 (22.2%) |
Race in Washington Park
The most populous races in Washington Park are Black / African American (1,654 | 93.2%), Hispanic or Latino (81 | 4.6%), and White / Caucasian (71 | 4.0%).
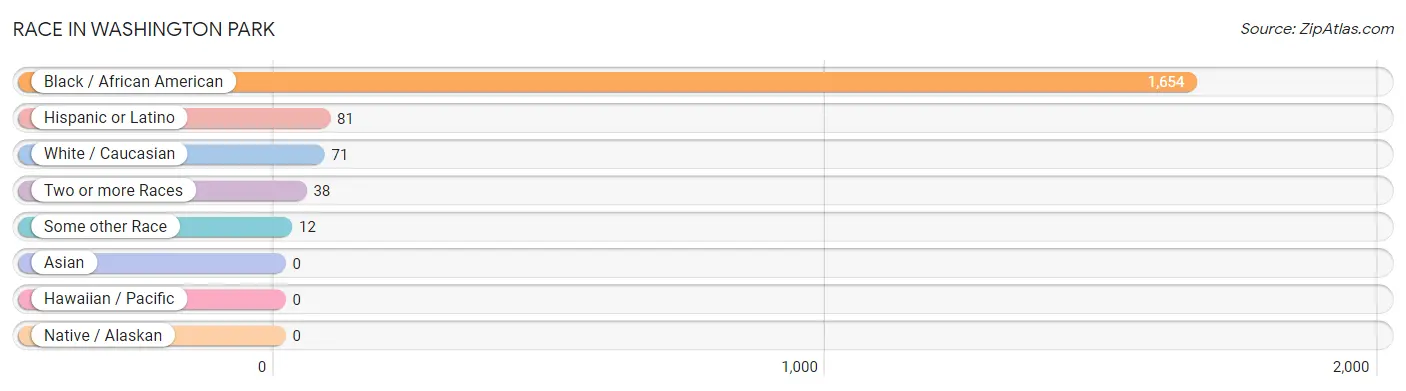
| Race | # Population | % Population |
| Asian | 0 | 0.0% |
| Black / African American | 1,654 | 93.2% |
| Hawaiian / Pacific | 0 | 0.0% |
| Hispanic or Latino | 81 | 4.6% |
| Native / Alaskan | 0 | 0.0% |
| White / Caucasian | 71 | 4.0% |
| Two or more Races | 38 | 2.1% |
| Some other Race | 12 | 0.7% |
| Total | 1,775 | 100.0% |
Ancestry in Washington Park
The most populous ancestries reported in Washington Park are Haitian (517 | 29.1%), Peruvian (69 | 3.9%), South American (69 | 3.9%), Jamaican (44 | 2.5%), and African (36 | 2.0%), together accounting for 41.4% of all Washington Park residents.
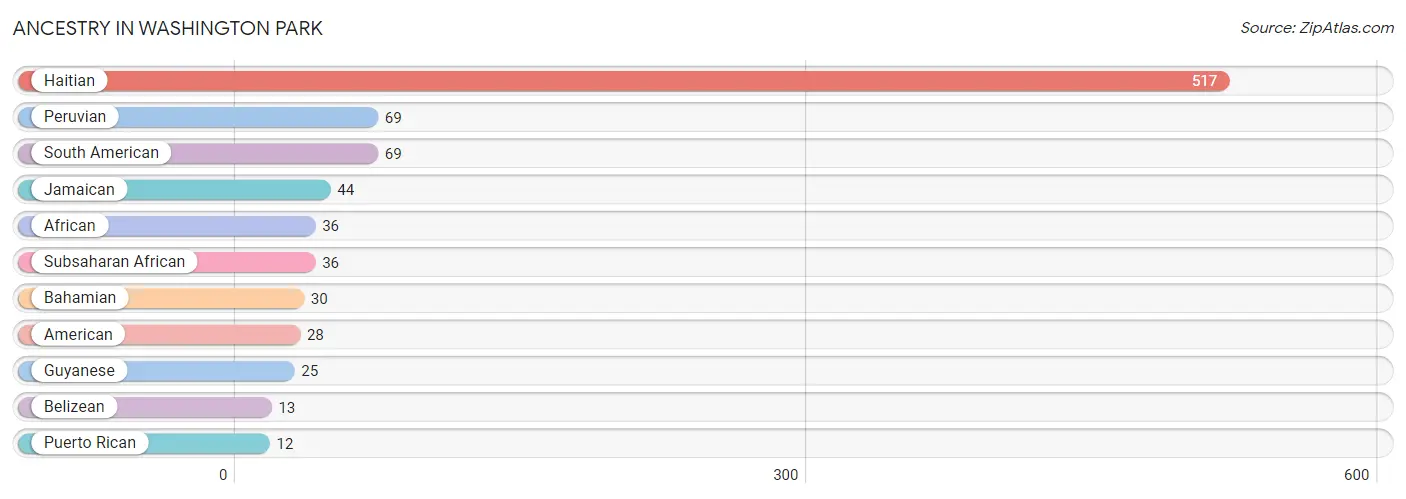
| Ancestry | # Population | % Population |
| African | 36 | 2.0% |
| American | 28 | 1.6% |
| Bahamian | 30 | 1.7% |
| Belizean | 13 | 0.7% |
| Guyanese | 25 | 1.4% |
| Haitian | 517 | 29.1% |
| Jamaican | 44 | 2.5% |
| Peruvian | 69 | 3.9% |
| Puerto Rican | 12 | 0.7% |
| South American | 69 | 3.9% |
| Subsaharan African | 36 | 2.0% | View All 11 Rows |
Immigrants in Washington Park
The most numerous immigrant groups reported in Washington Park came from Latin America (871 | 49.1%), Caribbean (820 | 46.2%), Haiti (786 | 44.3%), Peru (38 | 2.1%), and South America (38 | 2.1%), together accounting for 143.8% of all Washington Park residents.
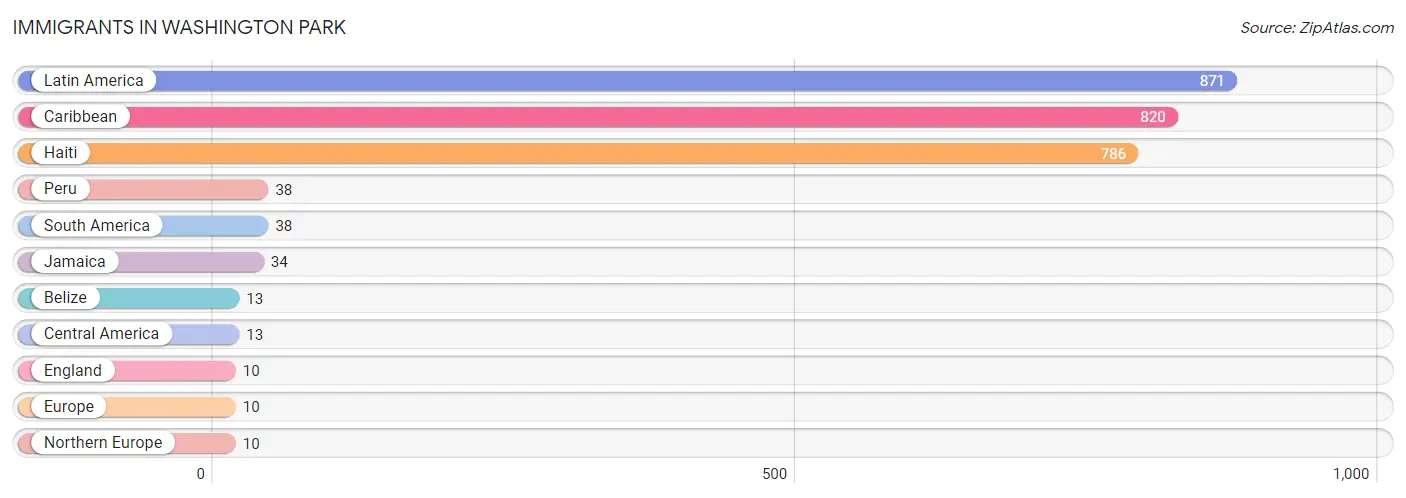
| Immigration Origin | # Population | % Population |
| Belize | 13 | 0.7% |
| Caribbean | 820 | 46.2% |
| Central America | 13 | 0.7% |
| England | 10 | 0.6% |
| Europe | 10 | 0.6% |
| Haiti | 786 | 44.3% |
| Jamaica | 34 | 1.9% |
| Latin America | 871 | 49.1% |
| Northern Europe | 10 | 0.6% |
| Peru | 38 | 2.1% |
| South America | 38 | 2.1% | View All 11 Rows |
Sex and Age in Washington Park
Sex and Age in Washington Park
The most populous age groups in Washington Park are Under 5 Years (81 | 13.1%) for men and 15 to 19 Years (126 | 10.9%) for women.
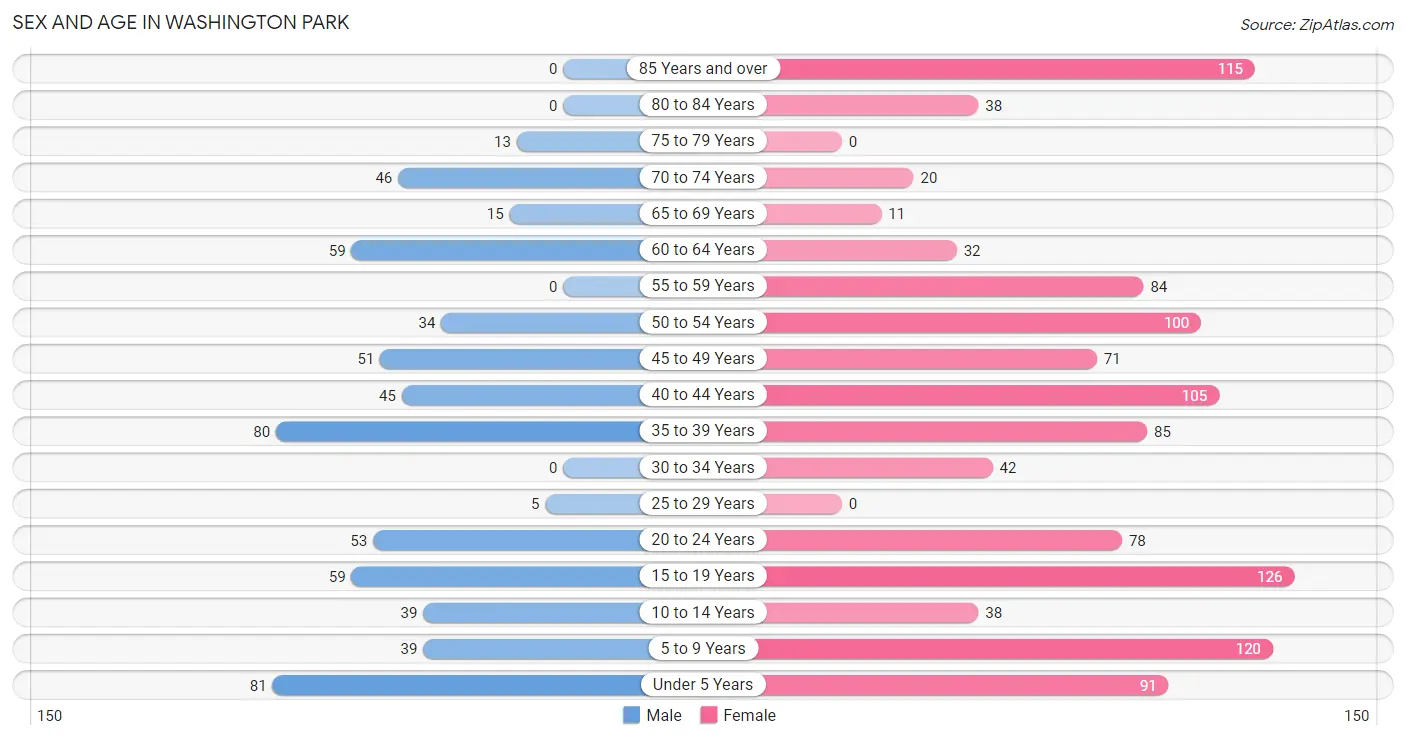
| Age Bracket | Male | Female |
| Under 5 Years | 81 (13.1%) | 91 (7.9%) |
| 5 to 9 Years | 39 (6.3%) | 120 (10.4%) |
| 10 to 14 Years | 39 (6.3%) | 38 (3.3%) |
| 15 to 19 Years | 59 (9.5%) | 126 (10.9%) |
| 20 to 24 Years | 53 (8.6%) | 78 (6.8%) |
| 25 to 29 Years | 5 (0.8%) | 0 (0.0%) |
| 30 to 34 Years | 0 (0.0%) | 42 (3.6%) |
| 35 to 39 Years | 80 (12.9%) | 85 (7.3%) |
| 40 to 44 Years | 45 (7.3%) | 105 (9.1%) |
| 45 to 49 Years | 51 (8.2%) | 71 (6.1%) |
| 50 to 54 Years | 34 (5.5%) | 100 (8.6%) |
| 55 to 59 Years | 0 (0.0%) | 84 (7.3%) |
| 60 to 64 Years | 59 (9.5%) | 32 (2.8%) |
| 65 to 69 Years | 15 (2.4%) | 11 (0.9%) |
| 70 to 74 Years | 46 (7.4%) | 20 (1.7%) |
| 75 to 79 Years | 13 (2.1%) | 0 (0.0%) |
| 80 to 84 Years | 0 (0.0%) | 38 (3.3%) |
| 85 Years and over | 0 (0.0%) | 115 (10.0%) |
| Total | 619 (100.0%) | 1,156 (100.0%) |
Families and Households in Washington Park
Median Family Size in Washington Park
The median family size in Washington Park is 4.21 persons per family, with married-couple families (150 | 43.6%) accounting for the largest median family size of 6.21 persons per family. On the other hand, single male/father families (50 | 14.5%) represent the smallest median family size with 2.26 persons per family.
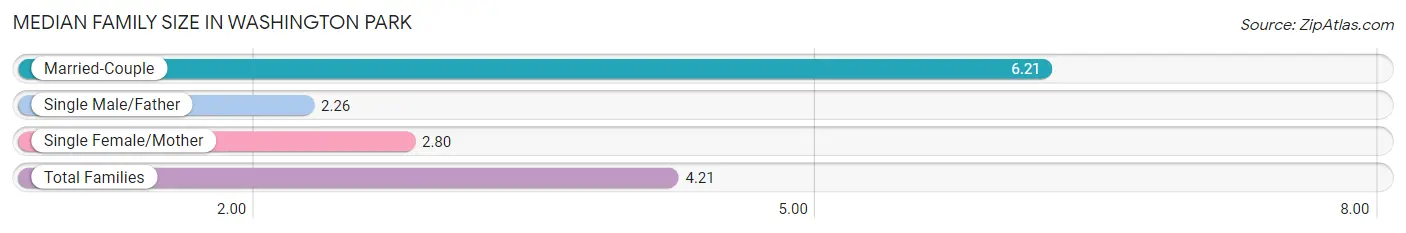
| Family Type | # Families | Family Size |
| Married-Couple | 150 (43.6%) | 6.21 |
| Single Male/Father | 50 (14.5%) | 2.26 |
| Single Female/Mother | 144 (41.9%) | 2.80 |
| Total Families | 344 (100.0%) | 4.21 |
Median Household Size in Washington Park
The median household size in Washington Park is 3.20 persons per household, with married-couple households (150 | 27.0%) accounting for the largest median household size of 6.21 persons per household. non-family households (211 | 38.0%) represent the smallest median household size with 1.37 persons per household.
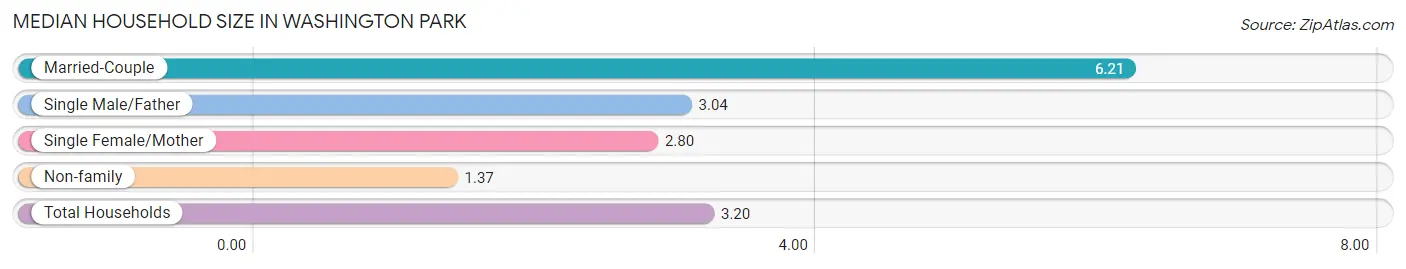
| Household Type | # Households | Household Size |
| Married-Couple | 150 (27.0%) | 6.21 |
| Single Male/Father | 50 (9.0%) | 3.04 |
| Single Female/Mother | 144 (26.0%) | 2.80 |
| Non-family | 211 (38.0%) | 1.37 |
| Total Households | 555 (100.0%) | 3.20 |
Household Size by Marriage Status in Washington Park
Out of a total of 555 households in Washington Park, 344 (62.0%) are family households, while 211 (38.0%) are nonfamily households. The most numerous type of family households are 2-person households, comprising 129, and the most common type of nonfamily households are 1-person households, comprising 171.
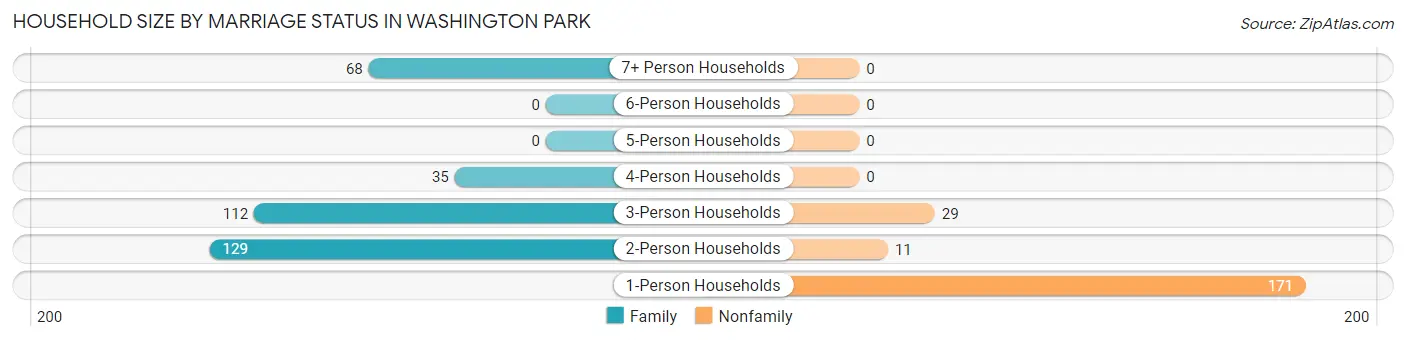
| Household Size | Family Households | Nonfamily Households |
| 1-Person Households | - | 171 (30.8%) |
| 2-Person Households | 129 (23.2%) | 11 (2.0%) |
| 3-Person Households | 112 (20.2%) | 29 (5.2%) |
| 4-Person Households | 35 (6.3%) | 0 (0.0%) |
| 5-Person Households | 0 (0.0%) | 0 (0.0%) |
| 6-Person Households | 0 (0.0%) | 0 (0.0%) |
| 7+ Person Households | 68 (12.2%) | 0 (0.0%) |
| Total | 344 (62.0%) | 211 (38.0%) |
Female Fertility in Washington Park
Fertility by Age in Washington Park
Average fertility rate in Washington Park is 79.0 births per 1,000 women. Women in the age bracket of 20 to 34 years have the highest fertility rate with 350.0 births per 1,000 women. Women in the age bracket of 20 to 34 years acount for 100.0% of all women with births.
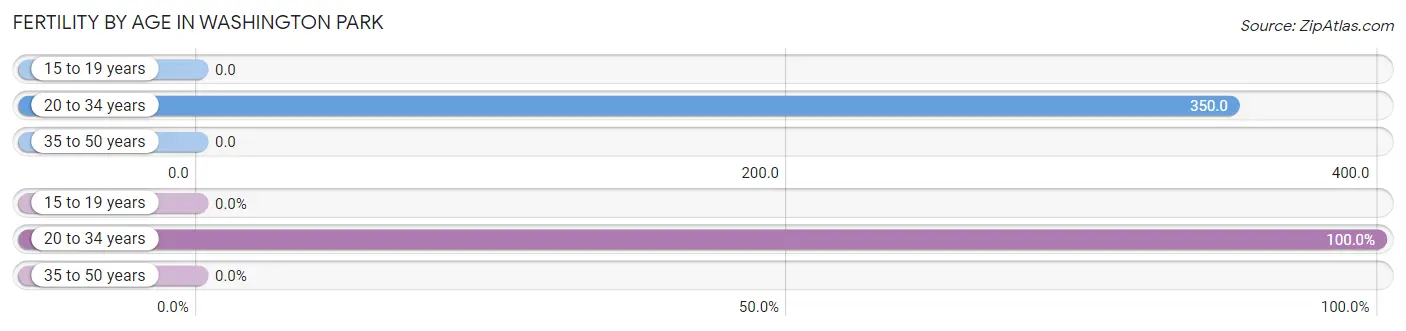
| Age Bracket | Women with Births | Births / 1,000 Women |
| 15 to 19 years | 0 (0.0%) | 0.0 |
| 20 to 34 years | 42 (100.0%) | 350.0 |
| 35 to 50 years | 0 (0.0%) | 0.0 |
| Total | 42 (100.0%) | 79.0 |
Fertility by Age by Marriage Status in Washington Park
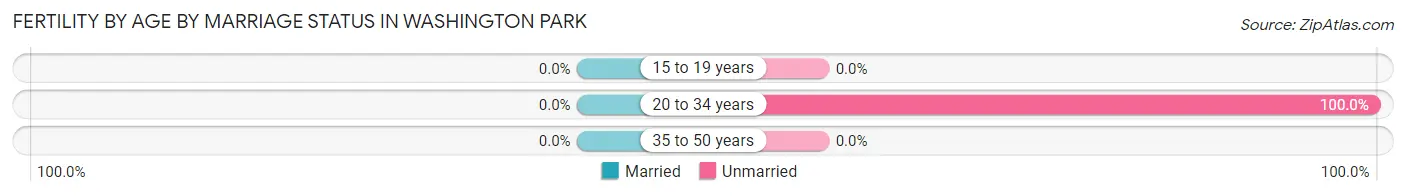
| Age Bracket | Married | Unmarried |
| 15 to 19 years | 0 (0.0%) | 0 (0.0%) |
| 20 to 34 years | 0 (0.0%) | 42 (100.0%) |
| 35 to 50 years | 0 (0.0%) | 0 (0.0%) |
| Total | 0 (0.0%) | 42 (100.0%) |
Fertility by Education in Washington Park
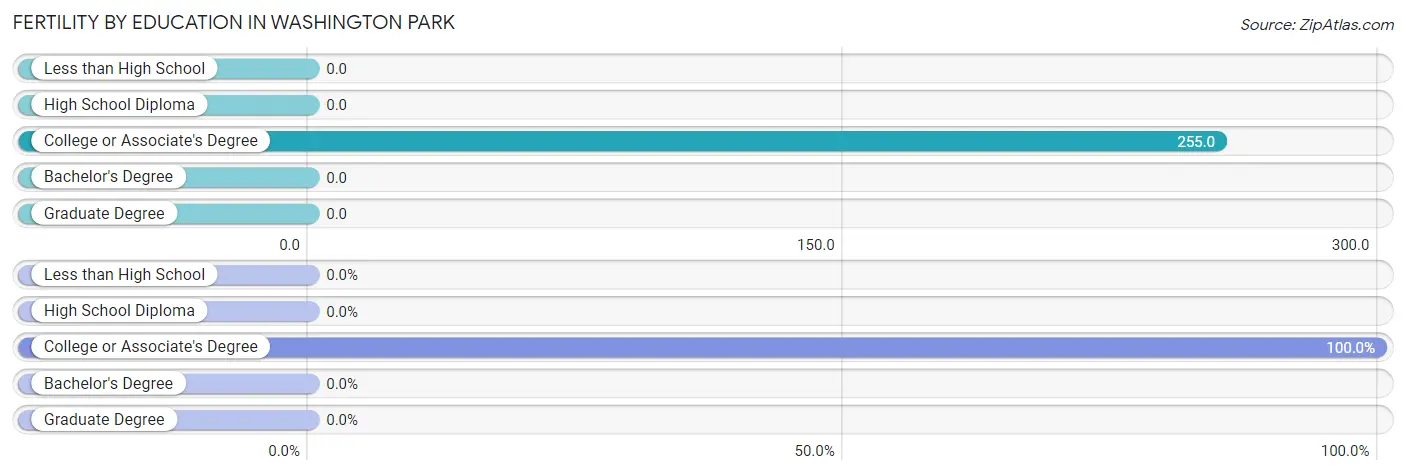
| Educational Attainment | Women with Births | Births / 1,000 Women |
| Less than High School | 0 (0.0%) | 0.0 |
| High School Diploma | 0 (0.0%) | 0.0 |
| College or Associate's Degree | 42 (100.0%) | 255.0 |
| Bachelor's Degree | 0 (0.0%) | 0.0 |
| Graduate Degree | 0 (0.0%) | 0.0 |
| Total | 42 (100.0%) | 79.0 |
Fertility by Education by Marriage Status in Washington Park
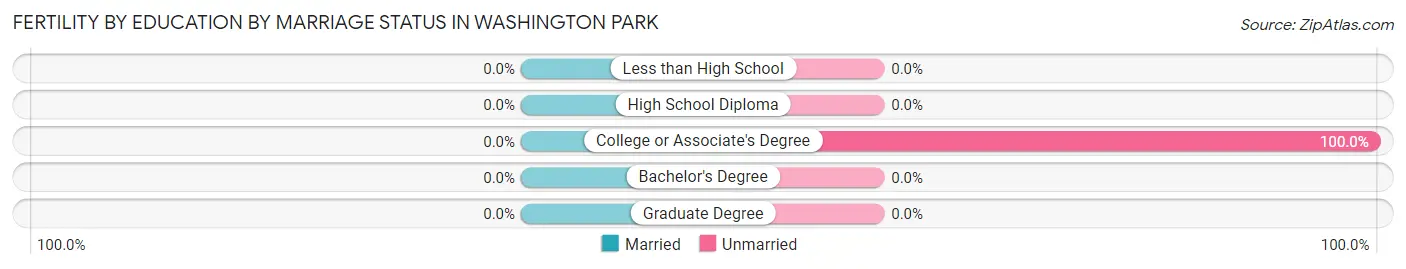
| Educational Attainment | Married | Unmarried |
| Less than High School | 0 (0.0%) | 0 (0.0%) |
| High School Diploma | 0 (0.0%) | 0 (0.0%) |
| College or Associate's Degree | 0 (0.0%) | 42 (100.0%) |
| Bachelor's Degree | 0 (0.0%) | 0 (0.0%) |
| Graduate Degree | 0 (0.0%) | 0 (0.0%) |
| Total | 0 (0.0%) | 42 (100.0%) |
Employment Characteristics in Washington Park
Employment by Class of Employer in Washington Park
Among the 728 employed individuals in Washington Park, private company employees (411 | 56.5%), local government employees (113 | 15.5%), and self-employed (not incorporated) (101 | 13.9%) make up the most common classes of employment.
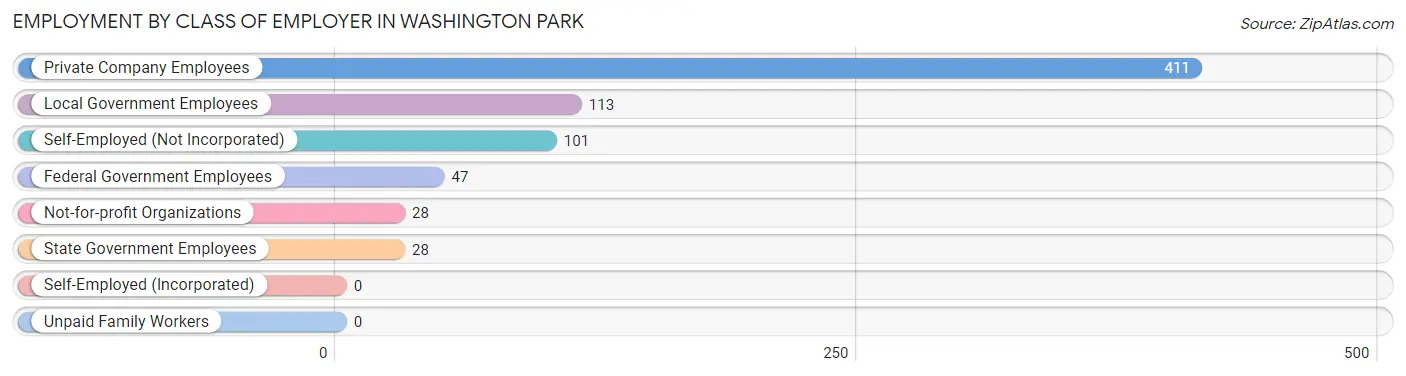
| Employer Class | # Employees | % Employees |
| Private Company Employees | 411 | 56.5% |
| Self-Employed (Incorporated) | 0 | 0.0% |
| Self-Employed (Not Incorporated) | 101 | 13.9% |
| Not-for-profit Organizations | 28 | 3.8% |
| Local Government Employees | 113 | 15.5% |
| State Government Employees | 28 | 3.8% |
| Federal Government Employees | 47 | 6.5% |
| Unpaid Family Workers | 0 | 0.0% |
| Total | 728 | 100.0% |
Employment Status by Age in Washington Park
According to the labor force statistics for Washington Park, out of the total population over 16 years of age (1,318), 57.6% or 759 individuals are in the labor force, with 3.4% or 26 of them unemployed. The age group with the highest labor force participation rate is 25 to 29 years, with 100.0% or 5 individuals in the labor force. Within the labor force, the 20 to 24 years age range has the highest percentage of unemployed individuals, with 37.7% or 26 of them being unemployed.
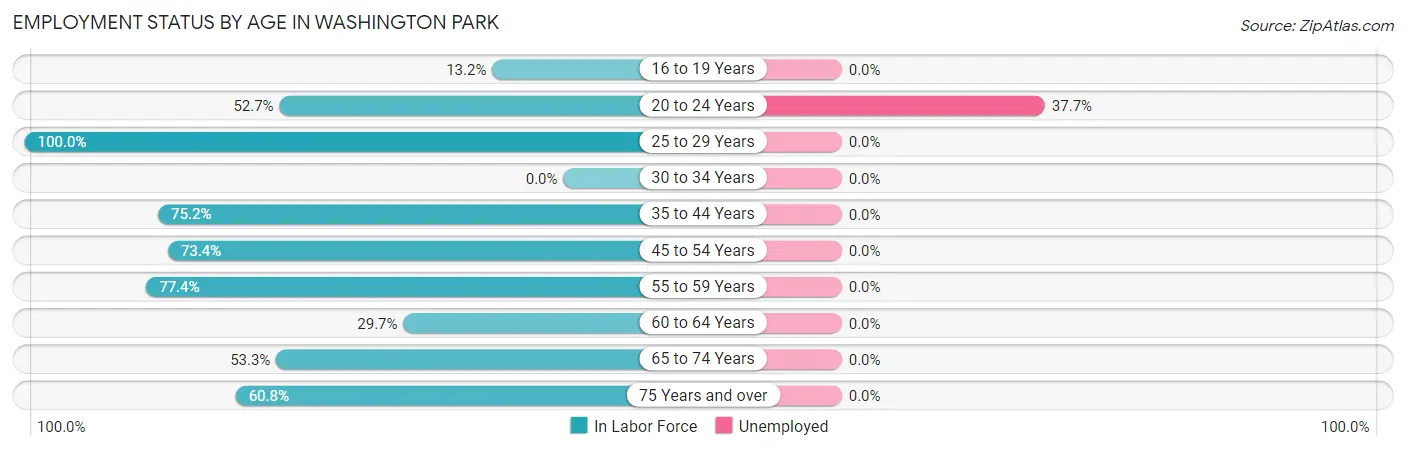
| Age Bracket | In Labor Force | Unemployed |
| 16 to 19 Years | 18 (13.2%) | 0 (0.0%) |
| 20 to 24 Years | 69 (52.7%) | 26 (37.7%) |
| 25 to 29 Years | 5 (100.0%) | 0 (0.0%) |
| 30 to 34 Years | 0 (0.0%) | 0 (0.0%) |
| 35 to 44 Years | 237 (75.2%) | 0 (0.0%) |
| 45 to 54 Years | 188 (73.4%) | 0 (0.0%) |
| 55 to 59 Years | 65 (77.4%) | 0 (0.0%) |
| 60 to 64 Years | 27 (29.7%) | 0 (0.0%) |
| 65 to 74 Years | 49 (53.3%) | 0 (0.0%) |
| 75 Years and over | 101 (60.8%) | 0 (0.0%) |
| Total | 759 (57.6%) | 26 (3.4%) |
Employment Status by Educational Attainment in Washington Park
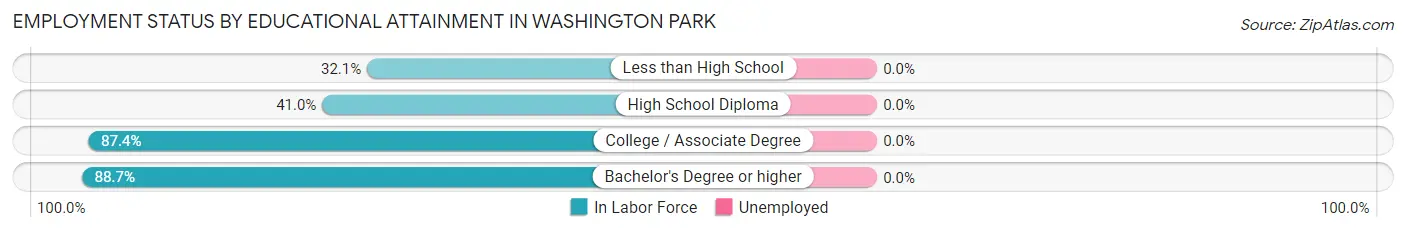
| Educational Attainment | In Labor Force | Unemployed |
| Less than High School | 50 (32.1%) | 0 (0.0%) |
| High School Diploma | 77 (41.0%) | 0 (0.0%) |
| College / Associate Degree | 222 (87.4%) | 0 (0.0%) |
| Bachelor's Degree or higher | 173 (88.7%) | 0 (0.0%) |
| Total | 522 (65.8%) | 0 (0.0%) |
Employment Occupations by Sex in Washington Park
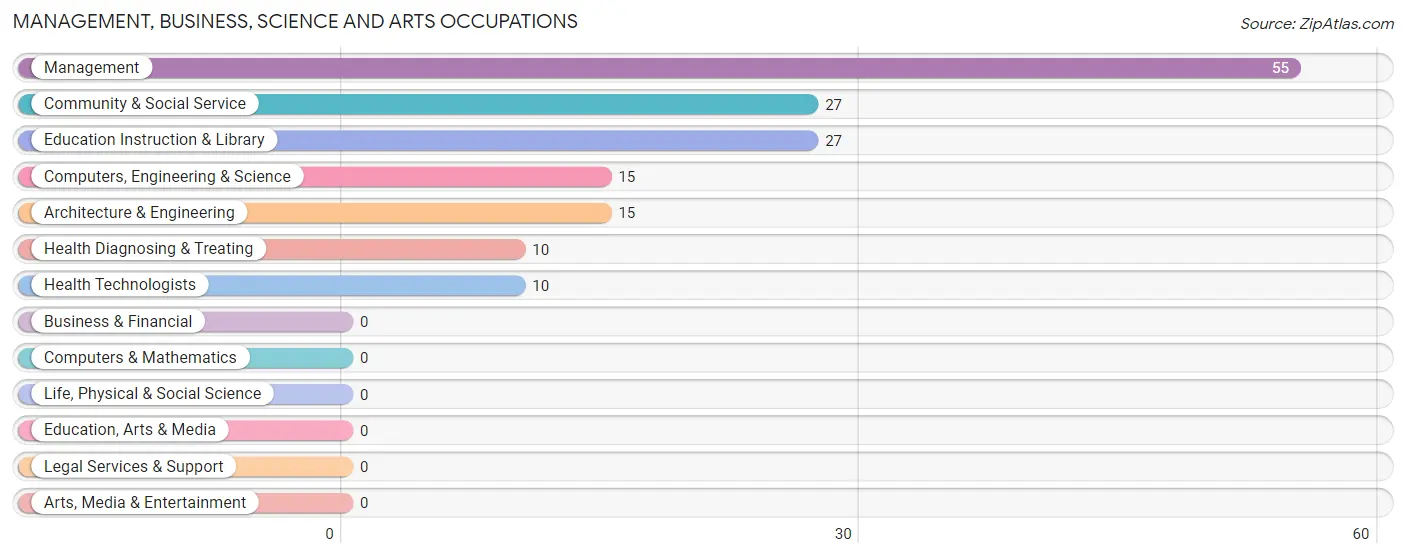
Management, Business, Science and Arts Occupations
The most common Management, Business, Science and Arts occupations in Washington Park are Management (55 | 7.5%), Community & Social Service (27 | 3.7%), Education Instruction & Library (27 | 3.7%), Computers, Engineering & Science (15 | 2.1%), and Architecture & Engineering (15 | 2.1%).
Management, Business, Science and Arts Occupations by Sex
Within the Management, Business, Science and Arts occupations in Washington Park, the most male-oriented occupations are Computers, Engineering & Science (100.0%), Architecture & Engineering (100.0%), and Community & Social Service (100.0%), while the most female-oriented occupations are Management (100.0%), Health Diagnosing & Treating (100.0%), and Health Technologists (100.0%).
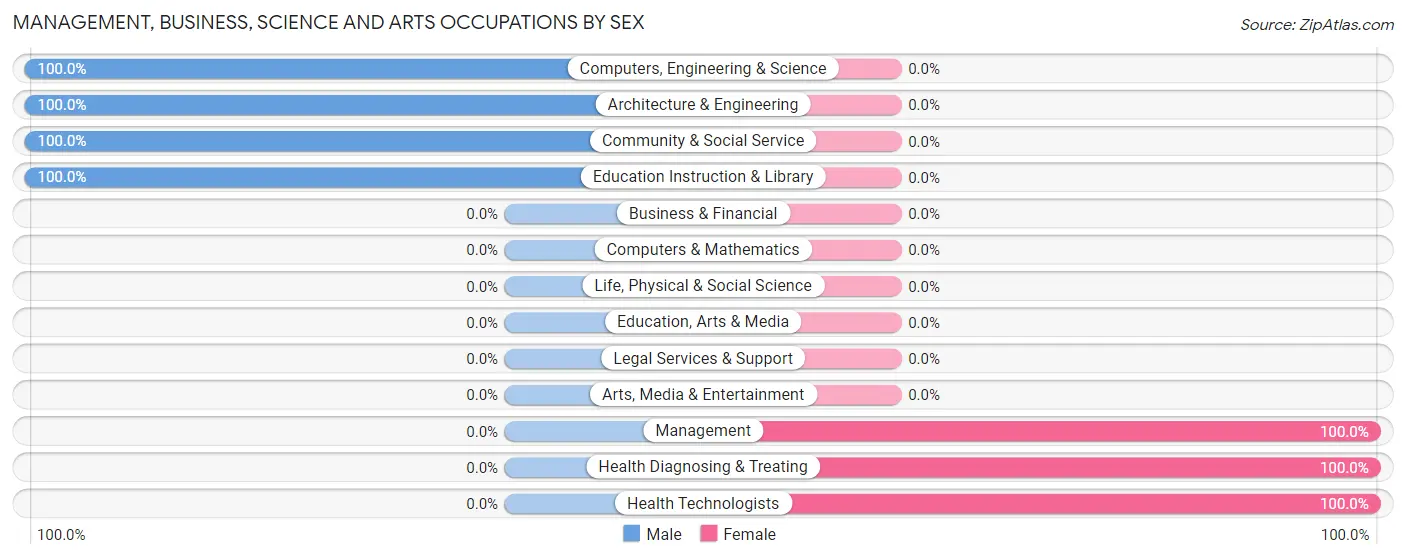
| Occupation | Male | Female |
| Management | 0 (0.0%) | 55 (100.0%) |
| Business & Financial | 0 (0.0%) | 0 (0.0%) |
| Computers, Engineering & Science | 15 (100.0%) | 0 (0.0%) |
| Computers & Mathematics | 0 (0.0%) | 0 (0.0%) |
| Architecture & Engineering | 15 (100.0%) | 0 (0.0%) |
| Life, Physical & Social Science | 0 (0.0%) | 0 (0.0%) |
| Community & Social Service | 27 (100.0%) | 0 (0.0%) |
| Education, Arts & Media | 0 (0.0%) | 0 (0.0%) |
| Legal Services & Support | 0 (0.0%) | 0 (0.0%) |
| Education Instruction & Library | 27 (100.0%) | 0 (0.0%) |
| Arts, Media & Entertainment | 0 (0.0%) | 0 (0.0%) |
| Health Diagnosing & Treating | 0 (0.0%) | 10 (100.0%) |
| Health Technologists | 0 (0.0%) | 10 (100.0%) |
| Total (Category) | 42 (39.3%) | 65 (60.8%) |
| Total (Overall) | 195 (26.6%) | 538 (73.4%) |
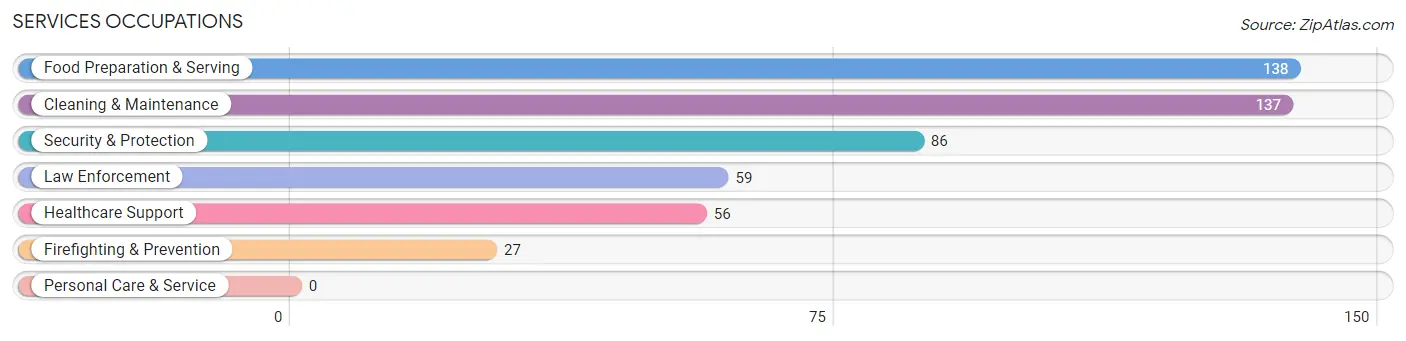
Services Occupations
The most common Services occupations in Washington Park are Food Preparation & Serving (138 | 18.8%), Cleaning & Maintenance (137 | 18.7%), Security & Protection (86 | 11.7%), Law Enforcement (59 | 8.1%), and Healthcare Support (56 | 7.6%).
Services Occupations by Sex
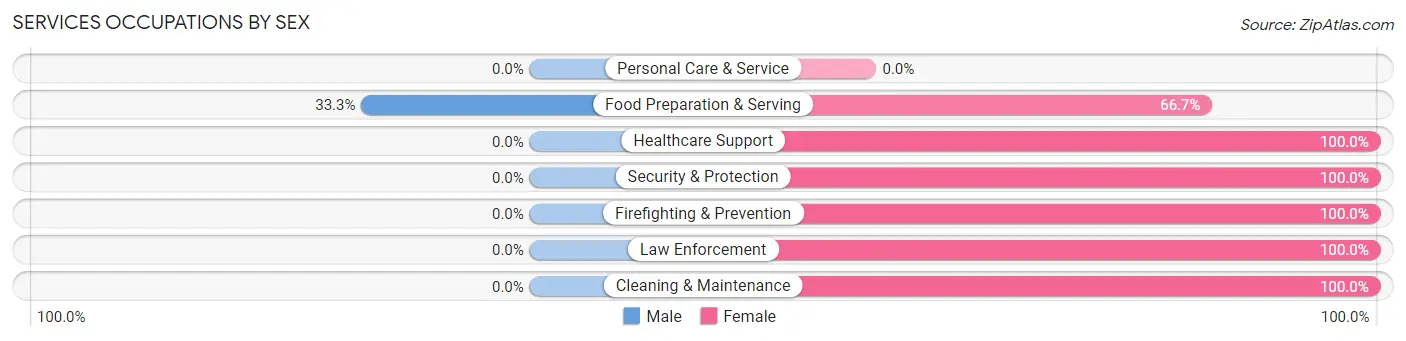
| Occupation | Male | Female |
| Healthcare Support | 0 (0.0%) | 56 (100.0%) |
| Security & Protection | 0 (0.0%) | 86 (100.0%) |
| Firefighting & Prevention | 0 (0.0%) | 27 (100.0%) |
| Law Enforcement | 0 (0.0%) | 59 (100.0%) |
| Food Preparation & Serving | 46 (33.3%) | 92 (66.7%) |
| Cleaning & Maintenance | 0 (0.0%) | 137 (100.0%) |
| Personal Care & Service | 0 (0.0%) | 0 (0.0%) |
| Total (Category) | 46 (11.0%) | 371 (89.0%) |
| Total (Overall) | 195 (26.6%) | 538 (73.4%) |
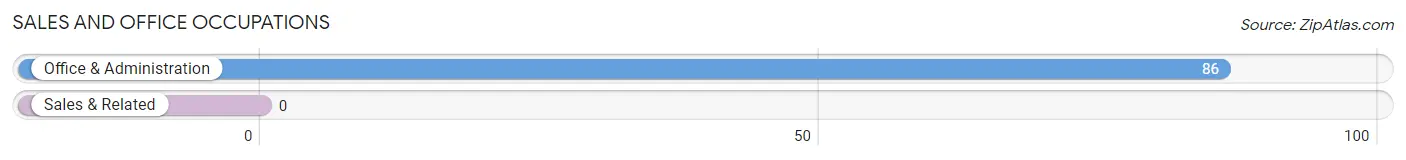
Sales and Office Occupations
The most common Sales and Office occupations in Washington Park are , and Office & Administration (86 | 11.7%).
Sales and Office Occupations by Sex
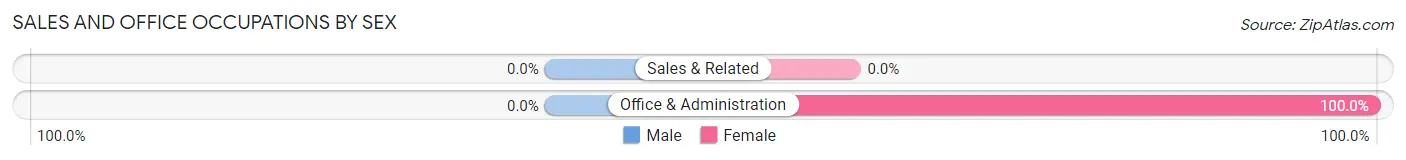
| Occupation | Male | Female |
| Sales & Related | 0 (0.0%) | 0 (0.0%) |
| Office & Administration | 0 (0.0%) | 86 (100.0%) |
| Total (Category) | 0 (0.0%) | 86 (100.0%) |
| Total (Overall) | 195 (26.6%) | 538 (73.4%) |
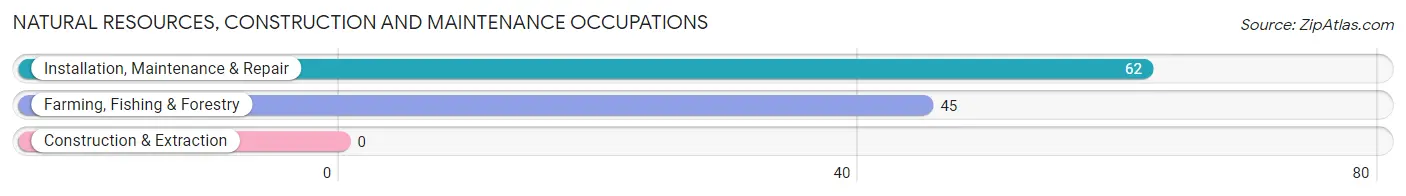
Natural Resources, Construction and Maintenance Occupations
The most common Natural Resources, Construction and Maintenance occupations in Washington Park are Installation, Maintenance & Repair (62 | 8.5%), and Farming, Fishing & Forestry (45 | 6.1%).
Natural Resources, Construction and Maintenance Occupations by Sex
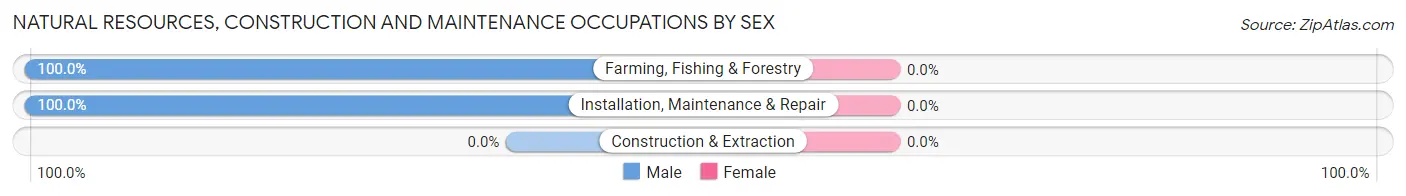
| Occupation | Male | Female |
| Farming, Fishing & Forestry | 45 (100.0%) | 0 (0.0%) |
| Construction & Extraction | 0 (0.0%) | 0 (0.0%) |
| Installation, Maintenance & Repair | 62 (100.0%) | 0 (0.0%) |
| Total (Category) | 107 (100.0%) | 0 (0.0%) |
| Total (Overall) | 195 (26.6%) | 538 (73.4%) |
Production, Transportation and Moving Occupations
The most common Production, Transportation and Moving occupations in Washington Park are , and Production (16 | 2.2%).
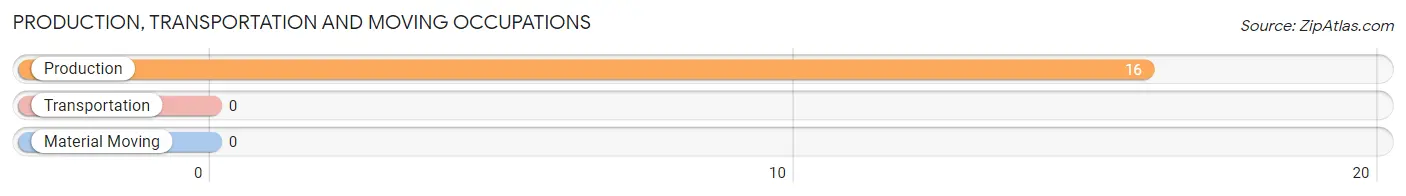
Production, Transportation and Moving Occupations by Sex
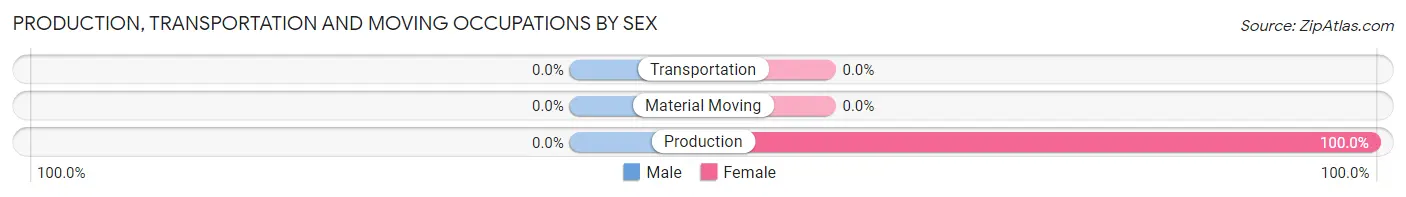
| Occupation | Male | Female |
| Production | 0 (0.0%) | 16 (100.0%) |
| Transportation | 0 (0.0%) | 0 (0.0%) |
| Material Moving | 0 (0.0%) | 0 (0.0%) |
| Total (Category) | 0 (0.0%) | 16 (100.0%) |
| Total (Overall) | 195 (26.6%) | 538 (73.4%) |
Employment Industries by Sex in Washington Park
Employment Industries in Washington Park
The major employment industries in Washington Park include Accommodation & Food Services (169 | 23.1%), Public Administration (129 | 17.6%), Administrative & Support (101 | 13.8%), Wholesale Trade (69 | 9.4%), and Health Care & Social Assistance (63 | 8.6%).
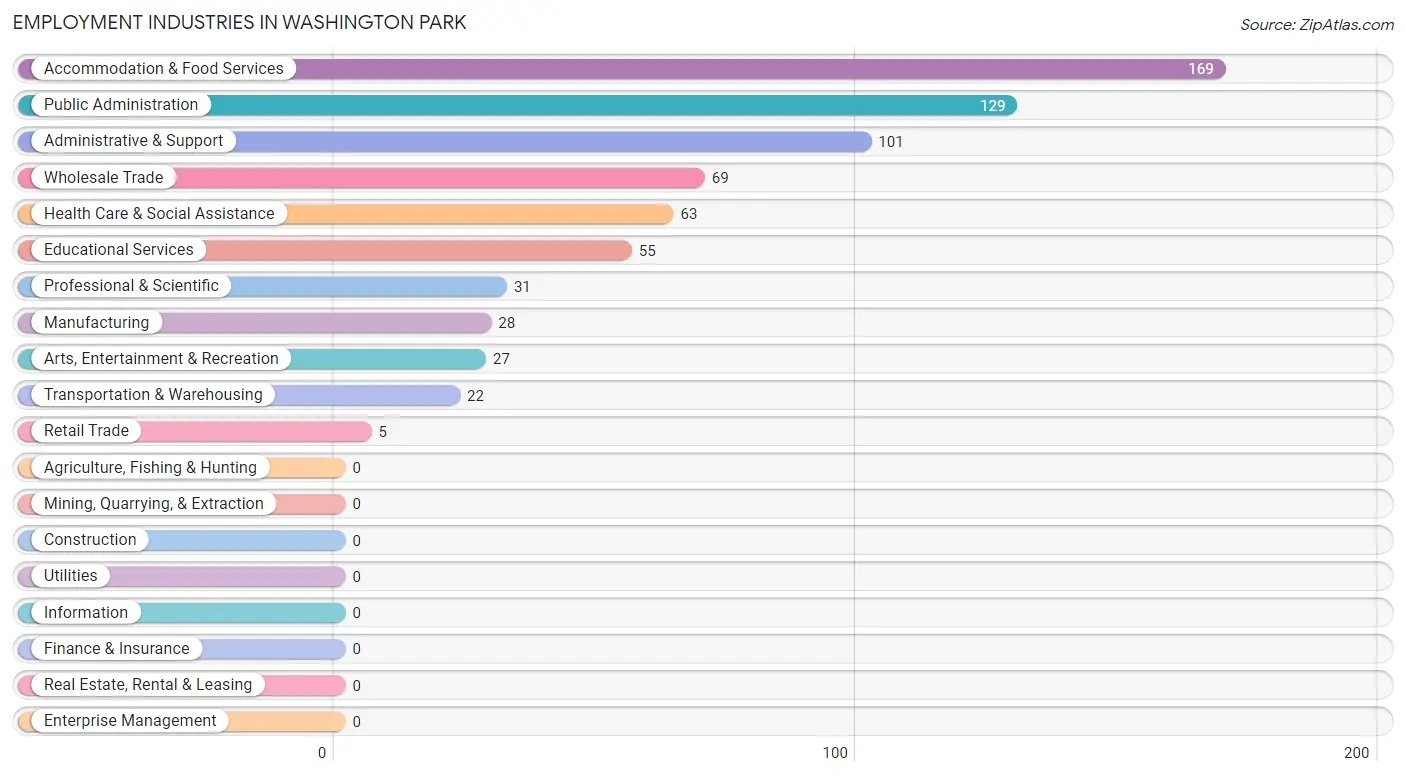
Employment Industries by Sex in Washington Park
The Washington Park industries that see more men than women are Retail Trade (100.0%), Educational Services (100.0%), and Wholesale Trade (65.2%), whereas the industries that tend to have a higher number of women are Manufacturing (100.0%), Transportation & Warehousing (100.0%), and Professional & Scientific (100.0%).
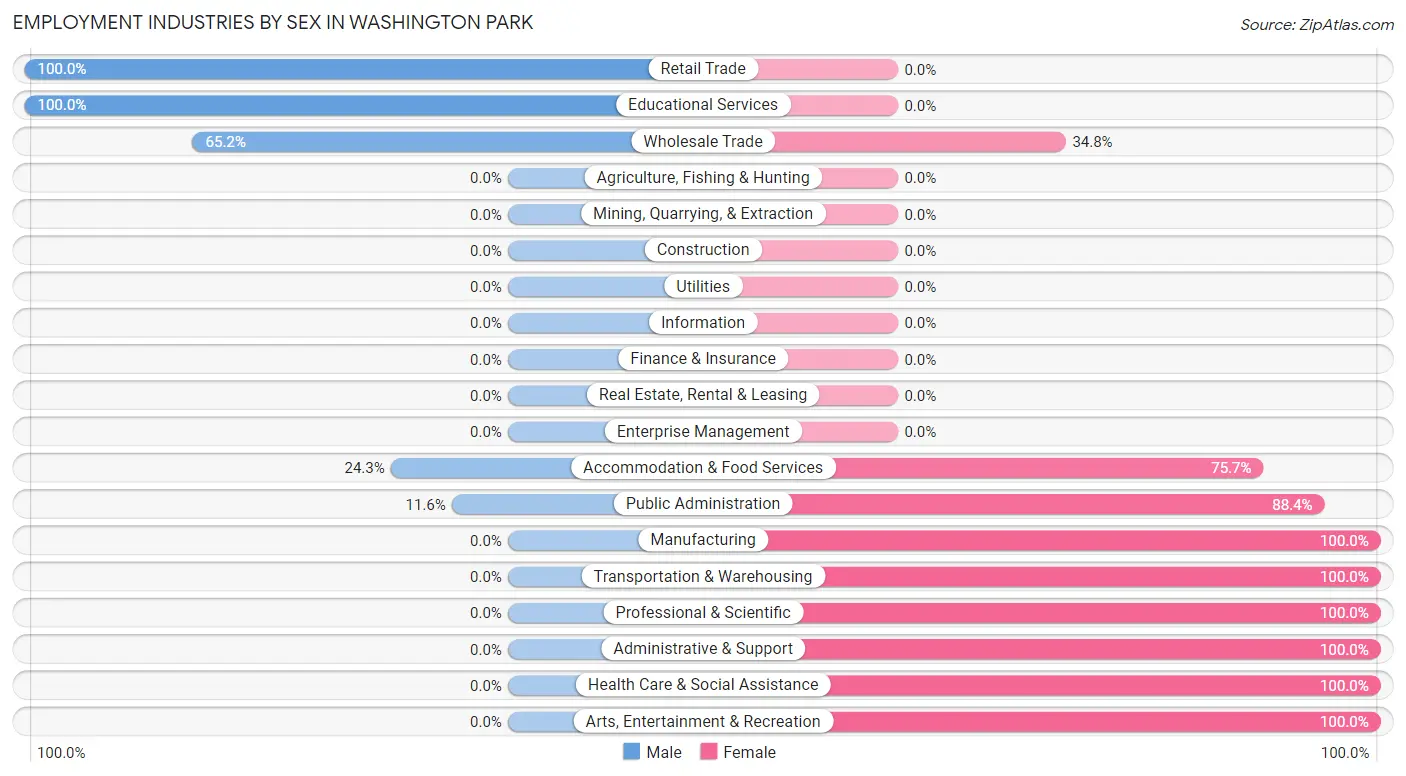
| Industry | Male | Female |
| Agriculture, Fishing & Hunting | 0 (0.0%) | 0 (0.0%) |
| Mining, Quarrying, & Extraction | 0 (0.0%) | 0 (0.0%) |
| Construction | 0 (0.0%) | 0 (0.0%) |
| Manufacturing | 0 (0.0%) | 28 (100.0%) |
| Wholesale Trade | 45 (65.2%) | 24 (34.8%) |
| Retail Trade | 5 (100.0%) | 0 (0.0%) |
| Transportation & Warehousing | 0 (0.0%) | 22 (100.0%) |
| Utilities | 0 (0.0%) | 0 (0.0%) |
| Information | 0 (0.0%) | 0 (0.0%) |
| Finance & Insurance | 0 (0.0%) | 0 (0.0%) |
| Real Estate, Rental & Leasing | 0 (0.0%) | 0 (0.0%) |
| Professional & Scientific | 0 (0.0%) | 31 (100.0%) |
| Enterprise Management | 0 (0.0%) | 0 (0.0%) |
| Administrative & Support | 0 (0.0%) | 101 (100.0%) |
| Educational Services | 55 (100.0%) | 0 (0.0%) |
| Health Care & Social Assistance | 0 (0.0%) | 63 (100.0%) |
| Arts, Entertainment & Recreation | 0 (0.0%) | 27 (100.0%) |
| Accommodation & Food Services | 41 (24.3%) | 128 (75.7%) |
| Public Administration | 15 (11.6%) | 114 (88.4%) |
| Total | 195 (26.6%) | 538 (73.4%) |
Education in Washington Park
School Enrollment in Washington Park
The most common levels of schooling among the 494 students in Washington Park are elementary school (159 | 32.2%), high school (157 | 31.8%), and college / undergraduate (91 | 18.4%).
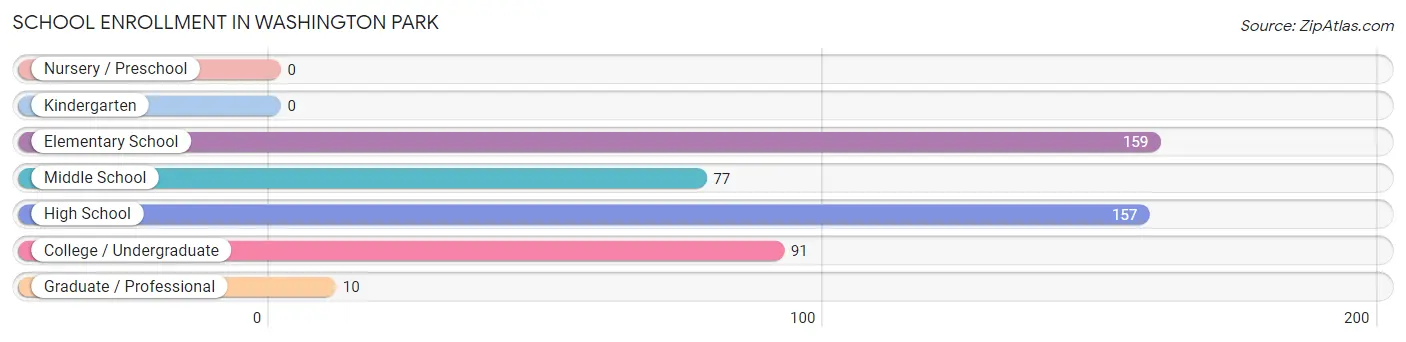
| School Level | # Students | % Students |
| Nursery / Preschool | 0 | 0.0% |
| Kindergarten | 0 | 0.0% |
| Elementary School | 159 | 32.2% |
| Middle School | 77 | 15.6% |
| High School | 157 | 31.8% |
| College / Undergraduate | 91 | 18.4% |
| Graduate / Professional | 10 | 2.0% |
| Total | 494 | 100.0% |
School Enrollment by Age by Funding Source in Washington Park
Out of a total of 494 students who are enrolled in schools in Washington Park, 10 (2.0%) attend a private institution, while the remaining 484 (98.0%) are enrolled in public schools. The age group of 35 years and over has the highest likelihood of being enrolled in private schools, with 10 (20.4% in the age bracket) enrolled. Conversely, the age group of 5 to 9 year old has the lowest likelihood of being enrolled in a private school, with 159 (100.0% in the age bracket) attending a public institution.
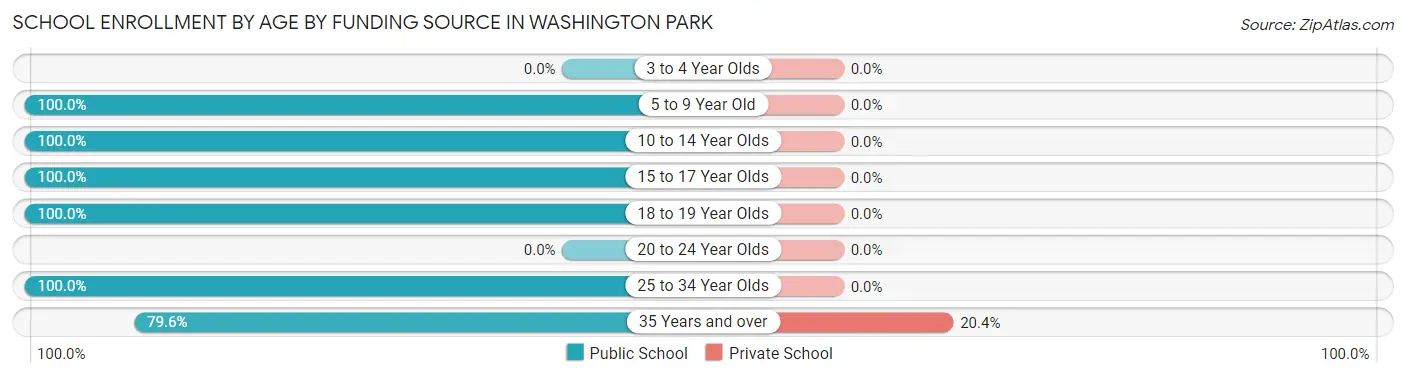
| Age Bracket | Public School | Private School |
| 3 to 4 Year Olds | 0 (0.0%) | 0 (0.0%) |
| 5 to 9 Year Old | 159 (100.0%) | 0 (0.0%) |
| 10 to 14 Year Olds | 77 (100.0%) | 0 (0.0%) |
| 15 to 17 Year Olds | 157 (100.0%) | 0 (0.0%) |
| 18 to 19 Year Olds | 10 (100.0%) | 0 (0.0%) |
| 20 to 24 Year Olds | 0 (0.0%) | 0 (0.0%) |
| 25 to 34 Year Olds | 42 (100.0%) | 0 (0.0%) |
| 35 Years and over | 39 (79.6%) | 10 (20.4%) |
| Total | 484 (98.0%) | 10 (2.0%) |
Educational Attainment by Field of Study in Washington Park
Business (94 | 43.7%), science & technology (68 | 31.6%), social sciences (29 | 13.5%), education (13 | 6.0%), and communications (11 | 5.1%) are the most common fields of study among 215 individuals in Washington Park who have obtained a bachelor's degree or higher.
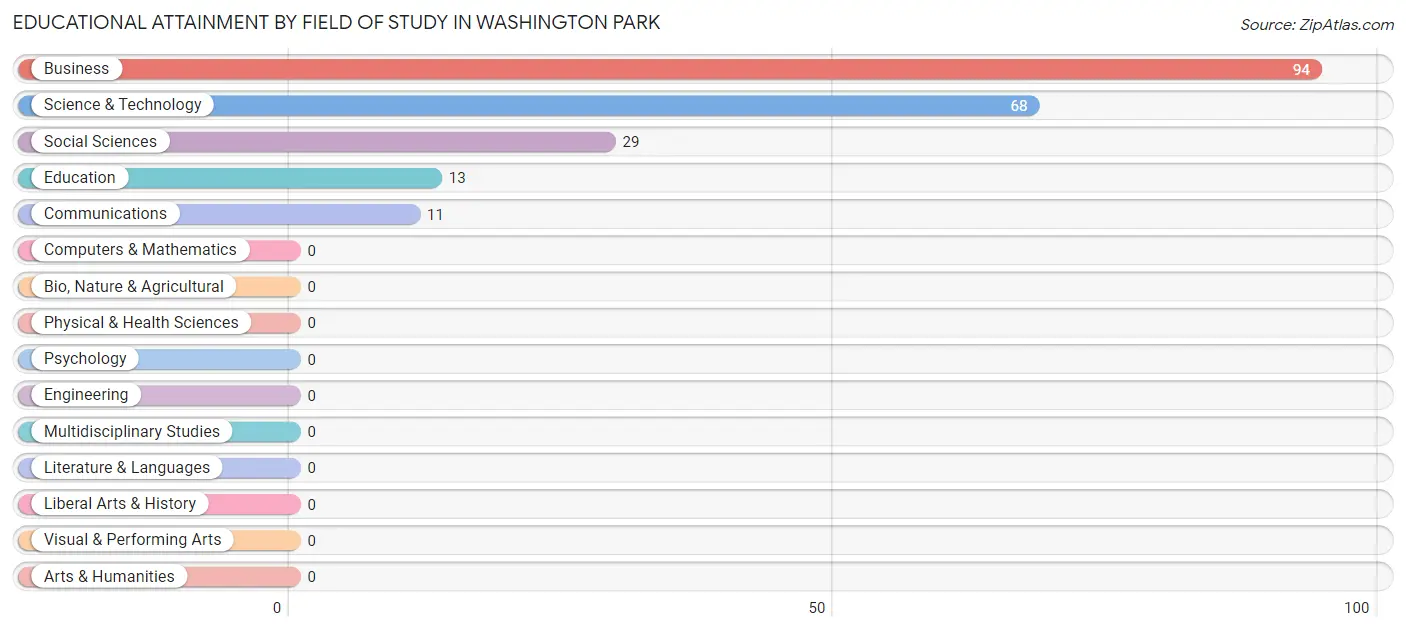
| Field of Study | # Graduates | % Graduates |
| Computers & Mathematics | 0 | 0.0% |
| Bio, Nature & Agricultural | 0 | 0.0% |
| Physical & Health Sciences | 0 | 0.0% |
| Psychology | 0 | 0.0% |
| Social Sciences | 29 | 13.5% |
| Engineering | 0 | 0.0% |
| Multidisciplinary Studies | 0 | 0.0% |
| Science & Technology | 68 | 31.6% |
| Business | 94 | 43.7% |
| Education | 13 | 6.0% |
| Literature & Languages | 0 | 0.0% |
| Liberal Arts & History | 0 | 0.0% |
| Visual & Performing Arts | 0 | 0.0% |
| Communications | 11 | 5.1% |
| Arts & Humanities | 0 | 0.0% |
| Total | 215 | 100.0% |
Transportation & Commute in Washington Park
Vehicle Availability by Sex in Washington Park
The most prevalent vehicle ownership categories in Washington Park are males with 2 vehicles (141, accounting for 74.2%) and females with 2 vehicles (92, making up 26.2%).
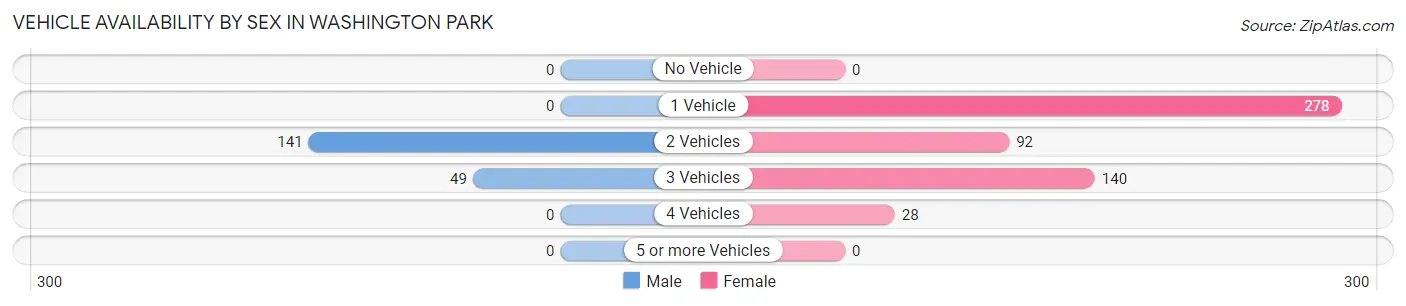
| Vehicles Available | Male | Female |
| No Vehicle | 0 (0.0%) | 0 (0.0%) |
| 1 Vehicle | 0 (0.0%) | 278 (51.7%) |
| 2 Vehicles | 141 (74.2%) | 92 (17.1%) |
| 3 Vehicles | 49 (25.8%) | 140 (26.0%) |
| 4 Vehicles | 0 (0.0%) | 28 (5.2%) |
| 5 or more Vehicles | 0 (0.0%) | 0 (0.0%) |
| Total | 190 (100.0%) | 538 (100.0%) |
Commute Time in Washington Park
The most frequently occuring commute durations in Washington Park are 15 to 19 minutes (227 commuters, 32.5%), 25 to 29 minutes (128 commuters, 18.3%), and 20 to 24 minutes (99 commuters, 14.2%).
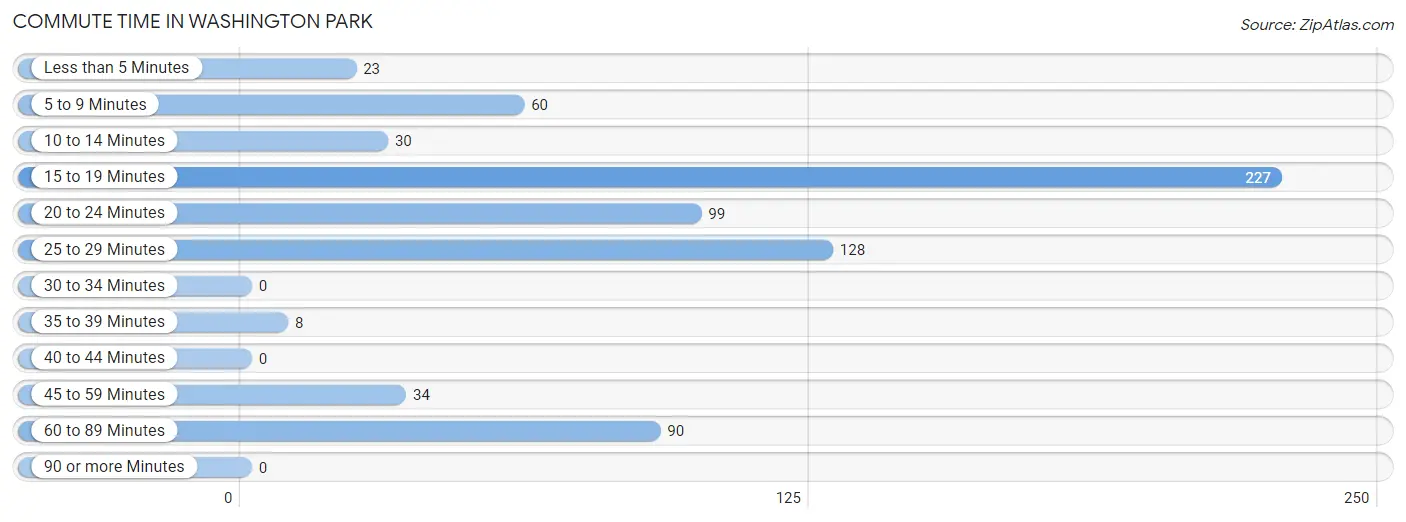
| Commute Time | # Commuters | % Commuters |
| Less than 5 Minutes | 23 | 3.3% |
| 5 to 9 Minutes | 60 | 8.6% |
| 10 to 14 Minutes | 30 | 4.3% |
| 15 to 19 Minutes | 227 | 32.5% |
| 20 to 24 Minutes | 99 | 14.2% |
| 25 to 29 Minutes | 128 | 18.3% |
| 30 to 34 Minutes | 0 | 0.0% |
| 35 to 39 Minutes | 8 | 1.1% |
| 40 to 44 Minutes | 0 | 0.0% |
| 45 to 59 Minutes | 34 | 4.9% |
| 60 to 89 Minutes | 90 | 12.9% |
| 90 or more Minutes | 0 | 0.0% |
Commute Time by Sex in Washington Park
The most common commute times in Washington Park are 15 to 19 minutes (69 commuters, 36.3%) for males and 15 to 19 minutes (158 commuters, 31.0%) for females.
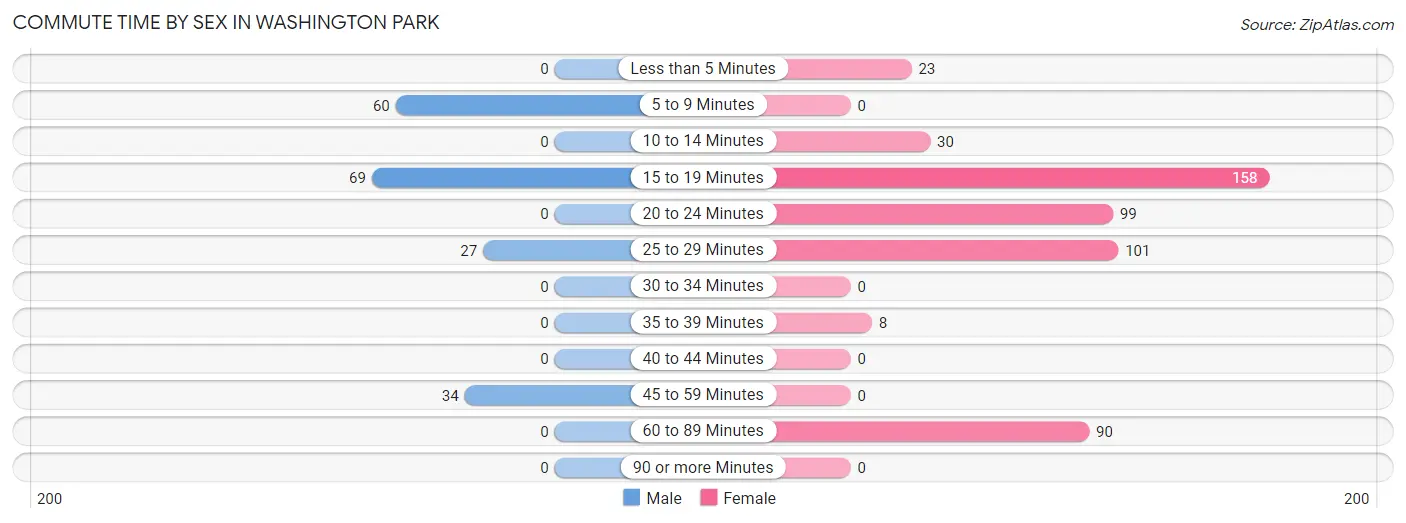
| Commute Time | Male | Female |
| Less than 5 Minutes | 0 (0.0%) | 23 (4.5%) |
| 5 to 9 Minutes | 60 (31.6%) | 0 (0.0%) |
| 10 to 14 Minutes | 0 (0.0%) | 30 (5.9%) |
| 15 to 19 Minutes | 69 (36.3%) | 158 (31.0%) |
| 20 to 24 Minutes | 0 (0.0%) | 99 (19.5%) |
| 25 to 29 Minutes | 27 (14.2%) | 101 (19.8%) |
| 30 to 34 Minutes | 0 (0.0%) | 0 (0.0%) |
| 35 to 39 Minutes | 0 (0.0%) | 8 (1.6%) |
| 40 to 44 Minutes | 0 (0.0%) | 0 (0.0%) |
| 45 to 59 Minutes | 34 (17.9%) | 0 (0.0%) |
| 60 to 89 Minutes | 0 (0.0%) | 90 (17.7%) |
| 90 or more Minutes | 0 (0.0%) | 0 (0.0%) |
Time of Departure to Work by Sex in Washington Park
The most frequent times of departure to work in Washington Park are 12:00 PM to 3:59 PM (45, 23.7%) for males and 8:00 AM to 8:29 AM (166, 32.6%) for females.
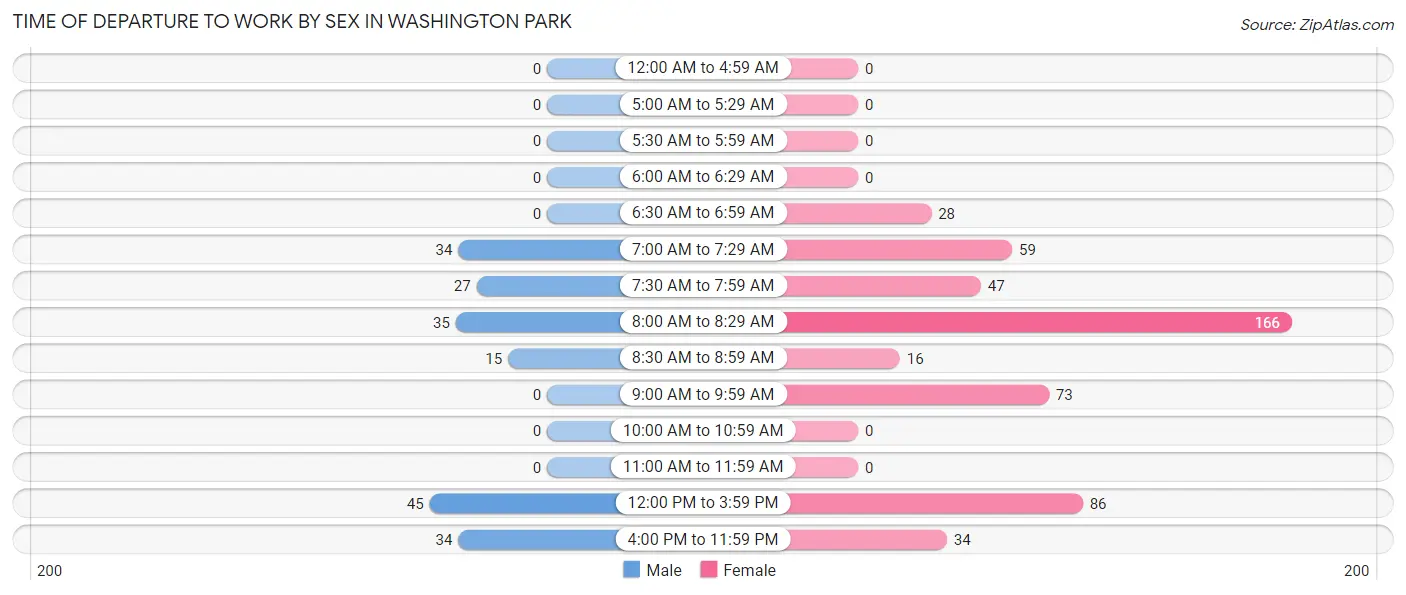
| Time of Departure | Male | Female |
| 12:00 AM to 4:59 AM | 0 (0.0%) | 0 (0.0%) |
| 5:00 AM to 5:29 AM | 0 (0.0%) | 0 (0.0%) |
| 5:30 AM to 5:59 AM | 0 (0.0%) | 0 (0.0%) |
| 6:00 AM to 6:29 AM | 0 (0.0%) | 0 (0.0%) |
| 6:30 AM to 6:59 AM | 0 (0.0%) | 28 (5.5%) |
| 7:00 AM to 7:29 AM | 34 (17.9%) | 59 (11.6%) |
| 7:30 AM to 7:59 AM | 27 (14.2%) | 47 (9.2%) |
| 8:00 AM to 8:29 AM | 35 (18.4%) | 166 (32.6%) |
| 8:30 AM to 8:59 AM | 15 (7.9%) | 16 (3.1%) |
| 9:00 AM to 9:59 AM | 0 (0.0%) | 73 (14.3%) |
| 10:00 AM to 10:59 AM | 0 (0.0%) | 0 (0.0%) |
| 11:00 AM to 11:59 AM | 0 (0.0%) | 0 (0.0%) |
| 12:00 PM to 3:59 PM | 45 (23.7%) | 86 (16.9%) |
| 4:00 PM to 11:59 PM | 34 (17.9%) | 34 (6.7%) |
| Total | 190 (100.0%) | 509 (100.0%) |
Housing Occupancy in Washington Park
Occupancy by Ownership in Washington Park
Of the total 555 dwellings in Washington Park, owner-occupied units account for 401 (72.3%), while renter-occupied units make up 154 (27.8%).
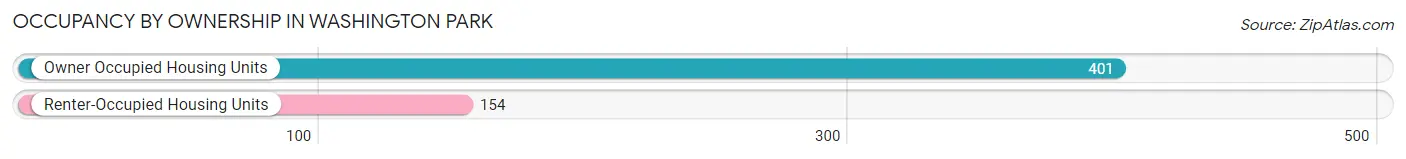
| Occupancy | # Housing Units | % Housing Units |
| Owner Occupied Housing Units | 401 | 72.3% |
| Renter-Occupied Housing Units | 154 | 27.8% |
| Total Occupied Housing Units | 555 | 100.0% |
Occupancy by Household Size in Washington Park
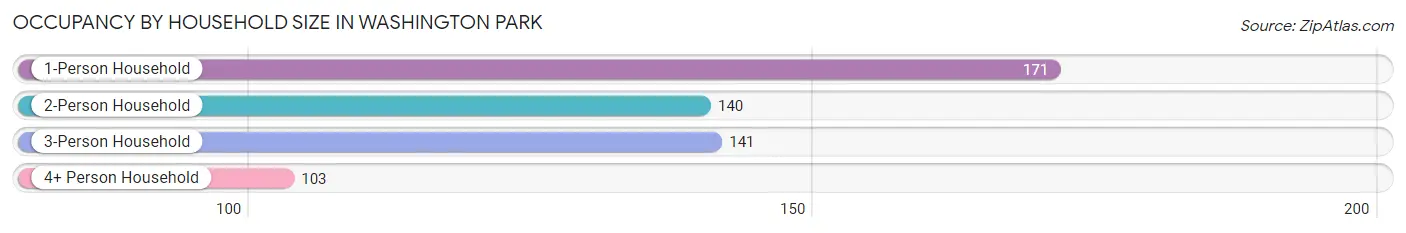
| Household Size | # Housing Units | % Housing Units |
| 1-Person Household | 171 | 30.8% |
| 2-Person Household | 140 | 25.2% |
| 3-Person Household | 141 | 25.4% |
| 4+ Person Household | 103 | 18.6% |
| Total Housing Units | 555 | 100.0% |
Occupancy by Ownership by Household Size in Washington Park
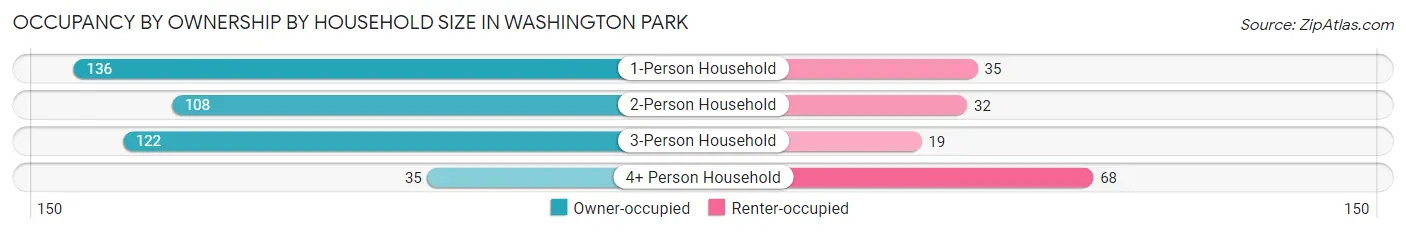
| Household Size | Owner-occupied | Renter-occupied |
| 1-Person Household | 136 (79.5%) | 35 (20.5%) |
| 2-Person Household | 108 (77.1%) | 32 (22.9%) |
| 3-Person Household | 122 (86.5%) | 19 (13.5%) |
| 4+ Person Household | 35 (34.0%) | 68 (66.0%) |
| Total Housing Units | 401 (72.3%) | 154 (27.8%) |
Occupancy by Educational Attainment in Washington Park
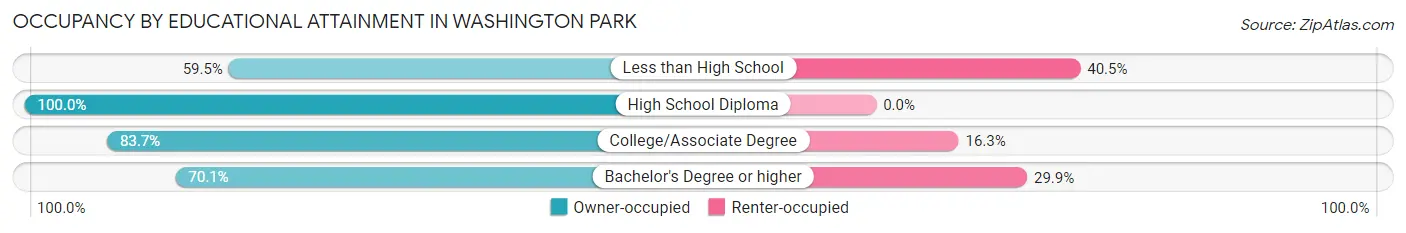
| Household Size | Owner-occupied | Renter-occupied |
| Less than High School | 128 (59.5%) | 87 (40.5%) |
| High School Diploma | 27 (100.0%) | 0 (0.0%) |
| College/Associate Degree | 164 (83.7%) | 32 (16.3%) |
| Bachelor's Degree or higher | 82 (70.1%) | 35 (29.9%) |
Occupancy by Age of Householder in Washington Park
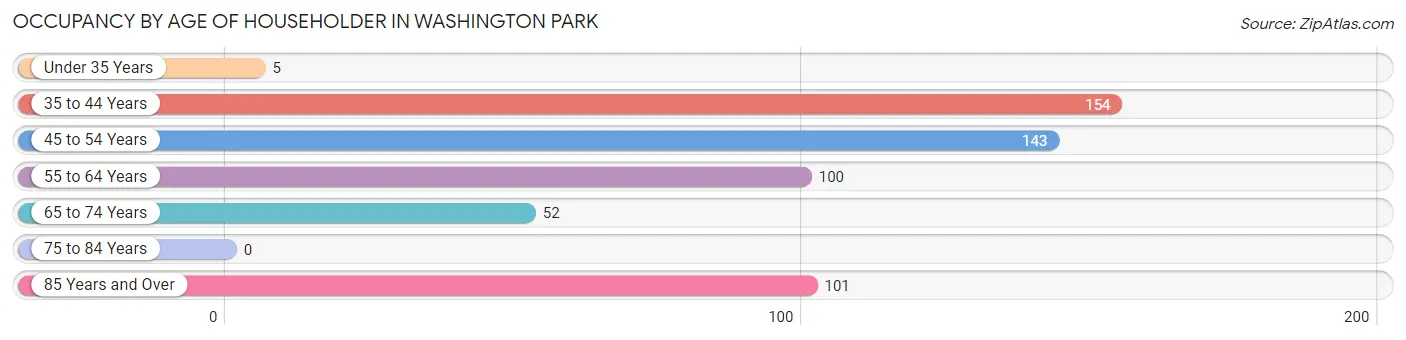
| Age Bracket | # Households | % Households |
| Under 35 Years | 5 | 0.9% |
| 35 to 44 Years | 154 | 27.8% |
| 45 to 54 Years | 143 | 25.8% |
| 55 to 64 Years | 100 | 18.0% |
| 65 to 74 Years | 52 | 9.4% |
| 75 to 84 Years | 0 | 0.0% |
| 85 Years and Over | 101 | 18.2% |
| Total | 555 | 100.0% |
Housing Finances in Washington Park
Median Income by Occupancy in Washington Park
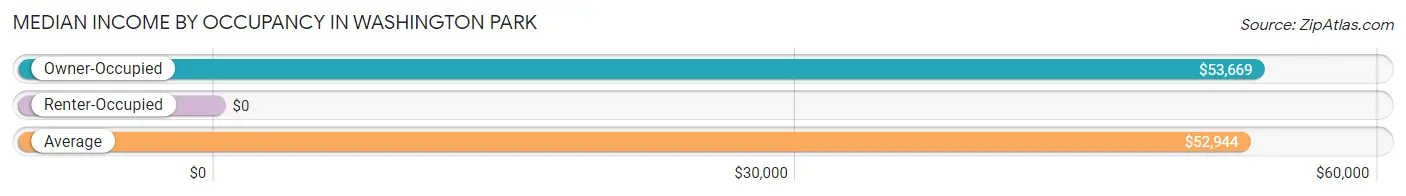
| Occupancy Type | # Households | Median Income |
| Owner-Occupied | 401 (72.3%) | $53,669 |
| Renter-Occupied | 154 (27.8%) | $0 |
| Average | 555 (100.0%) | $52,944 |
Occupancy by Householder Income Bracket in Washington Park
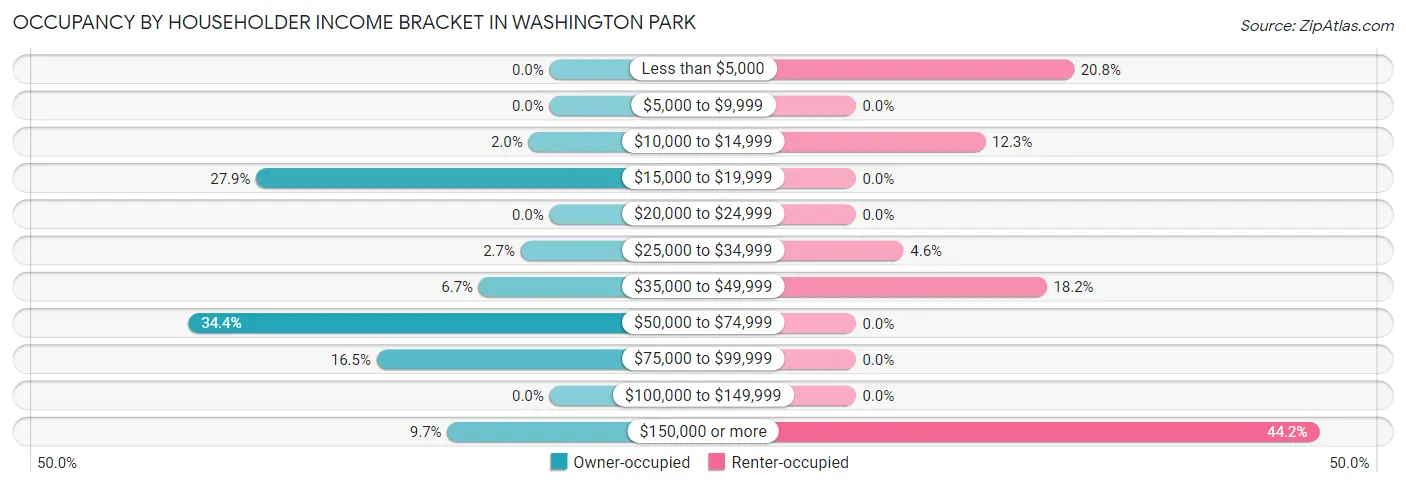
| Income Bracket | Owner-occupied | Renter-occupied |
| Less than $5,000 | 0 (0.0%) | 32 (20.8%) |
| $5,000 to $9,999 | 0 (0.0%) | 0 (0.0%) |
| $10,000 to $14,999 | 8 (2.0%) | 19 (12.3%) |
| $15,000 to $19,999 | 112 (27.9%) | 0 (0.0%) |
| $20,000 to $24,999 | 0 (0.0%) | 0 (0.0%) |
| $25,000 to $34,999 | 11 (2.7%) | 7 (4.5%) |
| $35,000 to $49,999 | 27 (6.7%) | 28 (18.2%) |
| $50,000 to $74,999 | 138 (34.4%) | 0 (0.0%) |
| $75,000 to $99,999 | 66 (16.5%) | 0 (0.0%) |
| $100,000 to $149,999 | 0 (0.0%) | 0 (0.0%) |
| $150,000 or more | 39 (9.7%) | 68 (44.2%) |
| Total | 401 (100.0%) | 154 (100.0%) |
Monthly Housing Cost Tiers in Washington Park
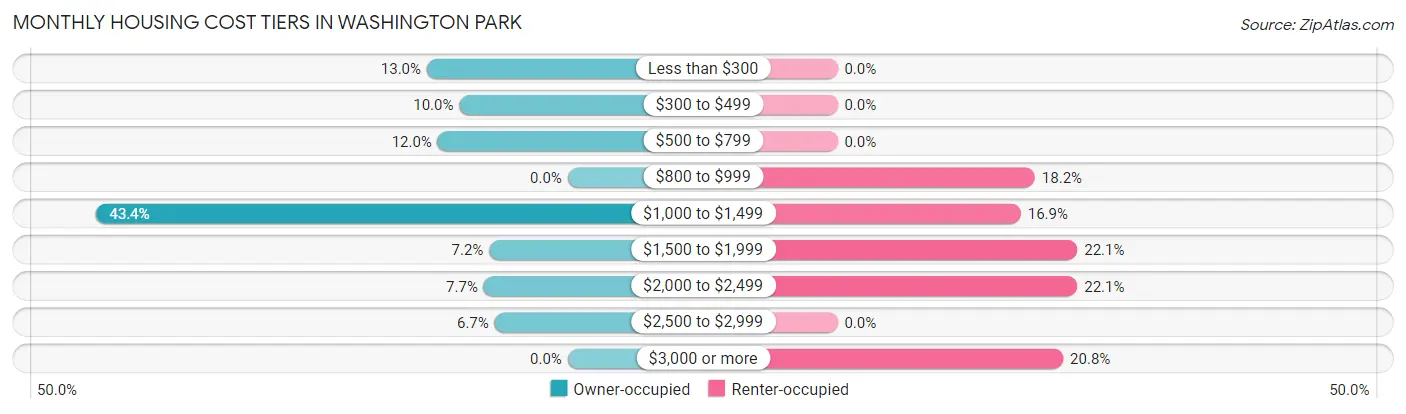
| Monthly Cost | Owner-occupied | Renter-occupied |
| Less than $300 | 52 (13.0%) | 0 (0.0%) |
| $300 to $499 | 40 (10.0%) | 0 (0.0%) |
| $500 to $799 | 48 (12.0%) | 0 (0.0%) |
| $800 to $999 | 0 (0.0%) | 28 (18.2%) |
| $1,000 to $1,499 | 174 (43.4%) | 26 (16.9%) |
| $1,500 to $1,999 | 29 (7.2%) | 34 (22.1%) |
| $2,000 to $2,499 | 31 (7.7%) | 34 (22.1%) |
| $2,500 to $2,999 | 27 (6.7%) | 0 (0.0%) |
| $3,000 or more | 0 (0.0%) | 32 (20.8%) |
| Total | 401 (100.0%) | 154 (100.0%) |
Physical Housing Characteristics in Washington Park
Housing Structures in Washington Park
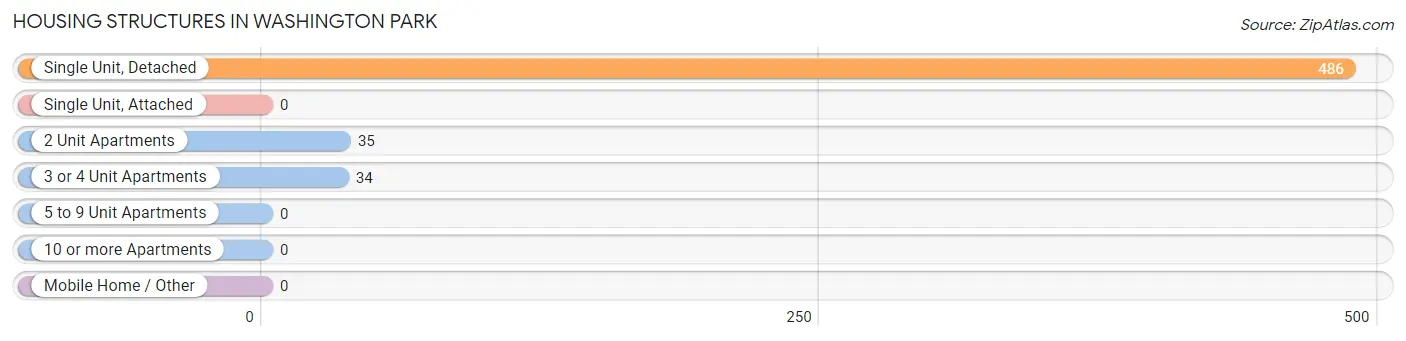
| Structure Type | # Housing Units | % Housing Units |
| Single Unit, Detached | 486 | 87.6% |
| Single Unit, Attached | 0 | 0.0% |
| 2 Unit Apartments | 35 | 6.3% |
| 3 or 4 Unit Apartments | 34 | 6.1% |
| 5 to 9 Unit Apartments | 0 | 0.0% |
| 10 or more Apartments | 0 | 0.0% |
| Mobile Home / Other | 0 | 0.0% |
| Total | 555 | 100.0% |
Housing Structures by Occupancy in Washington Park
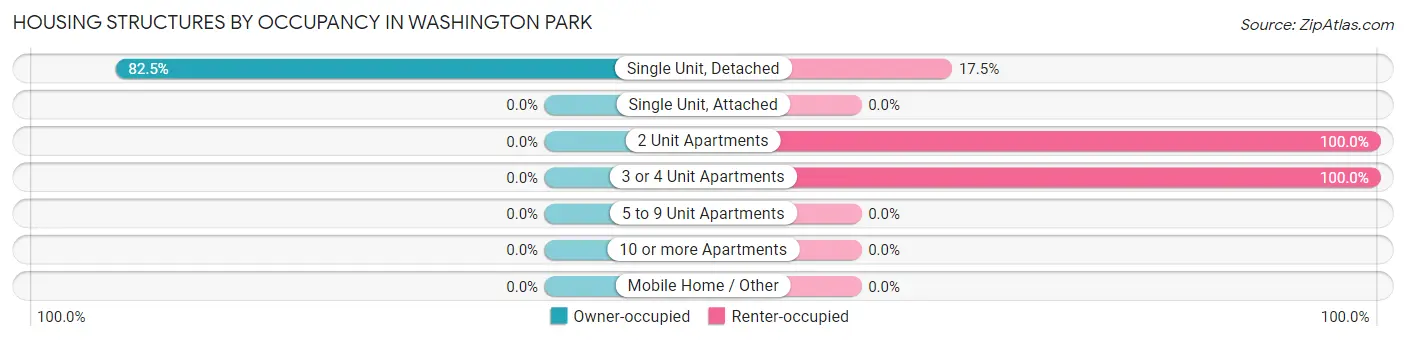
| Structure Type | Owner-occupied | Renter-occupied |
| Single Unit, Detached | 401 (82.5%) | 85 (17.5%) |
| Single Unit, Attached | 0 (0.0%) | 0 (0.0%) |
| 2 Unit Apartments | 0 (0.0%) | 35 (100.0%) |
| 3 or 4 Unit Apartments | 0 (0.0%) | 34 (100.0%) |
| 5 to 9 Unit Apartments | 0 (0.0%) | 0 (0.0%) |
| 10 or more Apartments | 0 (0.0%) | 0 (0.0%) |
| Mobile Home / Other | 0 (0.0%) | 0 (0.0%) |
| Total | 401 (72.3%) | 154 (27.8%) |
Housing Structures by Number of Rooms in Washington Park
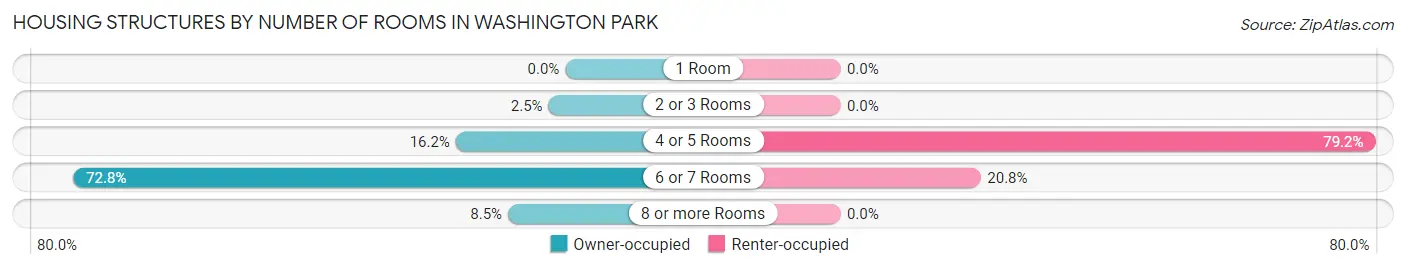
| Number of Rooms | Owner-occupied | Renter-occupied |
| 1 Room | 0 (0.0%) | 0 (0.0%) |
| 2 or 3 Rooms | 10 (2.5%) | 0 (0.0%) |
| 4 or 5 Rooms | 65 (16.2%) | 122 (79.2%) |
| 6 or 7 Rooms | 292 (72.8%) | 32 (20.8%) |
| 8 or more Rooms | 34 (8.5%) | 0 (0.0%) |
| Total | 401 (100.0%) | 154 (100.0%) |
Housing Structure by Heating Type in Washington Park
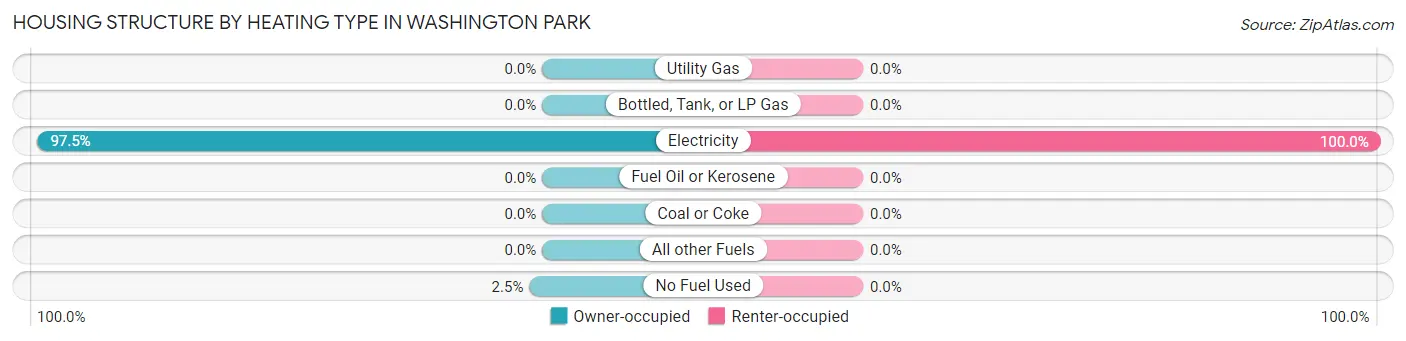
| Heating Type | Owner-occupied | Renter-occupied |
| Utility Gas | 0 (0.0%) | 0 (0.0%) |
| Bottled, Tank, or LP Gas | 0 (0.0%) | 0 (0.0%) |
| Electricity | 391 (97.5%) | 154 (100.0%) |
| Fuel Oil or Kerosene | 0 (0.0%) | 0 (0.0%) |
| Coal or Coke | 0 (0.0%) | 0 (0.0%) |
| All other Fuels | 0 (0.0%) | 0 (0.0%) |
| No Fuel Used | 10 (2.5%) | 0 (0.0%) |
| Total | 401 (100.0%) | 154 (100.0%) |
Household Vehicle Usage in Washington Park
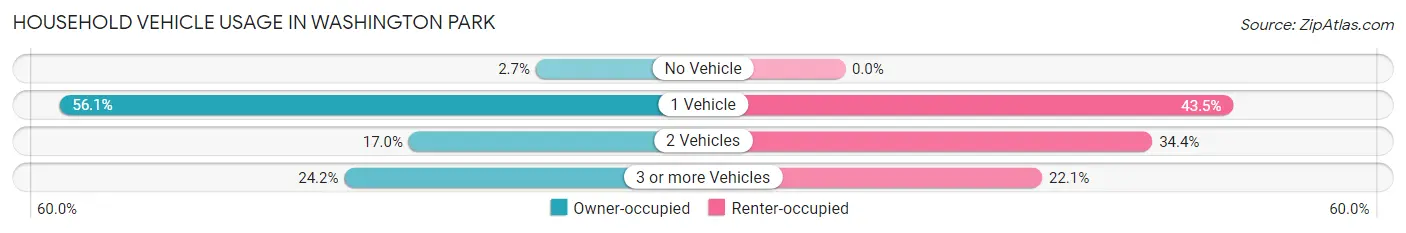
| Vehicles per Household | Owner-occupied | Renter-occupied |
| No Vehicle | 11 (2.7%) | 0 (0.0%) |
| 1 Vehicle | 225 (56.1%) | 67 (43.5%) |
| 2 Vehicles | 68 (17.0%) | 53 (34.4%) |
| 3 or more Vehicles | 97 (24.2%) | 34 (22.1%) |
| Total | 401 (100.0%) | 154 (100.0%) |
Real Estate & Mortgages in Washington Park
Real Estate and Mortgage Overview in Washington Park
| Characteristic | Without Mortgage | With Mortgage |
| Housing Units | 115 | 286 |
| Median Property Value | $113,500 | $245,700 |
| Median Household Income | $71,065 | $29 |
| Monthly Housing Costs | $450 | $0 |
| Real Estate Taxes | $1,158 | $61 |
Property Value by Mortgage Status in Washington Park
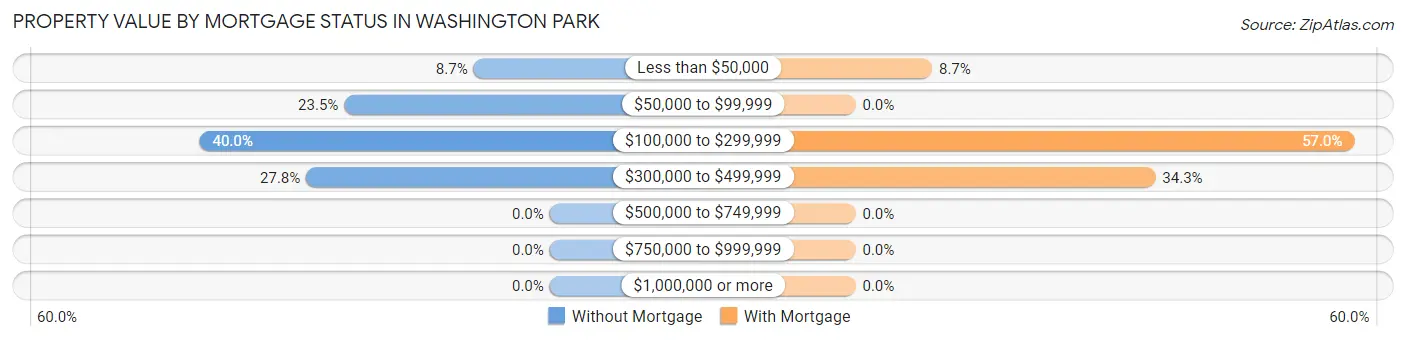
| Property Value | Without Mortgage | With Mortgage |
| Less than $50,000 | 10 (8.7%) | 25 (8.7%) |
| $50,000 to $99,999 | 27 (23.5%) | 0 (0.0%) |
| $100,000 to $299,999 | 46 (40.0%) | 163 (57.0%) |
| $300,000 to $499,999 | 32 (27.8%) | 98 (34.3%) |
| $500,000 to $749,999 | 0 (0.0%) | 0 (0.0%) |
| $750,000 to $999,999 | 0 (0.0%) | 0 (0.0%) |
| $1,000,000 or more | 0 (0.0%) | 0 (0.0%) |
| Total | 115 (100.0%) | 286 (100.0%) |
Household Income by Mortgage Status in Washington Park
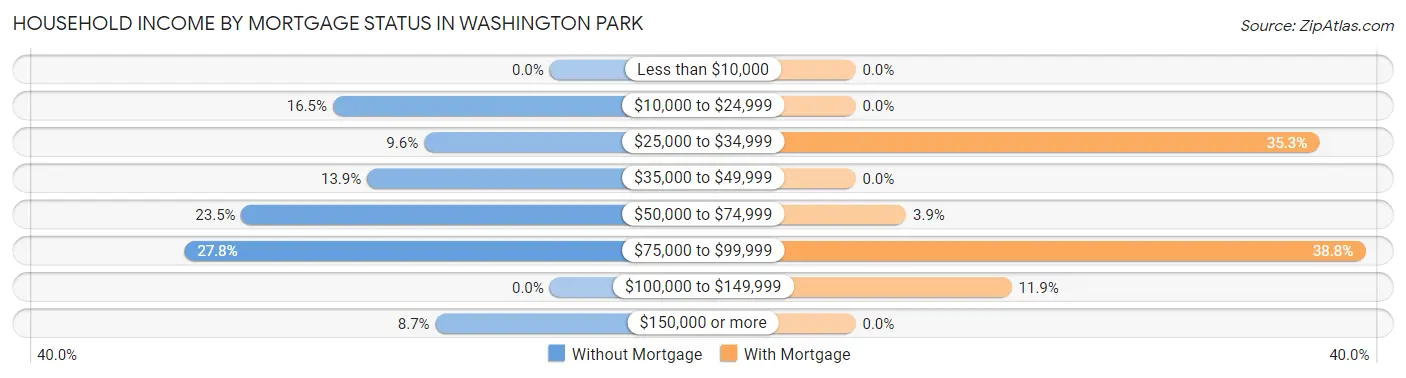
| Household Income | Without Mortgage | With Mortgage |
| Less than $10,000 | 0 (0.0%) | 0 (0.0%) |
| $10,000 to $24,999 | 19 (16.5%) | 0 (0.0%) |
| $25,000 to $34,999 | 11 (9.6%) | 101 (35.3%) |
| $35,000 to $49,999 | 16 (13.9%) | 0 (0.0%) |
| $50,000 to $74,999 | 27 (23.5%) | 11 (3.8%) |
| $75,000 to $99,999 | 32 (27.8%) | 111 (38.8%) |
| $100,000 to $149,999 | 0 (0.0%) | 34 (11.9%) |
| $150,000 or more | 10 (8.7%) | 0 (0.0%) |
| Total | 115 (100.0%) | 286 (100.0%) |
Property Value to Household Income Ratio in Washington Park
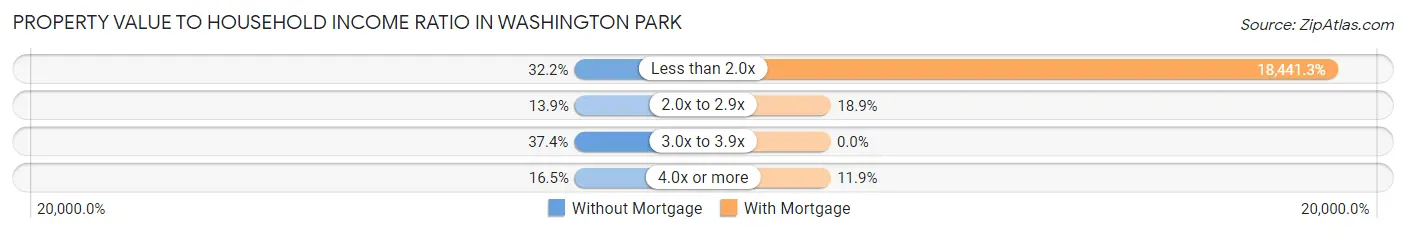
| Value-to-Income Ratio | Without Mortgage | With Mortgage |
| Less than 2.0x | 37 (32.2%) | 52,742 (18,441.3%) |
| 2.0x to 2.9x | 16 (13.9%) | 54 (18.9%) |
| 3.0x to 3.9x | 43 (37.4%) | 0 (0.0%) |
| 4.0x or more | 19 (16.5%) | 34 (11.9%) |
| Total | 115 (100.0%) | 286 (100.0%) |
Real Estate Taxes by Mortgage Status in Washington Park
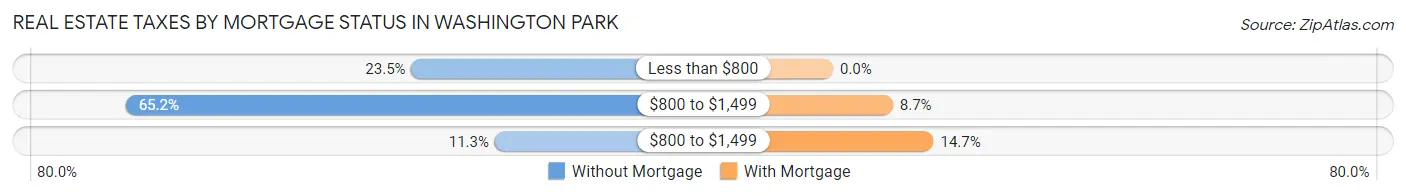
| Property Taxes | Without Mortgage | With Mortgage |
| Less than $800 | 27 (23.5%) | 0 (0.0%) |
| $800 to $1,499 | 75 (65.2%) | 25 (8.7%) |
| $800 to $1,499 | 13 (11.3%) | 42 (14.7%) |
| Total | 115 (100.0%) | 286 (100.0%) |
Health & Disability in Washington Park
Health Insurance Coverage by Age in Washington Park
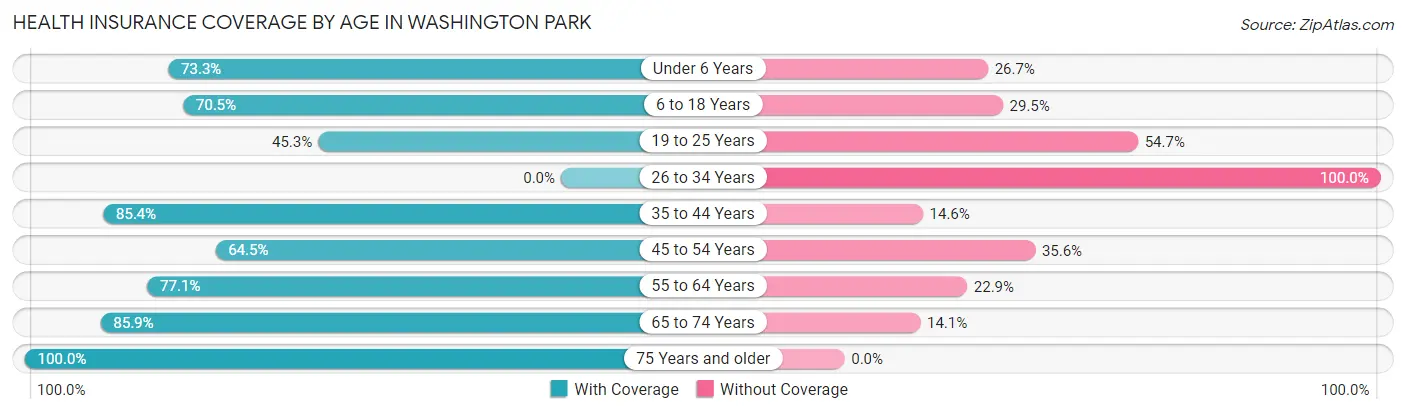
| Age Bracket | With Coverage | Without Coverage |
| Under 6 Years | 126 (73.3%) | 46 (26.7%) |
| 6 to 18 Years | 277 (70.5%) | 116 (29.5%) |
| 19 to 25 Years | 72 (45.3%) | 87 (54.7%) |
| 26 to 34 Years | 0 (0.0%) | 47 (100.0%) |
| 35 to 44 Years | 269 (85.4%) | 46 (14.6%) |
| 45 to 54 Years | 165 (64.4%) | 91 (35.5%) |
| 55 to 64 Years | 135 (77.1%) | 40 (22.9%) |
| 65 to 74 Years | 79 (85.9%) | 13 (14.1%) |
| 75 Years and older | 166 (100.0%) | 0 (0.0%) |
| Total | 1,289 (72.6%) | 486 (27.4%) |
Health Insurance Coverage by Citizenship Status in Washington Park
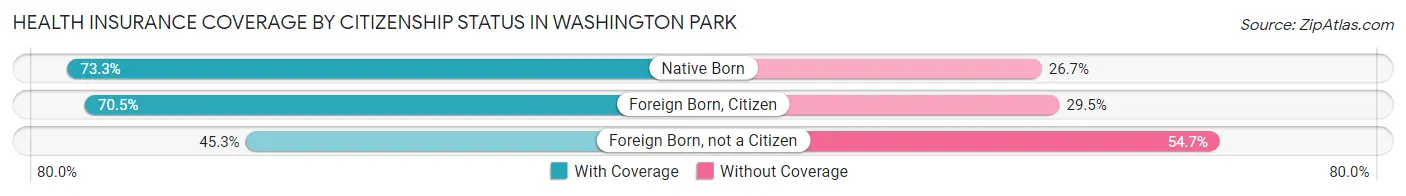
| Citizenship Status | With Coverage | Without Coverage |
| Native Born | 126 (73.3%) | 46 (26.7%) |
| Foreign Born, Citizen | 277 (70.5%) | 116 (29.5%) |
| Foreign Born, not a Citizen | 72 (45.3%) | 87 (54.7%) |
Health Insurance Coverage by Household Income in Washington Park
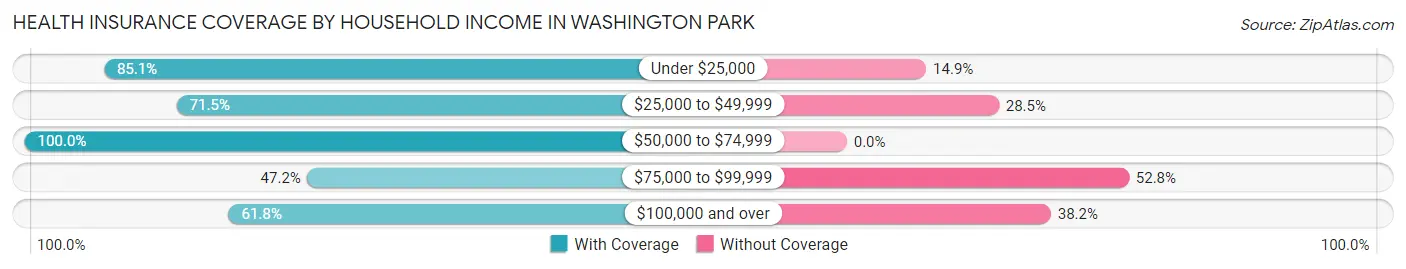
| Household Income | With Coverage | Without Coverage |
| Under $25,000 | 229 (85.1%) | 40 (14.9%) |
| $25,000 to $49,999 | 108 (71.5%) | 43 (28.5%) |
| $50,000 to $74,999 | 368 (100.0%) | 0 (0.0%) |
| $75,000 to $99,999 | 83 (47.2%) | 93 (52.8%) |
| $100,000 and over | 501 (61.8%) | 310 (38.2%) |
Public vs Private Health Insurance Coverage by Age in Washington Park
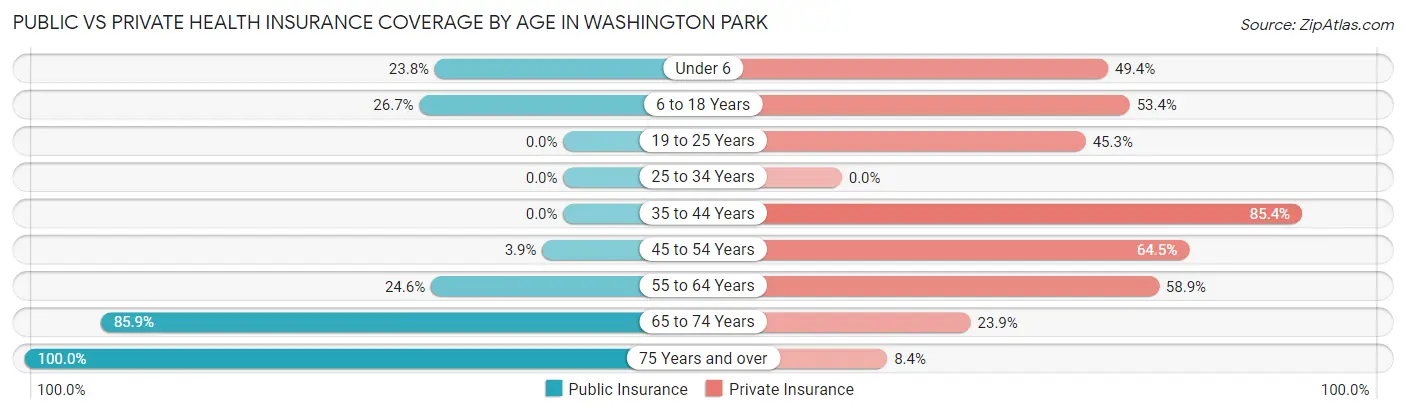
| Age Bracket | Public Insurance | Private Insurance |
| Under 6 | 41 (23.8%) | 85 (49.4%) |
| 6 to 18 Years | 105 (26.7%) | 210 (53.4%) |
| 19 to 25 Years | 0 (0.0%) | 72 (45.3%) |
| 25 to 34 Years | 0 (0.0%) | 0 (0.0%) |
| 35 to 44 Years | 0 (0.0%) | 269 (85.4%) |
| 45 to 54 Years | 10 (3.9%) | 165 (64.4%) |
| 55 to 64 Years | 43 (24.6%) | 103 (58.9%) |
| 65 to 74 Years | 79 (85.9%) | 22 (23.9%) |
| 75 Years and over | 166 (100.0%) | 14 (8.4%) |
| Total | 444 (25.0%) | 940 (53.0%) |
Disability Status by Sex by Age in Washington Park
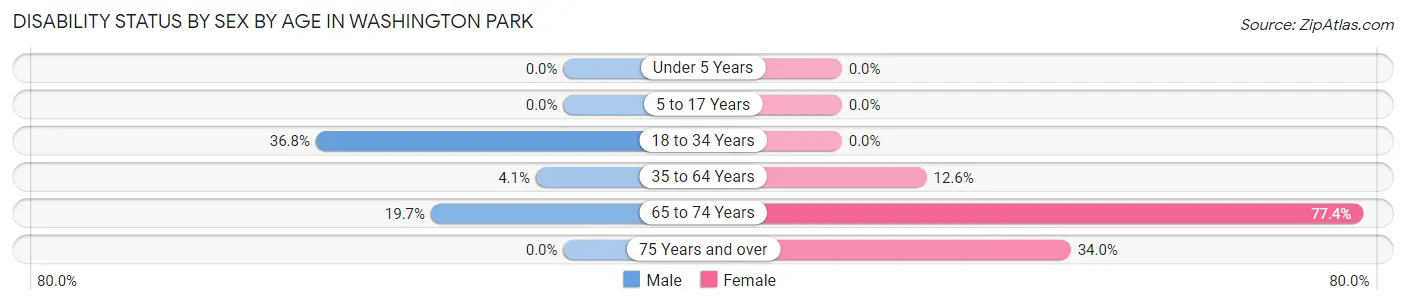
| Age Bracket | Male | Female |
| Under 5 Years | 0 (0.0%) | 0 (0.0%) |
| 5 to 17 Years | 0 (0.0%) | 0 (0.0%) |
| 18 to 34 Years | 25 (36.8%) | 0 (0.0%) |
| 35 to 64 Years | 11 (4.1%) | 60 (12.6%) |
| 65 to 74 Years | 12 (19.7%) | 24 (77.4%) |
| 75 Years and over | 0 (0.0%) | 52 (34.0%) |
Disability Class by Sex by Age in Washington Park
Disability Class: Hearing Difficulty
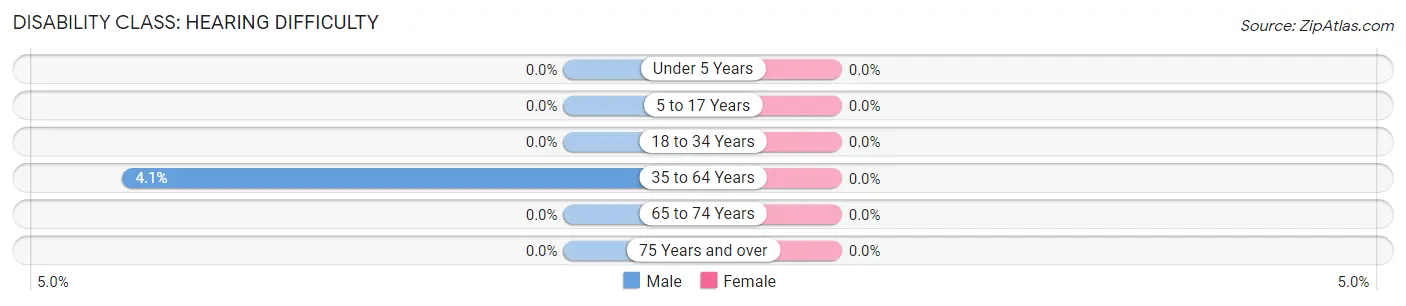
| Age Bracket | Male | Female |
| Under 5 Years | 0 (0.0%) | 0 (0.0%) |
| 5 to 17 Years | 0 (0.0%) | 0 (0.0%) |
| 18 to 34 Years | 0 (0.0%) | 0 (0.0%) |
| 35 to 64 Years | 11 (4.1%) | 0 (0.0%) |
| 65 to 74 Years | 0 (0.0%) | 0 (0.0%) |
| 75 Years and over | 0 (0.0%) | 0 (0.0%) |
Disability Class: Vision Difficulty
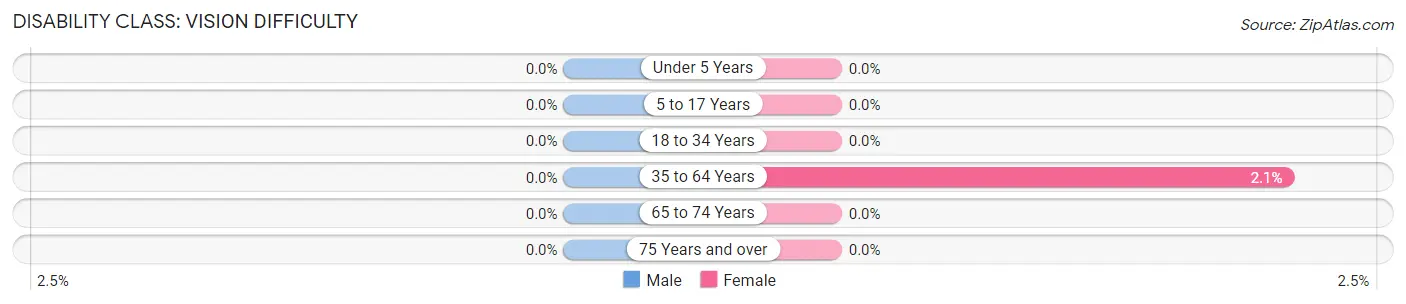
| Age Bracket | Male | Female |
| Under 5 Years | 0 (0.0%) | 0 (0.0%) |
| 5 to 17 Years | 0 (0.0%) | 0 (0.0%) |
| 18 to 34 Years | 0 (0.0%) | 0 (0.0%) |
| 35 to 64 Years | 0 (0.0%) | 10 (2.1%) |
| 65 to 74 Years | 0 (0.0%) | 0 (0.0%) |
| 75 Years and over | 0 (0.0%) | 0 (0.0%) |
Disability Class: Cognitive Difficulty
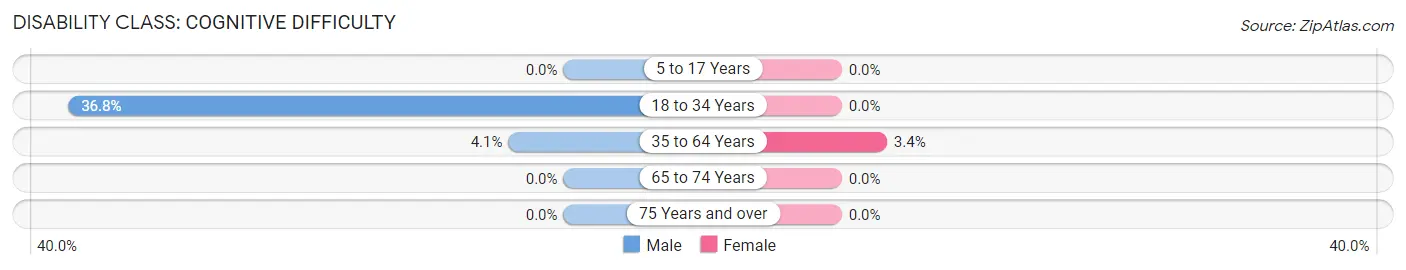
| Age Bracket | Male | Female |
| 5 to 17 Years | 0 (0.0%) | 0 (0.0%) |
| 18 to 34 Years | 25 (36.8%) | 0 (0.0%) |
| 35 to 64 Years | 11 (4.1%) | 16 (3.4%) |
| 65 to 74 Years | 0 (0.0%) | 0 (0.0%) |
| 75 Years and over | 0 (0.0%) | 0 (0.0%) |
Disability Class: Ambulatory Difficulty
| Age Bracket | Male | Female |
| 5 to 17 Years | 0 (0.0%) | 0 (0.0%) |
| 18 to 34 Years | 0 (0.0%) | 0 (0.0%) |
| 35 to 64 Years | 11 (4.1%) | 34 (7.1%) |
| 65 to 74 Years | 12 (19.7%) | 24 (77.4%) |
| 75 Years and over | 0 (0.0%) | 52 (34.0%) |
Disability Class: Self-Care Difficulty
| Age Bracket | Male | Female |
| 5 to 17 Years | 0 (0.0%) | 0 (0.0%) |
| 18 to 34 Years | 0 (0.0%) | 0 (0.0%) |
| 35 to 64 Years | 0 (0.0%) | 0 (0.0%) |
| 65 to 74 Years | 12 (19.7%) | 0 (0.0%) |
| 75 Years and over | 0 (0.0%) | 0 (0.0%) |
Technology Access in Washington Park
Computing Device Access in Washington Park
| Device Type | # Households | % Households |
| Desktop or Laptop | 330 | 59.5% |
| Smartphone | 454 | 81.8% |
| Tablet | 291 | 52.4% |
| No Computing Device | 101 | 18.2% |
| Total | 555 | 100.0% |
Internet Access in Washington Park
| Internet Type | # Households | % Households |
| Dial-Up Internet | 0 | 0.0% |
| Broadband Home | 317 | 57.1% |
| Cellular Data Only | 45 | 8.1% |
| Satellite Internet | 41 | 7.4% |
| No Internet | 182 | 32.8% |
| Total | 555 | 100.0% |
Washington Park Summary
Introduction
Washington Park is a small town located in the state of Florida, United States. It is situated in the northern part of the state, in Bay County. The town has a population of around 1,000 people and is known for its rural atmosphere and small-town charm. The town is home to a variety of businesses, including a grocery store, a hardware store, and a few restaurants. The town is also home to a number of parks and recreational areas, including a golf course and a lake.
History
Washington Park was founded in 1883 by a group of settlers from Georgia. The town was named after President George Washington, who had recently died. The settlers were attracted to the area due to its fertile soil and abundant wildlife. The town quickly grew and by the early 1900s, it had become a thriving community.
In the 1920s, the town was hit hard by the Great Depression. Many of the businesses in the town closed and the population declined. However, the town was able to recover and by the 1950s, it had become a popular tourist destination. The town was also home to a number of businesses, including a grocery store, a hardware store, and a few restaurants.
Geography
Washington Park is located in the northern part of Florida, in Bay County. The town is situated on the banks of the Apalachicola River, which is a major waterway in the region. The town is surrounded by a number of small towns and villages, including Panama City, Lynn Haven, and Callaway. The town is also located close to the Gulf of Mexico, which provides a number of recreational opportunities.
The town has a total area of 1.2 square miles, all of which is land. The town is located at an elevation of 30 feet above sea level. The climate in the area is humid subtropical, with hot summers and mild winters.
Economy
Washington Park is a small town with a population of around 1,000 people. The town is home to a variety of businesses, including a grocery store, a hardware store, and a few restaurants. The town is also home to a number of parks and recreational areas, including a golf course and a lake.
The town is also home to a number of manufacturing and industrial businesses. These businesses include a paper mill, a lumber mill, and a chemical plant. The town is also home to a number of agricultural businesses, including a dairy farm and a vegetable farm.
Demographics
As of the 2010 census, the population of Washington Park was 1,000 people. The racial makeup of the town was 97.7% White, 0.7% African American, 0.2% Native American, 0.2% Asian, and 1.2% from other races. The median household income in the town was $37,500. The per capita income in the town was $17,500.
Conclusion
Washington Park is a small town located in the northern part of Florida, in Bay County. The town has a population of around 1,000 people and is known for its rural atmosphere and small-town charm. The town is home to a variety of businesses, including a grocery store, a hardware store, and a few restaurants. The town is also home to a number of parks and recreational areas, including a golf course and a lake. The town has a total area of 1.2 square miles, all of which is land. The town is located at an elevation of 30 feet above sea level. The climate in the area is humid subtropical, with hot summers and mild winters. As of the 2010 census, the population of Washington Park was 1,000 people. The racial makeup of the town was 97.7% White, 0.7% African American, 0.2% Native American, 0.2% Asian, and 1.2% from other races. The median household income in the town was $37,500. The per capita income in the town was $17,500.
Common Questions
What is Per Capita Income in Washington Park?
Per Capita income in Washington Park is $25,859.
What is the Median Family Income in Washington Park?
Median Family Income in Washington Park is $66,900.
What is the Median Household income in Washington Park?
Median Household Income in Washington Park is $52,944.
What is Income or Wage Gap in Washington Park?
Income or Wage Gap in Washington Park is 8.0%.
Women in Washington Park earn 92.0 cents for every dollar earned by a man.
What is Inequality or Gini Index in Washington Park?
Inequality or Gini Index in Washington Park is 0.51.
What is the Total Population of Washington Park?
Total Population of Washington Park is 1,775.
What is the Total Male Population of Washington Park?
Total Male Population of Washington Park is 619.
What is the Total Female Population of Washington Park?
Total Female Population of Washington Park is 1,156.
What is the Ratio of Males per 100 Females in Washington Park?
There are 53.55 Males per 100 Females in Washington Park.
What is the Ratio of Females per 100 Males in Washington Park?
There are 186.75 Females per 100 Males in Washington Park.
What is the Median Population Age in Washington Park?
Median Population Age in Washington Park is 38.8 Years.
What is the Average Family Size in Washington Park
Average Family Size in Washington Park is 4.2 People.
What is the Average Household Size in Washington Park
Average Household Size in Washington Park is 3.2 People.
How Large is the Labor Force in Washington Park?
There are 759 People in the Labor Forcein in Washington Park.
What is the Percentage of People in the Labor Force in Washington Park?
57.6% of People are in the Labor Force in Washington Park.
What is the Unemployment Rate in Washington Park?
Unemployment Rate in Washington Park is 3.4%.