Fairview Shores, FL Map & Demographics
Fairview Shores Map
Fairview Shores Overview
$37,144
PER CAPITA INCOME
$86,871
AVG FAMILY INCOME
$64,556
AVG HOUSEHOLD INCOME
3.4%
WAGE / INCOME GAP [ % ]
96.6¢/ $1
WAGE / INCOME GAP [ $ ]
$14,256
FAMILY INCOME DEFICIT
0.46
INEQUALITY / GINI INDEX
11,011
TOTAL POPULATION
5,303
MALE POPULATION
5,708
FEMALE POPULATION
92.90
MALES / 100 FEMALES
107.64
FEMALES / 100 MALES
39.7
MEDIAN AGE
3.2
AVG FAMILY SIZE
2.4
AVG HOUSEHOLD SIZE
6,615
LABOR FORCE [ PEOPLE ]
72.4%
PERCENT IN LABOR FORCE
2.6%
UNEMPLOYMENT RATE
Income in Fairview Shores
Income Overview in Fairview Shores
Per Capita Income in Fairview Shores is $37,144, while median incomes of families and households are $86,871 and $64,556 respectively.
| Characteristic | Number | Measure |
| Per Capita Income | 11,011 | $37,144 |
| Median Family Income | 2,468 | $86,871 |
| Mean Family Income | 2,468 | $101,673 |
| Median Household Income | 4,379 | $64,556 |
| Mean Household Income | 4,379 | $85,380 |
| Income Deficit | 2,468 | $14,256 |
| Wage / Income Gap (%) | 11,011 | 3.35% |
| Wage / Income Gap ($) | 11,011 | 96.65¢ per $1 |
| Gini / Inequality Index | 11,011 | 0.46 |
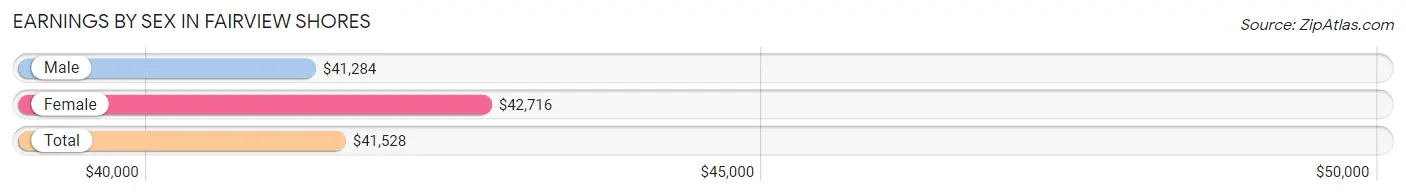
Earnings by Sex in Fairview Shores
Average Earnings in Fairview Shores are $41,528, $41,284 for men and $42,716 for women, a difference of 3.4%.
| Sex | Number | Average Earnings |
| Male | 3,330 (49.7%) | $41,284 |
| Female | 3,366 (50.3%) | $42,716 |
| Total | 6,696 (100.0%) | $41,528 |
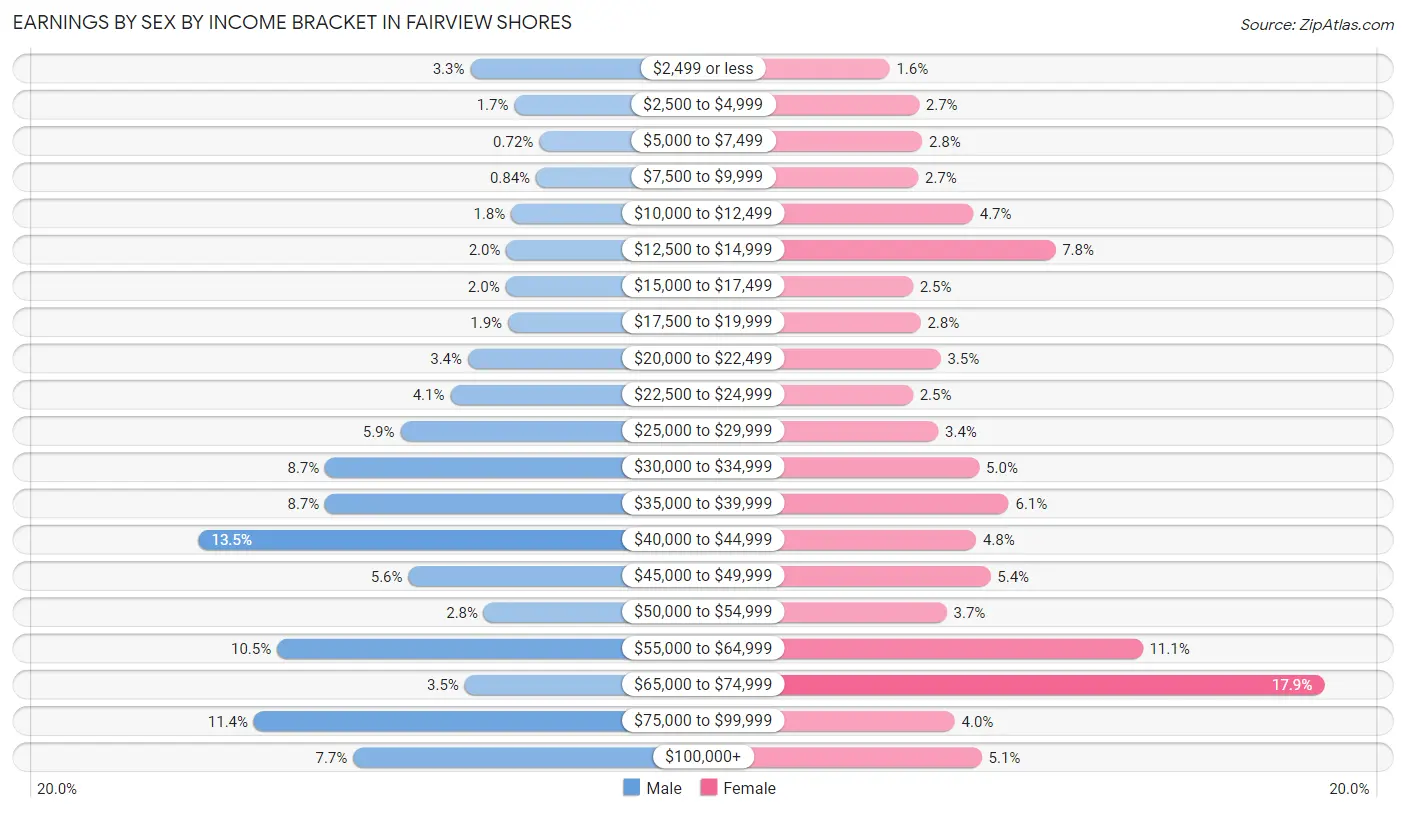
Earnings by Sex by Income Bracket in Fairview Shores
The most common earnings brackets in Fairview Shores are $40,000 to $44,999 for men (449 | 13.5%) and $65,000 to $74,999 for women (602 | 17.9%).
| Income | Male | Female |
| $2,499 or less | 110 (3.3%) | 54 (1.6%) |
| $2,500 to $4,999 | 55 (1.7%) | 91 (2.7%) |
| $5,000 to $7,499 | 24 (0.7%) | 95 (2.8%) |
| $7,500 to $9,999 | 28 (0.8%) | 90 (2.7%) |
| $10,000 to $12,499 | 59 (1.8%) | 159 (4.7%) |
| $12,500 to $14,999 | 65 (1.9%) | 263 (7.8%) |
| $15,000 to $17,499 | 66 (2.0%) | 83 (2.5%) |
| $17,500 to $19,999 | 63 (1.9%) | 93 (2.8%) |
| $20,000 to $22,499 | 113 (3.4%) | 118 (3.5%) |
| $22,500 to $24,999 | 135 (4.1%) | 83 (2.5%) |
| $25,000 to $29,999 | 197 (5.9%) | 115 (3.4%) |
| $30,000 to $34,999 | 291 (8.7%) | 167 (5.0%) |
| $35,000 to $39,999 | 291 (8.7%) | 204 (6.1%) |
| $40,000 to $44,999 | 449 (13.5%) | 163 (4.8%) |
| $45,000 to $49,999 | 187 (5.6%) | 181 (5.4%) |
| $50,000 to $54,999 | 93 (2.8%) | 126 (3.7%) |
| $55,000 to $64,999 | 351 (10.5%) | 373 (11.1%) |
| $65,000 to $74,999 | 117 (3.5%) | 602 (17.9%) |
| $75,000 to $99,999 | 380 (11.4%) | 136 (4.0%) |
| $100,000+ | 256 (7.7%) | 170 (5.1%) |
| Total | 3,330 (100.0%) | 3,366 (100.0%) |
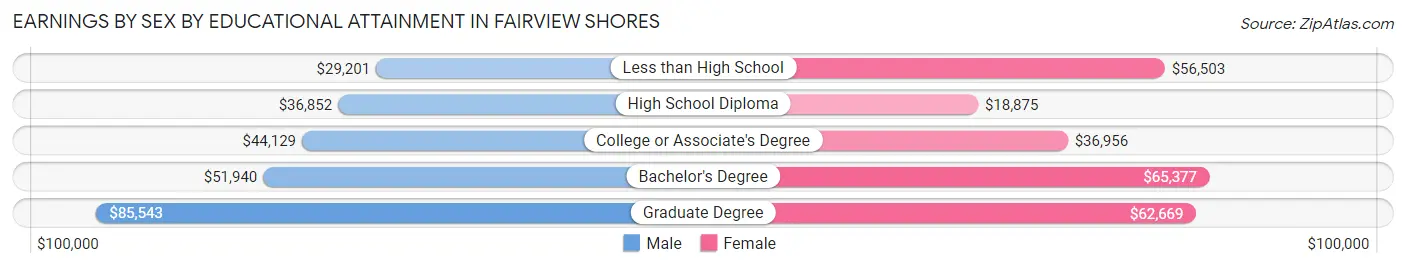
Earnings by Sex by Educational Attainment in Fairview Shores
Average earnings in Fairview Shores are $42,108 for men and $45,523 for women, a difference of 7.5%. Men with an educational attainment of graduate degree enjoy the highest average annual earnings of $85,543, while those with less than high school education earn the least with $29,201. Women with an educational attainment of bachelor's degree earn the most with the average annual earnings of $65,377, while those with high school diploma education have the smallest earnings of $18,875.
| Educational Attainment | Male Income | Female Income |
| Less than High School | $29,201 | $56,503 |
| High School Diploma | $36,852 | $18,875 |
| College or Associate's Degree | $44,129 | $36,956 |
| Bachelor's Degree | $51,940 | $65,377 |
| Graduate Degree | $85,543 | $62,669 |
| Total | $42,108 | $45,523 |
Family Income in Fairview Shores
Family Income Brackets in Fairview Shores
According to the Fairview Shores family income data, there are 538 families falling into the $100,000 to $149,999 income range, which is the most common income bracket and makes up 21.8% of all families. Conversely, the $10,000 to $14,999 income bracket is the least frequent group with only 35 families (1.4%) belonging to this category.
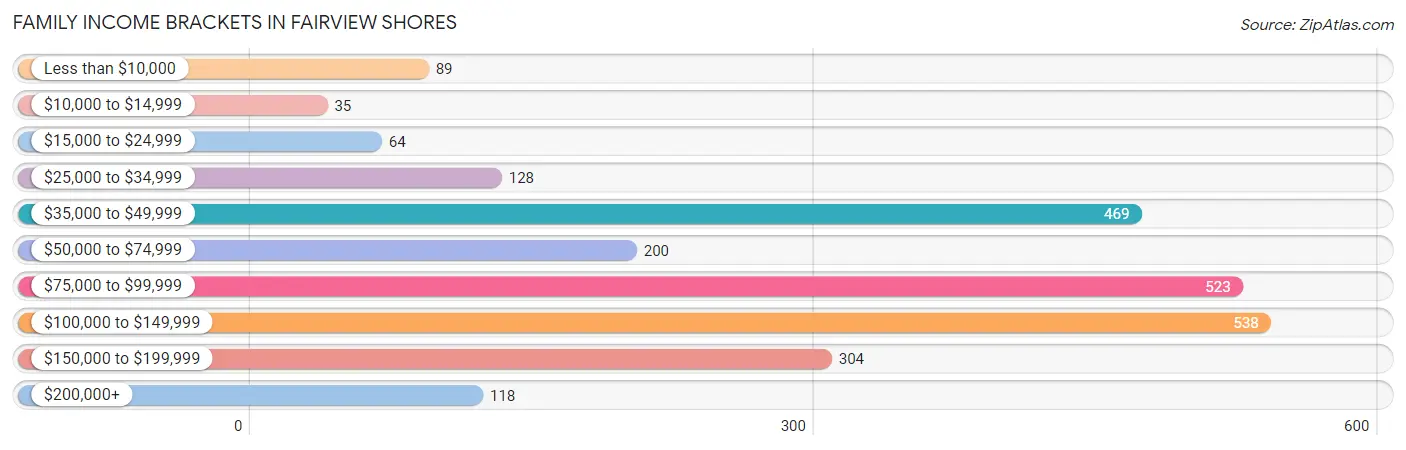
| Income Bracket | # Families | % Families |
| Less than $10,000 | 89 | 3.6% |
| $10,000 to $14,999 | 35 | 1.4% |
| $15,000 to $24,999 | 64 | 2.6% |
| $25,000 to $34,999 | 128 | 5.2% |
| $35,000 to $49,999 | 469 | 19.0% |
| $50,000 to $74,999 | 200 | 8.1% |
| $75,000 to $99,999 | 523 | 21.2% |
| $100,000 to $149,999 | 538 | 21.8% |
| $150,000 to $199,999 | 304 | 12.3% |
| $200,000+ | 118 | 4.8% |
Family Income by Famaliy Size in Fairview Shores
3-person families (528 | 21.4%) account for the highest median family income in Fairview Shores with $93,631 per family, while 2-person families (1,301 | 52.7%) have the highest median income of $43,716 per family member.
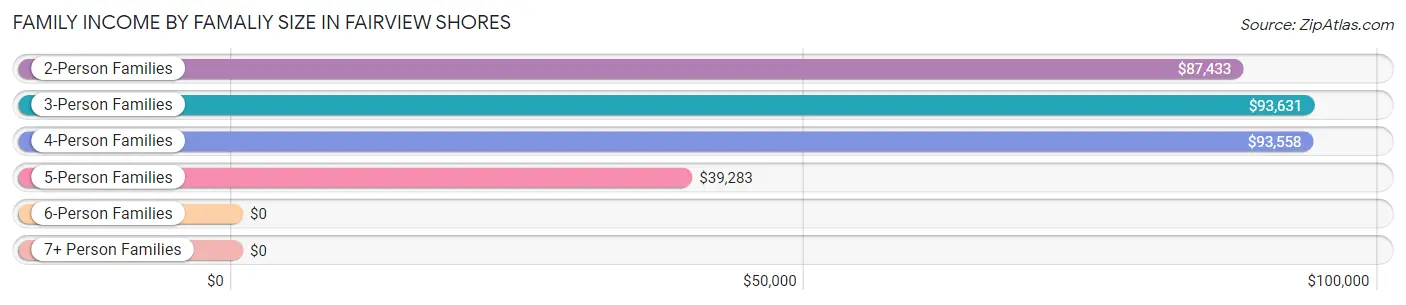
| Income Bracket | # Families | Median Income |
| 2-Person Families | 1,301 (52.7%) | $87,433 |
| 3-Person Families | 528 (21.4%) | $93,631 |
| 4-Person Families | 480 (19.5%) | $93,558 |
| 5-Person Families | 129 (5.2%) | $39,283 |
| 6-Person Families | 30 (1.2%) | $0 |
| 7+ Person Families | 0 (0.0%) | $0 |
| Total | 2,468 (100.0%) | $86,871 |
Family Income by Number of Earners in Fairview Shores
The median family income in Fairview Shores is $86,871, with families comprising 3+ earners (321) having the highest median family income of $143,431, while families with no earners (300) have the lowest median family income of $30,875, accounting for 13.0% and 12.2% of families, respectively.
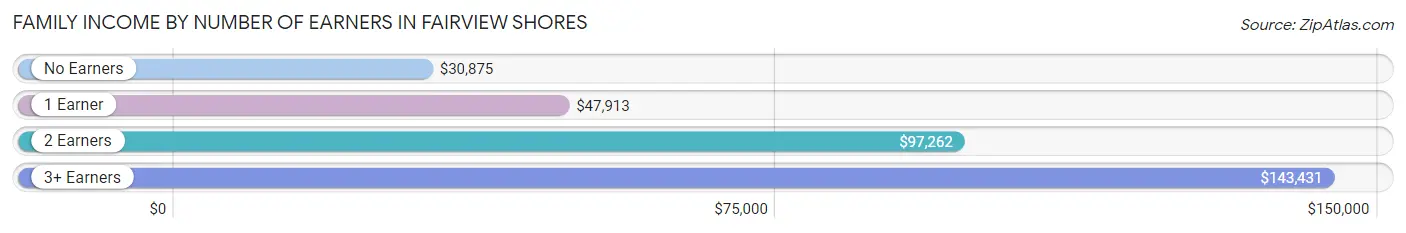
| Number of Earners | # Families | Median Income |
| No Earners | 300 (12.2%) | $30,875 |
| 1 Earner | 523 (21.2%) | $47,913 |
| 2 Earners | 1,324 (53.6%) | $97,262 |
| 3+ Earners | 321 (13.0%) | $143,431 |
| Total | 2,468 (100.0%) | $86,871 |
Household Income in Fairview Shores
Household Income Brackets in Fairview Shores
With 731 households falling in the category, the $100,000 to $149,999 income range is the most frequent in Fairview Shores, accounting for 16.7% of all households. In contrast, only 171 households (3.9%) fall into the $10,000 to $14,999 income bracket, making it the least populous group.
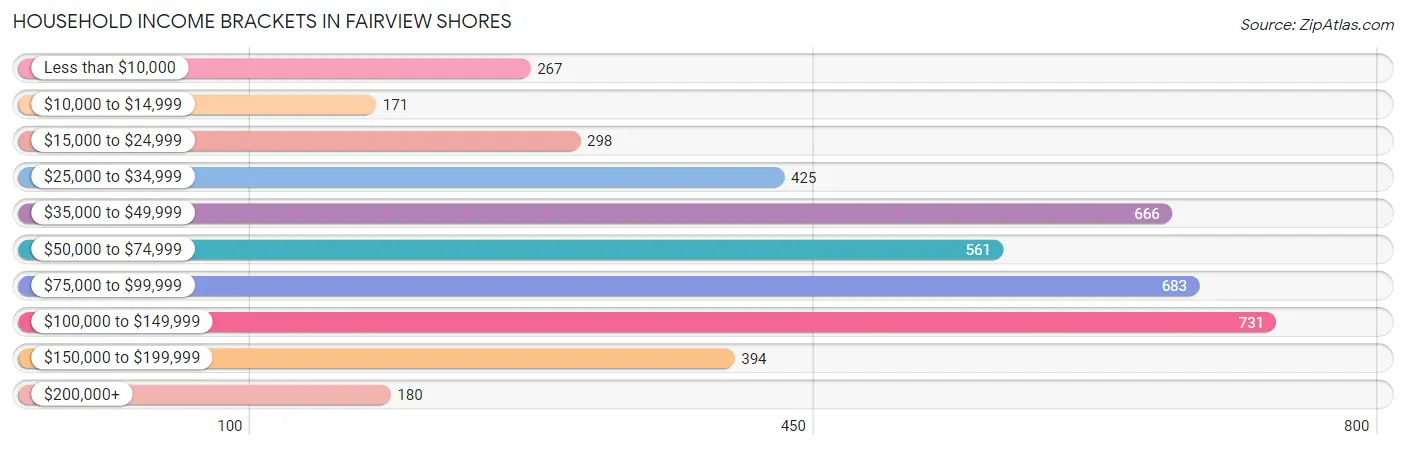
| Income Bracket | # Households | % Households |
| Less than $10,000 | 267 | 6.1% |
| $10,000 to $14,999 | 171 | 3.9% |
| $15,000 to $24,999 | 298 | 6.8% |
| $25,000 to $34,999 | 425 | 9.7% |
| $35,000 to $49,999 | 666 | 15.2% |
| $50,000 to $74,999 | 561 | 12.8% |
| $75,000 to $99,999 | 683 | 15.6% |
| $100,000 to $149,999 | 731 | 16.7% |
| $150,000 to $199,999 | 394 | 9.0% |
| $200,000+ | 180 | 4.1% |
Household Income by Householder Age in Fairview Shores
The median household income in Fairview Shores is $64,556, with the highest median household income of $86,750 found in the 45 to 64 years age bracket for the primary householder. A total of 2,021 households (46.2%) fall into this category. Meanwhile, the 15 to 24 years age bracket for the primary householder has the lowest median household income of $0, with 82 households (1.9%) in this group.
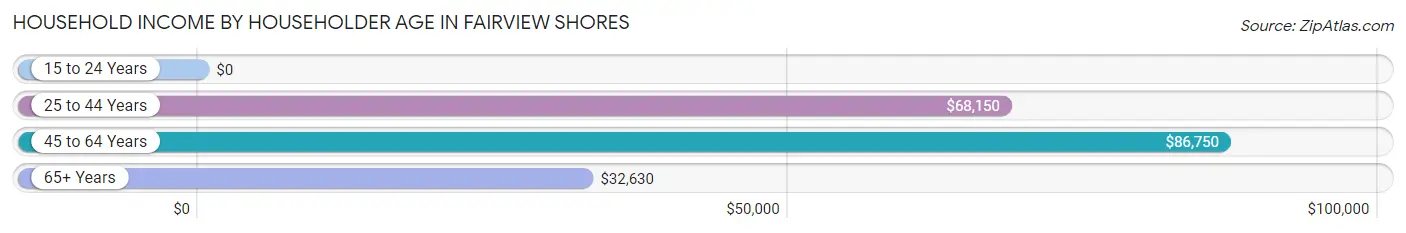
| Income Bracket | # Households | Median Income |
| 15 to 24 Years | 82 (1.9%) | $0 |
| 25 to 44 Years | 1,411 (32.2%) | $68,150 |
| 45 to 64 Years | 2,021 (46.2%) | $86,750 |
| 65+ Years | 865 (19.8%) | $32,630 |
| Total | 4,379 (100.0%) | $64,556 |
Poverty in Fairview Shores
Income Below Poverty by Sex and Age in Fairview Shores
With 11.0% poverty level for males and 12.4% for females among the residents of Fairview Shores, 45 to 54 year old males and 18 to 24 year old females are the most vulnerable to poverty, with 161 males (24.4%) and 98 females (34.0%) in their respective age groups living below the poverty level.
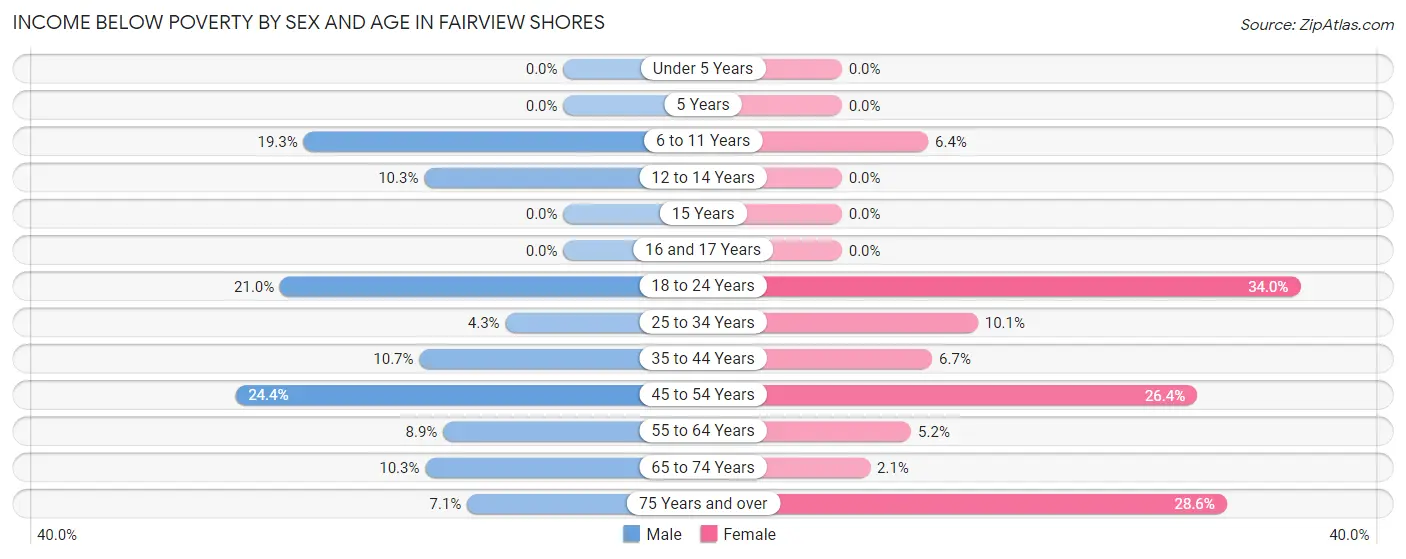
| Age Bracket | Male | Female |
| Under 5 Years | 0 (0.0%) | 0 (0.0%) |
| 5 Years | 0 (0.0%) | 0 (0.0%) |
| 6 to 11 Years | 76 (19.3%) | 20 (6.4%) |
| 12 to 14 Years | 25 (10.3%) | 0 (0.0%) |
| 15 Years | 0 (0.0%) | 0 (0.0%) |
| 16 and 17 Years | 0 (0.0%) | 0 (0.0%) |
| 18 to 24 Years | 57 (21.0%) | 98 (34.0%) |
| 25 to 34 Years | 46 (4.3%) | 125 (10.1%) |
| 35 to 44 Years | 71 (10.7%) | 46 (6.7%) |
| 45 to 54 Years | 161 (24.4%) | 231 (26.4%) |
| 55 to 64 Years | 80 (8.9%) | 47 (5.1%) |
| 65 to 74 Years | 41 (10.2%) | 6 (2.1%) |
| 75 Years and over | 14 (7.1%) | 118 (28.6%) |
| Total | 571 (11.0%) | 691 (12.4%) |
Income Above Poverty by Sex and Age in Fairview Shores
According to the poverty statistics in Fairview Shores, males aged under 5 years and females aged under 5 years are the age groups that are most secure financially, with 100.0% of males and 100.0% of females in these age groups living above the poverty line.
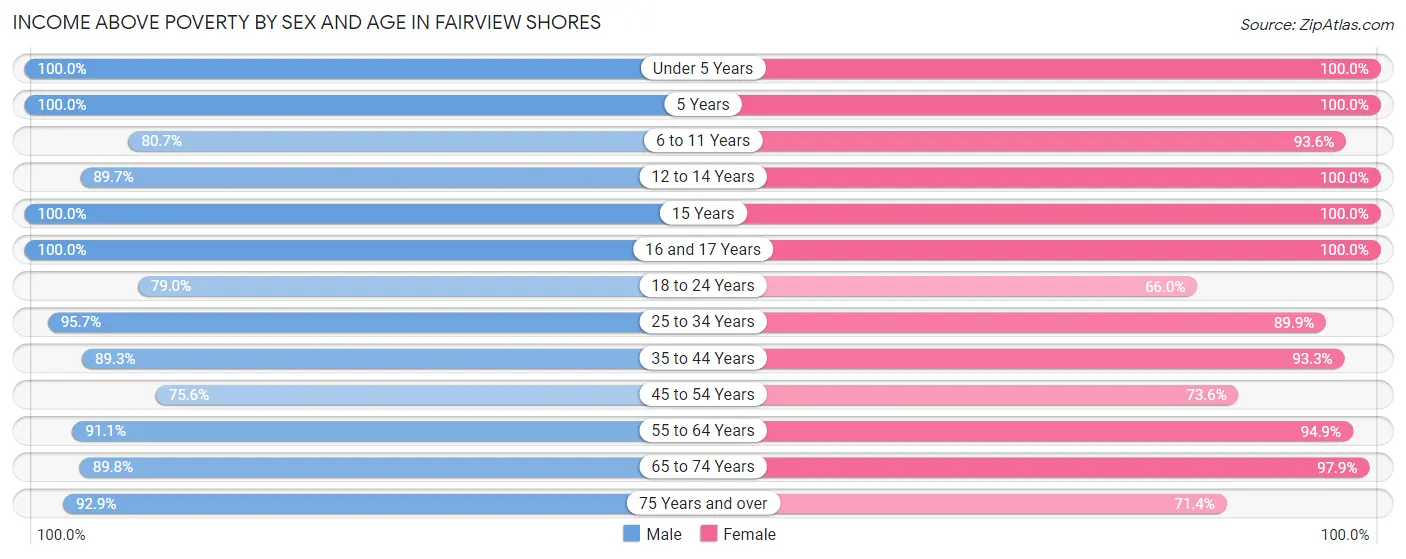
| Age Bracket | Male | Female |
| Under 5 Years | 304 (100.0%) | 387 (100.0%) |
| 5 Years | 17 (100.0%) | 26 (100.0%) |
| 6 to 11 Years | 318 (80.7%) | 292 (93.6%) |
| 12 to 14 Years | 217 (89.7%) | 37 (100.0%) |
| 15 Years | 57 (100.0%) | 61 (100.0%) |
| 16 and 17 Years | 23 (100.0%) | 37 (100.0%) |
| 18 to 24 Years | 214 (79.0%) | 190 (66.0%) |
| 25 to 34 Years | 1,023 (95.7%) | 1,113 (89.9%) |
| 35 to 44 Years | 593 (89.3%) | 640 (93.3%) |
| 45 to 54 Years | 500 (75.6%) | 645 (73.6%) |
| 55 to 64 Years | 817 (91.1%) | 865 (94.9%) |
| 65 to 74 Years | 359 (89.7%) | 280 (97.9%) |
| 75 Years and over | 182 (92.9%) | 295 (71.4%) |
| Total | 4,624 (89.0%) | 4,868 (87.6%) |
Income Below Poverty Among Married-Couple Families in Fairview Shores
The poverty statistics for married-couple families in Fairview Shores show that 3.2% or 55 of the total 1,729 families live below the poverty line. Families with 1 or 2 children have the highest poverty rate of 6.8%, comprising of 37 families. On the other hand, families with 3 or 4 children have the lowest poverty rate of 0.0%, which includes 0 families.
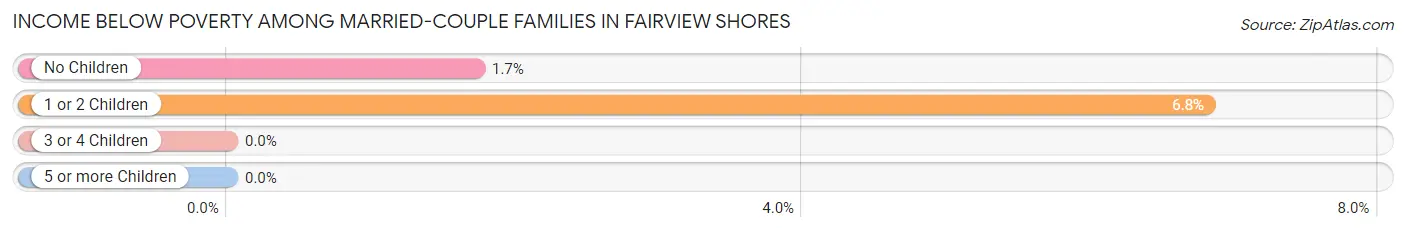
| Children | Above Poverty | Below Poverty |
| No Children | 1,030 (98.3%) | 18 (1.7%) |
| 1 or 2 Children | 506 (93.2%) | 37 (6.8%) |
| 3 or 4 Children | 138 (100.0%) | 0 (0.0%) |
| 5 or more Children | 0 (0.0%) | 0 (0.0%) |
| Total | 1,674 (96.8%) | 55 (3.2%) |
Income Below Poverty Among Single-Parent Households in Fairview Shores
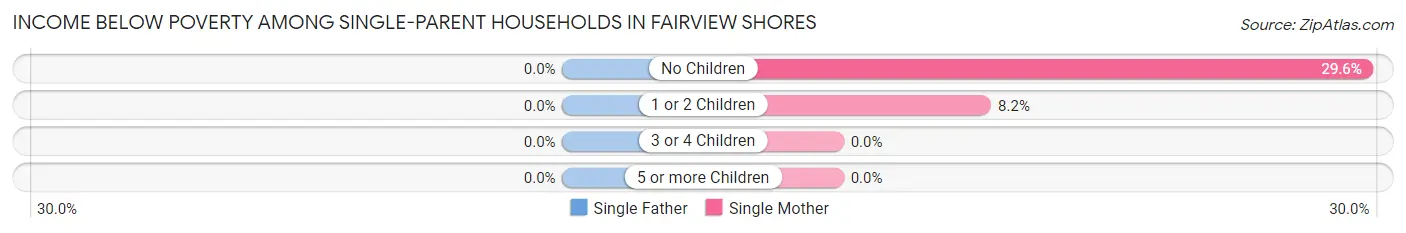
| Children | Single Father | Single Mother |
| No Children | 0 (0.0%) | 106 (29.6%) |
| 1 or 2 Children | 0 (0.0%) | 21 (8.2%) |
| 3 or 4 Children | 0 (0.0%) | 0 (0.0%) |
| 5 or more Children | 0 (0.0%) | 0 (0.0%) |
| Total | 0 (0.0%) | 127 (20.7%) |
Income Below Poverty Among Married-Couple vs Single-Parent Households in Fairview Shores
The poverty data for Fairview Shores shows that 55 of the married-couple family households (3.2%) and 127 of the single-parent households (17.2%) are living below the poverty level. Within the married-couple family households, those with 1 or 2 children have the highest poverty rate, with 37 households (6.8%) falling below the poverty line. Among the single-parent households, those with no children have the highest poverty rate, with 106 household (25.2%) living below poverty.
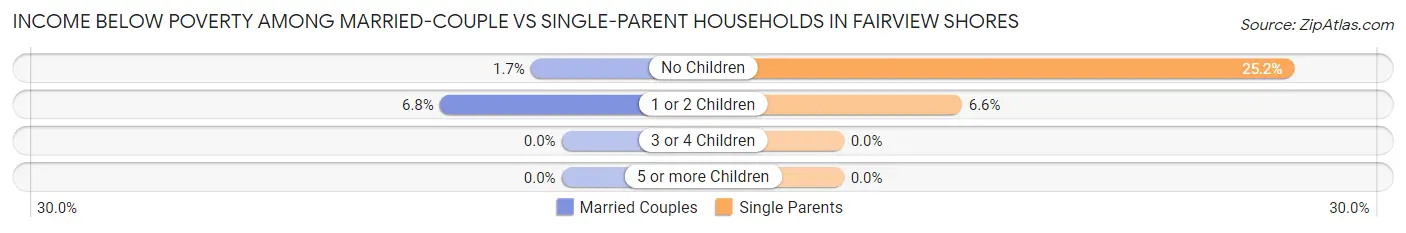
| Children | Married-Couple Families | Single-Parent Households |
| No Children | 18 (1.7%) | 106 (25.2%) |
| 1 or 2 Children | 37 (6.8%) | 21 (6.6%) |
| 3 or 4 Children | 0 (0.0%) | 0 (0.0%) |
| 5 or more Children | 0 (0.0%) | 0 (0.0%) |
| Total | 55 (3.2%) | 127 (17.2%) |
Race in Fairview Shores
The most populous races in Fairview Shores are White / Caucasian (6,358 | 57.7%), Black / African American (2,439 | 22.2%), and Hispanic or Latino (2,343 | 21.3%).
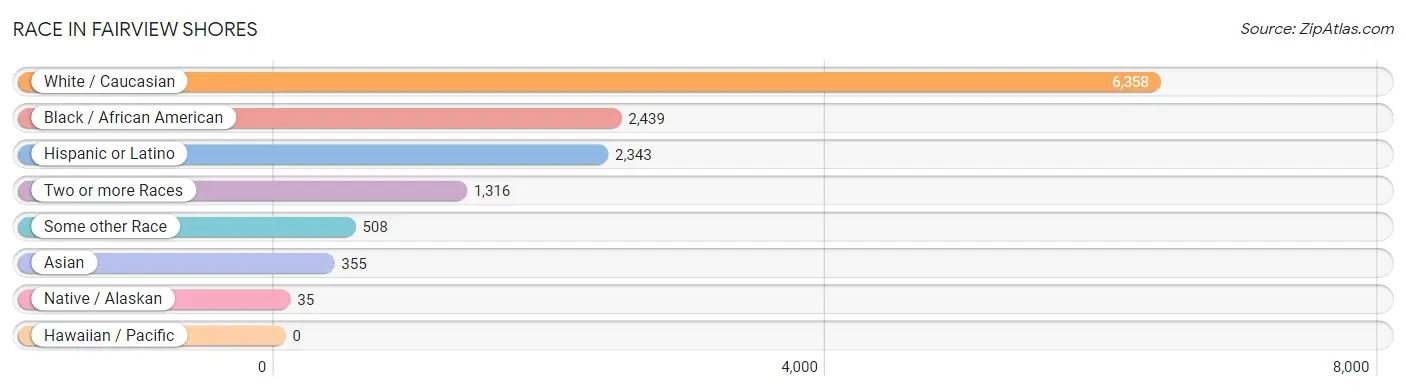
| Race | # Population | % Population |
| Asian | 355 | 3.2% |
| Black / African American | 2,439 | 22.2% |
| Hawaiian / Pacific | 0 | 0.0% |
| Hispanic or Latino | 2,343 | 21.3% |
| Native / Alaskan | 35 | 0.3% |
| White / Caucasian | 6,358 | 57.7% |
| Two or more Races | 1,316 | 11.9% |
| Some other Race | 508 | 4.6% |
| Total | 11,011 | 100.0% |
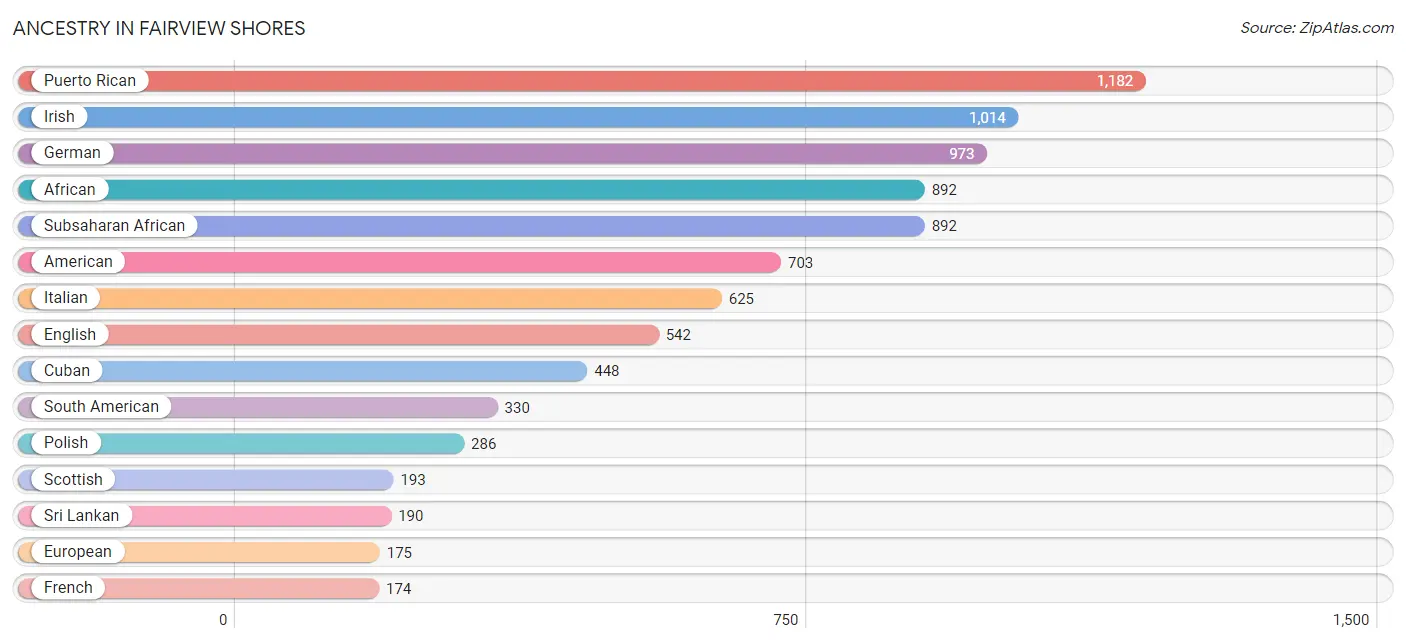
Ancestry in Fairview Shores
The most populous ancestries reported in Fairview Shores are Puerto Rican (1,182 | 10.7%), Irish (1,014 | 9.2%), German (973 | 8.8%), African (892 | 8.1%), and Subsaharan African (892 | 8.1%), together accounting for 45.0% of all Fairview Shores residents.
| Ancestry | # Population | % Population |
| African | 892 | 8.1% |
| American | 703 | 6.4% |
| Arab | 29 | 0.3% |
| Argentinean | 30 | 0.3% |
| Austrian | 20 | 0.2% |
| Bahamian | 58 | 0.5% |
| Brazilian | 25 | 0.2% |
| British | 7 | 0.1% |
| Burmese | 22 | 0.2% |
| Central American | 172 | 1.6% |
| Central American Indian | 44 | 0.4% |
| Cherokee | 29 | 0.3% |
| Colombian | 121 | 1.1% |
| Cuban | 448 | 4.1% |
| Czech | 47 | 0.4% |
| Czechoslovakian | 11 | 0.1% |
| Dominican | 78 | 0.7% |
| Dutch | 9 | 0.1% |
| Eastern European | 54 | 0.5% |
| Ecuadorian | 44 | 0.4% |
| Egyptian | 9 | 0.1% |
| English | 542 | 4.9% |
| European | 175 | 1.6% |
| French | 174 | 1.6% |
| French Canadian | 31 | 0.3% |
| German | 973 | 8.8% |
| Greek | 23 | 0.2% |
| Guatemalan | 84 | 0.8% |
| Guyanese | 32 | 0.3% |
| Haitian | 71 | 0.6% |
| Hopi | 10 | 0.1% |
| Hungarian | 11 | 0.1% |
| Indian (Asian) | 22 | 0.2% |
| Irish | 1,014 | 9.2% |
| Israeli | 21 | 0.2% |
| Italian | 625 | 5.7% |
| Jamaican | 39 | 0.4% |
| Korean | 161 | 1.5% |
| Lebanese | 13 | 0.1% |
| Mexican | 115 | 1.0% |
| Nicaraguan | 41 | 0.4% |
| Norwegian | 96 | 0.9% |
| Pakistani | 25 | 0.2% |
| Panamanian | 47 | 0.4% |
| Pennsylvania German | 9 | 0.1% |
| Peruvian | 115 | 1.0% |
| Polish | 286 | 2.6% |
| Pueblo | 10 | 0.1% |
| Puerto Rican | 1,182 | 10.7% |
| Russian | 26 | 0.2% |
| Scotch-Irish | 58 | 0.5% |
| Scottish | 193 | 1.8% |
| Slovak | 13 | 0.1% |
| South American | 330 | 3.0% |
| Sri Lankan | 190 | 1.7% |
| Subsaharan African | 892 | 8.1% |
| Swedish | 62 | 0.6% |
| Syrian | 7 | 0.1% |
| Thai | 7 | 0.1% |
| Turkish | 9 | 0.1% |
| Uruguayan | 8 | 0.1% |
| Venezuelan | 12 | 0.1% |
| Welsh | 64 | 0.6% | View All 63 Rows |
Immigrants in Fairview Shores
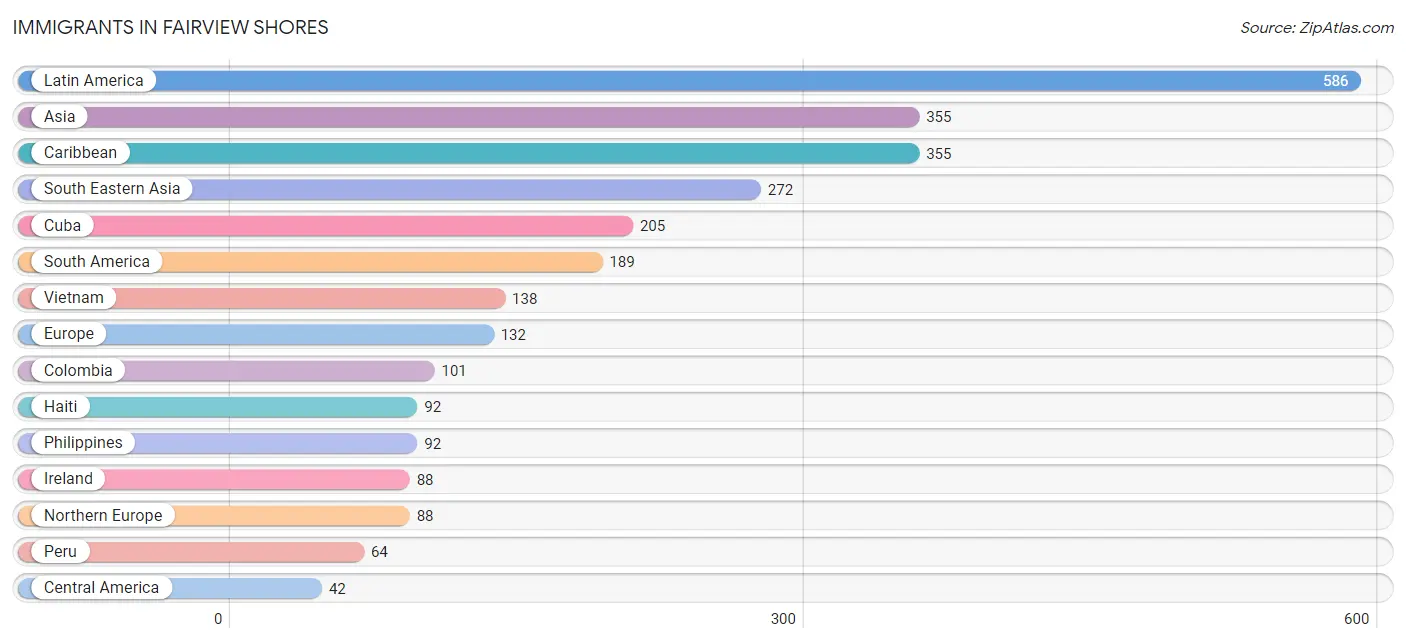
The most numerous immigrant groups reported in Fairview Shores came from Latin America (586 | 5.3%), Asia (355 | 3.2%), Caribbean (355 | 3.2%), South Eastern Asia (272 | 2.5%), and Cuba (205 | 1.9%), together accounting for 16.1% of all Fairview Shores residents.
| Immigration Origin | # Population | % Population |
| Argentina | 16 | 0.2% |
| Asia | 355 | 3.2% |
| Bahamas | 23 | 0.2% |
| Canada | 9 | 0.1% |
| Caribbean | 355 | 3.2% |
| Central America | 42 | 0.4% |
| China | 18 | 0.2% |
| Colombia | 101 | 0.9% |
| Cuba | 205 | 1.9% |
| Dominican Republic | 16 | 0.2% |
| Eastern Asia | 40 | 0.4% |
| Eastern Europe | 8 | 0.1% |
| Europe | 132 | 1.2% |
| Germany | 36 | 0.3% |
| Guatemala | 19 | 0.2% |
| Haiti | 92 | 0.8% |
| India | 7 | 0.1% |
| Ireland | 88 | 0.8% |
| Israel | 21 | 0.2% |
| Jamaica | 19 | 0.2% |
| Korea | 22 | 0.2% |
| Latin America | 586 | 5.3% |
| Mexico | 12 | 0.1% |
| Nicaragua | 11 | 0.1% |
| Northern Europe | 88 | 0.8% |
| Peru | 64 | 0.6% |
| Philippines | 92 | 0.8% |
| Russia | 8 | 0.1% |
| South America | 189 | 1.7% |
| South Central Asia | 7 | 0.1% |
| South Eastern Asia | 272 | 2.5% |
| Syria | 15 | 0.1% |
| Taiwan | 18 | 0.2% |
| Thailand | 42 | 0.4% |
| Uruguay | 8 | 0.1% |
| Vietnam | 138 | 1.3% |
| Western Asia | 36 | 0.3% |
| Western Europe | 36 | 0.3% | View All 38 Rows |
Sex and Age in Fairview Shores
Sex and Age in Fairview Shores
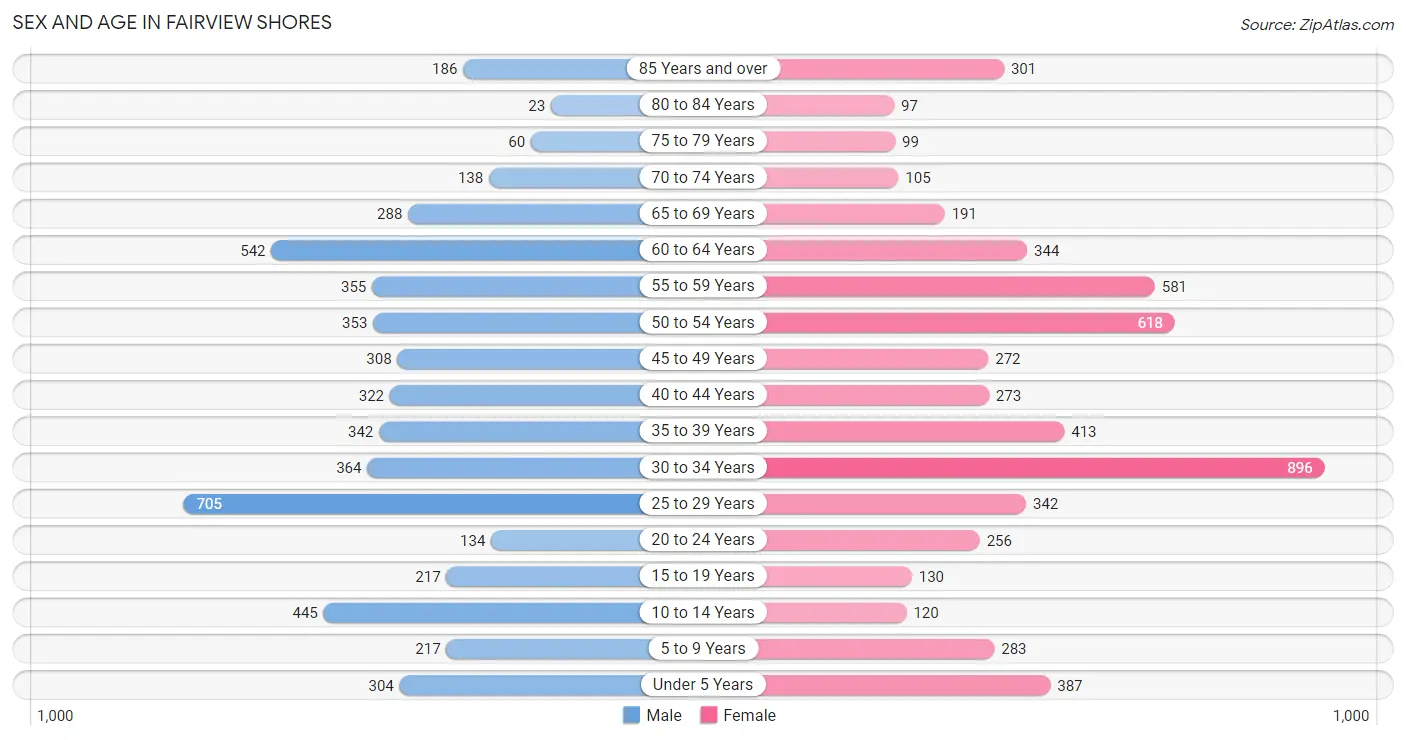
The most populous age groups in Fairview Shores are 25 to 29 Years (705 | 13.3%) for men and 30 to 34 Years (896 | 15.7%) for women.
| Age Bracket | Male | Female |
| Under 5 Years | 304 (5.7%) | 387 (6.8%) |
| 5 to 9 Years | 217 (4.1%) | 283 (5.0%) |
| 10 to 14 Years | 445 (8.4%) | 120 (2.1%) |
| 15 to 19 Years | 217 (4.1%) | 130 (2.3%) |
| 20 to 24 Years | 134 (2.5%) | 256 (4.5%) |
| 25 to 29 Years | 705 (13.3%) | 342 (6.0%) |
| 30 to 34 Years | 364 (6.9%) | 896 (15.7%) |
| 35 to 39 Years | 342 (6.5%) | 413 (7.2%) |
| 40 to 44 Years | 322 (6.1%) | 273 (4.8%) |
| 45 to 49 Years | 308 (5.8%) | 272 (4.8%) |
| 50 to 54 Years | 353 (6.7%) | 618 (10.8%) |
| 55 to 59 Years | 355 (6.7%) | 581 (10.2%) |
| 60 to 64 Years | 542 (10.2%) | 344 (6.0%) |
| 65 to 69 Years | 288 (5.4%) | 191 (3.4%) |
| 70 to 74 Years | 138 (2.6%) | 105 (1.8%) |
| 75 to 79 Years | 60 (1.1%) | 99 (1.7%) |
| 80 to 84 Years | 23 (0.4%) | 97 (1.7%) |
| 85 Years and over | 186 (3.5%) | 301 (5.3%) |
| Total | 5,303 (100.0%) | 5,708 (100.0%) |
Families and Households in Fairview Shores
Median Family Size in Fairview Shores
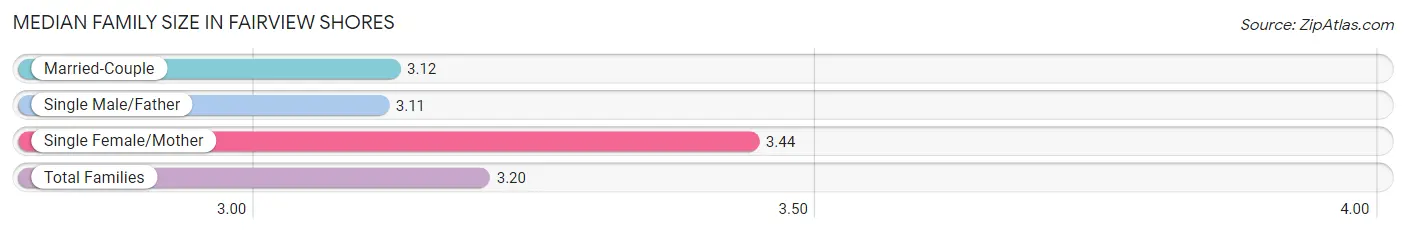
The median family size in Fairview Shores is 3.20 persons per family, with single female/mother families (613 | 24.8%) accounting for the largest median family size of 3.44 persons per family. On the other hand, single male/father families (126 | 5.1%) represent the smallest median family size with 3.11 persons per family.
| Family Type | # Families | Family Size |
| Married-Couple | 1,729 (70.1%) | 3.12 |
| Single Male/Father | 126 (5.1%) | 3.11 |
| Single Female/Mother | 613 (24.8%) | 3.44 |
| Total Families | 2,468 (100.0%) | 3.20 |
Median Household Size in Fairview Shores
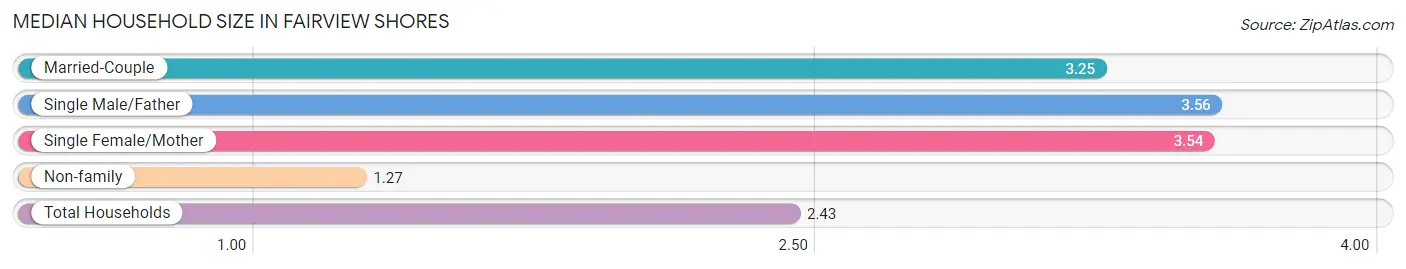
The median household size in Fairview Shores is 2.43 persons per household, with single male/father households (126 | 2.9%) accounting for the largest median household size of 3.56 persons per household. non-family households (1,911 | 43.6%) represent the smallest median household size with 1.27 persons per household.
| Household Type | # Households | Household Size |
| Married-Couple | 1,729 (39.5%) | 3.25 |
| Single Male/Father | 126 (2.9%) | 3.56 |
| Single Female/Mother | 613 (14.0%) | 3.54 |
| Non-family | 1,911 (43.6%) | 1.27 |
| Total Households | 4,379 (100.0%) | 2.43 |
Household Size by Marriage Status in Fairview Shores
Out of a total of 4,379 households in Fairview Shores, 2,468 (56.4%) are family households, while 1,911 (43.6%) are nonfamily households. The most numerous type of family households are 2-person households, comprising 1,161, and the most common type of nonfamily households are 1-person households, comprising 1,532.
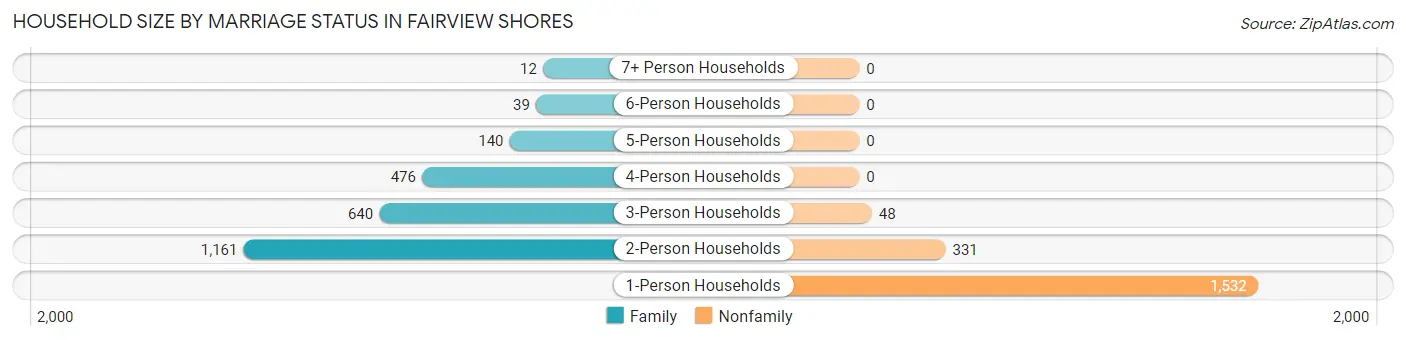
| Household Size | Family Households | Nonfamily Households |
| 1-Person Households | - | 1,532 (35.0%) |
| 2-Person Households | 1,161 (26.5%) | 331 (7.6%) |
| 3-Person Households | 640 (14.6%) | 48 (1.1%) |
| 4-Person Households | 476 (10.9%) | 0 (0.0%) |
| 5-Person Households | 140 (3.2%) | 0 (0.0%) |
| 6-Person Households | 39 (0.9%) | 0 (0.0%) |
| 7+ Person Households | 12 (0.3%) | 0 (0.0%) |
| Total | 2,468 (56.4%) | 1,911 (43.6%) |
Female Fertility in Fairview Shores
Fertility by Age in Fairview Shores
Average fertility rate in Fairview Shores is 61.0 births per 1,000 women. Women in the age bracket of 20 to 34 years have the highest fertility rate with 106.0 births per 1,000 women. Women in the age bracket of 20 to 34 years acount for 100.0% of all women with births.
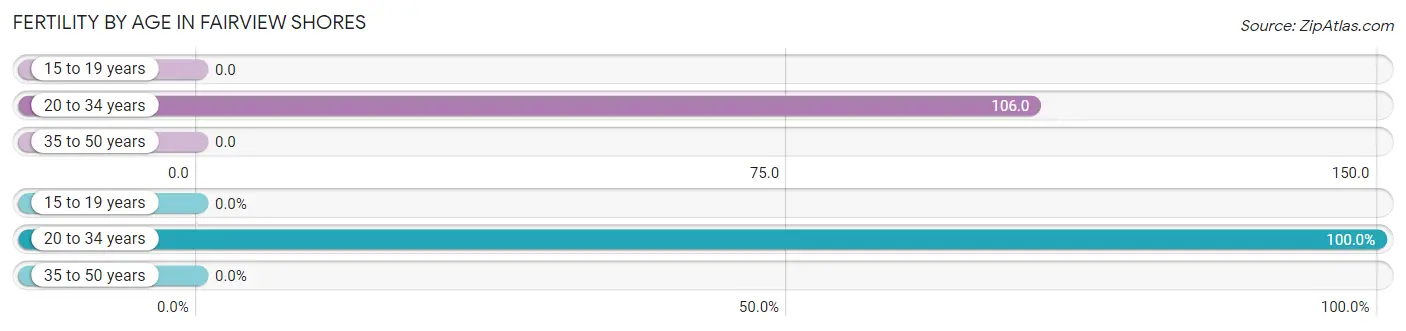
| Age Bracket | Women with Births | Births / 1,000 Women |
| 15 to 19 years | 0 (0.0%) | 0.0 |
| 20 to 34 years | 158 (100.0%) | 106.0 |
| 35 to 50 years | 0 (0.0%) | 0.0 |
| Total | 158 (100.0%) | 61.0 |
Fertility by Age by Marriage Status in Fairview Shores
47.5% of women with births (158) in Fairview Shores are married. The highest percentage of unmarried women with births falls into 20 to 34 years age bracket with 52.5% of them unmarried at the time of birth, while the lowest percentage of unmarried women with births belong to 20 to 34 years age bracket with 52.5% of them unmarried.
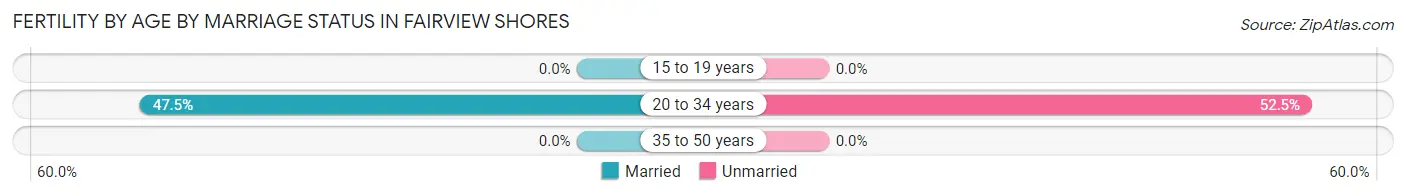
| Age Bracket | Married | Unmarried |
| 15 to 19 years | 0 (0.0%) | 0 (0.0%) |
| 20 to 34 years | 75 (47.5%) | 83 (52.5%) |
| 35 to 50 years | 0 (0.0%) | 0 (0.0%) |
| Total | 75 (47.5%) | 83 (52.5%) |
Fertility by Education in Fairview Shores
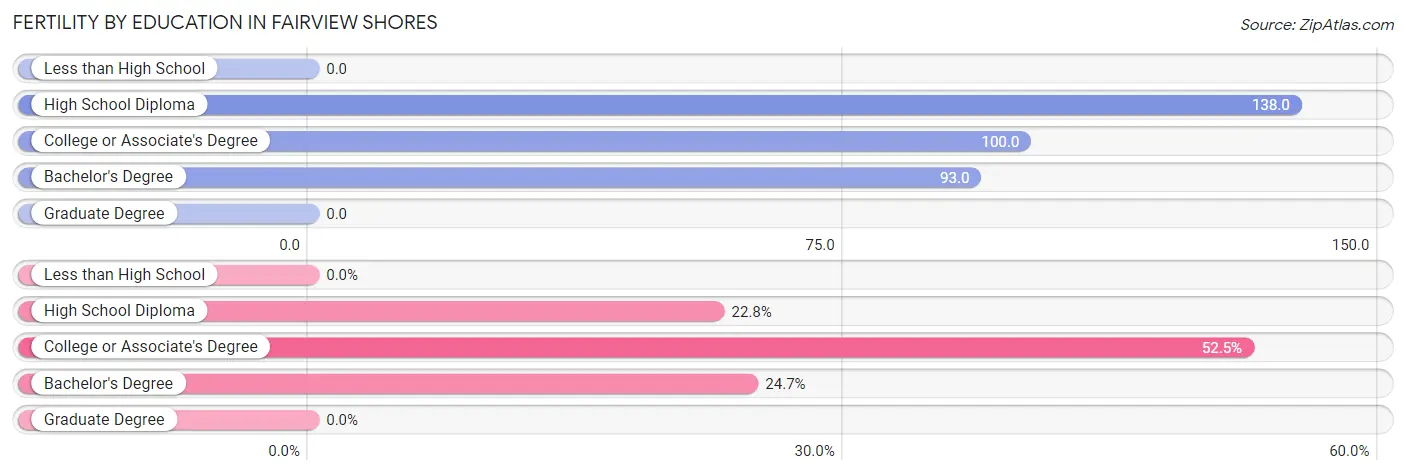
| Educational Attainment | Women with Births | Births / 1,000 Women |
| Less than High School | 0 (0.0%) | 0.0 |
| High School Diploma | 36 (22.8%) | 138.0 |
| College or Associate's Degree | 83 (52.5%) | 100.0 |
| Bachelor's Degree | 39 (24.7%) | 93.0 |
| Graduate Degree | 0 (0.0%) | 0.0 |
| Total | 158 (100.0%) | 61.0 |
Fertility by Education by Marriage Status in Fairview Shores
52.5% of women with births in Fairview Shores are unmarried. Women with the educational attainment of high school diploma are most likely to be married with 100.0% of them married at childbirth, while women with the educational attainment of college or associate's degree are least likely to be married with 100.0% of them unmarried at childbirth.

| Educational Attainment | Married | Unmarried |
| Less than High School | 0 (0.0%) | 0 (0.0%) |
| High School Diploma | 36 (100.0%) | 0 (0.0%) |
| College or Associate's Degree | 0 (0.0%) | 83 (100.0%) |
| Bachelor's Degree | 39 (100.0%) | 0 (0.0%) |
| Graduate Degree | 0 (0.0%) | 0 (0.0%) |
| Total | 75 (47.5%) | 83 (52.5%) |
Employment Characteristics in Fairview Shores
Employment by Class of Employer in Fairview Shores
Among the 6,341 employed individuals in Fairview Shores, private company employees (4,480 | 70.7%), not-for-profit organizations (617 | 9.7%), and self-employed (incorporated) (428 | 6.8%) make up the most common classes of employment.
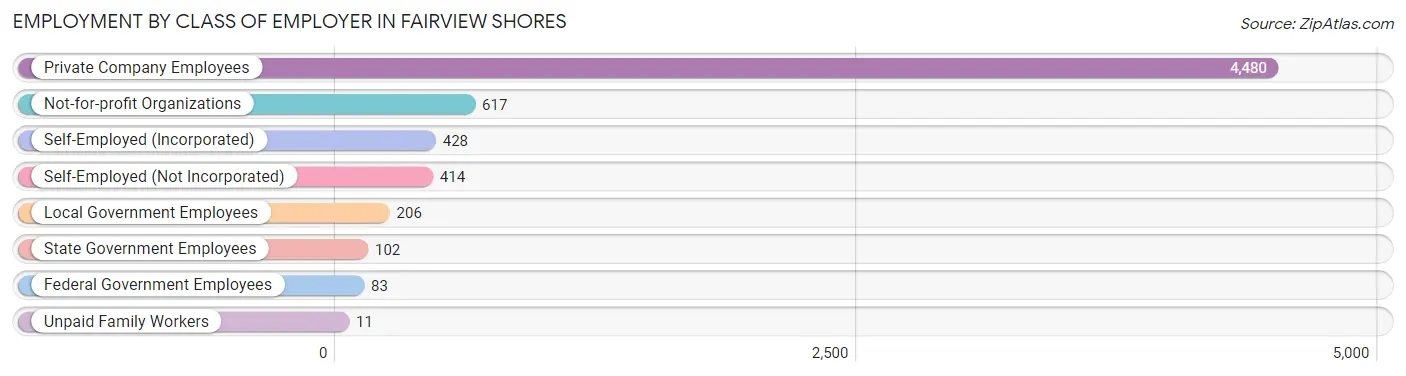
| Employer Class | # Employees | % Employees |
| Private Company Employees | 4,480 | 70.7% |
| Self-Employed (Incorporated) | 428 | 6.8% |
| Self-Employed (Not Incorporated) | 414 | 6.5% |
| Not-for-profit Organizations | 617 | 9.7% |
| Local Government Employees | 206 | 3.3% |
| State Government Employees | 102 | 1.6% |
| Federal Government Employees | 83 | 1.3% |
| Unpaid Family Workers | 11 | 0.2% |
| Total | 6,341 | 100.0% |
Employment Status by Age in Fairview Shores
According to the labor force statistics for Fairview Shores, out of the total population over 16 years of age (9,137), 72.4% or 6,615 individuals are in the labor force, with 2.6% or 172 of them unemployed. The age group with the highest labor force participation rate is 25 to 29 years, with 93.9% or 983 individuals in the labor force. Within the labor force, the 20 to 24 years age range has the highest percentage of unemployed individuals, with 8.1% or 25 of them being unemployed.
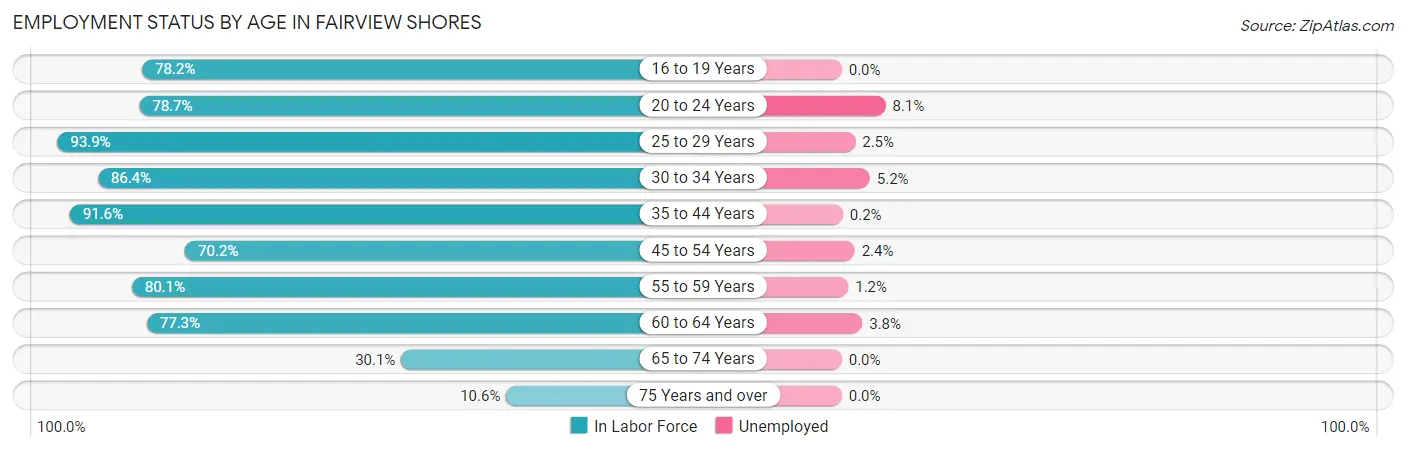
| Age Bracket | In Labor Force | Unemployed |
| 16 to 19 Years | 179 (78.2%) | 0 (0.0%) |
| 20 to 24 Years | 307 (78.7%) | 25 (8.1%) |
| 25 to 29 Years | 983 (93.9%) | 25 (2.5%) |
| 30 to 34 Years | 1,089 (86.4%) | 57 (5.2%) |
| 35 to 44 Years | 1,237 (91.6%) | 2 (0.2%) |
| 45 to 54 Years | 1,089 (70.2%) | 26 (2.4%) |
| 55 to 59 Years | 750 (80.1%) | 9 (1.2%) |
| 60 to 64 Years | 685 (77.3%) | 26 (3.8%) |
| 65 to 74 Years | 217 (30.1%) | 0 (0.0%) |
| 75 Years and over | 81 (10.6%) | 0 (0.0%) |
| Total | 6,615 (72.4%) | 172 (2.6%) |
Employment Status by Educational Attainment in Fairview Shores
According to labor force statistics for Fairview Shores, 83.0% of individuals (5,835) out of the total population between 25 and 64 years of age (7,030) are in the labor force, with 2.5% or 146 of them being unemployed. The group with the highest labor force participation rate are those with the educational attainment of high school diploma, with 87.8% or 1,515 individuals in the labor force. Within the labor force, individuals with high school diploma education have the highest percentage of unemployment, with 4.0% or 61 of them being unemployed.

| Educational Attainment | In Labor Force | Unemployed |
| Less than High School | 990 (86.0%) | 0 (0.0%) |
| High School Diploma | 1,515 (87.8%) | 69 (4.0%) |
| College / Associate Degree | 1,600 (73.9%) | 58 (2.7%) |
| Bachelor's Degree or higher | 1,726 (86.8%) | 48 (2.4%) |
| Total | 5,835 (83.0%) | 176 (2.5%) |
Employment Occupations by Sex in Fairview Shores
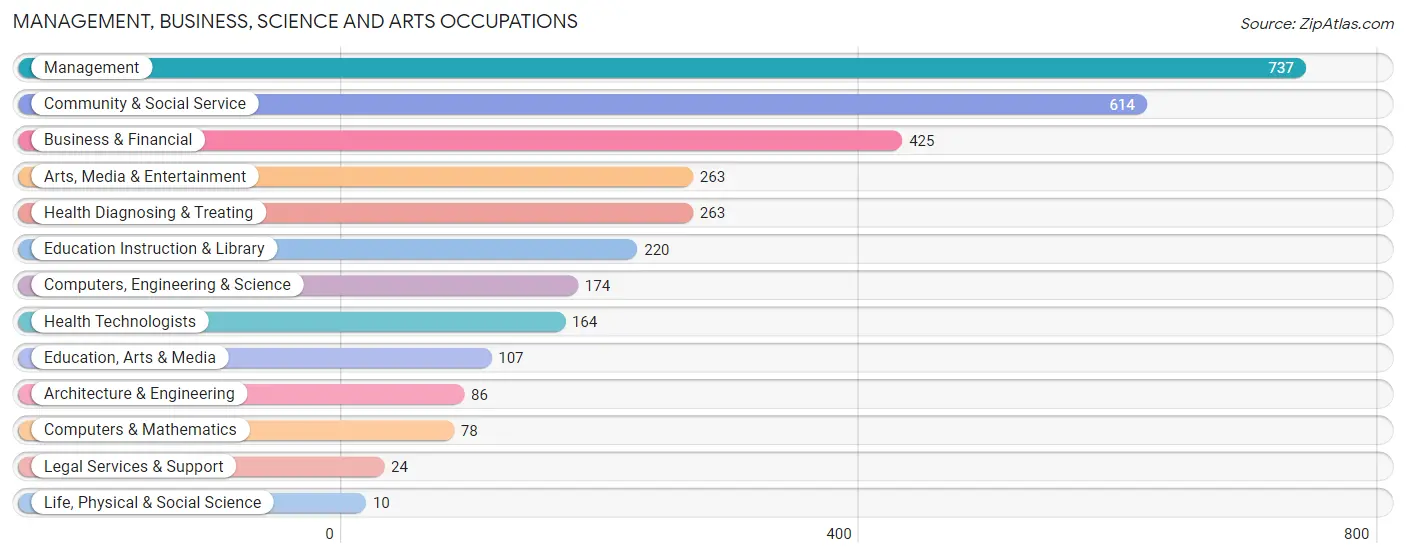
Management, Business, Science and Arts Occupations
The most common Management, Business, Science and Arts occupations in Fairview Shores are Management (737 | 11.4%), Community & Social Service (614 | 9.5%), Business & Financial (425 | 6.6%), Arts, Media & Entertainment (263 | 4.1%), and Health Diagnosing & Treating (263 | 4.1%).
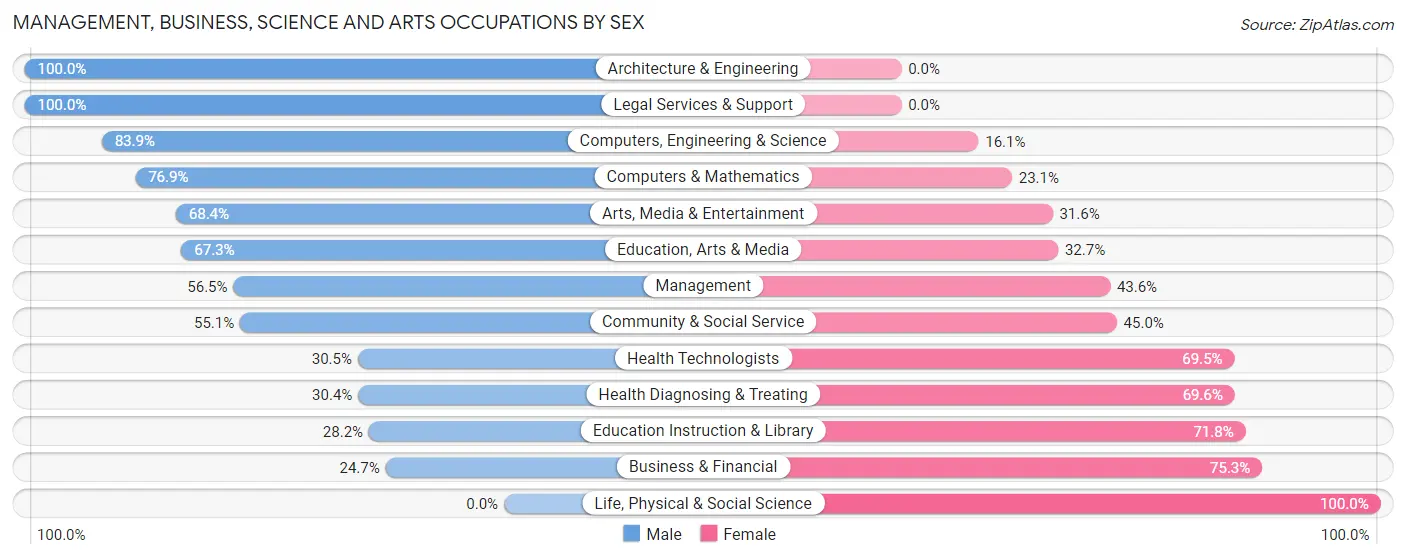
Management, Business, Science and Arts Occupations by Sex
Within the Management, Business, Science and Arts occupations in Fairview Shores, the most male-oriented occupations are Architecture & Engineering (100.0%), Legal Services & Support (100.0%), and Computers, Engineering & Science (83.9%), while the most female-oriented occupations are Life, Physical & Social Science (100.0%), Business & Financial (75.3%), and Education Instruction & Library (71.8%).
| Occupation | Male | Female |
| Management | 416 (56.5%) | 321 (43.5%) |
| Business & Financial | 105 (24.7%) | 320 (75.3%) |
| Computers, Engineering & Science | 146 (83.9%) | 28 (16.1%) |
| Computers & Mathematics | 60 (76.9%) | 18 (23.1%) |
| Architecture & Engineering | 86 (100.0%) | 0 (0.0%) |
| Life, Physical & Social Science | 0 (0.0%) | 10 (100.0%) |
| Community & Social Service | 338 (55.0%) | 276 (45.0%) |
| Education, Arts & Media | 72 (67.3%) | 35 (32.7%) |
| Legal Services & Support | 24 (100.0%) | 0 (0.0%) |
| Education Instruction & Library | 62 (28.2%) | 158 (71.8%) |
| Arts, Media & Entertainment | 180 (68.4%) | 83 (31.6%) |
| Health Diagnosing & Treating | 80 (30.4%) | 183 (69.6%) |
| Health Technologists | 50 (30.5%) | 114 (69.5%) |
| Total (Category) | 1,085 (49.0%) | 1,128 (51.0%) |
| Total (Overall) | 3,244 (50.3%) | 3,201 (49.7%) |
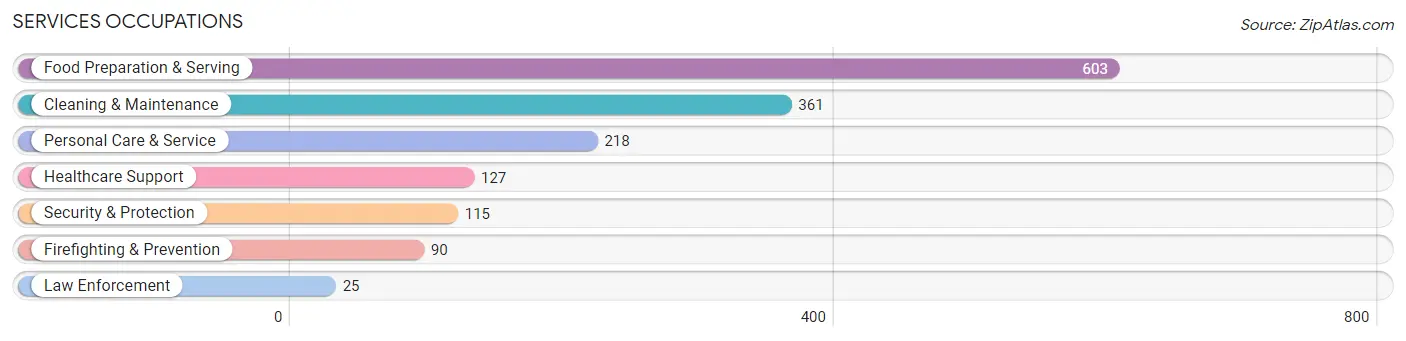
Services Occupations
The most common Services occupations in Fairview Shores are Food Preparation & Serving (603 | 9.4%), Cleaning & Maintenance (361 | 5.6%), Personal Care & Service (218 | 3.4%), Healthcare Support (127 | 2.0%), and Security & Protection (115 | 1.8%).
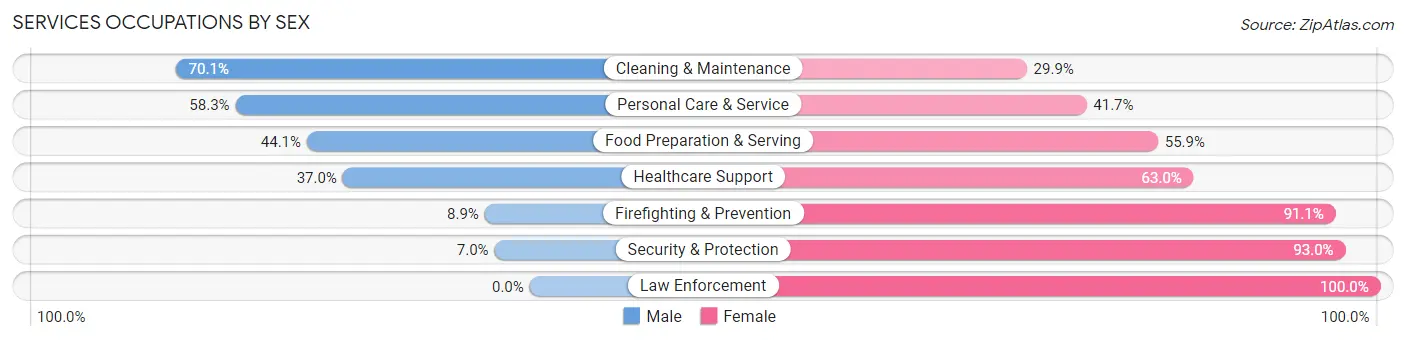
Services Occupations by Sex
Within the Services occupations in Fairview Shores, the most male-oriented occupations are Cleaning & Maintenance (70.1%), Personal Care & Service (58.3%), and Food Preparation & Serving (44.1%), while the most female-oriented occupations are Law Enforcement (100.0%), Security & Protection (93.0%), and Firefighting & Prevention (91.1%).
| Occupation | Male | Female |
| Healthcare Support | 47 (37.0%) | 80 (63.0%) |
| Security & Protection | 8 (7.0%) | 107 (93.0%) |
| Firefighting & Prevention | 8 (8.9%) | 82 (91.1%) |
| Law Enforcement | 0 (0.0%) | 25 (100.0%) |
| Food Preparation & Serving | 266 (44.1%) | 337 (55.9%) |
| Cleaning & Maintenance | 253 (70.1%) | 108 (29.9%) |
| Personal Care & Service | 127 (58.3%) | 91 (41.7%) |
| Total (Category) | 701 (49.2%) | 723 (50.8%) |
| Total (Overall) | 3,244 (50.3%) | 3,201 (49.7%) |
Sales and Office Occupations
The most common Sales and Office occupations in Fairview Shores are Sales & Related (986 | 15.3%), and Office & Administration (570 | 8.8%).

Sales and Office Occupations by Sex

| Occupation | Male | Female |
| Sales & Related | 421 (42.7%) | 565 (57.3%) |
| Office & Administration | 187 (32.8%) | 383 (67.2%) |
| Total (Category) | 608 (39.1%) | 948 (60.9%) |
| Total (Overall) | 3,244 (50.3%) | 3,201 (49.7%) |
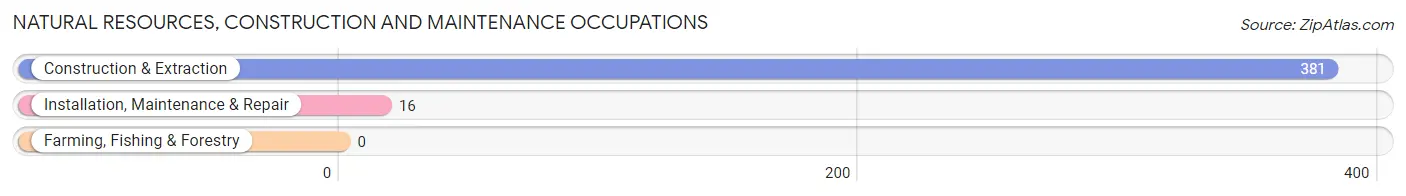
Natural Resources, Construction and Maintenance Occupations
The most common Natural Resources, Construction and Maintenance occupations in Fairview Shores are Construction & Extraction (381 | 5.9%), and Installation, Maintenance & Repair (16 | 0.3%).
Natural Resources, Construction and Maintenance Occupations by Sex

| Occupation | Male | Female |
| Farming, Fishing & Forestry | 0 (0.0%) | 0 (0.0%) |
| Construction & Extraction | 370 (97.1%) | 11 (2.9%) |
| Installation, Maintenance & Repair | 16 (100.0%) | 0 (0.0%) |
| Total (Category) | 386 (97.2%) | 11 (2.8%) |
| Total (Overall) | 3,244 (50.3%) | 3,201 (49.7%) |
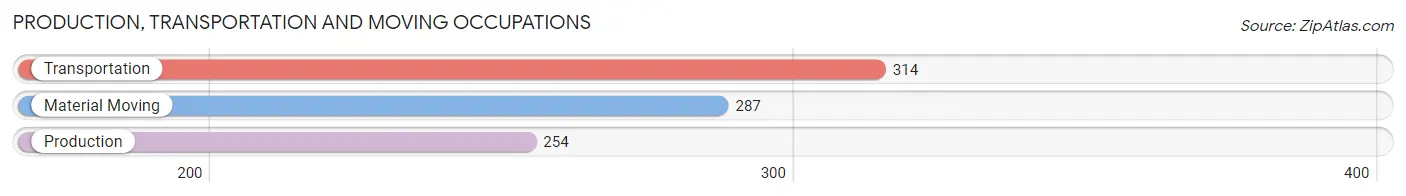
Production, Transportation and Moving Occupations
The most common Production, Transportation and Moving occupations in Fairview Shores are Transportation (314 | 4.9%), Material Moving (287 | 4.4%), and Production (254 | 3.9%).
Production, Transportation and Moving Occupations by Sex

| Occupation | Male | Female |
| Production | 143 (56.3%) | 111 (43.7%) |
| Transportation | 291 (92.7%) | 23 (7.3%) |
| Material Moving | 30 (10.4%) | 257 (89.5%) |
| Total (Category) | 464 (54.3%) | 391 (45.7%) |
| Total (Overall) | 3,244 (50.3%) | 3,201 (49.7%) |
Employment Industries by Sex in Fairview Shores
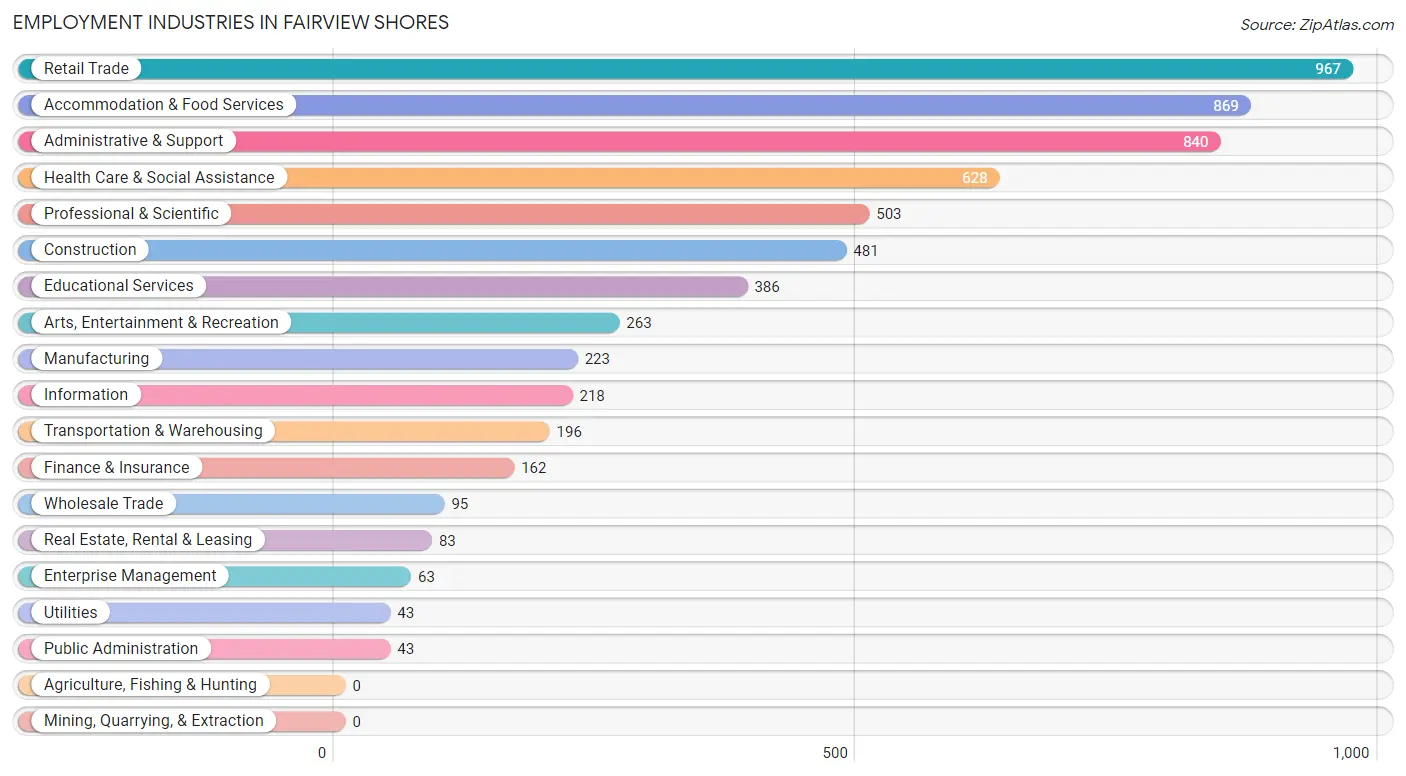
Employment Industries in Fairview Shores
The major employment industries in Fairview Shores include Retail Trade (967 | 15.0%), Accommodation & Food Services (869 | 13.5%), Administrative & Support (840 | 13.0%), Health Care & Social Assistance (628 | 9.7%), and Professional & Scientific (503 | 7.8%).
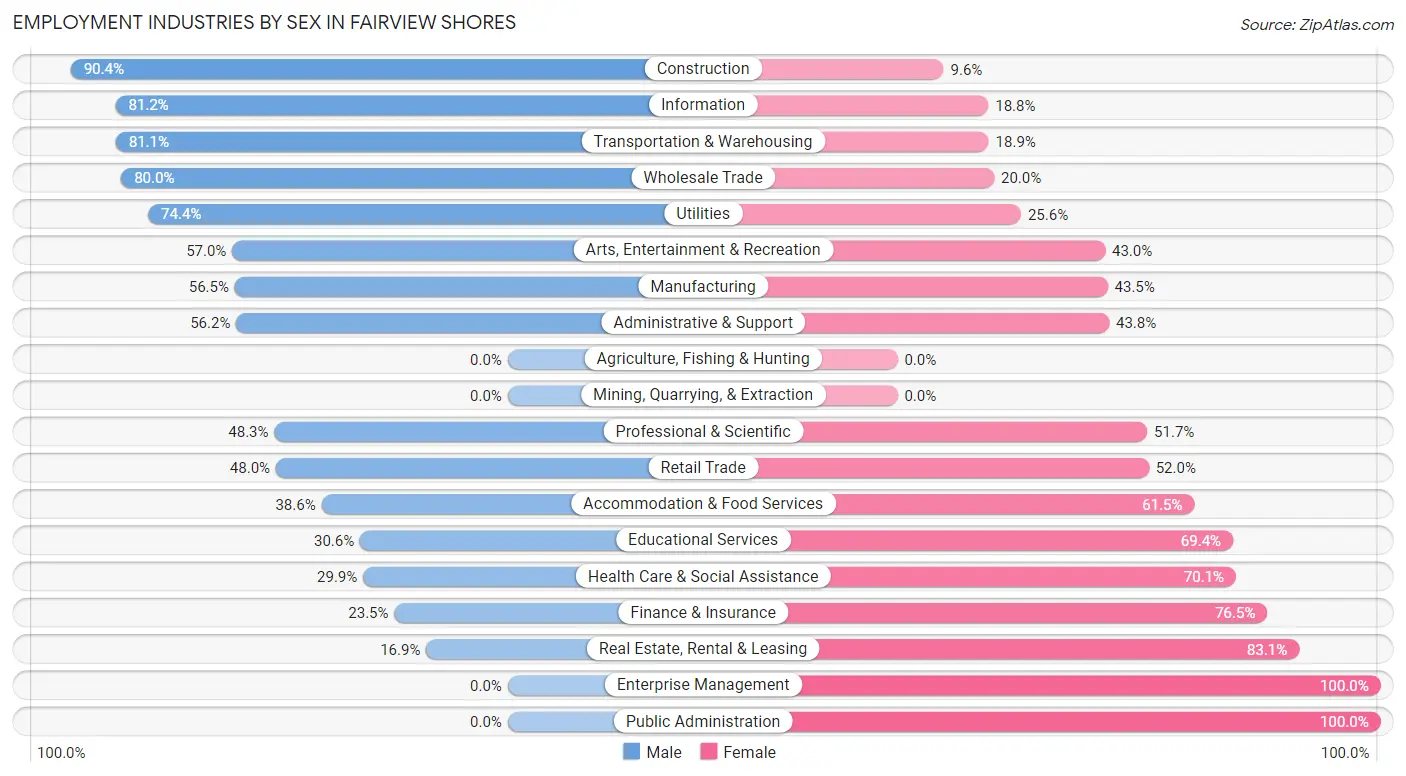
Employment Industries by Sex in Fairview Shores
The Fairview Shores industries that see more men than women are Construction (90.4%), Information (81.2%), and Transportation & Warehousing (81.1%), whereas the industries that tend to have a higher number of women are Enterprise Management (100.0%), Public Administration (100.0%), and Real Estate, Rental & Leasing (83.1%).
| Industry | Male | Female |
| Agriculture, Fishing & Hunting | 0 (0.0%) | 0 (0.0%) |
| Mining, Quarrying, & Extraction | 0 (0.0%) | 0 (0.0%) |
| Construction | 435 (90.4%) | 46 (9.6%) |
| Manufacturing | 126 (56.5%) | 97 (43.5%) |
| Wholesale Trade | 76 (80.0%) | 19 (20.0%) |
| Retail Trade | 464 (48.0%) | 503 (52.0%) |
| Transportation & Warehousing | 159 (81.1%) | 37 (18.9%) |
| Utilities | 32 (74.4%) | 11 (25.6%) |
| Information | 177 (81.2%) | 41 (18.8%) |
| Finance & Insurance | 38 (23.5%) | 124 (76.5%) |
| Real Estate, Rental & Leasing | 14 (16.9%) | 69 (83.1%) |
| Professional & Scientific | 243 (48.3%) | 260 (51.7%) |
| Enterprise Management | 0 (0.0%) | 63 (100.0%) |
| Administrative & Support | 472 (56.2%) | 368 (43.8%) |
| Educational Services | 118 (30.6%) | 268 (69.4%) |
| Health Care & Social Assistance | 188 (29.9%) | 440 (70.1%) |
| Arts, Entertainment & Recreation | 150 (57.0%) | 113 (43.0%) |
| Accommodation & Food Services | 335 (38.6%) | 534 (61.5%) |
| Public Administration | 0 (0.0%) | 43 (100.0%) |
| Total | 3,244 (50.3%) | 3,201 (49.7%) |
Education in Fairview Shores
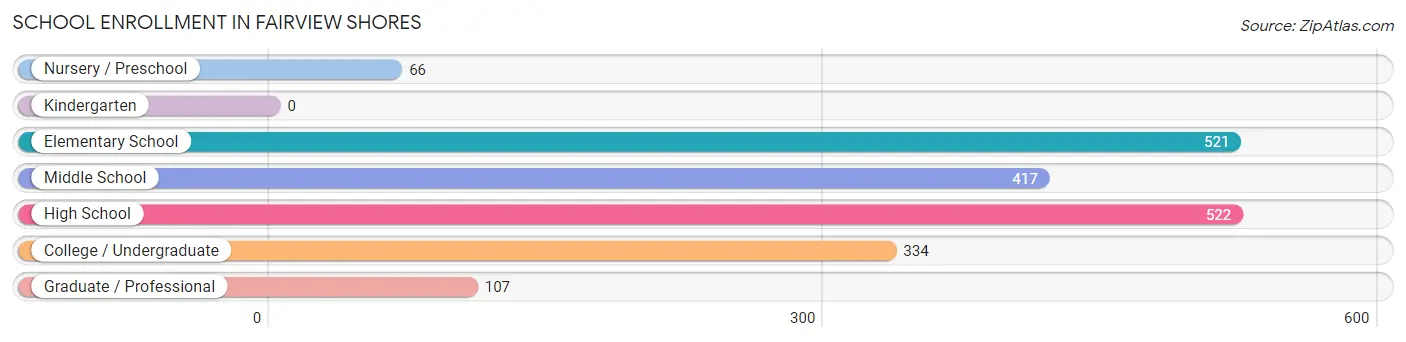
School Enrollment in Fairview Shores
The most common levels of schooling among the 1,967 students in Fairview Shores are high school (522 | 26.5%), elementary school (521 | 26.5%), and middle school (417 | 21.2%).
| School Level | # Students | % Students |
| Nursery / Preschool | 66 | 3.4% |
| Kindergarten | 0 | 0.0% |
| Elementary School | 521 | 26.5% |
| Middle School | 417 | 21.2% |
| High School | 522 | 26.5% |
| College / Undergraduate | 334 | 17.0% |
| Graduate / Professional | 107 | 5.4% |
| Total | 1,967 | 100.0% |
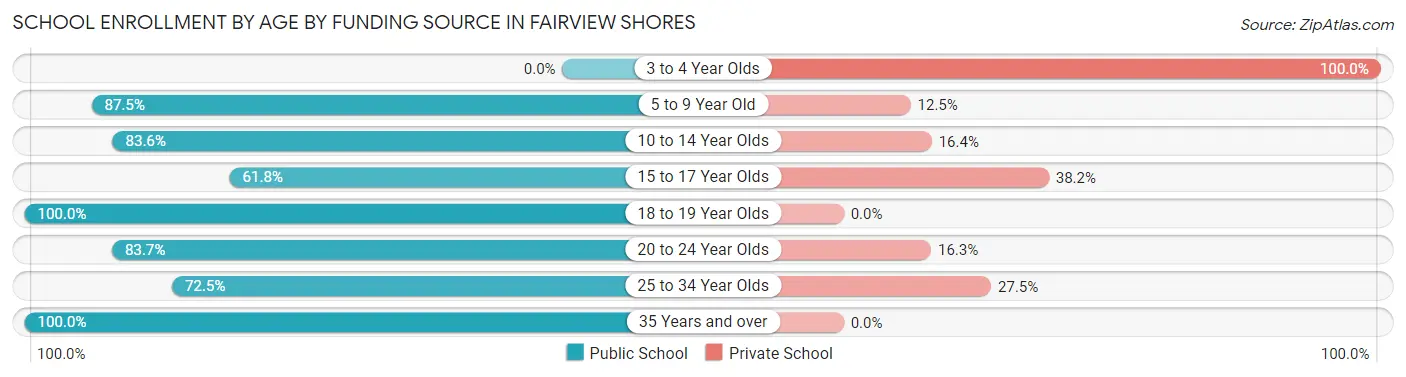
School Enrollment by Age by Funding Source in Fairview Shores
Out of a total of 1,967 students who are enrolled in schools in Fairview Shores, 413 (21.0%) attend a private institution, while the remaining 1,554 (79.0%) are enrolled in public schools. The age group of 3 to 4 year olds has the highest likelihood of being enrolled in private schools, with 49 (100.0% in the age bracket) enrolled. Conversely, the age group of 18 to 19 year olds has the lowest likelihood of being enrolled in a private school, with 57 (100.0% in the age bracket) attending a public institution.
| Age Bracket | Public School | Private School |
| 3 to 4 Year Olds | 0 (0.0%) | 49 (100.0%) |
| 5 to 9 Year Old | 407 (87.5%) | 58 (12.5%) |
| 10 to 14 Year Olds | 464 (83.6%) | 91 (16.4%) |
| 15 to 17 Year Olds | 110 (61.8%) | 68 (38.2%) |
| 18 to 19 Year Olds | 57 (100.0%) | 0 (0.0%) |
| 20 to 24 Year Olds | 72 (83.7%) | 14 (16.3%) |
| 25 to 34 Year Olds | 354 (72.5%) | 134 (27.5%) |
| 35 Years and over | 89 (100.0%) | 0 (0.0%) |
| Total | 1,554 (79.0%) | 413 (21.0%) |
Educational Attainment by Field of Study in Fairview Shores
Business (399 | 17.3%), education (238 | 10.3%), bio, nature & agricultural (225 | 9.7%), science & technology (182 | 7.9%), and psychology (174 | 7.5%) are the most common fields of study among 2,309 individuals in Fairview Shores who have obtained a bachelor's degree or higher.
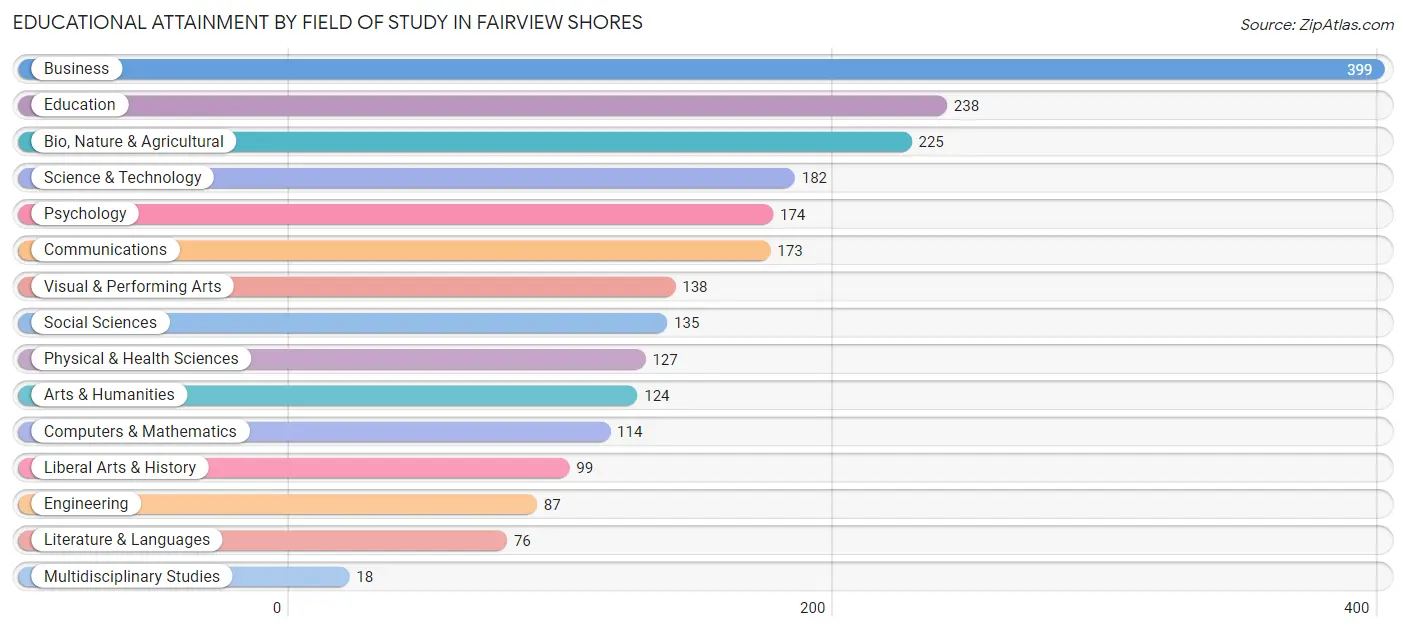
| Field of Study | # Graduates | % Graduates |
| Computers & Mathematics | 114 | 4.9% |
| Bio, Nature & Agricultural | 225 | 9.7% |
| Physical & Health Sciences | 127 | 5.5% |
| Psychology | 174 | 7.5% |
| Social Sciences | 135 | 5.9% |
| Engineering | 87 | 3.8% |
| Multidisciplinary Studies | 18 | 0.8% |
| Science & Technology | 182 | 7.9% |
| Business | 399 | 17.3% |
| Education | 238 | 10.3% |
| Literature & Languages | 76 | 3.3% |
| Liberal Arts & History | 99 | 4.3% |
| Visual & Performing Arts | 138 | 6.0% |
| Communications | 173 | 7.5% |
| Arts & Humanities | 124 | 5.4% |
| Total | 2,309 | 100.0% |
Transportation & Commute in Fairview Shores
Vehicle Availability by Sex in Fairview Shores
The most prevalent vehicle ownership categories in Fairview Shores are males with 2 vehicles (1,580, accounting for 50.5%) and females with 2 vehicles (1,193, making up 50.3%).
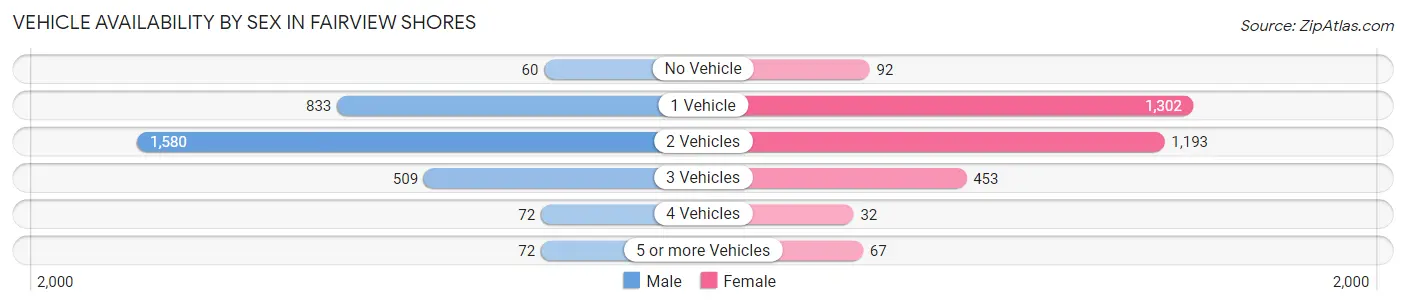
| Vehicles Available | Male | Female |
| No Vehicle | 60 (1.9%) | 92 (2.9%) |
| 1 Vehicle | 833 (26.7%) | 1,302 (41.5%) |
| 2 Vehicles | 1,580 (50.5%) | 1,193 (38.0%) |
| 3 Vehicles | 509 (16.3%) | 453 (14.4%) |
| 4 Vehicles | 72 (2.3%) | 32 (1.0%) |
| 5 or more Vehicles | 72 (2.3%) | 67 (2.1%) |
| Total | 3,126 (100.0%) | 3,139 (100.0%) |
Commute Time in Fairview Shores
The most frequently occuring commute durations in Fairview Shores are 10 to 14 minutes (1,210 commuters, 21.6%), 15 to 19 minutes (1,147 commuters, 20.5%), and 30 to 34 minutes (806 commuters, 14.4%).
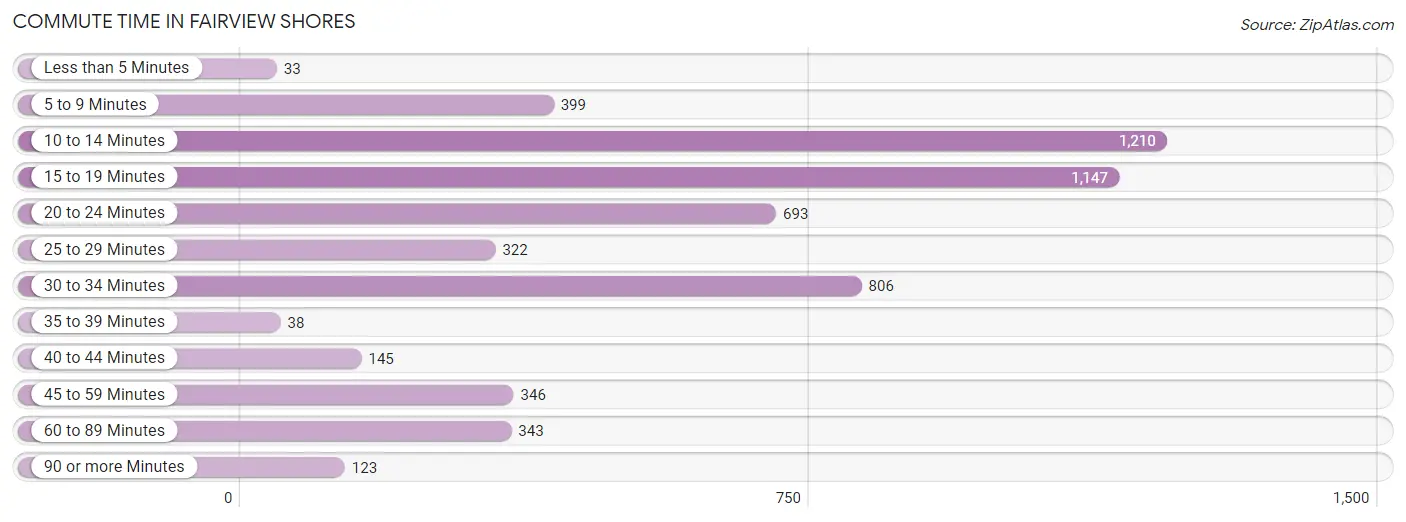
| Commute Time | # Commuters | % Commuters |
| Less than 5 Minutes | 33 | 0.6% |
| 5 to 9 Minutes | 399 | 7.1% |
| 10 to 14 Minutes | 1,210 | 21.6% |
| 15 to 19 Minutes | 1,147 | 20.5% |
| 20 to 24 Minutes | 693 | 12.4% |
| 25 to 29 Minutes | 322 | 5.7% |
| 30 to 34 Minutes | 806 | 14.4% |
| 35 to 39 Minutes | 38 | 0.7% |
| 40 to 44 Minutes | 145 | 2.6% |
| 45 to 59 Minutes | 346 | 6.2% |
| 60 to 89 Minutes | 343 | 6.1% |
| 90 or more Minutes | 123 | 2.2% |
Commute Time by Sex in Fairview Shores
The most common commute times in Fairview Shores are 30 to 34 minutes (493 commuters, 17.6%) for males and 10 to 14 minutes (721 commuters, 25.7%) for females.
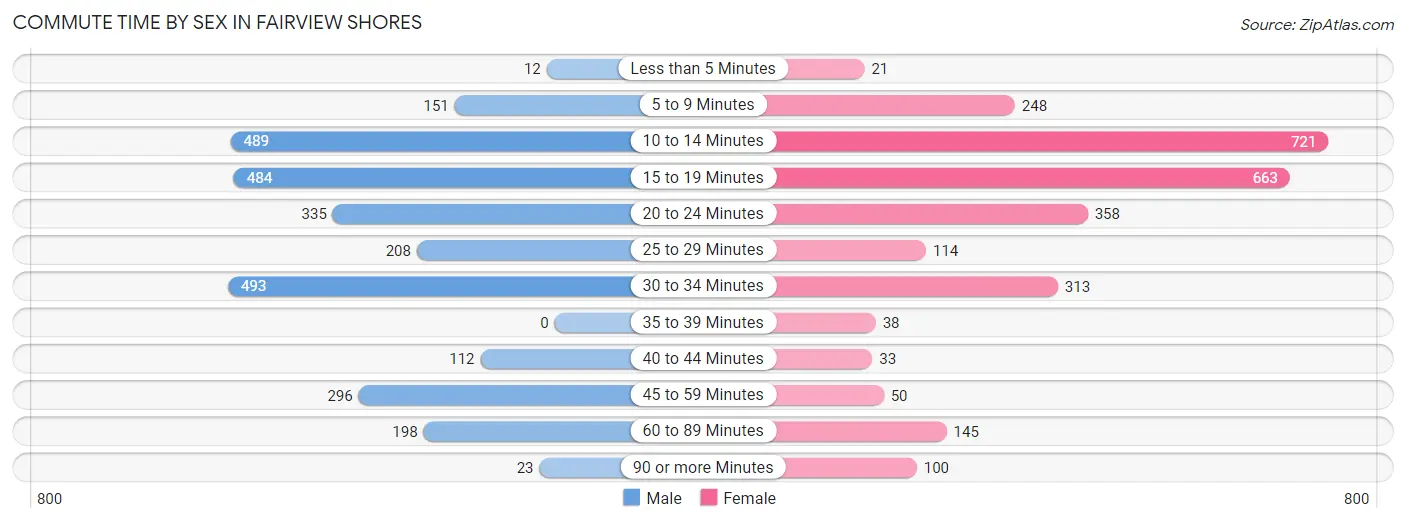
| Commute Time | Male | Female |
| Less than 5 Minutes | 12 (0.4%) | 21 (0.7%) |
| 5 to 9 Minutes | 151 (5.4%) | 248 (8.8%) |
| 10 to 14 Minutes | 489 (17.5%) | 721 (25.7%) |
| 15 to 19 Minutes | 484 (17.3%) | 663 (23.6%) |
| 20 to 24 Minutes | 335 (12.0%) | 358 (12.8%) |
| 25 to 29 Minutes | 208 (7.4%) | 114 (4.1%) |
| 30 to 34 Minutes | 493 (17.6%) | 313 (11.2%) |
| 35 to 39 Minutes | 0 (0.0%) | 38 (1.4%) |
| 40 to 44 Minutes | 112 (4.0%) | 33 (1.2%) |
| 45 to 59 Minutes | 296 (10.6%) | 50 (1.8%) |
| 60 to 89 Minutes | 198 (7.1%) | 145 (5.2%) |
| 90 or more Minutes | 23 (0.8%) | 100 (3.6%) |
Time of Departure to Work by Sex in Fairview Shores
The most frequent times of departure to work in Fairview Shores are 7:30 AM to 7:59 AM (418, 14.9%) for males and 4:00 PM to 11:59 PM (413, 14.7%) for females.
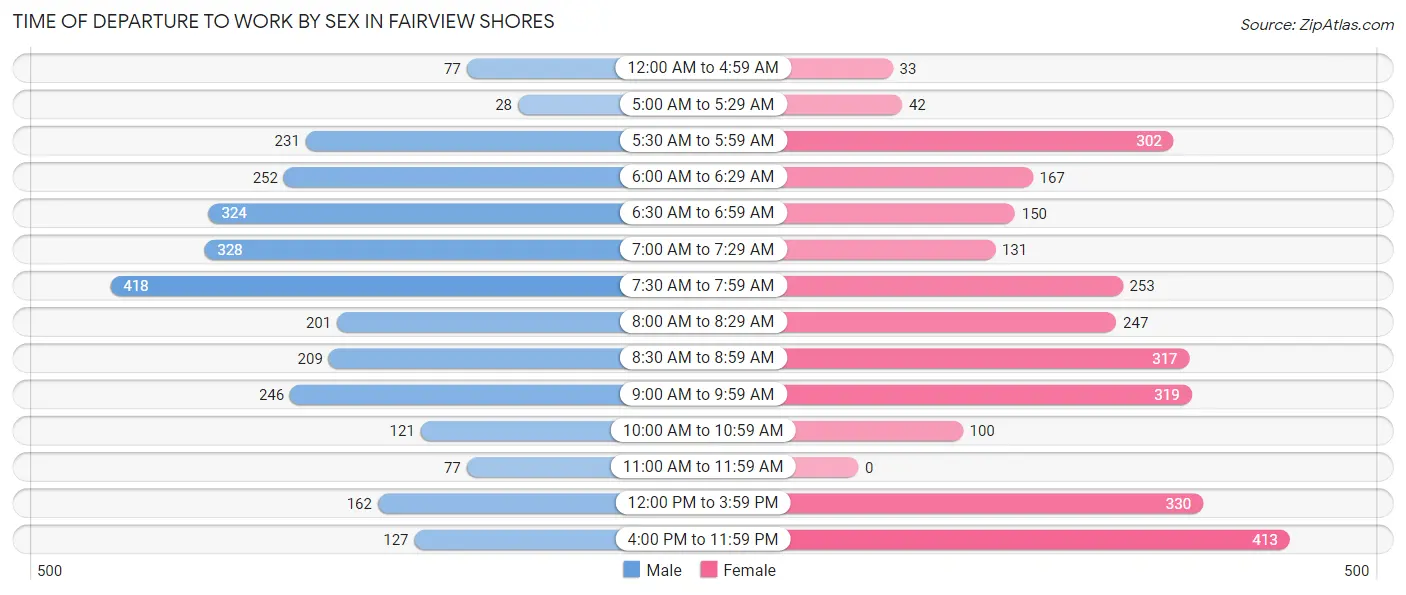
| Time of Departure | Male | Female |
| 12:00 AM to 4:59 AM | 77 (2.8%) | 33 (1.2%) |
| 5:00 AM to 5:29 AM | 28 (1.0%) | 42 (1.5%) |
| 5:30 AM to 5:59 AM | 231 (8.3%) | 302 (10.8%) |
| 6:00 AM to 6:29 AM | 252 (9.0%) | 167 (6.0%) |
| 6:30 AM to 6:59 AM | 324 (11.6%) | 150 (5.3%) |
| 7:00 AM to 7:29 AM | 328 (11.7%) | 131 (4.7%) |
| 7:30 AM to 7:59 AM | 418 (14.9%) | 253 (9.0%) |
| 8:00 AM to 8:29 AM | 201 (7.2%) | 247 (8.8%) |
| 8:30 AM to 8:59 AM | 209 (7.5%) | 317 (11.3%) |
| 9:00 AM to 9:59 AM | 246 (8.8%) | 319 (11.4%) |
| 10:00 AM to 10:59 AM | 121 (4.3%) | 100 (3.6%) |
| 11:00 AM to 11:59 AM | 77 (2.8%) | 0 (0.0%) |
| 12:00 PM to 3:59 PM | 162 (5.8%) | 330 (11.8%) |
| 4:00 PM to 11:59 PM | 127 (4.5%) | 413 (14.7%) |
| Total | 2,801 (100.0%) | 2,804 (100.0%) |
Housing Occupancy in Fairview Shores
Occupancy by Ownership in Fairview Shores
Of the total 4,379 dwellings in Fairview Shores, owner-occupied units account for 2,289 (52.3%), while renter-occupied units make up 2,090 (47.7%).
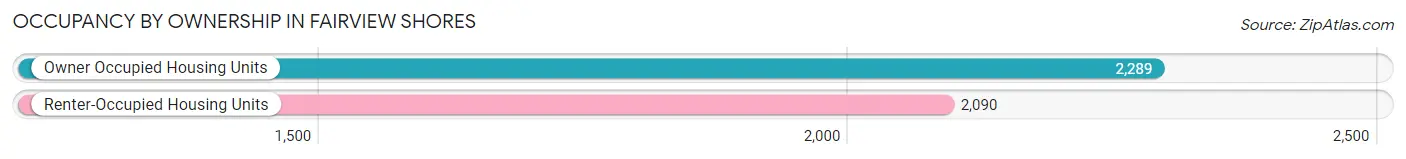
| Occupancy | # Housing Units | % Housing Units |
| Owner Occupied Housing Units | 2,289 | 52.3% |
| Renter-Occupied Housing Units | 2,090 | 47.7% |
| Total Occupied Housing Units | 4,379 | 100.0% |
Occupancy by Household Size in Fairview Shores
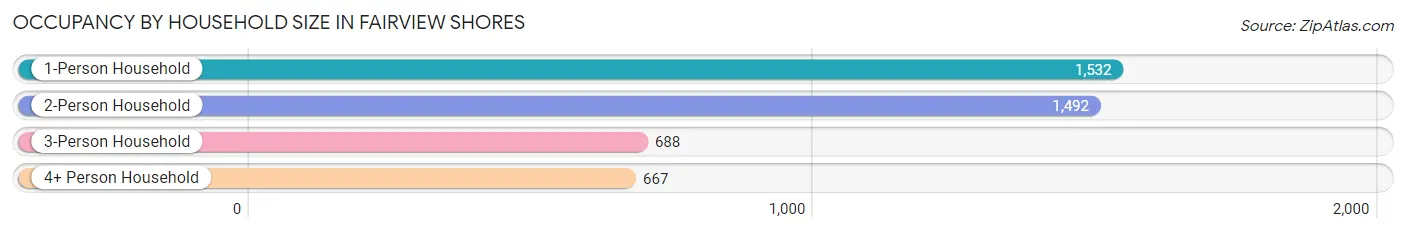
| Household Size | # Housing Units | % Housing Units |
| 1-Person Household | 1,532 | 35.0% |
| 2-Person Household | 1,492 | 34.1% |
| 3-Person Household | 688 | 15.7% |
| 4+ Person Household | 667 | 15.2% |
| Total Housing Units | 4,379 | 100.0% |
Occupancy by Ownership by Household Size in Fairview Shores
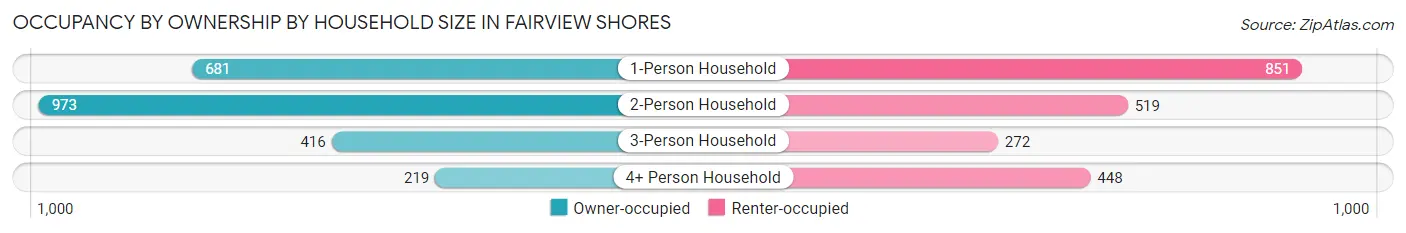
| Household Size | Owner-occupied | Renter-occupied |
| 1-Person Household | 681 (44.5%) | 851 (55.5%) |
| 2-Person Household | 973 (65.2%) | 519 (34.8%) |
| 3-Person Household | 416 (60.5%) | 272 (39.5%) |
| 4+ Person Household | 219 (32.8%) | 448 (67.2%) |
| Total Housing Units | 2,289 (52.3%) | 2,090 (47.7%) |
Occupancy by Educational Attainment in Fairview Shores
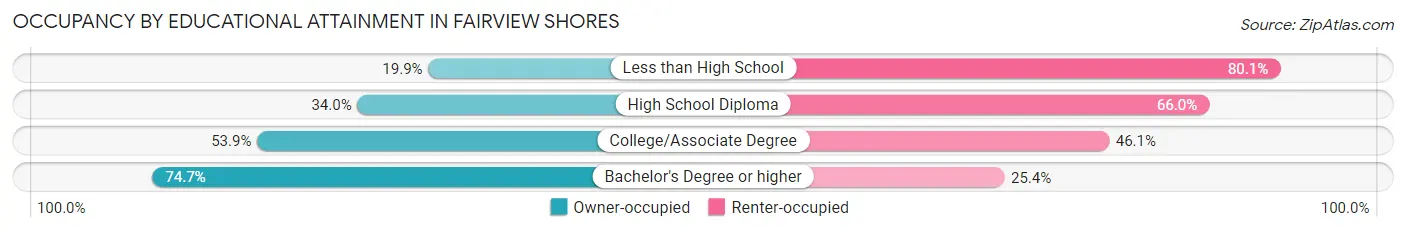
| Household Size | Owner-occupied | Renter-occupied |
| Less than High School | 71 (19.9%) | 285 (80.1%) |
| High School Diploma | 390 (34.0%) | 757 (66.0%) |
| College/Associate Degree | 827 (53.9%) | 708 (46.1%) |
| Bachelor's Degree or higher | 1,001 (74.7%) | 340 (25.4%) |
Occupancy by Age of Householder in Fairview Shores
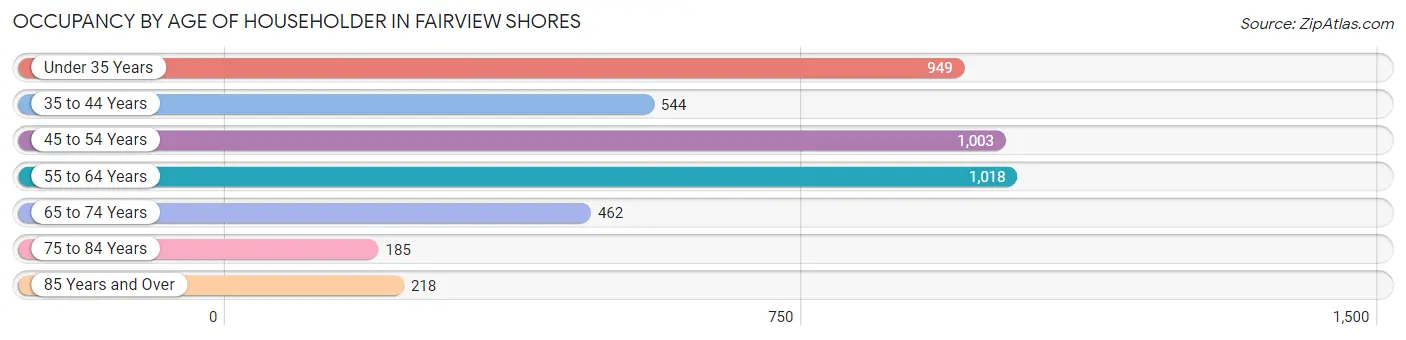
| Age Bracket | # Households | % Households |
| Under 35 Years | 949 | 21.7% |
| 35 to 44 Years | 544 | 12.4% |
| 45 to 54 Years | 1,003 | 22.9% |
| 55 to 64 Years | 1,018 | 23.3% |
| 65 to 74 Years | 462 | 10.5% |
| 75 to 84 Years | 185 | 4.2% |
| 85 Years and Over | 218 | 5.0% |
| Total | 4,379 | 100.0% |
Housing Finances in Fairview Shores
Median Income by Occupancy in Fairview Shores
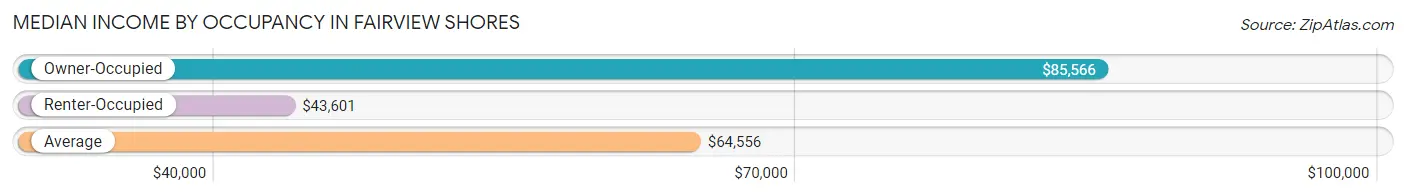
| Occupancy Type | # Households | Median Income |
| Owner-Occupied | 2,289 (52.3%) | $85,566 |
| Renter-Occupied | 2,090 (47.7%) | $43,601 |
| Average | 4,379 (100.0%) | $64,556 |
Occupancy by Householder Income Bracket in Fairview Shores
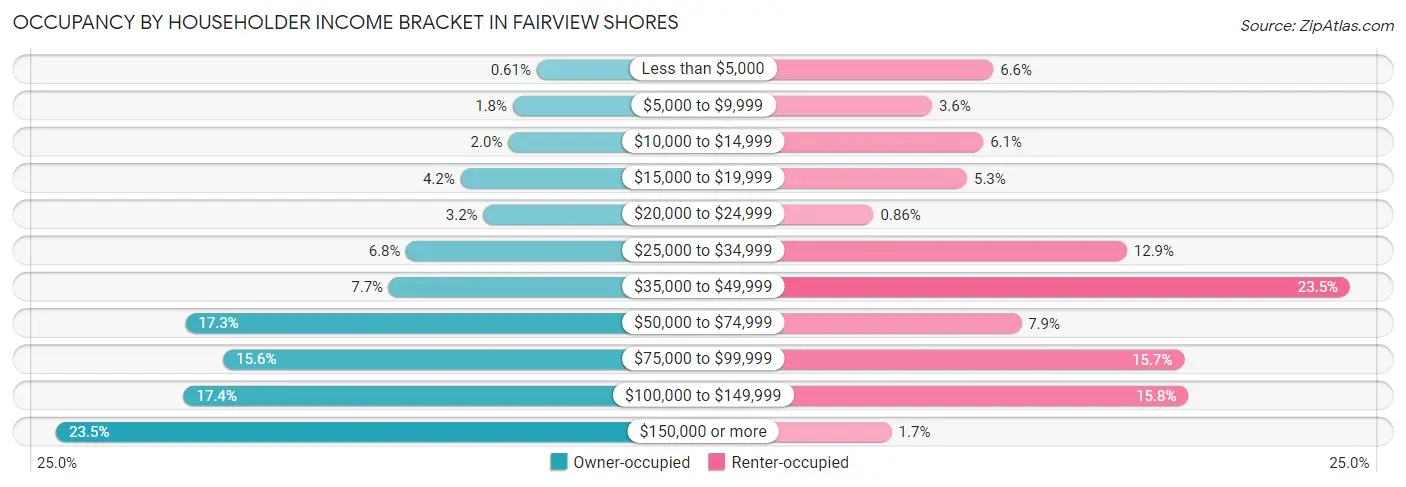
| Income Bracket | Owner-occupied | Renter-occupied |
| Less than $5,000 | 14 (0.6%) | 137 (6.6%) |
| $5,000 to $9,999 | 40 (1.8%) | 76 (3.6%) |
| $10,000 to $14,999 | 45 (2.0%) | 127 (6.1%) |
| $15,000 to $19,999 | 97 (4.2%) | 111 (5.3%) |
| $20,000 to $24,999 | 72 (3.2%) | 18 (0.9%) |
| $25,000 to $34,999 | 156 (6.8%) | 270 (12.9%) |
| $35,000 to $49,999 | 175 (7.6%) | 492 (23.5%) |
| $50,000 to $74,999 | 397 (17.3%) | 165 (7.9%) |
| $75,000 to $99,999 | 356 (15.5%) | 327 (15.7%) |
| $100,000 to $149,999 | 399 (17.4%) | 331 (15.8%) |
| $150,000 or more | 538 (23.5%) | 36 (1.7%) |
| Total | 2,289 (100.0%) | 2,090 (100.0%) |
Monthly Housing Cost Tiers in Fairview Shores
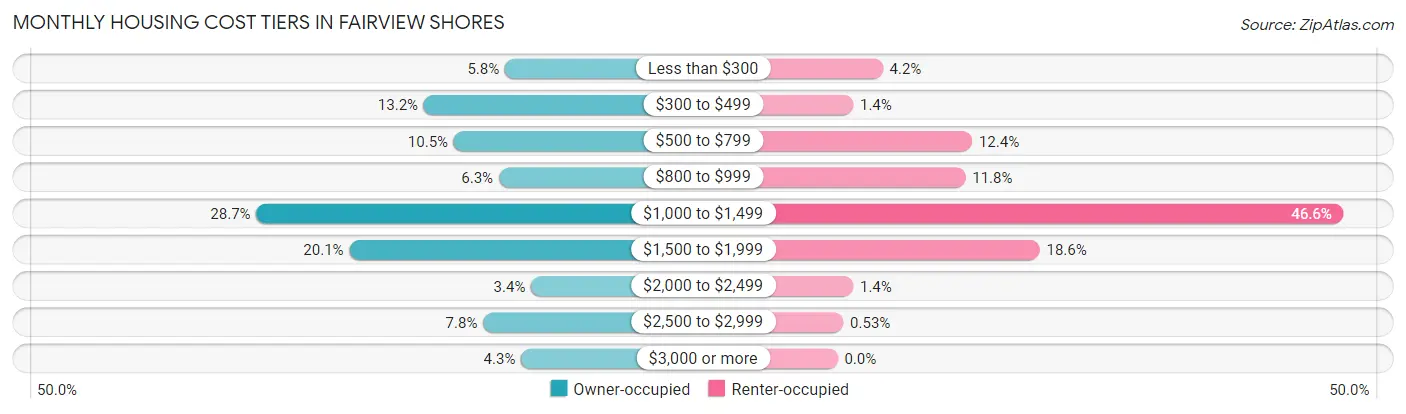
| Monthly Cost | Owner-occupied | Renter-occupied |
| Less than $300 | 132 (5.8%) | 87 (4.2%) |
| $300 to $499 | 303 (13.2%) | 30 (1.4%) |
| $500 to $799 | 240 (10.5%) | 259 (12.4%) |
| $800 to $999 | 145 (6.3%) | 246 (11.8%) |
| $1,000 to $1,499 | 656 (28.7%) | 974 (46.6%) |
| $1,500 to $1,999 | 460 (20.1%) | 389 (18.6%) |
| $2,000 to $2,499 | 77 (3.4%) | 30 (1.4%) |
| $2,500 to $2,999 | 178 (7.8%) | 11 (0.5%) |
| $3,000 or more | 98 (4.3%) | 0 (0.0%) |
| Total | 2,289 (100.0%) | 2,090 (100.0%) |
Physical Housing Characteristics in Fairview Shores
Housing Structures in Fairview Shores
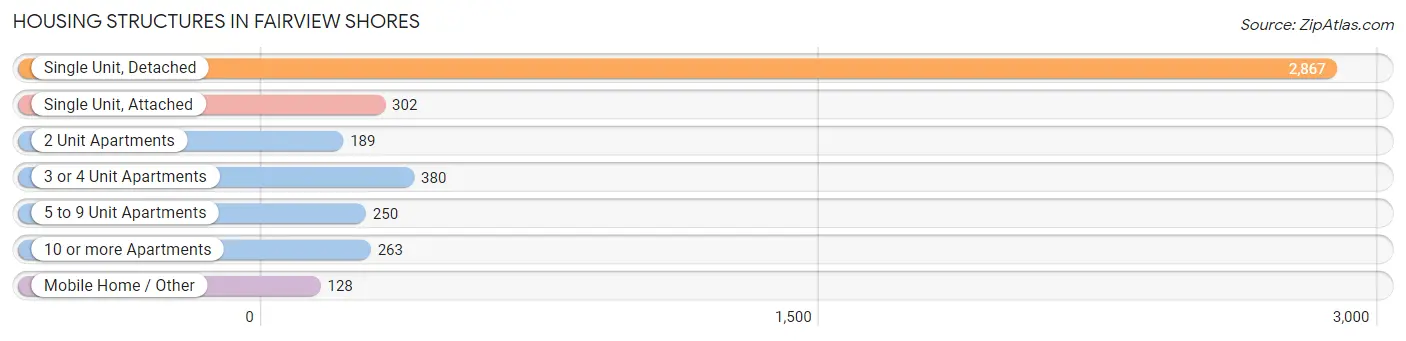
| Structure Type | # Housing Units | % Housing Units |
| Single Unit, Detached | 2,867 | 65.5% |
| Single Unit, Attached | 302 | 6.9% |
| 2 Unit Apartments | 189 | 4.3% |
| 3 or 4 Unit Apartments | 380 | 8.7% |
| 5 to 9 Unit Apartments | 250 | 5.7% |
| 10 or more Apartments | 263 | 6.0% |
| Mobile Home / Other | 128 | 2.9% |
| Total | 4,379 | 100.0% |
Housing Structures by Occupancy in Fairview Shores
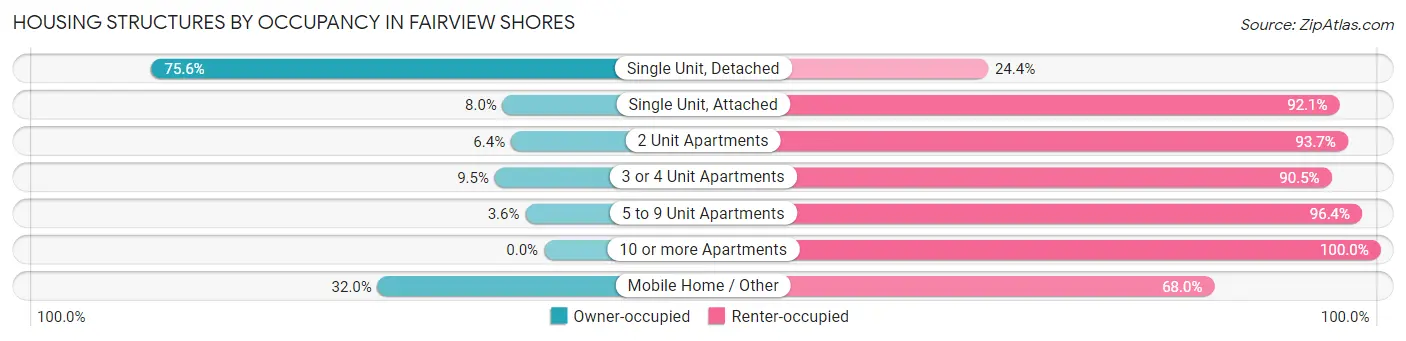
| Structure Type | Owner-occupied | Renter-occupied |
| Single Unit, Detached | 2,167 (75.6%) | 700 (24.4%) |
| Single Unit, Attached | 24 (8.0%) | 278 (92.0%) |
| 2 Unit Apartments | 12 (6.4%) | 177 (93.6%) |
| 3 or 4 Unit Apartments | 36 (9.5%) | 344 (90.5%) |
| 5 to 9 Unit Apartments | 9 (3.6%) | 241 (96.4%) |
| 10 or more Apartments | 0 (0.0%) | 263 (100.0%) |
| Mobile Home / Other | 41 (32.0%) | 87 (68.0%) |
| Total | 2,289 (52.3%) | 2,090 (47.7%) |
Housing Structures by Number of Rooms in Fairview Shores
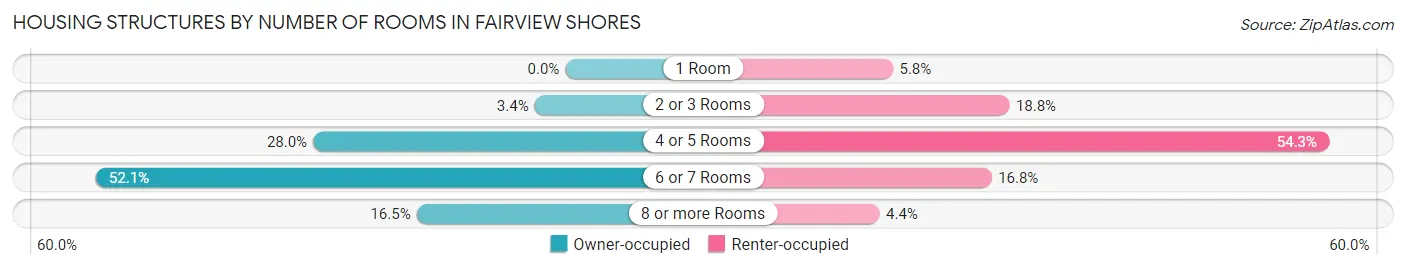
| Number of Rooms | Owner-occupied | Renter-occupied |
| 1 Room | 0 (0.0%) | 122 (5.8%) |
| 2 or 3 Rooms | 78 (3.4%) | 392 (18.8%) |
| 4 or 5 Rooms | 641 (28.0%) | 1,134 (54.3%) |
| 6 or 7 Rooms | 1,192 (52.1%) | 351 (16.8%) |
| 8 or more Rooms | 378 (16.5%) | 91 (4.3%) |
| Total | 2,289 (100.0%) | 2,090 (100.0%) |
Housing Structure by Heating Type in Fairview Shores
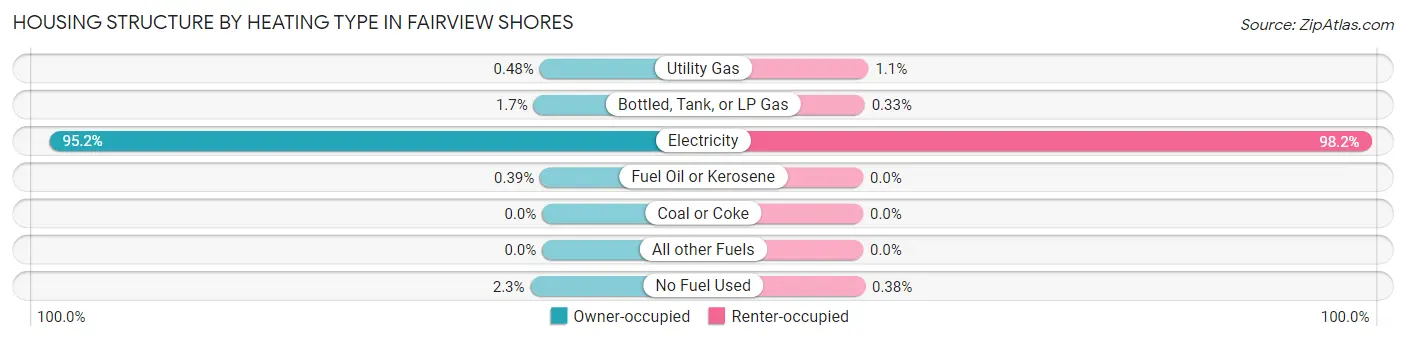
| Heating Type | Owner-occupied | Renter-occupied |
| Utility Gas | 11 (0.5%) | 22 (1.1%) |
| Bottled, Tank, or LP Gas | 38 (1.7%) | 7 (0.3%) |
| Electricity | 2,179 (95.2%) | 2,053 (98.2%) |
| Fuel Oil or Kerosene | 9 (0.4%) | 0 (0.0%) |
| Coal or Coke | 0 (0.0%) | 0 (0.0%) |
| All other Fuels | 0 (0.0%) | 0 (0.0%) |
| No Fuel Used | 52 (2.3%) | 8 (0.4%) |
| Total | 2,289 (100.0%) | 2,090 (100.0%) |
Household Vehicle Usage in Fairview Shores
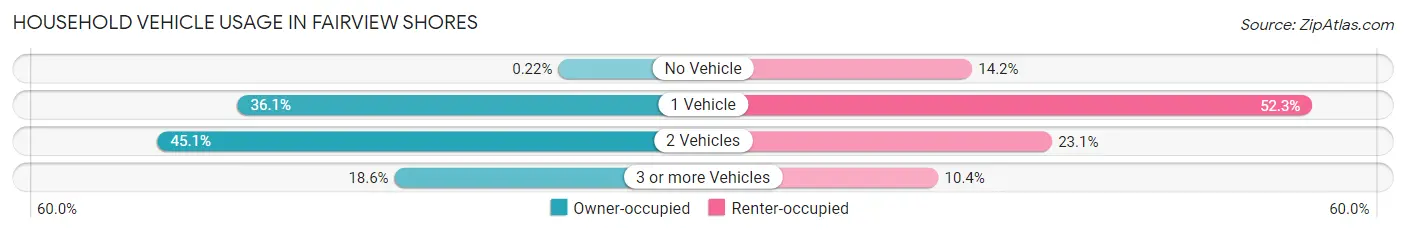
| Vehicles per Household | Owner-occupied | Renter-occupied |
| No Vehicle | 5 (0.2%) | 296 (14.2%) |
| 1 Vehicle | 827 (36.1%) | 1,094 (52.3%) |
| 2 Vehicles | 1,032 (45.1%) | 483 (23.1%) |
| 3 or more Vehicles | 425 (18.6%) | 217 (10.4%) |
| Total | 2,289 (100.0%) | 2,090 (100.0%) |
Real Estate & Mortgages in Fairview Shores
Real Estate and Mortgage Overview in Fairview Shores
| Characteristic | Without Mortgage | With Mortgage |
| Housing Units | 729 | 1,560 |
| Median Property Value | $251,500 | $298,800 |
| Median Household Income | $55,592 | $492 |
| Monthly Housing Costs | $420 | $98 |
| Real Estate Taxes | $1,380 | $56 |
Property Value by Mortgage Status in Fairview Shores
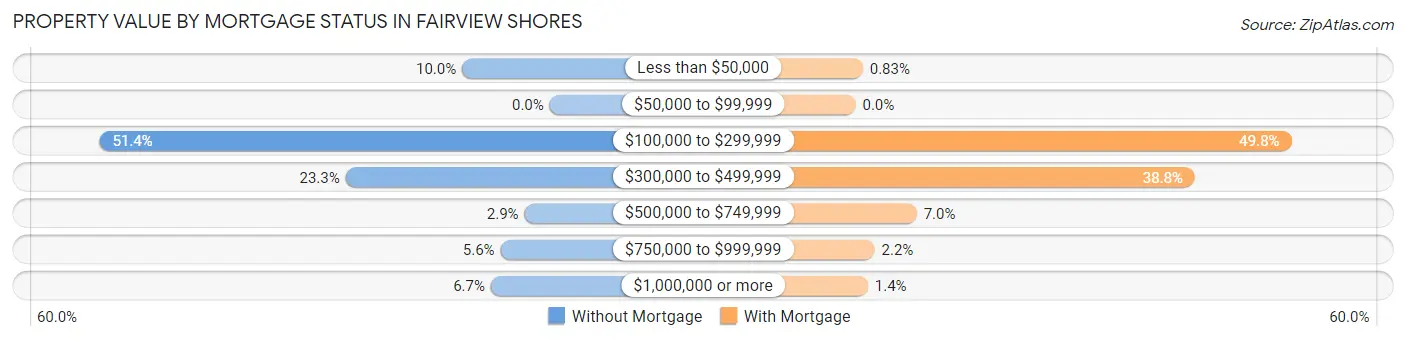
| Property Value | Without Mortgage | With Mortgage |
| Less than $50,000 | 73 (10.0%) | 13 (0.8%) |
| $50,000 to $99,999 | 0 (0.0%) | 0 (0.0%) |
| $100,000 to $299,999 | 375 (51.4%) | 777 (49.8%) |
| $300,000 to $499,999 | 170 (23.3%) | 605 (38.8%) |
| $500,000 to $749,999 | 21 (2.9%) | 109 (7.0%) |
| $750,000 to $999,999 | 41 (5.6%) | 34 (2.2%) |
| $1,000,000 or more | 49 (6.7%) | 22 (1.4%) |
| Total | 729 (100.0%) | 1,560 (100.0%) |
Household Income by Mortgage Status in Fairview Shores
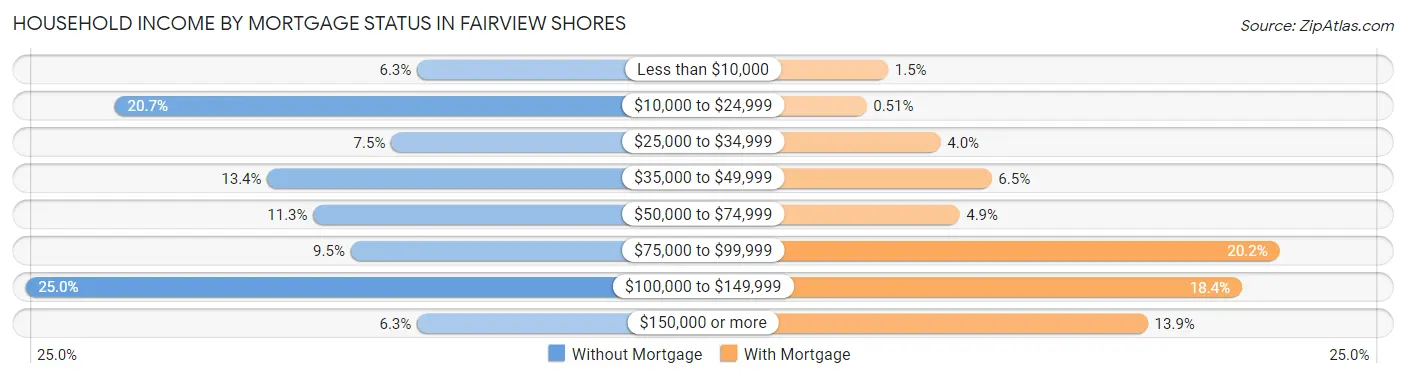
| Household Income | Without Mortgage | With Mortgage |
| Less than $10,000 | 46 (6.3%) | 24 (1.5%) |
| $10,000 to $24,999 | 151 (20.7%) | 8 (0.5%) |
| $25,000 to $34,999 | 55 (7.5%) | 63 (4.0%) |
| $35,000 to $49,999 | 98 (13.4%) | 101 (6.5%) |
| $50,000 to $74,999 | 82 (11.3%) | 77 (4.9%) |
| $75,000 to $99,999 | 69 (9.5%) | 315 (20.2%) |
| $100,000 to $149,999 | 182 (25.0%) | 287 (18.4%) |
| $150,000 or more | 46 (6.3%) | 217 (13.9%) |
| Total | 729 (100.0%) | 1,560 (100.0%) |
Property Value to Household Income Ratio in Fairview Shores
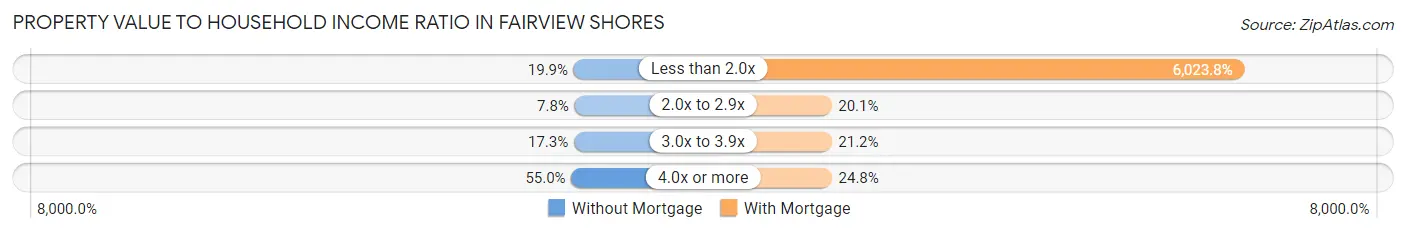
| Value-to-Income Ratio | Without Mortgage | With Mortgage |
| Less than 2.0x | 145 (19.9%) | 93,971 (6,023.8%) |
| 2.0x to 2.9x | 57 (7.8%) | 313 (20.1%) |
| 3.0x to 3.9x | 126 (17.3%) | 331 (21.2%) |
| 4.0x or more | 401 (55.0%) | 387 (24.8%) |
| Total | 729 (100.0%) | 1,560 (100.0%) |
Real Estate Taxes by Mortgage Status in Fairview Shores
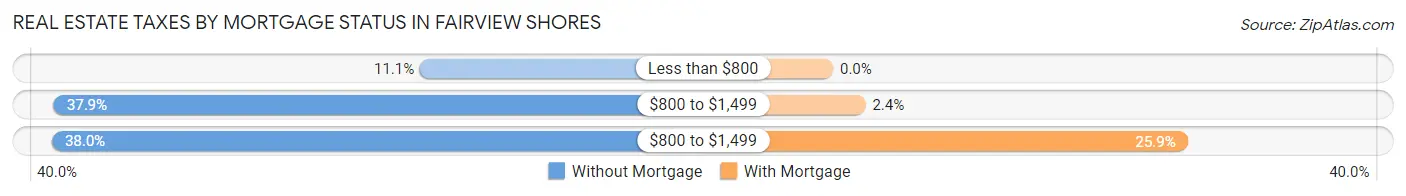
| Property Taxes | Without Mortgage | With Mortgage |
| Less than $800 | 81 (11.1%) | 0 (0.0%) |
| $800 to $1,499 | 276 (37.9%) | 37 (2.4%) |
| $800 to $1,499 | 277 (38.0%) | 404 (25.9%) |
| Total | 729 (100.0%) | 1,560 (100.0%) |
Health & Disability in Fairview Shores
Health Insurance Coverage by Age in Fairview Shores
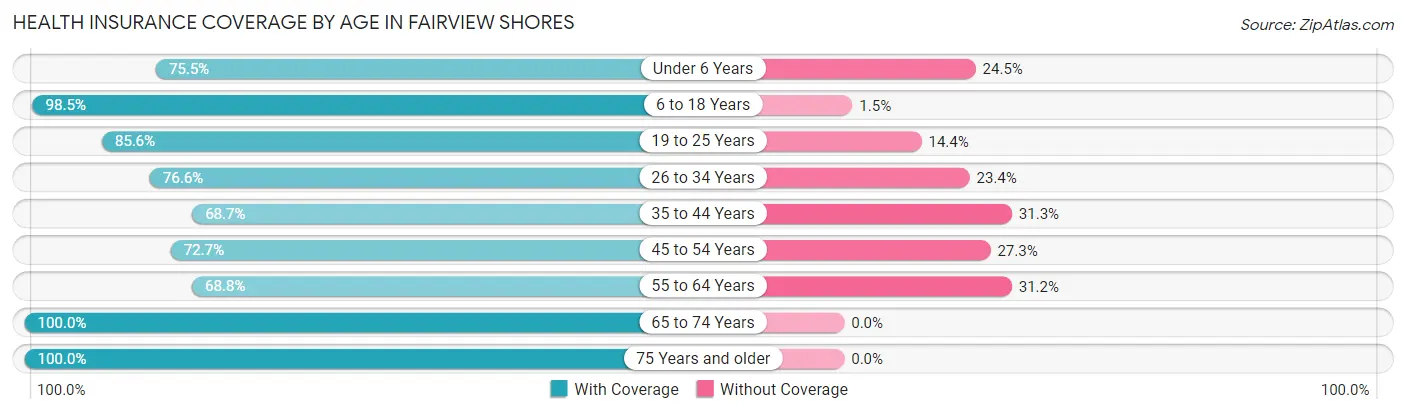
| Age Bracket | With Coverage | Without Coverage |
| Under 6 Years | 561 (75.5%) | 182 (24.5%) |
| 6 to 18 Years | 1,236 (98.5%) | 19 (1.5%) |
| 19 to 25 Years | 505 (85.6%) | 85 (14.4%) |
| 26 to 34 Years | 1,695 (76.6%) | 517 (23.4%) |
| 35 to 44 Years | 928 (68.7%) | 422 (31.3%) |
| 45 to 54 Years | 1,118 (72.7%) | 419 (27.3%) |
| 55 to 64 Years | 1,244 (68.8%) | 565 (31.2%) |
| 65 to 74 Years | 686 (100.0%) | 0 (0.0%) |
| 75 Years and older | 609 (100.0%) | 0 (0.0%) |
| Total | 8,582 (79.5%) | 2,209 (20.5%) |
Health Insurance Coverage by Citizenship Status in Fairview Shores
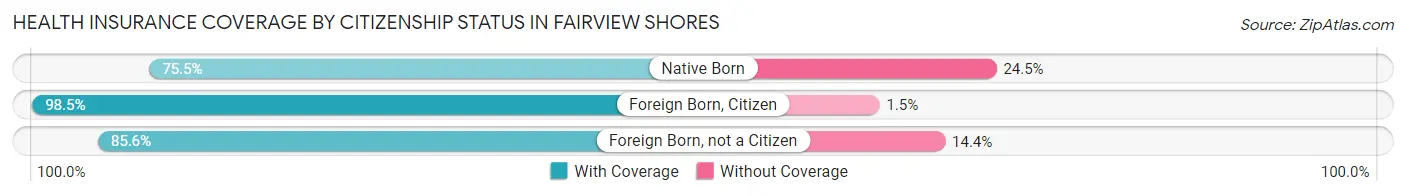
| Citizenship Status | With Coverage | Without Coverage |
| Native Born | 561 (75.5%) | 182 (24.5%) |
| Foreign Born, Citizen | 1,236 (98.5%) | 19 (1.5%) |
| Foreign Born, not a Citizen | 505 (85.6%) | 85 (14.4%) |
Health Insurance Coverage by Household Income in Fairview Shores
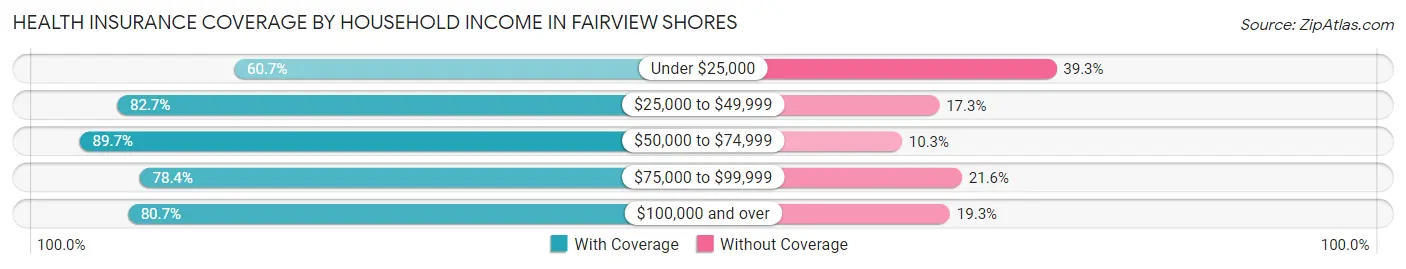
| Household Income | With Coverage | Without Coverage |
| Under $25,000 | 659 (60.7%) | 426 (39.3%) |
| $25,000 to $49,999 | 2,114 (82.7%) | 443 (17.3%) |
| $50,000 to $74,999 | 1,104 (89.7%) | 127 (10.3%) |
| $75,000 to $99,999 | 1,466 (78.4%) | 403 (21.6%) |
| $100,000 and over | 3,158 (80.7%) | 756 (19.3%) |
Public vs Private Health Insurance Coverage by Age in Fairview Shores
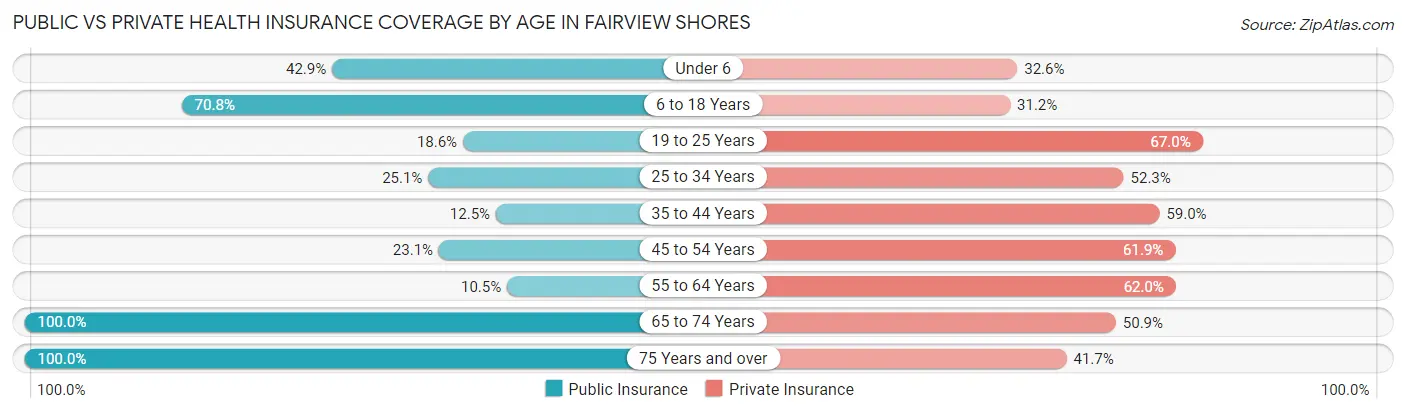
| Age Bracket | Public Insurance | Private Insurance |
| Under 6 | 319 (42.9%) | 242 (32.6%) |
| 6 to 18 Years | 889 (70.8%) | 392 (31.2%) |
| 19 to 25 Years | 110 (18.6%) | 395 (66.9%) |
| 25 to 34 Years | 555 (25.1%) | 1,157 (52.3%) |
| 35 to 44 Years | 169 (12.5%) | 796 (59.0%) |
| 45 to 54 Years | 355 (23.1%) | 951 (61.9%) |
| 55 to 64 Years | 189 (10.4%) | 1,121 (62.0%) |
| 65 to 74 Years | 686 (100.0%) | 349 (50.9%) |
| 75 Years and over | 609 (100.0%) | 254 (41.7%) |
| Total | 3,881 (36.0%) | 5,657 (52.4%) |
Disability Status by Sex by Age in Fairview Shores
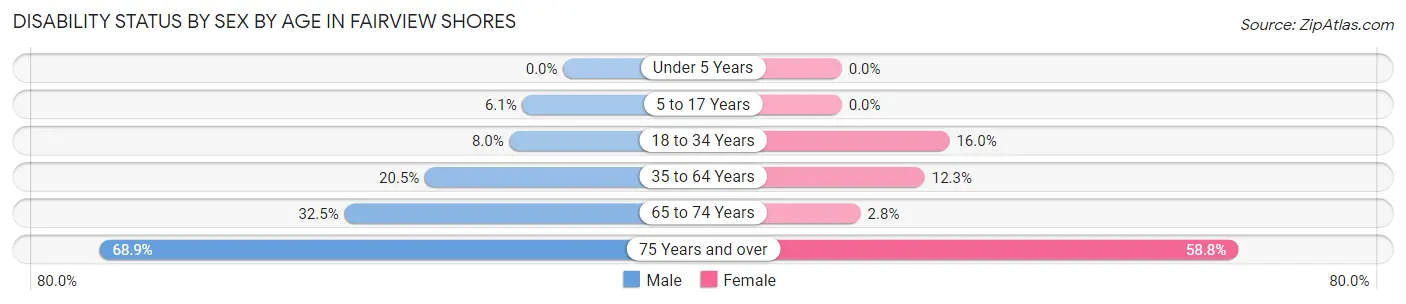
| Age Bracket | Male | Female |
| Under 5 Years | 0 (0.0%) | 0 (0.0%) |
| 5 to 17 Years | 45 (6.1%) | 0 (0.0%) |
| 18 to 34 Years | 107 (8.0%) | 244 (16.0%) |
| 35 to 64 Years | 456 (20.5%) | 305 (12.3%) |
| 65 to 74 Years | 130 (32.5%) | 8 (2.8%) |
| 75 Years and over | 135 (68.9%) | 243 (58.8%) |
Disability Class by Sex by Age in Fairview Shores
Disability Class: Hearing Difficulty
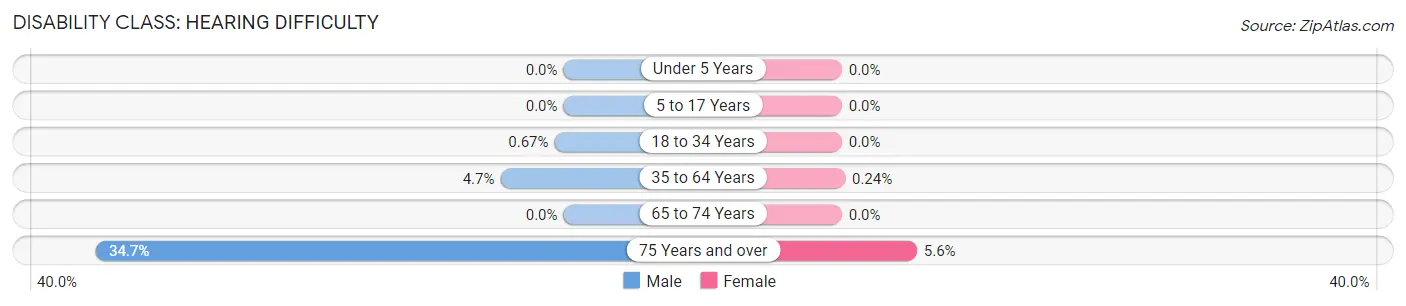
| Age Bracket | Male | Female |
| Under 5 Years | 0 (0.0%) | 0 (0.0%) |
| 5 to 17 Years | 0 (0.0%) | 0 (0.0%) |
| 18 to 34 Years | 9 (0.7%) | 0 (0.0%) |
| 35 to 64 Years | 104 (4.7%) | 6 (0.2%) |
| 65 to 74 Years | 0 (0.0%) | 0 (0.0%) |
| 75 Years and over | 68 (34.7%) | 23 (5.6%) |
Disability Class: Vision Difficulty
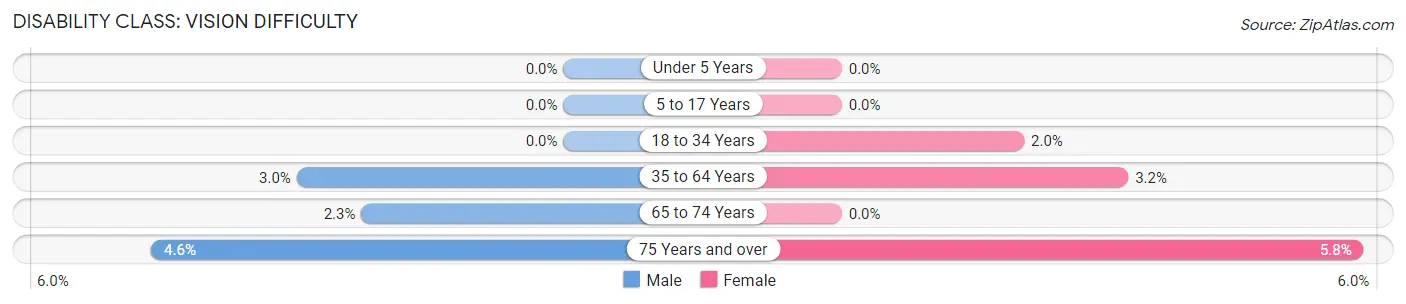
| Age Bracket | Male | Female |
| Under 5 Years | 0 (0.0%) | 0 (0.0%) |
| 5 to 17 Years | 0 (0.0%) | 0 (0.0%) |
| 18 to 34 Years | 0 (0.0%) | 31 (2.0%) |
| 35 to 64 Years | 66 (3.0%) | 79 (3.2%) |
| 65 to 74 Years | 9 (2.2%) | 0 (0.0%) |
| 75 Years and over | 9 (4.6%) | 24 (5.8%) |
Disability Class: Cognitive Difficulty
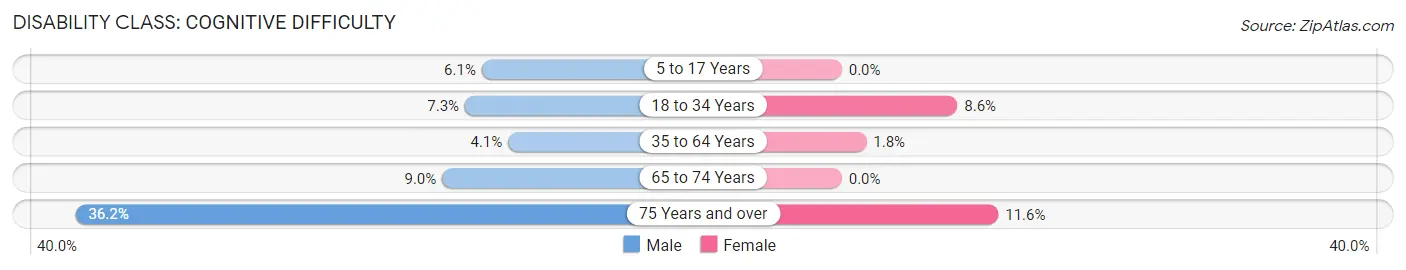
| Age Bracket | Male | Female |
| 5 to 17 Years | 45 (6.1%) | 0 (0.0%) |
| 18 to 34 Years | 98 (7.3%) | 131 (8.6%) |
| 35 to 64 Years | 91 (4.1%) | 45 (1.8%) |
| 65 to 74 Years | 36 (9.0%) | 0 (0.0%) |
| 75 Years and over | 71 (36.2%) | 48 (11.6%) |
Disability Class: Ambulatory Difficulty
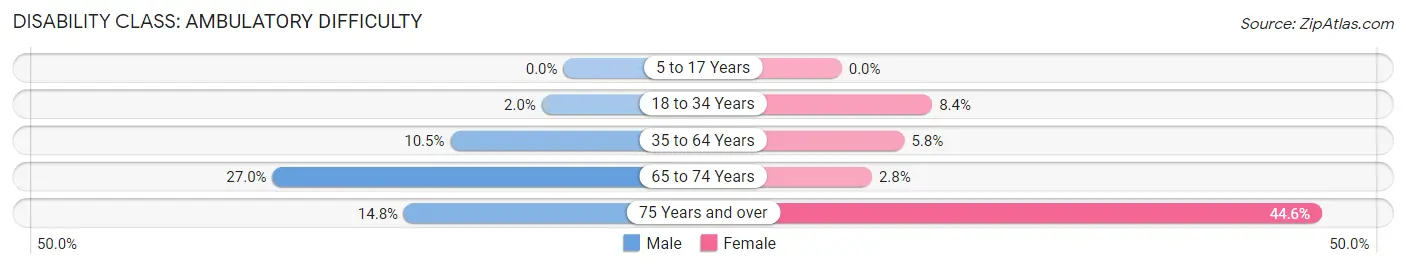
| Age Bracket | Male | Female |
| 5 to 17 Years | 0 (0.0%) | 0 (0.0%) |
| 18 to 34 Years | 27 (2.0%) | 128 (8.4%) |
| 35 to 64 Years | 233 (10.5%) | 144 (5.8%) |
| 65 to 74 Years | 108 (27.0%) | 8 (2.8%) |
| 75 Years and over | 29 (14.8%) | 184 (44.6%) |
Disability Class: Self-Care Difficulty
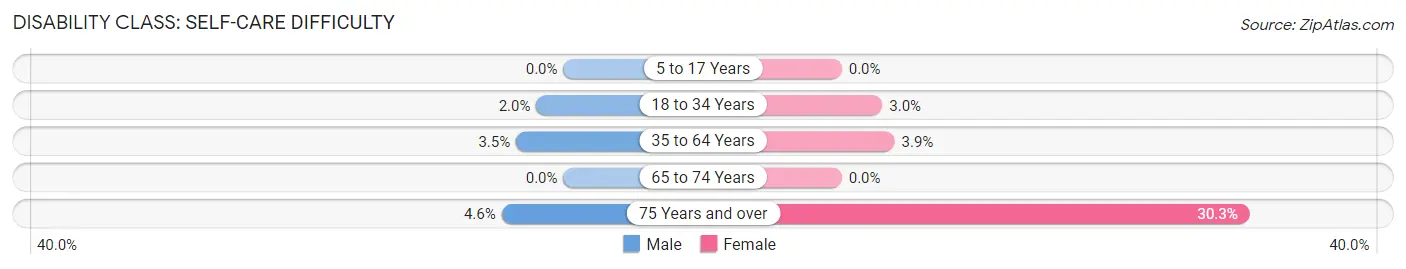
| Age Bracket | Male | Female |
| 5 to 17 Years | 0 (0.0%) | 0 (0.0%) |
| 18 to 34 Years | 27 (2.0%) | 46 (3.0%) |
| 35 to 64 Years | 78 (3.5%) | 97 (3.9%) |
| 65 to 74 Years | 0 (0.0%) | 0 (0.0%) |
| 75 Years and over | 9 (4.6%) | 125 (30.3%) |
Technology Access in Fairview Shores
Computing Device Access in Fairview Shores
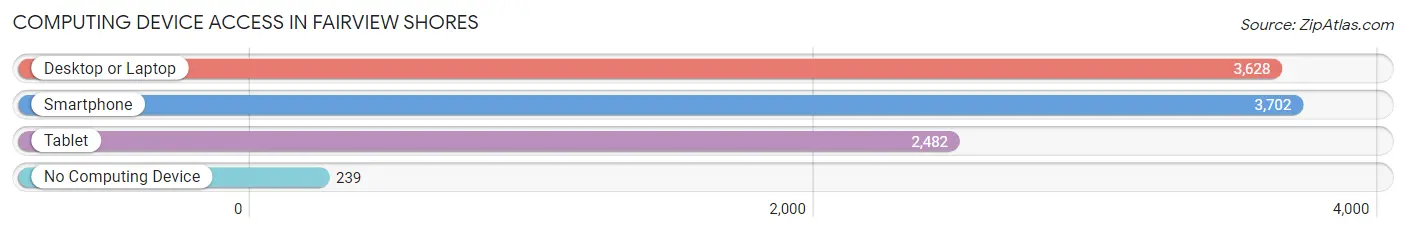
| Device Type | # Households | % Households |
| Desktop or Laptop | 3,628 | 82.9% |
| Smartphone | 3,702 | 84.5% |
| Tablet | 2,482 | 56.7% |
| No Computing Device | 239 | 5.5% |
| Total | 4,379 | 100.0% |
Internet Access in Fairview Shores
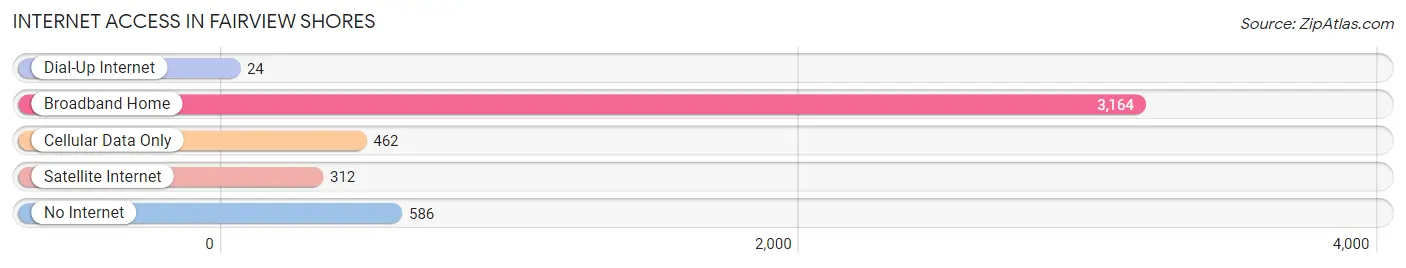
| Internet Type | # Households | % Households |
| Dial-Up Internet | 24 | 0.5% |
| Broadband Home | 3,164 | 72.3% |
| Cellular Data Only | 462 | 10.5% |
| Satellite Internet | 312 | 7.1% |
| No Internet | 586 | 13.4% |
| Total | 4,379 | 100.0% |
Fairview Shores Summary
Introduction
Fairview Shores is a census-designated place (CDP) located in Orange County, Florida. It is part of the Orlando-Kissimmee-Sanford Metropolitan Statistical Area. The population of Fairview Shores was 8,945 at the 2010 census. The area is known for its proximity to the University of Central Florida, the Orlando International Airport, and the Orange County Convention Center.
History
Fairview Shores was originally part of the Seminole Indian Reservation. The area was first settled in the late 1800s by settlers from the North. The area was known as Fairview until the early 1900s when it was renamed Fairview Shores. The area was annexed by Orange County in the 1950s and was officially incorporated as a CDP in 1980.
Geography
Fairview Shores is located in Orange County, Florida. It is bordered by the cities of Orlando, Winter Park, and Maitland. The area is located on the northern shore of Lake Fairview, which is part of the Butler Chain of Lakes. The area is also located near the University of Central Florida, the Orlando International Airport, and the Orange County Convention Center.
Economy
Fairview Shores is home to a variety of businesses and industries. The area is home to several retail stores, restaurants, and other businesses. The area is also home to several medical facilities, including Florida Hospital and Orlando Health. The area is also home to several corporate offices, including Lockheed Martin and Siemens.
Demographics
As of the 2010 census, the population of Fairview Shores was 8,945. The racial makeup of the area was 79.3% White, 11.2% African American, 0.7% Native American, 2.2% Asian, 0.1% Pacific Islander, 4.2% from other races, and 2.5% from two or more races. Hispanic or Latino of any race were 11.2% of the population.
Conclusion
Fairview Shores is a census-designated place located in Orange County, Florida. The area is known for its proximity to the University of Central Florida, the Orlando International Airport, and the Orange County Convention Center. The area was originally part of the Seminole Indian Reservation and was first settled in the late 1800s. The population of Fairview Shores was 8,945 at the 2010 census. The area is home to a variety of businesses and industries, including retail stores, restaurants, medical facilities, and corporate offices. The racial makeup of the area was 79.3% White, 11.2% African American, 0.7% Native American, 2.2% Asian, 0.1% Pacific Islander, 4.2% from other races, and 2.5% from two or more races. Hispanic or Latino of any race were 11.2% of the population.
Common Questions
What is Per Capita Income in Fairview Shores?
Per Capita income in Fairview Shores is $37,144.
What is the Median Family Income in Fairview Shores?
Median Family Income in Fairview Shores is $86,871.
What is the Median Household income in Fairview Shores?
Median Household Income in Fairview Shores is $64,556.
What is Income or Wage Gap in Fairview Shores?
Income or Wage Gap in Fairview Shores is 3.4%.
Women in Fairview Shores earn 96.6 cents for every dollar earned by a man.
What is Family Income Deficit in Fairview Shores?
Family Income Deficit in Fairview Shores is $14,256.
Families that are below poverty line in Fairview Shores earn $14,256 less on average than the poverty threshold level.
What is Inequality or Gini Index in Fairview Shores?
Inequality or Gini Index in Fairview Shores is 0.46.
What is the Total Population of Fairview Shores?
Total Population of Fairview Shores is 11,011.
What is the Total Male Population of Fairview Shores?
Total Male Population of Fairview Shores is 5,303.
What is the Total Female Population of Fairview Shores?
Total Female Population of Fairview Shores is 5,708.
What is the Ratio of Males per 100 Females in Fairview Shores?
There are 92.90 Males per 100 Females in Fairview Shores.
What is the Ratio of Females per 100 Males in Fairview Shores?
There are 107.64 Females per 100 Males in Fairview Shores.
What is the Median Population Age in Fairview Shores?
Median Population Age in Fairview Shores is 39.7 Years.
What is the Average Family Size in Fairview Shores
Average Family Size in Fairview Shores is 3.2 People.
What is the Average Household Size in Fairview Shores
Average Household Size in Fairview Shores is 2.4 People.
How Large is the Labor Force in Fairview Shores?
There are 6,615 People in the Labor Forcein in Fairview Shores.
What is the Percentage of People in the Labor Force in Fairview Shores?
72.4% of People are in the Labor Force in Fairview Shores.
What is the Unemployment Rate in Fairview Shores?
Unemployment Rate in Fairview Shores is 2.6%.