Dania Beach, FL Map & Demographics
Dania Beach Map
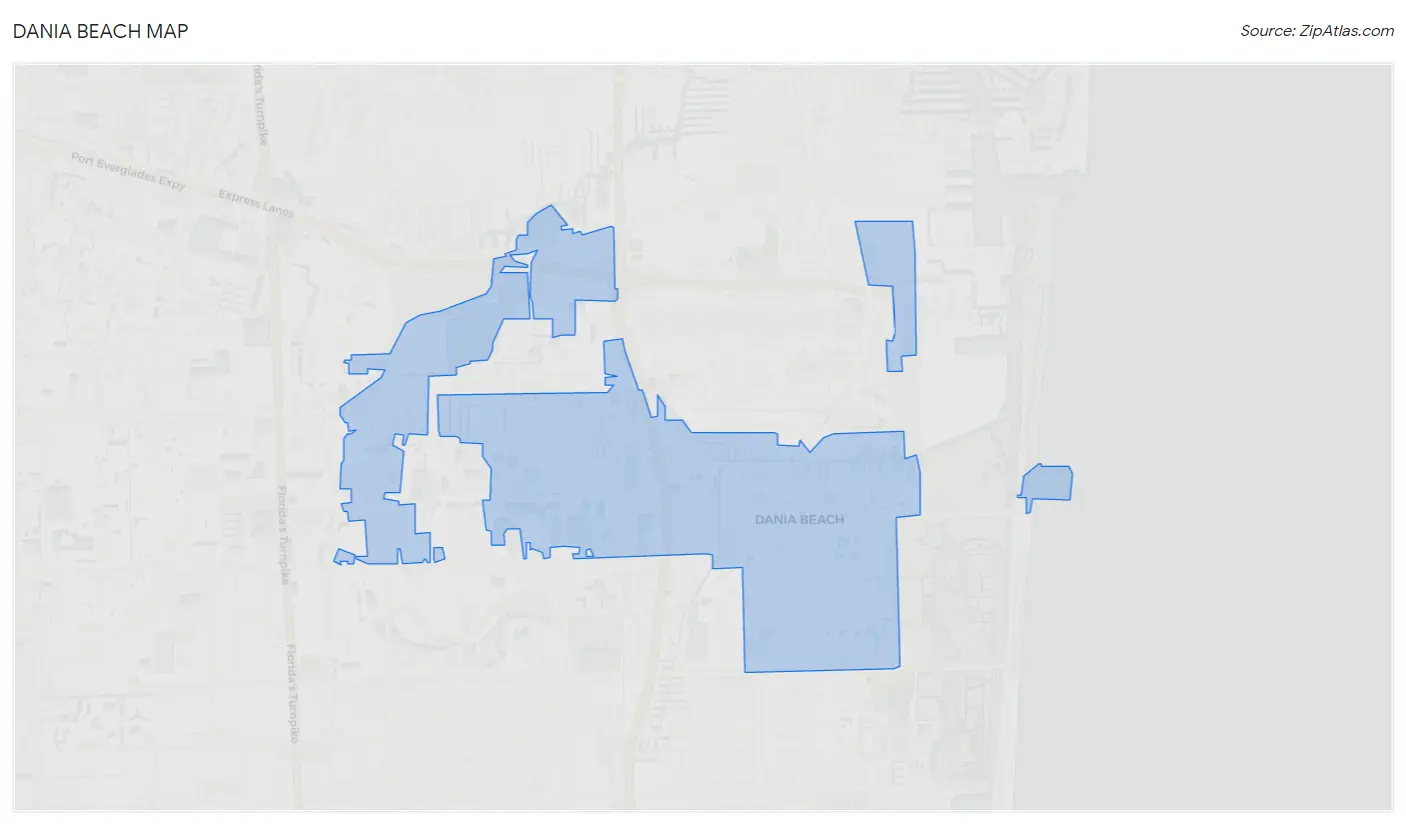
Dania Beach Overview
$35,346
PER CAPITA INCOME
$62,121
AVG FAMILY INCOME
$46,330
AVG HOUSEHOLD INCOME
10.9%
WAGE / INCOME GAP [ % ]
89.1¢/ $1
WAGE / INCOME GAP [ $ ]
0.55
INEQUALITY / GINI INDEX
31,700
TOTAL POPULATION
15,626
MALE POPULATION
16,074
FEMALE POPULATION
97.21
MALES / 100 FEMALES
102.87
FEMALES / 100 MALES
42.0
MEDIAN AGE
3.0
AVG FAMILY SIZE
2.3
AVG HOUSEHOLD SIZE
16,836
LABOR FORCE [ PEOPLE ]
63.9%
PERCENT IN LABOR FORCE
9.0%
UNEMPLOYMENT RATE
Dania Beach Area Codes
Income in Dania Beach
Income Overview in Dania Beach
Per Capita Income in Dania Beach is $35,346, while median incomes of families and households are $62,121 and $46,330 respectively.
| Characteristic | Number | Measure |
| Per Capita Income | 31,700 | $35,346 |
| Median Family Income | 7,955 | $62,121 |
| Mean Family Income | 7,955 | $92,183 |
| Median Household Income | 13,429 | $46,330 |
| Mean Household Income | 13,429 | $80,179 |
| Income Deficit | 7,955 | $0 |
| Wage / Income Gap (%) | 31,700 | 10.87% |
| Wage / Income Gap ($) | 31,700 | 89.13¢ per $1 |
| Gini / Inequality Index | 31,700 | 0.55 |
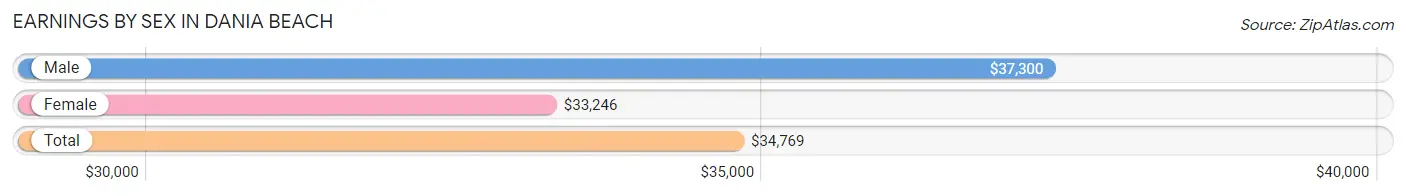
Earnings by Sex in Dania Beach
Average Earnings in Dania Beach are $34,769, $37,300 for men and $33,246 for women, a difference of 10.9%.
| Sex | Number | Average Earnings |
| Male | 8,890 (52.8%) | $37,300 |
| Female | 7,935 (47.2%) | $33,246 |
| Total | 16,825 (100.0%) | $34,769 |
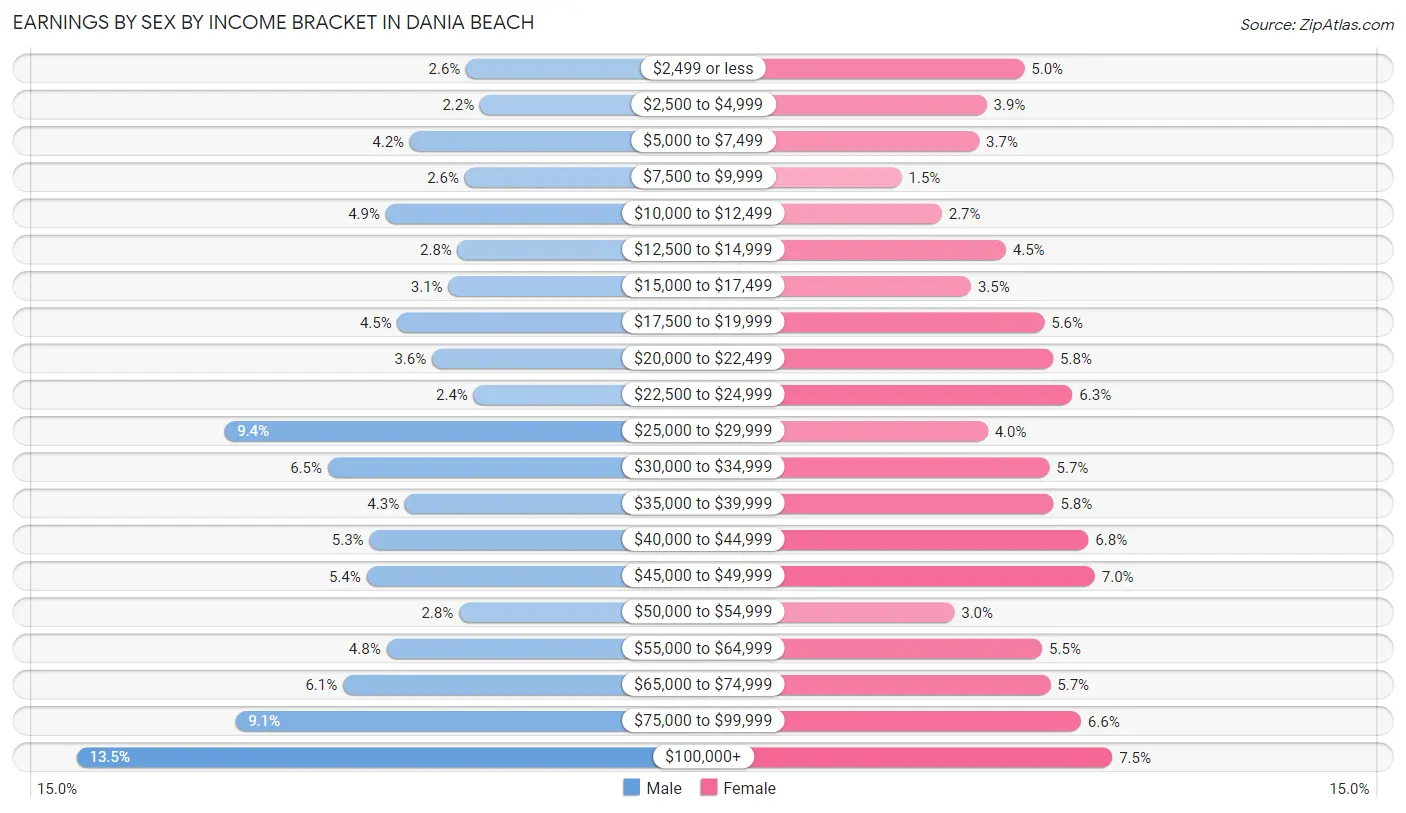
Earnings by Sex by Income Bracket in Dania Beach
The most common earnings brackets in Dania Beach are $100,000+ for men (1,204 | 13.5%) and $100,000+ for women (592 | 7.5%).
| Income | Male | Female |
| $2,499 or less | 230 (2.6%) | 396 (5.0%) |
| $2,500 to $4,999 | 196 (2.2%) | 312 (3.9%) |
| $5,000 to $7,499 | 371 (4.2%) | 295 (3.7%) |
| $7,500 to $9,999 | 234 (2.6%) | 122 (1.5%) |
| $10,000 to $12,499 | 431 (4.9%) | 212 (2.7%) |
| $12,500 to $14,999 | 252 (2.8%) | 355 (4.5%) |
| $15,000 to $17,499 | 275 (3.1%) | 277 (3.5%) |
| $17,500 to $19,999 | 402 (4.5%) | 440 (5.6%) |
| $20,000 to $22,499 | 316 (3.5%) | 460 (5.8%) |
| $22,500 to $24,999 | 212 (2.4%) | 503 (6.3%) |
| $25,000 to $29,999 | 835 (9.4%) | 314 (4.0%) |
| $30,000 to $34,999 | 576 (6.5%) | 452 (5.7%) |
| $35,000 to $39,999 | 383 (4.3%) | 461 (5.8%) |
| $40,000 to $44,999 | 472 (5.3%) | 539 (6.8%) |
| $45,000 to $49,999 | 479 (5.4%) | 553 (7.0%) |
| $50,000 to $54,999 | 248 (2.8%) | 240 (3.0%) |
| $55,000 to $64,999 | 429 (4.8%) | 436 (5.5%) |
| $65,000 to $74,999 | 538 (6.0%) | 454 (5.7%) |
| $75,000 to $99,999 | 807 (9.1%) | 522 (6.6%) |
| $100,000+ | 1,204 (13.5%) | 592 (7.5%) |
| Total | 8,890 (100.0%) | 7,935 (100.0%) |
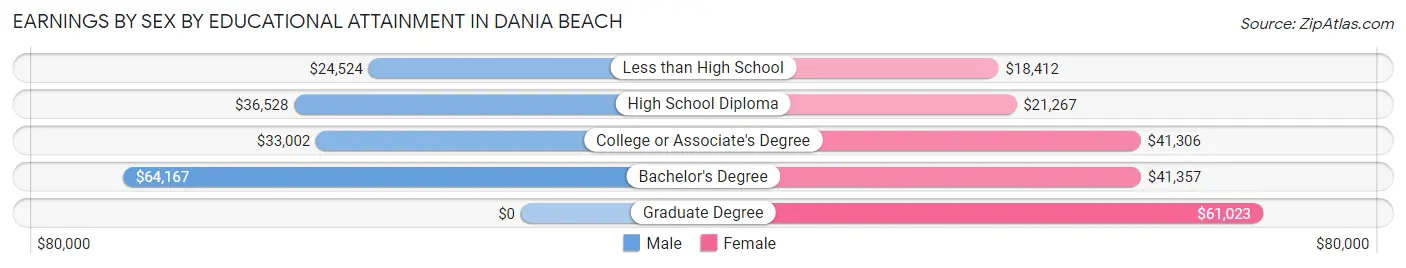
Earnings by Sex by Educational Attainment in Dania Beach
Average earnings in Dania Beach are $40,691 for men and $35,308 for women, a difference of 13.2%. Men with an educational attainment of bachelor's degree enjoy the highest average annual earnings of $64,167, while those with less than high school education earn the least with $24,524. Women with an educational attainment of graduate degree earn the most with the average annual earnings of $61,023, while those with less than high school education have the smallest earnings of $18,412.
| Educational Attainment | Male Income | Female Income |
| Less than High School | $24,524 | $18,412 |
| High School Diploma | $36,528 | $21,267 |
| College or Associate's Degree | $33,002 | $41,306 |
| Bachelor's Degree | $64,167 | $41,357 |
| Graduate Degree | - | - |
| Total | $40,691 | $35,308 |
Family Income in Dania Beach
Family Income Brackets in Dania Beach
According to the Dania Beach family income data, there are 1,209 families falling into the $100,000 to $149,999 income range, which is the most common income bracket and makes up 15.2% of all families. Conversely, the $10,000 to $14,999 income bracket is the least frequent group with only 159 families (2.0%) belonging to this category.
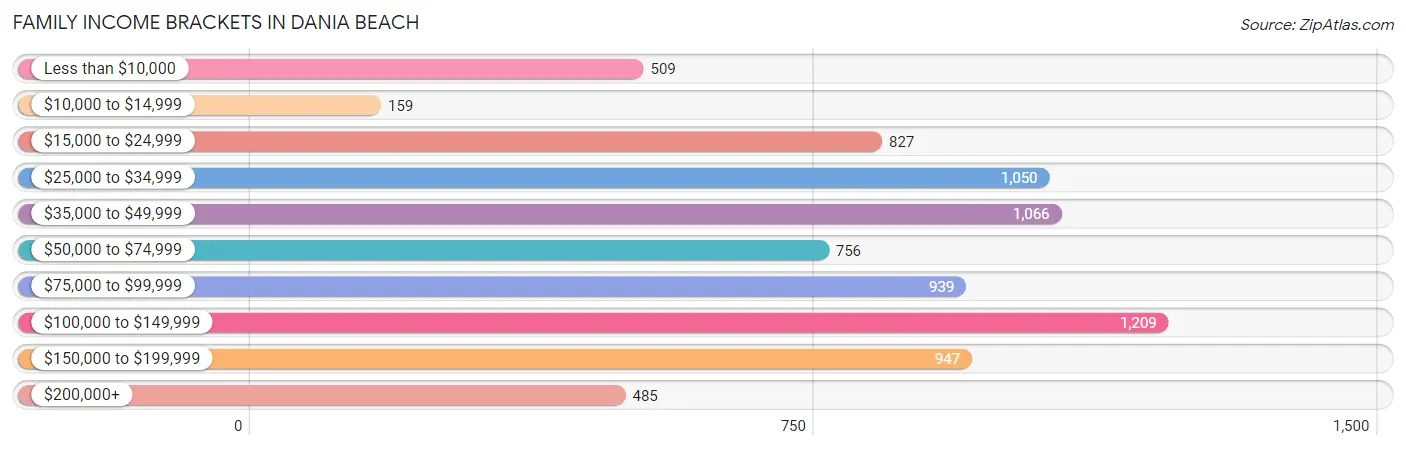
| Income Bracket | # Families | % Families |
| Less than $10,000 | 509 | 6.4% |
| $10,000 to $14,999 | 159 | 2.0% |
| $15,000 to $24,999 | 827 | 10.4% |
| $25,000 to $34,999 | 1,050 | 13.2% |
| $35,000 to $49,999 | 1,066 | 13.4% |
| $50,000 to $74,999 | 756 | 9.5% |
| $75,000 to $99,999 | 939 | 11.8% |
| $100,000 to $149,999 | 1,209 | 15.2% |
| $150,000 to $199,999 | 947 | 11.9% |
| $200,000+ | 485 | 6.1% |
Family Income by Famaliy Size in Dania Beach
6-person families (83 | 1.0%) account for the highest median family income in Dania Beach with $97,723 per family, while 2-person families (4,144 | 52.1%) have the highest median income of $29,830 per family member.
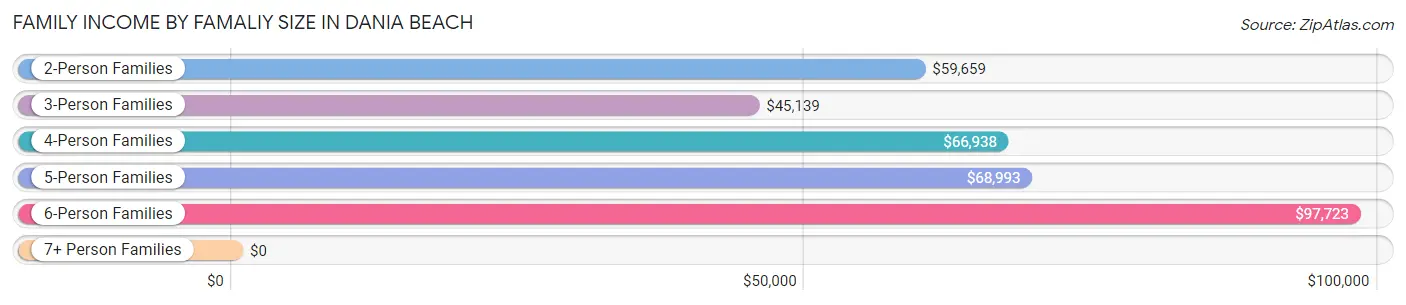
| Income Bracket | # Families | Median Income |
| 2-Person Families | 4,144 (52.1%) | $59,659 |
| 3-Person Families | 1,871 (23.5%) | $45,139 |
| 4-Person Families | 1,251 (15.7%) | $66,938 |
| 5-Person Families | 564 (7.1%) | $68,993 |
| 6-Person Families | 83 (1.0%) | $97,723 |
| 7+ Person Families | 42 (0.5%) | $0 |
| Total | 7,955 (100.0%) | $62,121 |
Family Income by Number of Earners in Dania Beach
The median family income in Dania Beach is $62,121, with families comprising 3+ earners (894) having the highest median family income of $118,432, while families with no earners (1,430) have the lowest median family income of $27,709, accounting for 11.2% and 18.0% of families, respectively.
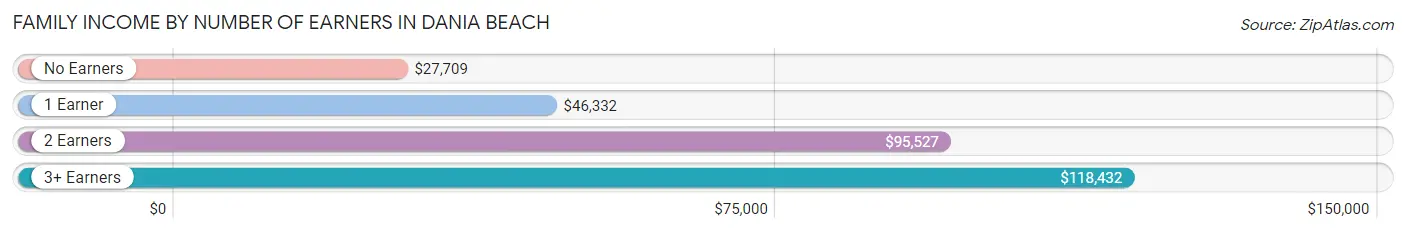
| Number of Earners | # Families | Median Income |
| No Earners | 1,430 (18.0%) | $27,709 |
| 1 Earner | 2,580 (32.4%) | $46,332 |
| 2 Earners | 3,051 (38.4%) | $95,527 |
| 3+ Earners | 894 (11.2%) | $118,432 |
| Total | 7,955 (100.0%) | $62,121 |
Household Income in Dania Beach
Household Income Brackets in Dania Beach
With 1,880 households falling in the category, the $35,000 to $49,999 income range is the most frequent in Dania Beach, accounting for 14.0% of all households. In contrast, only 671 households (5.0%) fall into the $10,000 to $14,999 income bracket, making it the least populous group.
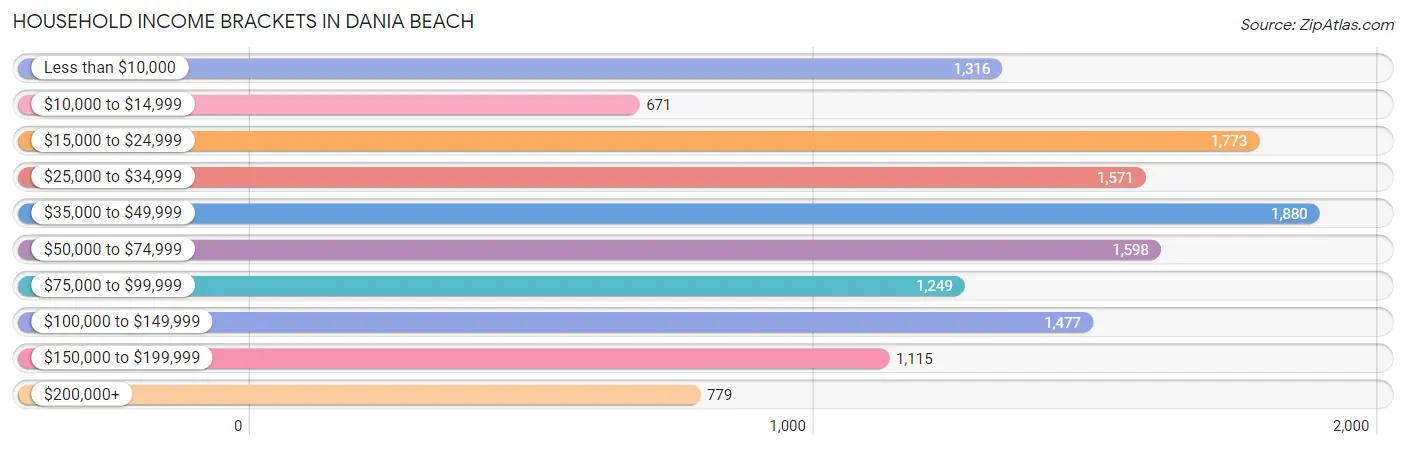
| Income Bracket | # Households | % Households |
| Less than $10,000 | 1,316 | 9.8% |
| $10,000 to $14,999 | 671 | 5.0% |
| $15,000 to $24,999 | 1,773 | 13.2% |
| $25,000 to $34,999 | 1,571 | 11.7% |
| $35,000 to $49,999 | 1,880 | 14.0% |
| $50,000 to $74,999 | 1,598 | 11.9% |
| $75,000 to $99,999 | 1,249 | 9.3% |
| $100,000 to $149,999 | 1,477 | 11.0% |
| $150,000 to $199,999 | 1,115 | 8.3% |
| $200,000+ | 779 | 5.8% |
Household Income by Householder Age in Dania Beach
The median household income in Dania Beach is $46,330, with the highest median household income of $66,698 found in the 45 to 64 years age bracket for the primary householder. A total of 4,613 households (34.4%) fall into this category. Meanwhile, the 15 to 24 years age bracket for the primary householder has the lowest median household income of $0, with 436 households (3.3%) in this group.
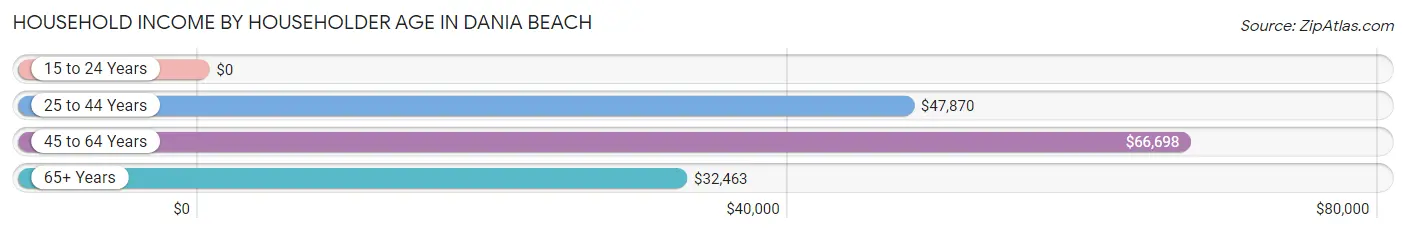
| Income Bracket | # Households | Median Income |
| 15 to 24 Years | 436 (3.3%) | $0 |
| 25 to 44 Years | 4,419 (32.9%) | $47,870 |
| 45 to 64 Years | 4,613 (34.4%) | $66,698 |
| 65+ Years | 3,961 (29.5%) | $32,463 |
| Total | 13,429 (100.0%) | $46,330 |
Poverty in Dania Beach
Income Below Poverty by Sex and Age in Dania Beach
With 17.6% poverty level for males and 20.9% for females among the residents of Dania Beach, 15 year old males and 15 year old females are the most vulnerable to poverty, with 61 males (58.7%) and 28 females (50.0%) in their respective age groups living below the poverty level.
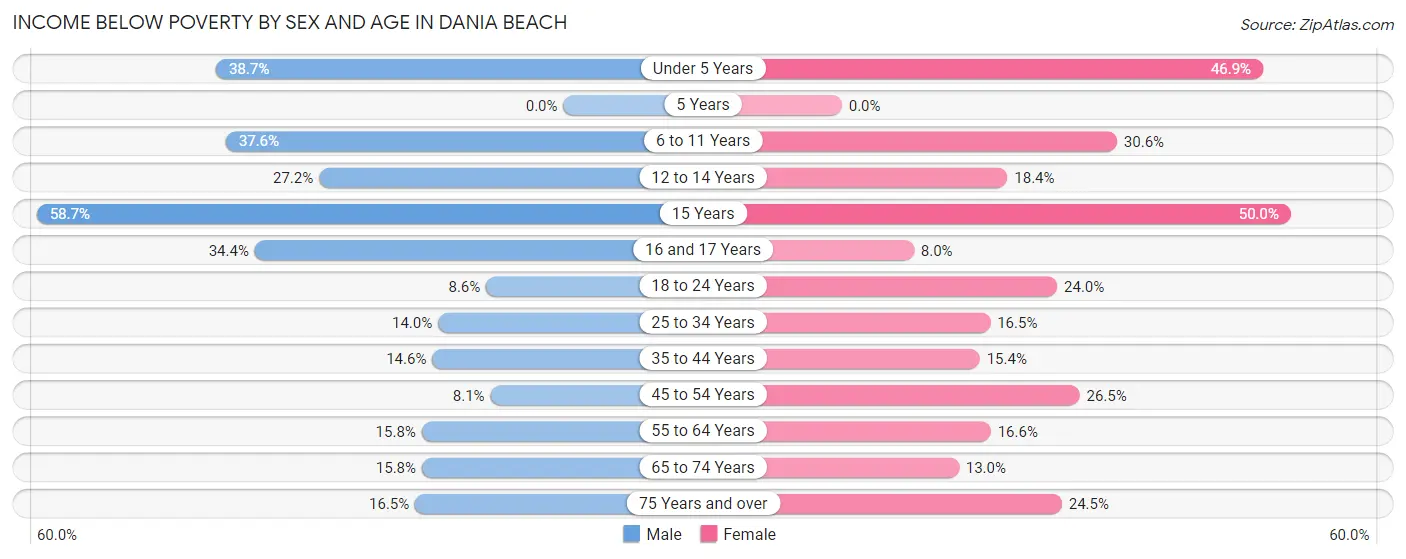
| Age Bracket | Male | Female |
| Under 5 Years | 439 (38.7%) | 401 (46.9%) |
| 5 Years | 0 (0.0%) | 0 (0.0%) |
| 6 to 11 Years | 303 (37.6%) | 303 (30.6%) |
| 12 to 14 Years | 111 (27.2%) | 144 (18.4%) |
| 15 Years | 61 (58.7%) | 28 (50.0%) |
| 16 and 17 Years | 133 (34.4%) | 13 (8.0%) |
| 18 to 24 Years | 75 (8.6%) | 271 (24.0%) |
| 25 to 34 Years | 361 (14.0%) | 444 (16.5%) |
| 35 to 44 Years | 237 (14.6%) | 361 (15.4%) |
| 45 to 54 Years | 182 (8.1%) | 509 (26.5%) |
| 55 to 64 Years | 366 (15.8%) | 342 (16.6%) |
| 65 to 74 Years | 287 (15.8%) | 216 (13.0%) |
| 75 Years and over | 179 (16.5%) | 307 (24.5%) |
| Total | 2,734 (17.6%) | 3,339 (20.9%) |
Income Above Poverty by Sex and Age in Dania Beach
According to the poverty statistics in Dania Beach, males aged 5 years and females aged 5 years are the age groups that are most secure financially, with 100.0% of males and 100.0% of females in these age groups living above the poverty line.
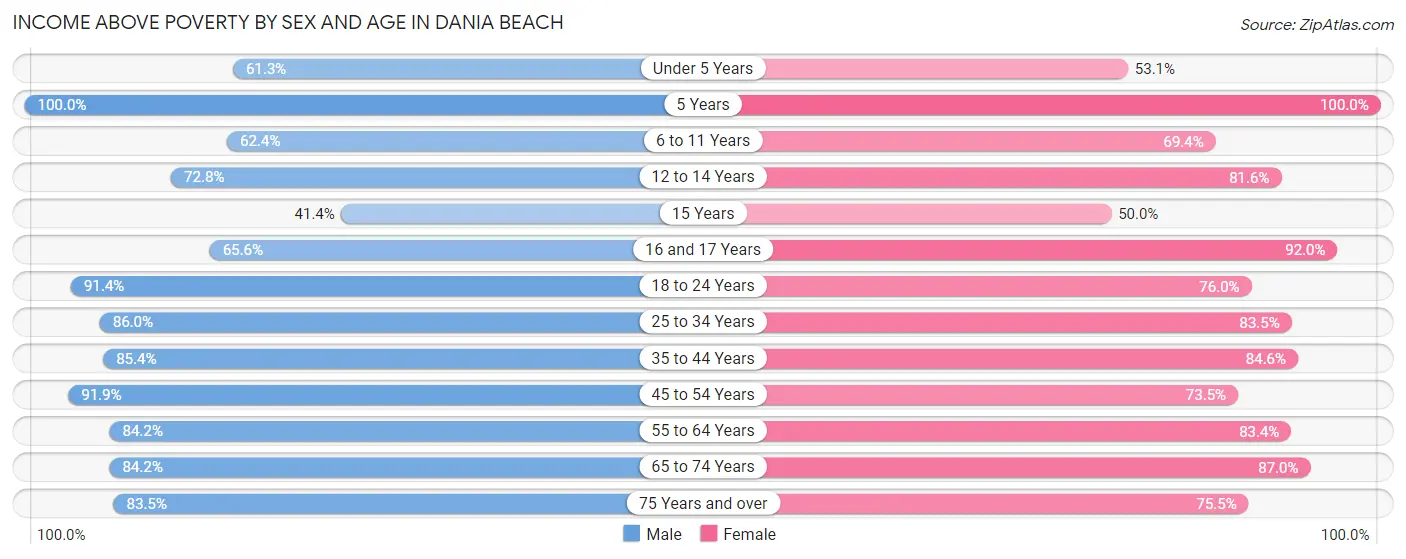
| Age Bracket | Male | Female |
| Under 5 Years | 696 (61.3%) | 454 (53.1%) |
| 5 Years | 108 (100.0%) | 41 (100.0%) |
| 6 to 11 Years | 503 (62.4%) | 686 (69.4%) |
| 12 to 14 Years | 297 (72.8%) | 637 (81.6%) |
| 15 Years | 43 (41.3%) | 28 (50.0%) |
| 16 and 17 Years | 254 (65.6%) | 149 (92.0%) |
| 18 to 24 Years | 797 (91.4%) | 859 (76.0%) |
| 25 to 34 Years | 2,225 (86.0%) | 2,242 (83.5%) |
| 35 to 44 Years | 1,386 (85.4%) | 1,990 (84.6%) |
| 45 to 54 Years | 2,058 (91.9%) | 1,413 (73.5%) |
| 55 to 64 Years | 1,954 (84.2%) | 1,719 (83.4%) |
| 65 to 74 Years | 1,534 (84.2%) | 1,442 (87.0%) |
| 75 Years and over | 905 (83.5%) | 946 (75.5%) |
| Total | 12,760 (82.4%) | 12,606 (79.1%) |
Income Below Poverty Among Married-Couple Families in Dania Beach
The poverty statistics for married-couple families in Dania Beach show that 8.6% or 435 of the total 5,031 families live below the poverty line. Families with 3 or 4 children have the highest poverty rate of 32.5%, comprising of 137 families. On the other hand, families with 5 or more children have the lowest poverty rate of 0.0%, which includes 0 families.
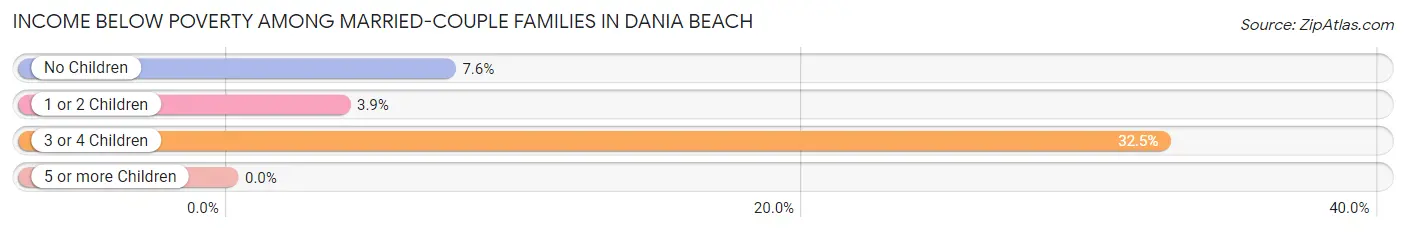
| Children | Above Poverty | Below Poverty |
| No Children | 2,991 (92.4%) | 245 (7.6%) |
| 1 or 2 Children | 1,307 (96.1%) | 53 (3.9%) |
| 3 or 4 Children | 285 (67.5%) | 137 (32.5%) |
| 5 or more Children | 13 (100.0%) | 0 (0.0%) |
| Total | 4,596 (91.3%) | 435 (8.6%) |
Income Below Poverty Among Single-Parent Households in Dania Beach
According to the poverty data in Dania Beach, 9.0% or 56 single-father households and 32.6% or 752 single-mother households are living below the poverty line. Among single-father households, those with no children have the highest poverty rate, with 50 households (10.6%) experiencing poverty. Likewise, among single-mother households, those with 3 or 4 children have the highest poverty rate, with 260 households (98.1%) falling below the poverty line.
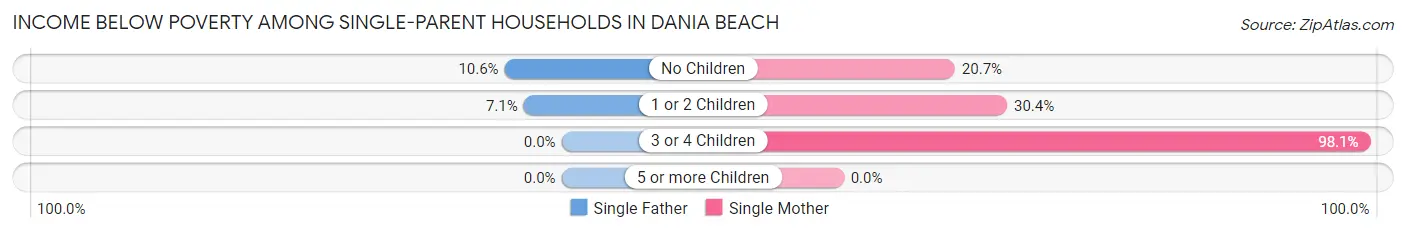
| Children | Single Father | Single Mother |
| No Children | 50 (10.6%) | 275 (20.7%) |
| 1 or 2 Children | 6 (7.1%) | 217 (30.4%) |
| 3 or 4 Children | 0 (0.0%) | 260 (98.1%) |
| 5 or more Children | 0 (0.0%) | 0 (0.0%) |
| Total | 56 (9.0%) | 752 (32.6%) |
Income Below Poverty Among Married-Couple vs Single-Parent Households in Dania Beach
The poverty data for Dania Beach shows that 435 of the married-couple family households (8.6%) and 808 of the single-parent households (27.6%) are living below the poverty level. Within the married-couple family households, those with 3 or 4 children have the highest poverty rate, with 137 households (32.5%) falling below the poverty line. Among the single-parent households, those with 3 or 4 children have the highest poverty rate, with 260 household (79.3%) living below poverty.
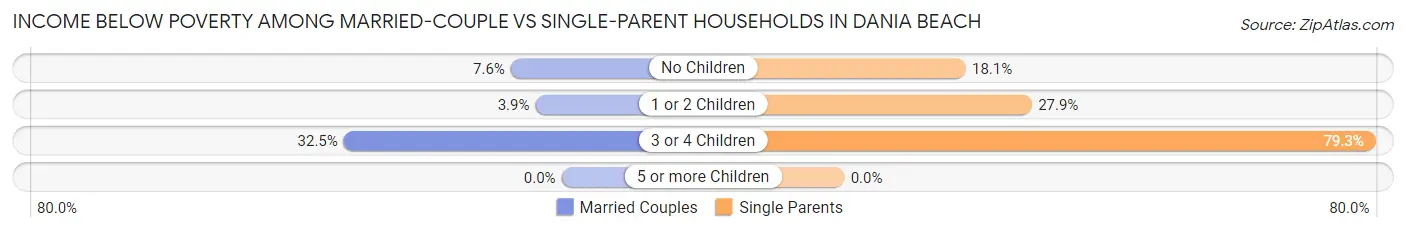
| Children | Married-Couple Families | Single-Parent Households |
| No Children | 245 (7.6%) | 325 (18.1%) |
| 1 or 2 Children | 53 (3.9%) | 223 (27.9%) |
| 3 or 4 Children | 137 (32.5%) | 260 (79.3%) |
| 5 or more Children | 0 (0.0%) | 0 (0.0%) |
| Total | 435 (8.6%) | 808 (27.6%) |
Race in Dania Beach
The most populous races in Dania Beach are White / Caucasian (18,049 | 56.9%), Hispanic or Latino (10,871 | 34.3%), and Black / African American (6,525 | 20.6%).
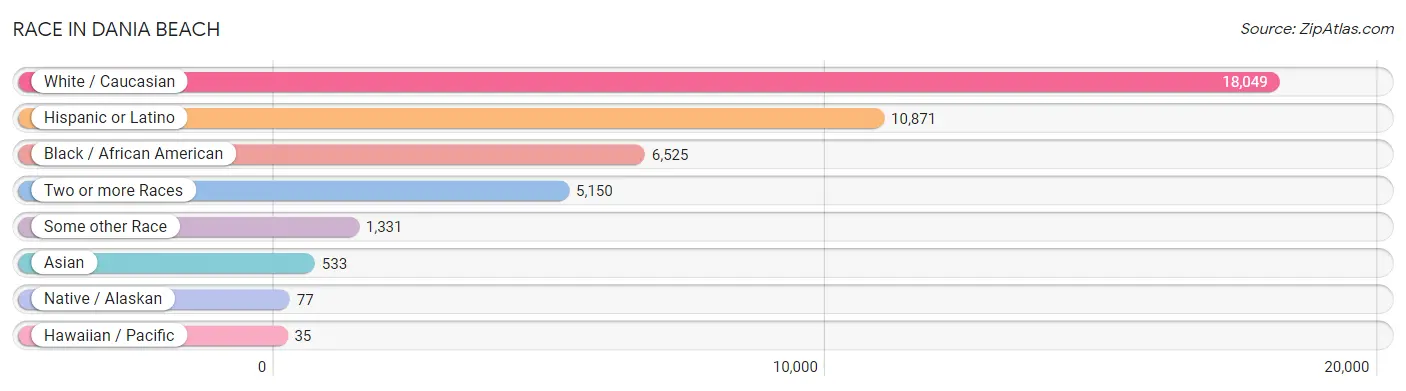
| Race | # Population | % Population |
| Asian | 533 | 1.7% |
| Black / African American | 6,525 | 20.6% |
| Hawaiian / Pacific | 35 | 0.1% |
| Hispanic or Latino | 10,871 | 34.3% |
| Native / Alaskan | 77 | 0.2% |
| White / Caucasian | 18,049 | 56.9% |
| Two or more Races | 5,150 | 16.3% |
| Some other Race | 1,331 | 4.2% |
| Total | 31,700 | 100.0% |
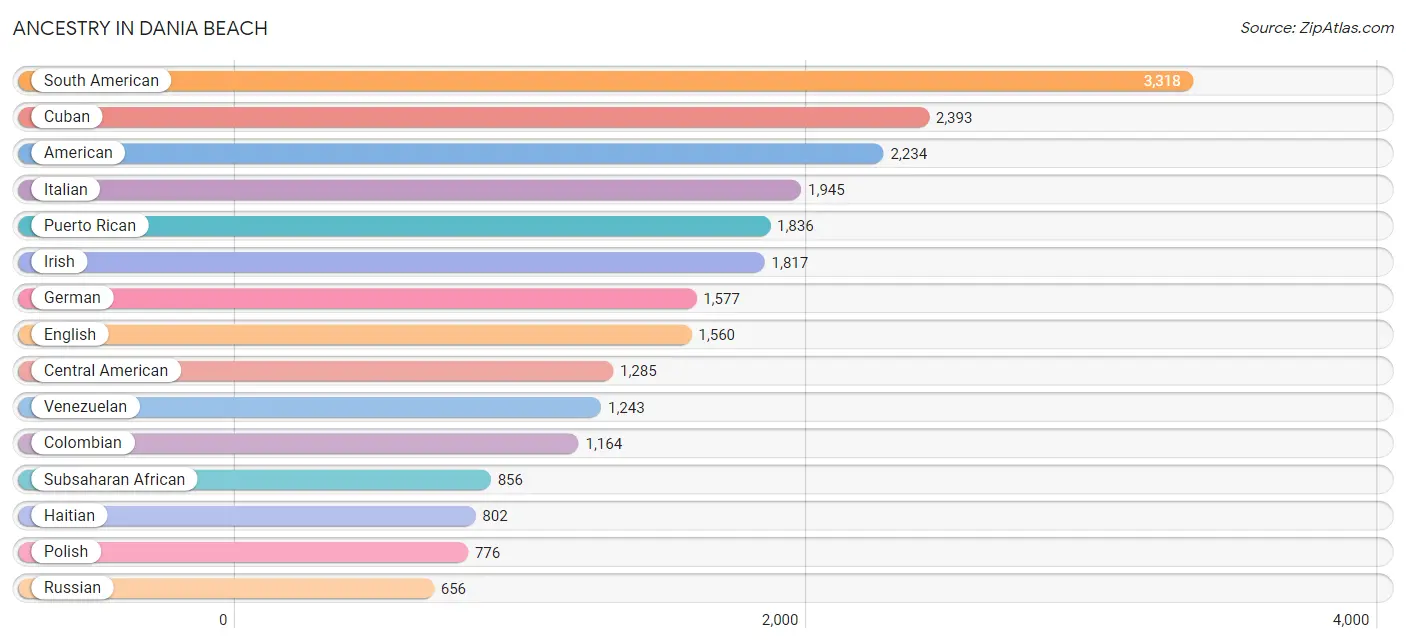
Ancestry in Dania Beach
The most populous ancestries reported in Dania Beach are South American (3,318 | 10.5%), Cuban (2,393 | 7.5%), American (2,234 | 7.0%), Italian (1,945 | 6.1%), and Puerto Rican (1,836 | 5.8%), together accounting for 37.0% of all Dania Beach residents.
| Ancestry | # Population | % Population |
| African | 602 | 1.9% |
| American | 2,234 | 7.0% |
| Arab | 132 | 0.4% |
| Argentinean | 64 | 0.2% |
| Armenian | 20 | 0.1% |
| Austrian | 42 | 0.1% |
| Bahamian | 395 | 1.3% |
| Barbadian | 85 | 0.3% |
| Basque | 15 | 0.1% |
| Belgian | 20 | 0.1% |
| Belizean | 49 | 0.2% |
| Bhutanese | 80 | 0.3% |
| Bolivian | 44 | 0.1% |
| Brazilian | 329 | 1.0% |
| British | 152 | 0.5% |
| British West Indian | 45 | 0.1% |
| Bulgarian | 1 | 0.0% |
| Canadian | 24 | 0.1% |
| Central American | 1,285 | 4.1% |
| Central American Indian | 84 | 0.3% |
| Chilean | 122 | 0.4% |
| Choctaw | 16 | 0.1% |
| Colombian | 1,164 | 3.7% |
| Costa Rican | 9 | 0.0% |
| Croatian | 57 | 0.2% |
| Cuban | 2,393 | 7.5% |
| Czech | 294 | 0.9% |
| Czechoslovakian | 13 | 0.0% |
| Danish | 144 | 0.4% |
| Dominican | 528 | 1.7% |
| Dutch | 59 | 0.2% |
| Eastern European | 119 | 0.4% |
| Ecuadorian | 247 | 0.8% |
| Egyptian | 13 | 0.0% |
| English | 1,560 | 4.9% |
| European | 195 | 0.6% |
| French | 612 | 1.9% |
| French Canadian | 398 | 1.3% |
| German | 1,577 | 5.0% |
| Greek | 41 | 0.1% |
| Guamanian / Chamorro | 35 | 0.1% |
| Guatemalan | 27 | 0.1% |
| Guyanese | 50 | 0.2% |
| Haitian | 802 | 2.5% |
| Honduran | 430 | 1.4% |
| Hungarian | 407 | 1.3% |
| Indian (Asian) | 249 | 0.8% |
| Iranian | 50 | 0.2% |
| Irish | 1,817 | 5.7% |
| Israeli | 182 | 0.6% |
| Italian | 1,945 | 6.1% |
| Jamaican | 372 | 1.2% |
| Japanese | 48 | 0.2% |
| Korean | 147 | 0.5% |
| Latvian | 36 | 0.1% |
| Lebanese | 7 | 0.0% |
| Lithuanian | 102 | 0.3% |
| Mexican | 624 | 2.0% |
| Mongolian | 6 | 0.0% |
| Moroccan | 18 | 0.1% |
| Navajo | 9 | 0.0% |
| New Zealander | 38 | 0.1% |
| Nicaraguan | 504 | 1.6% |
| Norwegian | 90 | 0.3% |
| Panamanian | 44 | 0.1% |
| Paraguayan | 10 | 0.0% |
| Peruvian | 379 | 1.2% |
| Polish | 776 | 2.5% |
| Portuguese | 94 | 0.3% |
| Potawatomi | 38 | 0.1% |
| Puerto Rican | 1,836 | 5.8% |
| Romanian | 368 | 1.2% |
| Russian | 656 | 2.1% |
| Salvadoran | 271 | 0.9% |
| Scandinavian | 19 | 0.1% |
| Scotch-Irish | 118 | 0.4% |
| Scottish | 242 | 0.8% |
| Serbian | 390 | 1.2% |
| Sioux | 10 | 0.0% |
| Slavic | 46 | 0.2% |
| Slovak | 27 | 0.1% |
| Slovene | 4 | 0.0% |
| South African | 76 | 0.2% |
| South American | 3,318 | 10.5% |
| Spaniard | 421 | 1.3% |
| Spanish | 90 | 0.3% |
| Sri Lankan | 67 | 0.2% |
| Subsaharan African | 856 | 2.7% |
| Sudanese | 178 | 0.6% |
| Swedish | 67 | 0.2% |
| Swiss | 20 | 0.1% |
| Syrian | 94 | 0.3% |
| Thai | 99 | 0.3% |
| Trinidadian and Tobagonian | 29 | 0.1% |
| Ukrainian | 235 | 0.7% |
| Uruguayan | 9 | 0.0% |
| Venezuelan | 1,243 | 3.9% |
| Welsh | 58 | 0.2% |
| West Indian | 40 | 0.1% |
| Yugoslavian | 12 | 0.0% | View All 100 Rows |
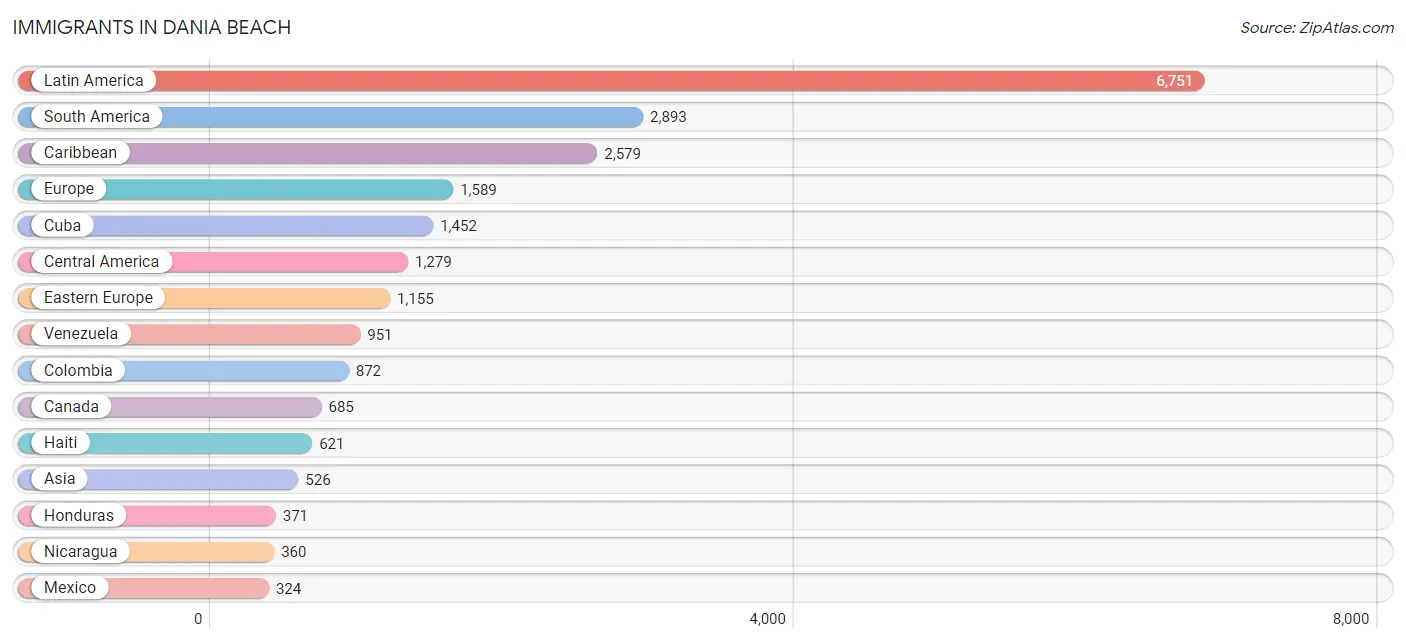
Immigrants in Dania Beach
The most numerous immigrant groups reported in Dania Beach came from Latin America (6,751 | 21.3%), South America (2,893 | 9.1%), Caribbean (2,579 | 8.1%), Europe (1,589 | 5.0%), and Cuba (1,452 | 4.6%), together accounting for 48.2% of all Dania Beach residents.
| Immigration Origin | # Population | % Population |
| Africa | 141 | 0.4% |
| Argentina | 18 | 0.1% |
| Armenia | 25 | 0.1% |
| Asia | 526 | 1.7% |
| Bahamas | 86 | 0.3% |
| Bolivia | 33 | 0.1% |
| Brazil | 314 | 1.0% |
| Bulgaria | 14 | 0.0% |
| Cambodia | 30 | 0.1% |
| Canada | 685 | 2.2% |
| Caribbean | 2,579 | 8.1% |
| Central America | 1,279 | 4.0% |
| Chile | 137 | 0.4% |
| China | 134 | 0.4% |
| Colombia | 872 | 2.8% |
| Costa Rica | 9 | 0.0% |
| Croatia | 57 | 0.2% |
| Cuba | 1,452 | 4.6% |
| Czechoslovakia | 111 | 0.4% |
| Dominican Republic | 310 | 1.0% |
| Eastern Asia | 175 | 0.5% |
| Eastern Europe | 1,155 | 3.6% |
| Ecuador | 218 | 0.7% |
| El Salvador | 138 | 0.4% |
| England | 87 | 0.3% |
| Europe | 1,589 | 5.0% |
| France | 166 | 0.5% |
| Germany | 23 | 0.1% |
| Greece | 23 | 0.1% |
| Guatemala | 7 | 0.0% |
| Guyana | 50 | 0.2% |
| Haiti | 621 | 2.0% |
| Honduras | 371 | 1.2% |
| Hong Kong | 14 | 0.0% |
| Hungary | 152 | 0.5% |
| India | 29 | 0.1% |
| Iran | 50 | 0.2% |
| Ireland | 14 | 0.0% |
| Israel | 116 | 0.4% |
| Italy | 46 | 0.2% |
| Jamaica | 26 | 0.1% |
| Japan | 41 | 0.1% |
| Latin America | 6,751 | 21.3% |
| Lebanon | 7 | 0.0% |
| Malaysia | 6 | 0.0% |
| Mexico | 324 | 1.0% |
| Nicaragua | 360 | 1.1% |
| Northern Africa | 65 | 0.2% |
| Northern Europe | 140 | 0.4% |
| Oceania | 17 | 0.1% |
| Panama | 70 | 0.2% |
| Peru | 289 | 0.9% |
| Philippines | 50 | 0.2% |
| Poland | 117 | 0.4% |
| Portugal | 10 | 0.0% |
| Romania | 311 | 1.0% |
| Russia | 217 | 0.7% |
| Scotland | 39 | 0.1% |
| Serbia | 19 | 0.1% |
| South Africa | 76 | 0.2% |
| South America | 2,893 | 9.1% |
| South Central Asia | 86 | 0.3% |
| South Eastern Asia | 86 | 0.3% |
| Southern Europe | 105 | 0.3% |
| Spain | 26 | 0.1% |
| Sudan | 65 | 0.2% |
| Syria | 31 | 0.1% |
| Taiwan | 49 | 0.2% |
| Trinidad and Tobago | 60 | 0.2% |
| Ukraine | 70 | 0.2% |
| Uruguay | 1 | 0.0% |
| Uzbekistan | 7 | 0.0% |
| Venezuela | 951 | 3.0% |
| Western Asia | 179 | 0.6% |
| Western Europe | 189 | 0.6% | View All 75 Rows |
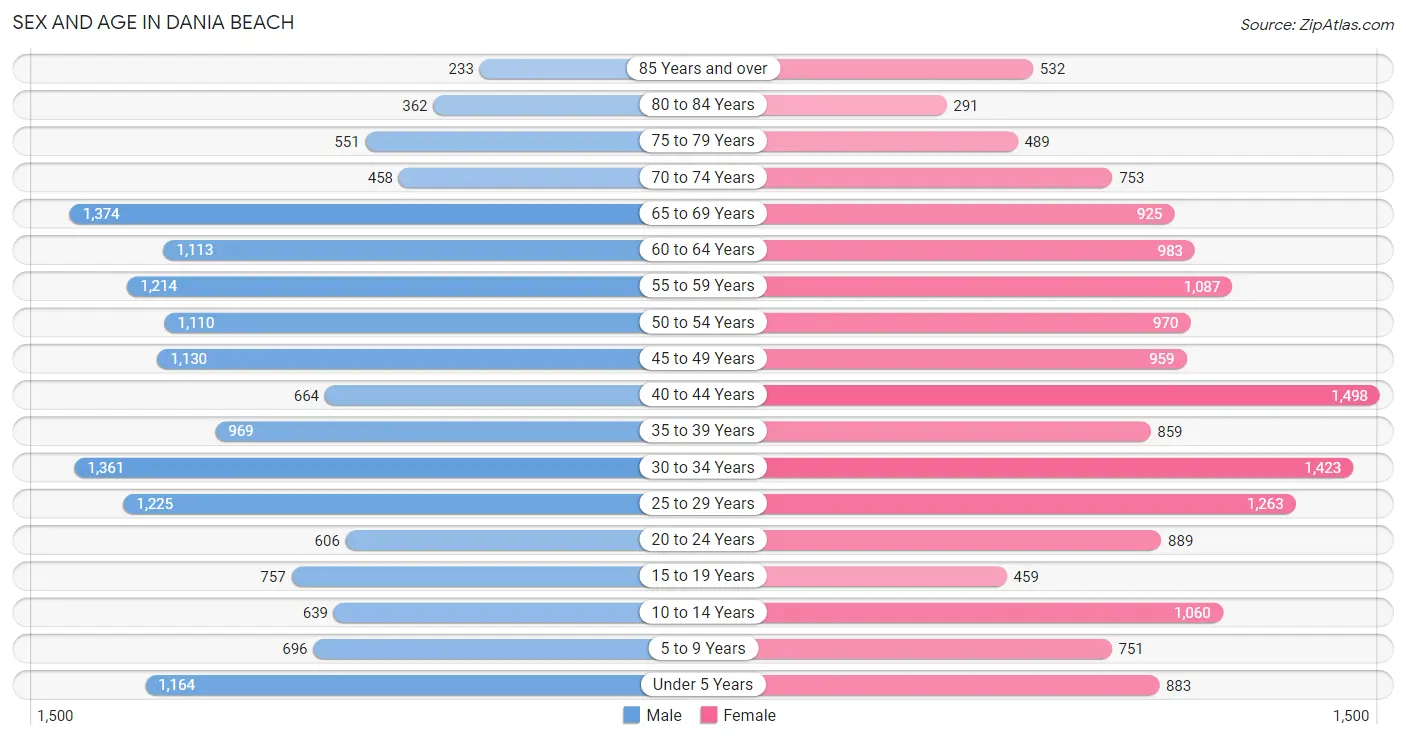
Sex and Age in Dania Beach
Sex and Age in Dania Beach
The most populous age groups in Dania Beach are 65 to 69 Years (1,374 | 8.8%) for men and 40 to 44 Years (1,498 | 9.3%) for women.
| Age Bracket | Male | Female |
| Under 5 Years | 1,164 (7.4%) | 883 (5.5%) |
| 5 to 9 Years | 696 (4.4%) | 751 (4.7%) |
| 10 to 14 Years | 639 (4.1%) | 1,060 (6.6%) |
| 15 to 19 Years | 757 (4.8%) | 459 (2.9%) |
| 20 to 24 Years | 606 (3.9%) | 889 (5.5%) |
| 25 to 29 Years | 1,225 (7.8%) | 1,263 (7.9%) |
| 30 to 34 Years | 1,361 (8.7%) | 1,423 (8.8%) |
| 35 to 39 Years | 969 (6.2%) | 859 (5.3%) |
| 40 to 44 Years | 664 (4.3%) | 1,498 (9.3%) |
| 45 to 49 Years | 1,130 (7.2%) | 959 (6.0%) |
| 50 to 54 Years | 1,110 (7.1%) | 970 (6.0%) |
| 55 to 59 Years | 1,214 (7.8%) | 1,087 (6.8%) |
| 60 to 64 Years | 1,113 (7.1%) | 983 (6.1%) |
| 65 to 69 Years | 1,374 (8.8%) | 925 (5.8%) |
| 70 to 74 Years | 458 (2.9%) | 753 (4.7%) |
| 75 to 79 Years | 551 (3.5%) | 489 (3.0%) |
| 80 to 84 Years | 362 (2.3%) | 291 (1.8%) |
| 85 Years and over | 233 (1.5%) | 532 (3.3%) |
| Total | 15,626 (100.0%) | 16,074 (100.0%) |
Families and Households in Dania Beach
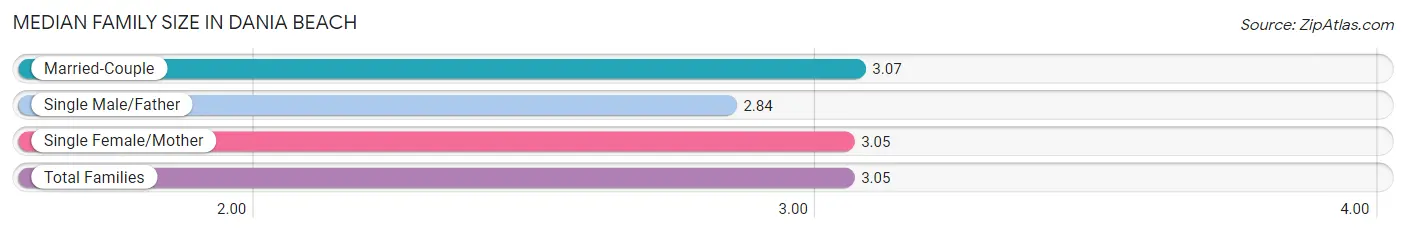
Median Family Size in Dania Beach
The median family size in Dania Beach is 3.05 persons per family, with married-couple families (5,031 | 63.2%) accounting for the largest median family size of 3.07 persons per family. On the other hand, single male/father families (619 | 7.8%) represent the smallest median family size with 2.84 persons per family.
| Family Type | # Families | Family Size |
| Married-Couple | 5,031 (63.2%) | 3.07 |
| Single Male/Father | 619 (7.8%) | 2.84 |
| Single Female/Mother | 2,305 (29.0%) | 3.05 |
| Total Families | 7,955 (100.0%) | 3.05 |
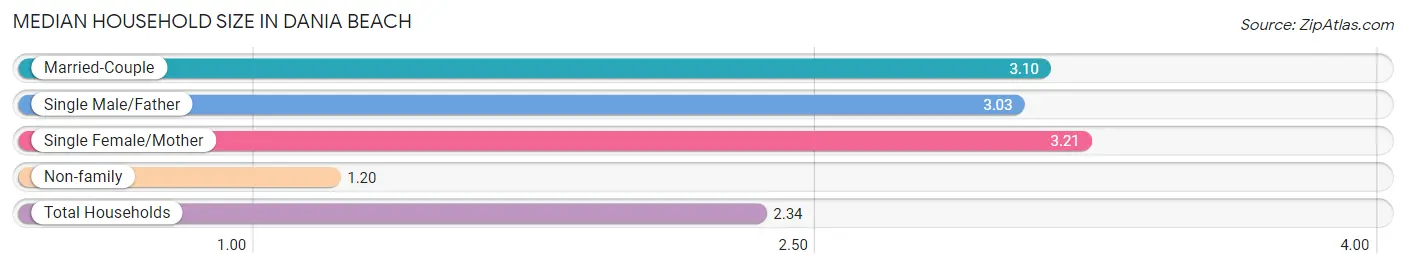
Median Household Size in Dania Beach
The median household size in Dania Beach is 2.34 persons per household, with single female/mother households (2,305 | 17.2%) accounting for the largest median household size of 3.21 persons per household. non-family households (5,474 | 40.8%) represent the smallest median household size with 1.20 persons per household.
| Household Type | # Households | Household Size |
| Married-Couple | 5,031 (37.5%) | 3.10 |
| Single Male/Father | 619 (4.6%) | 3.03 |
| Single Female/Mother | 2,305 (17.2%) | 3.21 |
| Non-family | 5,474 (40.8%) | 1.20 |
| Total Households | 13,429 (100.0%) | 2.34 |
Household Size by Marriage Status in Dania Beach
Out of a total of 13,429 households in Dania Beach, 7,955 (59.2%) are family households, while 5,474 (40.8%) are nonfamily households. The most numerous type of family households are 2-person households, comprising 3,938, and the most common type of nonfamily households are 1-person households, comprising 4,550.
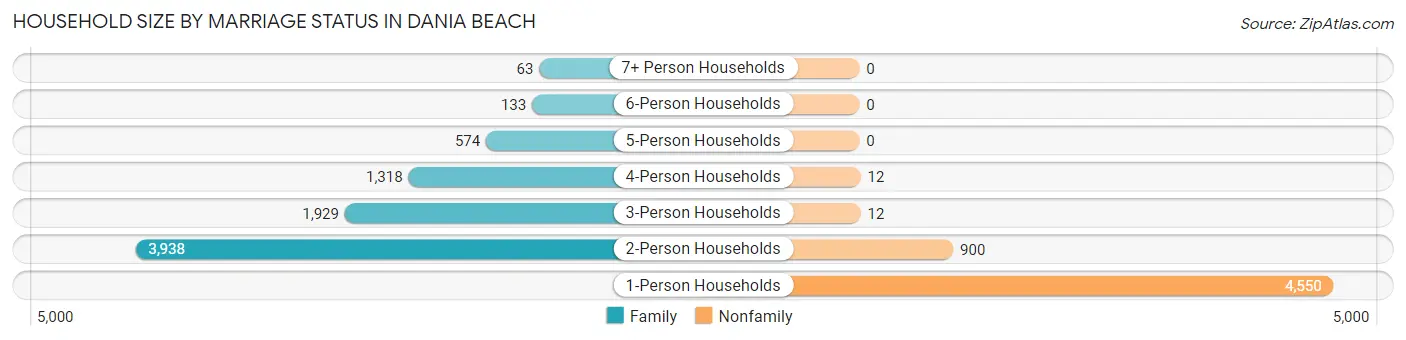
| Household Size | Family Households | Nonfamily Households |
| 1-Person Households | - | 4,550 (33.9%) |
| 2-Person Households | 3,938 (29.3%) | 900 (6.7%) |
| 3-Person Households | 1,929 (14.4%) | 12 (0.1%) |
| 4-Person Households | 1,318 (9.8%) | 12 (0.1%) |
| 5-Person Households | 574 (4.3%) | 0 (0.0%) |
| 6-Person Households | 133 (1.0%) | 0 (0.0%) |
| 7+ Person Households | 63 (0.5%) | 0 (0.0%) |
| Total | 7,955 (59.2%) | 5,474 (40.8%) |
Female Fertility in Dania Beach
Fertility by Age in Dania Beach
Average fertility rate in Dania Beach is 65.0 births per 1,000 women. Women in the age bracket of 20 to 34 years have the highest fertility rate with 110.0 births per 1,000 women. Women in the age bracket of 20 to 34 years acount for 79.5% of all women with births.
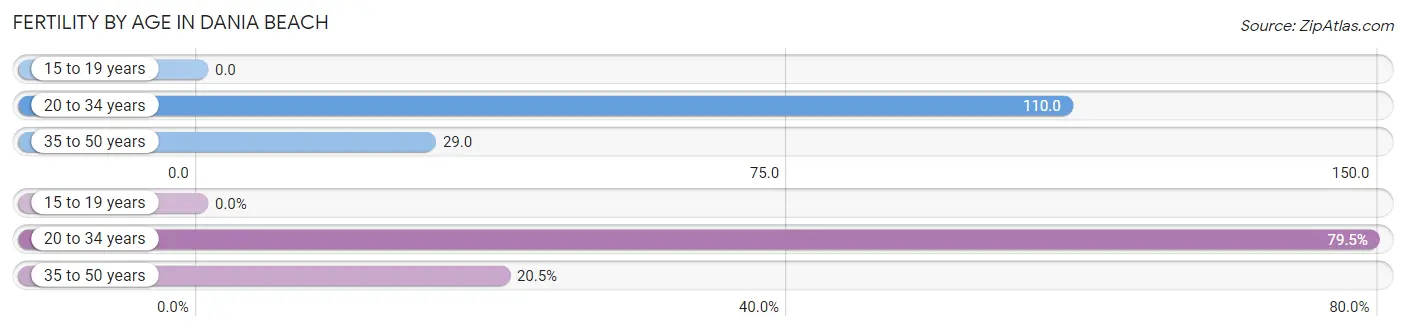
| Age Bracket | Women with Births | Births / 1,000 Women |
| 15 to 19 years | 0 (0.0%) | 0.0 |
| 20 to 34 years | 392 (79.5%) | 110.0 |
| 35 to 50 years | 101 (20.5%) | 29.0 |
| Total | 493 (100.0%) | 65.0 |
Fertility by Age by Marriage Status in Dania Beach
61.5% of women with births (493) in Dania Beach are married. The highest percentage of unmarried women with births falls into 20 to 34 years age bracket with 39.5% of them unmarried at the time of birth, while the lowest percentage of unmarried women with births belong to 35 to 50 years age bracket with 34.7% of them unmarried.
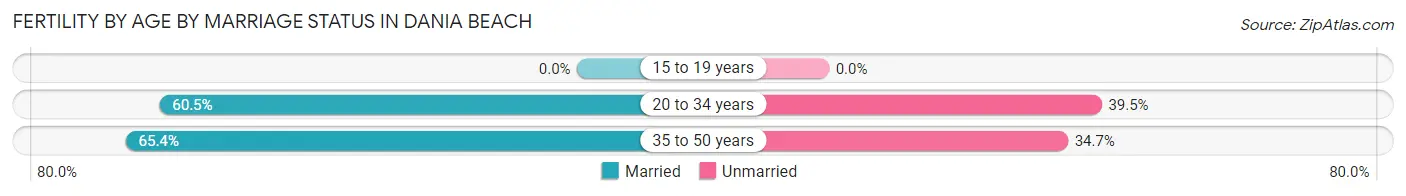
| Age Bracket | Married | Unmarried |
| 15 to 19 years | 0 (0.0%) | 0 (0.0%) |
| 20 to 34 years | 237 (60.5%) | 155 (39.5%) |
| 35 to 50 years | 66 (65.3%) | 35 (34.6%) |
| Total | 303 (61.5%) | 190 (38.5%) |
Fertility by Education in Dania Beach
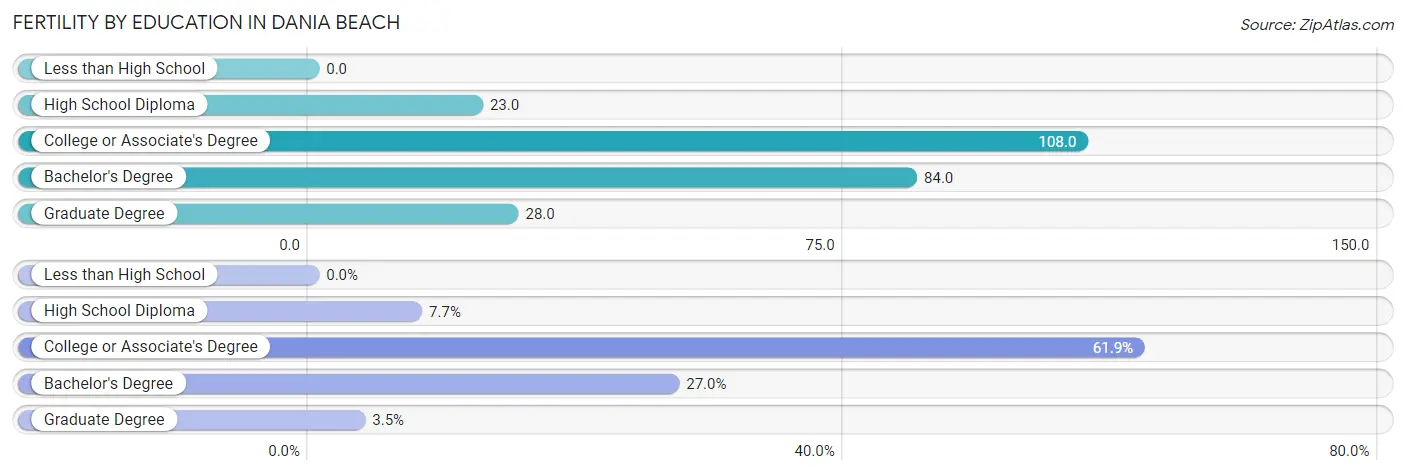
| Educational Attainment | Women with Births | Births / 1,000 Women |
| Less than High School | 0 (0.0%) | 0.0 |
| High School Diploma | 38 (7.7%) | 23.0 |
| College or Associate's Degree | 305 (61.9%) | 108.0 |
| Bachelor's Degree | 133 (27.0%) | 84.0 |
| Graduate Degree | 17 (3.5%) | 28.0 |
| Total | 493 (100.0%) | 65.0 |
Fertility by Education by Marriage Status in Dania Beach
38.5% of women with births in Dania Beach are unmarried. Women with the educational attainment of graduate degree are most likely to be married with 100.0% of them married at childbirth, while women with the educational attainment of high school diploma are least likely to be married with 63.2% of them unmarried at childbirth.
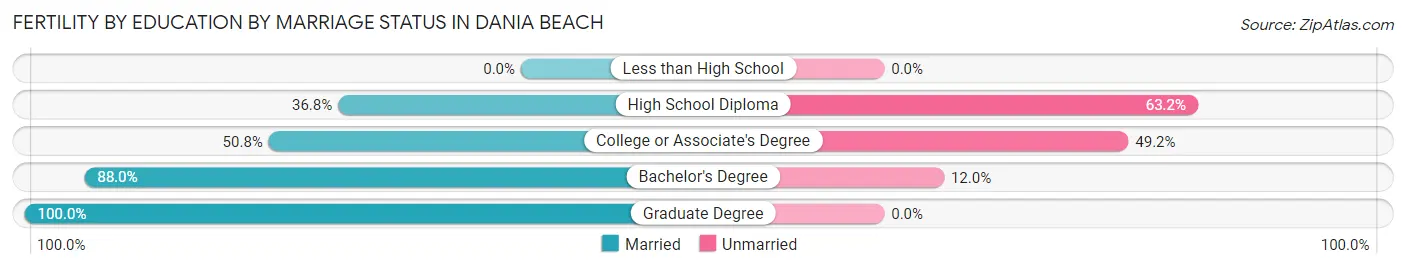
| Educational Attainment | Married | Unmarried |
| Less than High School | 0 (0.0%) | 0 (0.0%) |
| High School Diploma | 14 (36.8%) | 24 (63.2%) |
| College or Associate's Degree | 155 (50.8%) | 150 (49.2%) |
| Bachelor's Degree | 117 (88.0%) | 16 (12.0%) |
| Graduate Degree | 17 (100.0%) | 0 (0.0%) |
| Total | 303 (61.5%) | 190 (38.5%) |
Employment Characteristics in Dania Beach
Employment by Class of Employer in Dania Beach
Among the 15,132 employed individuals in Dania Beach, private company employees (10,527 | 69.6%), self-employed (not incorporated) (1,280 | 8.5%), and self-employed (incorporated) (1,152 | 7.6%) make up the most common classes of employment.
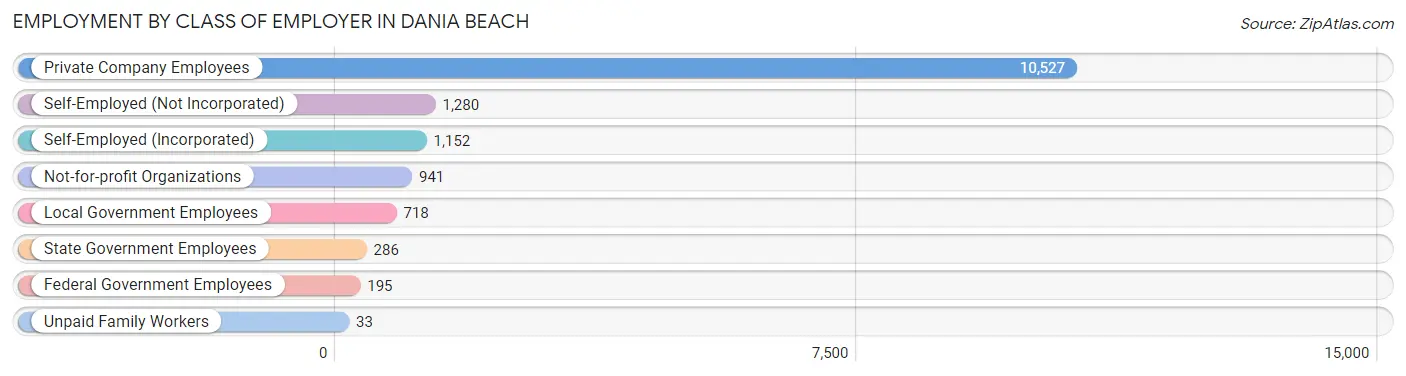
| Employer Class | # Employees | % Employees |
| Private Company Employees | 10,527 | 69.6% |
| Self-Employed (Incorporated) | 1,152 | 7.6% |
| Self-Employed (Not Incorporated) | 1,280 | 8.5% |
| Not-for-profit Organizations | 941 | 6.2% |
| Local Government Employees | 718 | 4.7% |
| State Government Employees | 286 | 1.9% |
| Federal Government Employees | 195 | 1.3% |
| Unpaid Family Workers | 33 | 0.2% |
| Total | 15,132 | 100.0% |
Employment Status by Age in Dania Beach
According to the labor force statistics for Dania Beach, out of the total population over 16 years of age (26,347), 63.9% or 16,836 individuals are in the labor force, with 9.0% or 1,515 of them unemployed. The age group with the highest labor force participation rate is 20 to 24 years, with 87.3% or 1,305 individuals in the labor force. Within the labor force, the 16 to 19 years age range has the highest percentage of unemployed individuals, with 34.6% or 79 of them being unemployed.
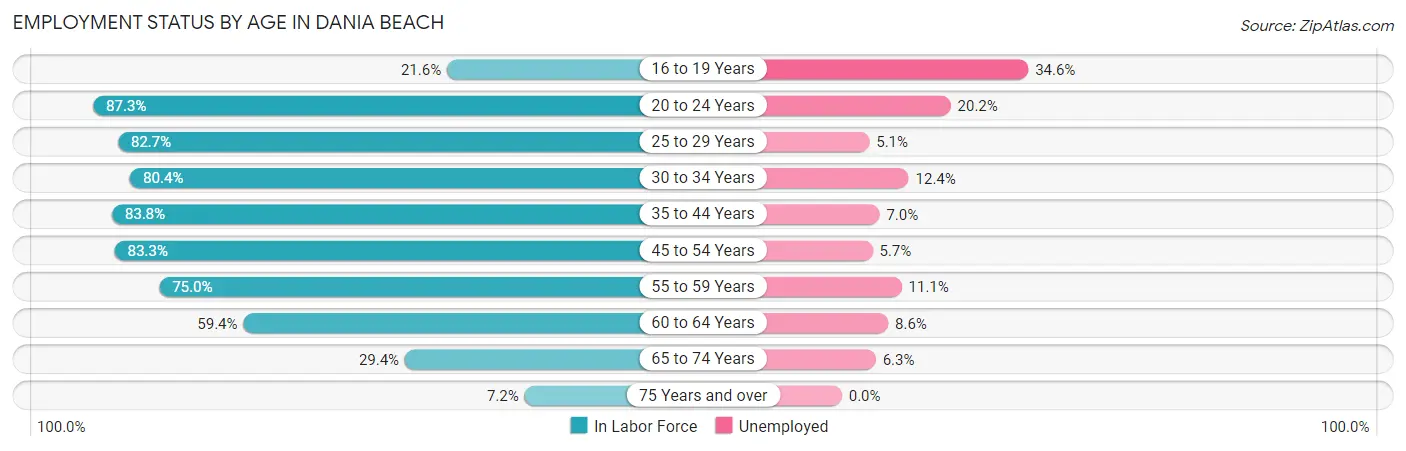
| Age Bracket | In Labor Force | Unemployed |
| 16 to 19 Years | 228 (21.6%) | 79 (34.6%) |
| 20 to 24 Years | 1,305 (87.3%) | 264 (20.2%) |
| 25 to 29 Years | 2,058 (82.7%) | 105 (5.1%) |
| 30 to 34 Years | 2,238 (80.4%) | 278 (12.4%) |
| 35 to 44 Years | 3,344 (83.8%) | 234 (7.0%) |
| 45 to 54 Years | 3,473 (83.3%) | 198 (5.7%) |
| 55 to 59 Years | 1,726 (75.0%) | 192 (11.1%) |
| 60 to 64 Years | 1,245 (59.4%) | 107 (8.6%) |
| 65 to 74 Years | 1,032 (29.4%) | 65 (6.3%) |
| 75 Years and over | 177 (7.2%) | 0 (0.0%) |
| Total | 16,836 (63.9%) | 1,515 (9.0%) |
Employment Status by Educational Attainment in Dania Beach
According to labor force statistics for Dania Beach, 79.0% of individuals (14,084) out of the total population between 25 and 64 years of age (17,828) are in the labor force, with 7.9% or 1,113 of them being unemployed. The group with the highest labor force participation rate are those with the educational attainment of bachelor's degree or higher, with 81.9% or 5,130 individuals in the labor force. Within the labor force, individuals with less than high school education have the highest percentage of unemployment, with 25.4% or 235 of them being unemployed.
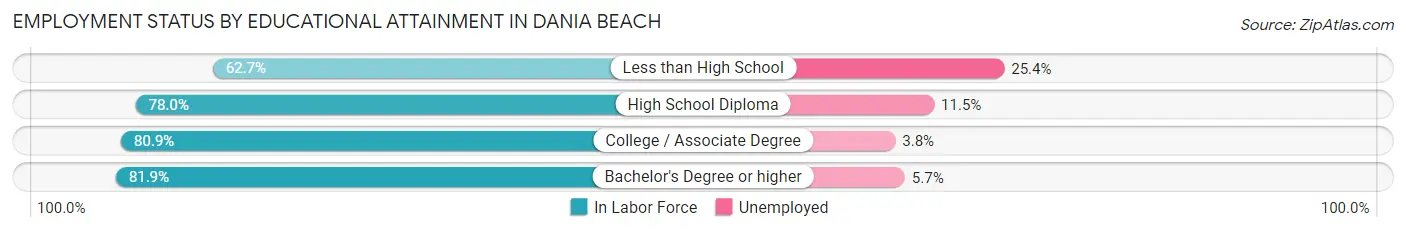
| Educational Attainment | In Labor Force | Unemployed |
| Less than High School | 924 (62.7%) | 374 (25.4%) |
| High School Diploma | 3,659 (78.0%) | 539 (11.5%) |
| College / Associate Degree | 4,368 (80.9%) | 205 (3.8%) |
| Bachelor's Degree or higher | 5,130 (81.9%) | 357 (5.7%) |
| Total | 14,084 (79.0%) | 1,408 (7.9%) |
Employment Occupations by Sex in Dania Beach
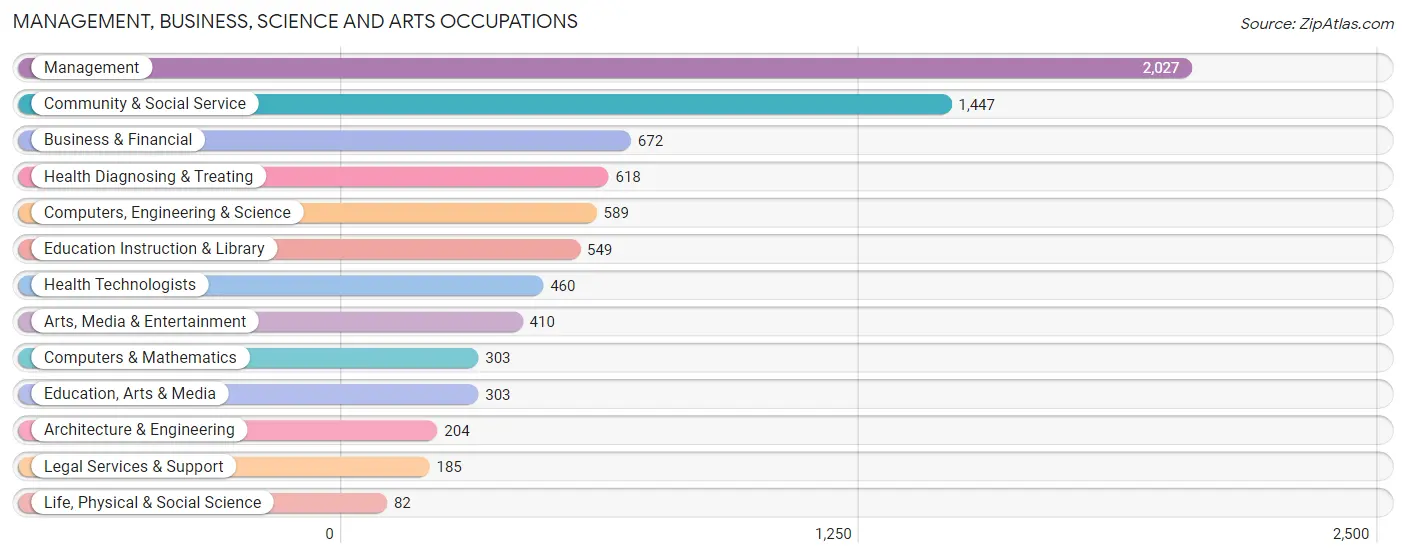
Management, Business, Science and Arts Occupations
The most common Management, Business, Science and Arts occupations in Dania Beach are Management (2,027 | 13.3%), Community & Social Service (1,447 | 9.5%), Business & Financial (672 | 4.4%), Health Diagnosing & Treating (618 | 4.0%), and Computers, Engineering & Science (589 | 3.8%).
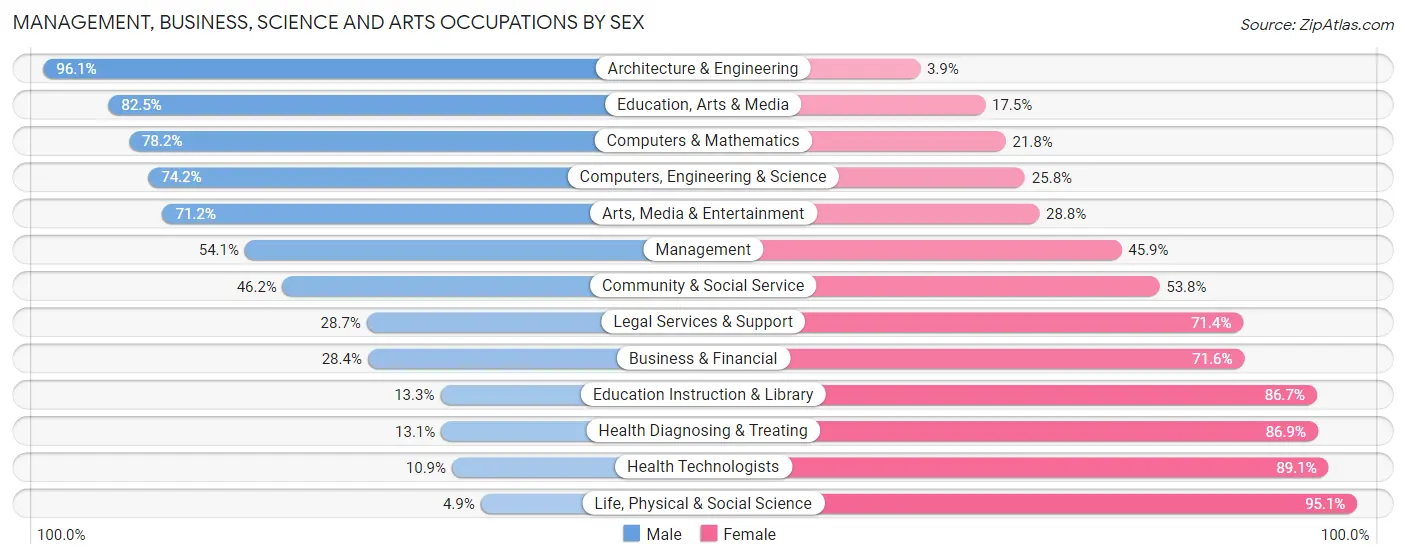
Management, Business, Science and Arts Occupations by Sex
Within the Management, Business, Science and Arts occupations in Dania Beach, the most male-oriented occupations are Architecture & Engineering (96.1%), Education, Arts & Media (82.5%), and Computers & Mathematics (78.2%), while the most female-oriented occupations are Life, Physical & Social Science (95.1%), Health Technologists (89.1%), and Health Diagnosing & Treating (86.9%).
| Occupation | Male | Female |
| Management | 1,096 (54.1%) | 931 (45.9%) |
| Business & Financial | 191 (28.4%) | 481 (71.6%) |
| Computers, Engineering & Science | 437 (74.2%) | 152 (25.8%) |
| Computers & Mathematics | 237 (78.2%) | 66 (21.8%) |
| Architecture & Engineering | 196 (96.1%) | 8 (3.9%) |
| Life, Physical & Social Science | 4 (4.9%) | 78 (95.1%) |
| Community & Social Service | 668 (46.2%) | 779 (53.8%) |
| Education, Arts & Media | 250 (82.5%) | 53 (17.5%) |
| Legal Services & Support | 53 (28.6%) | 132 (71.4%) |
| Education Instruction & Library | 73 (13.3%) | 476 (86.7%) |
| Arts, Media & Entertainment | 292 (71.2%) | 118 (28.8%) |
| Health Diagnosing & Treating | 81 (13.1%) | 537 (86.9%) |
| Health Technologists | 50 (10.9%) | 410 (89.1%) |
| Total (Category) | 2,473 (46.2%) | 2,880 (53.8%) |
| Total (Overall) | 8,100 (52.9%) | 7,203 (47.1%) |
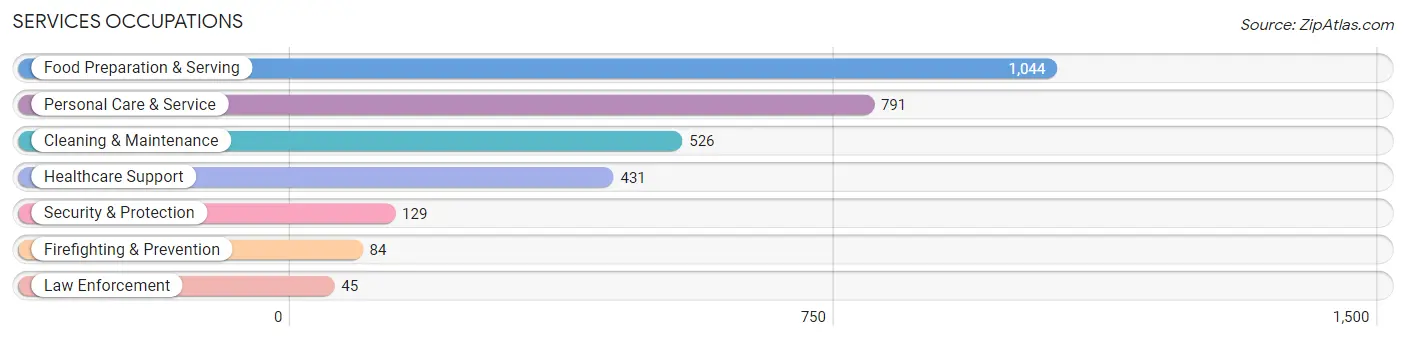
Services Occupations
The most common Services occupations in Dania Beach are Food Preparation & Serving (1,044 | 6.8%), Personal Care & Service (791 | 5.2%), Cleaning & Maintenance (526 | 3.4%), Healthcare Support (431 | 2.8%), and Security & Protection (129 | 0.8%).
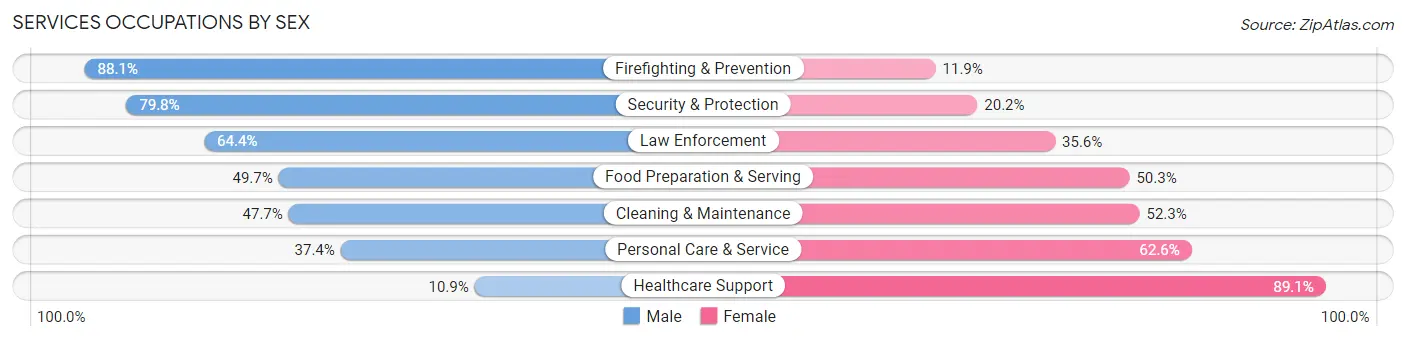
Services Occupations by Sex
Within the Services occupations in Dania Beach, the most male-oriented occupations are Firefighting & Prevention (88.1%), Security & Protection (79.8%), and Law Enforcement (64.4%), while the most female-oriented occupations are Healthcare Support (89.1%), Personal Care & Service (62.6%), and Cleaning & Maintenance (52.3%).
| Occupation | Male | Female |
| Healthcare Support | 47 (10.9%) | 384 (89.1%) |
| Security & Protection | 103 (79.8%) | 26 (20.2%) |
| Firefighting & Prevention | 74 (88.1%) | 10 (11.9%) |
| Law Enforcement | 29 (64.4%) | 16 (35.6%) |
| Food Preparation & Serving | 519 (49.7%) | 525 (50.3%) |
| Cleaning & Maintenance | 251 (47.7%) | 275 (52.3%) |
| Personal Care & Service | 296 (37.4%) | 495 (62.6%) |
| Total (Category) | 1,216 (41.6%) | 1,705 (58.4%) |
| Total (Overall) | 8,100 (52.9%) | 7,203 (47.1%) |
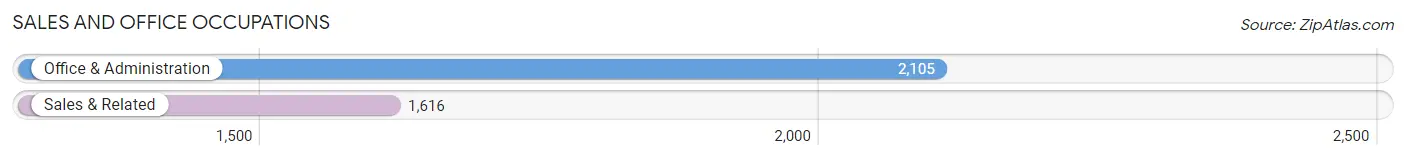
Sales and Office Occupations
The most common Sales and Office occupations in Dania Beach are Office & Administration (2,105 | 13.8%), and Sales & Related (1,616 | 10.6%).
Sales and Office Occupations by Sex
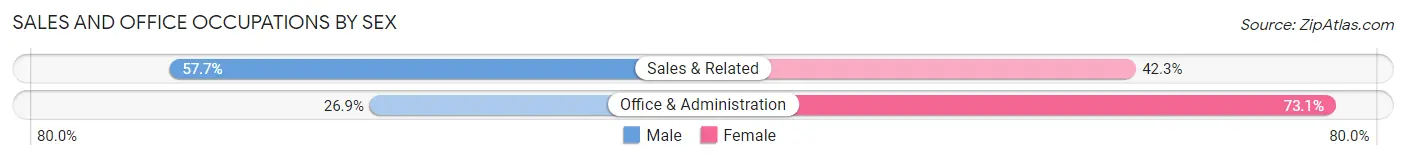
| Occupation | Male | Female |
| Sales & Related | 933 (57.7%) | 683 (42.3%) |
| Office & Administration | 566 (26.9%) | 1,539 (73.1%) |
| Total (Category) | 1,499 (40.3%) | 2,222 (59.7%) |
| Total (Overall) | 8,100 (52.9%) | 7,203 (47.1%) |
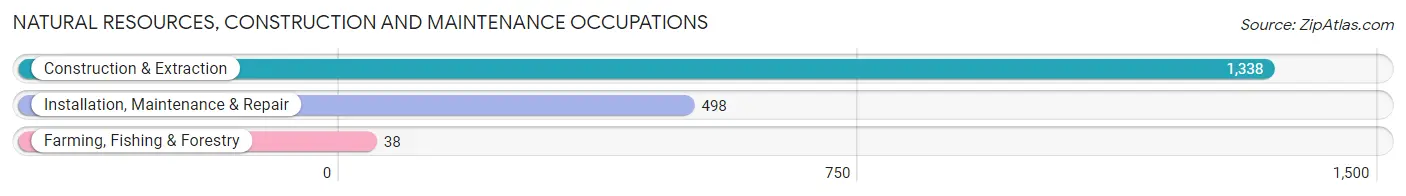
Natural Resources, Construction and Maintenance Occupations
The most common Natural Resources, Construction and Maintenance occupations in Dania Beach are Construction & Extraction (1,338 | 8.7%), Installation, Maintenance & Repair (498 | 3.3%), and Farming, Fishing & Forestry (38 | 0.3%).
Natural Resources, Construction and Maintenance Occupations by Sex
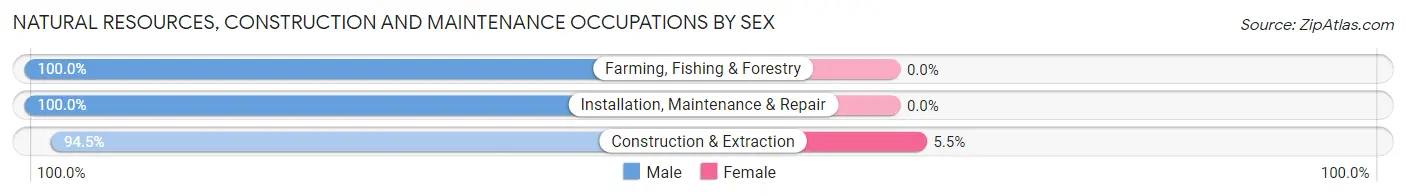
| Occupation | Male | Female |
| Farming, Fishing & Forestry | 38 (100.0%) | 0 (0.0%) |
| Construction & Extraction | 1,264 (94.5%) | 74 (5.5%) |
| Installation, Maintenance & Repair | 498 (100.0%) | 0 (0.0%) |
| Total (Category) | 1,800 (96.1%) | 74 (4.0%) |
| Total (Overall) | 8,100 (52.9%) | 7,203 (47.1%) |
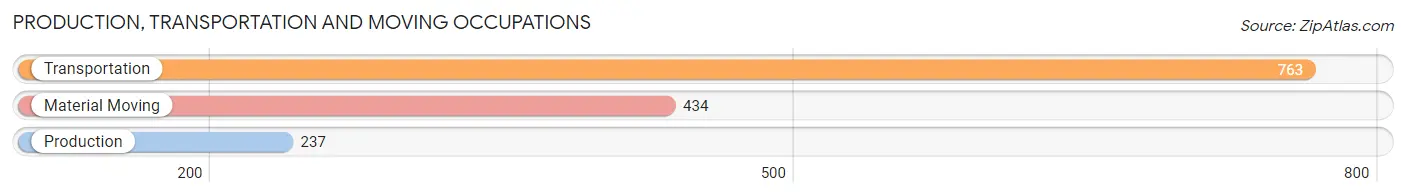
Production, Transportation and Moving Occupations
The most common Production, Transportation and Moving occupations in Dania Beach are Transportation (763 | 5.0%), Material Moving (434 | 2.8%), and Production (237 | 1.5%).
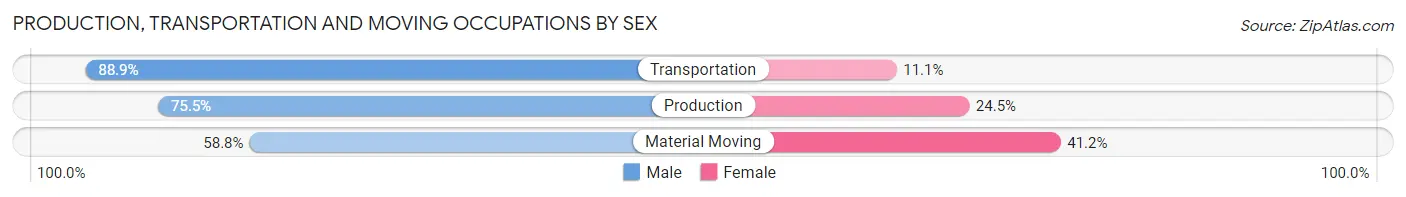
Production, Transportation and Moving Occupations by Sex
| Occupation | Male | Female |
| Production | 179 (75.5%) | 58 (24.5%) |
| Transportation | 678 (88.9%) | 85 (11.1%) |
| Material Moving | 255 (58.8%) | 179 (41.2%) |
| Total (Category) | 1,112 (77.5%) | 322 (22.5%) |
| Total (Overall) | 8,100 (52.9%) | 7,203 (47.1%) |
Employment Industries by Sex in Dania Beach
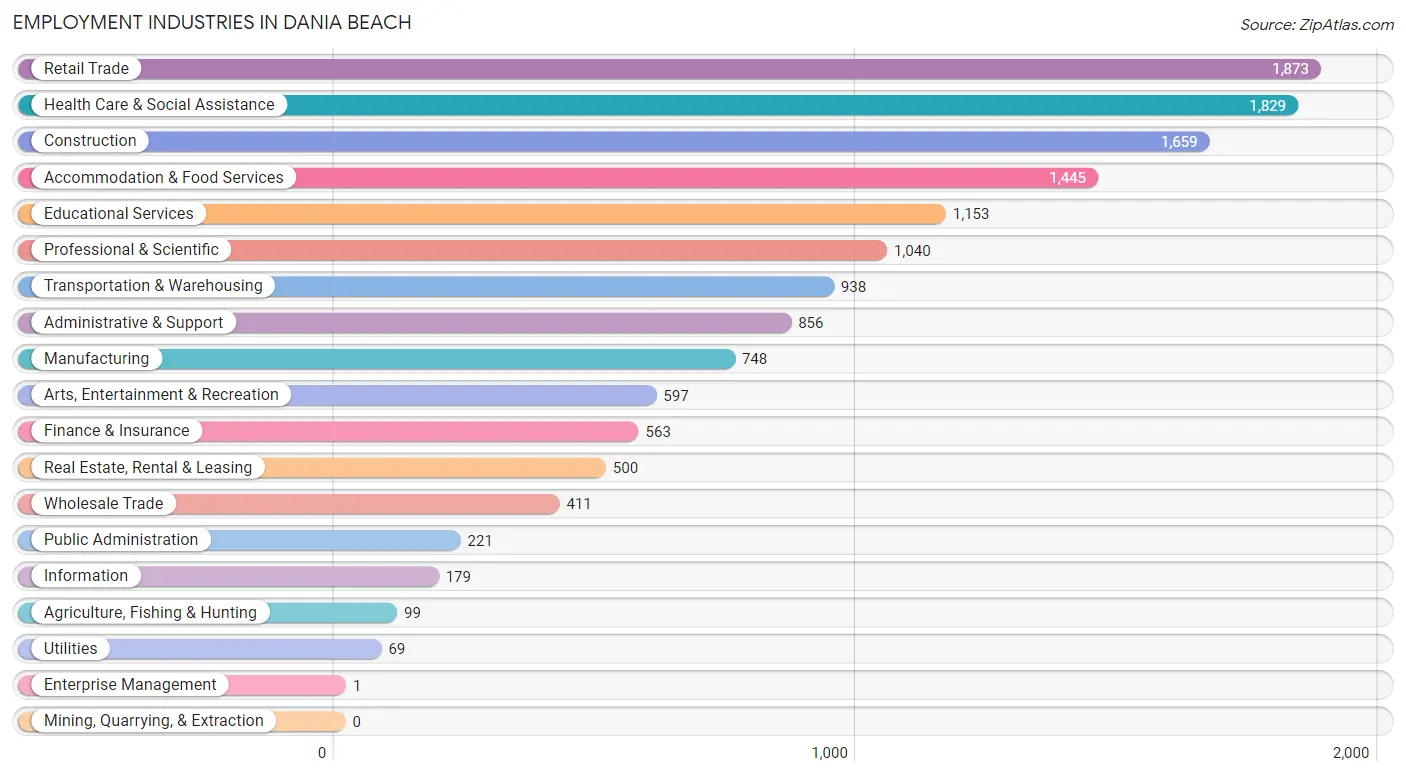
Employment Industries in Dania Beach
The major employment industries in Dania Beach include Retail Trade (1,873 | 12.2%), Health Care & Social Assistance (1,829 | 11.9%), Construction (1,659 | 10.8%), Accommodation & Food Services (1,445 | 9.4%), and Educational Services (1,153 | 7.5%).
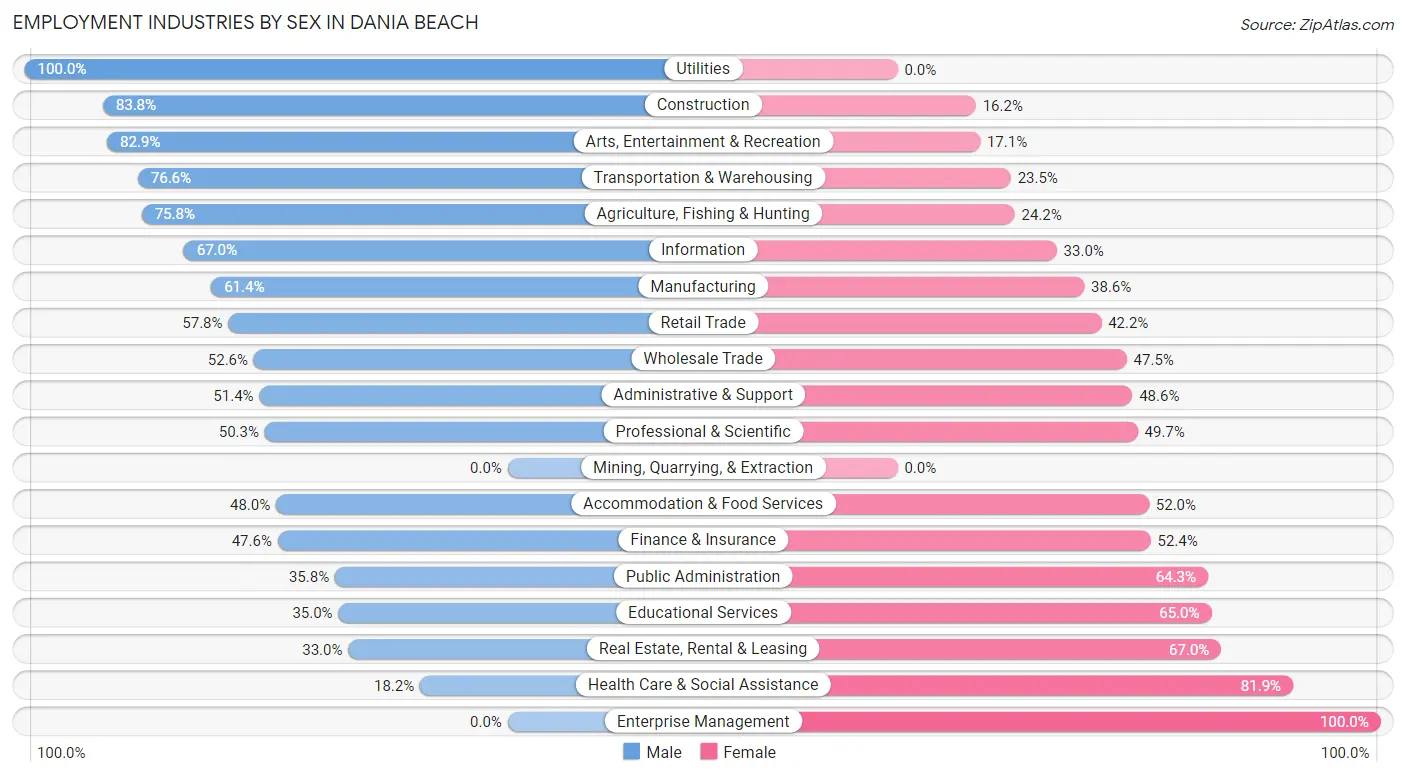
Employment Industries by Sex in Dania Beach
The Dania Beach industries that see more men than women are Utilities (100.0%), Construction (83.8%), and Arts, Entertainment & Recreation (82.9%), whereas the industries that tend to have a higher number of women are Enterprise Management (100.0%), Health Care & Social Assistance (81.9%), and Real Estate, Rental & Leasing (67.0%).
| Industry | Male | Female |
| Agriculture, Fishing & Hunting | 75 (75.8%) | 24 (24.2%) |
| Mining, Quarrying, & Extraction | 0 (0.0%) | 0 (0.0%) |
| Construction | 1,390 (83.8%) | 269 (16.2%) |
| Manufacturing | 459 (61.4%) | 289 (38.6%) |
| Wholesale Trade | 216 (52.5%) | 195 (47.4%) |
| Retail Trade | 1,083 (57.8%) | 790 (42.2%) |
| Transportation & Warehousing | 718 (76.5%) | 220 (23.4%) |
| Utilities | 69 (100.0%) | 0 (0.0%) |
| Information | 120 (67.0%) | 59 (33.0%) |
| Finance & Insurance | 268 (47.6%) | 295 (52.4%) |
| Real Estate, Rental & Leasing | 165 (33.0%) | 335 (67.0%) |
| Professional & Scientific | 523 (50.3%) | 517 (49.7%) |
| Enterprise Management | 0 (0.0%) | 1 (100.0%) |
| Administrative & Support | 440 (51.4%) | 416 (48.6%) |
| Educational Services | 404 (35.0%) | 749 (65.0%) |
| Health Care & Social Assistance | 332 (18.1%) | 1,497 (81.9%) |
| Arts, Entertainment & Recreation | 495 (82.9%) | 102 (17.1%) |
| Accommodation & Food Services | 693 (48.0%) | 752 (52.0%) |
| Public Administration | 79 (35.7%) | 142 (64.2%) |
| Total | 8,100 (52.9%) | 7,203 (47.1%) |
Education in Dania Beach
School Enrollment in Dania Beach
The most common levels of schooling among the 6,350 students in Dania Beach are middle school (1,379 | 21.7%), college / undergraduate (1,347 | 21.2%), and high school (1,277 | 20.1%).
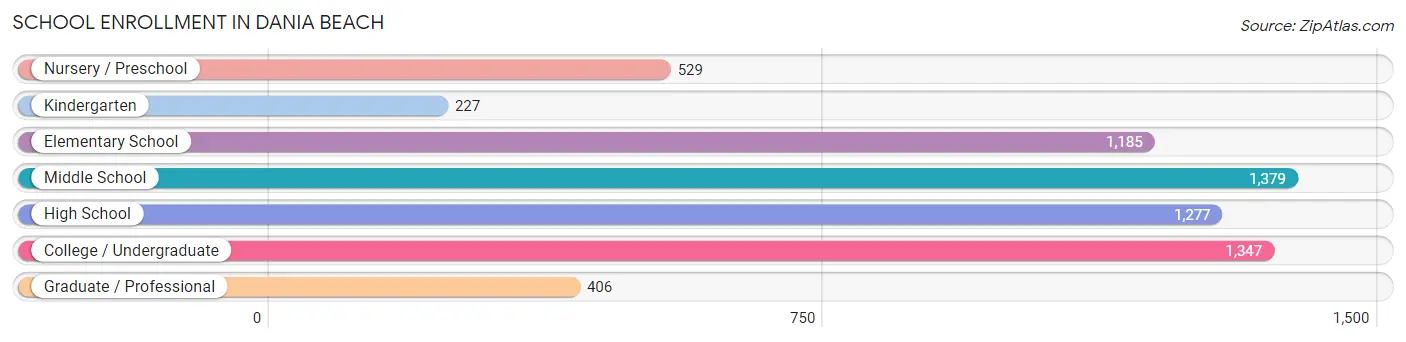
| School Level | # Students | % Students |
| Nursery / Preschool | 529 | 8.3% |
| Kindergarten | 227 | 3.6% |
| Elementary School | 1,185 | 18.7% |
| Middle School | 1,379 | 21.7% |
| High School | 1,277 | 20.1% |
| College / Undergraduate | 1,347 | 21.2% |
| Graduate / Professional | 406 | 6.4% |
| Total | 6,350 | 100.0% |
School Enrollment by Age by Funding Source in Dania Beach
Out of a total of 6,350 students who are enrolled in schools in Dania Beach, 1,289 (20.3%) attend a private institution, while the remaining 5,061 (79.7%) are enrolled in public schools. The age group of 3 to 4 year olds has the highest likelihood of being enrolled in private schools, with 259 (49.5% in the age bracket) enrolled. Conversely, the age group of 20 to 24 year olds has the lowest likelihood of being enrolled in a private school, with 422 (95.3% in the age bracket) attending a public institution.
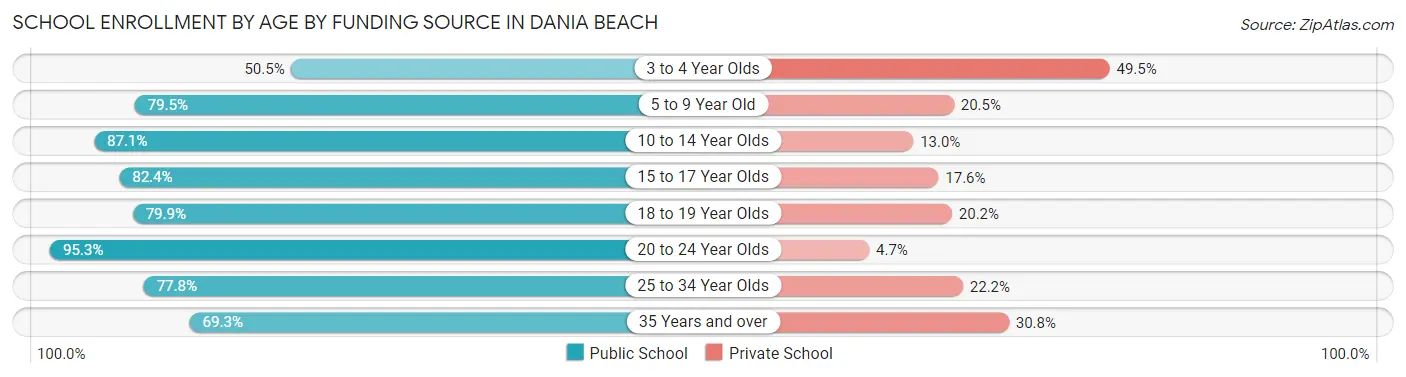
| Age Bracket | Public School | Private School |
| 3 to 4 Year Olds | 264 (50.5%) | 259 (49.5%) |
| 5 to 9 Year Old | 1,093 (79.5%) | 282 (20.5%) |
| 10 to 14 Year Olds | 1,479 (87.1%) | 220 (13.0%) |
| 15 to 17 Year Olds | 579 (82.4%) | 124 (17.6%) |
| 18 to 19 Year Olds | 210 (79.8%) | 53 (20.2%) |
| 20 to 24 Year Olds | 422 (95.3%) | 21 (4.7%) |
| 25 to 34 Year Olds | 785 (77.8%) | 224 (22.2%) |
| 35 Years and over | 232 (69.3%) | 103 (30.7%) |
| Total | 5,061 (79.7%) | 1,289 (20.3%) |
Educational Attainment by Field of Study in Dania Beach
Business (2,032 | 24.9%), science & technology (1,064 | 13.0%), engineering (765 | 9.4%), education (732 | 8.9%), and arts & humanities (489 | 6.0%) are the most common fields of study among 8,175 individuals in Dania Beach who have obtained a bachelor's degree or higher.
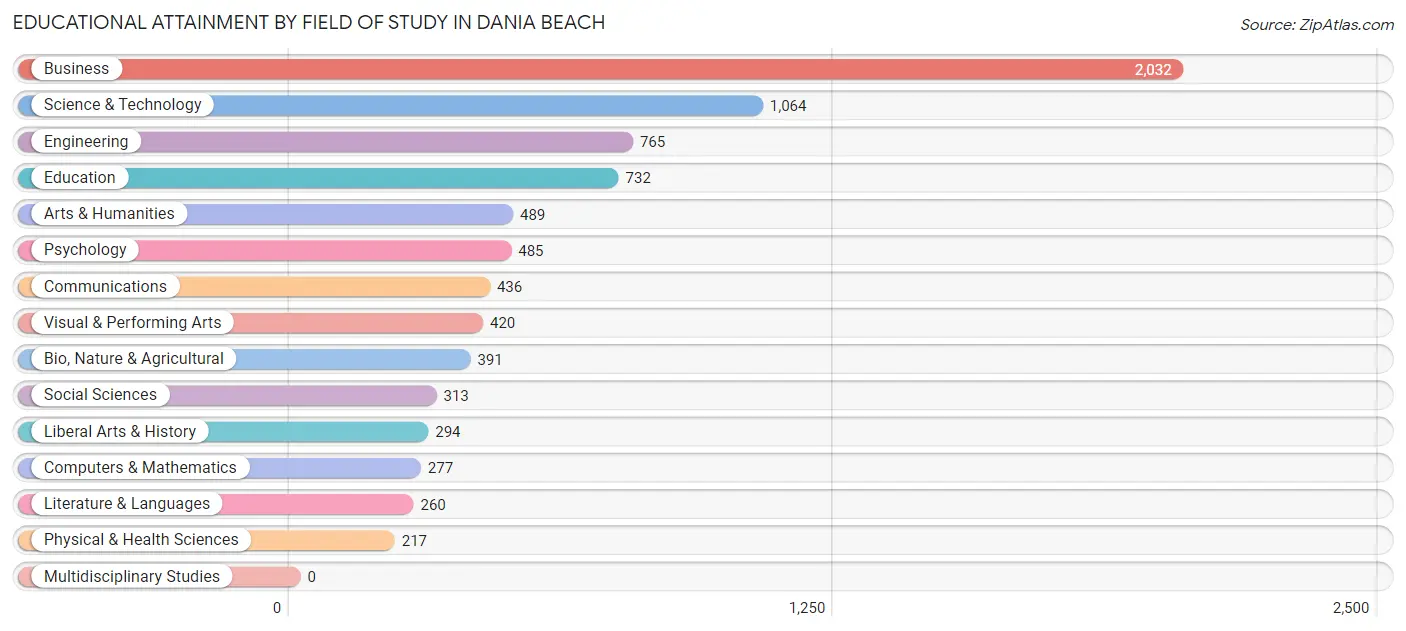
| Field of Study | # Graduates | % Graduates |
| Computers & Mathematics | 277 | 3.4% |
| Bio, Nature & Agricultural | 391 | 4.8% |
| Physical & Health Sciences | 217 | 2.6% |
| Psychology | 485 | 5.9% |
| Social Sciences | 313 | 3.8% |
| Engineering | 765 | 9.4% |
| Multidisciplinary Studies | 0 | 0.0% |
| Science & Technology | 1,064 | 13.0% |
| Business | 2,032 | 24.9% |
| Education | 732 | 8.9% |
| Literature & Languages | 260 | 3.2% |
| Liberal Arts & History | 294 | 3.6% |
| Visual & Performing Arts | 420 | 5.1% |
| Communications | 436 | 5.3% |
| Arts & Humanities | 489 | 6.0% |
| Total | 8,175 | 100.0% |
Transportation & Commute in Dania Beach
Vehicle Availability by Sex in Dania Beach
The most prevalent vehicle ownership categories in Dania Beach are males with 2 vehicles (3,843, accounting for 48.1%) and females with 2 vehicles (3,080, making up 53.8%).
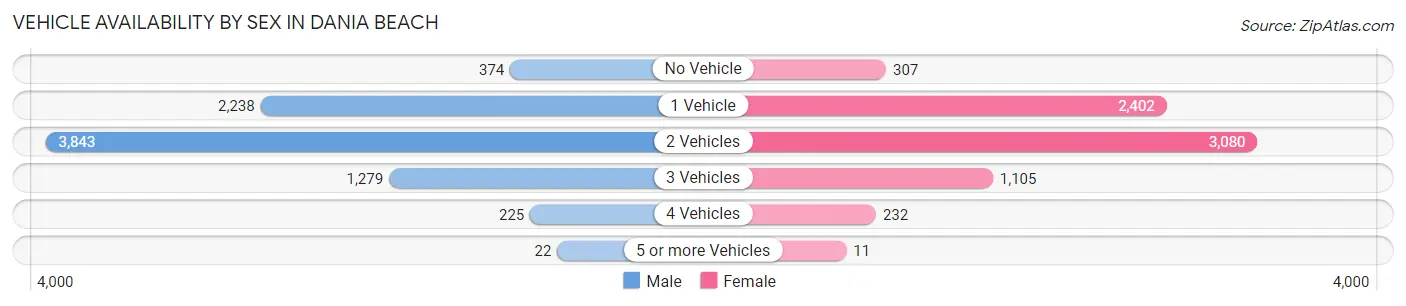
| Vehicles Available | Male | Female |
| No Vehicle | 374 (4.7%) | 307 (4.3%) |
| 1 Vehicle | 2,238 (28.0%) | 2,402 (33.7%) |
| 2 Vehicles | 3,843 (48.1%) | 3,080 (43.2%) |
| 3 Vehicles | 1,279 (16.0%) | 1,105 (15.5%) |
| 4 Vehicles | 225 (2.8%) | 232 (3.3%) |
| 5 or more Vehicles | 22 (0.3%) | 11 (0.2%) |
| Total | 7,981 (100.0%) | 7,137 (100.0%) |
Commute Time in Dania Beach
The most frequently occuring commute durations in Dania Beach are 30 to 34 minutes (2,422 commuters, 17.9%), 20 to 24 minutes (2,286 commuters, 16.9%), and 15 to 19 minutes (2,163 commuters, 16.0%).
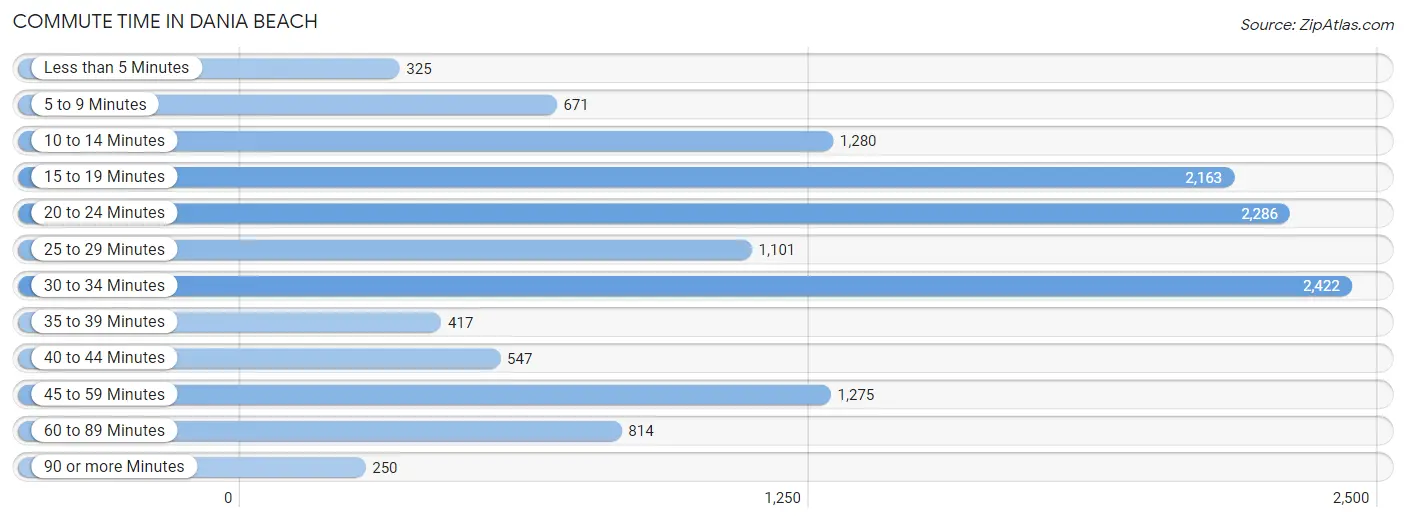
| Commute Time | # Commuters | % Commuters |
| Less than 5 Minutes | 325 | 2.4% |
| 5 to 9 Minutes | 671 | 5.0% |
| 10 to 14 Minutes | 1,280 | 9.5% |
| 15 to 19 Minutes | 2,163 | 16.0% |
| 20 to 24 Minutes | 2,286 | 16.9% |
| 25 to 29 Minutes | 1,101 | 8.1% |
| 30 to 34 Minutes | 2,422 | 17.9% |
| 35 to 39 Minutes | 417 | 3.1% |
| 40 to 44 Minutes | 547 | 4.0% |
| 45 to 59 Minutes | 1,275 | 9.4% |
| 60 to 89 Minutes | 814 | 6.0% |
| 90 or more Minutes | 250 | 1.8% |
Commute Time by Sex in Dania Beach
The most common commute times in Dania Beach are 15 to 19 minutes (1,433 commuters, 19.6%) for males and 20 to 24 minutes (1,175 commuters, 18.8%) for females.
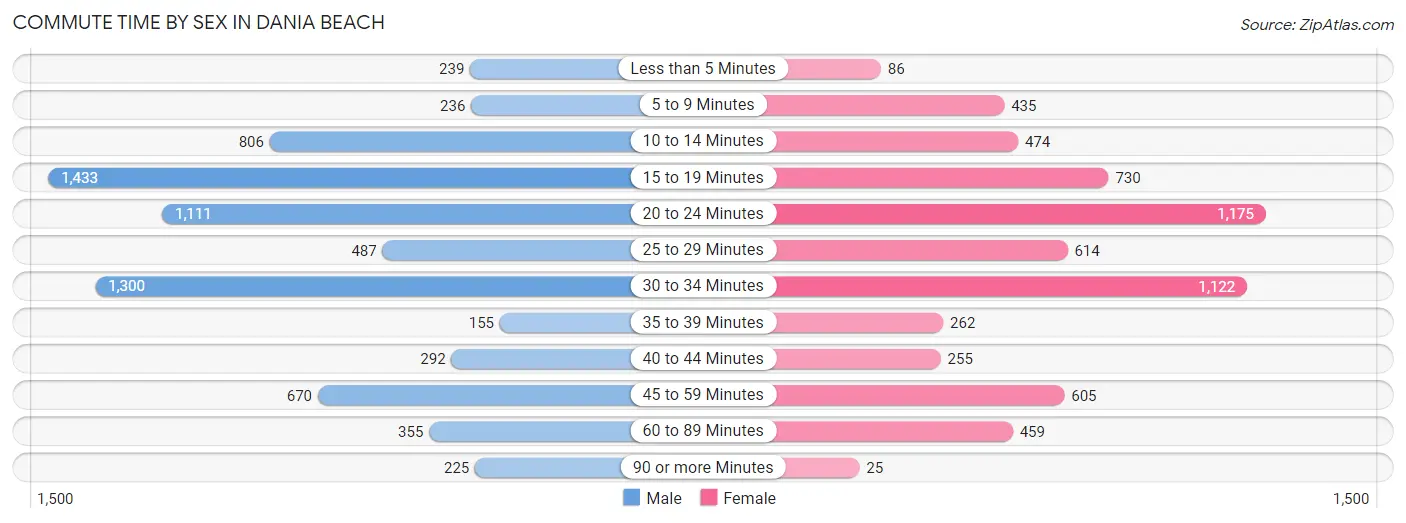
| Commute Time | Male | Female |
| Less than 5 Minutes | 239 (3.3%) | 86 (1.4%) |
| 5 to 9 Minutes | 236 (3.2%) | 435 (7.0%) |
| 10 to 14 Minutes | 806 (11.0%) | 474 (7.6%) |
| 15 to 19 Minutes | 1,433 (19.6%) | 730 (11.7%) |
| 20 to 24 Minutes | 1,111 (15.2%) | 1,175 (18.8%) |
| 25 to 29 Minutes | 487 (6.7%) | 614 (9.8%) |
| 30 to 34 Minutes | 1,300 (17.8%) | 1,122 (18.0%) |
| 35 to 39 Minutes | 155 (2.1%) | 262 (4.2%) |
| 40 to 44 Minutes | 292 (4.0%) | 255 (4.1%) |
| 45 to 59 Minutes | 670 (9.2%) | 605 (9.7%) |
| 60 to 89 Minutes | 355 (4.9%) | 459 (7.3%) |
| 90 or more Minutes | 225 (3.1%) | 25 (0.4%) |
Time of Departure to Work by Sex in Dania Beach
The most frequent times of departure to work in Dania Beach are 9:00 AM to 9:59 AM (879, 12.0%) for males and 8:00 AM to 8:29 AM (1,164, 18.6%) for females.
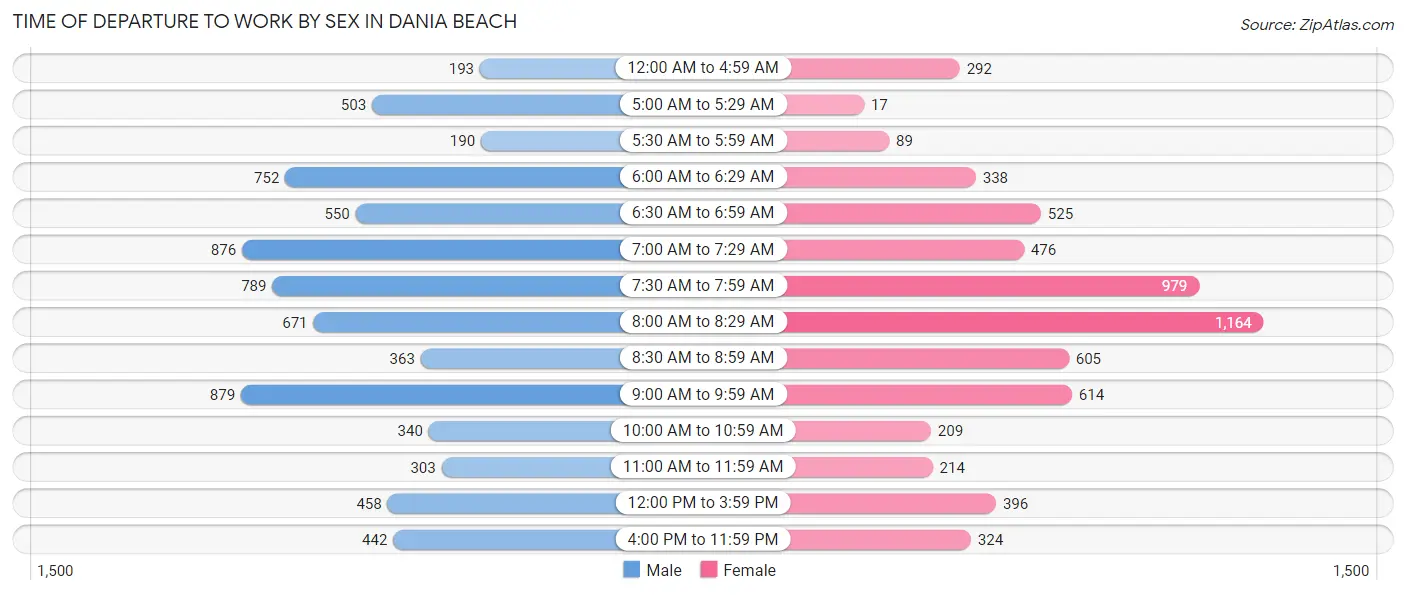
| Time of Departure | Male | Female |
| 12:00 AM to 4:59 AM | 193 (2.6%) | 292 (4.7%) |
| 5:00 AM to 5:29 AM | 503 (6.9%) | 17 (0.3%) |
| 5:30 AM to 5:59 AM | 190 (2.6%) | 89 (1.4%) |
| 6:00 AM to 6:29 AM | 752 (10.3%) | 338 (5.4%) |
| 6:30 AM to 6:59 AM | 550 (7.5%) | 525 (8.4%) |
| 7:00 AM to 7:29 AM | 876 (12.0%) | 476 (7.6%) |
| 7:30 AM to 7:59 AM | 789 (10.8%) | 979 (15.7%) |
| 8:00 AM to 8:29 AM | 671 (9.2%) | 1,164 (18.6%) |
| 8:30 AM to 8:59 AM | 363 (5.0%) | 605 (9.7%) |
| 9:00 AM to 9:59 AM | 879 (12.0%) | 614 (9.8%) |
| 10:00 AM to 10:59 AM | 340 (4.6%) | 209 (3.4%) |
| 11:00 AM to 11:59 AM | 303 (4.2%) | 214 (3.4%) |
| 12:00 PM to 3:59 PM | 458 (6.3%) | 396 (6.3%) |
| 4:00 PM to 11:59 PM | 442 (6.0%) | 324 (5.2%) |
| Total | 7,309 (100.0%) | 6,242 (100.0%) |
Housing Occupancy in Dania Beach
Occupancy by Ownership in Dania Beach
Of the total 13,429 dwellings in Dania Beach, owner-occupied units account for 6,414 (47.8%), while renter-occupied units make up 7,015 (52.2%).
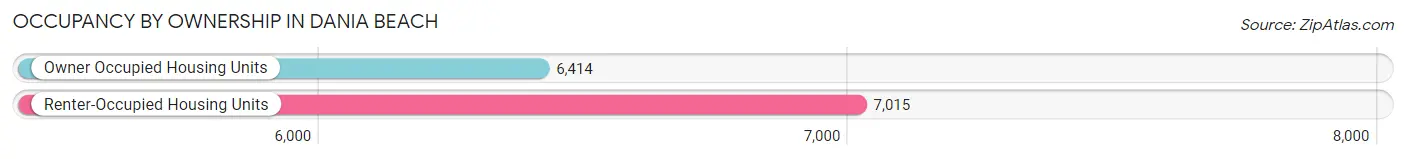
| Occupancy | # Housing Units | % Housing Units |
| Owner Occupied Housing Units | 6,414 | 47.8% |
| Renter-Occupied Housing Units | 7,015 | 52.2% |
| Total Occupied Housing Units | 13,429 | 100.0% |
Occupancy by Household Size in Dania Beach
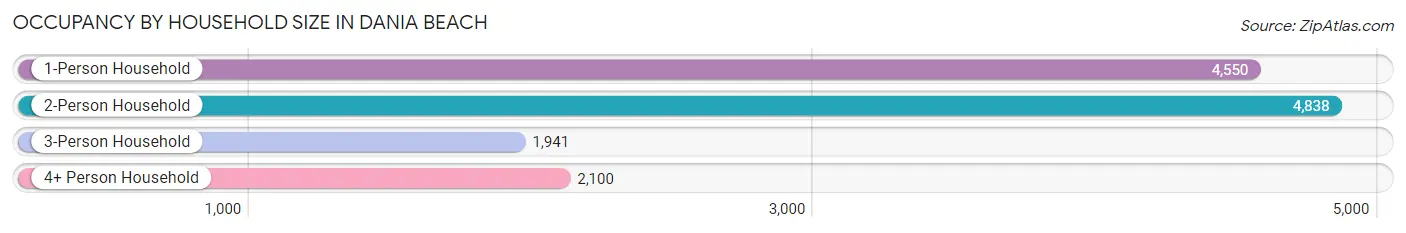
| Household Size | # Housing Units | % Housing Units |
| 1-Person Household | 4,550 | 33.9% |
| 2-Person Household | 4,838 | 36.0% |
| 3-Person Household | 1,941 | 14.4% |
| 4+ Person Household | 2,100 | 15.6% |
| Total Housing Units | 13,429 | 100.0% |
Occupancy by Ownership by Household Size in Dania Beach
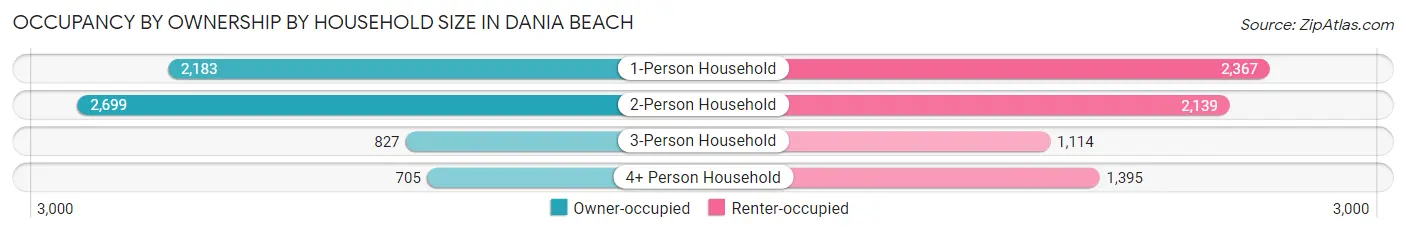
| Household Size | Owner-occupied | Renter-occupied |
| 1-Person Household | 2,183 (48.0%) | 2,367 (52.0%) |
| 2-Person Household | 2,699 (55.8%) | 2,139 (44.2%) |
| 3-Person Household | 827 (42.6%) | 1,114 (57.4%) |
| 4+ Person Household | 705 (33.6%) | 1,395 (66.4%) |
| Total Housing Units | 6,414 (47.8%) | 7,015 (52.2%) |
Occupancy by Educational Attainment in Dania Beach
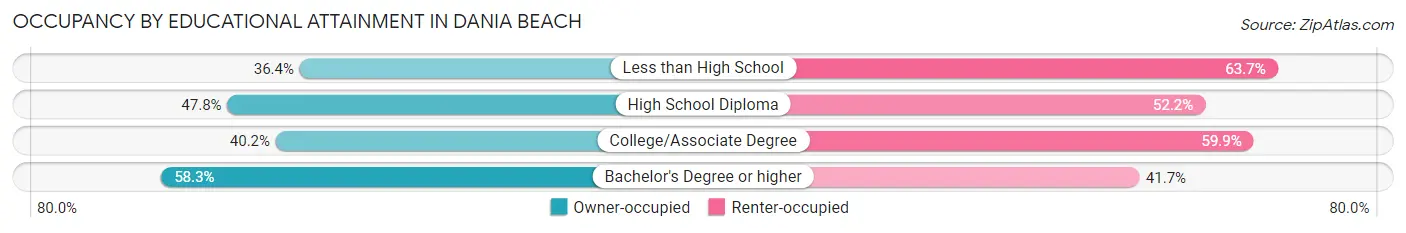
| Household Size | Owner-occupied | Renter-occupied |
| Less than High School | 349 (36.3%) | 611 (63.6%) |
| High School Diploma | 1,976 (47.8%) | 2,155 (52.2%) |
| College/Associate Degree | 1,711 (40.2%) | 2,550 (59.9%) |
| Bachelor's Degree or higher | 2,378 (58.3%) | 1,699 (41.7%) |
Occupancy by Age of Householder in Dania Beach
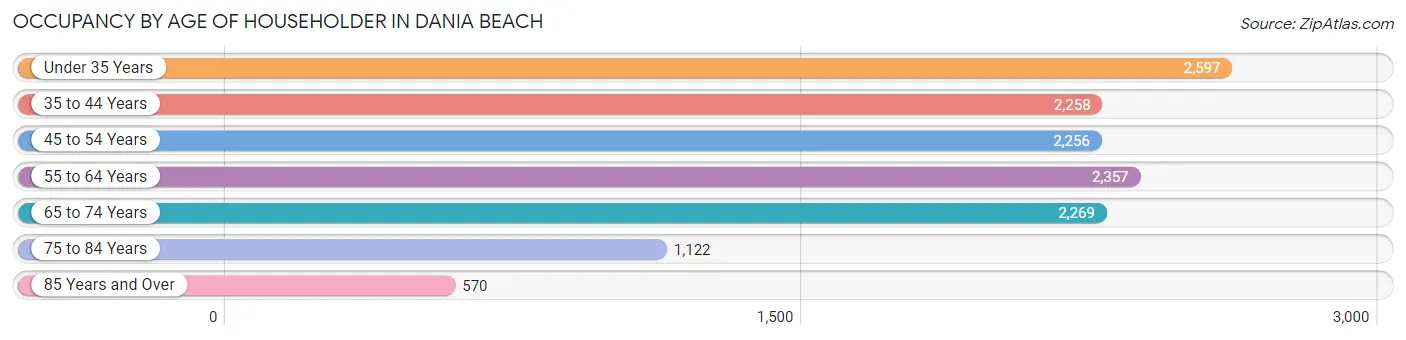
| Age Bracket | # Households | % Households |
| Under 35 Years | 2,597 | 19.3% |
| 35 to 44 Years | 2,258 | 16.8% |
| 45 to 54 Years | 2,256 | 16.8% |
| 55 to 64 Years | 2,357 | 17.5% |
| 65 to 74 Years | 2,269 | 16.9% |
| 75 to 84 Years | 1,122 | 8.4% |
| 85 Years and Over | 570 | 4.2% |
| Total | 13,429 | 100.0% |
Housing Finances in Dania Beach
Median Income by Occupancy in Dania Beach
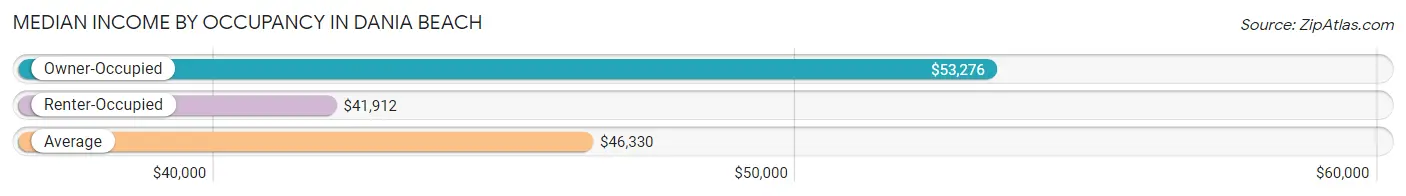
| Occupancy Type | # Households | Median Income |
| Owner-Occupied | 6,414 (47.8%) | $53,276 |
| Renter-Occupied | 7,015 (52.2%) | $41,912 |
| Average | 13,429 (100.0%) | $46,330 |
Occupancy by Householder Income Bracket in Dania Beach
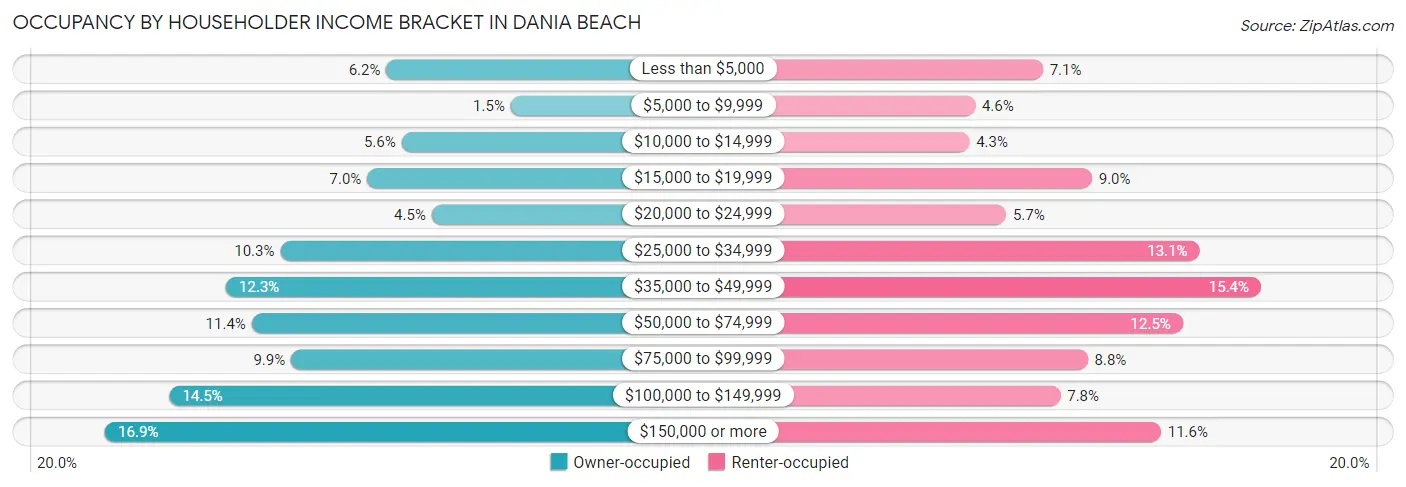
| Income Bracket | Owner-occupied | Renter-occupied |
| Less than $5,000 | 399 (6.2%) | 500 (7.1%) |
| $5,000 to $9,999 | 95 (1.5%) | 319 (4.5%) |
| $10,000 to $14,999 | 362 (5.6%) | 304 (4.3%) |
| $15,000 to $19,999 | 446 (7.0%) | 631 (9.0%) |
| $20,000 to $24,999 | 288 (4.5%) | 402 (5.7%) |
| $25,000 to $34,999 | 658 (10.3%) | 919 (13.1%) |
| $35,000 to $49,999 | 791 (12.3%) | 1,083 (15.4%) |
| $50,000 to $74,999 | 728 (11.4%) | 874 (12.5%) |
| $75,000 to $99,999 | 632 (9.9%) | 620 (8.8%) |
| $100,000 to $149,999 | 929 (14.5%) | 547 (7.8%) |
| $150,000 or more | 1,086 (16.9%) | 816 (11.6%) |
| Total | 6,414 (100.0%) | 7,015 (100.0%) |
Monthly Housing Cost Tiers in Dania Beach
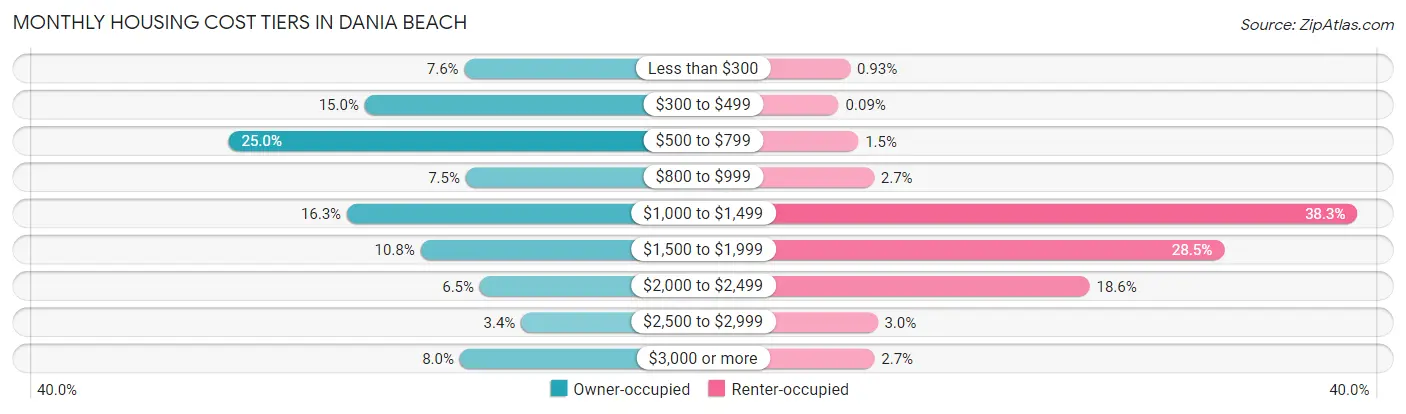
| Monthly Cost | Owner-occupied | Renter-occupied |
| Less than $300 | 488 (7.6%) | 65 (0.9%) |
| $300 to $499 | 959 (14.9%) | 6 (0.1%) |
| $500 to $799 | 1,602 (25.0%) | 107 (1.5%) |
| $800 to $999 | 482 (7.5%) | 188 (2.7%) |
| $1,000 to $1,499 | 1,043 (16.3%) | 2,685 (38.3%) |
| $1,500 to $1,999 | 695 (10.8%) | 1,997 (28.5%) |
| $2,000 to $2,499 | 415 (6.5%) | 1,303 (18.6%) |
| $2,500 to $2,999 | 220 (3.4%) | 207 (2.9%) |
| $3,000 or more | 510 (8.0%) | 191 (2.7%) |
| Total | 6,414 (100.0%) | 7,015 (100.0%) |
Physical Housing Characteristics in Dania Beach
Housing Structures in Dania Beach
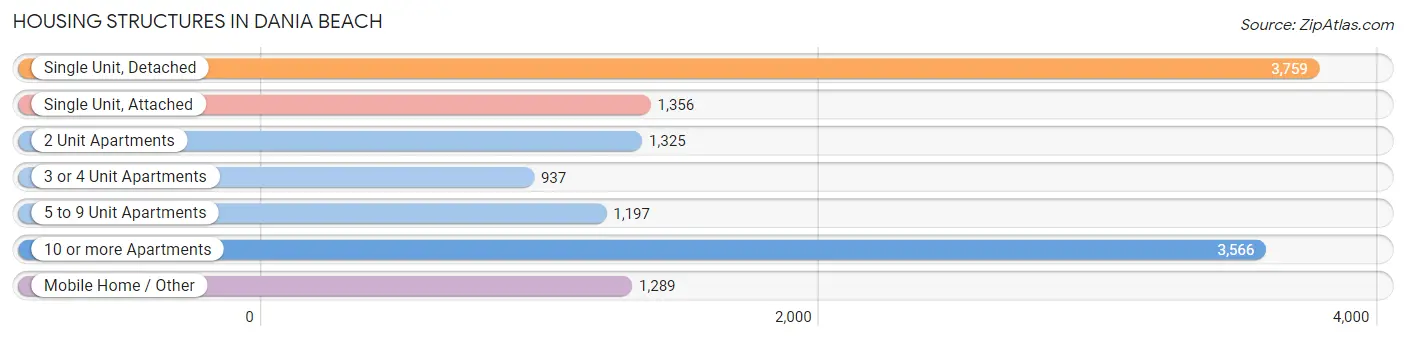
| Structure Type | # Housing Units | % Housing Units |
| Single Unit, Detached | 3,759 | 28.0% |
| Single Unit, Attached | 1,356 | 10.1% |
| 2 Unit Apartments | 1,325 | 9.9% |
| 3 or 4 Unit Apartments | 937 | 7.0% |
| 5 to 9 Unit Apartments | 1,197 | 8.9% |
| 10 or more Apartments | 3,566 | 26.6% |
| Mobile Home / Other | 1,289 | 9.6% |
| Total | 13,429 | 100.0% |
Housing Structures by Occupancy in Dania Beach
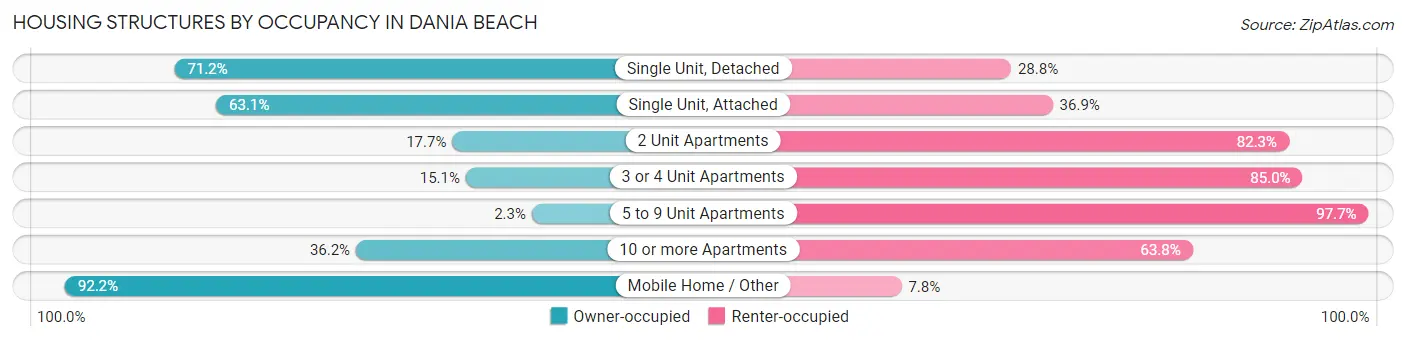
| Structure Type | Owner-occupied | Renter-occupied |
| Single Unit, Detached | 2,675 (71.2%) | 1,084 (28.8%) |
| Single Unit, Attached | 856 (63.1%) | 500 (36.9%) |
| 2 Unit Apartments | 234 (17.7%) | 1,091 (82.3%) |
| 3 or 4 Unit Apartments | 141 (15.0%) | 796 (85.0%) |
| 5 to 9 Unit Apartments | 28 (2.3%) | 1,169 (97.7%) |
| 10 or more Apartments | 1,291 (36.2%) | 2,275 (63.8%) |
| Mobile Home / Other | 1,189 (92.2%) | 100 (7.8%) |
| Total | 6,414 (47.8%) | 7,015 (52.2%) |
Housing Structures by Number of Rooms in Dania Beach
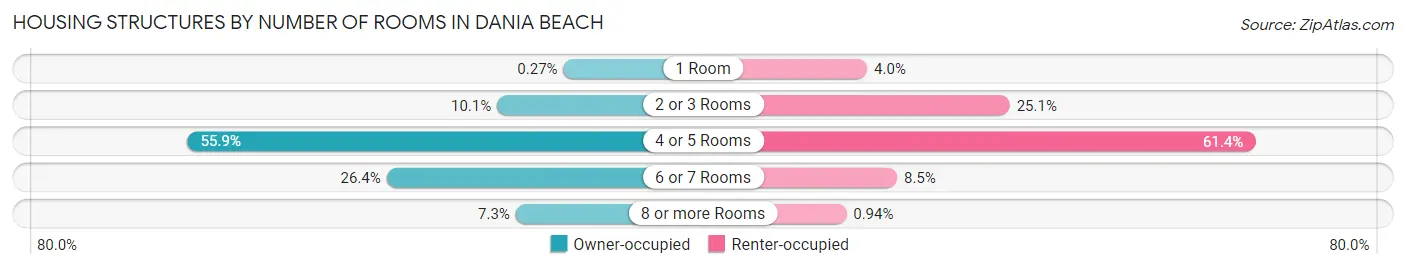
| Number of Rooms | Owner-occupied | Renter-occupied |
| 1 Room | 17 (0.3%) | 283 (4.0%) |
| 2 or 3 Rooms | 647 (10.1%) | 1,763 (25.1%) |
| 4 or 5 Rooms | 3,585 (55.9%) | 4,310 (61.4%) |
| 6 or 7 Rooms | 1,695 (26.4%) | 593 (8.5%) |
| 8 or more Rooms | 470 (7.3%) | 66 (0.9%) |
| Total | 6,414 (100.0%) | 7,015 (100.0%) |
Housing Structure by Heating Type in Dania Beach
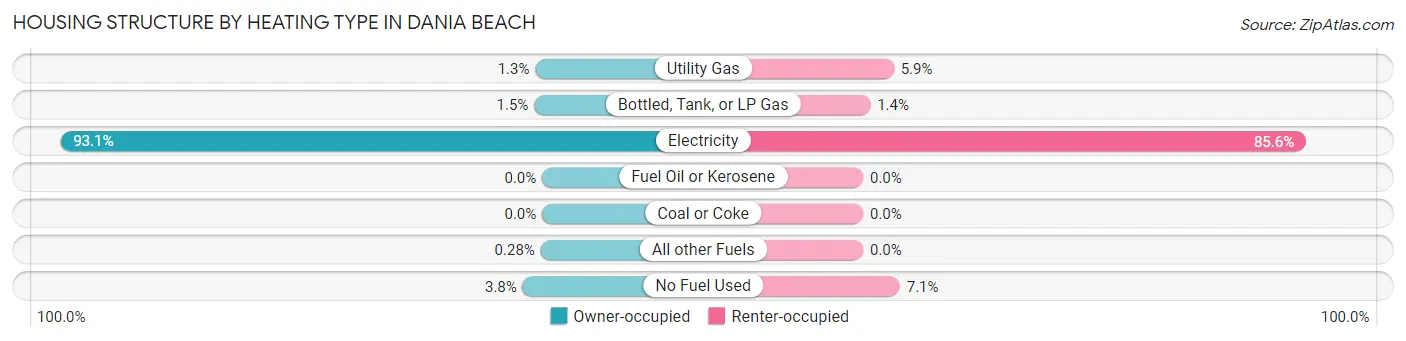
| Heating Type | Owner-occupied | Renter-occupied |
| Utility Gas | 84 (1.3%) | 416 (5.9%) |
| Bottled, Tank, or LP Gas | 98 (1.5%) | 97 (1.4%) |
| Electricity | 5,972 (93.1%) | 6,004 (85.6%) |
| Fuel Oil or Kerosene | 0 (0.0%) | 0 (0.0%) |
| Coal or Coke | 0 (0.0%) | 0 (0.0%) |
| All other Fuels | 18 (0.3%) | 0 (0.0%) |
| No Fuel Used | 242 (3.8%) | 498 (7.1%) |
| Total | 6,414 (100.0%) | 7,015 (100.0%) |
Household Vehicle Usage in Dania Beach
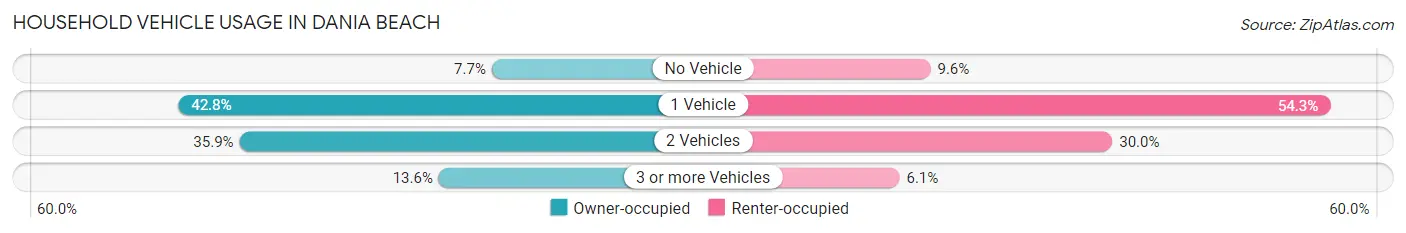
| Vehicles per Household | Owner-occupied | Renter-occupied |
| No Vehicle | 492 (7.7%) | 673 (9.6%) |
| 1 Vehicle | 2,744 (42.8%) | 3,812 (54.3%) |
| 2 Vehicles | 2,305 (35.9%) | 2,101 (29.9%) |
| 3 or more Vehicles | 873 (13.6%) | 429 (6.1%) |
| Total | 6,414 (100.0%) | 7,015 (100.0%) |
Real Estate & Mortgages in Dania Beach
Real Estate and Mortgage Overview in Dania Beach
| Characteristic | Without Mortgage | With Mortgage |
| Housing Units | 3,593 | 2,821 |
| Median Property Value | $222,600 | $314,800 |
| Median Household Income | $31,413 | $655 |
| Monthly Housing Costs | $562 | $468 |
| Real Estate Taxes | $1,836 | $35 |
Property Value by Mortgage Status in Dania Beach
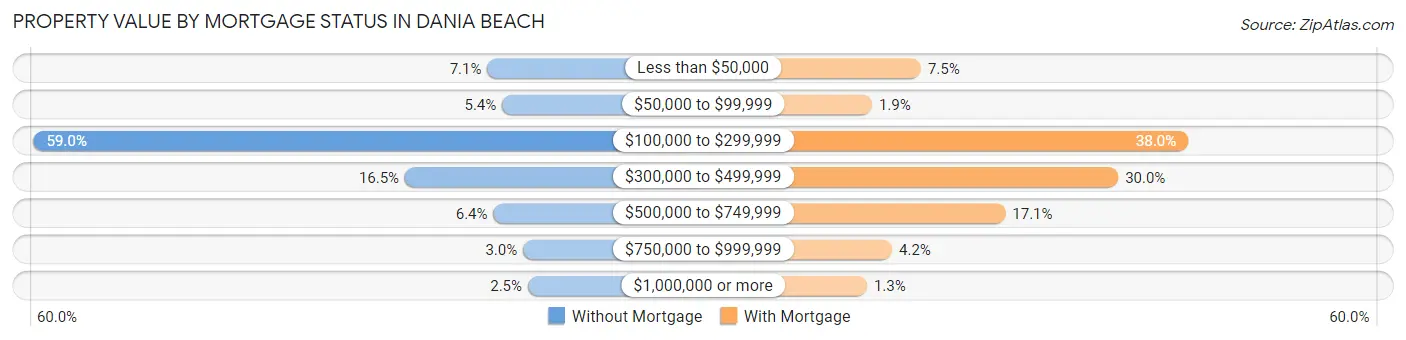
| Property Value | Without Mortgage | With Mortgage |
| Less than $50,000 | 256 (7.1%) | 211 (7.5%) |
| $50,000 to $99,999 | 195 (5.4%) | 53 (1.9%) |
| $100,000 to $299,999 | 2,119 (59.0%) | 1,072 (38.0%) |
| $300,000 to $499,999 | 594 (16.5%) | 847 (30.0%) |
| $500,000 to $749,999 | 231 (6.4%) | 483 (17.1%) |
| $750,000 to $999,999 | 109 (3.0%) | 118 (4.2%) |
| $1,000,000 or more | 89 (2.5%) | 37 (1.3%) |
| Total | 3,593 (100.0%) | 2,821 (100.0%) |
Household Income by Mortgage Status in Dania Beach
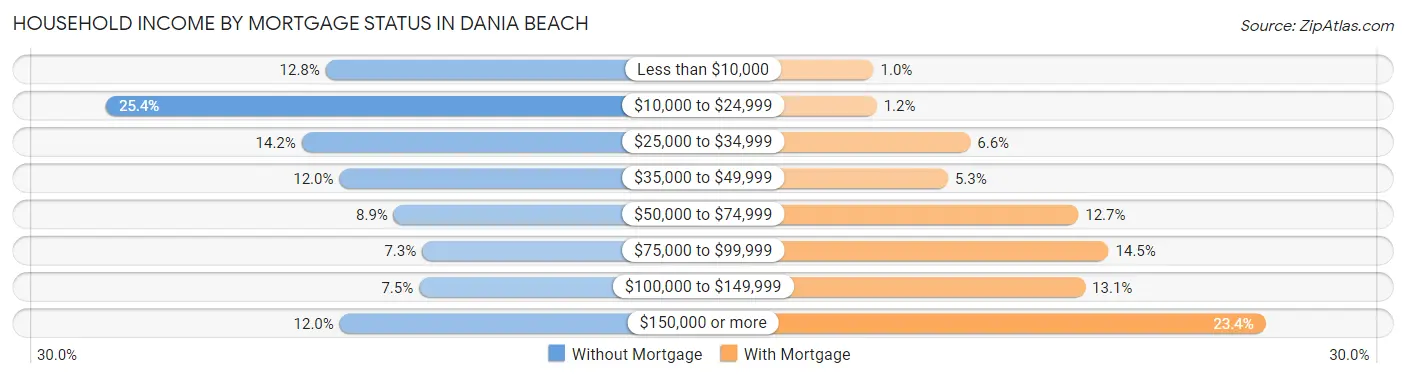
| Household Income | Without Mortgage | With Mortgage |
| Less than $10,000 | 460 (12.8%) | 29 (1.0%) |
| $10,000 to $24,999 | 911 (25.4%) | 34 (1.2%) |
| $25,000 to $34,999 | 509 (14.2%) | 185 (6.6%) |
| $35,000 to $49,999 | 432 (12.0%) | 149 (5.3%) |
| $50,000 to $74,999 | 320 (8.9%) | 359 (12.7%) |
| $75,000 to $99,999 | 262 (7.3%) | 408 (14.5%) |
| $100,000 to $149,999 | 268 (7.5%) | 370 (13.1%) |
| $150,000 or more | 431 (12.0%) | 661 (23.4%) |
| Total | 3,593 (100.0%) | 2,821 (100.0%) |
Property Value to Household Income Ratio in Dania Beach
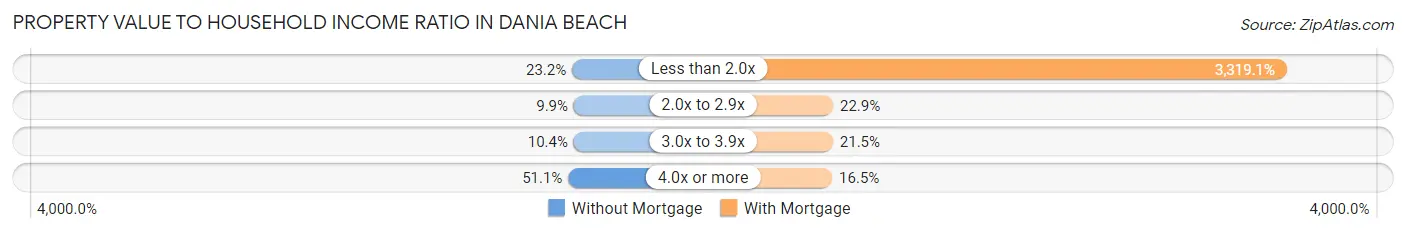
| Value-to-Income Ratio | Without Mortgage | With Mortgage |
| Less than 2.0x | 832 (23.2%) | 93,631 (3,319.1%) |
| 2.0x to 2.9x | 357 (9.9%) | 645 (22.9%) |
| 3.0x to 3.9x | 375 (10.4%) | 606 (21.5%) |
| 4.0x or more | 1,836 (51.1%) | 464 (16.5%) |
| Total | 3,593 (100.0%) | 2,821 (100.0%) |
Real Estate Taxes by Mortgage Status in Dania Beach
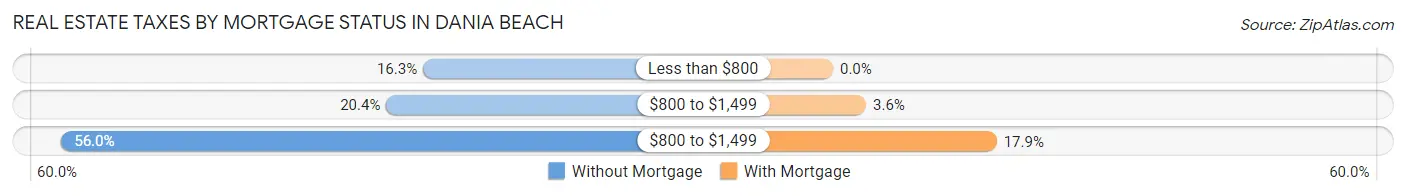
| Property Taxes | Without Mortgage | With Mortgage |
| Less than $800 | 587 (16.3%) | 0 (0.0%) |
| $800 to $1,499 | 732 (20.4%) | 102 (3.6%) |
| $800 to $1,499 | 2,011 (56.0%) | 506 (17.9%) |
| Total | 3,593 (100.0%) | 2,821 (100.0%) |
Health & Disability in Dania Beach
Health Insurance Coverage by Age in Dania Beach
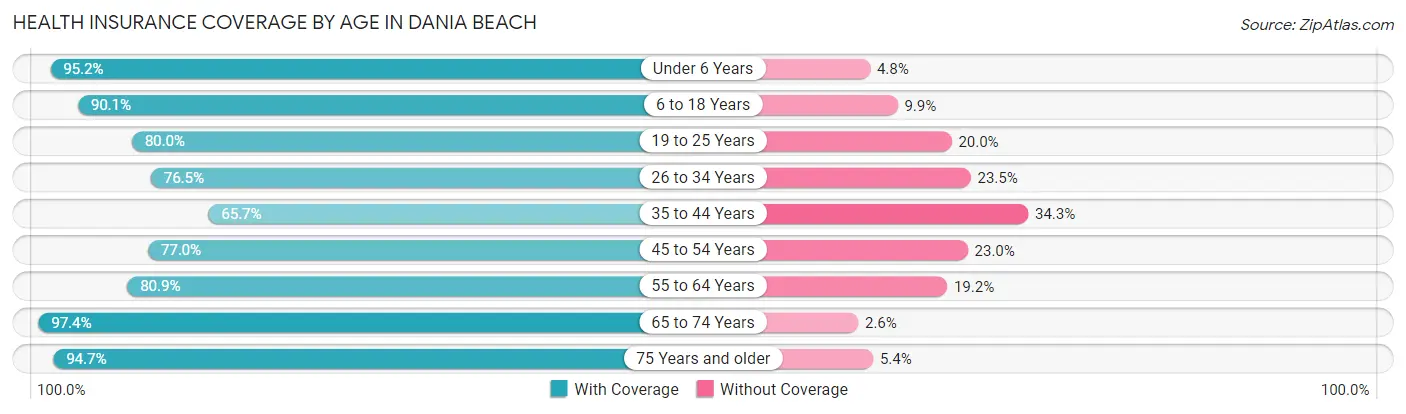
| Age Bracket | With Coverage | Without Coverage |
| Under 6 Years | 2,091 (95.2%) | 105 (4.8%) |
| 6 to 18 Years | 3,549 (90.1%) | 391 (9.9%) |
| 19 to 25 Years | 1,646 (80.0%) | 411 (20.0%) |
| 26 to 34 Years | 3,810 (76.5%) | 1,173 (23.5%) |
| 35 to 44 Years | 2,612 (65.7%) | 1,362 (34.3%) |
| 45 to 54 Years | 3,205 (77.0%) | 957 (23.0%) |
| 55 to 64 Years | 3,542 (80.8%) | 839 (19.2%) |
| 65 to 74 Years | 3,390 (97.4%) | 89 (2.6%) |
| 75 Years and older | 2,212 (94.7%) | 125 (5.3%) |
| Total | 26,057 (82.7%) | 5,452 (17.3%) |
Health Insurance Coverage by Citizenship Status in Dania Beach
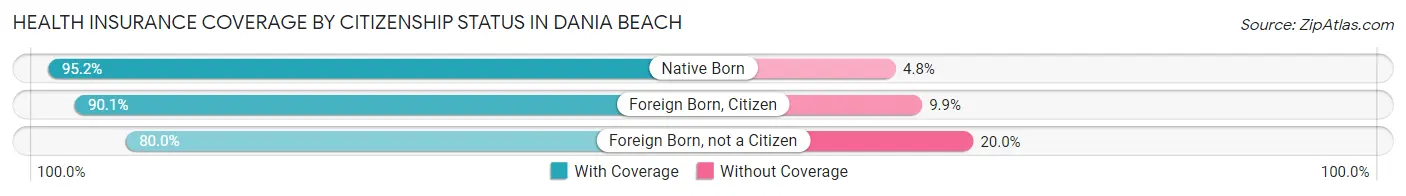
| Citizenship Status | With Coverage | Without Coverage |
| Native Born | 2,091 (95.2%) | 105 (4.8%) |
| Foreign Born, Citizen | 3,549 (90.1%) | 391 (9.9%) |
| Foreign Born, not a Citizen | 1,646 (80.0%) | 411 (20.0%) |
Health Insurance Coverage by Household Income in Dania Beach
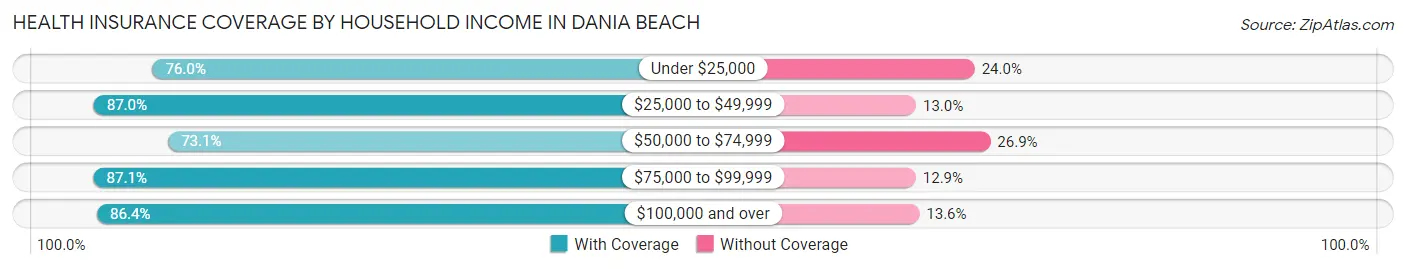
| Household Income | With Coverage | Without Coverage |
| Under $25,000 | 5,072 (76.0%) | 1,599 (24.0%) |
| $25,000 to $49,999 | 6,627 (87.0%) | 988 (13.0%) |
| $50,000 to $74,999 | 2,949 (73.1%) | 1,086 (26.9%) |
| $75,000 to $99,999 | 2,912 (87.1%) | 433 (12.9%) |
| $100,000 and over | 8,463 (86.4%) | 1,332 (13.6%) |
Public vs Private Health Insurance Coverage by Age in Dania Beach
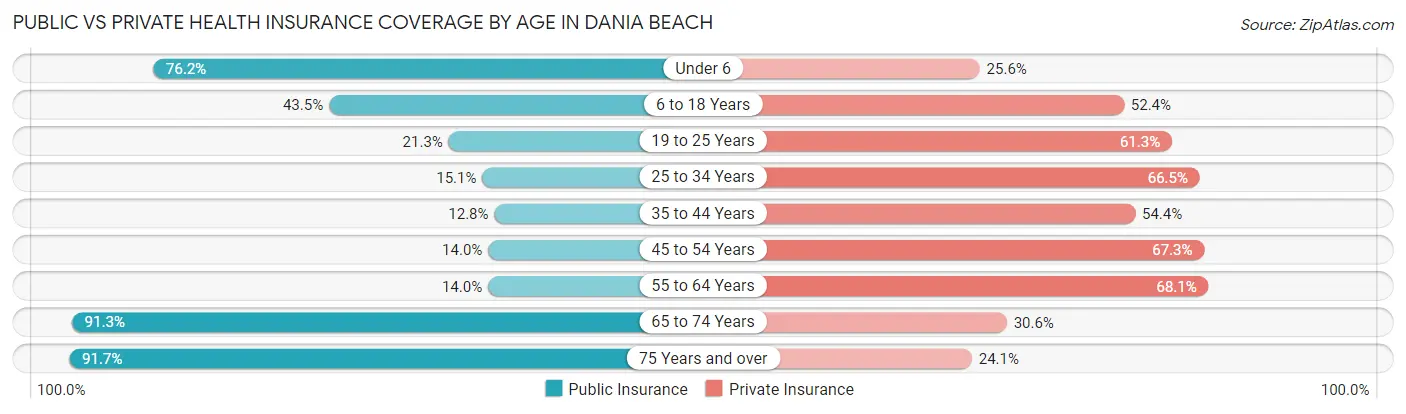
| Age Bracket | Public Insurance | Private Insurance |
| Under 6 | 1,673 (76.2%) | 562 (25.6%) |
| 6 to 18 Years | 1,714 (43.5%) | 2,063 (52.4%) |
| 19 to 25 Years | 438 (21.3%) | 1,261 (61.3%) |
| 25 to 34 Years | 750 (15.0%) | 3,311 (66.4%) |
| 35 to 44 Years | 509 (12.8%) | 2,163 (54.4%) |
| 45 to 54 Years | 581 (14.0%) | 2,800 (67.3%) |
| 55 to 64 Years | 613 (14.0%) | 2,983 (68.1%) |
| 65 to 74 Years | 3,175 (91.3%) | 1,065 (30.6%) |
| 75 Years and over | 2,144 (91.7%) | 564 (24.1%) |
| Total | 11,597 (36.8%) | 16,772 (53.2%) |
Disability Status by Sex by Age in Dania Beach
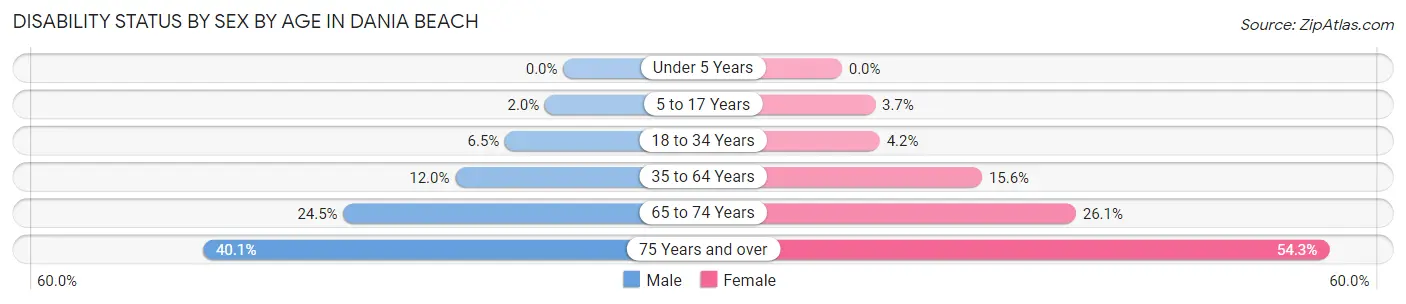
| Age Bracket | Male | Female |
| Under 5 Years | 0 (0.0%) | 0 (0.0%) |
| 5 to 17 Years | 37 (2.0%) | 75 (3.7%) |
| 18 to 34 Years | 224 (6.5%) | 161 (4.2%) |
| 35 to 64 Years | 744 (12.0%) | 989 (15.6%) |
| 65 to 74 Years | 446 (24.5%) | 432 (26.1%) |
| 75 Years and over | 435 (40.1%) | 680 (54.3%) |
Disability Class by Sex by Age in Dania Beach
Disability Class: Hearing Difficulty
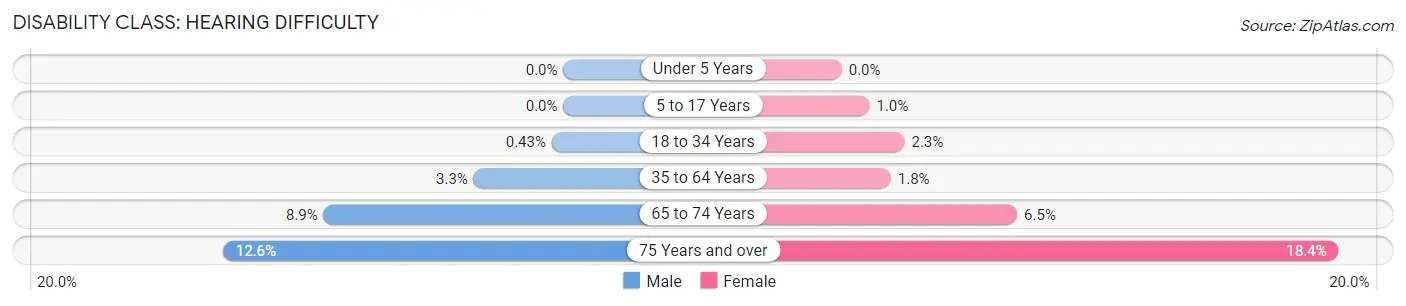
| Age Bracket | Male | Female |
| Under 5 Years | 0 (0.0%) | 0 (0.0%) |
| 5 to 17 Years | 0 (0.0%) | 21 (1.0%) |
| 18 to 34 Years | 15 (0.4%) | 89 (2.3%) |
| 35 to 64 Years | 206 (3.3%) | 115 (1.8%) |
| 65 to 74 Years | 162 (8.9%) | 108 (6.5%) |
| 75 Years and over | 137 (12.6%) | 231 (18.4%) |
Disability Class: Vision Difficulty
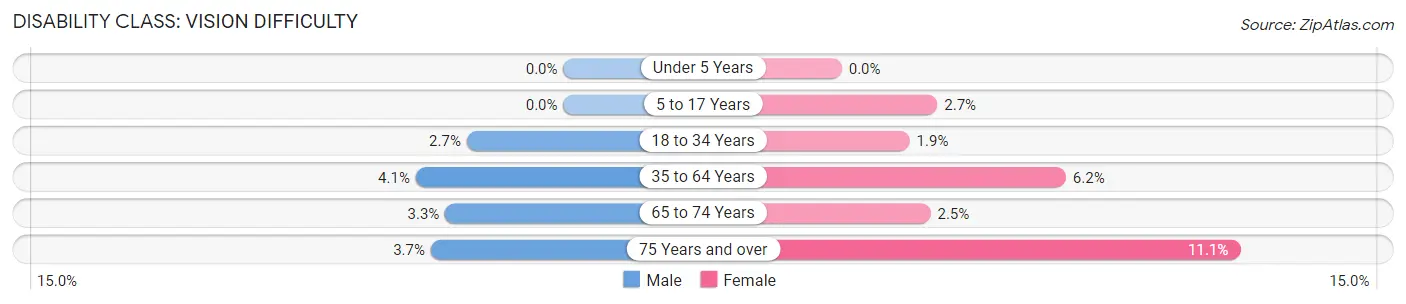
| Age Bracket | Male | Female |
| Under 5 Years | 0 (0.0%) | 0 (0.0%) |
| 5 to 17 Years | 0 (0.0%) | 54 (2.7%) |
| 18 to 34 Years | 93 (2.7%) | 72 (1.9%) |
| 35 to 64 Years | 254 (4.1%) | 395 (6.2%) |
| 65 to 74 Years | 60 (3.3%) | 41 (2.5%) |
| 75 Years and over | 40 (3.7%) | 139 (11.1%) |
Disability Class: Cognitive Difficulty
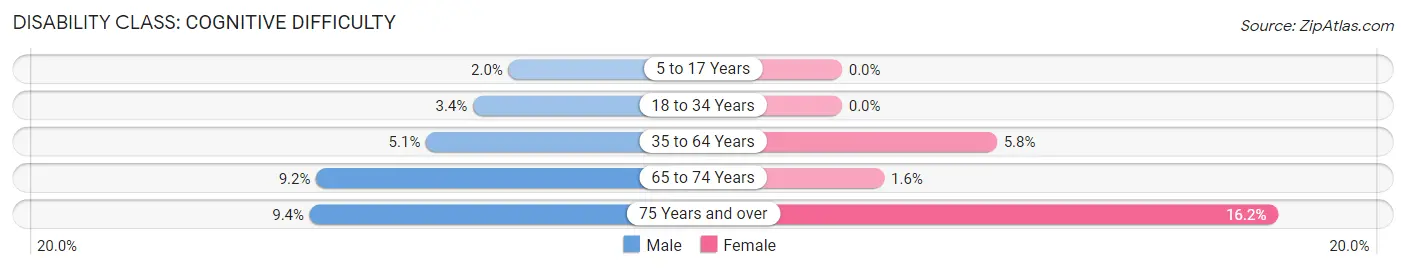
| Age Bracket | Male | Female |
| 5 to 17 Years | 37 (2.0%) | 0 (0.0%) |
| 18 to 34 Years | 116 (3.4%) | 0 (0.0%) |
| 35 to 64 Years | 315 (5.1%) | 364 (5.8%) |
| 65 to 74 Years | 167 (9.2%) | 26 (1.6%) |
| 75 Years and over | 102 (9.4%) | 203 (16.2%) |
Disability Class: Ambulatory Difficulty
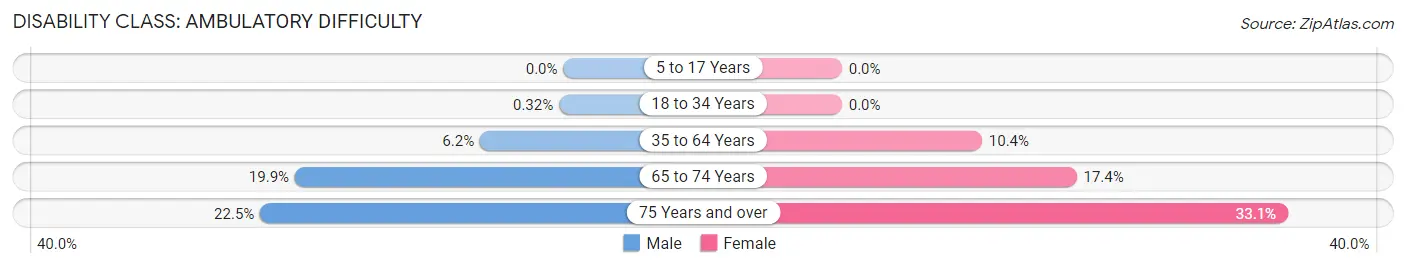
| Age Bracket | Male | Female |
| 5 to 17 Years | 0 (0.0%) | 0 (0.0%) |
| 18 to 34 Years | 11 (0.3%) | 0 (0.0%) |
| 35 to 64 Years | 383 (6.2%) | 659 (10.4%) |
| 65 to 74 Years | 363 (19.9%) | 289 (17.4%) |
| 75 Years and over | 244 (22.5%) | 415 (33.1%) |
Disability Class: Self-Care Difficulty
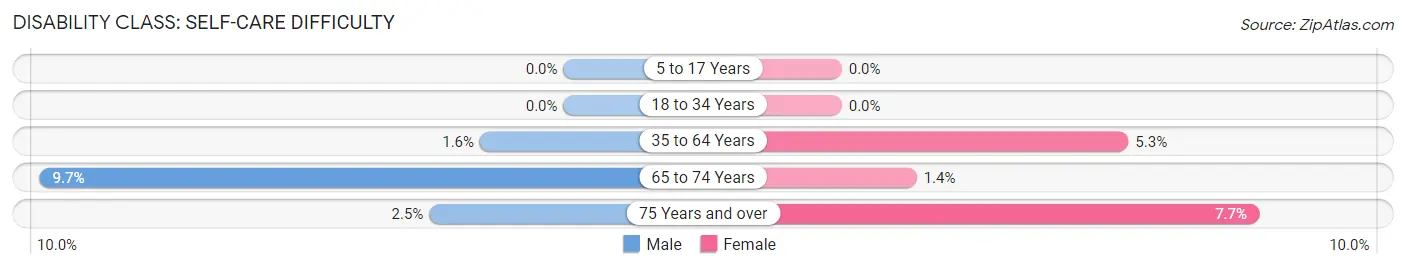
| Age Bracket | Male | Female |
| 5 to 17 Years | 0 (0.0%) | 0 (0.0%) |
| 18 to 34 Years | 0 (0.0%) | 0 (0.0%) |
| 35 to 64 Years | 96 (1.5%) | 337 (5.3%) |
| 65 to 74 Years | 177 (9.7%) | 23 (1.4%) |
| 75 Years and over | 27 (2.5%) | 97 (7.7%) |
Technology Access in Dania Beach
Computing Device Access in Dania Beach
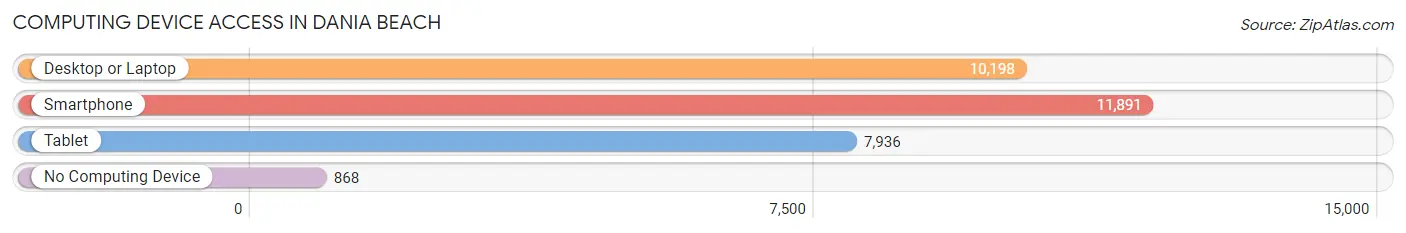
| Device Type | # Households | % Households |
| Desktop or Laptop | 10,198 | 75.9% |
| Smartphone | 11,891 | 88.5% |
| Tablet | 7,936 | 59.1% |
| No Computing Device | 868 | 6.5% |
| Total | 13,429 | 100.0% |
Internet Access in Dania Beach
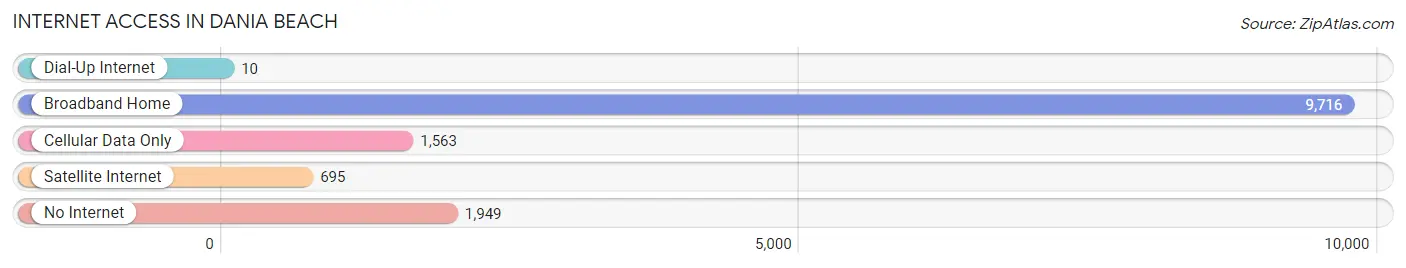
| Internet Type | # Households | % Households |
| Dial-Up Internet | 10 | 0.1% |
| Broadband Home | 9,716 | 72.4% |
| Cellular Data Only | 1,563 | 11.6% |
| Satellite Internet | 695 | 5.2% |
| No Internet | 1,949 | 14.5% |
| Total | 13,429 | 100.0% |
Dania Beach Summary
Dania Beach is a city located in Broward County, Florida, United States. It is part of the South Florida metropolitan area, which is home to 5.5 million people. The city is located on the Atlantic Ocean, just north of Fort Lauderdale. It is bordered by Hollywood to the north, Davie to the west, and Hallandale Beach to the south.
History
Dania Beach was originally a part of the town of Dania, which was founded in 1904 by Danish settlers. The town was named after the Danish city of Dania, which is now part of Copenhagen. The settlers were attracted to the area by its warm climate and fertile soil. The town was incorporated in 1904 and was the first incorporated town in Broward County.
In the early 1900s, Dania Beach was a popular destination for tourists. The town was known for its fishing, boating, and other outdoor activities. In the 1920s, the town was home to a number of resorts, including the Dania Beach Hotel and the Dania Beach Casino.
In the 1950s, the town began to decline as tourists began to flock to nearby Fort Lauderdale. The town was eventually annexed by Hollywood in 1953. In the 1960s, the town was redeveloped as a residential community.
Geography
Dania Beach is located in southeastern Florida, just north of Fort Lauderdale. It is bordered by Hollywood to the north, Davie to the west, and Hallandale Beach to the south. The city covers an area of 4.2 square miles and has a population of 29,639 (as of 2019).
The city is located on the Atlantic Ocean and is home to several beaches, including Dania Beach, Hollywood Beach, and Hallandale Beach. The city is also home to several parks, including John U. Lloyd State Park, which is a popular destination for fishing, boating, and other outdoor activities.
Economy
Dania Beach is home to a number of businesses, including retail stores, restaurants, and hotels. The city is also home to the Dania Beach Casino, which is a popular destination for tourists and locals alike.
The city is also home to several industrial parks, including the Dania Pointe Business Park, which is home to a number of businesses, including a Walmart Supercenter.
Demographics
As of 2019, the population of Dania Beach was 29,639. The population is made up of a diverse mix of people, including African Americans, Hispanics, and Caucasians. The median household income is $45,845 and the median age is 41.
The city is home to a number of churches, including the First Baptist Church of Dania Beach and the Church of God of Prophecy. The city is also home to a number of schools, including Dania Elementary School, Olsen Middle School, and South Broward High School.
Conclusion
Dania Beach is a city located in Broward County, Florida, United States. It is part of the South Florida metropolitan area and is home to a diverse mix of people. The city is located on the Atlantic Ocean and is home to several beaches, parks, and businesses. The city is also home to a number of churches and schools. The median household income is $45,845 and the median age is 41. Dania Beach is a popular destination for tourists and locals alike and is a great place to live, work, and play.
Common Questions
What is Per Capita Income in Dania Beach?
Per Capita income in Dania Beach is $35,346.
What is the Median Family Income in Dania Beach?
Median Family Income in Dania Beach is $62,121.
What is the Median Household income in Dania Beach?
Median Household Income in Dania Beach is $46,330.
What is Income or Wage Gap in Dania Beach?
Income or Wage Gap in Dania Beach is 10.9%.
Women in Dania Beach earn 89.1 cents for every dollar earned by a man.
What is Inequality or Gini Index in Dania Beach?
Inequality or Gini Index in Dania Beach is 0.55.
What is the Total Population of Dania Beach?
Total Population of Dania Beach is 31,700.
What is the Total Male Population of Dania Beach?
Total Male Population of Dania Beach is 15,626.
What is the Total Female Population of Dania Beach?
Total Female Population of Dania Beach is 16,074.
What is the Ratio of Males per 100 Females in Dania Beach?
There are 97.21 Males per 100 Females in Dania Beach.
What is the Ratio of Females per 100 Males in Dania Beach?
There are 102.87 Females per 100 Males in Dania Beach.
What is the Median Population Age in Dania Beach?
Median Population Age in Dania Beach is 42.0 Years.
What is the Average Family Size in Dania Beach
Average Family Size in Dania Beach is 3.0 People.
What is the Average Household Size in Dania Beach
Average Household Size in Dania Beach is 2.3 People.
How Large is the Labor Force in Dania Beach?
There are 16,836 People in the Labor Forcein in Dania Beach.
What is the Percentage of People in the Labor Force in Dania Beach?
63.9% of People are in the Labor Force in Dania Beach.
What is the Unemployment Rate in Dania Beach?
Unemployment Rate in Dania Beach is 9.0%.