West Park, FL Map & Demographics
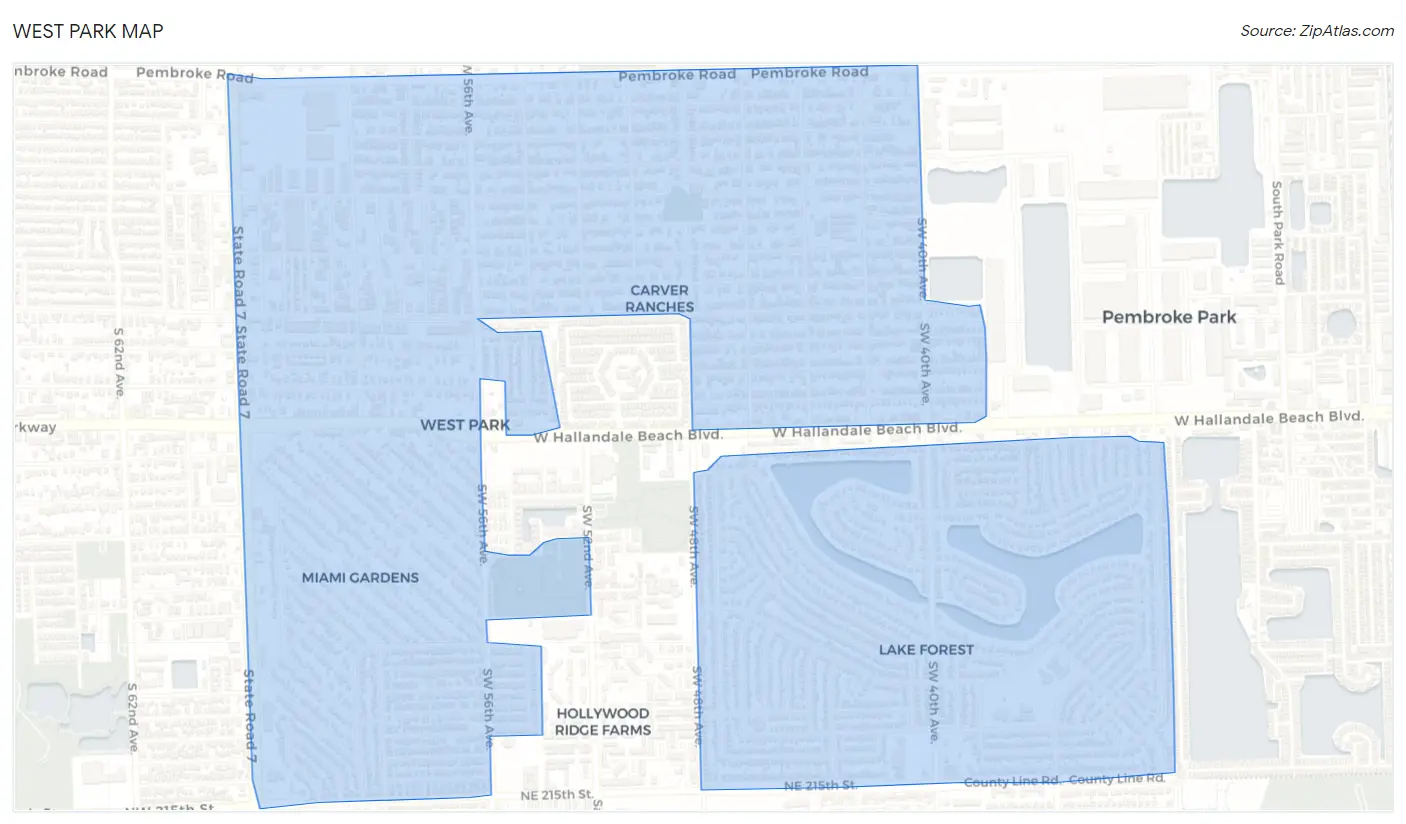
West Park Map
West Park Overview
$24,958
PER CAPITA INCOME
$60,527
AVG FAMILY INCOME
$58,712
AVG HOUSEHOLD INCOME
17.5%
WAGE / INCOME GAP [ % ]
82.5¢/ $1
WAGE / INCOME GAP [ $ ]
$9,999
FAMILY INCOME DEFICIT
0.44
INEQUALITY / GINI INDEX
15,074
TOTAL POPULATION
7,599
MALE POPULATION
7,475
FEMALE POPULATION
101.66
MALES / 100 FEMALES
98.37
FEMALES / 100 MALES
34.8
MEDIAN AGE
3.7
AVG FAMILY SIZE
3.2
AVG HOUSEHOLD SIZE
8,264
LABOR FORCE [ PEOPLE ]
68.2%
PERCENT IN LABOR FORCE
8.6%
UNEMPLOYMENT RATE
West Park Area Codes
Income in West Park
Income Overview in West Park
Per Capita Income in West Park is $24,958, while median incomes of families and households are $60,527 and $58,712 respectively.
| Characteristic | Number | Measure |
| Per Capita Income | 15,074 | $24,958 |
| Median Family Income | 3,309 | $60,527 |
| Mean Family Income | 3,309 | $80,596 |
| Median Household Income | 4,628 | $58,712 |
| Mean Household Income | 4,628 | $76,465 |
| Income Deficit | 3,309 | $9,999 |
| Wage / Income Gap (%) | 15,074 | 17.52% |
| Wage / Income Gap ($) | 15,074 | 82.48¢ per $1 |
| Gini / Inequality Index | 15,074 | 0.44 |
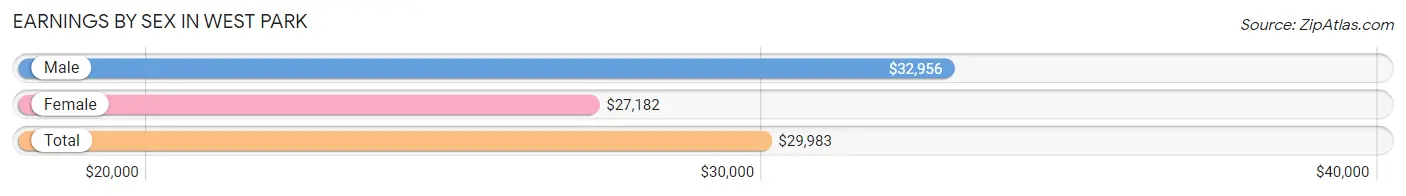
Earnings by Sex in West Park
Average Earnings in West Park are $29,983, $32,956 for men and $27,182 for women, a difference of 17.5%.
| Sex | Number | Average Earnings |
| Male | 4,653 (54.7%) | $32,956 |
| Female | 3,856 (45.3%) | $27,182 |
| Total | 8,509 (100.0%) | $29,983 |
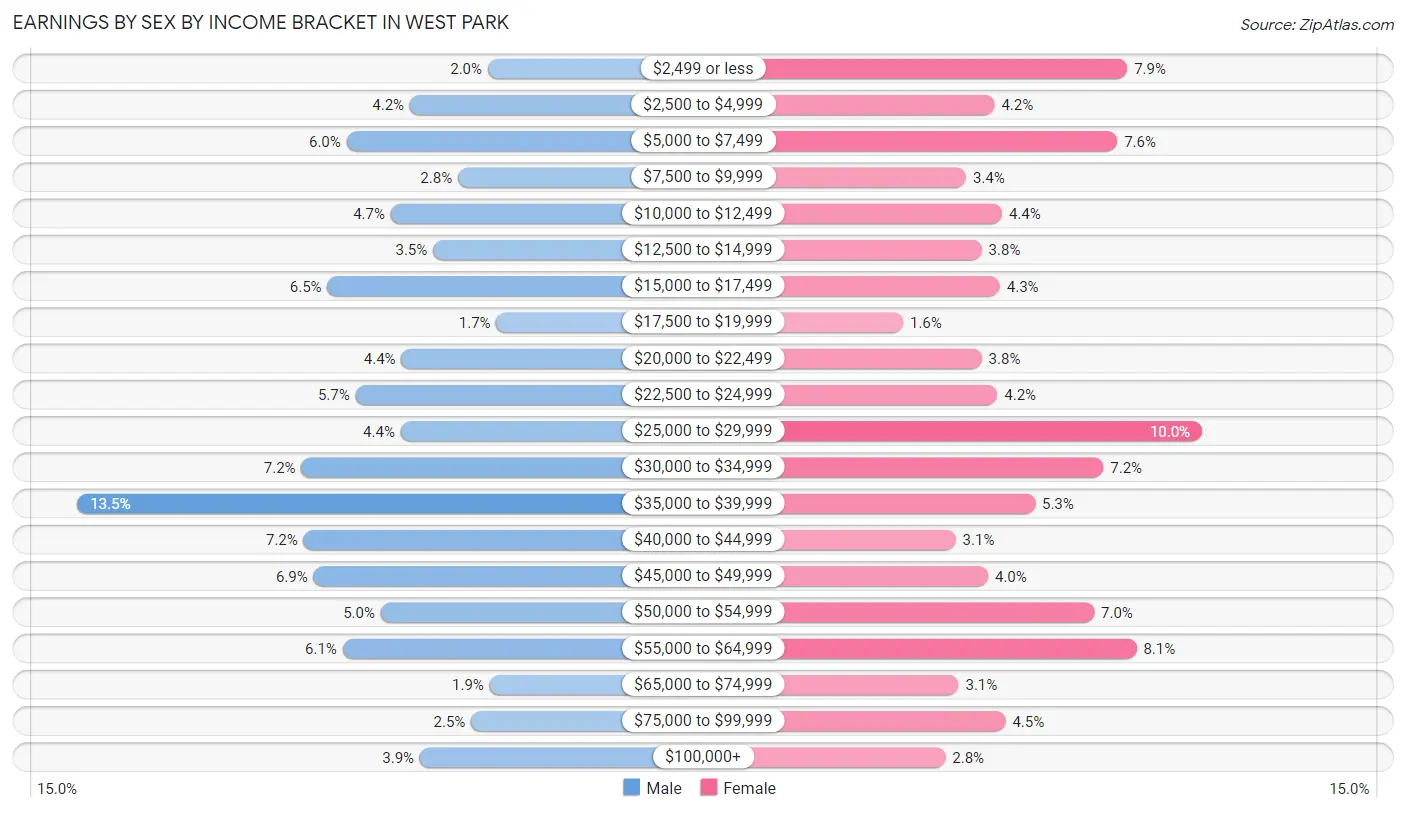
Earnings by Sex by Income Bracket in West Park
The most common earnings brackets in West Park are $35,000 to $39,999 for men (629 | 13.5%) and $25,000 to $29,999 for women (385 | 10.0%).
| Income | Male | Female |
| $2,499 or less | 92 (2.0%) | 304 (7.9%) |
| $2,500 to $4,999 | 194 (4.2%) | 160 (4.2%) |
| $5,000 to $7,499 | 277 (5.9%) | 293 (7.6%) |
| $7,500 to $9,999 | 131 (2.8%) | 129 (3.4%) |
| $10,000 to $12,499 | 219 (4.7%) | 168 (4.4%) |
| $12,500 to $14,999 | 164 (3.5%) | 146 (3.8%) |
| $15,000 to $17,499 | 302 (6.5%) | 166 (4.3%) |
| $17,500 to $19,999 | 81 (1.7%) | 61 (1.6%) |
| $20,000 to $22,499 | 205 (4.4%) | 146 (3.8%) |
| $22,500 to $24,999 | 265 (5.7%) | 163 (4.2%) |
| $25,000 to $29,999 | 206 (4.4%) | 385 (10.0%) |
| $30,000 to $34,999 | 336 (7.2%) | 278 (7.2%) |
| $35,000 to $39,999 | 629 (13.5%) | 204 (5.3%) |
| $40,000 to $44,999 | 333 (7.2%) | 118 (3.1%) |
| $45,000 to $49,999 | 320 (6.9%) | 153 (4.0%) |
| $50,000 to $54,999 | 232 (5.0%) | 268 (7.0%) |
| $55,000 to $64,999 | 282 (6.1%) | 314 (8.1%) |
| $65,000 to $74,999 | 90 (1.9%) | 121 (3.1%) |
| $75,000 to $99,999 | 114 (2.5%) | 172 (4.5%) |
| $100,000+ | 181 (3.9%) | 107 (2.8%) |
| Total | 4,653 (100.0%) | 3,856 (100.0%) |
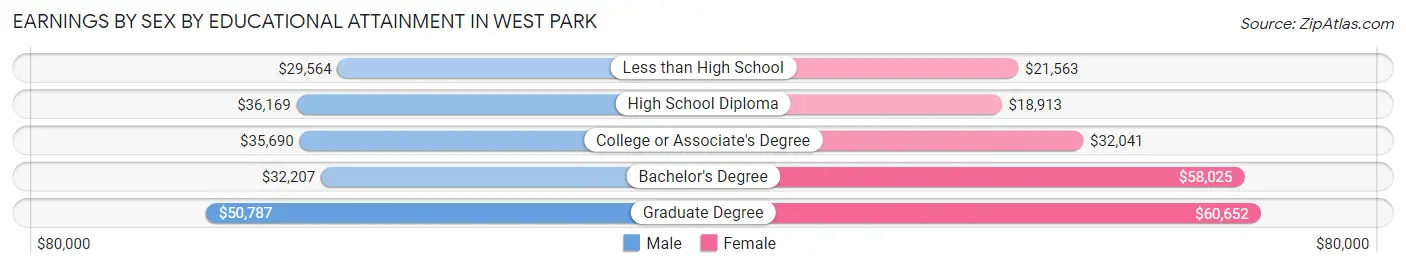
Earnings by Sex by Educational Attainment in West Park
Average earnings in West Park are $35,573 for men and $30,138 for women, a difference of 15.3%. Men with an educational attainment of graduate degree enjoy the highest average annual earnings of $50,787, while those with less than high school education earn the least with $29,564. Women with an educational attainment of graduate degree earn the most with the average annual earnings of $60,652, while those with high school diploma education have the smallest earnings of $18,913.
| Educational Attainment | Male Income | Female Income |
| Less than High School | $29,564 | $21,563 |
| High School Diploma | $36,169 | $18,913 |
| College or Associate's Degree | $35,690 | $32,041 |
| Bachelor's Degree | $32,207 | $58,025 |
| Graduate Degree | $50,787 | $60,652 |
| Total | $35,573 | $30,138 |
Family Income in West Park
Family Income Brackets in West Park
According to the West Park family income data, there are 668 families falling into the $50,000 to $74,999 income range, which is the most common income bracket and makes up 20.2% of all families. Conversely, the less than $10,000 income bracket is the least frequent group with only 63 families (1.9%) belonging to this category.
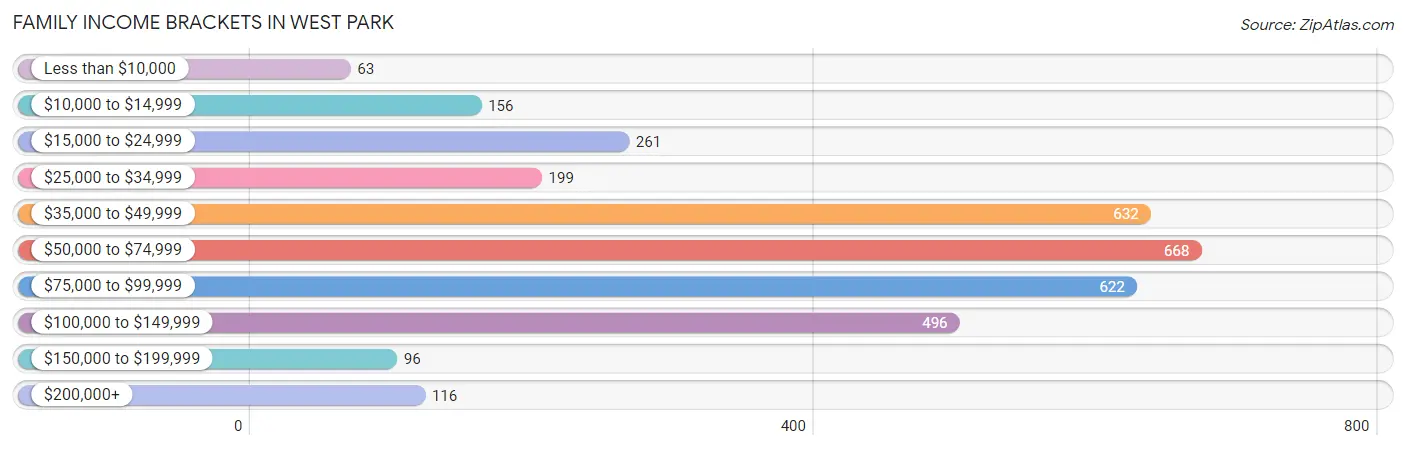
| Income Bracket | # Families | % Families |
| Less than $10,000 | 63 | 1.9% |
| $10,000 to $14,999 | 156 | 4.7% |
| $15,000 to $24,999 | 261 | 7.9% |
| $25,000 to $34,999 | 199 | 6.0% |
| $35,000 to $49,999 | 632 | 19.1% |
| $50,000 to $74,999 | 668 | 20.2% |
| $75,000 to $99,999 | 622 | 18.8% |
| $100,000 to $149,999 | 496 | 15.0% |
| $150,000 to $199,999 | 96 | 2.9% |
| $200,000+ | 116 | 3.5% |
Family Income by Famaliy Size in West Park
4-person families (687 | 20.8%) account for the highest median family income in West Park with $77,261 per family, while 2-person families (1,052 | 31.8%) have the highest median income of $22,359 per family member.
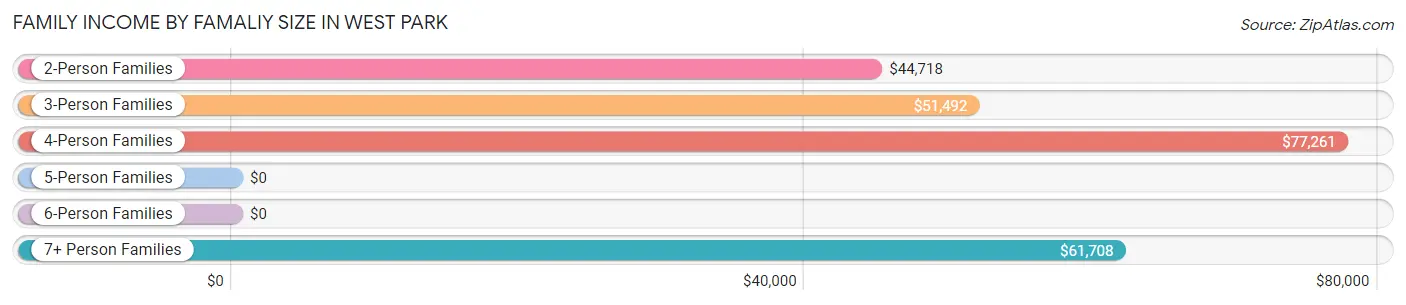
| Income Bracket | # Families | Median Income |
| 2-Person Families | 1,052 (31.8%) | $44,718 |
| 3-Person Families | 845 (25.5%) | $51,492 |
| 4-Person Families | 687 (20.8%) | $77,261 |
| 5-Person Families | 564 (17.0%) | $0 |
| 6-Person Families | 92 (2.8%) | $0 |
| 7+ Person Families | 69 (2.1%) | $61,708 |
| Total | 3,309 (100.0%) | $60,527 |
Family Income by Number of Earners in West Park
The median family income in West Park is $60,527, with families comprising 3+ earners (778) having the highest median family income of $96,026, while families with no earners (208) have the lowest median family income of $25,833, accounting for 23.5% and 6.3% of families, respectively.
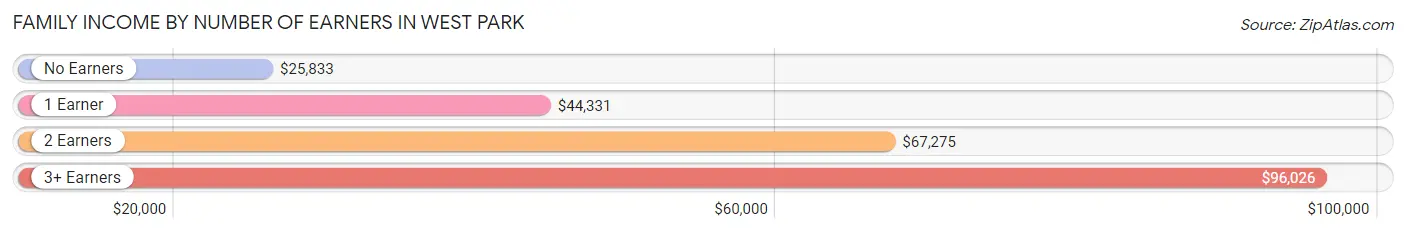
| Number of Earners | # Families | Median Income |
| No Earners | 208 (6.3%) | $25,833 |
| 1 Earner | 1,060 (32.0%) | $44,331 |
| 2 Earners | 1,263 (38.2%) | $67,275 |
| 3+ Earners | 778 (23.5%) | $96,026 |
| Total | 3,309 (100.0%) | $60,527 |
Household Income in West Park
Household Income Brackets in West Park
With 921 households falling in the category, the $75,000 to $99,999 income range is the most frequent in West Park, accounting for 19.9% of all households. In contrast, only 130 households (2.8%) fall into the $200,000+ income bracket, making it the least populous group.
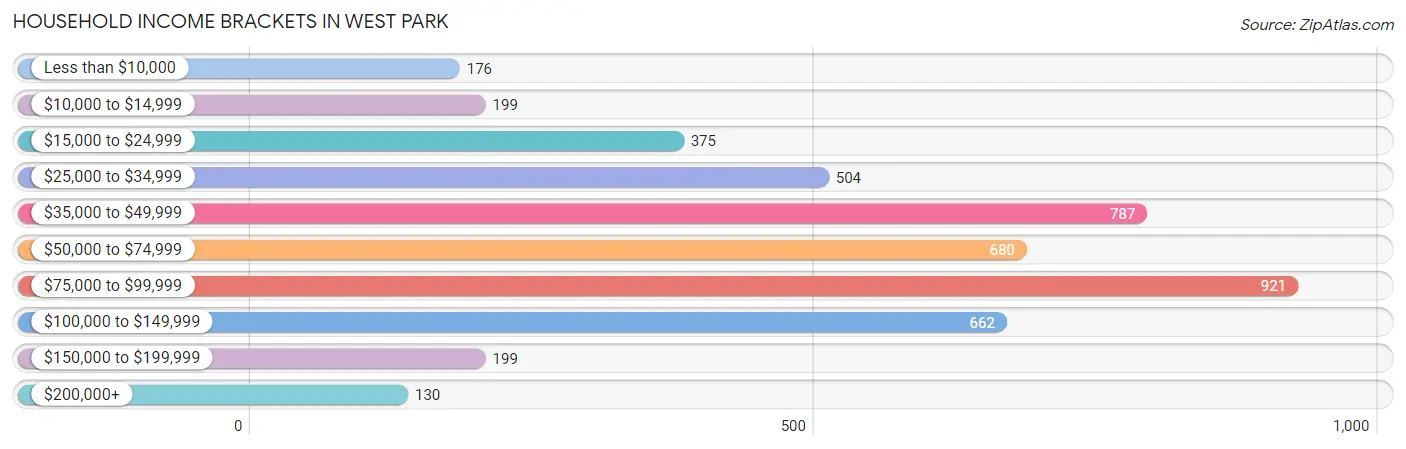
| Income Bracket | # Households | % Households |
| Less than $10,000 | 176 | 3.8% |
| $10,000 to $14,999 | 199 | 4.3% |
| $15,000 to $24,999 | 375 | 8.1% |
| $25,000 to $34,999 | 504 | 10.9% |
| $35,000 to $49,999 | 787 | 17.0% |
| $50,000 to $74,999 | 680 | 14.7% |
| $75,000 to $99,999 | 921 | 19.9% |
| $100,000 to $149,999 | 662 | 14.3% |
| $150,000 to $199,999 | 199 | 4.3% |
| $200,000+ | 130 | 2.8% |
Household Income by Householder Age in West Park
The median household income in West Park is $58,712, with the highest median household income of $62,321 found in the 45 to 64 years age bracket for the primary householder. A total of 1,762 households (38.1%) fall into this category. Meanwhile, the 15 to 24 years age bracket for the primary householder has the lowest median household income of $0, with 90 households (1.9%) in this group.
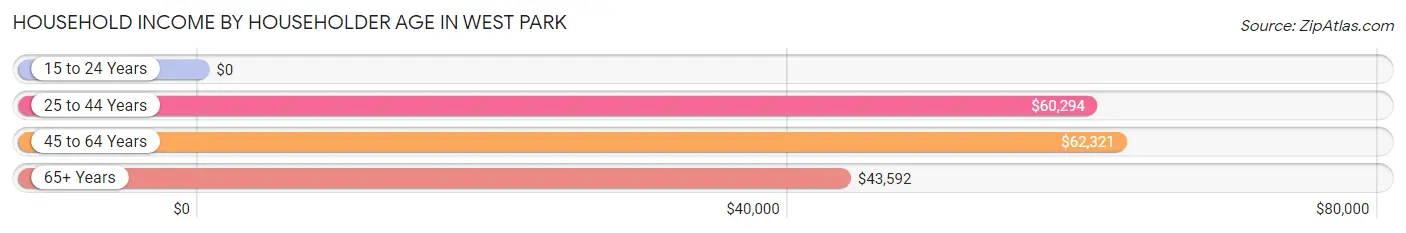
| Income Bracket | # Households | Median Income |
| 15 to 24 Years | 90 (1.9%) | $0 |
| 25 to 44 Years | 1,712 (37.0%) | $60,294 |
| 45 to 64 Years | 1,762 (38.1%) | $62,321 |
| 65+ Years | 1,064 (23.0%) | $43,592 |
| Total | 4,628 (100.0%) | $58,712 |
Poverty in West Park
Income Below Poverty by Sex and Age in West Park
With 16.1% poverty level for males and 15.8% for females among the residents of West Park, 15 year old males and 6 to 11 year old females are the most vulnerable to poverty, with 45 males (50.0%) and 176 females (40.2%) in their respective age groups living below the poverty level.
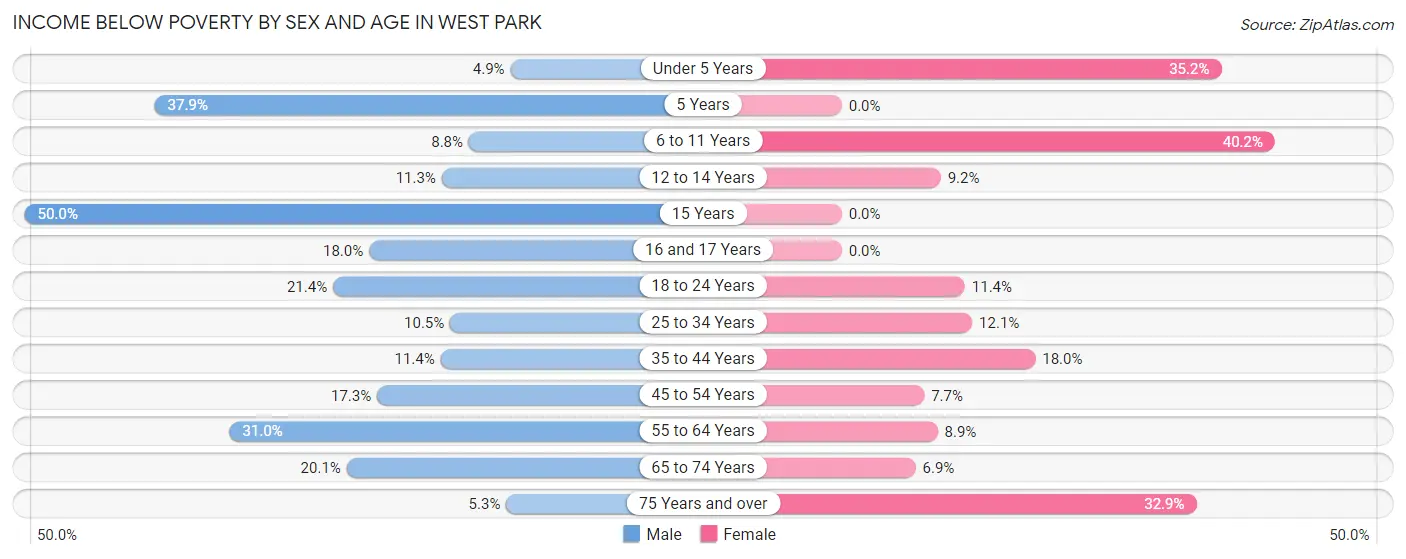
| Age Bracket | Male | Female |
| Under 5 Years | 13 (4.9%) | 206 (35.2%) |
| 5 Years | 44 (37.9%) | 0 (0.0%) |
| 6 to 11 Years | 60 (8.8%) | 176 (40.2%) |
| 12 to 14 Years | 36 (11.3%) | 38 (9.2%) |
| 15 Years | 45 (50.0%) | 0 (0.0%) |
| 16 and 17 Years | 44 (18.0%) | 0 (0.0%) |
| 18 to 24 Years | 124 (21.4%) | 73 (11.4%) |
| 25 to 34 Years | 177 (10.5%) | 161 (12.1%) |
| 35 to 44 Years | 98 (11.4%) | 144 (18.0%) |
| 45 to 54 Years | 134 (17.3%) | 77 (7.6%) |
| 55 to 64 Years | 318 (31.0%) | 78 (8.9%) |
| 65 to 74 Years | 105 (20.1%) | 42 (6.9%) |
| 75 Years and over | 23 (5.3%) | 178 (32.9%) |
| Total | 1,221 (16.1%) | 1,173 (15.8%) |
Income Above Poverty by Sex and Age in West Park
According to the poverty statistics in West Park, males aged under 5 years and females aged 15 years are the age groups that are most secure financially, with 95.1% of males and 100.0% of females in these age groups living above the poverty line.
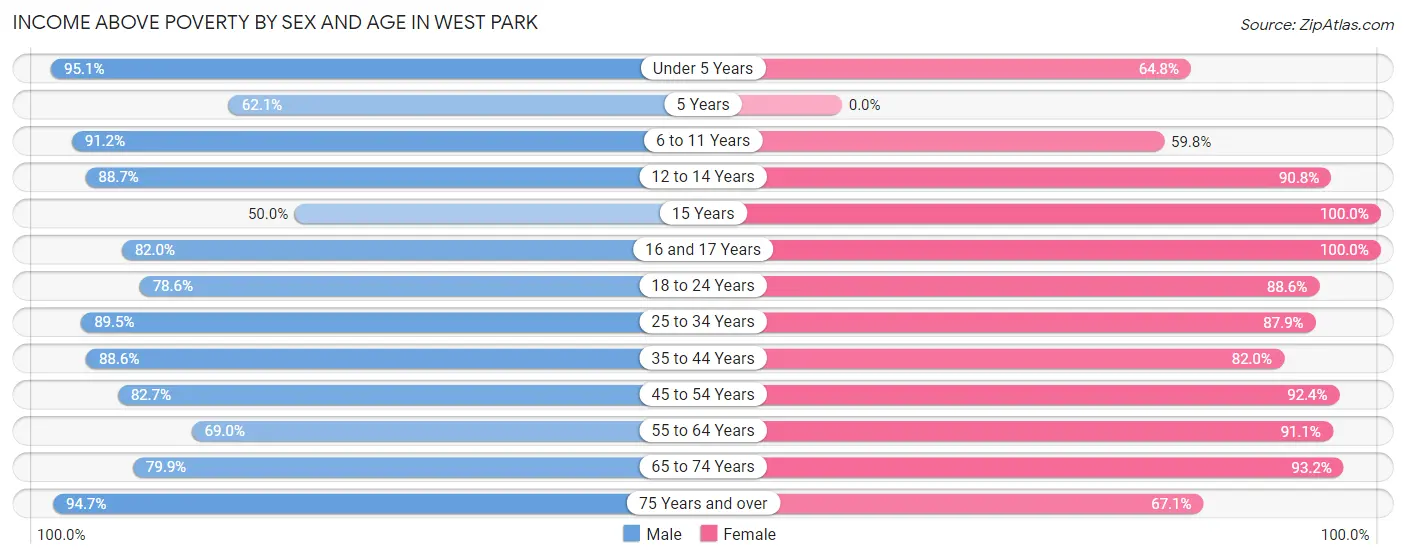
| Age Bracket | Male | Female |
| Under 5 Years | 252 (95.1%) | 379 (64.8%) |
| 5 Years | 72 (62.1%) | 0 (0.0%) |
| 6 to 11 Years | 624 (91.2%) | 262 (59.8%) |
| 12 to 14 Years | 283 (88.7%) | 376 (90.8%) |
| 15 Years | 45 (50.0%) | 46 (100.0%) |
| 16 and 17 Years | 200 (82.0%) | 140 (100.0%) |
| 18 to 24 Years | 456 (78.6%) | 566 (88.6%) |
| 25 to 34 Years | 1,507 (89.5%) | 1,170 (87.9%) |
| 35 to 44 Years | 762 (88.6%) | 658 (82.0%) |
| 45 to 54 Years | 641 (82.7%) | 929 (92.3%) |
| 55 to 64 Years | 708 (69.0%) | 799 (91.1%) |
| 65 to 74 Years | 417 (79.9%) | 571 (93.1%) |
| 75 Years and over | 411 (94.7%) | 363 (67.1%) |
| Total | 6,378 (83.9%) | 6,259 (84.2%) |
Income Below Poverty Among Married-Couple Families in West Park
The poverty statistics for married-couple families in West Park show that 7.1% or 125 of the total 1,759 families live below the poverty line. Families with 3 or 4 children have the highest poverty rate of 10.8%, comprising of 36 families. On the other hand, families with no children have the lowest poverty rate of 5.7%, which includes 44 families.
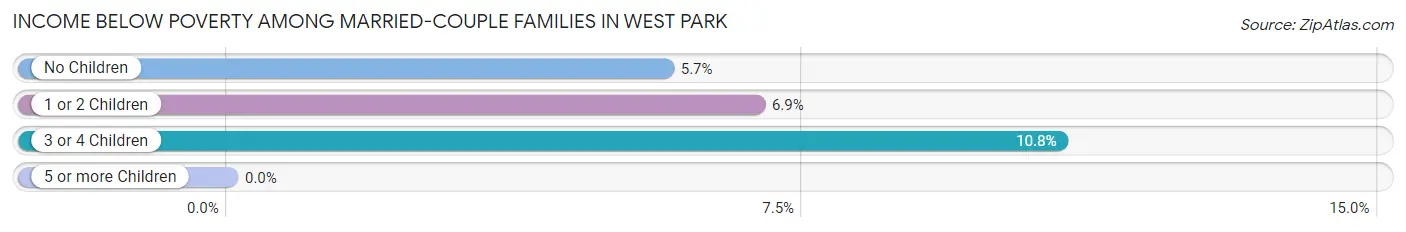
| Children | Above Poverty | Below Poverty |
| No Children | 729 (94.3%) | 44 (5.7%) |
| 1 or 2 Children | 609 (93.1%) | 45 (6.9%) |
| 3 or 4 Children | 296 (89.2%) | 36 (10.8%) |
| 5 or more Children | 0 (0.0%) | 0 (0.0%) |
| Total | 1,634 (92.9%) | 125 (7.1%) |
Income Below Poverty Among Single-Parent Households in West Park
According to the poverty data in West Park, 49.7% or 216 single-father households and 10.0% or 111 single-mother households are living below the poverty line. Among single-father households, those with 3 or 4 children have the highest poverty rate, with 10 households (100.0%) experiencing poverty. Likewise, among single-mother households, those with 3 or 4 children have the highest poverty rate, with 57 households (41.0%) falling below the poverty line.
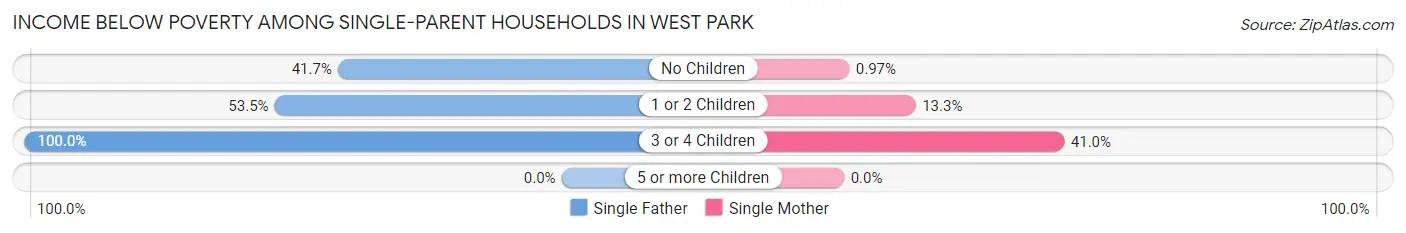
| Children | Single Father | Single Mother |
| No Children | 75 (41.7%) | 6 (1.0%) |
| 1 or 2 Children | 131 (53.5%) | 48 (13.3%) |
| 3 or 4 Children | 10 (100.0%) | 57 (41.0%) |
| 5 or more Children | 0 (0.0%) | 0 (0.0%) |
| Total | 216 (49.7%) | 111 (10.0%) |
Income Below Poverty Among Married-Couple vs Single-Parent Households in West Park
The poverty data for West Park shows that 125 of the married-couple family households (7.1%) and 327 of the single-parent households (21.1%) are living below the poverty level. Within the married-couple family households, those with 3 or 4 children have the highest poverty rate, with 36 households (10.8%) falling below the poverty line. Among the single-parent households, those with 3 or 4 children have the highest poverty rate, with 67 household (45.0%) living below poverty.
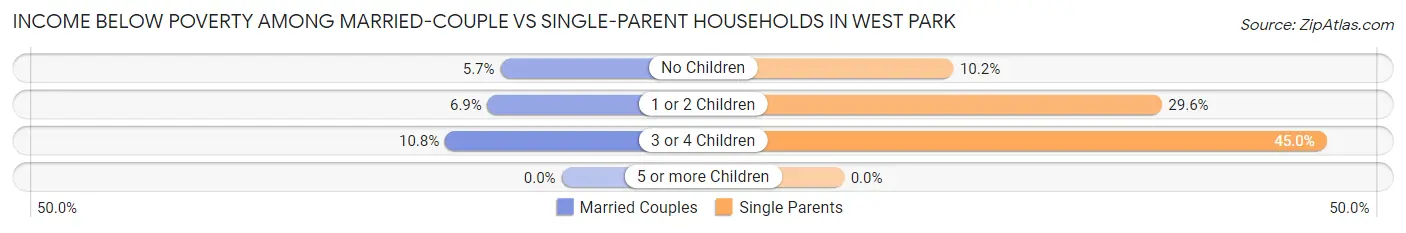
| Children | Married-Couple Families | Single-Parent Households |
| No Children | 44 (5.7%) | 81 (10.2%) |
| 1 or 2 Children | 45 (6.9%) | 179 (29.6%) |
| 3 or 4 Children | 36 (10.8%) | 67 (45.0%) |
| 5 or more Children | 0 (0.0%) | 0 (0.0%) |
| Total | 125 (7.1%) | 327 (21.1%) |
Race in West Park
The most populous races in West Park are Black / African American (6,921 | 45.9%), Hispanic or Latino (6,410 | 42.5%), and White / Caucasian (4,307 | 28.6%).
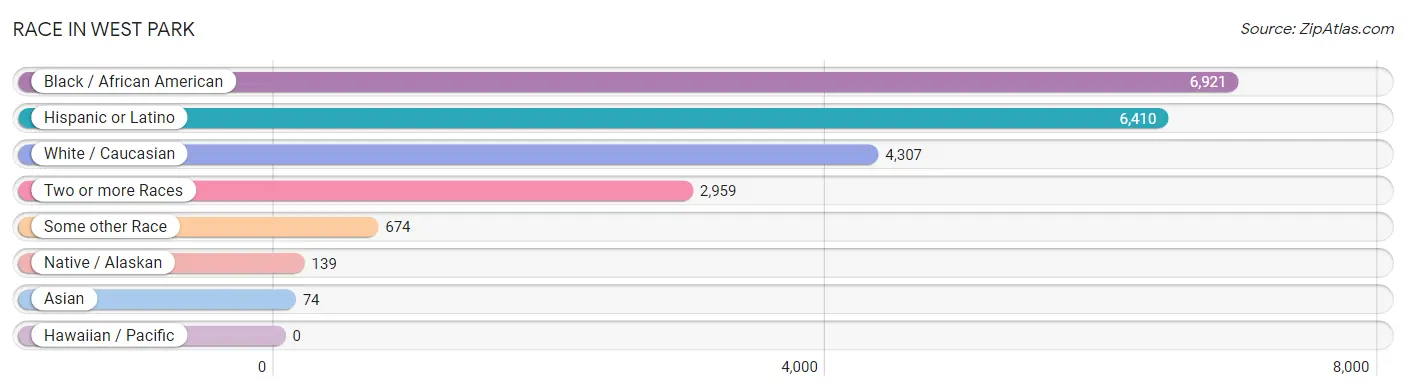
| Race | # Population | % Population |
| Asian | 74 | 0.5% |
| Black / African American | 6,921 | 45.9% |
| Hawaiian / Pacific | 0 | 0.0% |
| Hispanic or Latino | 6,410 | 42.5% |
| Native / Alaskan | 139 | 0.9% |
| White / Caucasian | 4,307 | 28.6% |
| Two or more Races | 2,959 | 19.6% |
| Some other Race | 674 | 4.5% |
| Total | 15,074 | 100.0% |
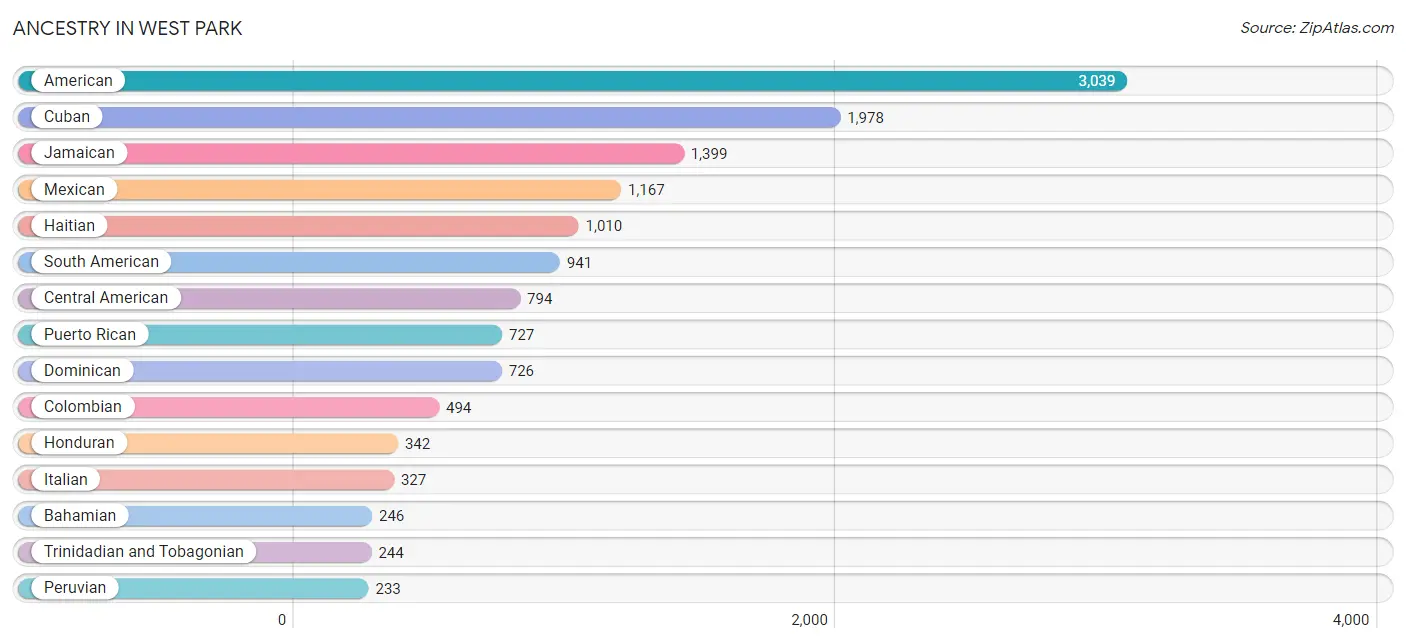
Ancestry in West Park
The most populous ancestries reported in West Park are American (3,039 | 20.2%), Cuban (1,978 | 13.1%), Jamaican (1,399 | 9.3%), Mexican (1,167 | 7.7%), and Haitian (1,010 | 6.7%), together accounting for 57.0% of all West Park residents.
| Ancestry | # Population | % Population |
| African | 129 | 0.9% |
| American | 3,039 | 20.2% |
| Bahamian | 246 | 1.6% |
| Barbadian | 16 | 0.1% |
| Belizean | 27 | 0.2% |
| British | 10 | 0.1% |
| Canadian | 10 | 0.1% |
| Central American | 794 | 5.3% |
| Central American Indian | 40 | 0.3% |
| Cherokee | 37 | 0.3% |
| Chilean | 86 | 0.6% |
| Colombian | 494 | 3.3% |
| Cuban | 1,978 | 13.1% |
| Dominican | 726 | 4.8% |
| Dutch | 20 | 0.1% |
| Ecuadorian | 17 | 0.1% |
| English | 35 | 0.2% |
| European | 10 | 0.1% |
| French | 45 | 0.3% |
| German | 118 | 0.8% |
| Guatemalan | 185 | 1.2% |
| Haitian | 1,010 | 6.7% |
| Honduran | 342 | 2.3% |
| Irish | 127 | 0.8% |
| Italian | 327 | 2.2% |
| Jamaican | 1,399 | 9.3% |
| Mexican | 1,167 | 7.7% |
| Mexican American Indian | 117 | 0.8% |
| Nicaraguan | 133 | 0.9% |
| Panamanian | 47 | 0.3% |
| Peruvian | 233 | 1.5% |
| Polish | 67 | 0.4% |
| Portuguese | 8 | 0.1% |
| Puerto Rican | 727 | 4.8% |
| Romanian | 51 | 0.3% |
| Salvadoran | 87 | 0.6% |
| Scotch-Irish | 6 | 0.0% |
| Scottish | 14 | 0.1% |
| South American | 941 | 6.2% |
| South American Indian | 25 | 0.2% |
| Sri Lankan | 71 | 0.5% |
| Subsaharan African | 129 | 0.9% |
| Swedish | 43 | 0.3% |
| Thai | 3 | 0.0% |
| Trinidadian and Tobagonian | 244 | 1.6% |
| Venezuelan | 111 | 0.7% | View All 46 Rows |
Immigrants in West Park
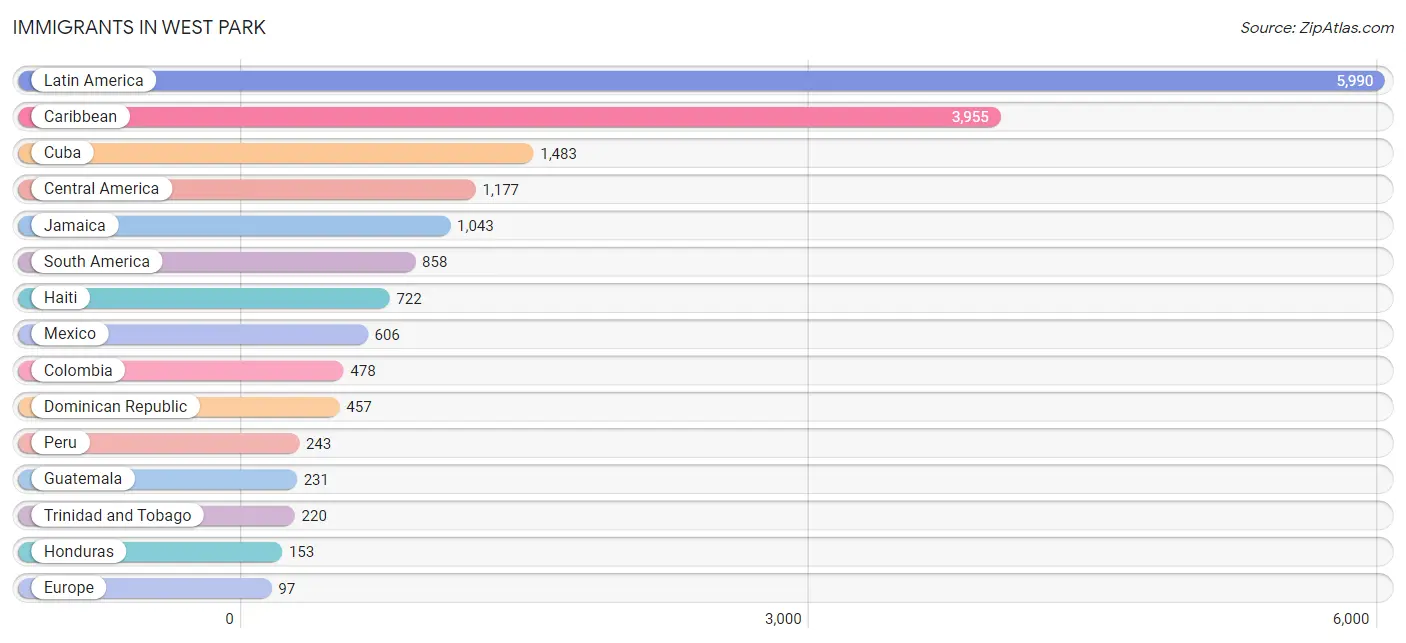
The most numerous immigrant groups reported in West Park came from Latin America (5,990 | 39.7%), Caribbean (3,955 | 26.2%), Cuba (1,483 | 9.8%), Central America (1,177 | 7.8%), and Jamaica (1,043 | 6.9%), together accounting for 90.6% of all West Park residents.
| Immigration Origin | # Population | % Population |
| Asia | 71 | 0.5% |
| Bahamas | 30 | 0.2% |
| Belize | 27 | 0.2% |
| Brazil | 14 | 0.1% |
| Caribbean | 3,955 | 26.2% |
| Central America | 1,177 | 7.8% |
| Chile | 62 | 0.4% |
| Colombia | 478 | 3.2% |
| Cuba | 1,483 | 9.8% |
| Dominican Republic | 457 | 3.0% |
| Eastern Europe | 51 | 0.3% |
| Ecuador | 17 | 0.1% |
| El Salvador | 71 | 0.5% |
| England | 17 | 0.1% |
| Europe | 97 | 0.6% |
| France | 10 | 0.1% |
| Guatemala | 231 | 1.5% |
| Haiti | 722 | 4.8% |
| Honduras | 153 | 1.0% |
| Jamaica | 1,043 | 6.9% |
| Latin America | 5,990 | 39.7% |
| Mexico | 606 | 4.0% |
| Nicaragua | 86 | 0.6% |
| Northern Europe | 36 | 0.2% |
| Panama | 3 | 0.0% |
| Peru | 243 | 1.6% |
| Romania | 51 | 0.3% |
| South America | 858 | 5.7% |
| Sweden | 19 | 0.1% |
| Trinidad and Tobago | 220 | 1.5% |
| Venezuela | 44 | 0.3% |
| Western Europe | 10 | 0.1% | View All 32 Rows |
Sex and Age in West Park
Sex and Age in West Park
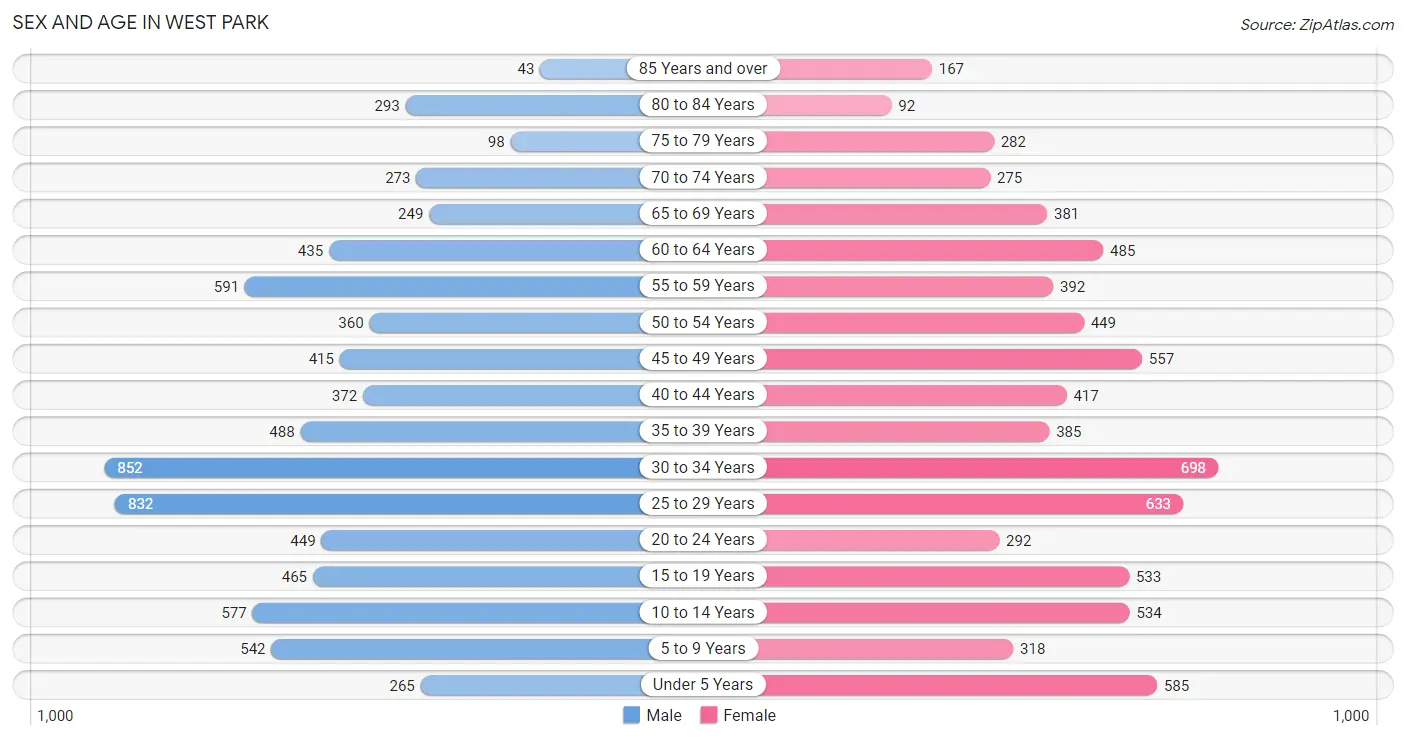
The most populous age groups in West Park are 30 to 34 Years (852 | 11.2%) for men and 30 to 34 Years (698 | 9.3%) for women.
| Age Bracket | Male | Female |
| Under 5 Years | 265 (3.5%) | 585 (7.8%) |
| 5 to 9 Years | 542 (7.1%) | 318 (4.3%) |
| 10 to 14 Years | 577 (7.6%) | 534 (7.1%) |
| 15 to 19 Years | 465 (6.1%) | 533 (7.1%) |
| 20 to 24 Years | 449 (5.9%) | 292 (3.9%) |
| 25 to 29 Years | 832 (11.0%) | 633 (8.5%) |
| 30 to 34 Years | 852 (11.2%) | 698 (9.3%) |
| 35 to 39 Years | 488 (6.4%) | 385 (5.1%) |
| 40 to 44 Years | 372 (4.9%) | 417 (5.6%) |
| 45 to 49 Years | 415 (5.5%) | 557 (7.4%) |
| 50 to 54 Years | 360 (4.7%) | 449 (6.0%) |
| 55 to 59 Years | 591 (7.8%) | 392 (5.2%) |
| 60 to 64 Years | 435 (5.7%) | 485 (6.5%) |
| 65 to 69 Years | 249 (3.3%) | 381 (5.1%) |
| 70 to 74 Years | 273 (3.6%) | 275 (3.7%) |
| 75 to 79 Years | 98 (1.3%) | 282 (3.8%) |
| 80 to 84 Years | 293 (3.9%) | 92 (1.2%) |
| 85 Years and over | 43 (0.6%) | 167 (2.2%) |
| Total | 7,599 (100.0%) | 7,475 (100.0%) |
Families and Households in West Park
Median Family Size in West Park
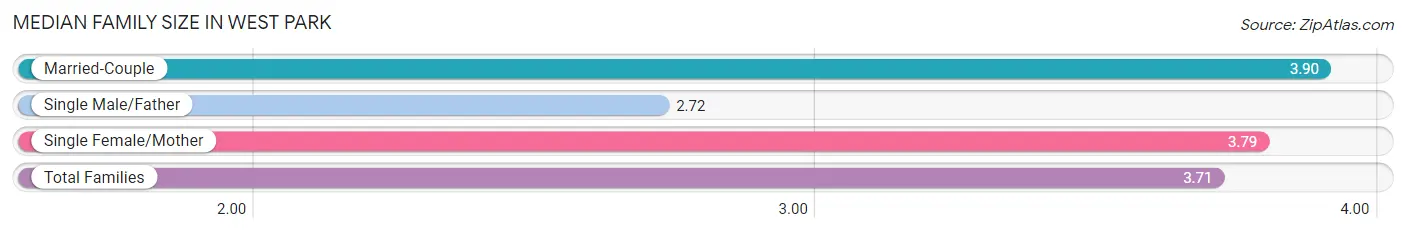
The median family size in West Park is 3.71 persons per family, with married-couple families (1,759 | 53.2%) accounting for the largest median family size of 3.9 persons per family. On the other hand, single male/father families (435 | 13.2%) represent the smallest median family size with 2.72 persons per family.
| Family Type | # Families | Family Size |
| Married-Couple | 1,759 (53.2%) | 3.90 |
| Single Male/Father | 435 (13.2%) | 2.72 |
| Single Female/Mother | 1,115 (33.7%) | 3.79 |
| Total Families | 3,309 (100.0%) | 3.71 |
Median Household Size in West Park
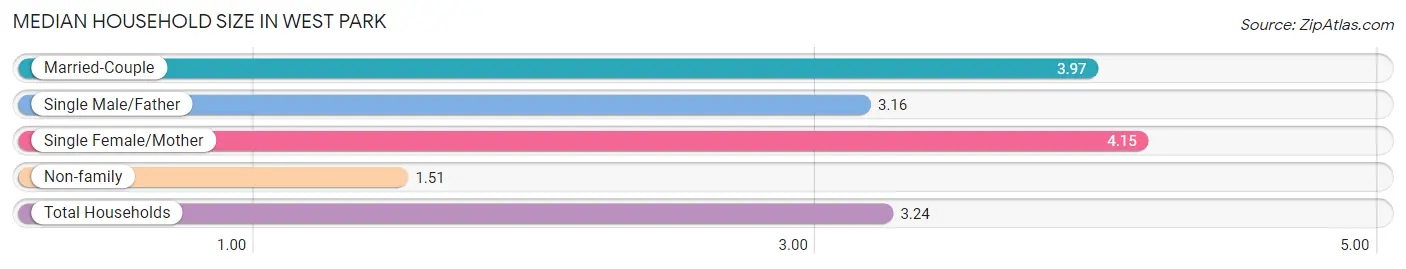
The median household size in West Park is 3.24 persons per household, with single female/mother households (1,115 | 24.1%) accounting for the largest median household size of 4.15 persons per household. non-family households (1,319 | 28.5%) represent the smallest median household size with 1.51 persons per household.
| Household Type | # Households | Household Size |
| Married-Couple | 1,759 (38.0%) | 3.97 |
| Single Male/Father | 435 (9.4%) | 3.16 |
| Single Female/Mother | 1,115 (24.1%) | 4.15 |
| Non-family | 1,319 (28.5%) | 1.51 |
| Total Households | 4,628 (100.0%) | 3.24 |
Household Size by Marriage Status in West Park
Out of a total of 4,628 households in West Park, 3,309 (71.5%) are family households, while 1,319 (28.5%) are nonfamily households. The most numerous type of family households are 3-person households, comprising 1,060, and the most common type of nonfamily households are 1-person households, comprising 915.
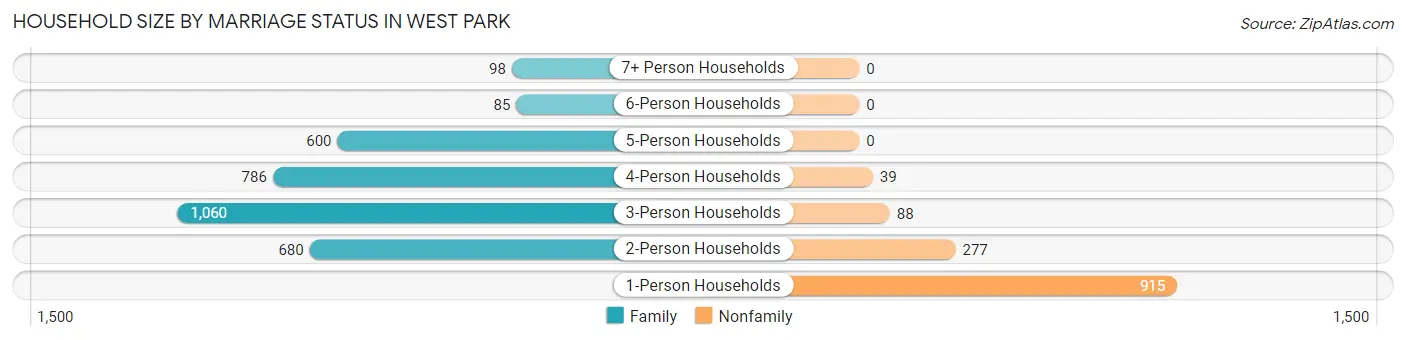
| Household Size | Family Households | Nonfamily Households |
| 1-Person Households | - | 915 (19.8%) |
| 2-Person Households | 680 (14.7%) | 277 (6.0%) |
| 3-Person Households | 1,060 (22.9%) | 88 (1.9%) |
| 4-Person Households | 786 (17.0%) | 39 (0.8%) |
| 5-Person Households | 600 (13.0%) | 0 (0.0%) |
| 6-Person Households | 85 (1.8%) | 0 (0.0%) |
| 7+ Person Households | 98 (2.1%) | 0 (0.0%) |
| Total | 3,309 (71.5%) | 1,319 (28.5%) |
Female Fertility in West Park
Fertility by Age in West Park
Average fertility rate in West Park is 15.0 births per 1,000 women. Women in the age bracket of 15 to 19 years have the highest fertility rate with 26.0 births per 1,000 women. Women in the age bracket of 20 to 34 years acount for 73.6% of all women with births.
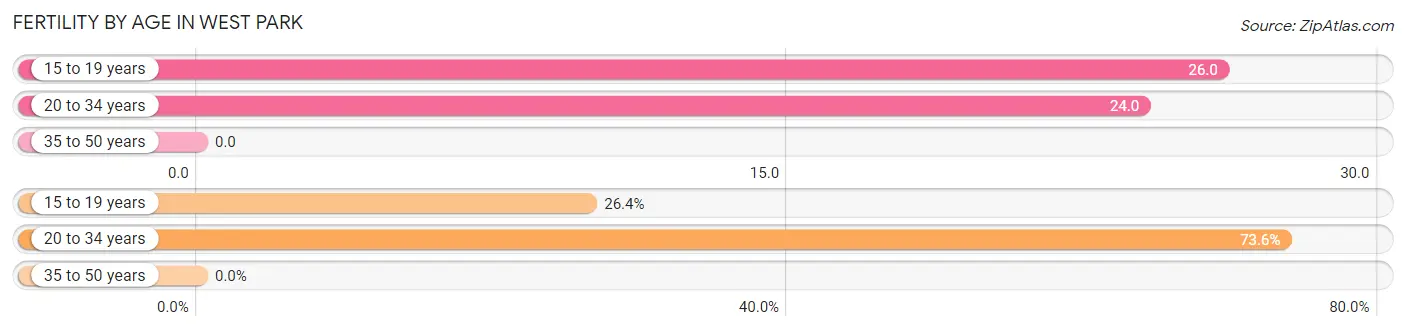
| Age Bracket | Women with Births | Births / 1,000 Women |
| 15 to 19 years | 14 (26.4%) | 26.0 |
| 20 to 34 years | 39 (73.6%) | 24.0 |
| 35 to 50 years | 0 (0.0%) | 0.0 |
| Total | 53 (100.0%) | 15.0 |
Fertility by Age by Marriage Status in West Park
43.4% of women with births (53) in West Park are married. The highest percentage of unmarried women with births falls into 15 to 19 years age bracket with 100.0% of them unmarried at the time of birth, while the lowest percentage of unmarried women with births belong to 20 to 34 years age bracket with 41.0% of them unmarried.
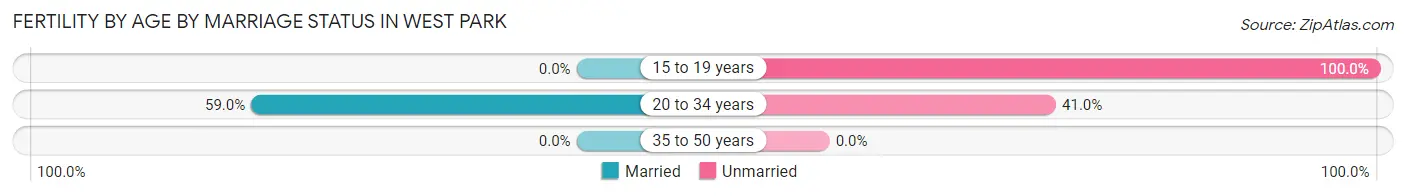
| Age Bracket | Married | Unmarried |
| 15 to 19 years | 0 (0.0%) | 14 (100.0%) |
| 20 to 34 years | 23 (59.0%) | 16 (41.0%) |
| 35 to 50 years | 0 (0.0%) | 0 (0.0%) |
| Total | 23 (43.4%) | 30 (56.6%) |
Fertility by Education in West Park
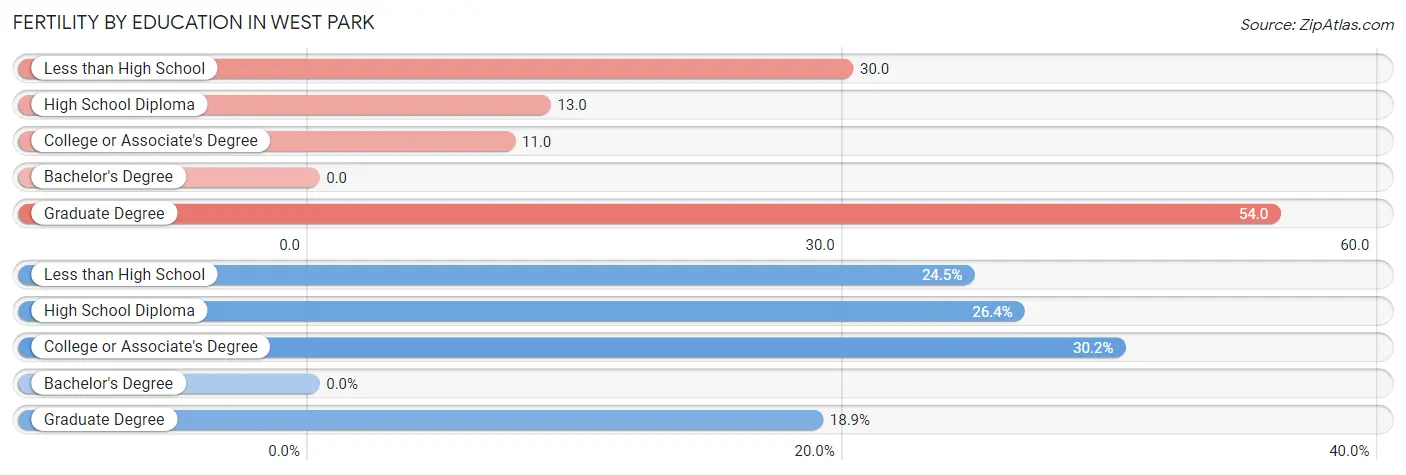
| Educational Attainment | Women with Births | Births / 1,000 Women |
| Less than High School | 13 (24.5%) | 30.0 |
| High School Diploma | 14 (26.4%) | 13.0 |
| College or Associate's Degree | 16 (30.2%) | 11.0 |
| Bachelor's Degree | 0 (0.0%) | 0.0 |
| Graduate Degree | 10 (18.9%) | 54.0 |
| Total | 53 (100.0%) | 15.0 |
Fertility by Education by Marriage Status in West Park
56.6% of women with births in West Park are unmarried. Women with the educational attainment of less than high school are most likely to be married with 100.0% of them married at childbirth, while women with the educational attainment of high school diploma are least likely to be married with 100.0% of them unmarried at childbirth.
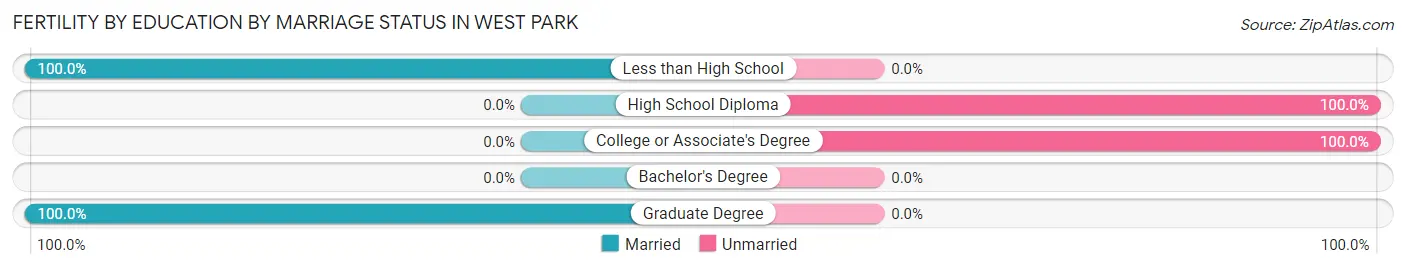
| Educational Attainment | Married | Unmarried |
| Less than High School | 13 (100.0%) | 0 (0.0%) |
| High School Diploma | 0 (0.0%) | 14 (100.0%) |
| College or Associate's Degree | 0 (0.0%) | 16 (100.0%) |
| Bachelor's Degree | 0 (0.0%) | 0 (0.0%) |
| Graduate Degree | 10 (100.0%) | 0 (0.0%) |
| Total | 23 (43.4%) | 30 (56.6%) |
Employment Characteristics in West Park
Employment by Class of Employer in West Park
Among the 7,306 employed individuals in West Park, private company employees (5,109 | 69.9%), self-employed (not incorporated) (698 | 9.6%), and local government employees (466 | 6.4%) make up the most common classes of employment.
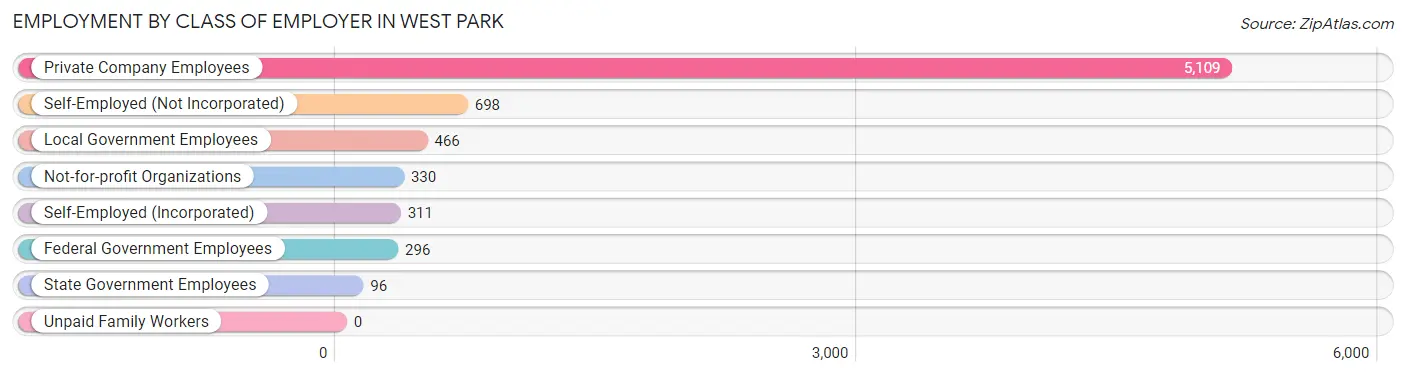
| Employer Class | # Employees | % Employees |
| Private Company Employees | 5,109 | 69.9% |
| Self-Employed (Incorporated) | 311 | 4.3% |
| Self-Employed (Not Incorporated) | 698 | 9.6% |
| Not-for-profit Organizations | 330 | 4.5% |
| Local Government Employees | 466 | 6.4% |
| State Government Employees | 96 | 1.3% |
| Federal Government Employees | 296 | 4.1% |
| Unpaid Family Workers | 0 | 0.0% |
| Total | 7,306 | 100.0% |
Employment Status by Age in West Park
According to the labor force statistics for West Park, out of the total population over 16 years of age (12,117), 68.2% or 8,264 individuals are in the labor force, with 8.6% or 711 of them unemployed. The age group with the highest labor force participation rate is 25 to 29 years, with 92.0% or 1,348 individuals in the labor force. Within the labor force, the 20 to 24 years age range has the highest percentage of unemployed individuals, with 29.8% or 174 of them being unemployed.
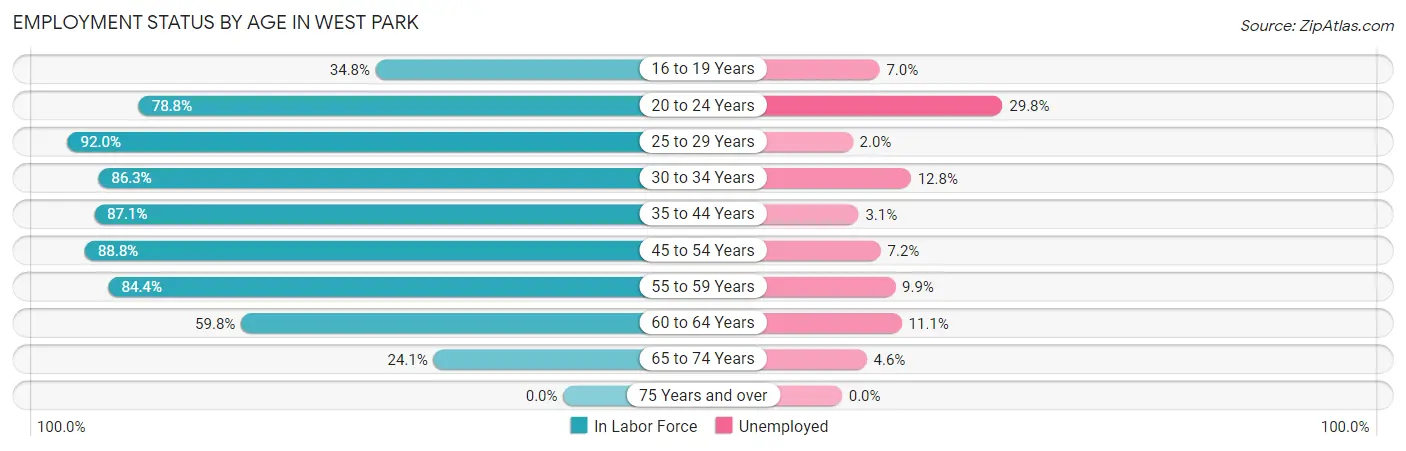
| Age Bracket | In Labor Force | Unemployed |
| 16 to 19 Years | 300 (34.8%) | 21 (7.0%) |
| 20 to 24 Years | 584 (78.8%) | 174 (29.8%) |
| 25 to 29 Years | 1,348 (92.0%) | 27 (2.0%) |
| 30 to 34 Years | 1,338 (86.3%) | 171 (12.8%) |
| 35 to 44 Years | 1,448 (87.1%) | 45 (3.1%) |
| 45 to 54 Years | 1,582 (88.8%) | 114 (7.2%) |
| 55 to 59 Years | 830 (84.4%) | 82 (9.9%) |
| 60 to 64 Years | 550 (59.8%) | 61 (11.1%) |
| 65 to 74 Years | 284 (24.1%) | 13 (4.6%) |
| 75 Years and over | 0 (0.0%) | 0 (0.0%) |
| Total | 8,264 (68.2%) | 711 (8.6%) |
Employment Status by Educational Attainment in West Park
According to labor force statistics for West Park, 84.8% of individuals (7,090) out of the total population between 25 and 64 years of age (8,361) are in the labor force, with 7.1% or 503 of them being unemployed. The group with the highest labor force participation rate are those with the educational attainment of bachelor's degree or higher, with 88.4% or 1,330 individuals in the labor force. Within the labor force, individuals with less than high school education have the highest percentage of unemployment, with 12.4% or 114 of them being unemployed.
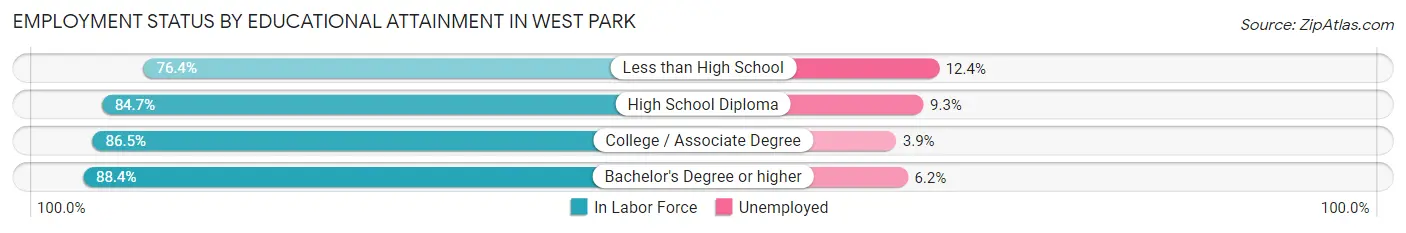
| Educational Attainment | In Labor Force | Unemployed |
| Less than High School | 921 (76.4%) | 150 (12.4%) |
| High School Diploma | 2,121 (84.7%) | 233 (9.3%) |
| College / Associate Degree | 2,722 (86.5%) | 123 (3.9%) |
| Bachelor's Degree or higher | 1,330 (88.4%) | 93 (6.2%) |
| Total | 7,090 (84.8%) | 594 (7.1%) |
Employment Occupations by Sex in West Park
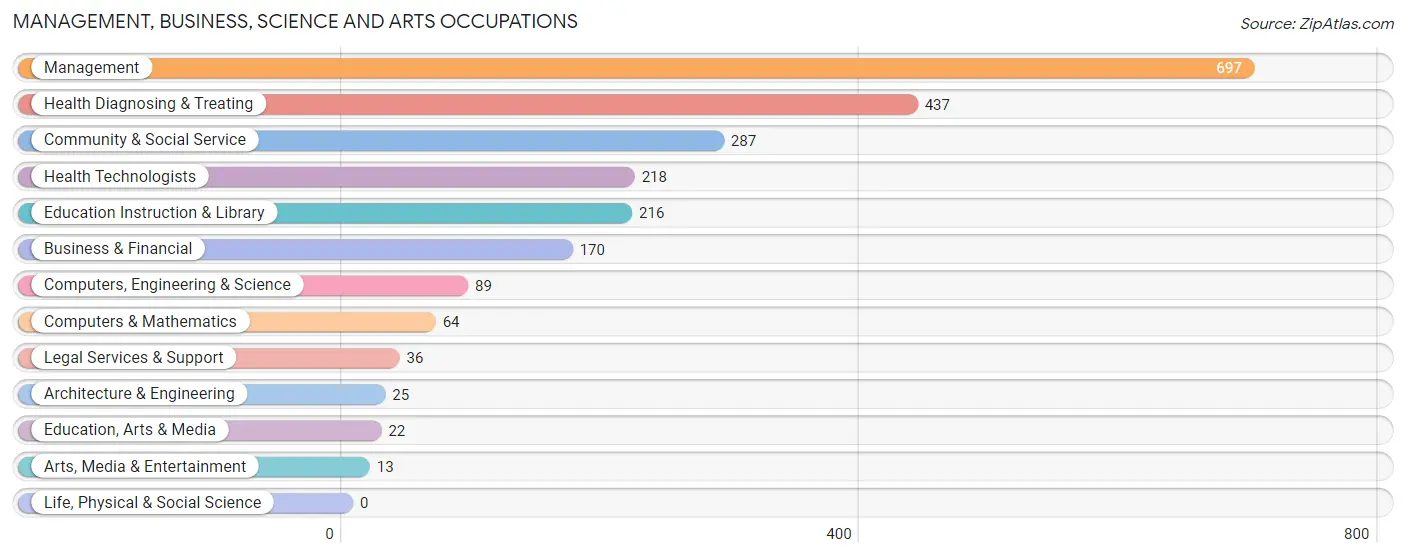
Management, Business, Science and Arts Occupations
The most common Management, Business, Science and Arts occupations in West Park are Management (697 | 9.2%), Health Diagnosing & Treating (437 | 5.8%), Community & Social Service (287 | 3.8%), Health Technologists (218 | 2.9%), and Education Instruction & Library (216 | 2.9%).
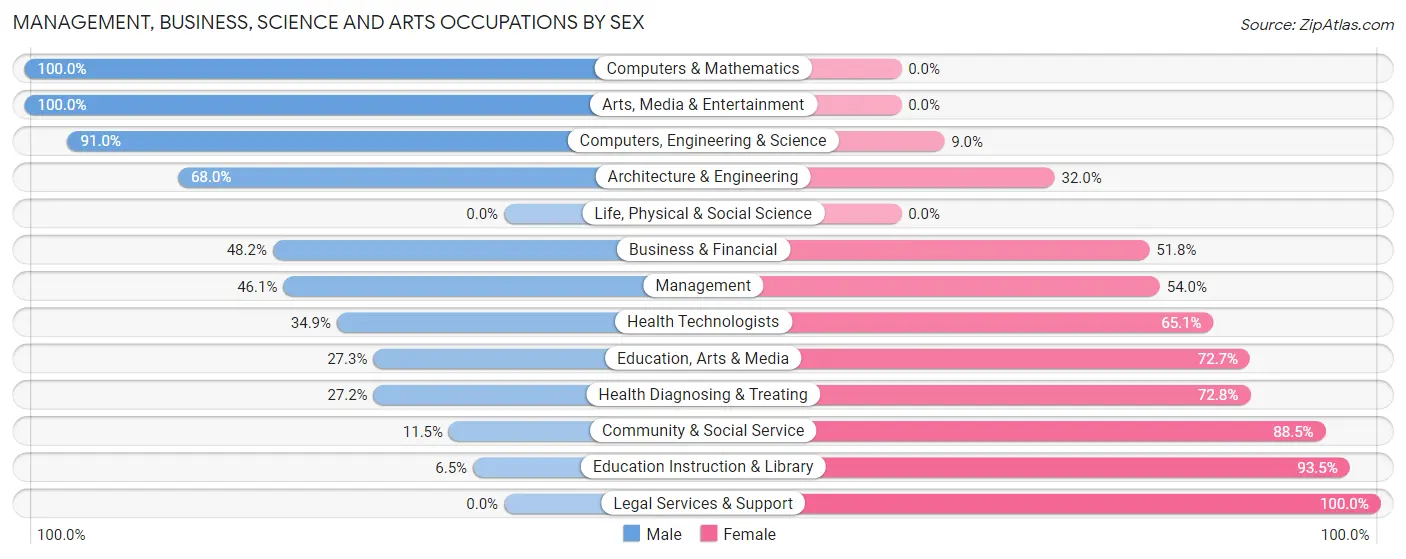
Management, Business, Science and Arts Occupations by Sex
Within the Management, Business, Science and Arts occupations in West Park, the most male-oriented occupations are Computers & Mathematics (100.0%), Arts, Media & Entertainment (100.0%), and Computers, Engineering & Science (91.0%), while the most female-oriented occupations are Legal Services & Support (100.0%), Education Instruction & Library (93.5%), and Community & Social Service (88.5%).
| Occupation | Male | Female |
| Management | 321 (46.1%) | 376 (53.9%) |
| Business & Financial | 82 (48.2%) | 88 (51.8%) |
| Computers, Engineering & Science | 81 (91.0%) | 8 (9.0%) |
| Computers & Mathematics | 64 (100.0%) | 0 (0.0%) |
| Architecture & Engineering | 17 (68.0%) | 8 (32.0%) |
| Life, Physical & Social Science | 0 (0.0%) | 0 (0.0%) |
| Community & Social Service | 33 (11.5%) | 254 (88.5%) |
| Education, Arts & Media | 6 (27.3%) | 16 (72.7%) |
| Legal Services & Support | 0 (0.0%) | 36 (100.0%) |
| Education Instruction & Library | 14 (6.5%) | 202 (93.5%) |
| Arts, Media & Entertainment | 13 (100.0%) | 0 (0.0%) |
| Health Diagnosing & Treating | 119 (27.2%) | 318 (72.8%) |
| Health Technologists | 76 (34.9%) | 142 (65.1%) |
| Total (Category) | 636 (37.9%) | 1,044 (62.1%) |
| Total (Overall) | 4,026 (53.4%) | 3,512 (46.6%) |
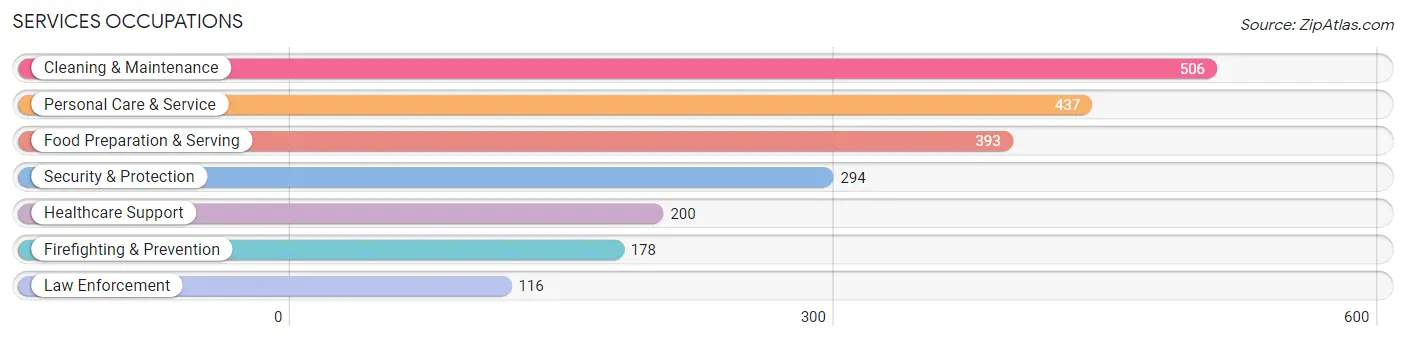
Services Occupations
The most common Services occupations in West Park are Cleaning & Maintenance (506 | 6.7%), Personal Care & Service (437 | 5.8%), Food Preparation & Serving (393 | 5.2%), Security & Protection (294 | 3.9%), and Healthcare Support (200 | 2.6%).
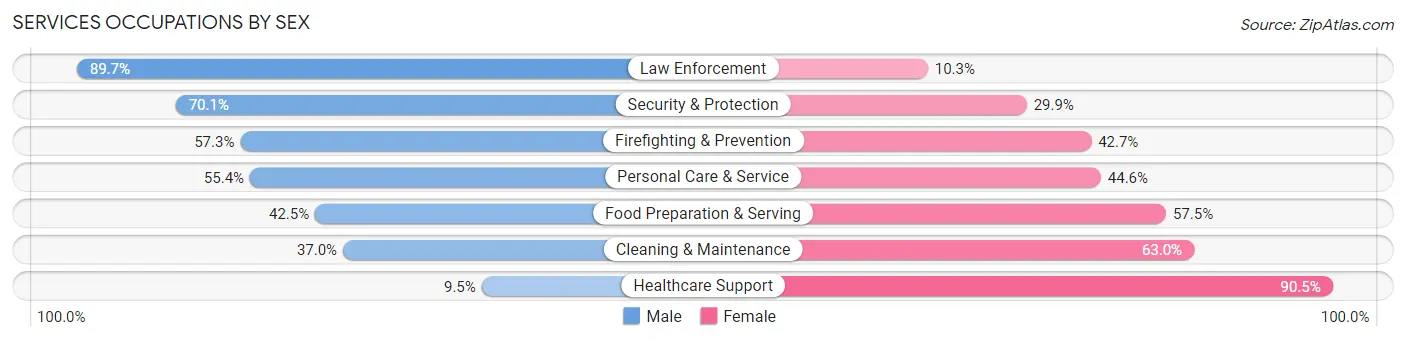
Services Occupations by Sex
Within the Services occupations in West Park, the most male-oriented occupations are Law Enforcement (89.7%), Security & Protection (70.1%), and Firefighting & Prevention (57.3%), while the most female-oriented occupations are Healthcare Support (90.5%), Cleaning & Maintenance (63.0%), and Food Preparation & Serving (57.5%).
| Occupation | Male | Female |
| Healthcare Support | 19 (9.5%) | 181 (90.5%) |
| Security & Protection | 206 (70.1%) | 88 (29.9%) |
| Firefighting & Prevention | 102 (57.3%) | 76 (42.7%) |
| Law Enforcement | 104 (89.7%) | 12 (10.3%) |
| Food Preparation & Serving | 167 (42.5%) | 226 (57.5%) |
| Cleaning & Maintenance | 187 (37.0%) | 319 (63.0%) |
| Personal Care & Service | 242 (55.4%) | 195 (44.6%) |
| Total (Category) | 821 (44.9%) | 1,009 (55.1%) |
| Total (Overall) | 4,026 (53.4%) | 3,512 (46.6%) |
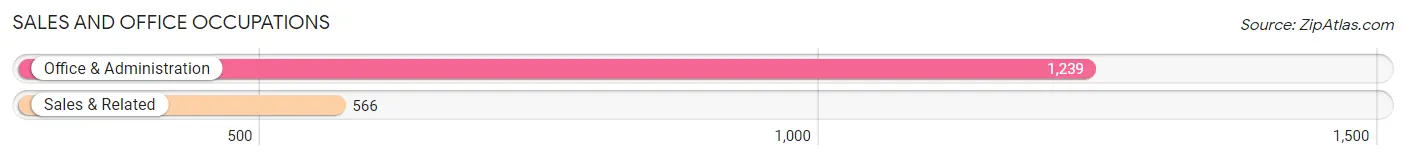
Sales and Office Occupations
The most common Sales and Office occupations in West Park are Office & Administration (1,239 | 16.4%), and Sales & Related (566 | 7.5%).
Sales and Office Occupations by Sex
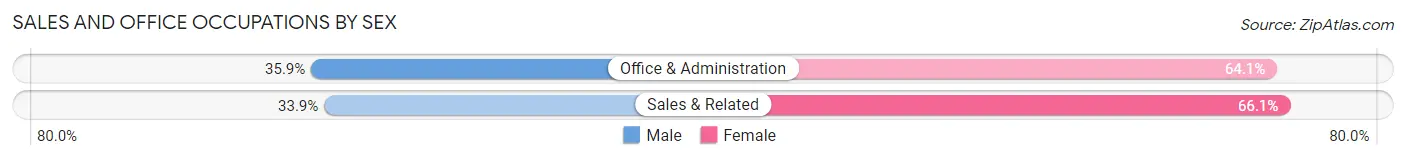
| Occupation | Male | Female |
| Sales & Related | 192 (33.9%) | 374 (66.1%) |
| Office & Administration | 445 (35.9%) | 794 (64.1%) |
| Total (Category) | 637 (35.3%) | 1,168 (64.7%) |
| Total (Overall) | 4,026 (53.4%) | 3,512 (46.6%) |
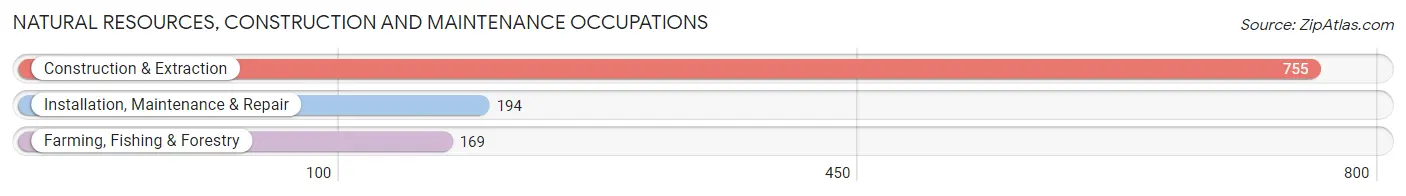
Natural Resources, Construction and Maintenance Occupations
The most common Natural Resources, Construction and Maintenance occupations in West Park are Construction & Extraction (755 | 10.0%), Installation, Maintenance & Repair (194 | 2.6%), and Farming, Fishing & Forestry (169 | 2.2%).
Natural Resources, Construction and Maintenance Occupations by Sex
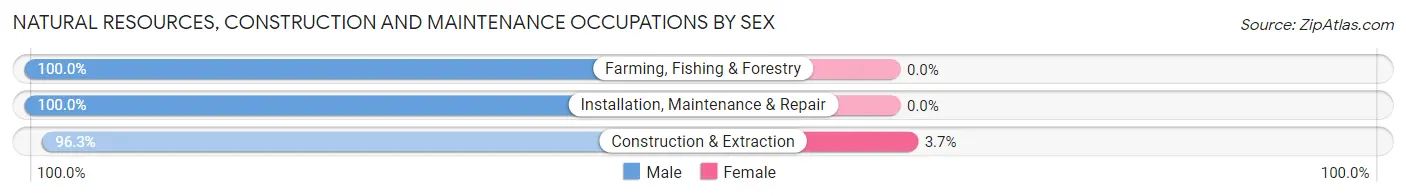
| Occupation | Male | Female |
| Farming, Fishing & Forestry | 169 (100.0%) | 0 (0.0%) |
| Construction & Extraction | 727 (96.3%) | 28 (3.7%) |
| Installation, Maintenance & Repair | 194 (100.0%) | 0 (0.0%) |
| Total (Category) | 1,090 (97.5%) | 28 (2.5%) |
| Total (Overall) | 4,026 (53.4%) | 3,512 (46.6%) |
Production, Transportation and Moving Occupations
The most common Production, Transportation and Moving occupations in West Park are Material Moving (428 | 5.7%), Transportation (383 | 5.1%), and Production (294 | 3.9%).
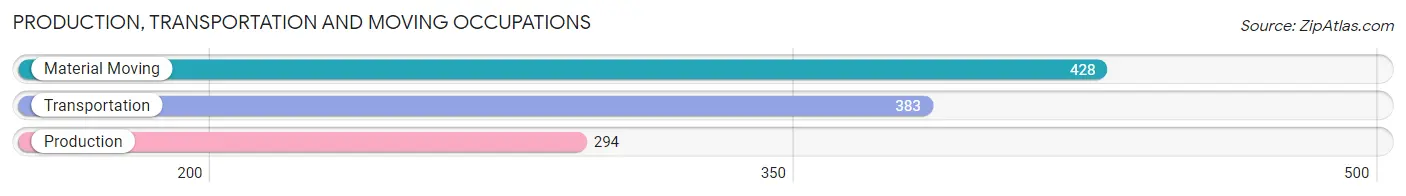
Production, Transportation and Moving Occupations by Sex
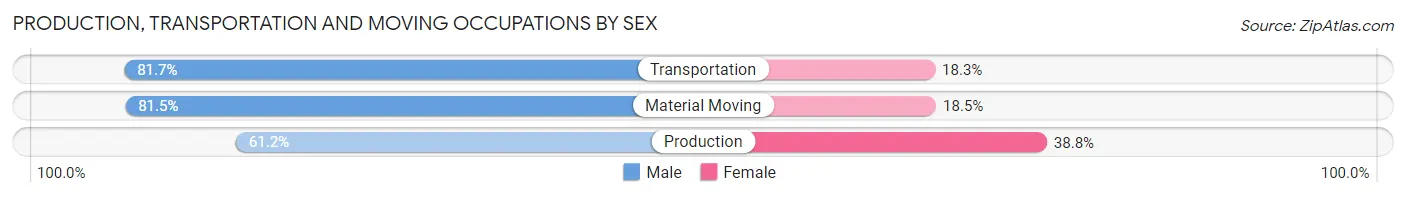
| Occupation | Male | Female |
| Production | 180 (61.2%) | 114 (38.8%) |
| Transportation | 313 (81.7%) | 70 (18.3%) |
| Material Moving | 349 (81.5%) | 79 (18.5%) |
| Total (Category) | 842 (76.2%) | 263 (23.8%) |
| Total (Overall) | 4,026 (53.4%) | 3,512 (46.6%) |
Employment Industries by Sex in West Park
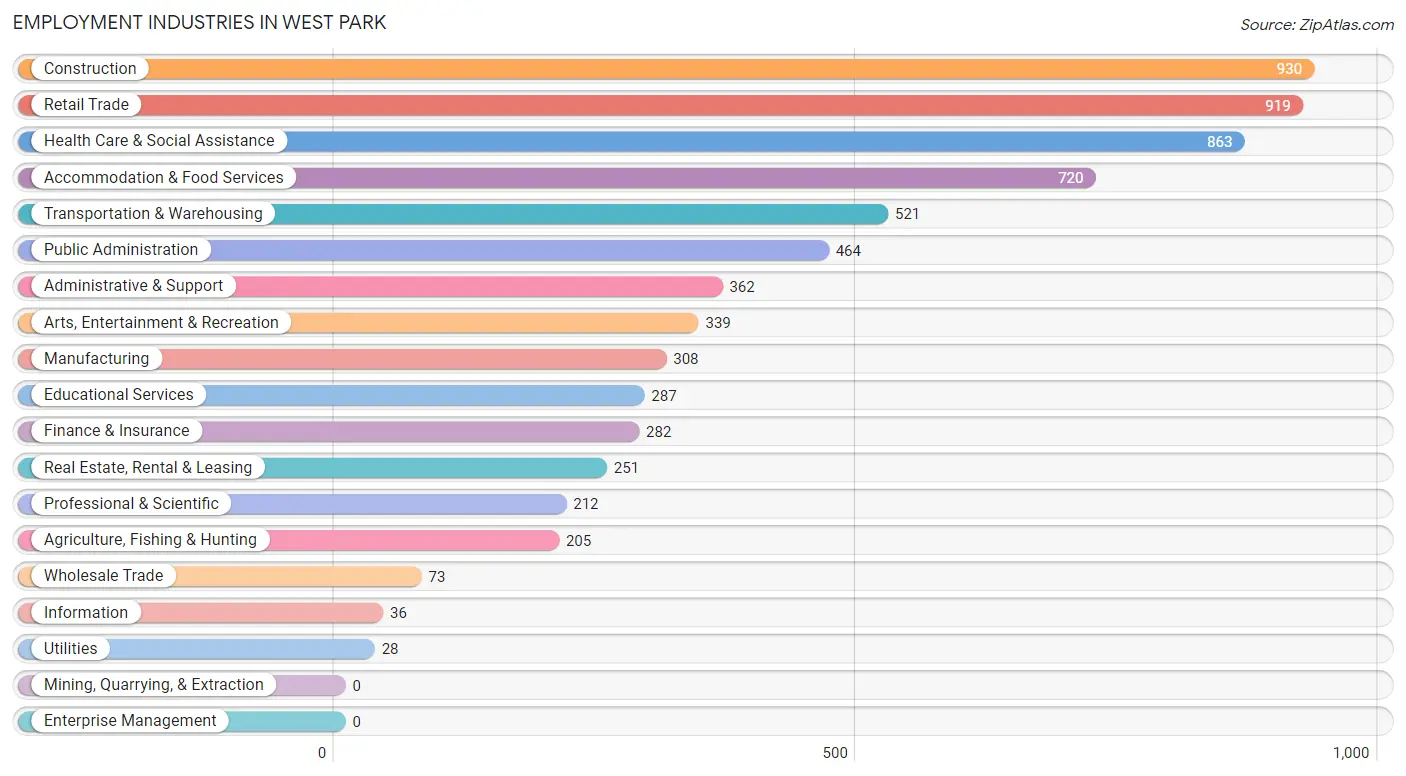
Employment Industries in West Park
The major employment industries in West Park include Construction (930 | 12.3%), Retail Trade (919 | 12.2%), Health Care & Social Assistance (863 | 11.5%), Accommodation & Food Services (720 | 9.6%), and Transportation & Warehousing (521 | 6.9%).
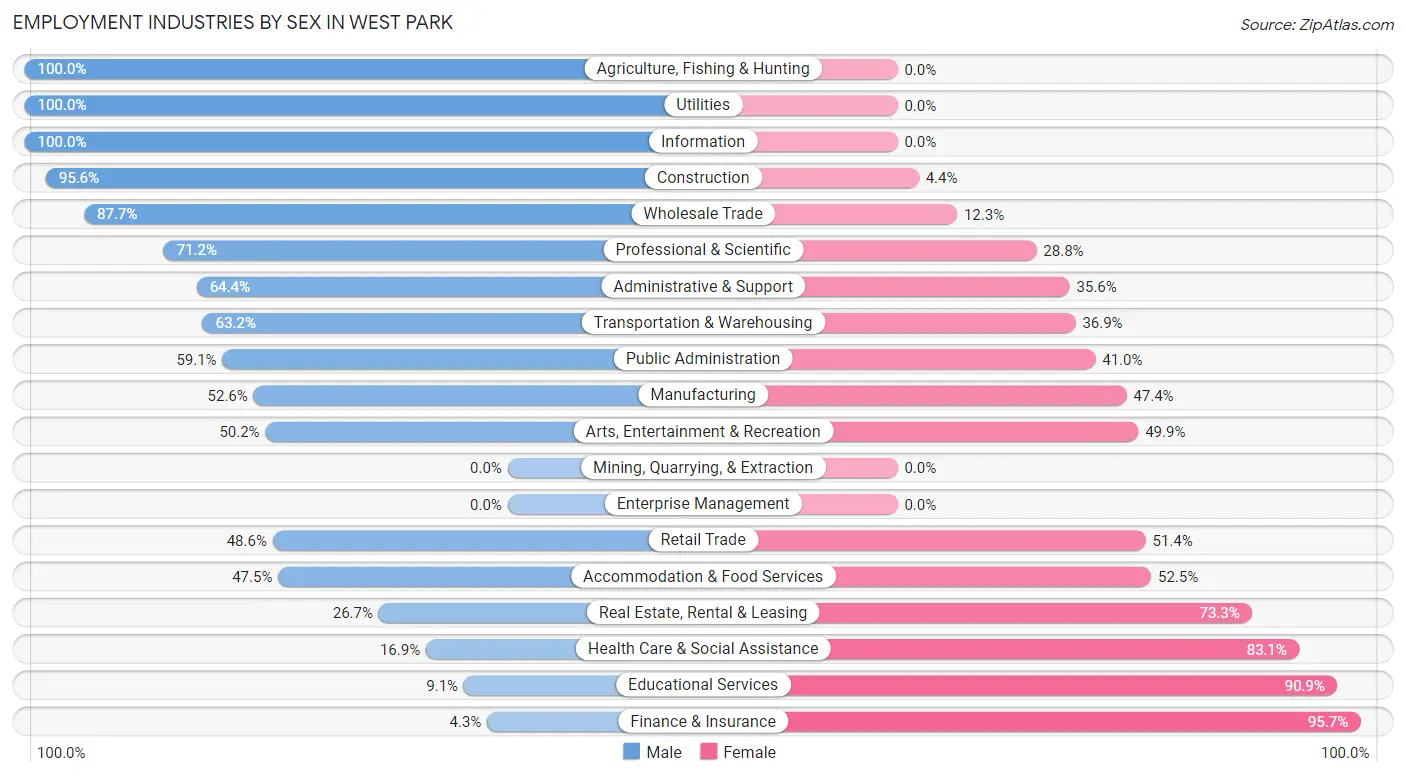
Employment Industries by Sex in West Park
The West Park industries that see more men than women are Agriculture, Fishing & Hunting (100.0%), Utilities (100.0%), and Information (100.0%), whereas the industries that tend to have a higher number of women are Finance & Insurance (95.7%), Educational Services (90.9%), and Health Care & Social Assistance (83.1%).
| Industry | Male | Female |
| Agriculture, Fishing & Hunting | 205 (100.0%) | 0 (0.0%) |
| Mining, Quarrying, & Extraction | 0 (0.0%) | 0 (0.0%) |
| Construction | 889 (95.6%) | 41 (4.4%) |
| Manufacturing | 162 (52.6%) | 146 (47.4%) |
| Wholesale Trade | 64 (87.7%) | 9 (12.3%) |
| Retail Trade | 447 (48.6%) | 472 (51.4%) |
| Transportation & Warehousing | 329 (63.1%) | 192 (36.8%) |
| Utilities | 28 (100.0%) | 0 (0.0%) |
| Information | 36 (100.0%) | 0 (0.0%) |
| Finance & Insurance | 12 (4.3%) | 270 (95.7%) |
| Real Estate, Rental & Leasing | 67 (26.7%) | 184 (73.3%) |
| Professional & Scientific | 151 (71.2%) | 61 (28.8%) |
| Enterprise Management | 0 (0.0%) | 0 (0.0%) |
| Administrative & Support | 233 (64.4%) | 129 (35.6%) |
| Educational Services | 26 (9.1%) | 261 (90.9%) |
| Health Care & Social Assistance | 146 (16.9%) | 717 (83.1%) |
| Arts, Entertainment & Recreation | 170 (50.1%) | 169 (49.8%) |
| Accommodation & Food Services | 342 (47.5%) | 378 (52.5%) |
| Public Administration | 274 (59.1%) | 190 (40.9%) |
| Total | 4,026 (53.4%) | 3,512 (46.6%) |
Education in West Park
School Enrollment in West Park
The most common levels of schooling among the 3,916 students in West Park are college / undergraduate (865 | 22.1%), middle school (784 | 20.0%), and elementary school (756 | 19.3%).
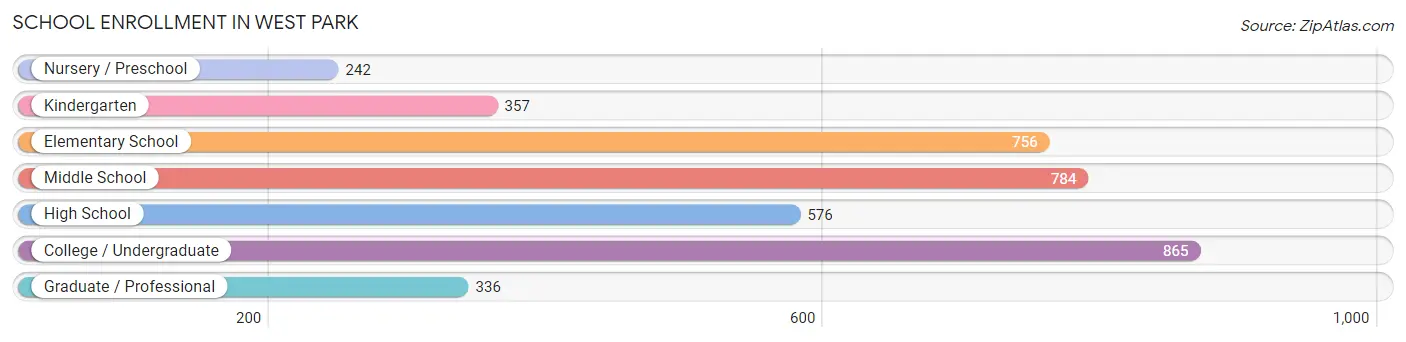
| School Level | # Students | % Students |
| Nursery / Preschool | 242 | 6.2% |
| Kindergarten | 357 | 9.1% |
| Elementary School | 756 | 19.3% |
| Middle School | 784 | 20.0% |
| High School | 576 | 14.7% |
| College / Undergraduate | 865 | 22.1% |
| Graduate / Professional | 336 | 8.6% |
| Total | 3,916 | 100.0% |
School Enrollment by Age by Funding Source in West Park
Out of a total of 3,916 students who are enrolled in schools in West Park, 916 (23.4%) attend a private institution, while the remaining 3,000 (76.6%) are enrolled in public schools. The age group of 3 to 4 year olds has the highest likelihood of being enrolled in private schools, with 140 (59.8% in the age bracket) enrolled. Conversely, the age group of 5 to 9 year old has the lowest likelihood of being enrolled in a private school, with 810 (97.8% in the age bracket) attending a public institution.
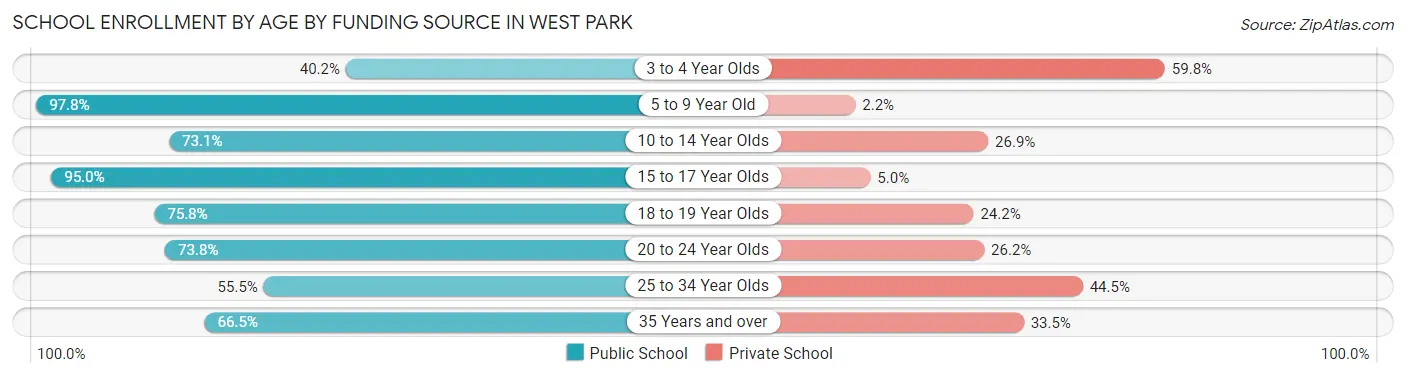
| Age Bracket | Public School | Private School |
| 3 to 4 Year Olds | 94 (40.2%) | 140 (59.8%) |
| 5 to 9 Year Old | 810 (97.8%) | 18 (2.2%) |
| 10 to 14 Year Olds | 812 (73.1%) | 299 (26.9%) |
| 15 to 17 Year Olds | 458 (95.0%) | 24 (5.0%) |
| 18 to 19 Year Olds | 254 (75.8%) | 81 (24.2%) |
| 20 to 24 Year Olds | 158 (73.8%) | 56 (26.2%) |
| 25 to 34 Year Olds | 299 (55.5%) | 240 (44.5%) |
| 35 Years and over | 115 (66.5%) | 58 (33.5%) |
| Total | 3,000 (76.6%) | 916 (23.4%) |
Educational Attainment by Field of Study in West Park
Engineering (275 | 15.9%), business (262 | 15.2%), arts & humanities (170 | 9.9%), literature & languages (145 | 8.4%), and liberal arts & history (134 | 7.8%) are the most common fields of study among 1,725 individuals in West Park who have obtained a bachelor's degree or higher.
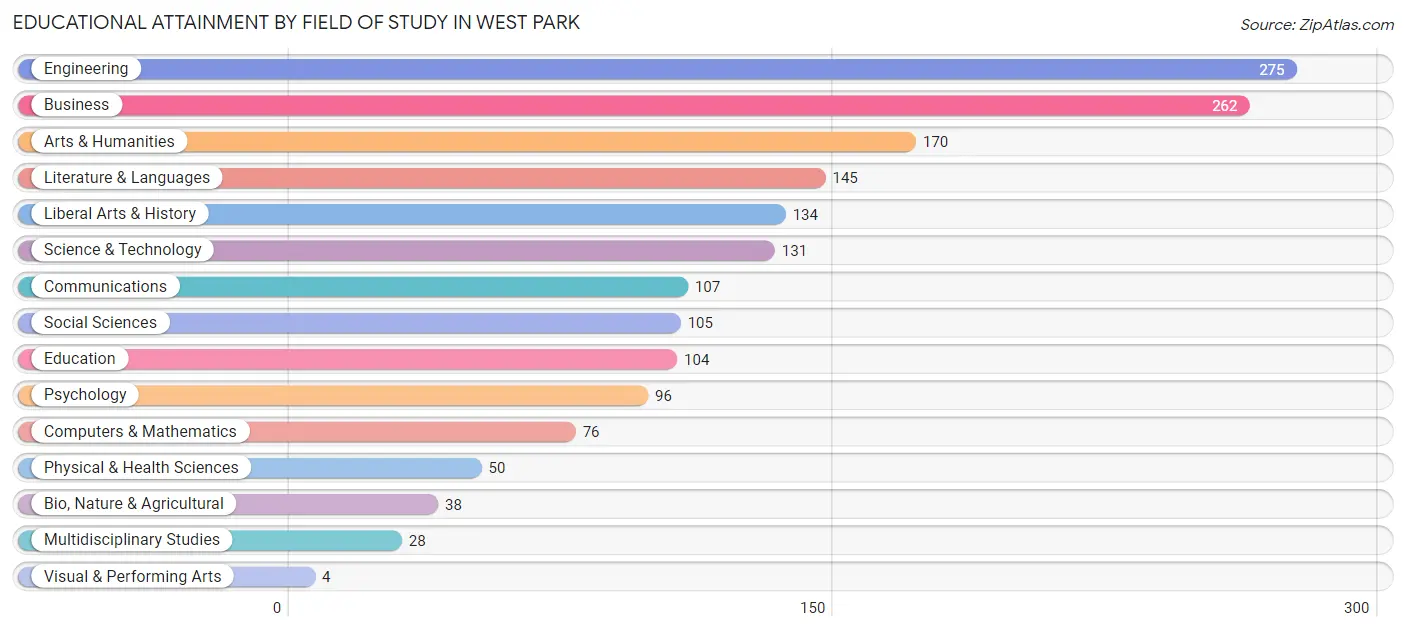
| Field of Study | # Graduates | % Graduates |
| Computers & Mathematics | 76 | 4.4% |
| Bio, Nature & Agricultural | 38 | 2.2% |
| Physical & Health Sciences | 50 | 2.9% |
| Psychology | 96 | 5.6% |
| Social Sciences | 105 | 6.1% |
| Engineering | 275 | 15.9% |
| Multidisciplinary Studies | 28 | 1.6% |
| Science & Technology | 131 | 7.6% |
| Business | 262 | 15.2% |
| Education | 104 | 6.0% |
| Literature & Languages | 145 | 8.4% |
| Liberal Arts & History | 134 | 7.8% |
| Visual & Performing Arts | 4 | 0.2% |
| Communications | 107 | 6.2% |
| Arts & Humanities | 170 | 9.9% |
| Total | 1,725 | 100.0% |
Transportation & Commute in West Park
Vehicle Availability by Sex in West Park
The most prevalent vehicle ownership categories in West Park are males with 2 vehicles (1,480, accounting for 37.8%) and females with 2 vehicles (1,395, making up 43.8%).
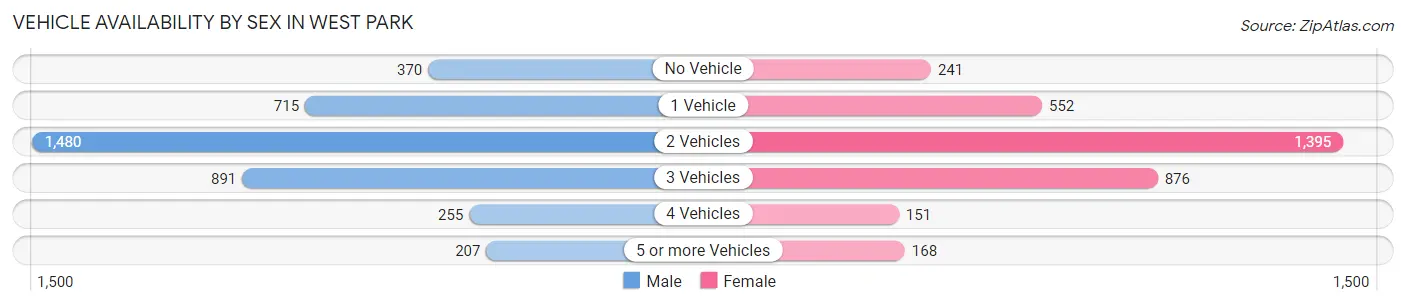
| Vehicles Available | Male | Female |
| No Vehicle | 370 (9.4%) | 241 (7.1%) |
| 1 Vehicle | 715 (18.2%) | 552 (16.3%) |
| 2 Vehicles | 1,480 (37.8%) | 1,395 (41.2%) |
| 3 Vehicles | 891 (22.7%) | 876 (25.9%) |
| 4 Vehicles | 255 (6.5%) | 151 (4.5%) |
| 5 or more Vehicles | 207 (5.3%) | 168 (5.0%) |
| Total | 3,918 (100.0%) | 3,383 (100.0%) |
Commute Time in West Park
The most frequently occuring commute durations in West Park are 30 to 34 minutes (1,438 commuters, 21.2%), 15 to 19 minutes (1,189 commuters, 17.6%), and 20 to 24 minutes (849 commuters, 12.5%).
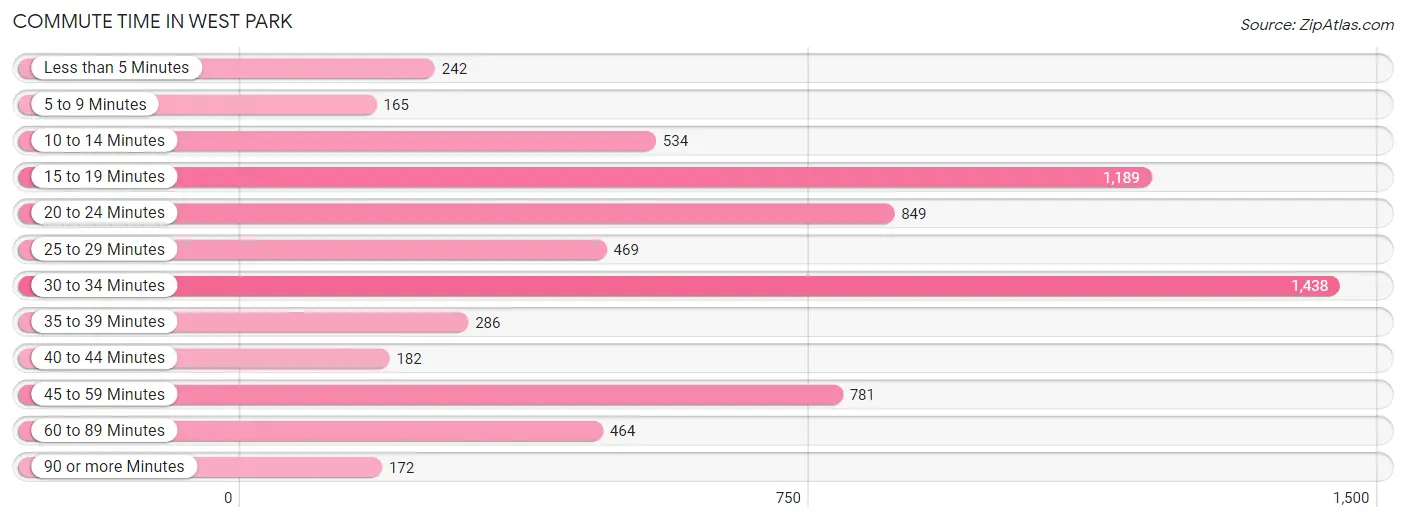
| Commute Time | # Commuters | % Commuters |
| Less than 5 Minutes | 242 | 3.6% |
| 5 to 9 Minutes | 165 | 2.4% |
| 10 to 14 Minutes | 534 | 7.9% |
| 15 to 19 Minutes | 1,189 | 17.6% |
| 20 to 24 Minutes | 849 | 12.5% |
| 25 to 29 Minutes | 469 | 6.9% |
| 30 to 34 Minutes | 1,438 | 21.2% |
| 35 to 39 Minutes | 286 | 4.2% |
| 40 to 44 Minutes | 182 | 2.7% |
| 45 to 59 Minutes | 781 | 11.5% |
| 60 to 89 Minutes | 464 | 6.9% |
| 90 or more Minutes | 172 | 2.5% |
Commute Time by Sex in West Park
The most common commute times in West Park are 30 to 34 minutes (1,033 commuters, 28.9%) for males and 15 to 19 minutes (707 commuters, 22.1%) for females.
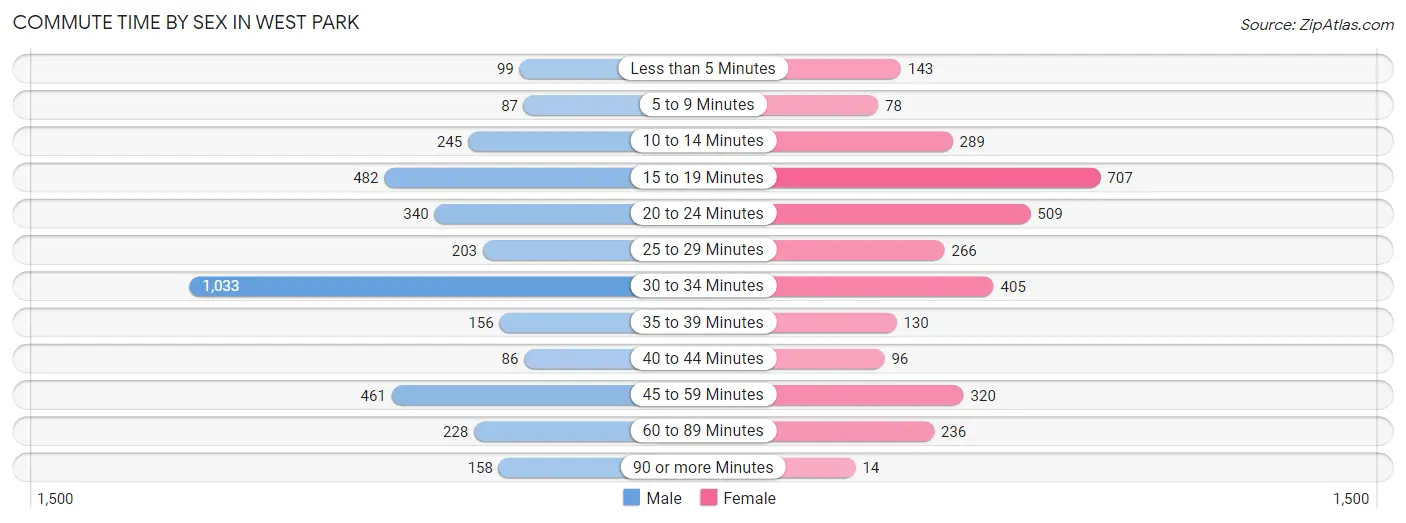
| Commute Time | Male | Female |
| Less than 5 Minutes | 99 (2.8%) | 143 (4.5%) |
| 5 to 9 Minutes | 87 (2.4%) | 78 (2.4%) |
| 10 to 14 Minutes | 245 (6.9%) | 289 (9.0%) |
| 15 to 19 Minutes | 482 (13.5%) | 707 (22.1%) |
| 20 to 24 Minutes | 340 (9.5%) | 509 (15.9%) |
| 25 to 29 Minutes | 203 (5.7%) | 266 (8.3%) |
| 30 to 34 Minutes | 1,033 (28.9%) | 405 (12.7%) |
| 35 to 39 Minutes | 156 (4.4%) | 130 (4.1%) |
| 40 to 44 Minutes | 86 (2.4%) | 96 (3.0%) |
| 45 to 59 Minutes | 461 (12.9%) | 320 (10.0%) |
| 60 to 89 Minutes | 228 (6.4%) | 236 (7.4%) |
| 90 or more Minutes | 158 (4.4%) | 14 (0.4%) |
Time of Departure to Work by Sex in West Park
The most frequent times of departure to work in West Park are 7:00 AM to 7:29 AM (649, 18.1%) for males and 7:00 AM to 7:29 AM (525, 16.4%) for females.
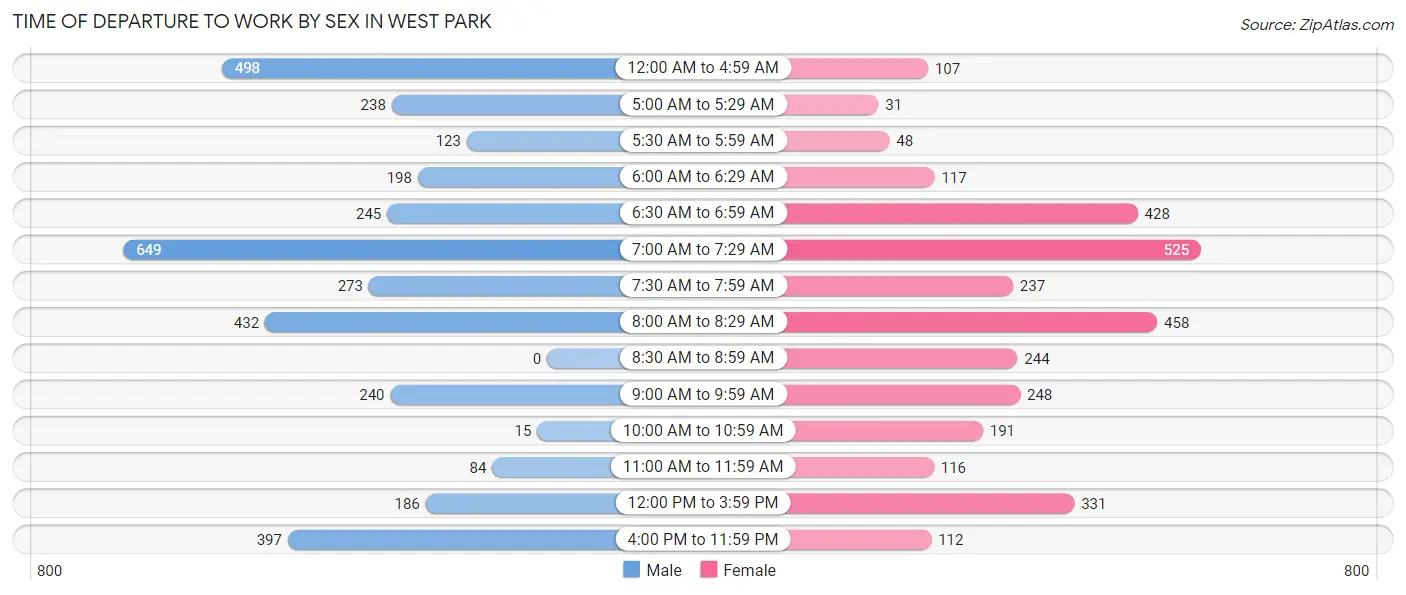
| Time of Departure | Male | Female |
| 12:00 AM to 4:59 AM | 498 (13.9%) | 107 (3.4%) |
| 5:00 AM to 5:29 AM | 238 (6.7%) | 31 (1.0%) |
| 5:30 AM to 5:59 AM | 123 (3.4%) | 48 (1.5%) |
| 6:00 AM to 6:29 AM | 198 (5.5%) | 117 (3.7%) |
| 6:30 AM to 6:59 AM | 245 (6.9%) | 428 (13.4%) |
| 7:00 AM to 7:29 AM | 649 (18.1%) | 525 (16.4%) |
| 7:30 AM to 7:59 AM | 273 (7.6%) | 237 (7.4%) |
| 8:00 AM to 8:29 AM | 432 (12.1%) | 458 (14.3%) |
| 8:30 AM to 8:59 AM | 0 (0.0%) | 244 (7.6%) |
| 9:00 AM to 9:59 AM | 240 (6.7%) | 248 (7.8%) |
| 10:00 AM to 10:59 AM | 15 (0.4%) | 191 (6.0%) |
| 11:00 AM to 11:59 AM | 84 (2.4%) | 116 (3.6%) |
| 12:00 PM to 3:59 PM | 186 (5.2%) | 331 (10.4%) |
| 4:00 PM to 11:59 PM | 397 (11.1%) | 112 (3.5%) |
| Total | 3,578 (100.0%) | 3,193 (100.0%) |
Housing Occupancy in West Park
Occupancy by Ownership in West Park
Of the total 4,628 dwellings in West Park, owner-occupied units account for 2,910 (62.9%), while renter-occupied units make up 1,718 (37.1%).
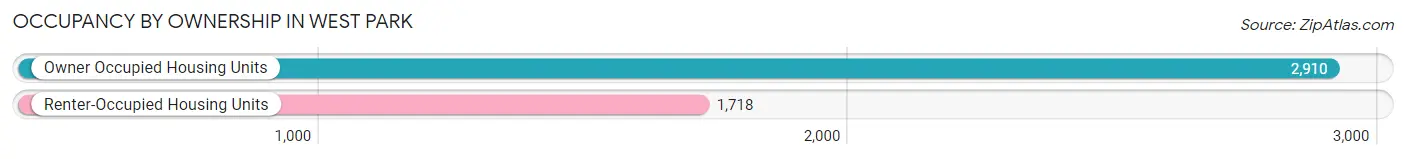
| Occupancy | # Housing Units | % Housing Units |
| Owner Occupied Housing Units | 2,910 | 62.9% |
| Renter-Occupied Housing Units | 1,718 | 37.1% |
| Total Occupied Housing Units | 4,628 | 100.0% |
Occupancy by Household Size in West Park
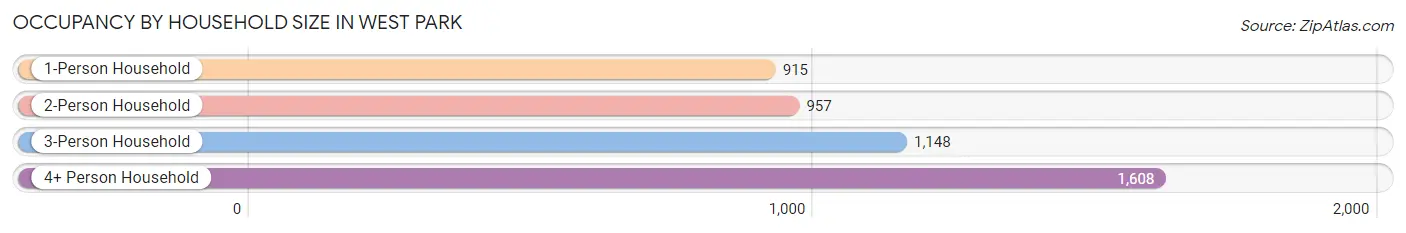
| Household Size | # Housing Units | % Housing Units |
| 1-Person Household | 915 | 19.8% |
| 2-Person Household | 957 | 20.7% |
| 3-Person Household | 1,148 | 24.8% |
| 4+ Person Household | 1,608 | 34.7% |
| Total Housing Units | 4,628 | 100.0% |
Occupancy by Ownership by Household Size in West Park
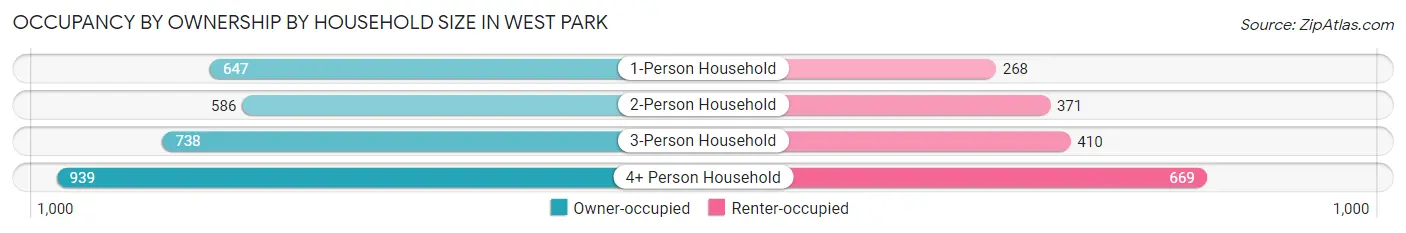
| Household Size | Owner-occupied | Renter-occupied |
| 1-Person Household | 647 (70.7%) | 268 (29.3%) |
| 2-Person Household | 586 (61.2%) | 371 (38.8%) |
| 3-Person Household | 738 (64.3%) | 410 (35.7%) |
| 4+ Person Household | 939 (58.4%) | 669 (41.6%) |
| Total Housing Units | 2,910 (62.9%) | 1,718 (37.1%) |
Occupancy by Educational Attainment in West Park
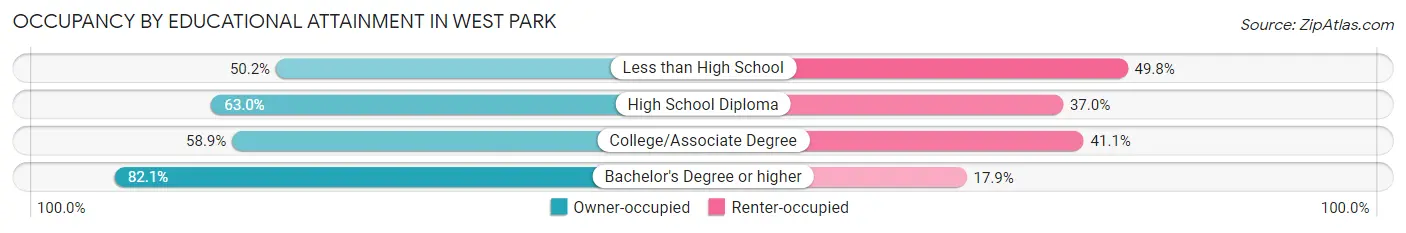
| Household Size | Owner-occupied | Renter-occupied |
| Less than High School | 433 (50.2%) | 430 (49.8%) |
| High School Diploma | 622 (63.0%) | 366 (37.0%) |
| College/Associate Degree | 1,076 (58.9%) | 752 (41.1%) |
| Bachelor's Degree or higher | 779 (82.1%) | 170 (17.9%) |
Occupancy by Age of Householder in West Park
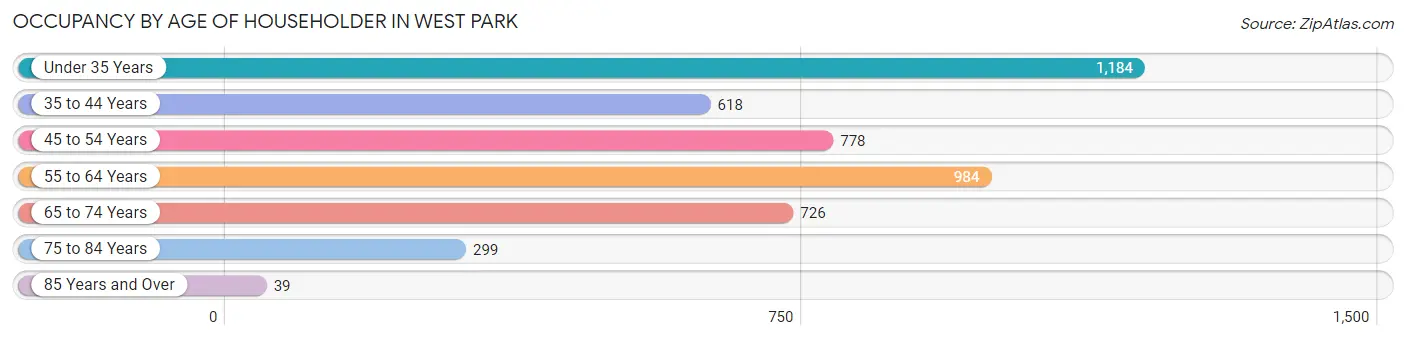
| Age Bracket | # Households | % Households |
| Under 35 Years | 1,184 | 25.6% |
| 35 to 44 Years | 618 | 13.4% |
| 45 to 54 Years | 778 | 16.8% |
| 55 to 64 Years | 984 | 21.3% |
| 65 to 74 Years | 726 | 15.7% |
| 75 to 84 Years | 299 | 6.5% |
| 85 Years and Over | 39 | 0.8% |
| Total | 4,628 | 100.0% |
Housing Finances in West Park
Median Income by Occupancy in West Park
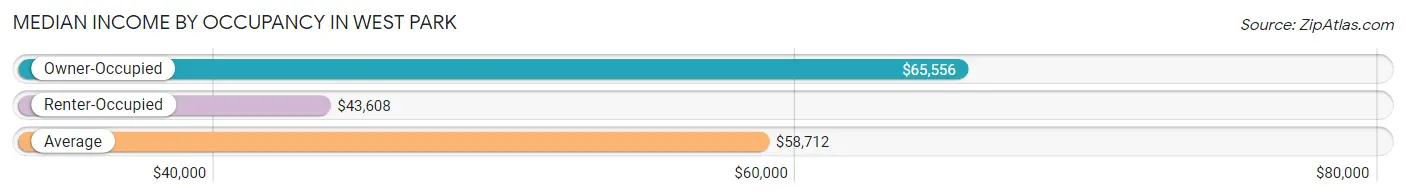
| Occupancy Type | # Households | Median Income |
| Owner-Occupied | 2,910 (62.9%) | $65,556 |
| Renter-Occupied | 1,718 (37.1%) | $43,608 |
| Average | 4,628 (100.0%) | $58,712 |
Occupancy by Householder Income Bracket in West Park
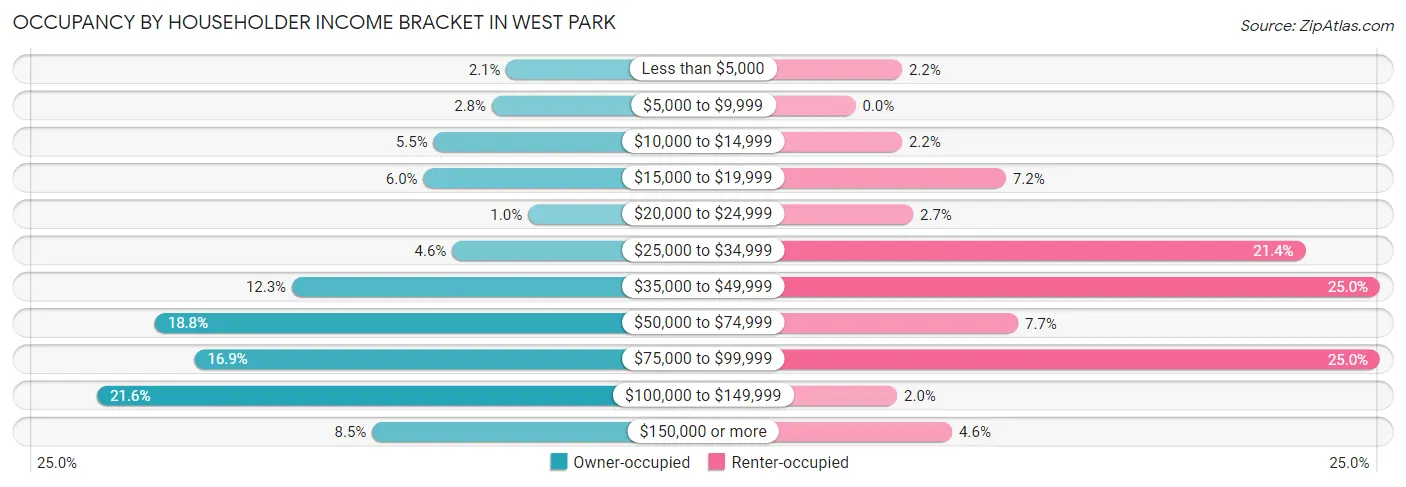
| Income Bracket | Owner-occupied | Renter-occupied |
| Less than $5,000 | 60 (2.1%) | 38 (2.2%) |
| $5,000 to $9,999 | 80 (2.8%) | 0 (0.0%) |
| $10,000 to $14,999 | 161 (5.5%) | 38 (2.2%) |
| $15,000 to $19,999 | 175 (6.0%) | 123 (7.2%) |
| $20,000 to $24,999 | 30 (1.0%) | 47 (2.7%) |
| $25,000 to $34,999 | 135 (4.6%) | 368 (21.4%) |
| $35,000 to $49,999 | 357 (12.3%) | 429 (25.0%) |
| $50,000 to $74,999 | 547 (18.8%) | 133 (7.7%) |
| $75,000 to $99,999 | 492 (16.9%) | 429 (25.0%) |
| $100,000 to $149,999 | 627 (21.5%) | 34 (2.0%) |
| $150,000 or more | 246 (8.5%) | 79 (4.6%) |
| Total | 2,910 (100.0%) | 1,718 (100.0%) |
Monthly Housing Cost Tiers in West Park
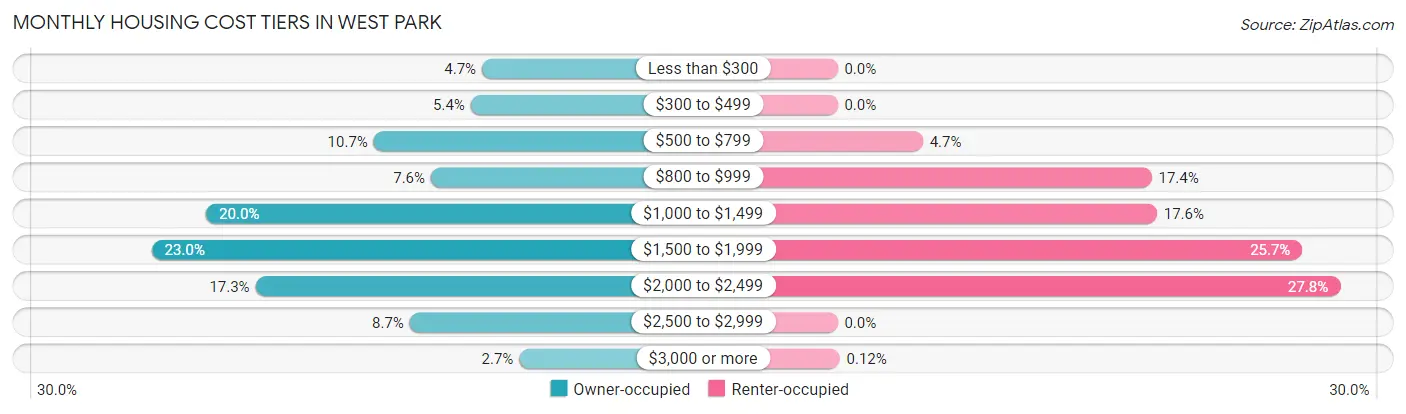
| Monthly Cost | Owner-occupied | Renter-occupied |
| Less than $300 | 138 (4.7%) | 0 (0.0%) |
| $300 to $499 | 156 (5.4%) | 0 (0.0%) |
| $500 to $799 | 312 (10.7%) | 81 (4.7%) |
| $800 to $999 | 220 (7.6%) | 298 (17.3%) |
| $1,000 to $1,499 | 581 (20.0%) | 303 (17.6%) |
| $1,500 to $1,999 | 669 (23.0%) | 441 (25.7%) |
| $2,000 to $2,499 | 502 (17.2%) | 477 (27.8%) |
| $2,500 to $2,999 | 254 (8.7%) | 0 (0.0%) |
| $3,000 or more | 78 (2.7%) | 2 (0.1%) |
| Total | 2,910 (100.0%) | 1,718 (100.0%) |
Physical Housing Characteristics in West Park
Housing Structures in West Park
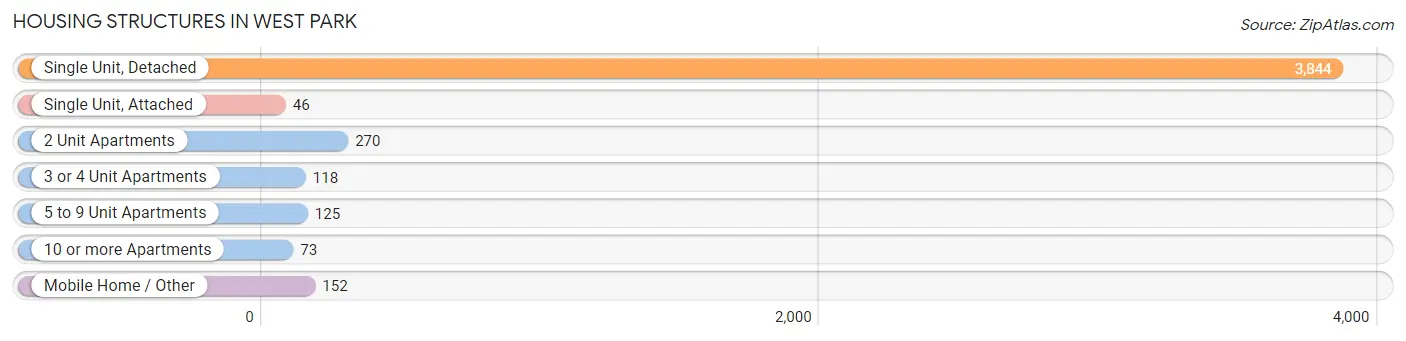
| Structure Type | # Housing Units | % Housing Units |
| Single Unit, Detached | 3,844 | 83.1% |
| Single Unit, Attached | 46 | 1.0% |
| 2 Unit Apartments | 270 | 5.8% |
| 3 or 4 Unit Apartments | 118 | 2.5% |
| 5 to 9 Unit Apartments | 125 | 2.7% |
| 10 or more Apartments | 73 | 1.6% |
| Mobile Home / Other | 152 | 3.3% |
| Total | 4,628 | 100.0% |
Housing Structures by Occupancy in West Park
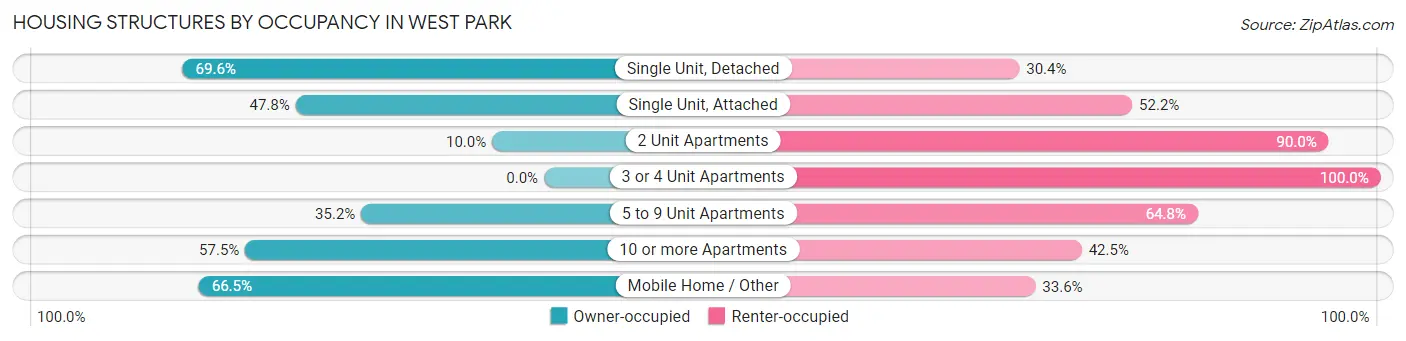
| Structure Type | Owner-occupied | Renter-occupied |
| Single Unit, Detached | 2,674 (69.6%) | 1,170 (30.4%) |
| Single Unit, Attached | 22 (47.8%) | 24 (52.2%) |
| 2 Unit Apartments | 27 (10.0%) | 243 (90.0%) |
| 3 or 4 Unit Apartments | 0 (0.0%) | 118 (100.0%) |
| 5 to 9 Unit Apartments | 44 (35.2%) | 81 (64.8%) |
| 10 or more Apartments | 42 (57.5%) | 31 (42.5%) |
| Mobile Home / Other | 101 (66.4%) | 51 (33.6%) |
| Total | 2,910 (62.9%) | 1,718 (37.1%) |
Housing Structures by Number of Rooms in West Park
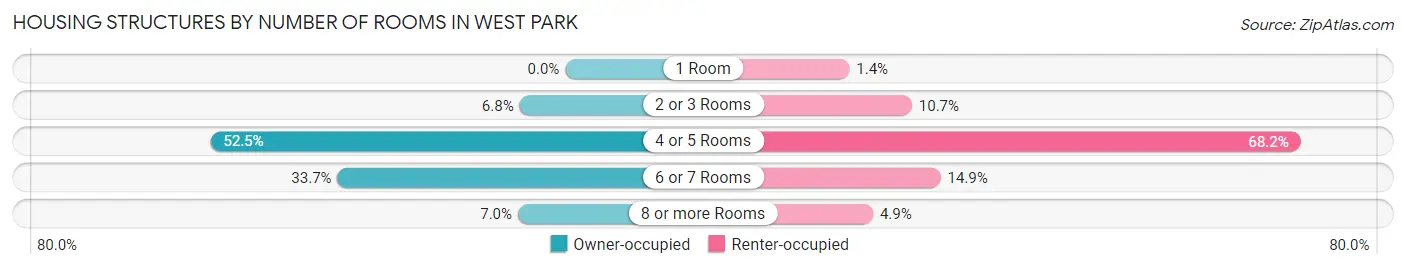
| Number of Rooms | Owner-occupied | Renter-occupied |
| 1 Room | 0 (0.0%) | 24 (1.4%) |
| 2 or 3 Rooms | 197 (6.8%) | 183 (10.6%) |
| 4 or 5 Rooms | 1,528 (52.5%) | 1,171 (68.2%) |
| 6 or 7 Rooms | 981 (33.7%) | 256 (14.9%) |
| 8 or more Rooms | 204 (7.0%) | 84 (4.9%) |
| Total | 2,910 (100.0%) | 1,718 (100.0%) |
Housing Structure by Heating Type in West Park
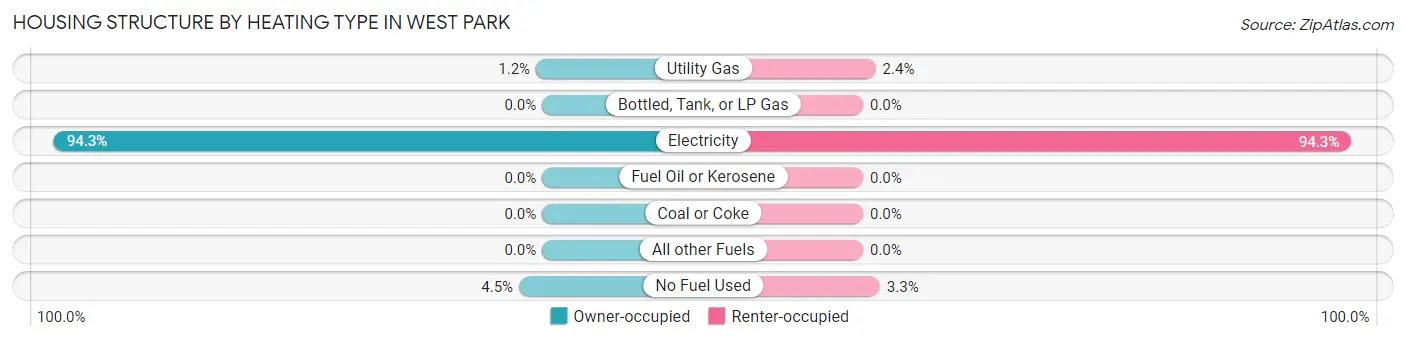
| Heating Type | Owner-occupied | Renter-occupied |
| Utility Gas | 35 (1.2%) | 42 (2.4%) |
| Bottled, Tank, or LP Gas | 0 (0.0%) | 0 (0.0%) |
| Electricity | 2,745 (94.3%) | 1,620 (94.3%) |
| Fuel Oil or Kerosene | 0 (0.0%) | 0 (0.0%) |
| Coal or Coke | 0 (0.0%) | 0 (0.0%) |
| All other Fuels | 0 (0.0%) | 0 (0.0%) |
| No Fuel Used | 130 (4.5%) | 56 (3.3%) |
| Total | 2,910 (100.0%) | 1,718 (100.0%) |
Household Vehicle Usage in West Park
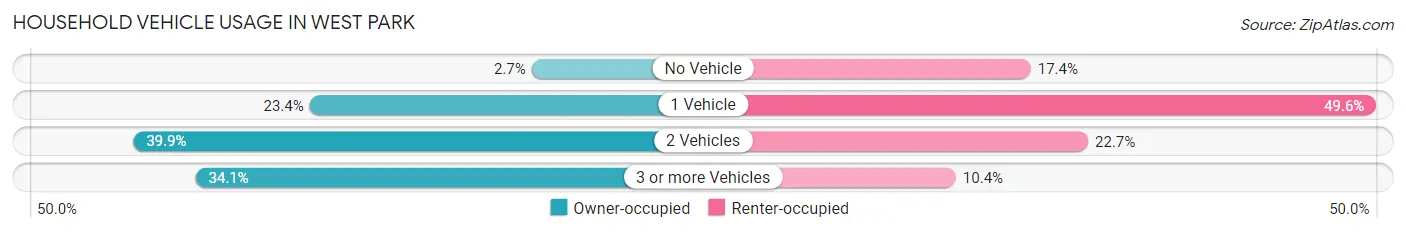
| Vehicles per Household | Owner-occupied | Renter-occupied |
| No Vehicle | 78 (2.7%) | 298 (17.3%) |
| 1 Vehicle | 681 (23.4%) | 852 (49.6%) |
| 2 Vehicles | 1,160 (39.9%) | 390 (22.7%) |
| 3 or more Vehicles | 991 (34.1%) | 178 (10.4%) |
| Total | 2,910 (100.0%) | 1,718 (100.0%) |
Real Estate & Mortgages in West Park
Real Estate and Mortgage Overview in West Park
| Characteristic | Without Mortgage | With Mortgage |
| Housing Units | 787 | 2,123 |
| Median Property Value | $292,900 | $310,400 |
| Median Household Income | $50,225 | $211 |
| Monthly Housing Costs | $612 | $51 |
| Real Estate Taxes | $2,349 | $78 |
Property Value by Mortgage Status in West Park
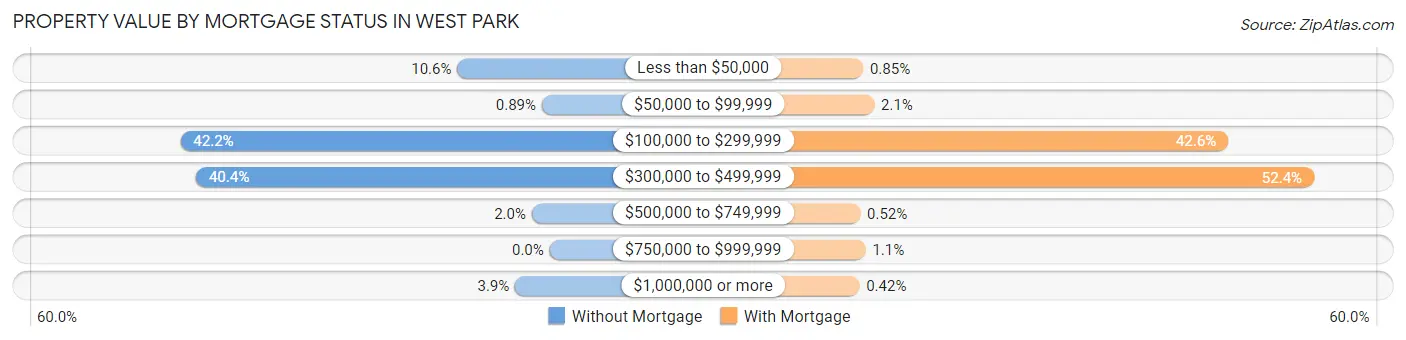
| Property Value | Without Mortgage | With Mortgage |
| Less than $50,000 | 83 (10.5%) | 18 (0.9%) |
| $50,000 to $99,999 | 7 (0.9%) | 45 (2.1%) |
| $100,000 to $299,999 | 332 (42.2%) | 904 (42.6%) |
| $300,000 to $499,999 | 318 (40.4%) | 1,112 (52.4%) |
| $500,000 to $749,999 | 16 (2.0%) | 11 (0.5%) |
| $750,000 to $999,999 | 0 (0.0%) | 24 (1.1%) |
| $1,000,000 or more | 31 (3.9%) | 9 (0.4%) |
| Total | 787 (100.0%) | 2,123 (100.0%) |
Household Income by Mortgage Status in West Park
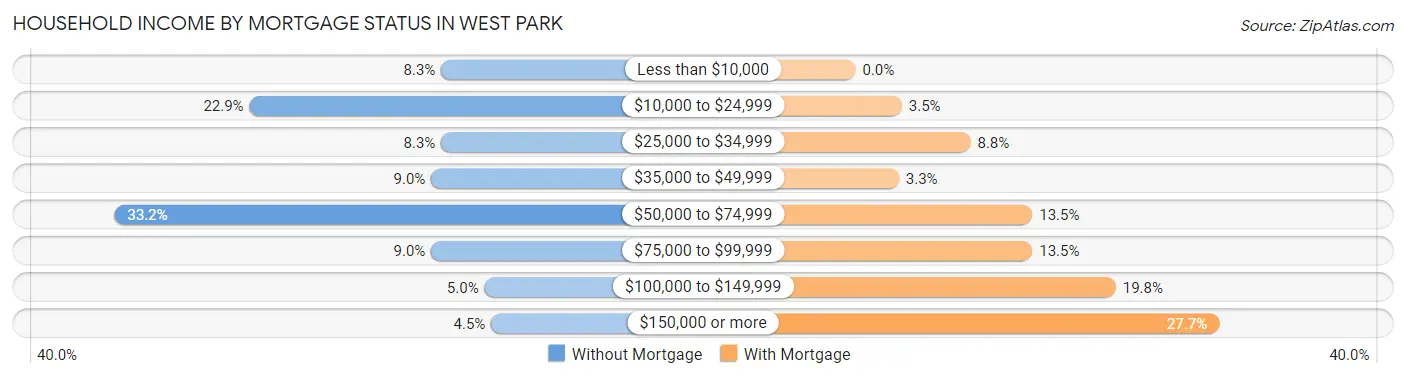
| Household Income | Without Mortgage | With Mortgage |
| Less than $10,000 | 65 (8.3%) | 0 (0.0%) |
| $10,000 to $24,999 | 180 (22.9%) | 75 (3.5%) |
| $25,000 to $34,999 | 65 (8.3%) | 186 (8.8%) |
| $35,000 to $49,999 | 71 (9.0%) | 70 (3.3%) |
| $50,000 to $74,999 | 261 (33.2%) | 286 (13.5%) |
| $75,000 to $99,999 | 71 (9.0%) | 286 (13.5%) |
| $100,000 to $149,999 | 39 (5.0%) | 421 (19.8%) |
| $150,000 or more | 35 (4.4%) | 588 (27.7%) |
| Total | 787 (100.0%) | 2,123 (100.0%) |
Property Value to Household Income Ratio in West Park
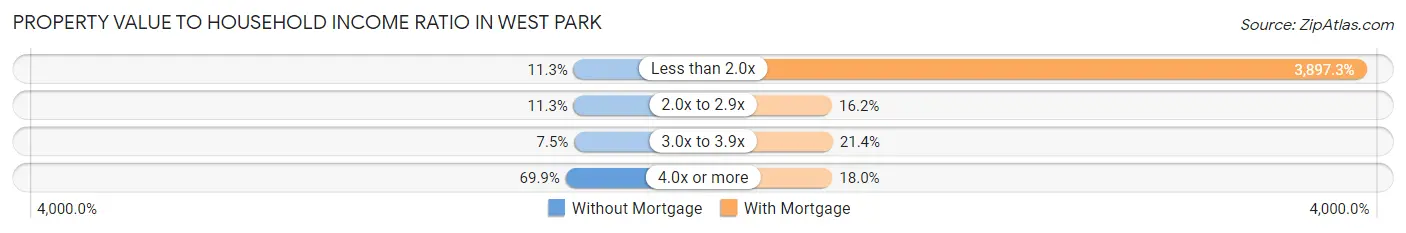
| Value-to-Income Ratio | Without Mortgage | With Mortgage |
| Less than 2.0x | 89 (11.3%) | 82,739 (3,897.3%) |
| 2.0x to 2.9x | 89 (11.3%) | 344 (16.2%) |
| 3.0x to 3.9x | 59 (7.5%) | 455 (21.4%) |
| 4.0x or more | 550 (69.9%) | 382 (18.0%) |
| Total | 787 (100.0%) | 2,123 (100.0%) |
Real Estate Taxes by Mortgage Status in West Park
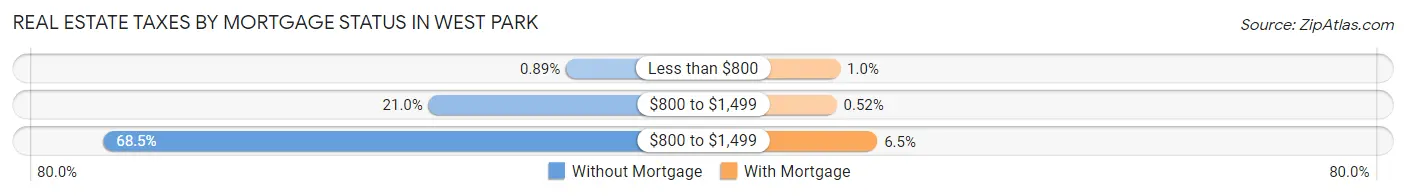
| Property Taxes | Without Mortgage | With Mortgage |
| Less than $800 | 7 (0.9%) | 22 (1.0%) |
| $800 to $1,499 | 165 (21.0%) | 11 (0.5%) |
| $800 to $1,499 | 539 (68.5%) | 137 (6.5%) |
| Total | 787 (100.0%) | 2,123 (100.0%) |
Health & Disability in West Park
Health Insurance Coverage by Age in West Park
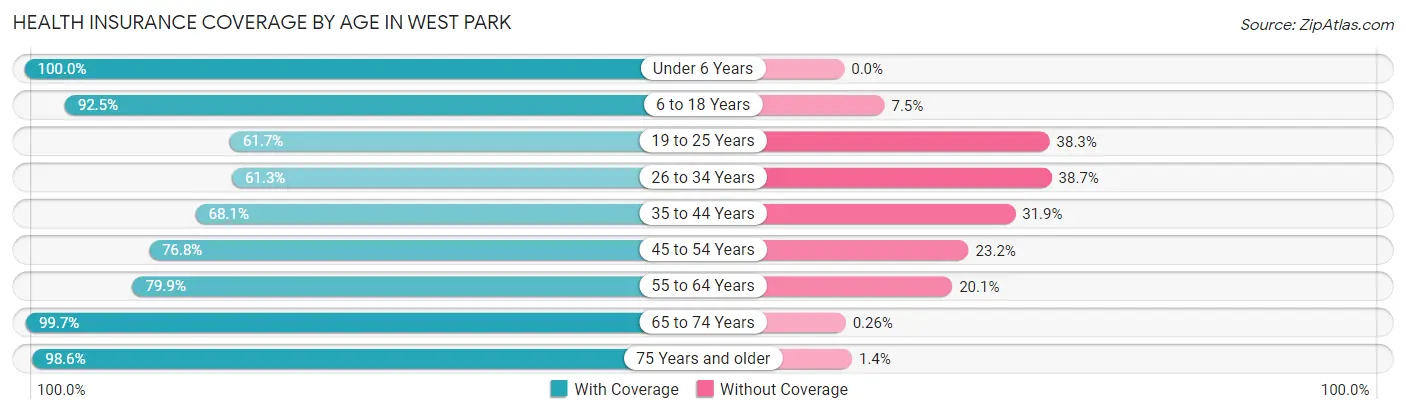
| Age Bracket | With Coverage | Without Coverage |
| Under 6 Years | 966 (100.0%) | 0 (0.0%) |
| 6 to 18 Years | 2,378 (92.5%) | 193 (7.5%) |
| 19 to 25 Years | 825 (61.7%) | 512 (38.3%) |
| 26 to 34 Years | 1,646 (61.3%) | 1,038 (38.7%) |
| 35 to 44 Years | 1,132 (68.1%) | 530 (31.9%) |
| 45 to 54 Years | 1,368 (76.8%) | 413 (23.2%) |
| 55 to 64 Years | 1,520 (79.9%) | 383 (20.1%) |
| 65 to 74 Years | 1,132 (99.7%) | 3 (0.3%) |
| 75 Years and older | 961 (98.6%) | 14 (1.4%) |
| Total | 11,928 (79.4%) | 3,086 (20.5%) |
Health Insurance Coverage by Citizenship Status in West Park
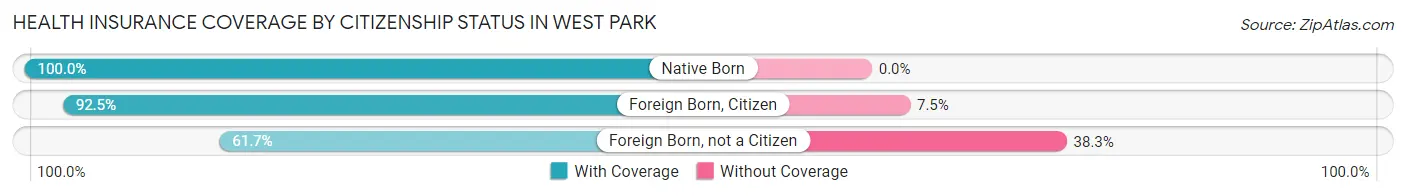
| Citizenship Status | With Coverage | Without Coverage |
| Native Born | 966 (100.0%) | 0 (0.0%) |
| Foreign Born, Citizen | 2,378 (92.5%) | 193 (7.5%) |
| Foreign Born, not a Citizen | 825 (61.7%) | 512 (38.3%) |
Health Insurance Coverage by Household Income in West Park
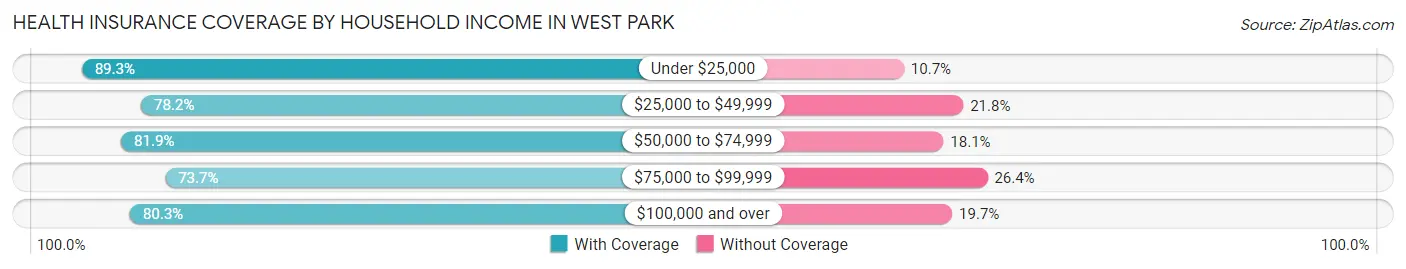
| Household Income | With Coverage | Without Coverage |
| Under $25,000 | 1,319 (89.3%) | 158 (10.7%) |
| $25,000 to $49,999 | 2,705 (78.2%) | 755 (21.8%) |
| $50,000 to $74,999 | 2,316 (81.9%) | 512 (18.1%) |
| $75,000 to $99,999 | 2,563 (73.7%) | 917 (26.4%) |
| $100,000 and over | 2,981 (80.3%) | 733 (19.7%) |
Public vs Private Health Insurance Coverage by Age in West Park
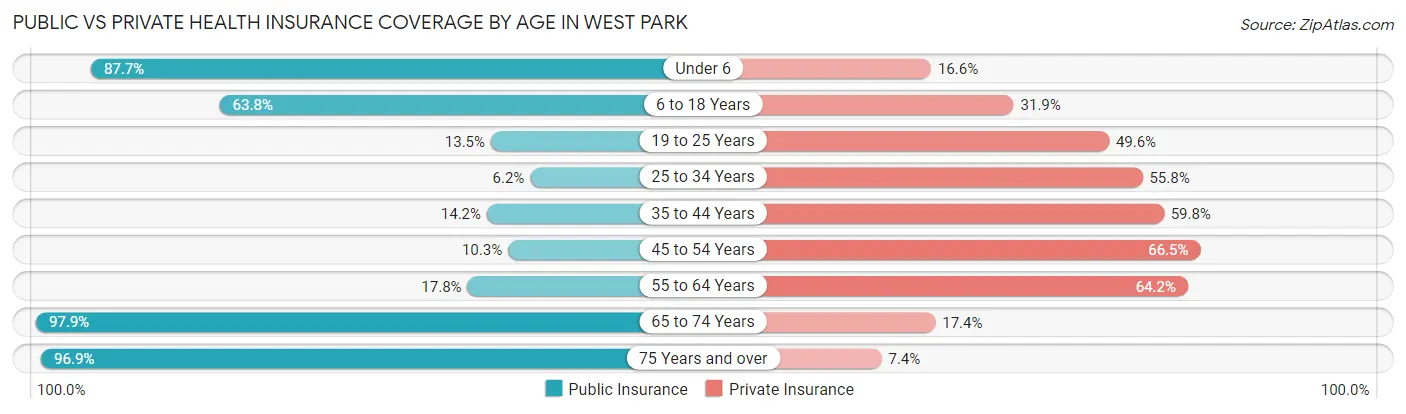
| Age Bracket | Public Insurance | Private Insurance |
| Under 6 | 847 (87.7%) | 160 (16.6%) |
| 6 to 18 Years | 1,640 (63.8%) | 820 (31.9%) |
| 19 to 25 Years | 180 (13.5%) | 663 (49.6%) |
| 25 to 34 Years | 165 (6.1%) | 1,498 (55.8%) |
| 35 to 44 Years | 236 (14.2%) | 993 (59.8%) |
| 45 to 54 Years | 183 (10.3%) | 1,185 (66.5%) |
| 55 to 64 Years | 339 (17.8%) | 1,222 (64.2%) |
| 65 to 74 Years | 1,111 (97.9%) | 197 (17.4%) |
| 75 Years and over | 945 (96.9%) | 72 (7.4%) |
| Total | 5,646 (37.6%) | 6,810 (45.4%) |
Disability Status by Sex by Age in West Park
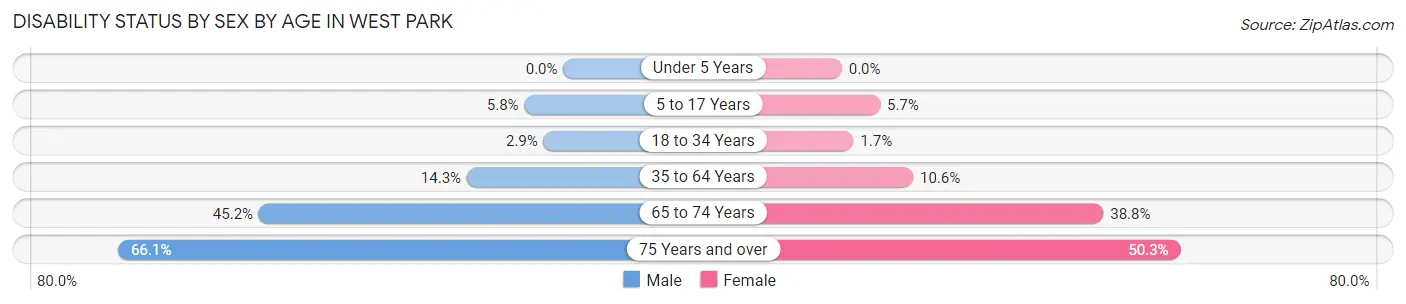
| Age Bracket | Male | Female |
| Under 5 Years | 0 (0.0%) | 0 (0.0%) |
| 5 to 17 Years | 84 (5.8%) | 59 (5.7%) |
| 18 to 34 Years | 66 (2.9%) | 34 (1.7%) |
| 35 to 64 Years | 381 (14.3%) | 284 (10.6%) |
| 65 to 74 Years | 236 (45.2%) | 238 (38.8%) |
| 75 Years and over | 287 (66.1%) | 272 (50.3%) |
Disability Class by Sex by Age in West Park
Disability Class: Hearing Difficulty
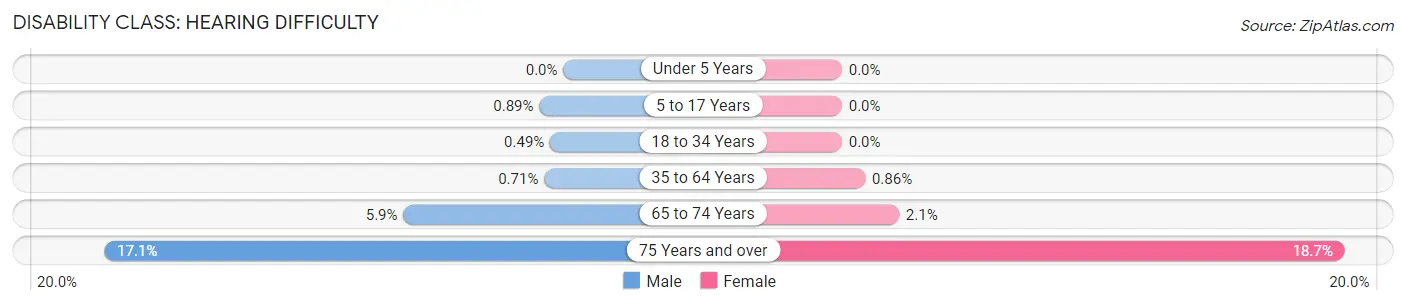
| Age Bracket | Male | Female |
| Under 5 Years | 0 (0.0%) | 0 (0.0%) |
| 5 to 17 Years | 13 (0.9%) | 0 (0.0%) |
| 18 to 34 Years | 11 (0.5%) | 0 (0.0%) |
| 35 to 64 Years | 19 (0.7%) | 23 (0.9%) |
| 65 to 74 Years | 31 (5.9%) | 13 (2.1%) |
| 75 Years and over | 74 (17.1%) | 101 (18.7%) |
Disability Class: Vision Difficulty
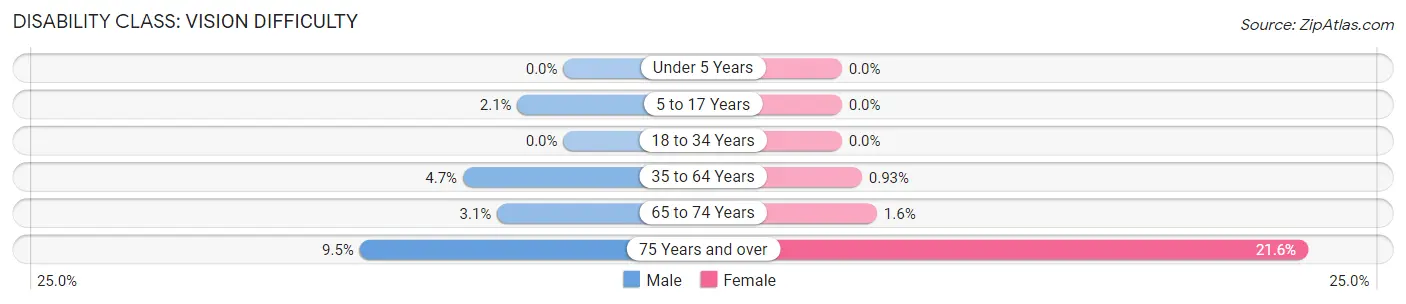
| Age Bracket | Male | Female |
| Under 5 Years | 0 (0.0%) | 0 (0.0%) |
| 5 to 17 Years | 31 (2.1%) | 0 (0.0%) |
| 18 to 34 Years | 0 (0.0%) | 0 (0.0%) |
| 35 to 64 Years | 124 (4.7%) | 25 (0.9%) |
| 65 to 74 Years | 16 (3.1%) | 10 (1.6%) |
| 75 Years and over | 41 (9.5%) | 117 (21.6%) |
Disability Class: Cognitive Difficulty
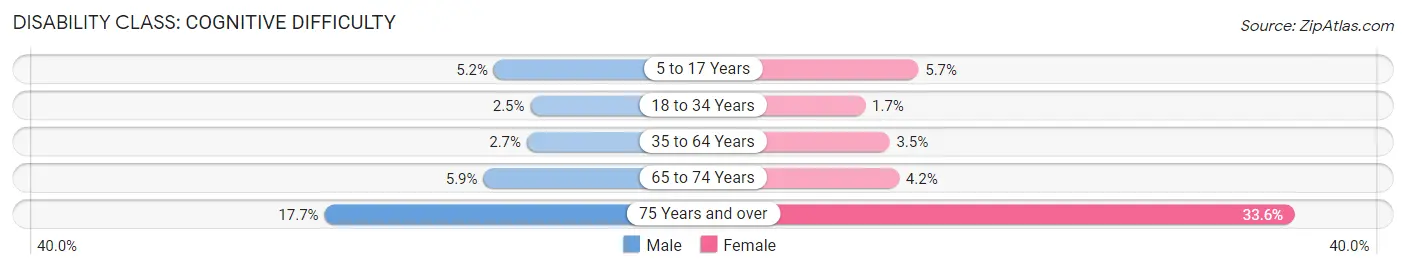
| Age Bracket | Male | Female |
| 5 to 17 Years | 75 (5.2%) | 59 (5.7%) |
| 18 to 34 Years | 55 (2.5%) | 34 (1.7%) |
| 35 to 64 Years | 72 (2.7%) | 95 (3.5%) |
| 65 to 74 Years | 31 (5.9%) | 26 (4.2%) |
| 75 Years and over | 77 (17.7%) | 182 (33.6%) |
Disability Class: Ambulatory Difficulty
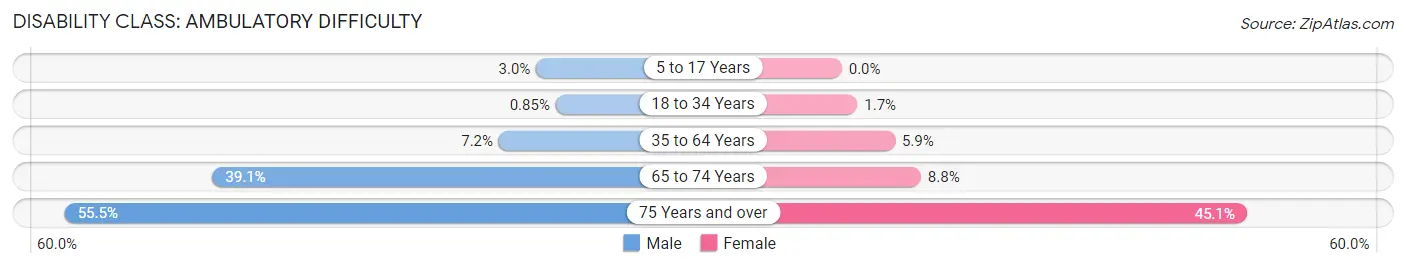
| Age Bracket | Male | Female |
| 5 to 17 Years | 44 (3.0%) | 0 (0.0%) |
| 18 to 34 Years | 19 (0.9%) | 34 (1.7%) |
| 35 to 64 Years | 191 (7.2%) | 159 (5.9%) |
| 65 to 74 Years | 204 (39.1%) | 54 (8.8%) |
| 75 Years and over | 241 (55.5%) | 244 (45.1%) |
Disability Class: Self-Care Difficulty
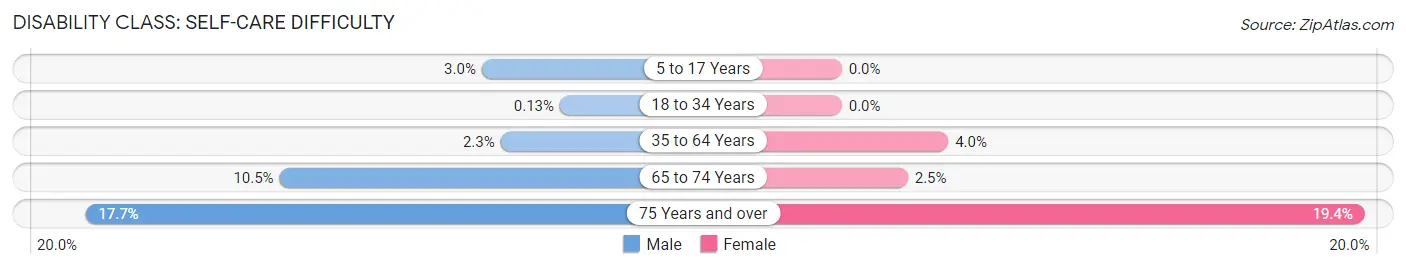
| Age Bracket | Male | Female |
| 5 to 17 Years | 44 (3.0%) | 0 (0.0%) |
| 18 to 34 Years | 3 (0.1%) | 0 (0.0%) |
| 35 to 64 Years | 62 (2.3%) | 106 (4.0%) |
| 65 to 74 Years | 55 (10.5%) | 15 (2.5%) |
| 75 Years and over | 77 (17.7%) | 105 (19.4%) |
Technology Access in West Park
Computing Device Access in West Park
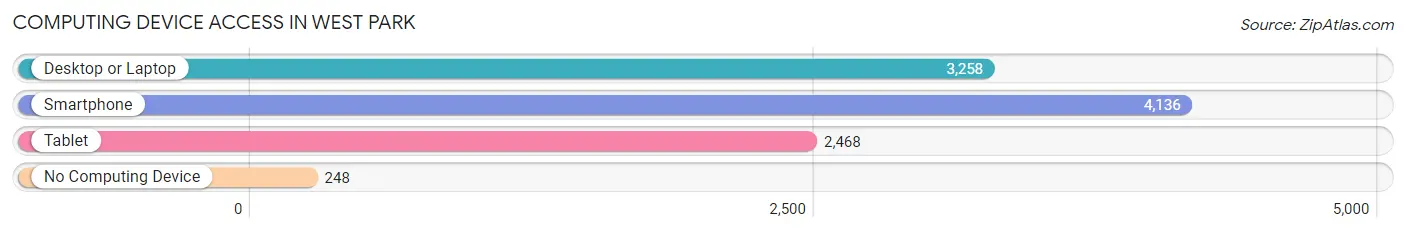
| Device Type | # Households | % Households |
| Desktop or Laptop | 3,258 | 70.4% |
| Smartphone | 4,136 | 89.4% |
| Tablet | 2,468 | 53.3% |
| No Computing Device | 248 | 5.4% |
| Total | 4,628 | 100.0% |
Internet Access in West Park
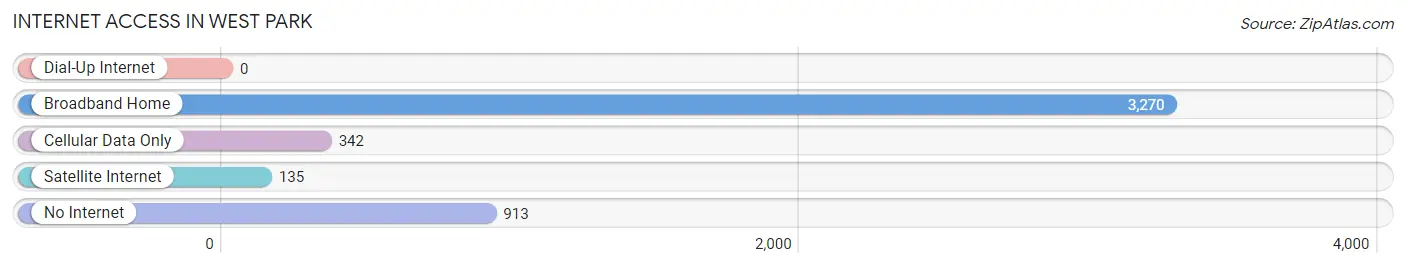
| Internet Type | # Households | % Households |
| Dial-Up Internet | 0 | 0.0% |
| Broadband Home | 3,270 | 70.7% |
| Cellular Data Only | 342 | 7.4% |
| Satellite Internet | 135 | 2.9% |
| No Internet | 913 | 19.7% |
| Total | 4,628 | 100.0% |
West Park Summary
West Park is a city located in Broward County, Florida, United States. It is located in the southeastern part of the state, just west of Miami-Dade County. The city was incorporated in 2005 and is the second-most populous city in Broward County, with a population of approximately 25,000.
Geography
West Park is located in the southeastern part of Florida, just west of Miami-Dade County. It is bordered by the cities of Pembroke Park, Hallandale Beach, Miramar, and Pembroke Pines. The city covers an area of approximately 5.5 square miles and is located at an elevation of 8 feet above sea level. The city is located on the Atlantic Coastal Ridge, which is a series of low hills that run along the eastern coast of Florida.
The city is home to several parks, including West Park Community Park, which features a playground, basketball courts, and a walking path. The city also has several lakes, including Lake Forest, Lakeview, and Lakewood.
Climate
West Park has a tropical climate, with hot and humid summers and mild winters. The average temperature in the summer is around 90°F, while the average temperature in the winter is around 70°F. The city receives an average of 54 inches of rain per year.
Demographics
As of the 2010 census, West Park had a population of 25,000. The racial makeup of the city was 57.3% African American, 28.2% White, 8.2% Hispanic or Latino, and 6.3% other. The median household income was $37,000, and the median age was 33.
Economy
West Park is home to several businesses, including retail stores, restaurants, and medical offices. The city is also home to several industrial parks, which are home to a variety of businesses, including manufacturing, warehousing, and distribution.
The city is also home to several educational institutions, including Broward College, Florida Atlantic University, and Nova Southeastern University.
Conclusion
West Park is a city located in Broward County, Florida, United States. It is located in the southeastern part of the state, just west of Miami-Dade County. The city was incorporated in 2005 and is the second-most populous city in Broward County, with a population of approximately 25,000. West Park has a tropical climate, with hot and humid summers and mild winters. The city is home to several parks, businesses, and educational institutions. The city has a diverse population, with a median household income of $37,000 and a median age of 33. West Park is a vibrant city with a growing economy and a variety of attractions.
Common Questions
What is Per Capita Income in West Park?
Per Capita income in West Park is $24,958.
What is the Median Family Income in West Park?
Median Family Income in West Park is $60,527.
What is the Median Household income in West Park?
Median Household Income in West Park is $58,712.
What is Income or Wage Gap in West Park?
Income or Wage Gap in West Park is 17.5%.
Women in West Park earn 82.5 cents for every dollar earned by a man.
What is Family Income Deficit in West Park?
Family Income Deficit in West Park is $9,999.
Families that are below poverty line in West Park earn $9,999 less on average than the poverty threshold level.
What is Inequality or Gini Index in West Park?
Inequality or Gini Index in West Park is 0.44.
What is the Total Population of West Park?
Total Population of West Park is 15,074.
What is the Total Male Population of West Park?
Total Male Population of West Park is 7,599.
What is the Total Female Population of West Park?
Total Female Population of West Park is 7,475.
What is the Ratio of Males per 100 Females in West Park?
There are 101.66 Males per 100 Females in West Park.
What is the Ratio of Females per 100 Males in West Park?
There are 98.37 Females per 100 Males in West Park.
What is the Median Population Age in West Park?
Median Population Age in West Park is 34.8 Years.
What is the Average Family Size in West Park
Average Family Size in West Park is 3.7 People.
What is the Average Household Size in West Park
Average Household Size in West Park is 3.2 People.
How Large is the Labor Force in West Park?
There are 8,264 People in the Labor Forcein in West Park.
What is the Percentage of People in the Labor Force in West Park?
68.2% of People are in the Labor Force in West Park.
What is the Unemployment Rate in West Park?
Unemployment Rate in West Park is 8.6%.