Gladeview, FL Map & Demographics
Gladeview Map
Gladeview Overview
$17,623
PER CAPITA INCOME
$43,688
AVG FAMILY INCOME
$42,490
AVG HOUSEHOLD INCOME
28.8%
WAGE / INCOME GAP [ % ]
71.2¢/ $1
WAGE / INCOME GAP [ $ ]
$13,645
FAMILY INCOME DEFICIT
0.46
INEQUALITY / GINI INDEX
14,698
TOTAL POPULATION
6,947
MALE POPULATION
7,751
FEMALE POPULATION
89.63
MALES / 100 FEMALES
111.57
FEMALES / 100 MALES
30.7
MEDIAN AGE
3.9
AVG FAMILY SIZE
3.1
AVG HOUSEHOLD SIZE
5,960
LABOR FORCE [ PEOPLE ]
56.8%
PERCENT IN LABOR FORCE
6.7%
UNEMPLOYMENT RATE
Income in Gladeview
Income Overview in Gladeview
Per Capita Income in Gladeview is $17,623, while median incomes of families and households are $43,688 and $42,490 respectively.
| Characteristic | Number | Measure |
| Per Capita Income | 14,698 | $17,623 |
| Median Family Income | 3,200 | $43,688 |
| Mean Family Income | 3,200 | $53,187 |
| Median Household Income | 4,686 | $42,490 |
| Mean Household Income | 4,686 | $50,391 |
| Income Deficit | 3,200 | $13,645 |
| Wage / Income Gap (%) | 14,698 | 28.84% |
| Wage / Income Gap ($) | 14,698 | 71.16¢ per $1 |
| Gini / Inequality Index | 14,698 | 0.46 |
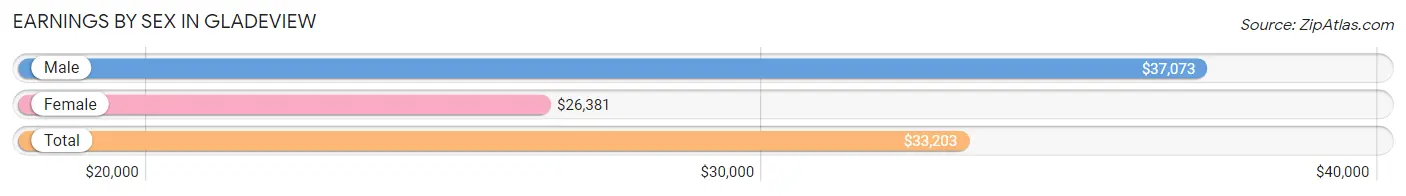
Earnings by Sex in Gladeview
Average Earnings in Gladeview are $33,203, $37,073 for men and $26,381 for women, a difference of 28.8%.
| Sex | Number | Average Earnings |
| Male | 2,633 (44.1%) | $37,073 |
| Female | 3,332 (55.9%) | $26,381 |
| Total | 5,965 (100.0%) | $33,203 |
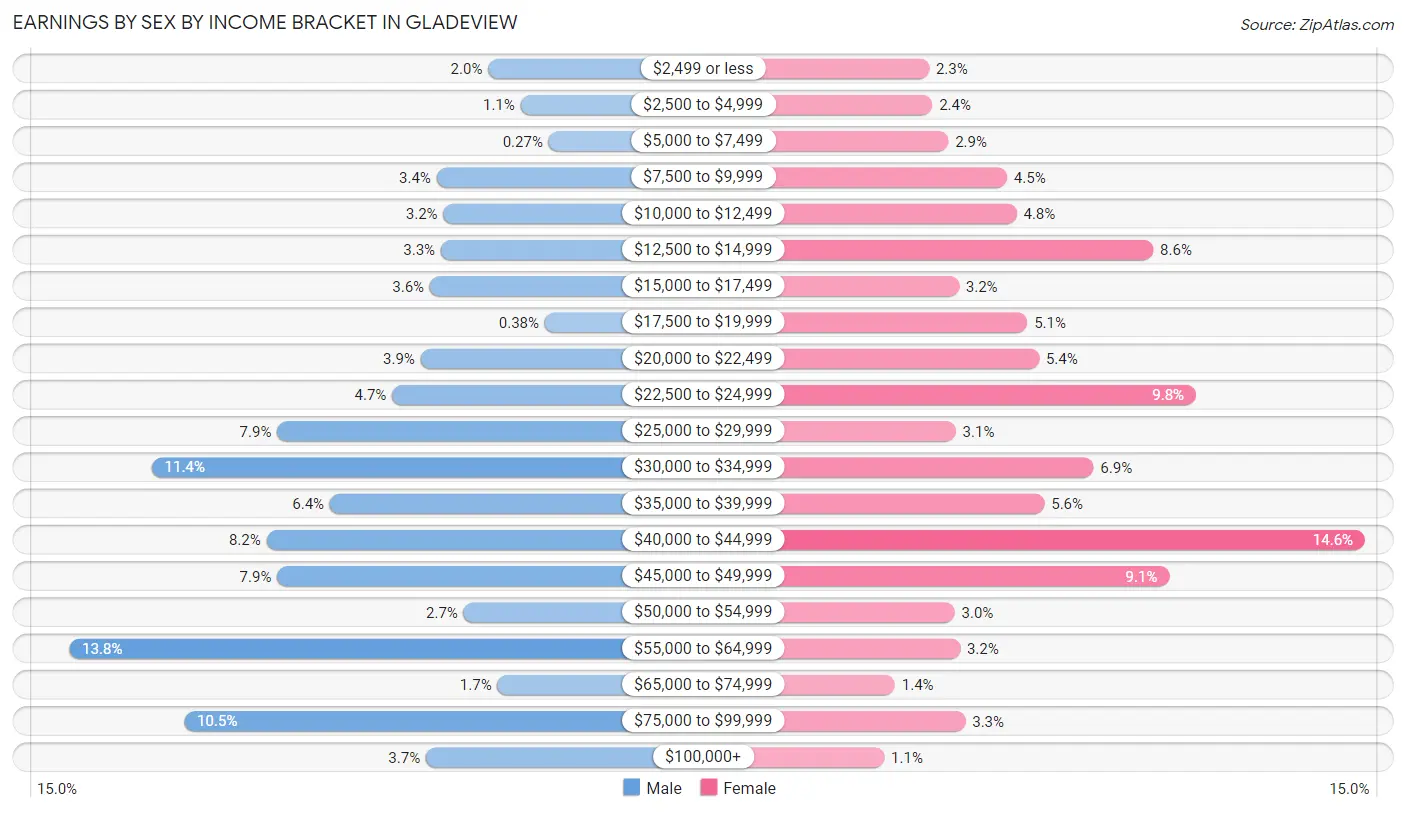
Earnings by Sex by Income Bracket in Gladeview
The most common earnings brackets in Gladeview are $55,000 to $64,999 for men (362 | 13.8%) and $40,000 to $44,999 for women (485 | 14.6%).
| Income | Male | Female |
| $2,499 or less | 52 (2.0%) | 77 (2.3%) |
| $2,500 to $4,999 | 28 (1.1%) | 80 (2.4%) |
| $5,000 to $7,499 | 7 (0.3%) | 95 (2.9%) |
| $7,500 to $9,999 | 90 (3.4%) | 150 (4.5%) |
| $10,000 to $12,499 | 85 (3.2%) | 159 (4.8%) |
| $12,500 to $14,999 | 87 (3.3%) | 287 (8.6%) |
| $15,000 to $17,499 | 95 (3.6%) | 105 (3.2%) |
| $17,500 to $19,999 | 10 (0.4%) | 169 (5.1%) |
| $20,000 to $22,499 | 102 (3.9%) | 180 (5.4%) |
| $22,500 to $24,999 | 123 (4.7%) | 327 (9.8%) |
| $25,000 to $29,999 | 208 (7.9%) | 102 (3.1%) |
| $30,000 to $34,999 | 301 (11.4%) | 231 (6.9%) |
| $35,000 to $39,999 | 169 (6.4%) | 185 (5.6%) |
| $40,000 to $44,999 | 216 (8.2%) | 485 (14.6%) |
| $45,000 to $49,999 | 208 (7.9%) | 302 (9.1%) |
| $50,000 to $54,999 | 70 (2.7%) | 101 (3.0%) |
| $55,000 to $64,999 | 362 (13.8%) | 106 (3.2%) |
| $65,000 to $74,999 | 45 (1.7%) | 45 (1.3%) |
| $75,000 to $99,999 | 277 (10.5%) | 111 (3.3%) |
| $100,000+ | 98 (3.7%) | 35 (1.1%) |
| Total | 2,633 (100.0%) | 3,332 (100.0%) |
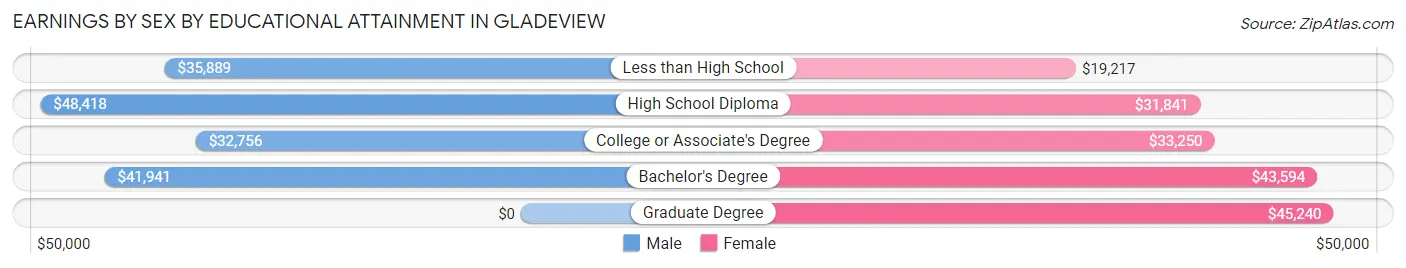
Earnings by Sex by Educational Attainment in Gladeview
Average earnings in Gladeview are $40,486 for men and $30,414 for women, a difference of 24.9%. Men with an educational attainment of high school diploma enjoy the highest average annual earnings of $48,418, while those with college or associate's degree education earn the least with $32,756. Women with an educational attainment of graduate degree earn the most with the average annual earnings of $45,240, while those with less than high school education have the smallest earnings of $19,217.
| Educational Attainment | Male Income | Female Income |
| Less than High School | $35,889 | $19,217 |
| High School Diploma | $48,418 | $31,841 |
| College or Associate's Degree | $32,756 | $33,250 |
| Bachelor's Degree | $41,941 | $43,594 |
| Graduate Degree | - | - |
| Total | $40,486 | $30,414 |
Family Income in Gladeview
Family Income Brackets in Gladeview
According to the Gladeview family income data, there are 672 families falling into the $35,000 to $49,999 income range, which is the most common income bracket and makes up 21.0% of all families. Conversely, the $200,000+ income bracket is the least frequent group with only 19 families (0.6%) belonging to this category.
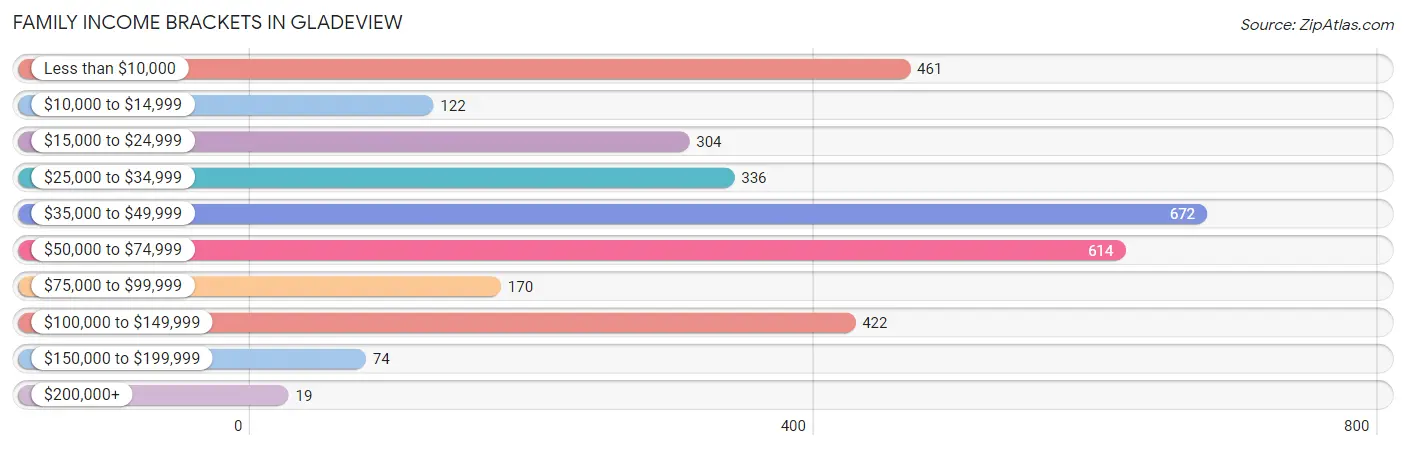
| Income Bracket | # Families | % Families |
| Less than $10,000 | 461 | 14.4% |
| $10,000 to $14,999 | 122 | 3.8% |
| $15,000 to $24,999 | 304 | 9.5% |
| $25,000 to $34,999 | 336 | 10.5% |
| $35,000 to $49,999 | 672 | 21.0% |
| $50,000 to $74,999 | 614 | 19.2% |
| $75,000 to $99,999 | 170 | 5.3% |
| $100,000 to $149,999 | 422 | 13.2% |
| $150,000 to $199,999 | 74 | 2.3% |
| $200,000+ | 19 | 0.6% |
Family Income by Famaliy Size in Gladeview
4-person families (598 | 18.7%) account for the highest median family income in Gladeview with $56,938 per family, while 2-person families (939 | 29.3%) have the highest median income of $20,279 per family member.

| Income Bracket | # Families | Median Income |
| 2-Person Families | 939 (29.3%) | $40,558 |
| 3-Person Families | 937 (29.3%) | $41,976 |
| 4-Person Families | 598 (18.7%) | $56,938 |
| 5-Person Families | 549 (17.2%) | $44,502 |
| 6-Person Families | 86 (2.7%) | $18,600 |
| 7+ Person Families | 91 (2.8%) | $0 |
| Total | 3,200 (100.0%) | $43,688 |
Family Income by Number of Earners in Gladeview
The median family income in Gladeview is $43,688, with families comprising 3+ earners (313) having the highest median family income of $120,806, while families with no earners (603) have the lowest median family income of $11,598, accounting for 9.8% and 18.8% of families, respectively.
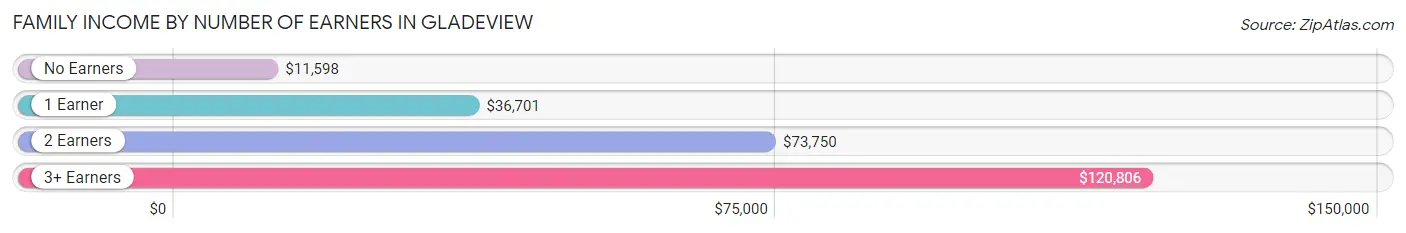
| Number of Earners | # Families | Median Income |
| No Earners | 603 (18.8%) | $11,598 |
| 1 Earner | 1,430 (44.7%) | $36,701 |
| 2 Earners | 854 (26.7%) | $73,750 |
| 3+ Earners | 313 (9.8%) | $120,806 |
| Total | 3,200 (100.0%) | $43,688 |
Household Income in Gladeview
Household Income Brackets in Gladeview
With 1,101 households falling in the category, the $35,000 to $49,999 income range is the most frequent in Gladeview, accounting for 23.5% of all households. In contrast, only 19 households (0.4%) fall into the $200,000+ income bracket, making it the least populous group.
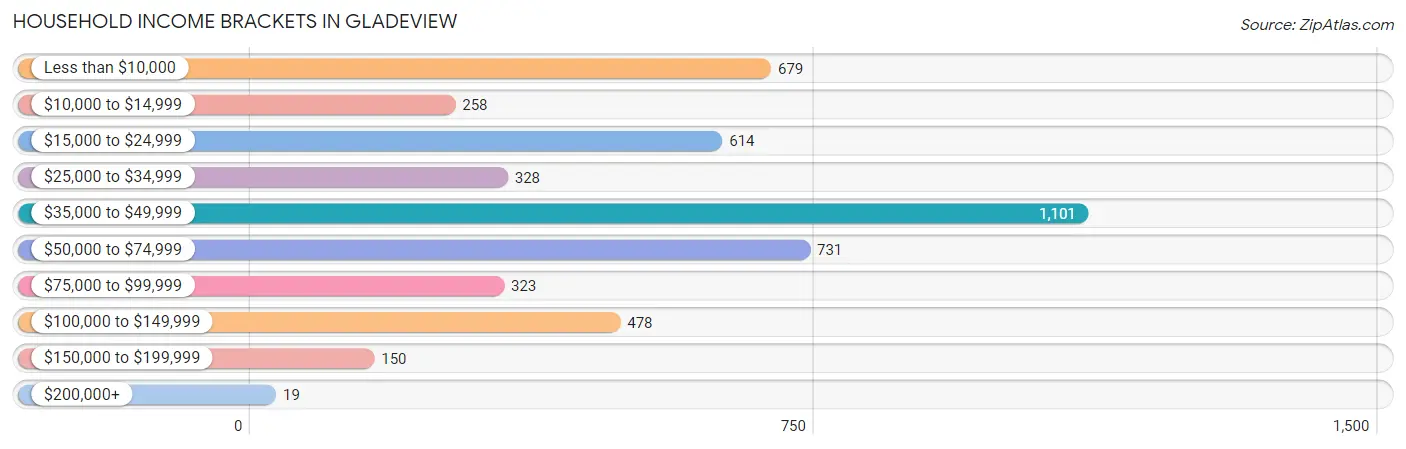
| Income Bracket | # Households | % Households |
| Less than $10,000 | 679 | 14.5% |
| $10,000 to $14,999 | 258 | 5.5% |
| $15,000 to $24,999 | 614 | 13.1% |
| $25,000 to $34,999 | 328 | 7.0% |
| $35,000 to $49,999 | 1,101 | 23.5% |
| $50,000 to $74,999 | 731 | 15.6% |
| $75,000 to $99,999 | 323 | 6.9% |
| $100,000 to $149,999 | 478 | 10.2% |
| $150,000 to $199,999 | 150 | 3.2% |
| $200,000+ | 19 | 0.4% |
Household Income by Householder Age in Gladeview
The median household income in Gladeview is $42,490, with the highest median household income of $46,828 found in the 25 to 44 years age bracket for the primary householder. A total of 1,923 households (41.0%) fall into this category. Meanwhile, the 15 to 24 years age bracket for the primary householder has the lowest median household income of $35,025, with 99 households (2.1%) in this group.
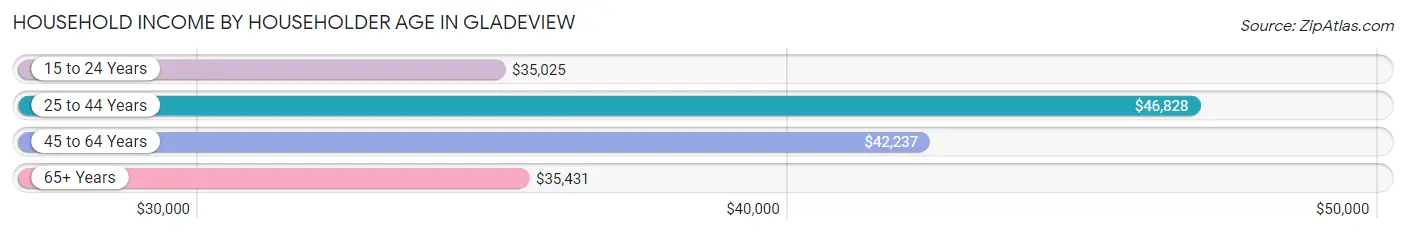
| Income Bracket | # Households | Median Income |
| 15 to 24 Years | 99 (2.1%) | $35,025 |
| 25 to 44 Years | 1,923 (41.0%) | $46,828 |
| 45 to 64 Years | 1,636 (34.9%) | $42,237 |
| 65+ Years | 1,028 (21.9%) | $35,431 |
| Total | 4,686 (100.0%) | $42,490 |
Poverty in Gladeview
Income Below Poverty by Sex and Age in Gladeview
With 29.1% poverty level for males and 35.3% for females among the residents of Gladeview, under 5 year old males and 6 to 11 year old females are the most vulnerable to poverty, with 388 males (68.9%) and 362 females (59.0%) in their respective age groups living below the poverty level.
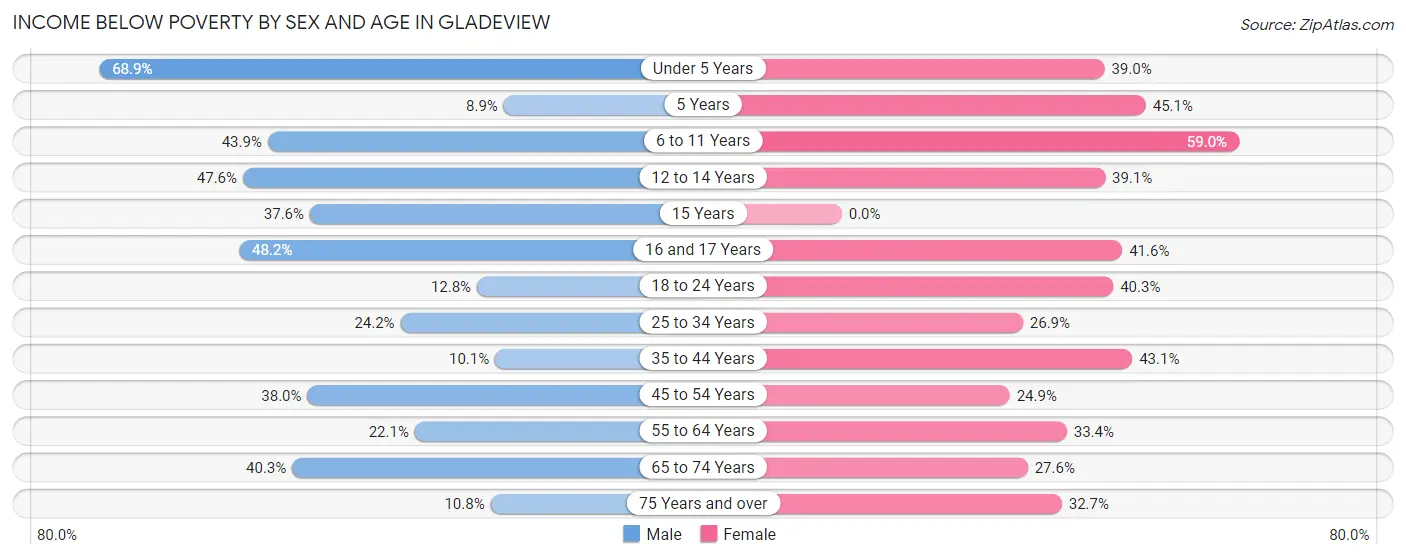
| Age Bracket | Male | Female |
| Under 5 Years | 388 (68.9%) | 307 (39.0%) |
| 5 Years | 21 (8.9%) | 79 (45.1%) |
| 6 to 11 Years | 403 (43.9%) | 362 (59.0%) |
| 12 to 14 Years | 178 (47.6%) | 95 (39.1%) |
| 15 Years | 99 (37.6%) | 0 (0.0%) |
| 16 and 17 Years | 91 (48.1%) | 112 (41.6%) |
| 18 to 24 Years | 91 (12.8%) | 237 (40.3%) |
| 25 to 34 Years | 217 (24.2%) | 409 (26.9%) |
| 35 to 44 Years | 128 (10.1%) | 320 (43.1%) |
| 45 to 54 Years | 122 (38.0%) | 214 (24.9%) |
| 55 to 64 Years | 130 (22.1%) | 298 (33.4%) |
| 65 to 74 Years | 114 (40.3%) | 201 (27.6%) |
| 75 Years and over | 37 (10.8%) | 99 (32.7%) |
| Total | 2,019 (29.1%) | 2,733 (35.3%) |
Income Above Poverty by Sex and Age in Gladeview
According to the poverty statistics in Gladeview, males aged 5 years and females aged 15 years are the age groups that are most secure financially, with 91.1% of males and 100.0% of females in these age groups living above the poverty line.
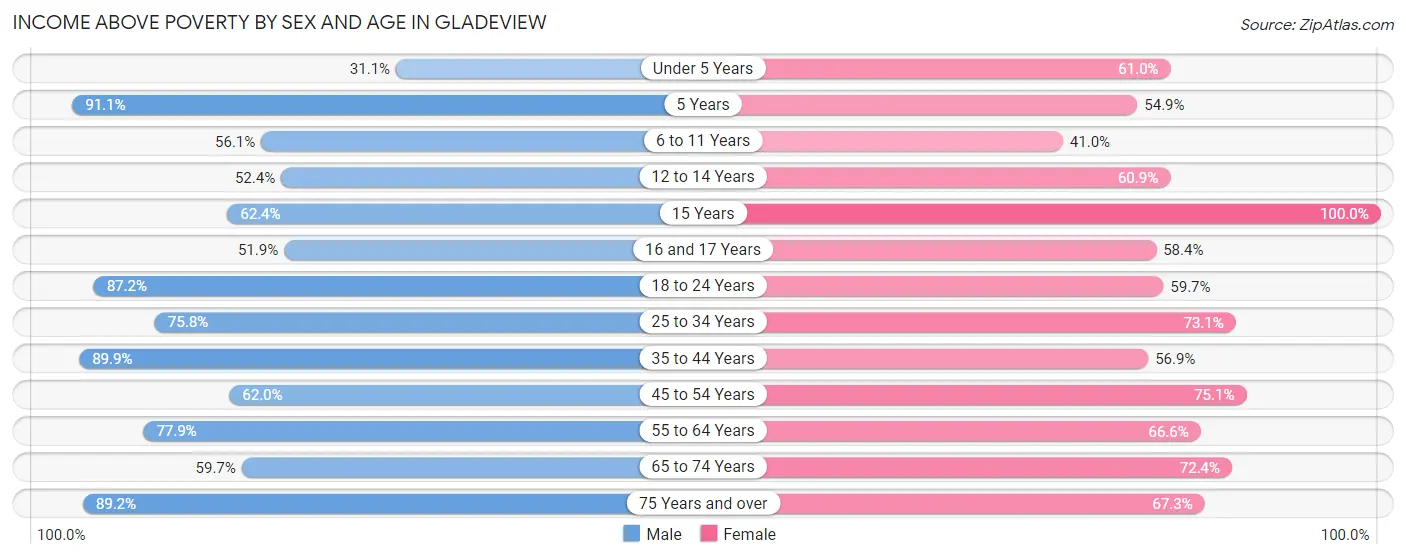
| Age Bracket | Male | Female |
| Under 5 Years | 175 (31.1%) | 480 (61.0%) |
| 5 Years | 216 (91.1%) | 96 (54.9%) |
| 6 to 11 Years | 515 (56.1%) | 252 (41.0%) |
| 12 to 14 Years | 196 (52.4%) | 148 (60.9%) |
| 15 Years | 164 (62.4%) | 31 (100.0%) |
| 16 and 17 Years | 98 (51.8%) | 157 (58.4%) |
| 18 to 24 Years | 618 (87.2%) | 351 (59.7%) |
| 25 to 34 Years | 680 (75.8%) | 1,112 (73.1%) |
| 35 to 44 Years | 1,134 (89.9%) | 422 (56.9%) |
| 45 to 54 Years | 199 (62.0%) | 644 (75.1%) |
| 55 to 64 Years | 459 (77.9%) | 594 (66.6%) |
| 65 to 74 Years | 169 (59.7%) | 527 (72.4%) |
| 75 Years and over | 305 (89.2%) | 204 (67.3%) |
| Total | 4,928 (70.9%) | 5,018 (64.7%) |
Income Below Poverty Among Married-Couple Families in Gladeview
The poverty statistics for married-couple families in Gladeview show that 13.3% or 145 of the total 1,088 families live below the poverty line. Families with no children have the highest poverty rate of 21.5%, comprising of 98 families. On the other hand, families with 1 or 2 children have the lowest poverty rate of 2.5%, which includes 11 families.
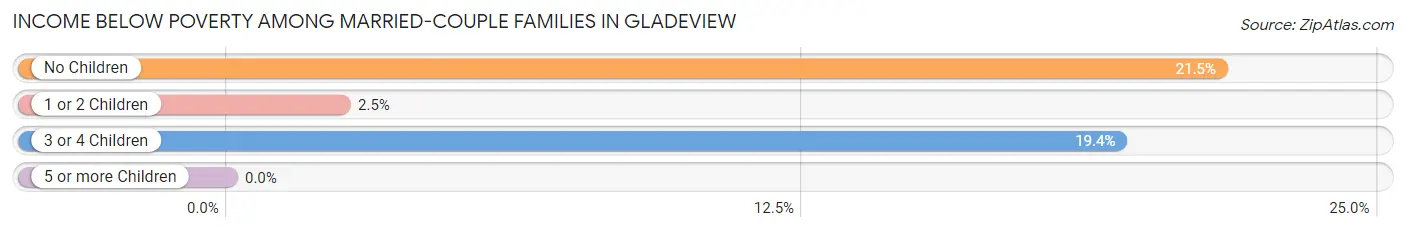
| Children | Above Poverty | Below Poverty |
| No Children | 357 (78.5%) | 98 (21.5%) |
| 1 or 2 Children | 436 (97.5%) | 11 (2.5%) |
| 3 or 4 Children | 150 (80.6%) | 36 (19.4%) |
| 5 or more Children | 0 (0.0%) | 0 (0.0%) |
| Total | 943 (86.7%) | 145 (13.3%) |
Income Below Poverty Among Single-Parent Households in Gladeview
According to the poverty data in Gladeview, 41.8% or 161 single-father households and 38.3% or 662 single-mother households are living below the poverty line. Among single-father households, those with 3 or 4 children have the highest poverty rate, with 91 households (100.0%) experiencing poverty. Likewise, among single-mother households, those with 5 or more children have the highest poverty rate, with 77 households (100.0%) falling below the poverty line.
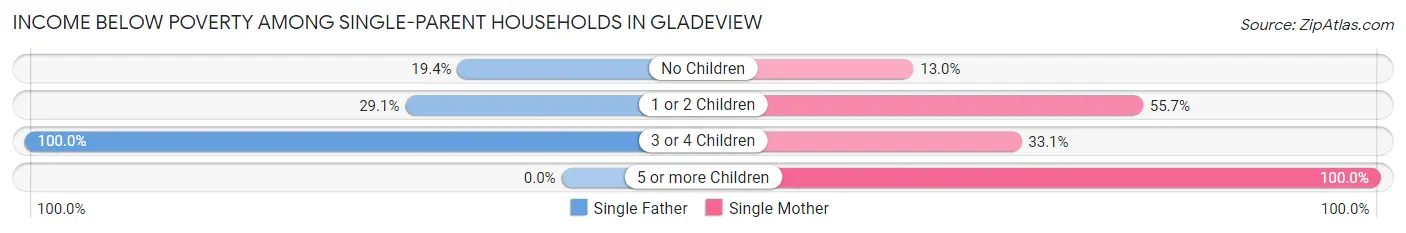
| Children | Single Father | Single Mother |
| No Children | 31 (19.4%) | 82 (13.0%) |
| 1 or 2 Children | 39 (29.1%) | 409 (55.7%) |
| 3 or 4 Children | 91 (100.0%) | 94 (33.1%) |
| 5 or more Children | 0 (0.0%) | 77 (100.0%) |
| Total | 161 (41.8%) | 662 (38.3%) |
Income Below Poverty Among Married-Couple vs Single-Parent Households in Gladeview
The poverty data for Gladeview shows that 145 of the married-couple family households (13.3%) and 823 of the single-parent households (39.0%) are living below the poverty level. Within the married-couple family households, those with no children have the highest poverty rate, with 98 households (21.5%) falling below the poverty line. Among the single-parent households, those with 5 or more children have the highest poverty rate, with 77 household (100.0%) living below poverty.
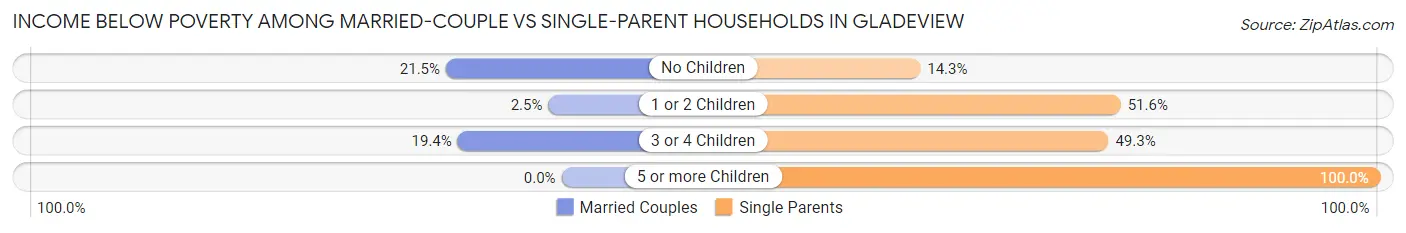
| Children | Married-Couple Families | Single-Parent Households |
| No Children | 98 (21.5%) | 113 (14.3%) |
| 1 or 2 Children | 11 (2.5%) | 448 (51.6%) |
| 3 or 4 Children | 36 (19.4%) | 185 (49.3%) |
| 5 or more Children | 0 (0.0%) | 77 (100.0%) |
| Total | 145 (13.3%) | 823 (39.0%) |
Race in Gladeview
The most populous races in Gladeview are Black / African American (9,336 | 63.5%), Hispanic or Latino (5,510 | 37.5%), and White / Caucasian (2,091 | 14.2%).
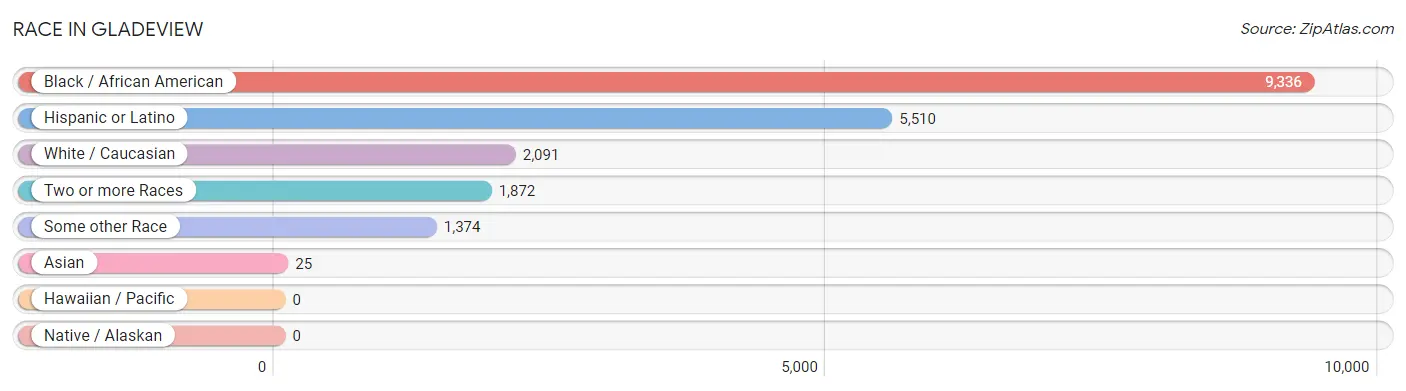
| Race | # Population | % Population |
| Asian | 25 | 0.2% |
| Black / African American | 9,336 | 63.5% |
| Hawaiian / Pacific | 0 | 0.0% |
| Hispanic or Latino | 5,510 | 37.5% |
| Native / Alaskan | 0 | 0.0% |
| White / Caucasian | 2,091 | 14.2% |
| Two or more Races | 1,872 | 12.7% |
| Some other Race | 1,374 | 9.3% |
| Total | 14,698 | 100.0% |
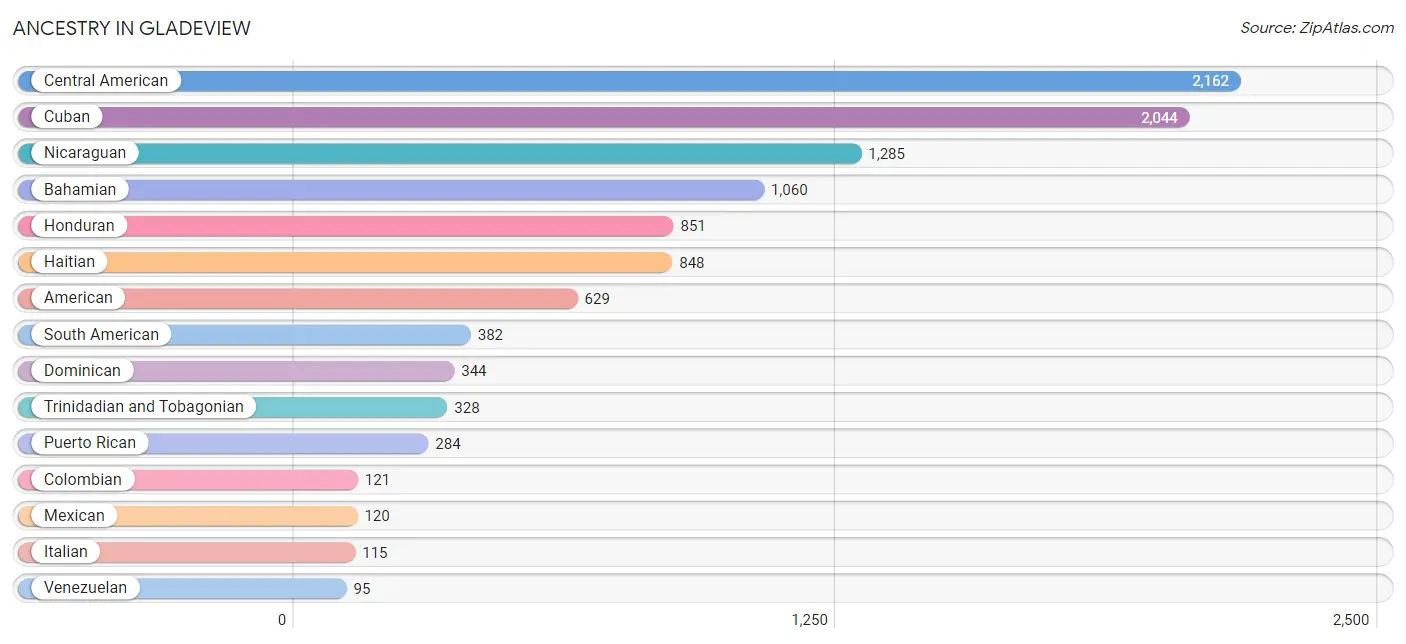
Ancestry in Gladeview
The most populous ancestries reported in Gladeview are Central American (2,162 | 14.7%), Cuban (2,044 | 13.9%), Nicaraguan (1,285 | 8.7%), Bahamian (1,060 | 7.2%), and Honduran (851 | 5.8%), together accounting for 50.4% of all Gladeview residents.
| Ancestry | # Population | % Population |
| African | 18 | 0.1% |
| American | 629 | 4.3% |
| Argentinean | 75 | 0.5% |
| Bahamian | 1,060 | 7.2% |
| British | 19 | 0.1% |
| Central American | 2,162 | 14.7% |
| Chilean | 6 | 0.0% |
| Colombian | 121 | 0.8% |
| Cuban | 2,044 | 13.9% |
| Dominican | 344 | 2.3% |
| Ecuadorian | 19 | 0.1% |
| English | 42 | 0.3% |
| French Canadian | 7 | 0.1% |
| Guyanese | 92 | 0.6% |
| Haitian | 848 | 5.8% |
| Honduran | 851 | 5.8% |
| Indian (Asian) | 13 | 0.1% |
| Irish | 20 | 0.1% |
| Italian | 115 | 0.8% |
| Jamaican | 78 | 0.5% |
| Mexican | 120 | 0.8% |
| Nicaraguan | 1,285 | 8.7% |
| Peruvian | 45 | 0.3% |
| Puerto Rican | 284 | 1.9% |
| Salvadoran | 26 | 0.2% |
| South American | 382 | 2.6% |
| Subsaharan African | 18 | 0.1% |
| Thai | 12 | 0.1% |
| Trinidadian and Tobagonian | 328 | 2.2% |
| Uruguayan | 21 | 0.1% |
| Venezuelan | 95 | 0.6% |
| West Indian | 79 | 0.5% | View All 32 Rows |
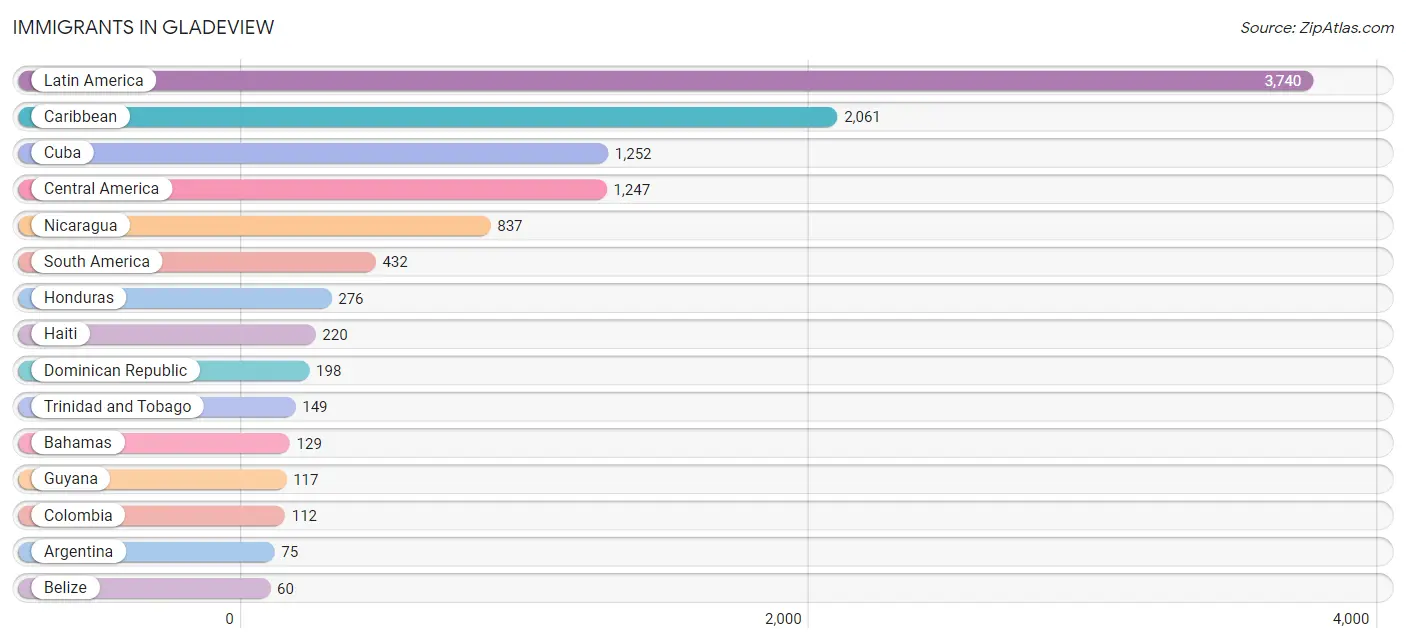
Immigrants in Gladeview
The most numerous immigrant groups reported in Gladeview came from Latin America (3,740 | 25.5%), Caribbean (2,061 | 14.0%), Cuba (1,252 | 8.5%), Central America (1,247 | 8.5%), and Nicaragua (837 | 5.7%), together accounting for 62.2% of all Gladeview residents.
| Immigration Origin | # Population | % Population |
| Argentina | 75 | 0.5% |
| Asia | 14 | 0.1% |
| Bahamas | 129 | 0.9% |
| Bangladesh | 14 | 0.1% |
| Belize | 60 | 0.4% |
| Caribbean | 2,061 | 14.0% |
| Central America | 1,247 | 8.5% |
| Chile | 6 | 0.0% |
| Colombia | 112 | 0.8% |
| Cuba | 1,252 | 8.5% |
| Dominican Republic | 198 | 1.3% |
| Ecuador | 19 | 0.1% |
| El Salvador | 17 | 0.1% |
| Grenada | 34 | 0.2% |
| Guatemala | 9 | 0.1% |
| Guyana | 117 | 0.8% |
| Haiti | 220 | 1.5% |
| Honduras | 276 | 1.9% |
| Jamaica | 60 | 0.4% |
| Latin America | 3,740 | 25.5% |
| Mexico | 48 | 0.3% |
| Nicaragua | 837 | 5.7% |
| Peru | 24 | 0.2% |
| South America | 432 | 2.9% |
| South Central Asia | 14 | 0.1% |
| Trinidad and Tobago | 149 | 1.0% |
| Uruguay | 21 | 0.1% |
| Venezuela | 58 | 0.4% | View All 28 Rows |
Sex and Age in Gladeview
Sex and Age in Gladeview
The most populous age groups in Gladeview are 5 to 9 Years (835 | 12.0%) for men and 30 to 34 Years (908 | 11.7%) for women.
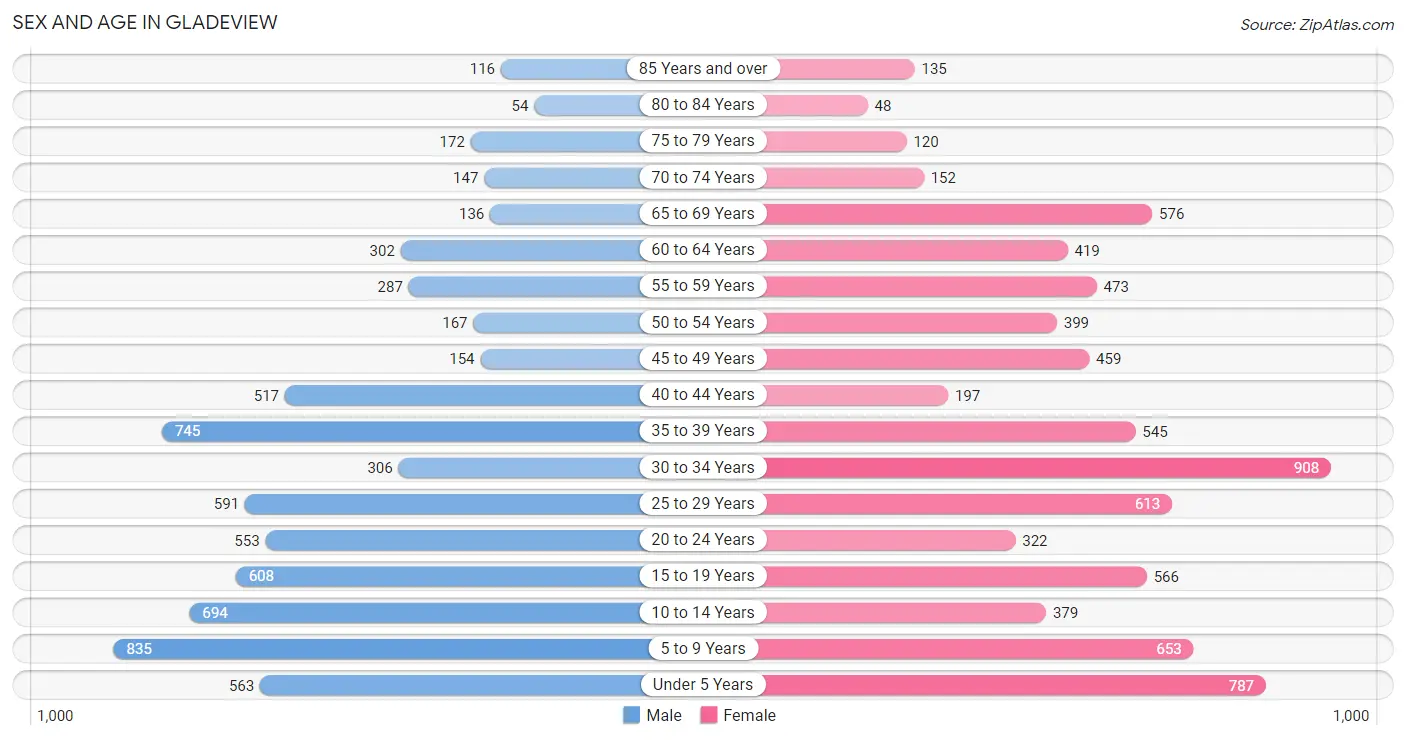
| Age Bracket | Male | Female |
| Under 5 Years | 563 (8.1%) | 787 (10.2%) |
| 5 to 9 Years | 835 (12.0%) | 653 (8.4%) |
| 10 to 14 Years | 694 (10.0%) | 379 (4.9%) |
| 15 to 19 Years | 608 (8.7%) | 566 (7.3%) |
| 20 to 24 Years | 553 (8.0%) | 322 (4.2%) |
| 25 to 29 Years | 591 (8.5%) | 613 (7.9%) |
| 30 to 34 Years | 306 (4.4%) | 908 (11.7%) |
| 35 to 39 Years | 745 (10.7%) | 545 (7.0%) |
| 40 to 44 Years | 517 (7.4%) | 197 (2.5%) |
| 45 to 49 Years | 154 (2.2%) | 459 (5.9%) |
| 50 to 54 Years | 167 (2.4%) | 399 (5.1%) |
| 55 to 59 Years | 287 (4.1%) | 473 (6.1%) |
| 60 to 64 Years | 302 (4.3%) | 419 (5.4%) |
| 65 to 69 Years | 136 (2.0%) | 576 (7.4%) |
| 70 to 74 Years | 147 (2.1%) | 152 (2.0%) |
| 75 to 79 Years | 172 (2.5%) | 120 (1.5%) |
| 80 to 84 Years | 54 (0.8%) | 48 (0.6%) |
| 85 Years and over | 116 (1.7%) | 135 (1.7%) |
| Total | 6,947 (100.0%) | 7,751 (100.0%) |
Families and Households in Gladeview
Median Family Size in Gladeview
The median family size in Gladeview is 3.89 persons per family, with married-couple families (1,088 | 34.0%) accounting for the largest median family size of 4.1 persons per family. On the other hand, single male/father families (385 | 12.0%) represent the smallest median family size with 3.39 persons per family.
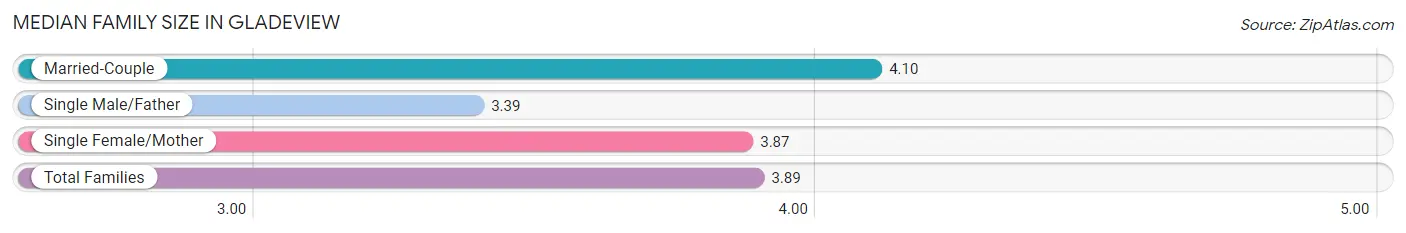
| Family Type | # Families | Family Size |
| Married-Couple | 1,088 (34.0%) | 4.10 |
| Single Male/Father | 385 (12.0%) | 3.39 |
| Single Female/Mother | 1,727 (54.0%) | 3.87 |
| Total Families | 3,200 (100.0%) | 3.89 |
Median Household Size in Gladeview
The median household size in Gladeview is 3.12 persons per household, with married-couple households (1,088 | 23.2%) accounting for the largest median household size of 4.13 persons per household. non-family households (1,486 | 31.7%) represent the smallest median household size with 1.15 persons per household.
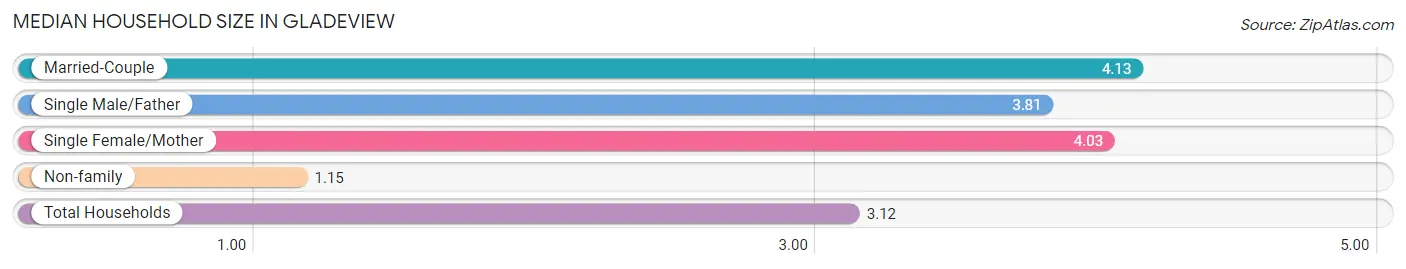
| Household Type | # Households | Household Size |
| Married-Couple | 1,088 (23.2%) | 4.13 |
| Single Male/Father | 385 (8.2%) | 3.81 |
| Single Female/Mother | 1,727 (36.8%) | 4.03 |
| Non-family | 1,486 (31.7%) | 1.15 |
| Total Households | 4,686 (100.0%) | 3.12 |
Household Size by Marriage Status in Gladeview
Out of a total of 4,686 households in Gladeview, 3,200 (68.3%) are family households, while 1,486 (31.7%) are nonfamily households. The most numerous type of family households are 3-person households, comprising 890, and the most common type of nonfamily households are 1-person households, comprising 1,228.
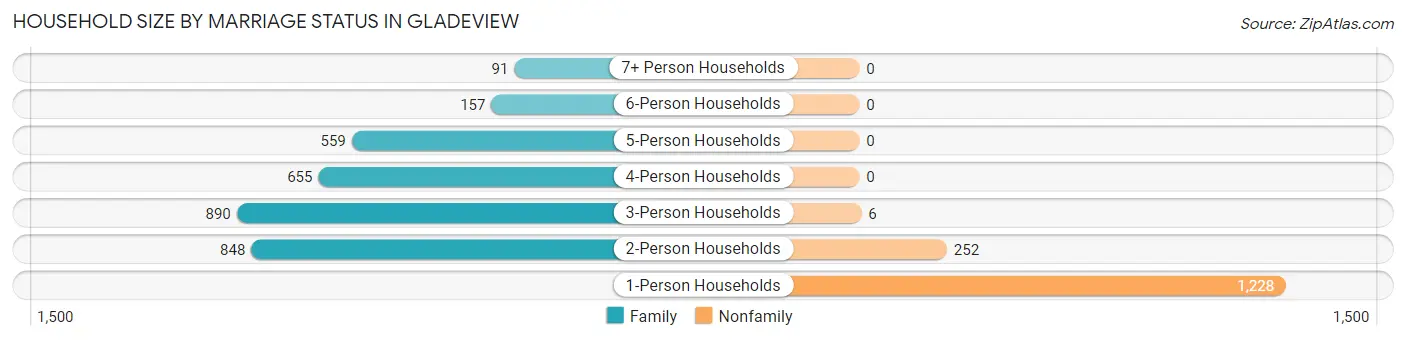
| Household Size | Family Households | Nonfamily Households |
| 1-Person Households | - | 1,228 (26.2%) |
| 2-Person Households | 848 (18.1%) | 252 (5.4%) |
| 3-Person Households | 890 (19.0%) | 6 (0.1%) |
| 4-Person Households | 655 (14.0%) | 0 (0.0%) |
| 5-Person Households | 559 (11.9%) | 0 (0.0%) |
| 6-Person Households | 157 (3.4%) | 0 (0.0%) |
| 7+ Person Households | 91 (1.9%) | 0 (0.0%) |
| Total | 3,200 (68.3%) | 1,486 (31.7%) |
Female Fertility in Gladeview
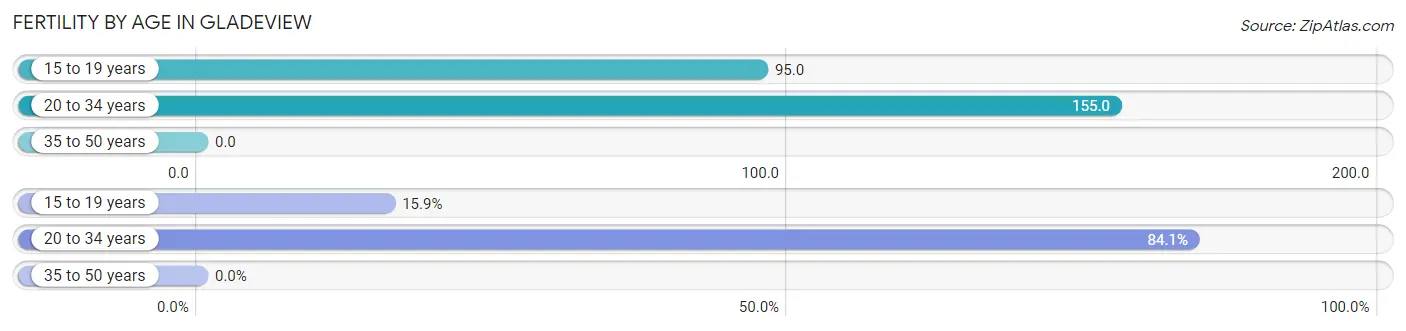
Fertility by Age in Gladeview
Average fertility rate in Gladeview is 92.0 births per 1,000 women. Women in the age bracket of 20 to 34 years have the highest fertility rate with 155.0 births per 1,000 women. Women in the age bracket of 20 to 34 years acount for 84.1% of all women with births.
| Age Bracket | Women with Births | Births / 1,000 Women |
| 15 to 19 years | 54 (15.9%) | 95.0 |
| 20 to 34 years | 286 (84.1%) | 155.0 |
| 35 to 50 years | 0 (0.0%) | 0.0 |
| Total | 340 (100.0%) | 92.0 |
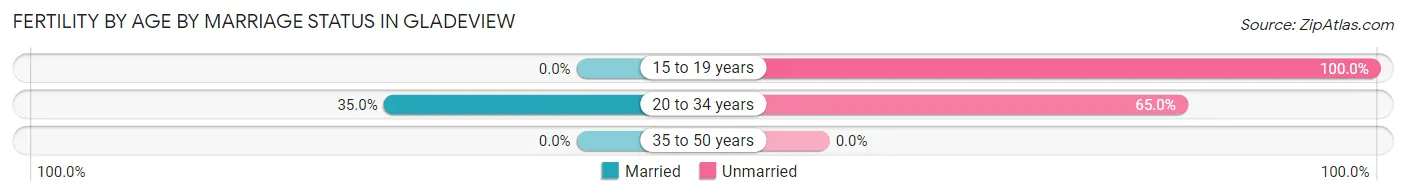
Fertility by Age by Marriage Status in Gladeview
29.4% of women with births (340) in Gladeview are married. The highest percentage of unmarried women with births falls into 15 to 19 years age bracket with 100.0% of them unmarried at the time of birth, while the lowest percentage of unmarried women with births belong to 20 to 34 years age bracket with 65.0% of them unmarried.
| Age Bracket | Married | Unmarried |
| 15 to 19 years | 0 (0.0%) | 54 (100.0%) |
| 20 to 34 years | 100 (35.0%) | 186 (65.0%) |
| 35 to 50 years | 0 (0.0%) | 0 (0.0%) |
| Total | 100 (29.4%) | 240 (70.6%) |
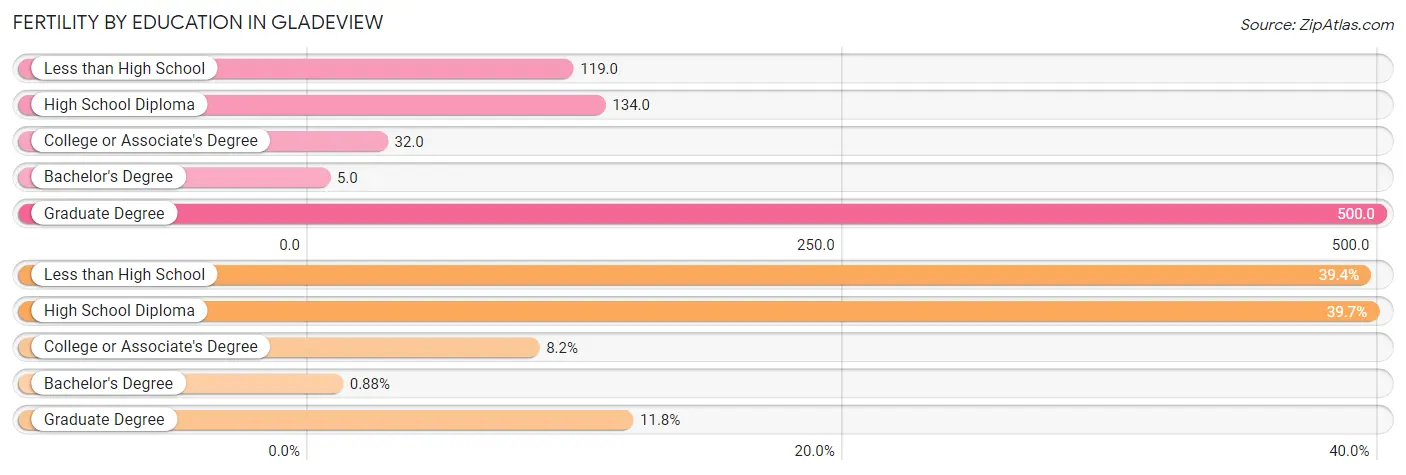
Fertility by Education in Gladeview
Average fertility rate in Gladeview is 92.0 births per 1,000 women. Women with the education attainment of graduate degree have the highest fertility rate of 500.0 births per 1,000 women, while women with the education attainment of bachelor's degree have the lowest fertility at 5.0 births per 1,000 women. Women with the education attainment of high school diploma represent 39.7% of all women with births.
| Educational Attainment | Women with Births | Births / 1,000 Women |
| Less than High School | 134 (39.4%) | 119.0 |
| High School Diploma | 135 (39.7%) | 134.0 |
| College or Associate's Degree | 28 (8.2%) | 32.0 |
| Bachelor's Degree | 3 (0.9%) | 5.0 |
| Graduate Degree | 40 (11.8%) | 500.0 |
| Total | 340 (100.0%) | 92.0 |
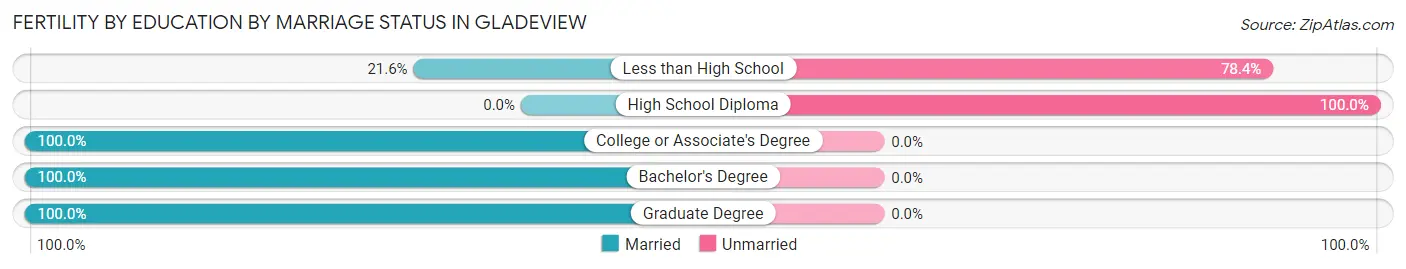
Fertility by Education by Marriage Status in Gladeview
70.6% of women with births in Gladeview are unmarried. Women with the educational attainment of college or associate's degree are most likely to be married with 100.0% of them married at childbirth, while women with the educational attainment of high school diploma are least likely to be married with 100.0% of them unmarried at childbirth.
| Educational Attainment | Married | Unmarried |
| Less than High School | 29 (21.6%) | 105 (78.4%) |
| High School Diploma | 0 (0.0%) | 135 (100.0%) |
| College or Associate's Degree | 28 (100.0%) | 0 (0.0%) |
| Bachelor's Degree | 3 (100.0%) | 0 (0.0%) |
| Graduate Degree | 40 (100.0%) | 0 (0.0%) |
| Total | 100 (29.4%) | 240 (70.6%) |
Employment Characteristics in Gladeview
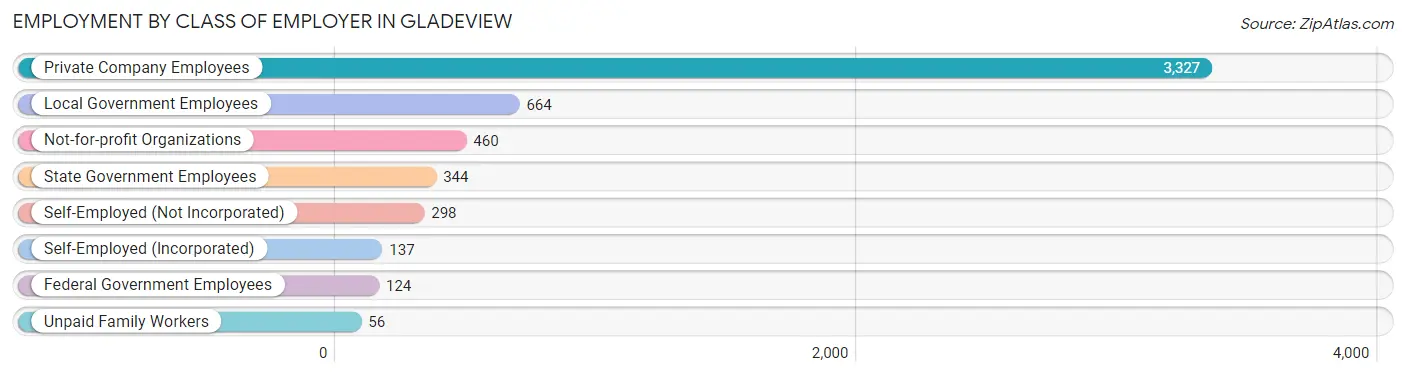
Employment by Class of Employer in Gladeview
Among the 5,410 employed individuals in Gladeview, private company employees (3,327 | 61.5%), local government employees (664 | 12.3%), and not-for-profit organizations (460 | 8.5%) make up the most common classes of employment.
| Employer Class | # Employees | % Employees |
| Private Company Employees | 3,327 | 61.5% |
| Self-Employed (Incorporated) | 137 | 2.5% |
| Self-Employed (Not Incorporated) | 298 | 5.5% |
| Not-for-profit Organizations | 460 | 8.5% |
| Local Government Employees | 664 | 12.3% |
| State Government Employees | 344 | 6.4% |
| Federal Government Employees | 124 | 2.3% |
| Unpaid Family Workers | 56 | 1.0% |
| Total | 5,410 | 100.0% |
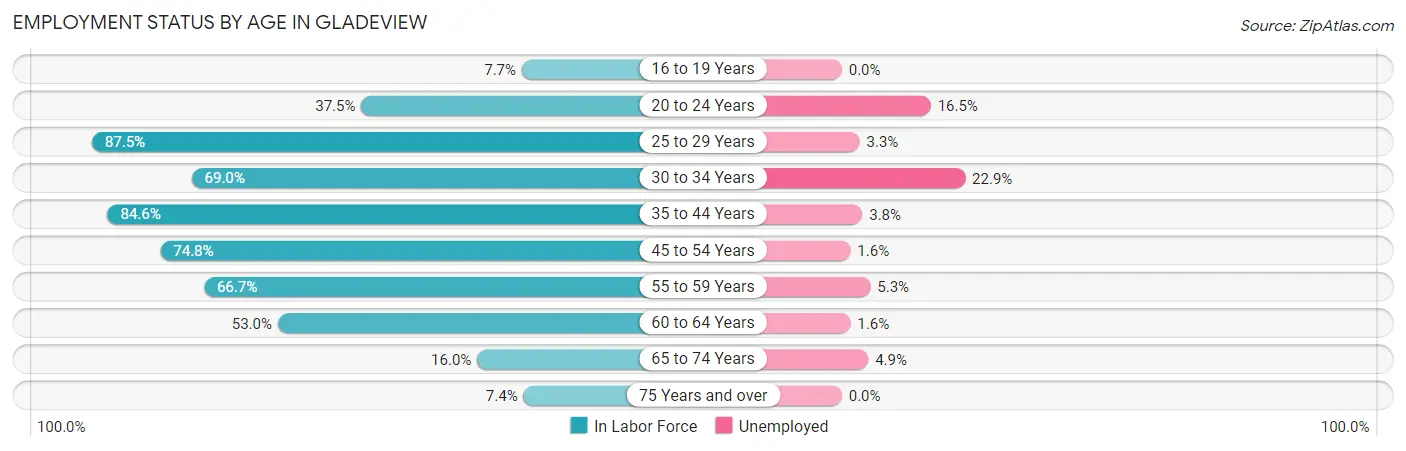
Employment Status by Age in Gladeview
According to the labor force statistics for Gladeview, out of the total population over 16 years of age (10,493), 56.8% or 5,960 individuals are in the labor force, with 6.7% or 399 of them unemployed. The age group with the highest labor force participation rate is 25 to 29 years, with 87.5% or 1,054 individuals in the labor force. Within the labor force, the 30 to 34 years age range has the highest percentage of unemployed individuals, with 22.9% or 192 of them being unemployed.
| Age Bracket | In Labor Force | Unemployed |
| 16 to 19 Years | 68 (7.7%) | 0 (0.0%) |
| 20 to 24 Years | 328 (37.5%) | 54 (16.5%) |
| 25 to 29 Years | 1,054 (87.5%) | 35 (3.3%) |
| 30 to 34 Years | 838 (69.0%) | 192 (22.9%) |
| 35 to 44 Years | 1,695 (84.6%) | 64 (3.8%) |
| 45 to 54 Years | 882 (74.8%) | 14 (1.6%) |
| 55 to 59 Years | 507 (66.7%) | 27 (5.3%) |
| 60 to 64 Years | 382 (53.0%) | 6 (1.6%) |
| 65 to 74 Years | 162 (16.0%) | 8 (4.9%) |
| 75 Years and over | 48 (7.4%) | 0 (0.0%) |
| Total | 5,960 (56.8%) | 399 (6.7%) |
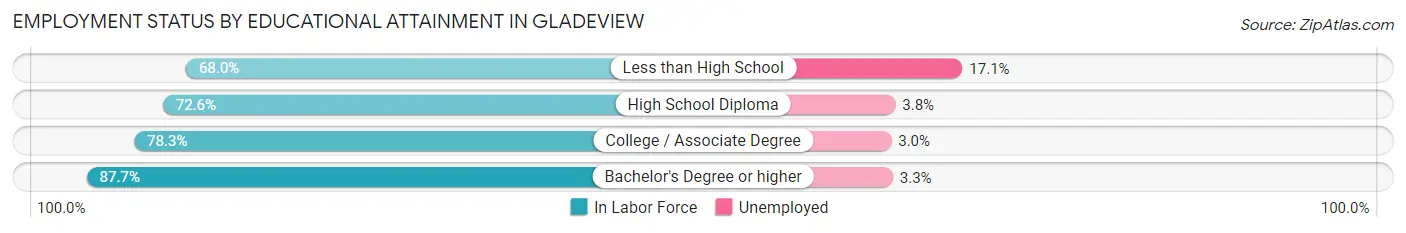
Employment Status by Educational Attainment in Gladeview
According to labor force statistics for Gladeview, 75.7% of individuals (5,361) out of the total population between 25 and 64 years of age (7,082) are in the labor force, with 6.3% or 338 of them being unemployed. The group with the highest labor force participation rate are those with the educational attainment of bachelor's degree or higher, with 87.7% or 1,125 individuals in the labor force. Within the labor force, individuals with less than high school education have the highest percentage of unemployment, with 17.1% or 198 of them being unemployed.
| Educational Attainment | In Labor Force | Unemployed |
| Less than High School | 1,155 (68.0%) | 291 (17.1%) |
| High School Diploma | 1,692 (72.6%) | 89 (3.8%) |
| College / Associate Degree | 1,386 (78.3%) | 53 (3.0%) |
| Bachelor's Degree or higher | 1,125 (87.7%) | 42 (3.3%) |
| Total | 5,361 (75.7%) | 446 (6.3%) |
Employment Occupations by Sex in Gladeview
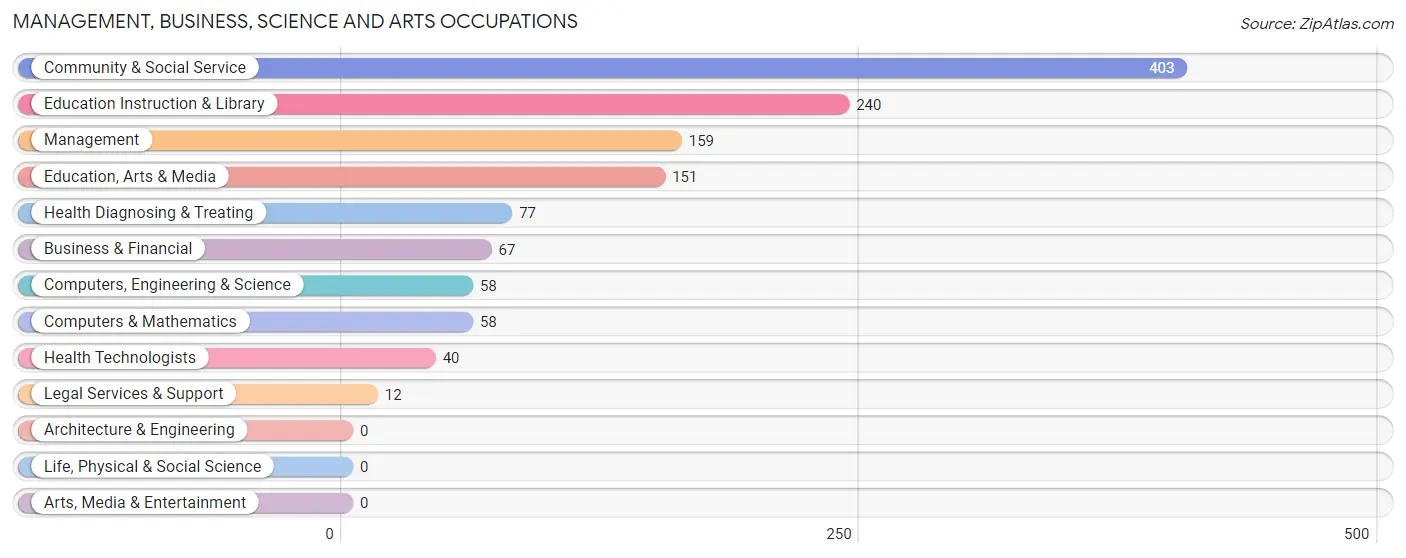
Management, Business, Science and Arts Occupations
The most common Management, Business, Science and Arts occupations in Gladeview are Community & Social Service (403 | 7.2%), Education Instruction & Library (240 | 4.3%), Management (159 | 2.9%), Education, Arts & Media (151 | 2.7%), and Health Diagnosing & Treating (77 | 1.4%).
Management, Business, Science and Arts Occupations by Sex
Within the Management, Business, Science and Arts occupations in Gladeview, the most male-oriented occupations are Computers, Engineering & Science (100.0%), Computers & Mathematics (100.0%), and Legal Services & Support (100.0%), while the most female-oriented occupations are Health Diagnosing & Treating (100.0%), Health Technologists (100.0%), and Education, Arts & Media (90.1%).
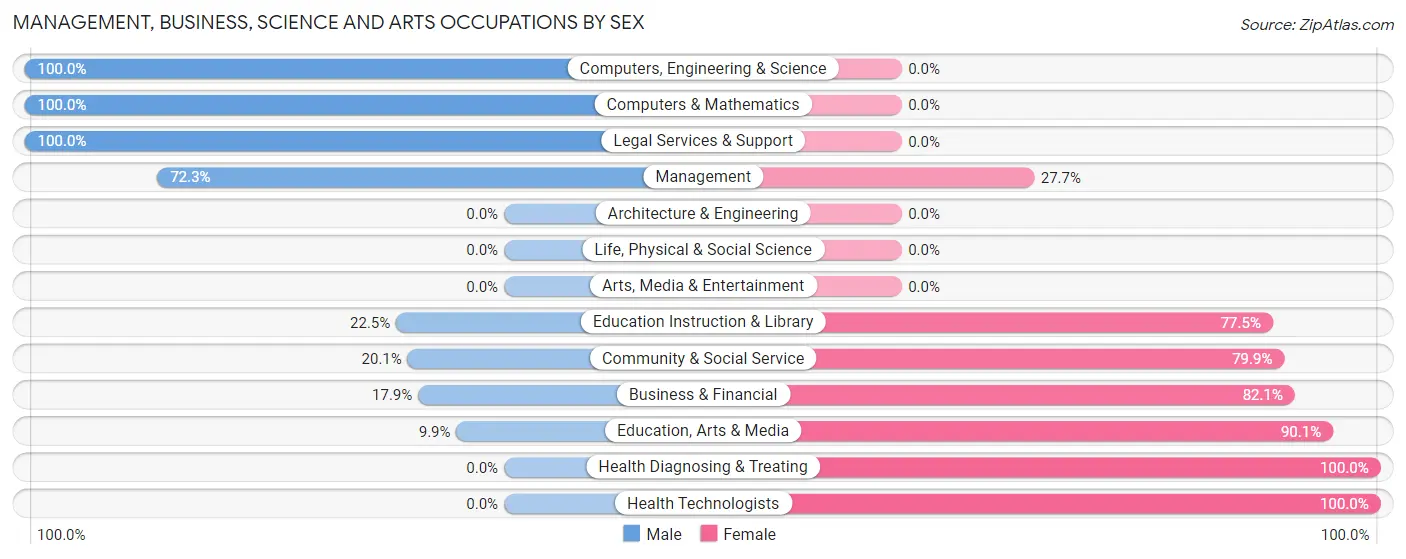
| Occupation | Male | Female |
| Management | 115 (72.3%) | 44 (27.7%) |
| Business & Financial | 12 (17.9%) | 55 (82.1%) |
| Computers, Engineering & Science | 58 (100.0%) | 0 (0.0%) |
| Computers & Mathematics | 58 (100.0%) | 0 (0.0%) |
| Architecture & Engineering | 0 (0.0%) | 0 (0.0%) |
| Life, Physical & Social Science | 0 (0.0%) | 0 (0.0%) |
| Community & Social Service | 81 (20.1%) | 322 (79.9%) |
| Education, Arts & Media | 15 (9.9%) | 136 (90.1%) |
| Legal Services & Support | 12 (100.0%) | 0 (0.0%) |
| Education Instruction & Library | 54 (22.5%) | 186 (77.5%) |
| Arts, Media & Entertainment | 0 (0.0%) | 0 (0.0%) |
| Health Diagnosing & Treating | 0 (0.0%) | 77 (100.0%) |
| Health Technologists | 0 (0.0%) | 40 (100.0%) |
| Total (Category) | 266 (34.8%) | 498 (65.2%) |
| Total (Overall) | 2,558 (46.0%) | 3,005 (54.0%) |
Services Occupations
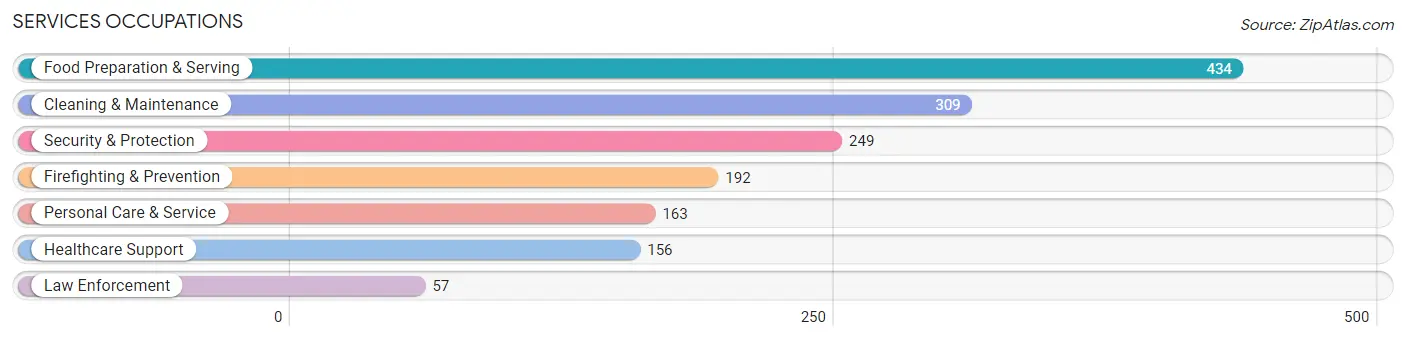
The most common Services occupations in Gladeview are Food Preparation & Serving (434 | 7.8%), Cleaning & Maintenance (309 | 5.6%), Security & Protection (249 | 4.5%), Firefighting & Prevention (192 | 3.5%), and Personal Care & Service (163 | 2.9%).
Services Occupations by Sex
Within the Services occupations in Gladeview, the most male-oriented occupations are Firefighting & Prevention (82.8%), Security & Protection (63.9%), and Food Preparation & Serving (45.2%), while the most female-oriented occupations are Healthcare Support (100.0%), Law Enforcement (100.0%), and Personal Care & Service (93.9%).
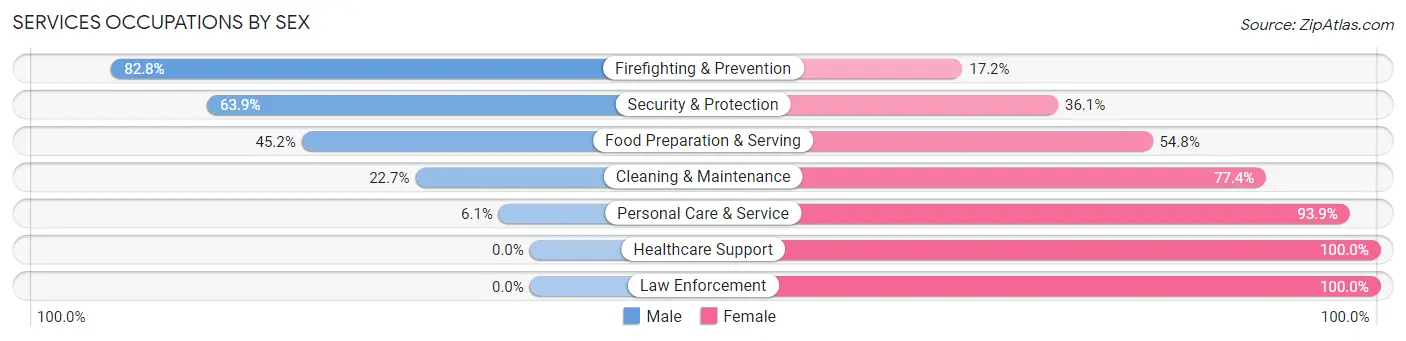
| Occupation | Male | Female |
| Healthcare Support | 0 (0.0%) | 156 (100.0%) |
| Security & Protection | 159 (63.9%) | 90 (36.1%) |
| Firefighting & Prevention | 159 (82.8%) | 33 (17.2%) |
| Law Enforcement | 0 (0.0%) | 57 (100.0%) |
| Food Preparation & Serving | 196 (45.2%) | 238 (54.8%) |
| Cleaning & Maintenance | 70 (22.7%) | 239 (77.3%) |
| Personal Care & Service | 10 (6.1%) | 153 (93.9%) |
| Total (Category) | 435 (33.2%) | 876 (66.8%) |
| Total (Overall) | 2,558 (46.0%) | 3,005 (54.0%) |
Sales and Office Occupations
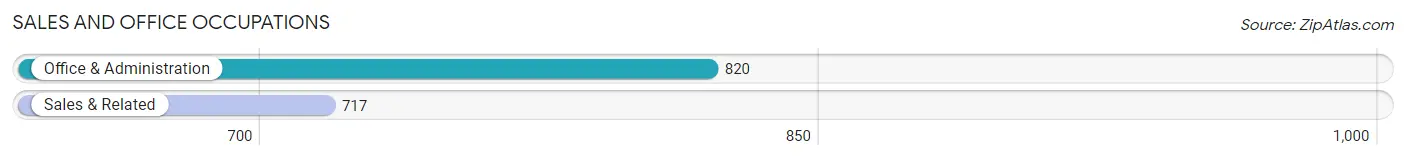
The most common Sales and Office occupations in Gladeview are Office & Administration (820 | 14.7%), and Sales & Related (717 | 12.9%).
Sales and Office Occupations by Sex
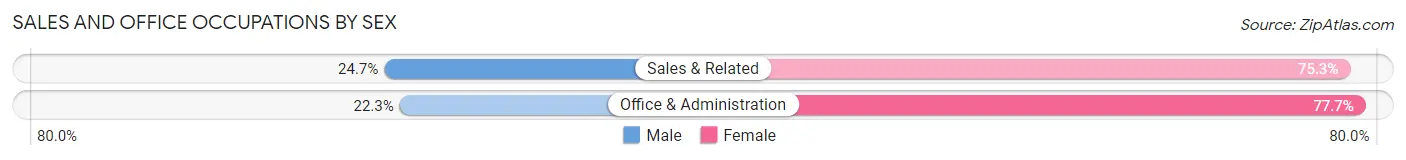
| Occupation | Male | Female |
| Sales & Related | 177 (24.7%) | 540 (75.3%) |
| Office & Administration | 183 (22.3%) | 637 (77.7%) |
| Total (Category) | 360 (23.4%) | 1,177 (76.6%) |
| Total (Overall) | 2,558 (46.0%) | 3,005 (54.0%) |
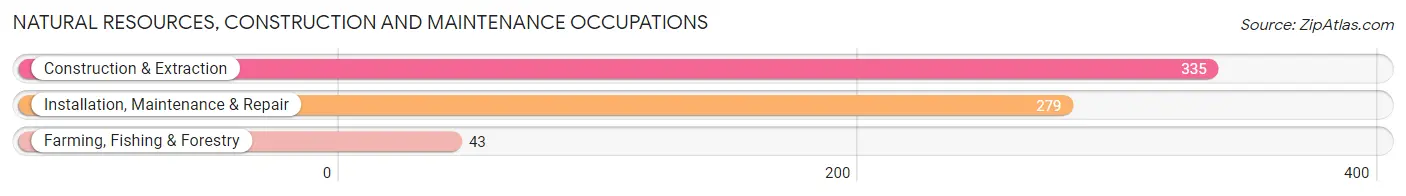
Natural Resources, Construction and Maintenance Occupations
The most common Natural Resources, Construction and Maintenance occupations in Gladeview are Construction & Extraction (335 | 6.0%), Installation, Maintenance & Repair (279 | 5.0%), and Farming, Fishing & Forestry (43 | 0.8%).
Natural Resources, Construction and Maintenance Occupations by Sex
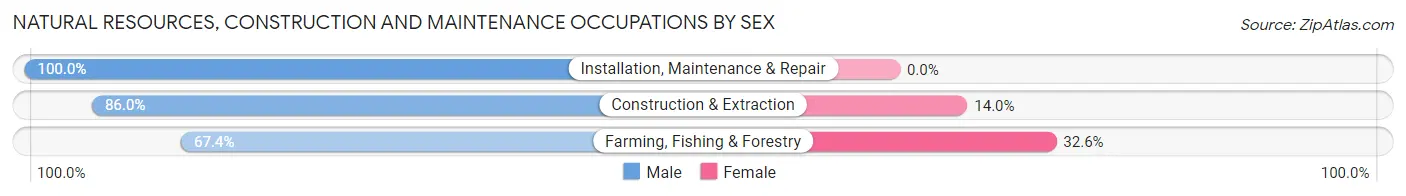
| Occupation | Male | Female |
| Farming, Fishing & Forestry | 29 (67.4%) | 14 (32.6%) |
| Construction & Extraction | 288 (86.0%) | 47 (14.0%) |
| Installation, Maintenance & Repair | 279 (100.0%) | 0 (0.0%) |
| Total (Category) | 596 (90.7%) | 61 (9.3%) |
| Total (Overall) | 2,558 (46.0%) | 3,005 (54.0%) |
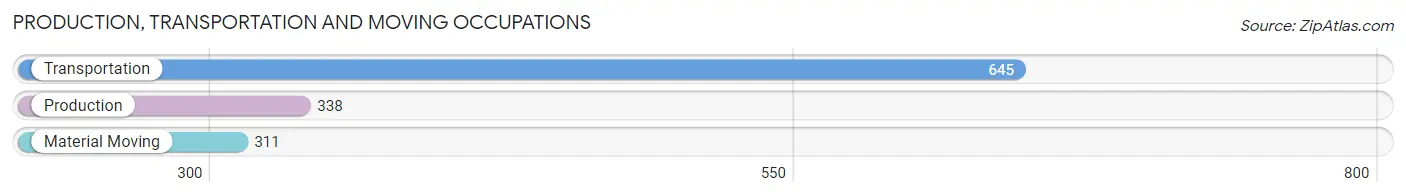
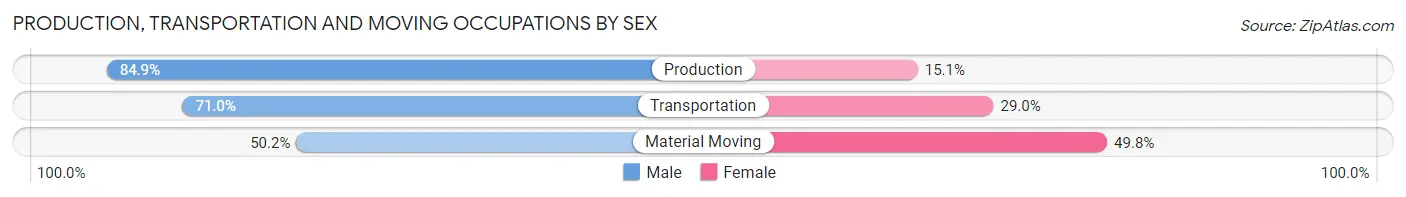
Production, Transportation and Moving Occupations
The most common Production, Transportation and Moving occupations in Gladeview are Transportation (645 | 11.6%), Production (338 | 6.1%), and Material Moving (311 | 5.6%).
Production, Transportation and Moving Occupations by Sex
| Occupation | Male | Female |
| Production | 287 (84.9%) | 51 (15.1%) |
| Transportation | 458 (71.0%) | 187 (29.0%) |
| Material Moving | 156 (50.2%) | 155 (49.8%) |
| Total (Category) | 901 (69.6%) | 393 (30.4%) |
| Total (Overall) | 2,558 (46.0%) | 3,005 (54.0%) |
Employment Industries by Sex in Gladeview
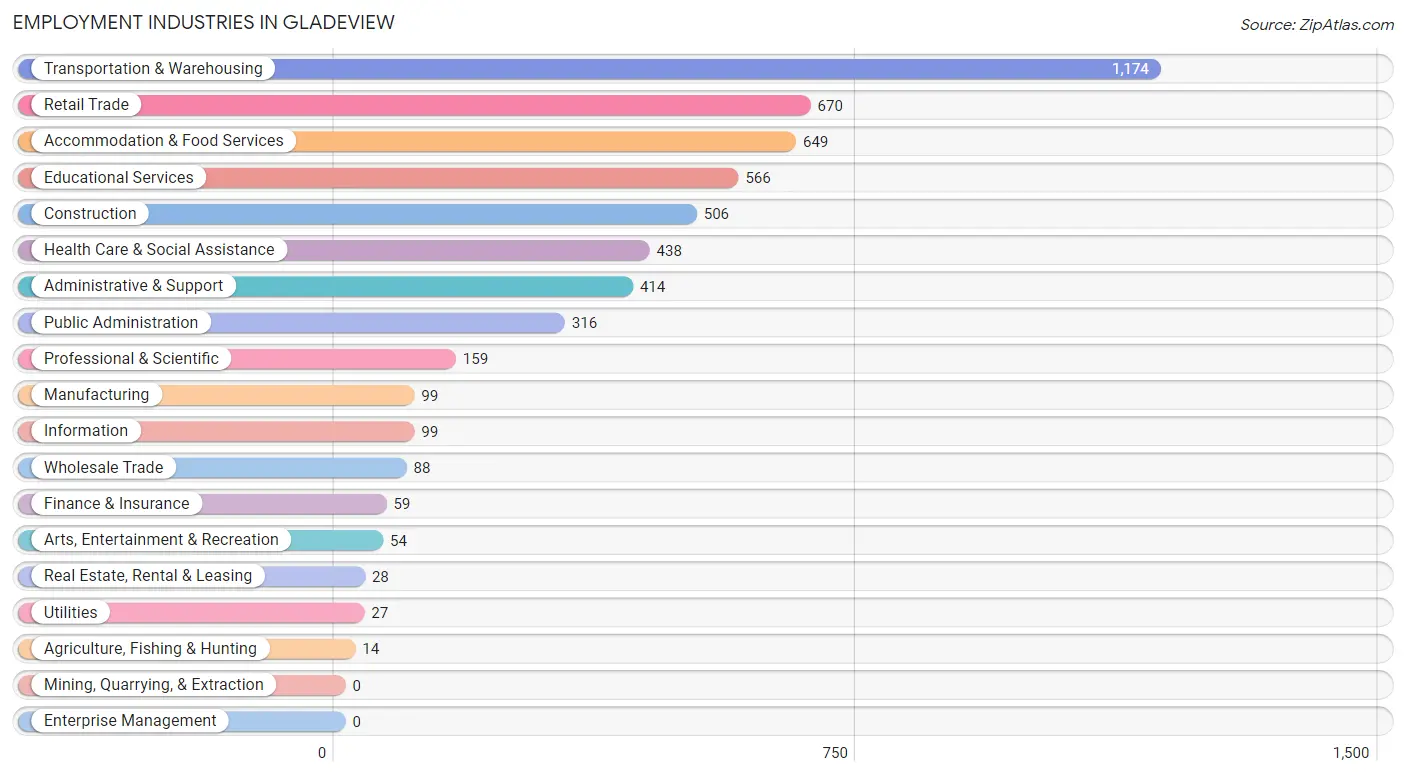
Employment Industries in Gladeview
The major employment industries in Gladeview include Transportation & Warehousing (1,174 | 21.1%), Retail Trade (670 | 12.0%), Accommodation & Food Services (649 | 11.7%), Educational Services (566 | 10.2%), and Construction (506 | 9.1%).
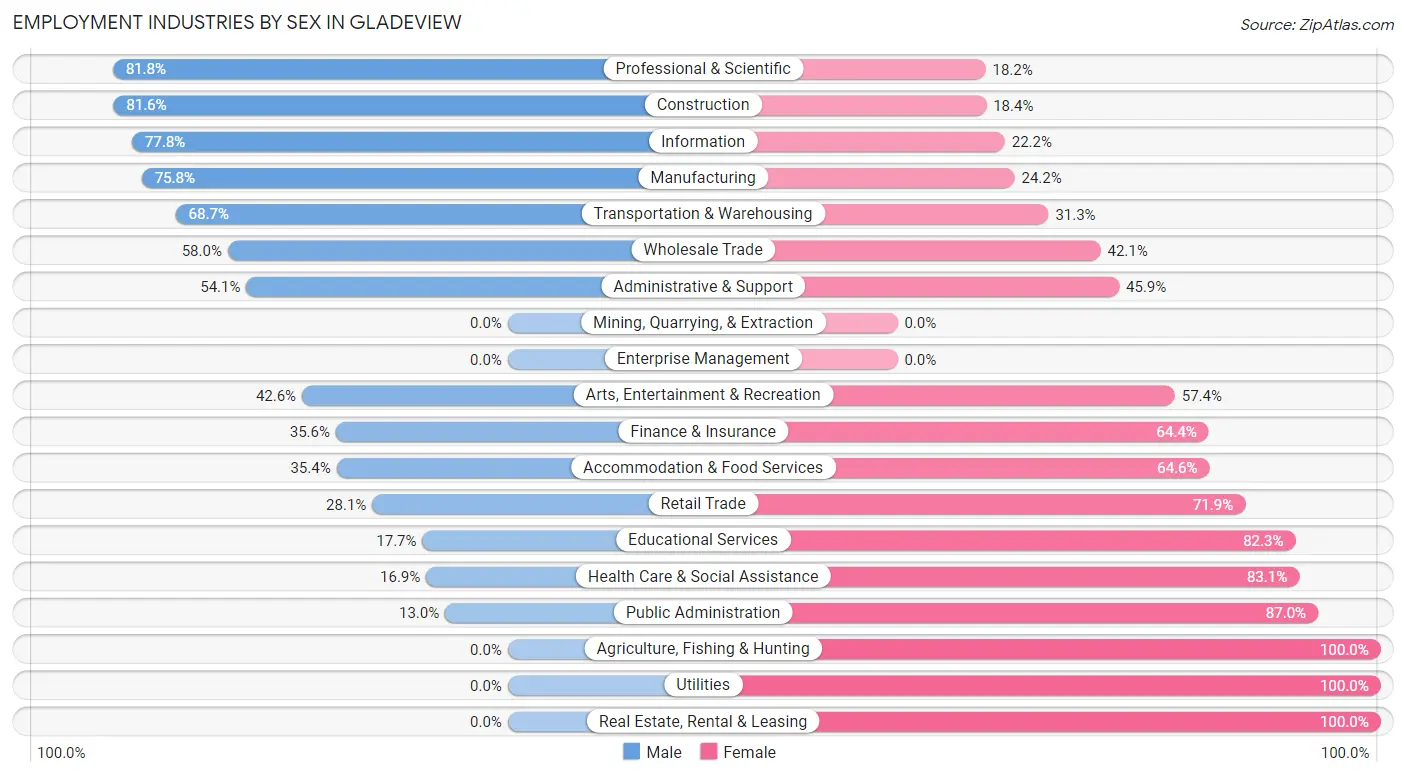
Employment Industries by Sex in Gladeview
The Gladeview industries that see more men than women are Professional & Scientific (81.8%), Construction (81.6%), and Information (77.8%), whereas the industries that tend to have a higher number of women are Agriculture, Fishing & Hunting (100.0%), Utilities (100.0%), and Real Estate, Rental & Leasing (100.0%).
| Industry | Male | Female |
| Agriculture, Fishing & Hunting | 0 (0.0%) | 14 (100.0%) |
| Mining, Quarrying, & Extraction | 0 (0.0%) | 0 (0.0%) |
| Construction | 413 (81.6%) | 93 (18.4%) |
| Manufacturing | 75 (75.8%) | 24 (24.2%) |
| Wholesale Trade | 51 (58.0%) | 37 (42.0%) |
| Retail Trade | 188 (28.1%) | 482 (71.9%) |
| Transportation & Warehousing | 807 (68.7%) | 367 (31.3%) |
| Utilities | 0 (0.0%) | 27 (100.0%) |
| Information | 77 (77.8%) | 22 (22.2%) |
| Finance & Insurance | 21 (35.6%) | 38 (64.4%) |
| Real Estate, Rental & Leasing | 0 (0.0%) | 28 (100.0%) |
| Professional & Scientific | 130 (81.8%) | 29 (18.2%) |
| Enterprise Management | 0 (0.0%) | 0 (0.0%) |
| Administrative & Support | 224 (54.1%) | 190 (45.9%) |
| Educational Services | 100 (17.7%) | 466 (82.3%) |
| Health Care & Social Assistance | 74 (16.9%) | 364 (83.1%) |
| Arts, Entertainment & Recreation | 23 (42.6%) | 31 (57.4%) |
| Accommodation & Food Services | 230 (35.4%) | 419 (64.6%) |
| Public Administration | 41 (13.0%) | 275 (87.0%) |
| Total | 2,558 (46.0%) | 3,005 (54.0%) |
Education in Gladeview
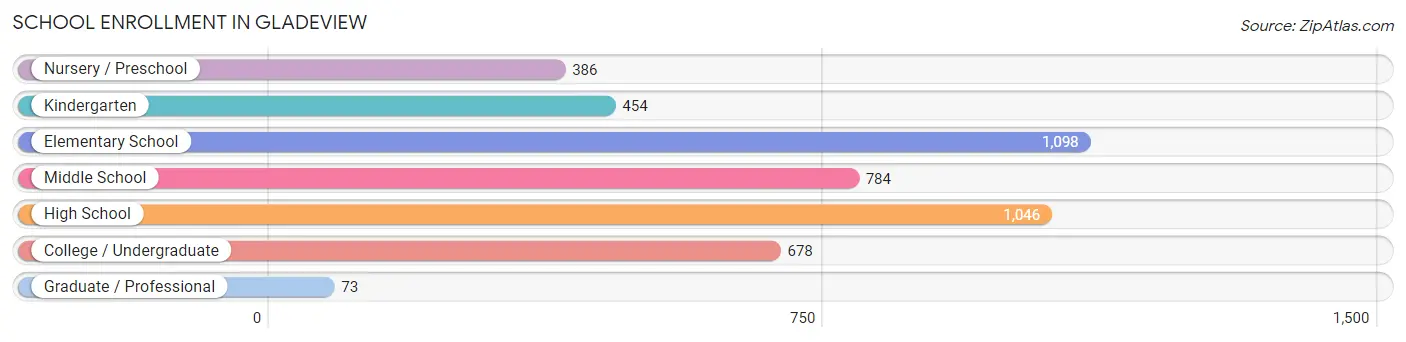
School Enrollment in Gladeview
The most common levels of schooling among the 4,519 students in Gladeview are elementary school (1,098 | 24.3%), high school (1,046 | 23.2%), and middle school (784 | 17.3%).
| School Level | # Students | % Students |
| Nursery / Preschool | 386 | 8.5% |
| Kindergarten | 454 | 10.1% |
| Elementary School | 1,098 | 24.3% |
| Middle School | 784 | 17.3% |
| High School | 1,046 | 23.2% |
| College / Undergraduate | 678 | 15.0% |
| Graduate / Professional | 73 | 1.6% |
| Total | 4,519 | 100.0% |
School Enrollment by Age by Funding Source in Gladeview
Out of a total of 4,519 students who are enrolled in schools in Gladeview, 637 (14.1%) attend a private institution, while the remaining 3,882 (85.9%) are enrolled in public schools. The age group of 35 years and over has the highest likelihood of being enrolled in private schools, with 68 (30.0% in the age bracket) enrolled. Conversely, the age group of 20 to 24 year olds has the lowest likelihood of being enrolled in a private school, with 439 (96.9% in the age bracket) attending a public institution.
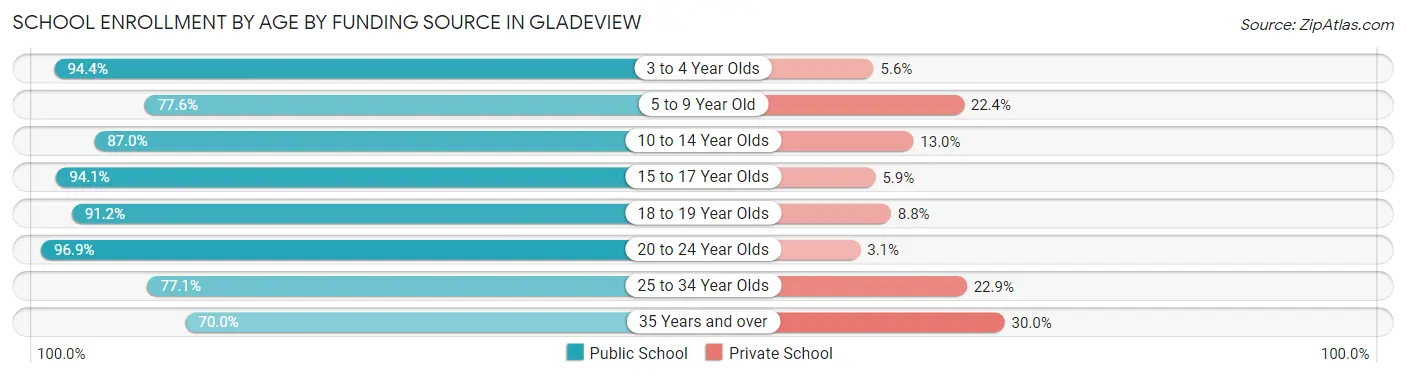
| Age Bracket | Public School | Private School |
| 3 to 4 Year Olds | 339 (94.4%) | 20 (5.6%) |
| 5 to 9 Year Old | 1,096 (77.6%) | 316 (22.4%) |
| 10 to 14 Year Olds | 905 (87.0%) | 135 (13.0%) |
| 15 to 17 Year Olds | 620 (94.1%) | 39 (5.9%) |
| 18 to 19 Year Olds | 249 (91.2%) | 24 (8.8%) |
| 20 to 24 Year Olds | 439 (96.9%) | 14 (3.1%) |
| 25 to 34 Year Olds | 74 (77.1%) | 22 (22.9%) |
| 35 Years and over | 159 (70.0%) | 68 (30.0%) |
| Total | 3,882 (85.9%) | 637 (14.1%) |
Educational Attainment by Field of Study in Gladeview
Science & technology (419 | 29.9%), business (296 | 21.1%), communications (186 | 13.3%), engineering (152 | 10.8%), and arts & humanities (102 | 7.3%) are the most common fields of study among 1,402 individuals in Gladeview who have obtained a bachelor's degree or higher.
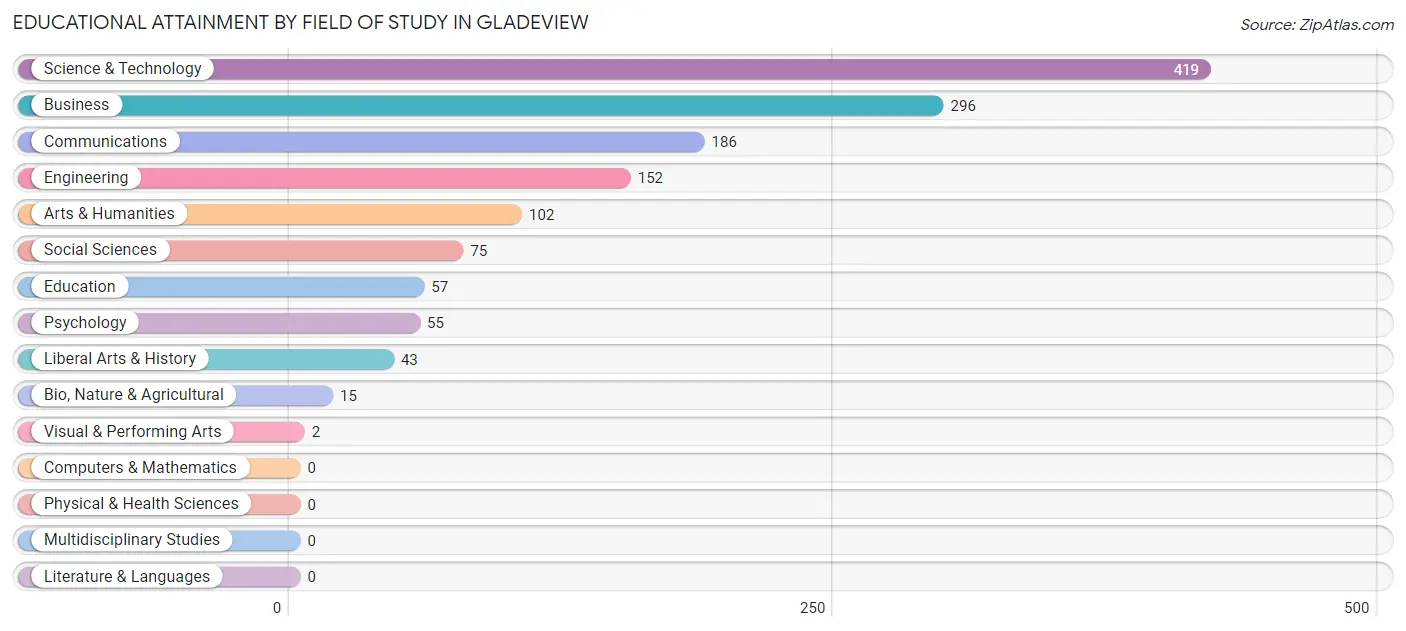
| Field of Study | # Graduates | % Graduates |
| Computers & Mathematics | 0 | 0.0% |
| Bio, Nature & Agricultural | 15 | 1.1% |
| Physical & Health Sciences | 0 | 0.0% |
| Psychology | 55 | 3.9% |
| Social Sciences | 75 | 5.3% |
| Engineering | 152 | 10.8% |
| Multidisciplinary Studies | 0 | 0.0% |
| Science & Technology | 419 | 29.9% |
| Business | 296 | 21.1% |
| Education | 57 | 4.1% |
| Literature & Languages | 0 | 0.0% |
| Liberal Arts & History | 43 | 3.1% |
| Visual & Performing Arts | 2 | 0.1% |
| Communications | 186 | 13.3% |
| Arts & Humanities | 102 | 7.3% |
| Total | 1,402 | 100.0% |
Transportation & Commute in Gladeview
Vehicle Availability by Sex in Gladeview
The most prevalent vehicle ownership categories in Gladeview are males with 2 vehicles (752, accounting for 30.6%) and females with 2 vehicles (763, making up 25.6%).
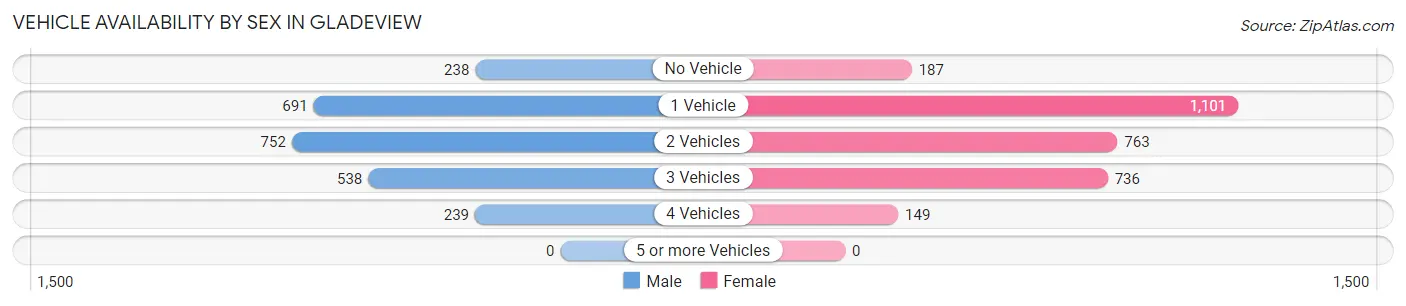
| Vehicles Available | Male | Female |
| No Vehicle | 238 (9.7%) | 187 (6.4%) |
| 1 Vehicle | 691 (28.1%) | 1,101 (37.5%) |
| 2 Vehicles | 752 (30.6%) | 763 (26.0%) |
| 3 Vehicles | 538 (21.9%) | 736 (25.1%) |
| 4 Vehicles | 239 (9.7%) | 149 (5.1%) |
| 5 or more Vehicles | 0 (0.0%) | 0 (0.0%) |
| Total | 2,458 (100.0%) | 2,936 (100.0%) |
Commute Time in Gladeview
The most frequently occuring commute durations in Gladeview are 30 to 34 minutes (1,694 commuters, 32.4%), 15 to 19 minutes (671 commuters, 12.8%), and 45 to 59 minutes (587 commuters, 11.2%).
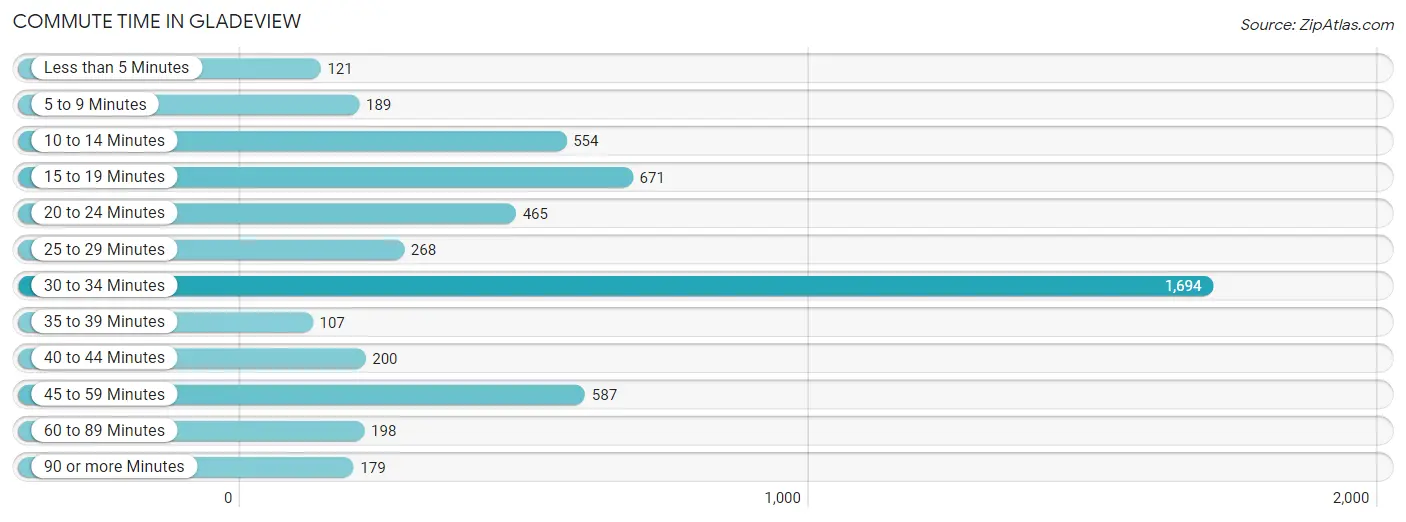
| Commute Time | # Commuters | % Commuters |
| Less than 5 Minutes | 121 | 2.3% |
| 5 to 9 Minutes | 189 | 3.6% |
| 10 to 14 Minutes | 554 | 10.6% |
| 15 to 19 Minutes | 671 | 12.8% |
| 20 to 24 Minutes | 465 | 8.9% |
| 25 to 29 Minutes | 268 | 5.1% |
| 30 to 34 Minutes | 1,694 | 32.4% |
| 35 to 39 Minutes | 107 | 2.0% |
| 40 to 44 Minutes | 200 | 3.8% |
| 45 to 59 Minutes | 587 | 11.2% |
| 60 to 89 Minutes | 198 | 3.8% |
| 90 or more Minutes | 179 | 3.4% |
Commute Time by Sex in Gladeview
The most common commute times in Gladeview are 30 to 34 minutes (874 commuters, 36.5%) for males and 30 to 34 minutes (820 commuters, 28.9%) for females.
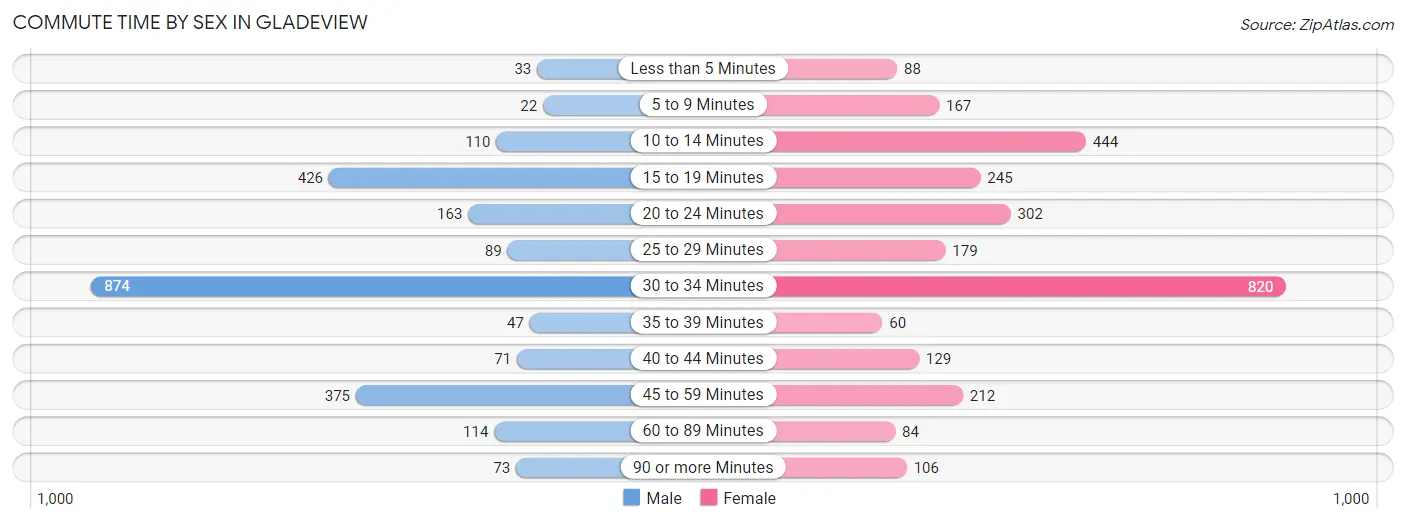
| Commute Time | Male | Female |
| Less than 5 Minutes | 33 (1.4%) | 88 (3.1%) |
| 5 to 9 Minutes | 22 (0.9%) | 167 (5.9%) |
| 10 to 14 Minutes | 110 (4.6%) | 444 (15.7%) |
| 15 to 19 Minutes | 426 (17.8%) | 245 (8.6%) |
| 20 to 24 Minutes | 163 (6.8%) | 302 (10.6%) |
| 25 to 29 Minutes | 89 (3.7%) | 179 (6.3%) |
| 30 to 34 Minutes | 874 (36.5%) | 820 (28.9%) |
| 35 to 39 Minutes | 47 (2.0%) | 60 (2.1%) |
| 40 to 44 Minutes | 71 (3.0%) | 129 (4.5%) |
| 45 to 59 Minutes | 375 (15.6%) | 212 (7.5%) |
| 60 to 89 Minutes | 114 (4.8%) | 84 (3.0%) |
| 90 or more Minutes | 73 (3.0%) | 106 (3.7%) |
Time of Departure to Work by Sex in Gladeview
The most frequent times of departure to work in Gladeview are 8:00 AM to 8:29 AM (637, 26.6%) for males and 8:00 AM to 8:29 AM (549, 19.4%) for females.
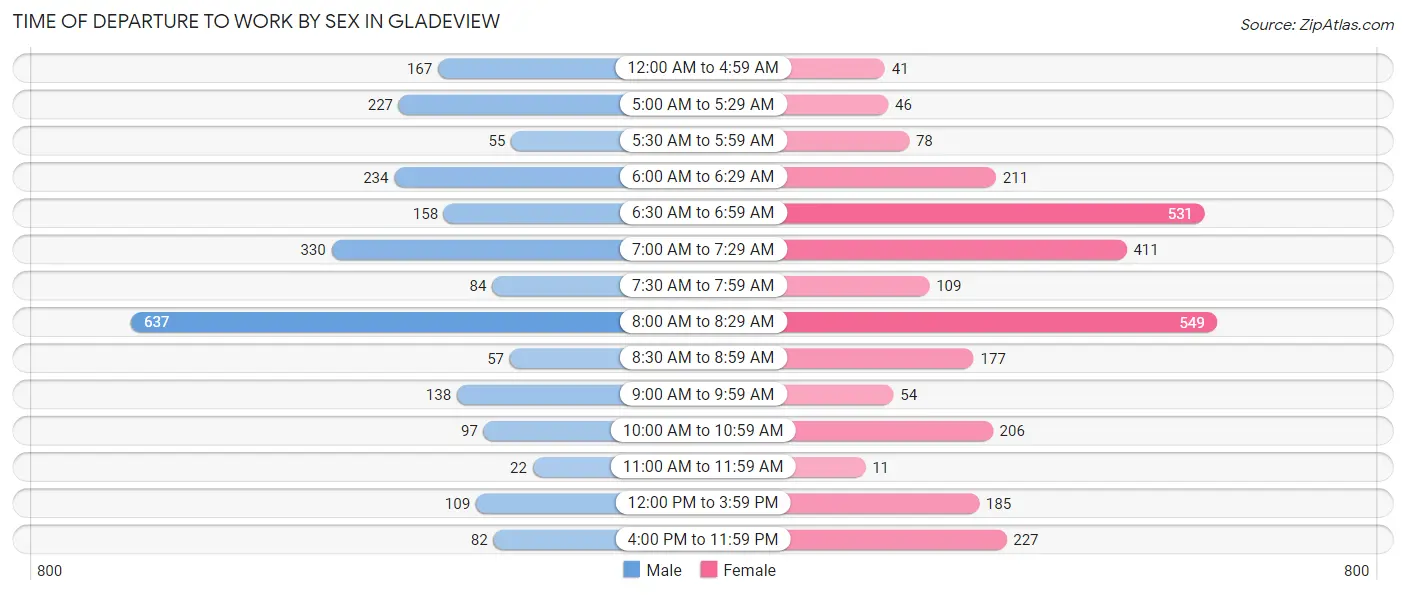
| Time of Departure | Male | Female |
| 12:00 AM to 4:59 AM | 167 (7.0%) | 41 (1.5%) |
| 5:00 AM to 5:29 AM | 227 (9.5%) | 46 (1.6%) |
| 5:30 AM to 5:59 AM | 55 (2.3%) | 78 (2.8%) |
| 6:00 AM to 6:29 AM | 234 (9.8%) | 211 (7.4%) |
| 6:30 AM to 6:59 AM | 158 (6.6%) | 531 (18.7%) |
| 7:00 AM to 7:29 AM | 330 (13.8%) | 411 (14.5%) |
| 7:30 AM to 7:59 AM | 84 (3.5%) | 109 (3.8%) |
| 8:00 AM to 8:29 AM | 637 (26.6%) | 549 (19.4%) |
| 8:30 AM to 8:59 AM | 57 (2.4%) | 177 (6.2%) |
| 9:00 AM to 9:59 AM | 138 (5.8%) | 54 (1.9%) |
| 10:00 AM to 10:59 AM | 97 (4.1%) | 206 (7.3%) |
| 11:00 AM to 11:59 AM | 22 (0.9%) | 11 (0.4%) |
| 12:00 PM to 3:59 PM | 109 (4.5%) | 185 (6.5%) |
| 4:00 PM to 11:59 PM | 82 (3.4%) | 227 (8.0%) |
| Total | 2,397 (100.0%) | 2,836 (100.0%) |
Housing Occupancy in Gladeview
Occupancy by Ownership in Gladeview
Of the total 4,686 dwellings in Gladeview, owner-occupied units account for 1,486 (31.7%), while renter-occupied units make up 3,200 (68.3%).
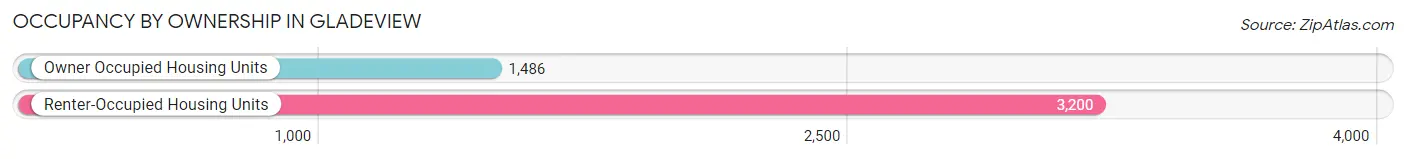
| Occupancy | # Housing Units | % Housing Units |
| Owner Occupied Housing Units | 1,486 | 31.7% |
| Renter-Occupied Housing Units | 3,200 | 68.3% |
| Total Occupied Housing Units | 4,686 | 100.0% |
Occupancy by Household Size in Gladeview
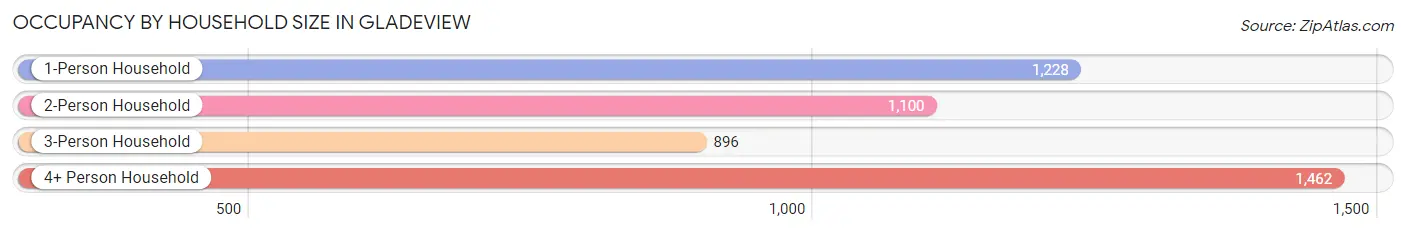
| Household Size | # Housing Units | % Housing Units |
| 1-Person Household | 1,228 | 26.2% |
| 2-Person Household | 1,100 | 23.5% |
| 3-Person Household | 896 | 19.1% |
| 4+ Person Household | 1,462 | 31.2% |
| Total Housing Units | 4,686 | 100.0% |
Occupancy by Ownership by Household Size in Gladeview
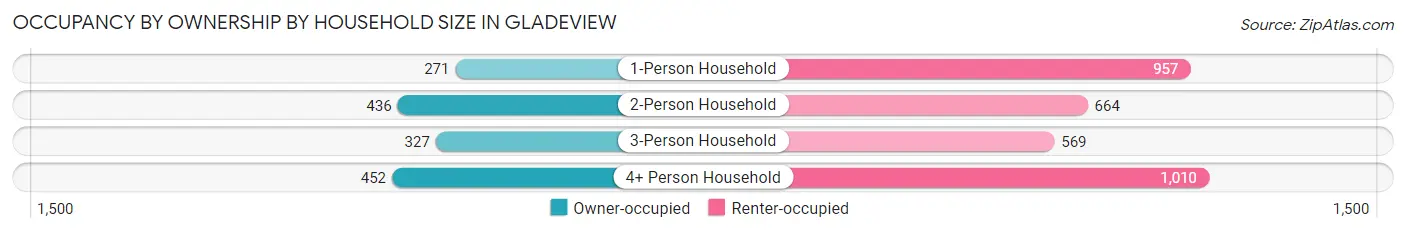
| Household Size | Owner-occupied | Renter-occupied |
| 1-Person Household | 271 (22.1%) | 957 (77.9%) |
| 2-Person Household | 436 (39.6%) | 664 (60.4%) |
| 3-Person Household | 327 (36.5%) | 569 (63.5%) |
| 4+ Person Household | 452 (30.9%) | 1,010 (69.1%) |
| Total Housing Units | 1,486 (31.7%) | 3,200 (68.3%) |
Occupancy by Educational Attainment in Gladeview
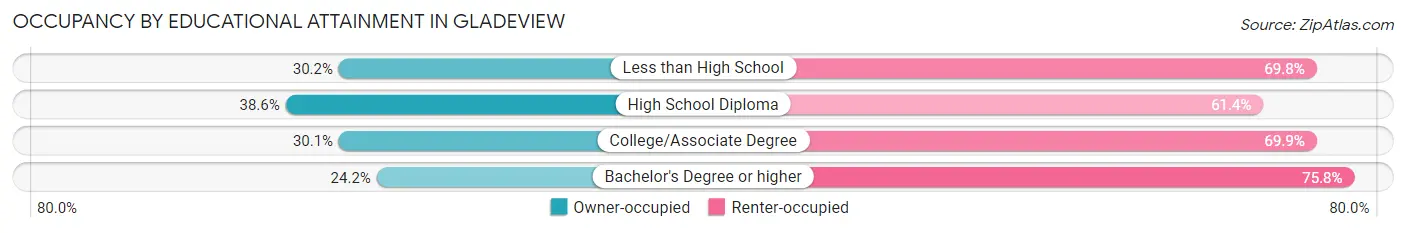
| Household Size | Owner-occupied | Renter-occupied |
| Less than High School | 350 (30.2%) | 810 (69.8%) |
| High School Diploma | 537 (38.6%) | 854 (61.4%) |
| College/Associate Degree | 419 (30.1%) | 971 (69.9%) |
| Bachelor's Degree or higher | 180 (24.2%) | 565 (75.8%) |
Occupancy by Age of Householder in Gladeview
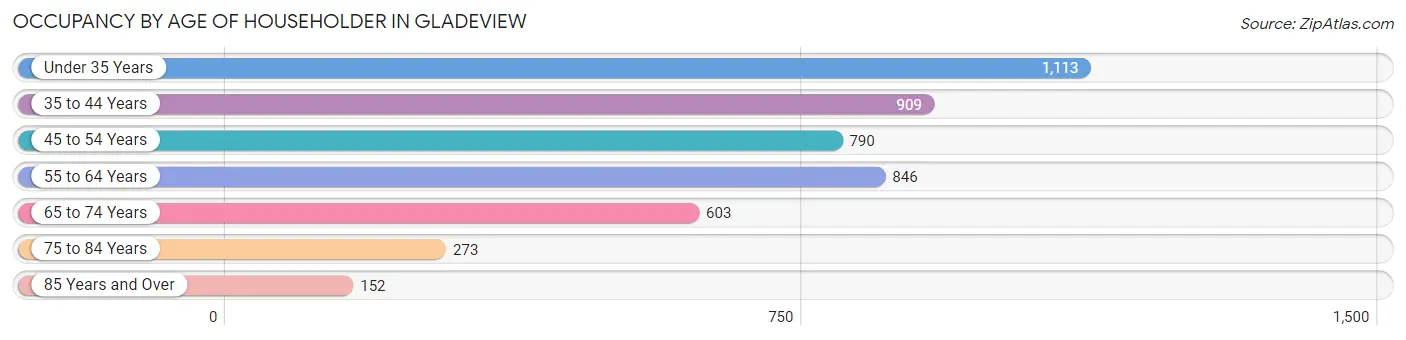
| Age Bracket | # Households | % Households |
| Under 35 Years | 1,113 | 23.7% |
| 35 to 44 Years | 909 | 19.4% |
| 45 to 54 Years | 790 | 16.9% |
| 55 to 64 Years | 846 | 18.0% |
| 65 to 74 Years | 603 | 12.9% |
| 75 to 84 Years | 273 | 5.8% |
| 85 Years and Over | 152 | 3.2% |
| Total | 4,686 | 100.0% |
Housing Finances in Gladeview
Median Income by Occupancy in Gladeview
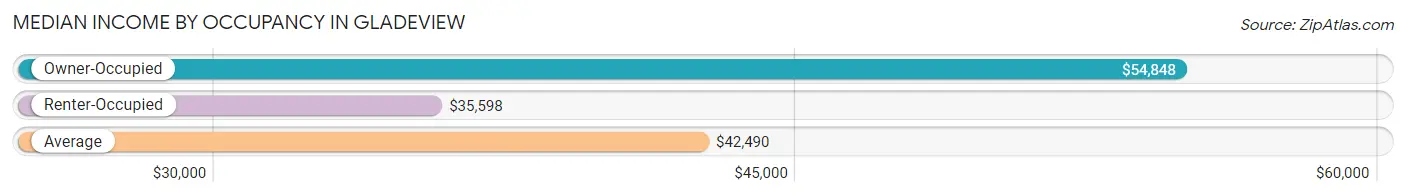
| Occupancy Type | # Households | Median Income |
| Owner-Occupied | 1,486 (31.7%) | $54,848 |
| Renter-Occupied | 3,200 (68.3%) | $35,598 |
| Average | 4,686 (100.0%) | $42,490 |
Occupancy by Householder Income Bracket in Gladeview
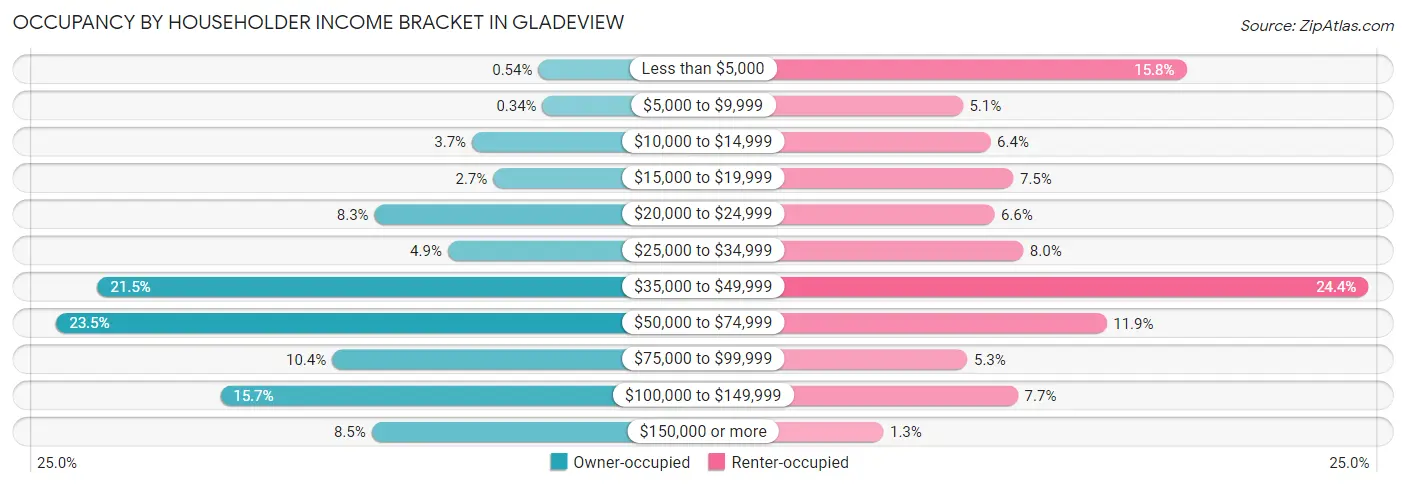
| Income Bracket | Owner-occupied | Renter-occupied |
| Less than $5,000 | 8 (0.5%) | 504 (15.8%) |
| $5,000 to $9,999 | 5 (0.3%) | 163 (5.1%) |
| $10,000 to $14,999 | 55 (3.7%) | 205 (6.4%) |
| $15,000 to $19,999 | 40 (2.7%) | 240 (7.5%) |
| $20,000 to $24,999 | 124 (8.3%) | 211 (6.6%) |
| $25,000 to $34,999 | 72 (4.9%) | 255 (8.0%) |
| $35,000 to $49,999 | 320 (21.5%) | 781 (24.4%) |
| $50,000 to $74,999 | 349 (23.5%) | 382 (11.9%) |
| $75,000 to $99,999 | 154 (10.4%) | 170 (5.3%) |
| $100,000 to $149,999 | 233 (15.7%) | 247 (7.7%) |
| $150,000 or more | 126 (8.5%) | 42 (1.3%) |
| Total | 1,486 (100.0%) | 3,200 (100.0%) |
Monthly Housing Cost Tiers in Gladeview
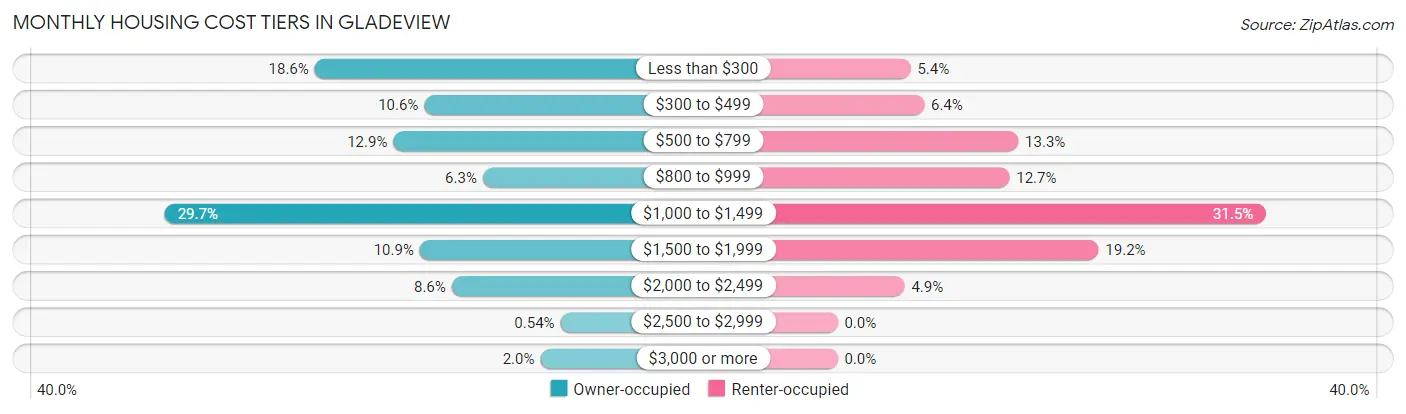
| Monthly Cost | Owner-occupied | Renter-occupied |
| Less than $300 | 277 (18.6%) | 172 (5.4%) |
| $300 to $499 | 157 (10.6%) | 204 (6.4%) |
| $500 to $799 | 191 (12.9%) | 426 (13.3%) |
| $800 to $999 | 93 (6.3%) | 405 (12.7%) |
| $1,000 to $1,499 | 441 (29.7%) | 1,008 (31.5%) |
| $1,500 to $1,999 | 162 (10.9%) | 615 (19.2%) |
| $2,000 to $2,499 | 127 (8.6%) | 158 (4.9%) |
| $2,500 to $2,999 | 8 (0.5%) | 0 (0.0%) |
| $3,000 or more | 30 (2.0%) | 0 (0.0%) |
| Total | 1,486 (100.0%) | 3,200 (100.0%) |
Physical Housing Characteristics in Gladeview
Housing Structures in Gladeview
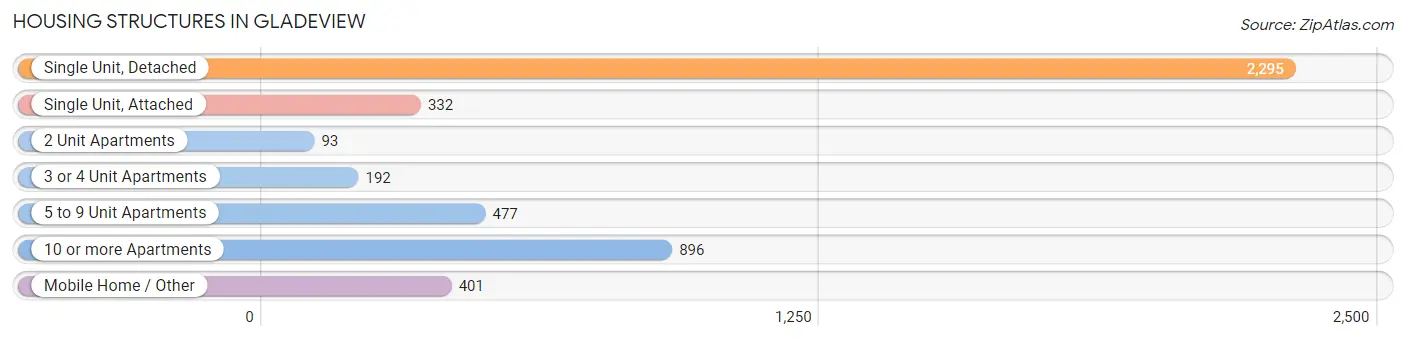
| Structure Type | # Housing Units | % Housing Units |
| Single Unit, Detached | 2,295 | 49.0% |
| Single Unit, Attached | 332 | 7.1% |
| 2 Unit Apartments | 93 | 2.0% |
| 3 or 4 Unit Apartments | 192 | 4.1% |
| 5 to 9 Unit Apartments | 477 | 10.2% |
| 10 or more Apartments | 896 | 19.1% |
| Mobile Home / Other | 401 | 8.6% |
| Total | 4,686 | 100.0% |
Housing Structures by Occupancy in Gladeview
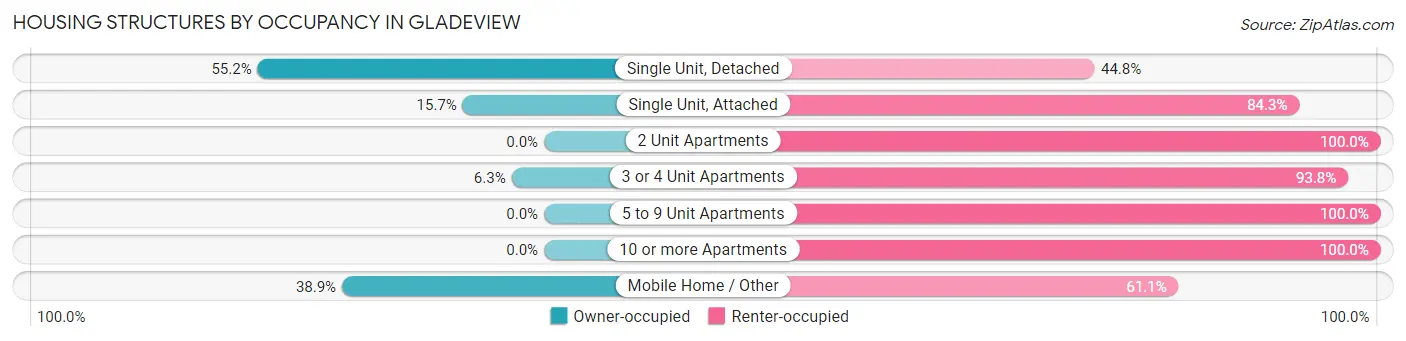
| Structure Type | Owner-occupied | Renter-occupied |
| Single Unit, Detached | 1,266 (55.2%) | 1,029 (44.8%) |
| Single Unit, Attached | 52 (15.7%) | 280 (84.3%) |
| 2 Unit Apartments | 0 (0.0%) | 93 (100.0%) |
| 3 or 4 Unit Apartments | 12 (6.2%) | 180 (93.8%) |
| 5 to 9 Unit Apartments | 0 (0.0%) | 477 (100.0%) |
| 10 or more Apartments | 0 (0.0%) | 896 (100.0%) |
| Mobile Home / Other | 156 (38.9%) | 245 (61.1%) |
| Total | 1,486 (31.7%) | 3,200 (68.3%) |
Housing Structures by Number of Rooms in Gladeview
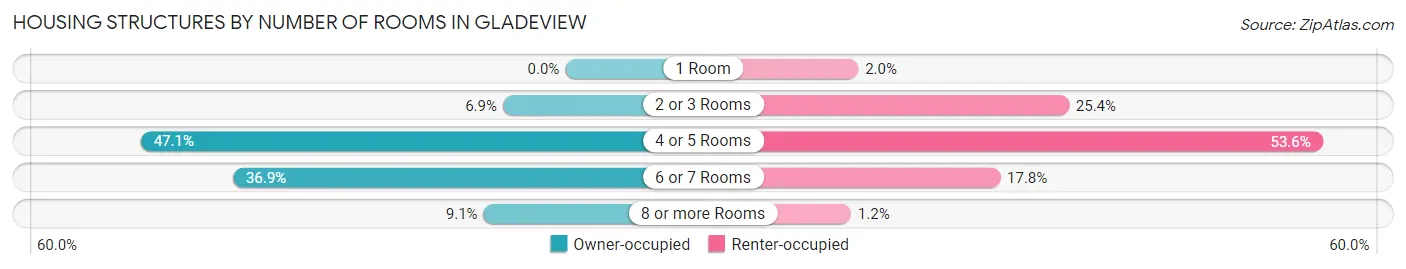
| Number of Rooms | Owner-occupied | Renter-occupied |
| 1 Room | 0 (0.0%) | 65 (2.0%) |
| 2 or 3 Rooms | 103 (6.9%) | 813 (25.4%) |
| 4 or 5 Rooms | 700 (47.1%) | 1,714 (53.6%) |
| 6 or 7 Rooms | 548 (36.9%) | 569 (17.8%) |
| 8 or more Rooms | 135 (9.1%) | 39 (1.2%) |
| Total | 1,486 (100.0%) | 3,200 (100.0%) |
Housing Structure by Heating Type in Gladeview
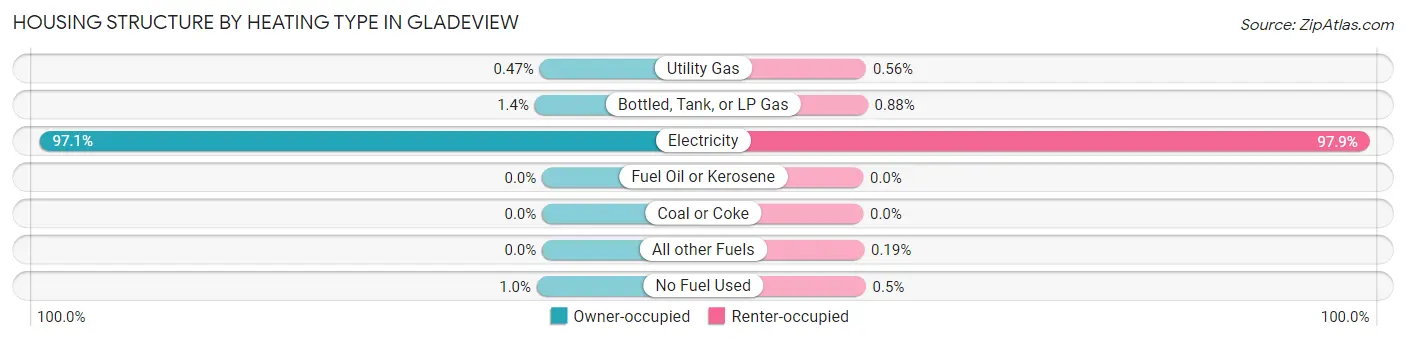
| Heating Type | Owner-occupied | Renter-occupied |
| Utility Gas | 7 (0.5%) | 18 (0.6%) |
| Bottled, Tank, or LP Gas | 21 (1.4%) | 28 (0.9%) |
| Electricity | 1,443 (97.1%) | 3,132 (97.9%) |
| Fuel Oil or Kerosene | 0 (0.0%) | 0 (0.0%) |
| Coal or Coke | 0 (0.0%) | 0 (0.0%) |
| All other Fuels | 0 (0.0%) | 6 (0.2%) |
| No Fuel Used | 15 (1.0%) | 16 (0.5%) |
| Total | 1,486 (100.0%) | 3,200 (100.0%) |
Household Vehicle Usage in Gladeview
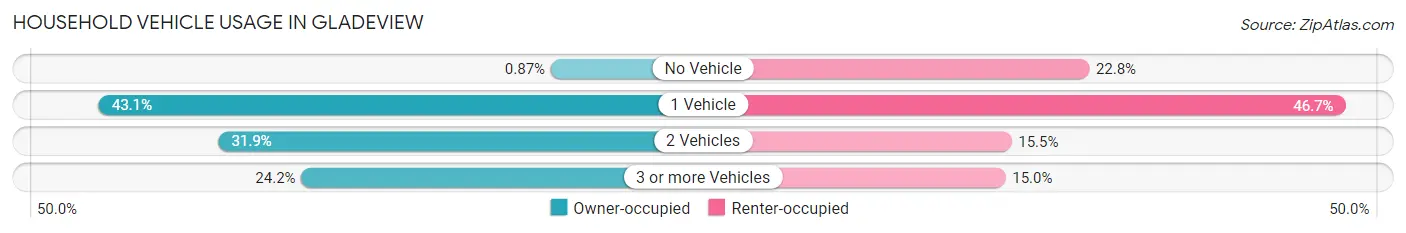
| Vehicles per Household | Owner-occupied | Renter-occupied |
| No Vehicle | 13 (0.9%) | 729 (22.8%) |
| 1 Vehicle | 640 (43.1%) | 1,495 (46.7%) |
| 2 Vehicles | 474 (31.9%) | 497 (15.5%) |
| 3 or more Vehicles | 359 (24.2%) | 479 (15.0%) |
| Total | 1,486 (100.0%) | 3,200 (100.0%) |
Real Estate & Mortgages in Gladeview
Real Estate and Mortgage Overview in Gladeview
| Characteristic | Without Mortgage | With Mortgage |
| Housing Units | 487 | 999 |
| Median Property Value | - | - |
| Median Household Income | $50,664 | $85 |
| Monthly Housing Costs | $249 | $30 |
| Real Estate Taxes | $1,150 | $54 |
Property Value by Mortgage Status in Gladeview
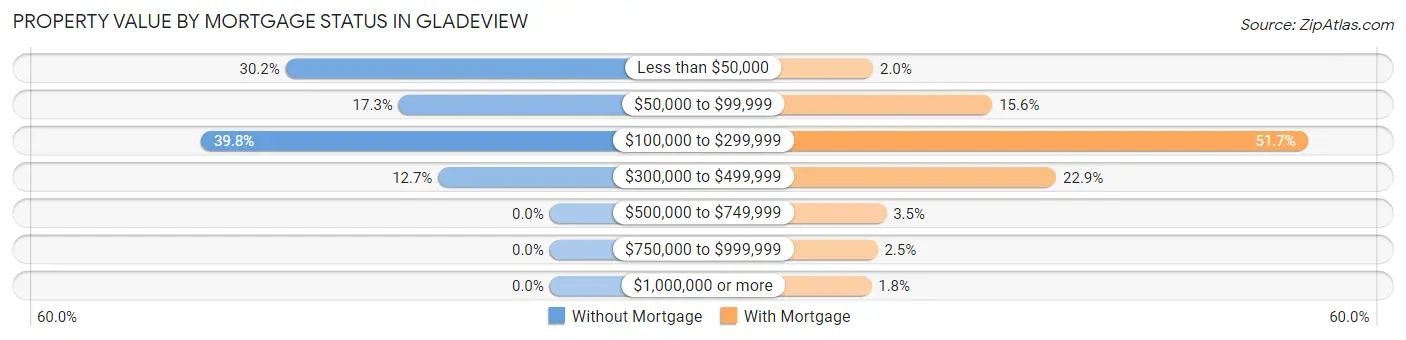
| Property Value | Without Mortgage | With Mortgage |
| Less than $50,000 | 147 (30.2%) | 20 (2.0%) |
| $50,000 to $99,999 | 84 (17.2%) | 156 (15.6%) |
| $100,000 to $299,999 | 194 (39.8%) | 516 (51.6%) |
| $300,000 to $499,999 | 62 (12.7%) | 229 (22.9%) |
| $500,000 to $749,999 | 0 (0.0%) | 35 (3.5%) |
| $750,000 to $999,999 | 0 (0.0%) | 25 (2.5%) |
| $1,000,000 or more | 0 (0.0%) | 18 (1.8%) |
| Total | 487 (100.0%) | 999 (100.0%) |
Household Income by Mortgage Status in Gladeview
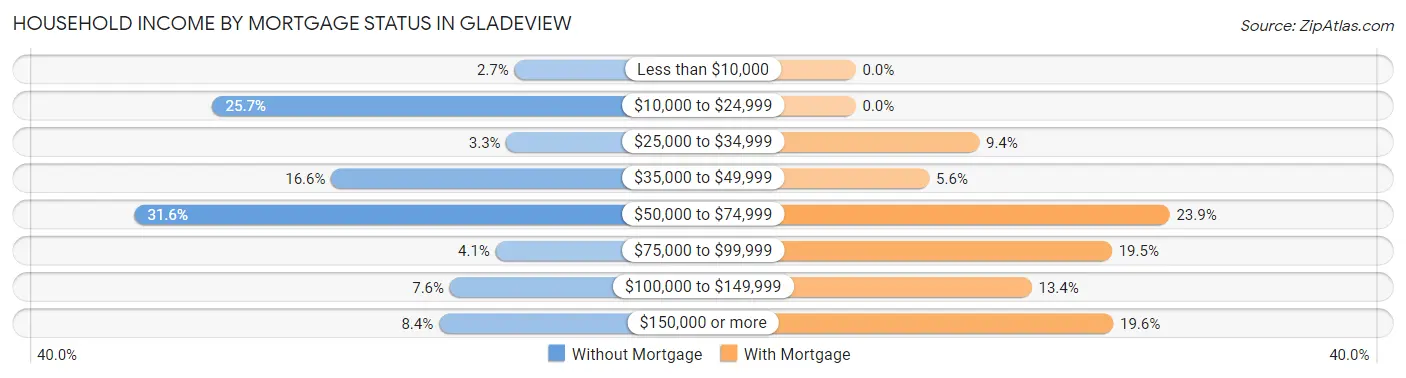
| Household Income | Without Mortgage | With Mortgage |
| Less than $10,000 | 13 (2.7%) | 0 (0.0%) |
| $10,000 to $24,999 | 125 (25.7%) | 0 (0.0%) |
| $25,000 to $34,999 | 16 (3.3%) | 94 (9.4%) |
| $35,000 to $49,999 | 81 (16.6%) | 56 (5.6%) |
| $50,000 to $74,999 | 154 (31.6%) | 239 (23.9%) |
| $75,000 to $99,999 | 20 (4.1%) | 195 (19.5%) |
| $100,000 to $149,999 | 37 (7.6%) | 134 (13.4%) |
| $150,000 or more | 41 (8.4%) | 196 (19.6%) |
| Total | 487 (100.0%) | 999 (100.0%) |
Property Value to Household Income Ratio in Gladeview
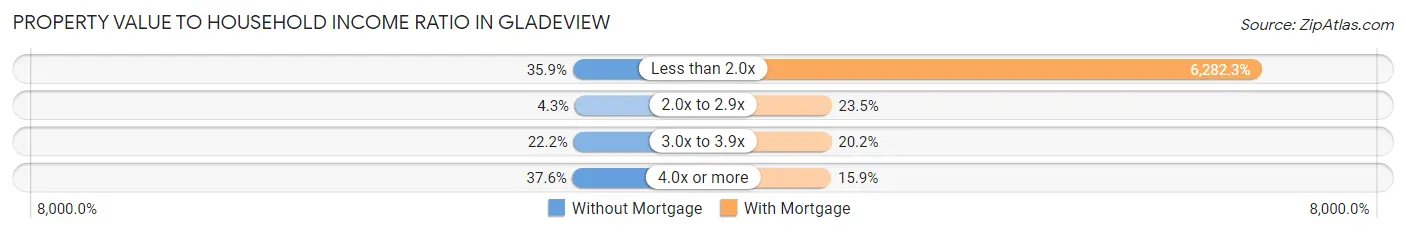
| Value-to-Income Ratio | Without Mortgage | With Mortgage |
| Less than 2.0x | 175 (35.9%) | 62,760 (6,282.3%) |
| 2.0x to 2.9x | 21 (4.3%) | 235 (23.5%) |
| 3.0x to 3.9x | 108 (22.2%) | 202 (20.2%) |
| 4.0x or more | 183 (37.6%) | 159 (15.9%) |
| Total | 487 (100.0%) | 999 (100.0%) |
Real Estate Taxes by Mortgage Status in Gladeview
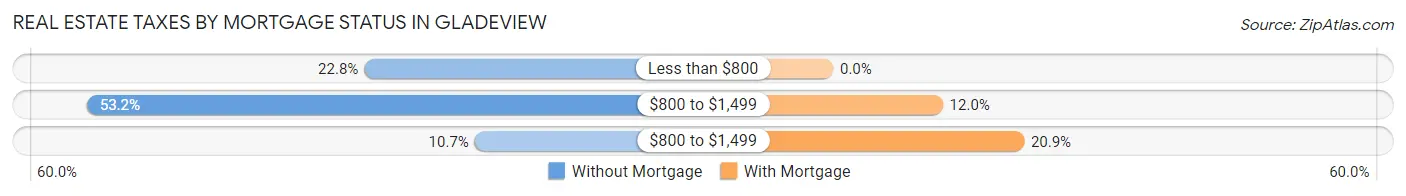
| Property Taxes | Without Mortgage | With Mortgage |
| Less than $800 | 111 (22.8%) | 0 (0.0%) |
| $800 to $1,499 | 259 (53.2%) | 120 (12.0%) |
| $800 to $1,499 | 52 (10.7%) | 209 (20.9%) |
| Total | 487 (100.0%) | 999 (100.0%) |
Health & Disability in Gladeview
Health Insurance Coverage by Age in Gladeview
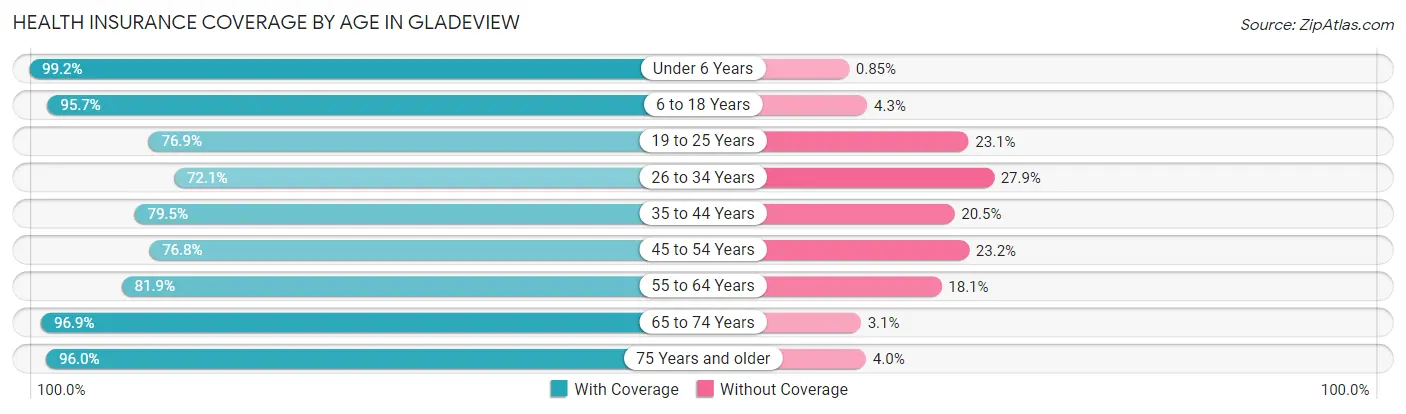
| Age Bracket | With Coverage | Without Coverage |
| Under 6 Years | 1,747 (99.2%) | 15 (0.9%) |
| 6 to 18 Years | 3,056 (95.7%) | 136 (4.3%) |
| 19 to 25 Years | 941 (76.9%) | 283 (23.1%) |
| 26 to 34 Years | 1,587 (72.1%) | 613 (27.9%) |
| 35 to 44 Years | 1,593 (79.5%) | 411 (20.5%) |
| 45 to 54 Years | 905 (76.8%) | 274 (23.2%) |
| 55 to 64 Years | 1,213 (81.9%) | 268 (18.1%) |
| 65 to 74 Years | 980 (96.9%) | 31 (3.1%) |
| 75 Years and older | 619 (96.0%) | 26 (4.0%) |
| Total | 12,641 (86.0%) | 2,057 (14.0%) |
Health Insurance Coverage by Citizenship Status in Gladeview
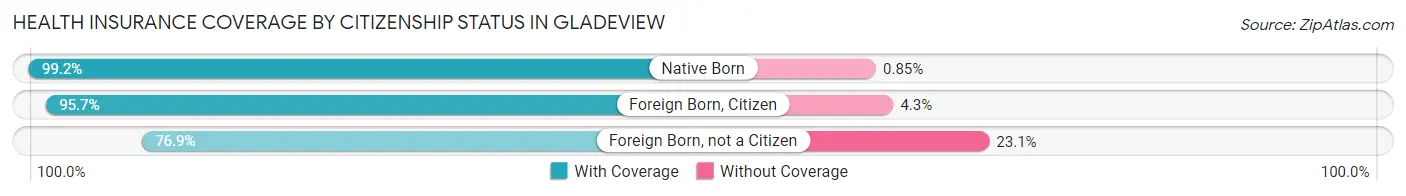
| Citizenship Status | With Coverage | Without Coverage |
| Native Born | 1,747 (99.2%) | 15 (0.9%) |
| Foreign Born, Citizen | 3,056 (95.7%) | 136 (4.3%) |
| Foreign Born, not a Citizen | 941 (76.9%) | 283 (23.1%) |
Health Insurance Coverage by Household Income in Gladeview
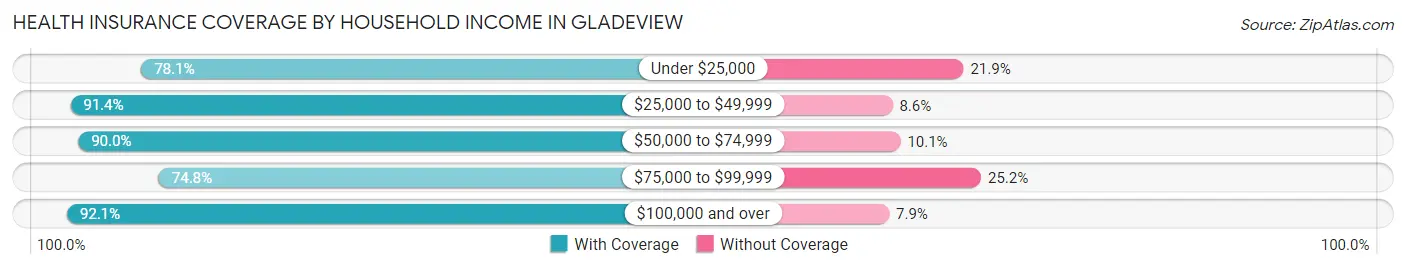
| Household Income | With Coverage | Without Coverage |
| Under $25,000 | 3,325 (78.1%) | 930 (21.9%) |
| $25,000 to $49,999 | 3,698 (91.4%) | 346 (8.6%) |
| $50,000 to $74,999 | 2,237 (89.9%) | 250 (10.1%) |
| $75,000 to $99,999 | 824 (74.8%) | 277 (25.2%) |
| $100,000 and over | 2,523 (92.1%) | 217 (7.9%) |
Public vs Private Health Insurance Coverage by Age in Gladeview
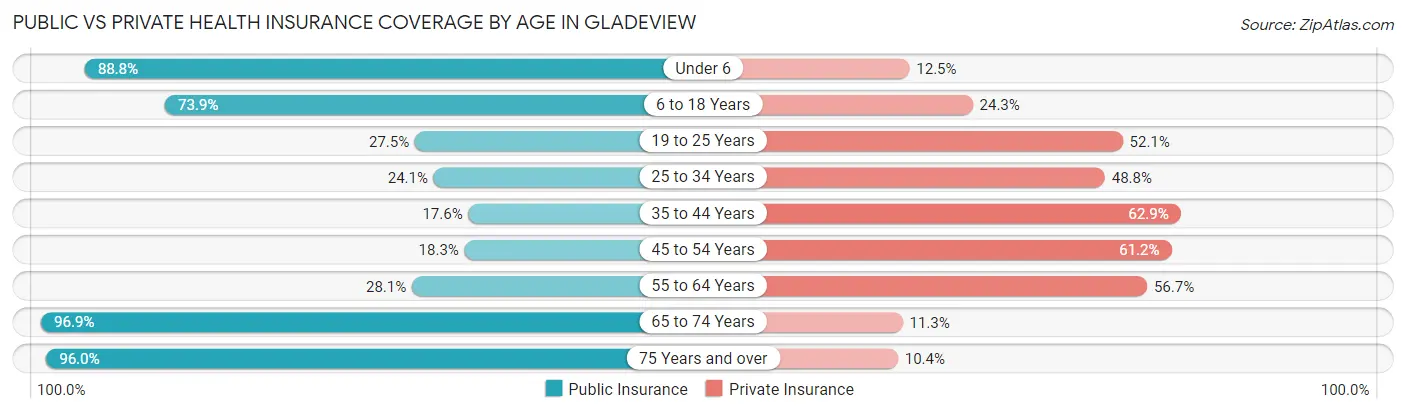
| Age Bracket | Public Insurance | Private Insurance |
| Under 6 | 1,565 (88.8%) | 221 (12.5%) |
| 6 to 18 Years | 2,360 (73.9%) | 775 (24.3%) |
| 19 to 25 Years | 337 (27.5%) | 638 (52.1%) |
| 25 to 34 Years | 529 (24.0%) | 1,074 (48.8%) |
| 35 to 44 Years | 353 (17.6%) | 1,260 (62.9%) |
| 45 to 54 Years | 216 (18.3%) | 721 (61.2%) |
| 55 to 64 Years | 416 (28.1%) | 839 (56.7%) |
| 65 to 74 Years | 980 (96.9%) | 114 (11.3%) |
| 75 Years and over | 619 (96.0%) | 67 (10.4%) |
| Total | 7,375 (50.2%) | 5,709 (38.8%) |
Disability Status by Sex by Age in Gladeview
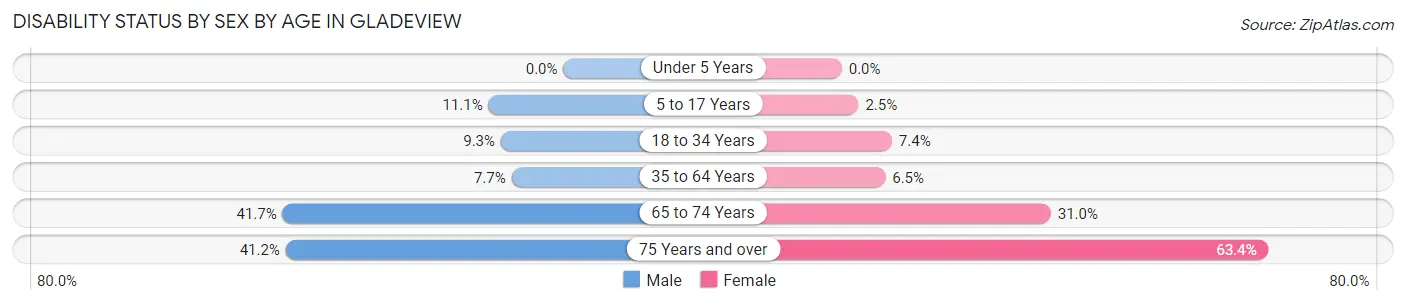
| Age Bracket | Male | Female |
| Under 5 Years | 0 (0.0%) | 0 (0.0%) |
| 5 to 17 Years | 220 (11.1%) | 33 (2.5%) |
| 18 to 34 Years | 149 (9.3%) | 157 (7.4%) |
| 35 to 64 Years | 167 (7.7%) | 161 (6.5%) |
| 65 to 74 Years | 118 (41.7%) | 226 (31.0%) |
| 75 Years and over | 141 (41.2%) | 192 (63.4%) |
Disability Class by Sex by Age in Gladeview
Disability Class: Hearing Difficulty
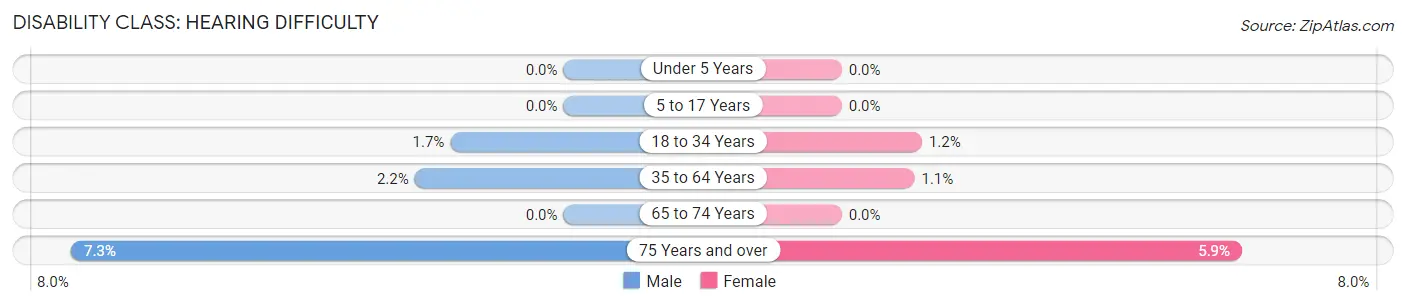
| Age Bracket | Male | Female |
| Under 5 Years | 0 (0.0%) | 0 (0.0%) |
| 5 to 17 Years | 0 (0.0%) | 0 (0.0%) |
| 18 to 34 Years | 27 (1.7%) | 25 (1.2%) |
| 35 to 64 Years | 48 (2.2%) | 27 (1.1%) |
| 65 to 74 Years | 0 (0.0%) | 0 (0.0%) |
| 75 Years and over | 25 (7.3%) | 18 (5.9%) |
Disability Class: Vision Difficulty
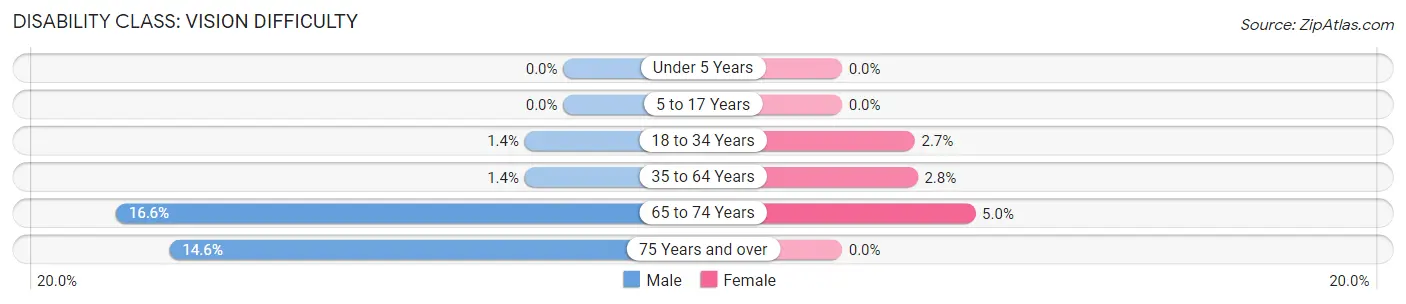
| Age Bracket | Male | Female |
| Under 5 Years | 0 (0.0%) | 0 (0.0%) |
| 5 to 17 Years | 0 (0.0%) | 0 (0.0%) |
| 18 to 34 Years | 23 (1.4%) | 57 (2.7%) |
| 35 to 64 Years | 31 (1.4%) | 70 (2.8%) |
| 65 to 74 Years | 47 (16.6%) | 36 (5.0%) |
| 75 Years and over | 50 (14.6%) | 0 (0.0%) |
Disability Class: Cognitive Difficulty
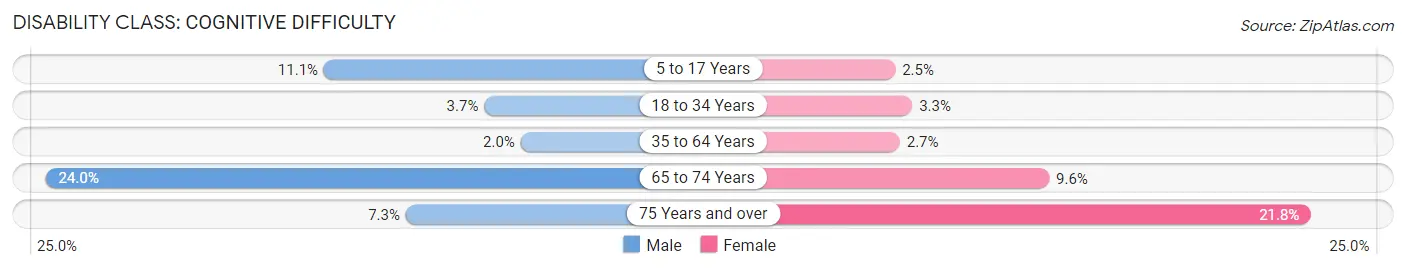
| Age Bracket | Male | Female |
| 5 to 17 Years | 220 (11.1%) | 33 (2.5%) |
| 18 to 34 Years | 59 (3.7%) | 69 (3.3%) |
| 35 to 64 Years | 43 (2.0%) | 67 (2.7%) |
| 65 to 74 Years | 68 (24.0%) | 70 (9.6%) |
| 75 Years and over | 25 (7.3%) | 66 (21.8%) |
Disability Class: Ambulatory Difficulty
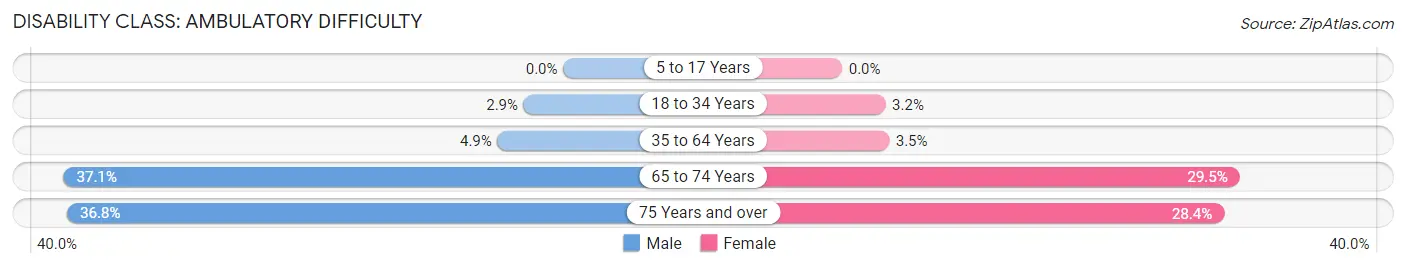
| Age Bracket | Male | Female |
| 5 to 17 Years | 0 (0.0%) | 0 (0.0%) |
| 18 to 34 Years | 47 (2.9%) | 68 (3.2%) |
| 35 to 64 Years | 106 (4.9%) | 87 (3.5%) |
| 65 to 74 Years | 105 (37.1%) | 215 (29.5%) |
| 75 Years and over | 126 (36.8%) | 86 (28.4%) |
Disability Class: Self-Care Difficulty
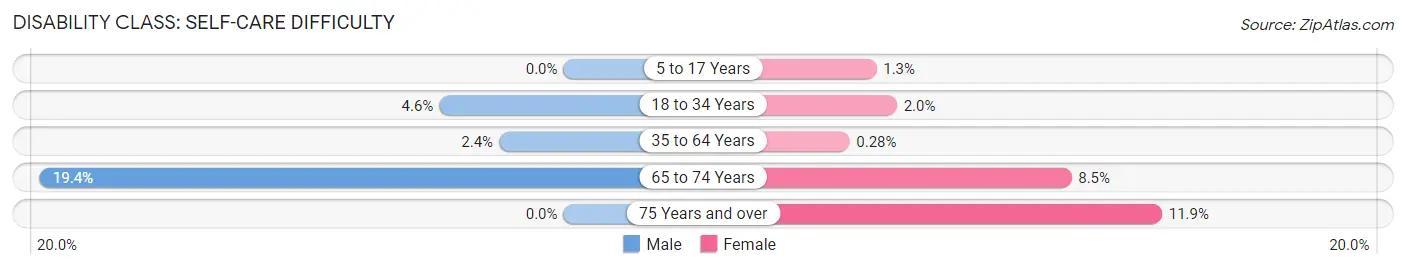
| Age Bracket | Male | Female |
| 5 to 17 Years | 0 (0.0%) | 17 (1.3%) |
| 18 to 34 Years | 74 (4.6%) | 43 (2.0%) |
| 35 to 64 Years | 52 (2.4%) | 7 (0.3%) |
| 65 to 74 Years | 55 (19.4%) | 62 (8.5%) |
| 75 Years and over | 0 (0.0%) | 36 (11.9%) |
Technology Access in Gladeview
Computing Device Access in Gladeview
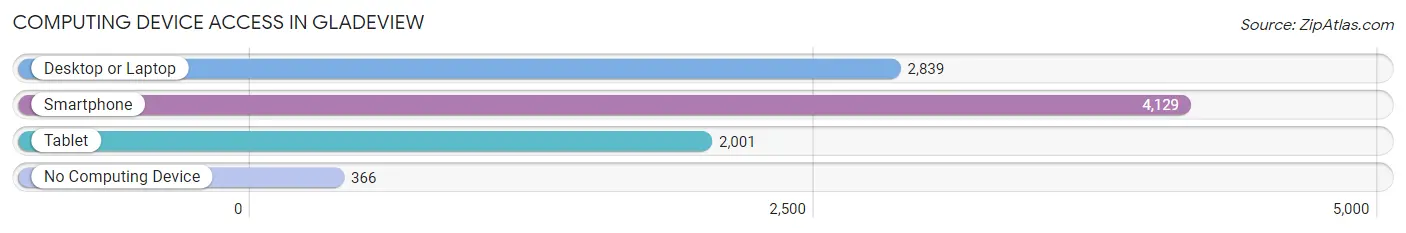
| Device Type | # Households | % Households |
| Desktop or Laptop | 2,839 | 60.6% |
| Smartphone | 4,129 | 88.1% |
| Tablet | 2,001 | 42.7% |
| No Computing Device | 366 | 7.8% |
| Total | 4,686 | 100.0% |
Internet Access in Gladeview
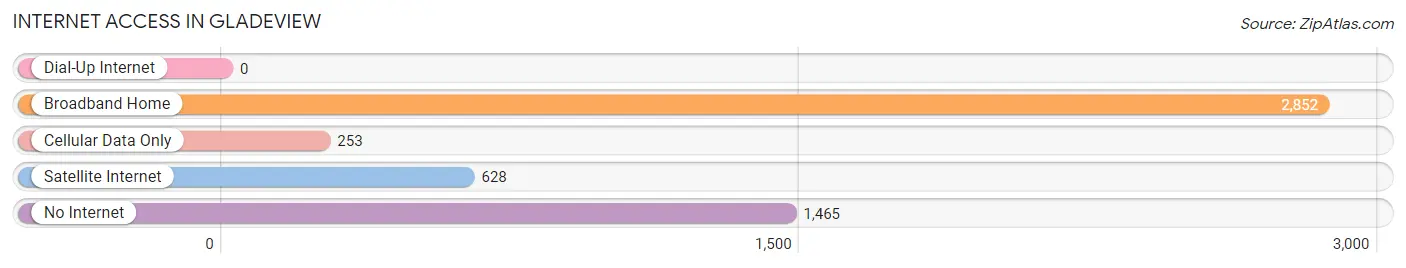
| Internet Type | # Households | % Households |
| Dial-Up Internet | 0 | 0.0% |
| Broadband Home | 2,852 | 60.9% |
| Cellular Data Only | 253 | 5.4% |
| Satellite Internet | 628 | 13.4% |
| No Internet | 1,465 | 31.3% |
| Total | 4,686 | 100.0% |
Gladeview Summary
Gladeview is a census-designated place located in Miami-Dade County, Florida. It is located in the northwest corner of the county, just south of the city of Miami. The population of Gladeview was 8,945 at the 2010 census.
History
Gladeview was originally part of the Everglades, and was first settled in the late 19th century by homesteaders. The area was known as Gladeview because of its proximity to the Everglades. In the early 20th century, the area was developed as a farming community, with the main crops being tomatoes, beans, and peppers. The area was also known for its dairy farms.
In the 1950s, the area began to be developed as a residential community. The first homes were built in the area in the late 1950s and early 1960s. The area was annexed by the City of Miami in 1962.
Geography
Gladeview is located in the northwest corner of Miami-Dade County, just south of the city of Miami. It is bordered by the cities of Miami Gardens to the north, Miami Lakes to the east, and Westview to the south. The area is mostly flat, with an elevation of about 10 feet above sea level.
Economy
The economy of Gladeview is largely based on service industries. The area is home to a number of retail stores, restaurants, and other businesses. The area is also home to a number of light industrial businesses.
Demographics
As of the 2010 census, the population of Gladeview was 8,945. The racial makeup of the area was 57.3% White, 28.2% African American, 0.4% Native American, 1.2% Asian, 0.1% Pacific Islander, 10.2% from other races, and 2.8% from two or more races. Hispanic or Latino of any race were 33.2% of the population.
The median income for a household in Gladeview was $35,945, and the median income for a family was $41,945. The per capita income for the area was $17,945. About 17.2% of families and 20.2% of the population were below the poverty line, including 28.2% of those under age 18 and 11.2% of those age 65 or over.
Common Questions
What is Per Capita Income in Gladeview?
Per Capita income in Gladeview is $17,623.
What is the Median Family Income in Gladeview?
Median Family Income in Gladeview is $43,688.
What is the Median Household income in Gladeview?
Median Household Income in Gladeview is $42,490.
What is Income or Wage Gap in Gladeview?
Income or Wage Gap in Gladeview is 28.8%.
Women in Gladeview earn 71.2 cents for every dollar earned by a man.
What is Family Income Deficit in Gladeview?
Family Income Deficit in Gladeview is $13,645.
Families that are below poverty line in Gladeview earn $13,645 less on average than the poverty threshold level.
What is Inequality or Gini Index in Gladeview?
Inequality or Gini Index in Gladeview is 0.46.
What is the Total Population of Gladeview?
Total Population of Gladeview is 14,698.
What is the Total Male Population of Gladeview?
Total Male Population of Gladeview is 6,947.
What is the Total Female Population of Gladeview?
Total Female Population of Gladeview is 7,751.
What is the Ratio of Males per 100 Females in Gladeview?
There are 89.63 Males per 100 Females in Gladeview.
What is the Ratio of Females per 100 Males in Gladeview?
There are 111.57 Females per 100 Males in Gladeview.
What is the Median Population Age in Gladeview?
Median Population Age in Gladeview is 30.7 Years.
What is the Average Family Size in Gladeview
Average Family Size in Gladeview is 3.9 People.
What is the Average Household Size in Gladeview
Average Household Size in Gladeview is 3.1 People.
How Large is the Labor Force in Gladeview?
There are 5,960 People in the Labor Forcein in Gladeview.
What is the Percentage of People in the Labor Force in Gladeview?
56.8% of People are in the Labor Force in Gladeview.
What is the Unemployment Rate in Gladeview?
Unemployment Rate in Gladeview is 6.7%.