Brushy Creek, TX Map & Demographics
Brushy Creek Map
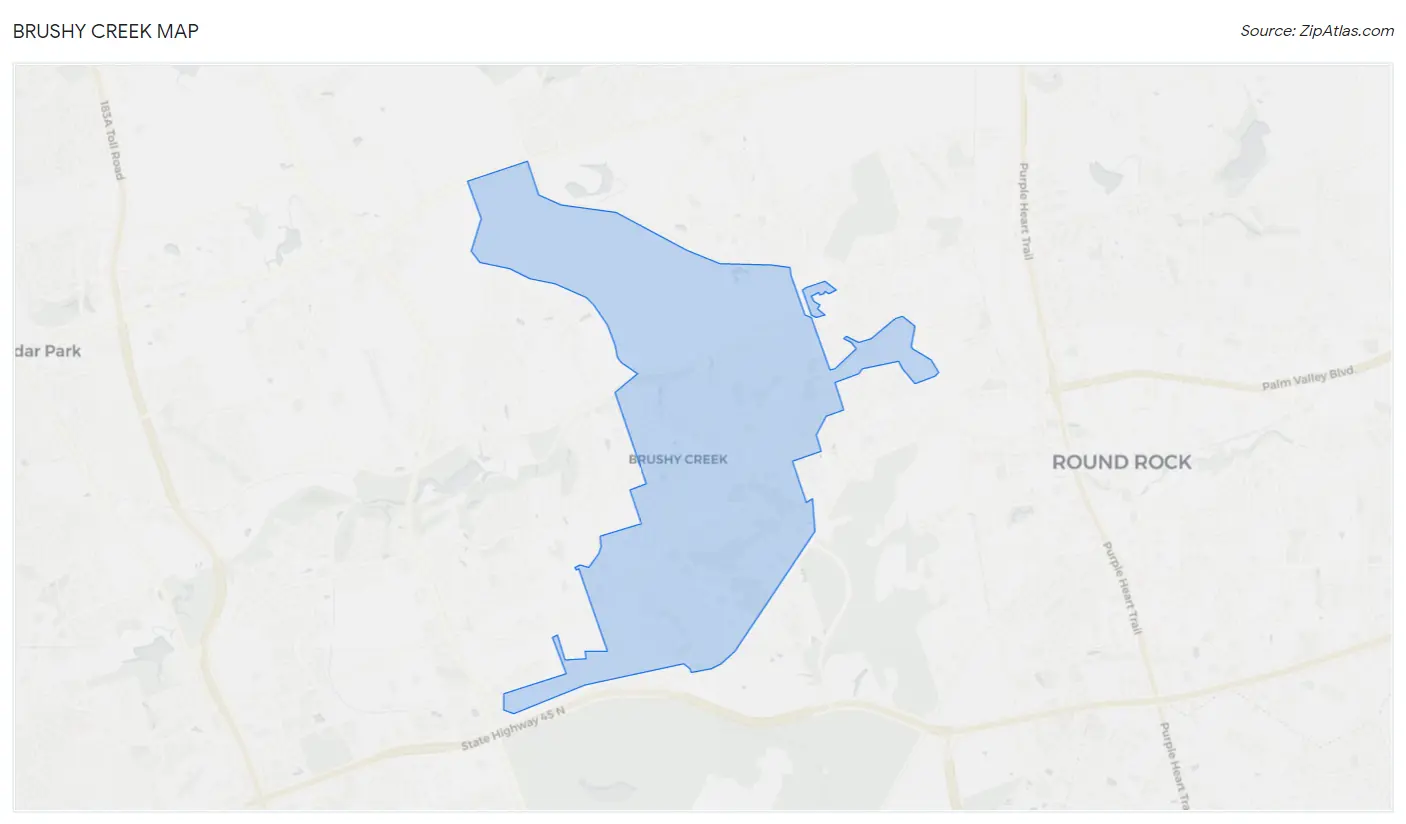
Brushy Creek Overview
$53,528
PER CAPITA INCOME
$143,750
AVG FAMILY INCOME
$133,060
AVG HOUSEHOLD INCOME
48.0%
WAGE / INCOME GAP [ % ]
52.0¢/ $1
WAGE / INCOME GAP [ $ ]
0.38
INEQUALITY / GINI INDEX
22,282
TOTAL POPULATION
11,821
MALE POPULATION
10,461
FEMALE POPULATION
113.00
MALES / 100 FEMALES
88.50
FEMALES / 100 MALES
38.8
MEDIAN AGE
3.3
AVG FAMILY SIZE
2.9
AVG HOUSEHOLD SIZE
12,394
LABOR FORCE [ PEOPLE ]
74.0%
PERCENT IN LABOR FORCE
3.4%
UNEMPLOYMENT RATE
Income in Brushy Creek
Income Overview in Brushy Creek
Per Capita Income in Brushy Creek is $53,528, while median incomes of families and households are $143,750 and $133,060 respectively.
| Characteristic | Number | Measure |
| Per Capita Income | 22,282 | $53,528 |
| Median Family Income | 5,970 | $143,750 |
| Mean Family Income | 5,970 | $171,425 |
| Median Household Income | 7,631 | $133,060 |
| Mean Household Income | 7,631 | $155,050 |
| Income Deficit | 5,970 | $0 |
| Wage / Income Gap (%) | 22,282 | 48.00% |
| Wage / Income Gap ($) | 22,282 | 52.00¢ per $1 |
| Gini / Inequality Index | 22,282 | 0.38 |
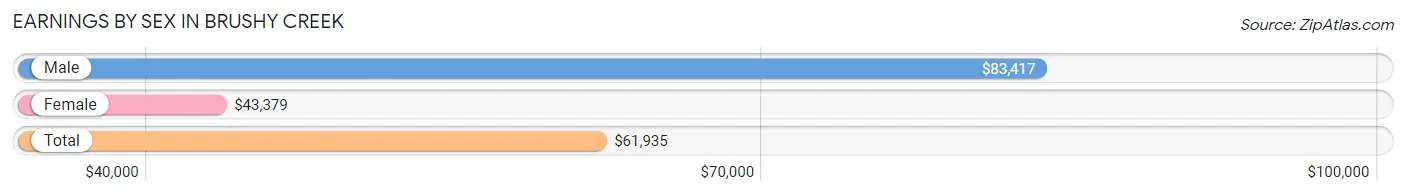
Earnings by Sex in Brushy Creek
Average Earnings in Brushy Creek are $61,935, $83,417 for men and $43,379 for women, a difference of 48.0%.
| Sex | Number | Average Earnings |
| Male | 7,011 (55.2%) | $83,417 |
| Female | 5,685 (44.8%) | $43,379 |
| Total | 12,696 (100.0%) | $61,935 |
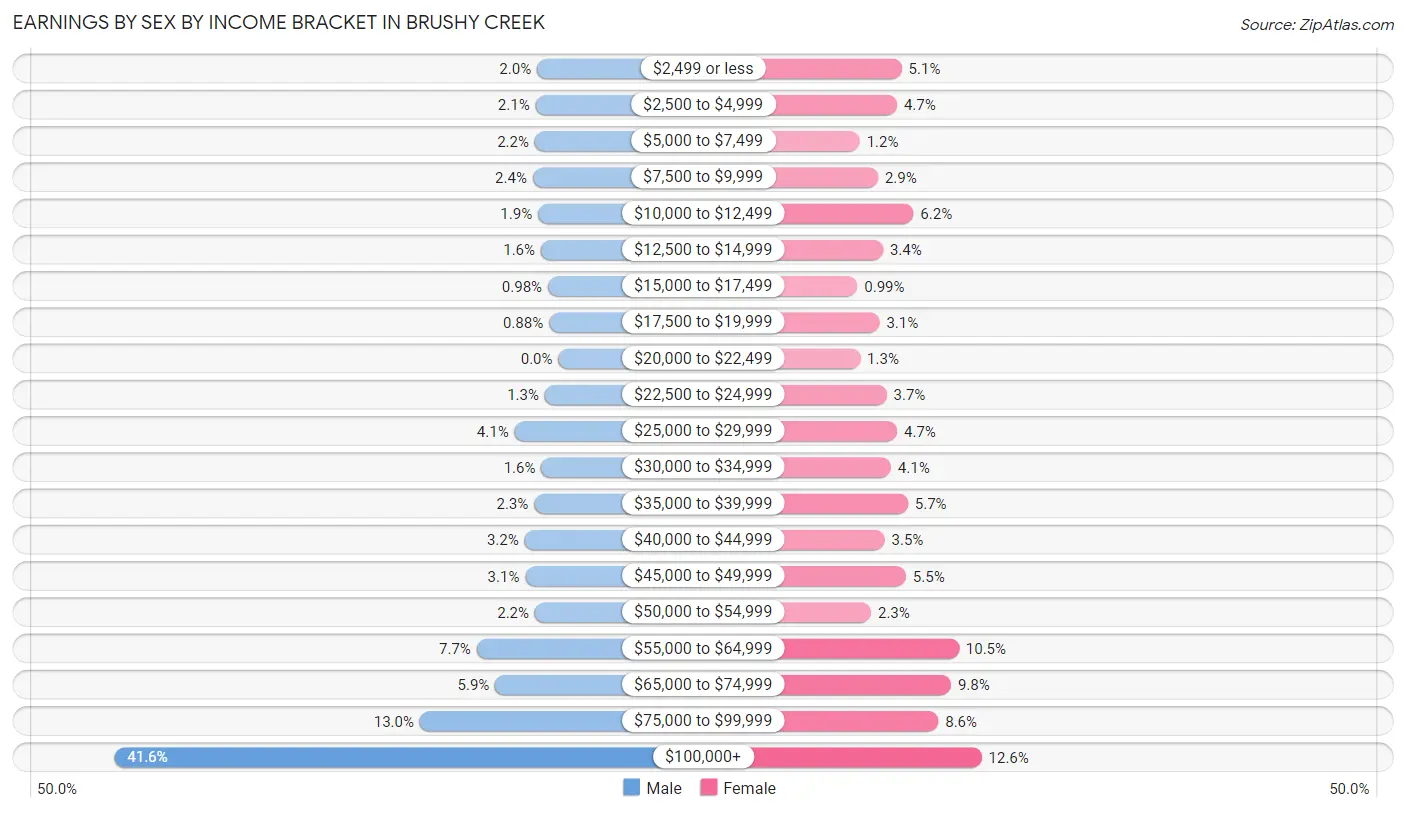
Earnings by Sex by Income Bracket in Brushy Creek
The most common earnings brackets in Brushy Creek are $100,000+ for men (2,916 | 41.6%) and $100,000+ for women (718 | 12.6%).
| Income | Male | Female |
| $2,499 or less | 140 (2.0%) | 292 (5.1%) |
| $2,500 to $4,999 | 150 (2.1%) | 267 (4.7%) |
| $5,000 to $7,499 | 155 (2.2%) | 69 (1.2%) |
| $7,500 to $9,999 | 168 (2.4%) | 166 (2.9%) |
| $10,000 to $12,499 | 134 (1.9%) | 355 (6.2%) |
| $12,500 to $14,999 | 115 (1.6%) | 193 (3.4%) |
| $15,000 to $17,499 | 69 (1.0%) | 56 (1.0%) |
| $17,500 to $19,999 | 62 (0.9%) | 174 (3.1%) |
| $20,000 to $22,499 | 0 (0.0%) | 71 (1.3%) |
| $22,500 to $24,999 | 89 (1.3%) | 212 (3.7%) |
| $25,000 to $29,999 | 288 (4.1%) | 268 (4.7%) |
| $30,000 to $34,999 | 112 (1.6%) | 235 (4.1%) |
| $35,000 to $39,999 | 159 (2.3%) | 325 (5.7%) |
| $40,000 to $44,999 | 222 (3.2%) | 201 (3.5%) |
| $45,000 to $49,999 | 217 (3.1%) | 315 (5.5%) |
| $50,000 to $54,999 | 154 (2.2%) | 129 (2.3%) |
| $55,000 to $64,999 | 536 (7.6%) | 597 (10.5%) |
| $65,000 to $74,999 | 415 (5.9%) | 555 (9.8%) |
| $75,000 to $99,999 | 910 (13.0%) | 487 (8.6%) |
| $100,000+ | 2,916 (41.6%) | 718 (12.6%) |
| Total | 7,011 (100.0%) | 5,685 (100.0%) |
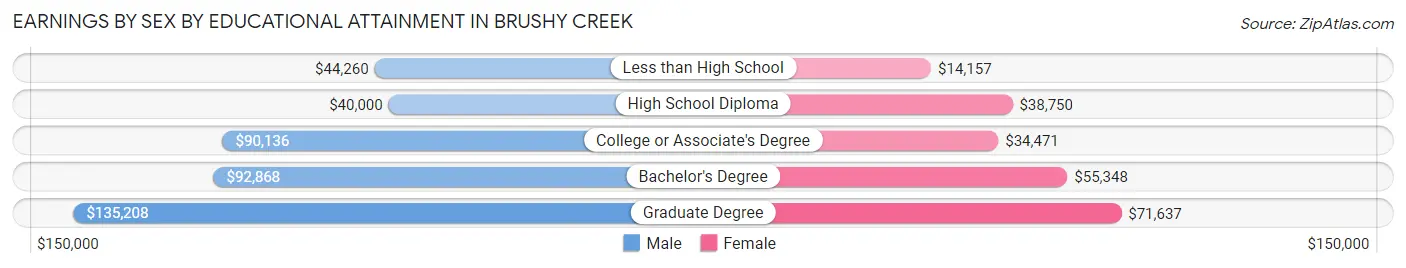
Earnings by Sex by Educational Attainment in Brushy Creek
Average earnings in Brushy Creek are $95,000 for men and $50,192 for women, a difference of 47.2%. Men with an educational attainment of graduate degree enjoy the highest average annual earnings of $135,208, while those with high school diploma education earn the least with $40,000. Women with an educational attainment of graduate degree earn the most with the average annual earnings of $71,637, while those with less than high school education have the smallest earnings of $14,157.
| Educational Attainment | Male Income | Female Income |
| Less than High School | $44,260 | $14,157 |
| High School Diploma | $40,000 | $38,750 |
| College or Associate's Degree | $90,136 | $34,471 |
| Bachelor's Degree | $92,868 | $55,348 |
| Graduate Degree | $135,208 | $71,637 |
| Total | $95,000 | $50,192 |
Family Income in Brushy Creek
Family Income Brackets in Brushy Creek
According to the Brushy Creek family income data, there are 1,725 families falling into the $200,000+ income range, which is the most common income bracket and makes up 28.9% of all families. Conversely, the $10,000 to $14,999 income bracket is the least frequent group with only 18 families (0.3%) belonging to this category.
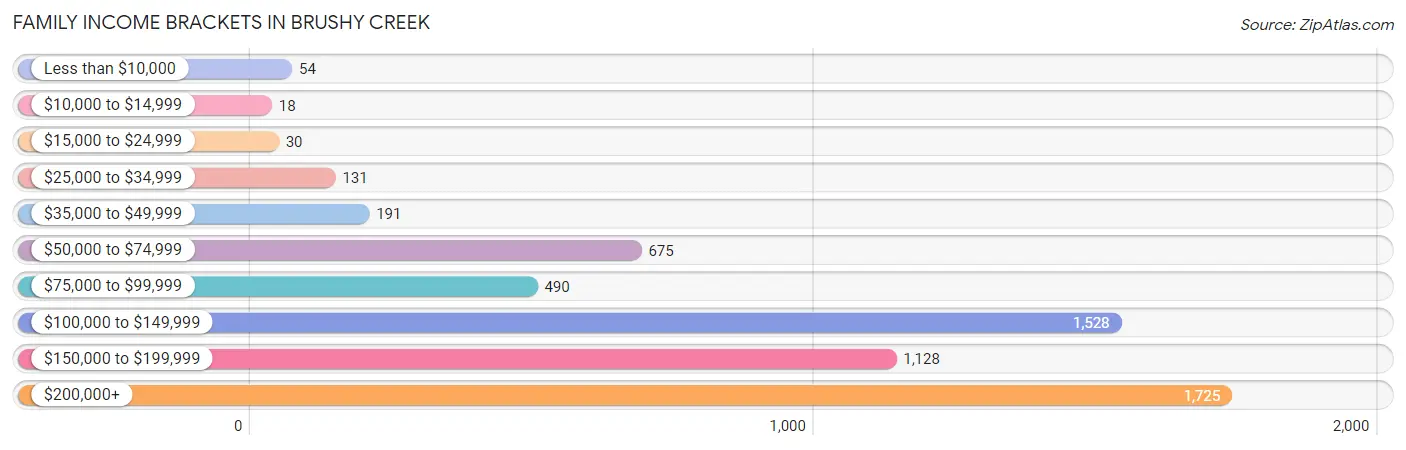
| Income Bracket | # Families | % Families |
| Less than $10,000 | 54 | 0.9% |
| $10,000 to $14,999 | 18 | 0.3% |
| $15,000 to $24,999 | 30 | 0.5% |
| $25,000 to $34,999 | 131 | 2.2% |
| $35,000 to $49,999 | 191 | 3.2% |
| $50,000 to $74,999 | 675 | 11.3% |
| $75,000 to $99,999 | 490 | 8.2% |
| $100,000 to $149,999 | 1,528 | 25.6% |
| $150,000 to $199,999 | 1,128 | 18.9% |
| $200,000+ | 1,725 | 28.9% |
Family Income by Famaliy Size in Brushy Creek
4-person families (1,868 | 31.3%) account for the highest median family income in Brushy Creek with $168,333 per family, while 2-person families (1,789 | 30.0%) have the highest median income of $60,527 per family member.
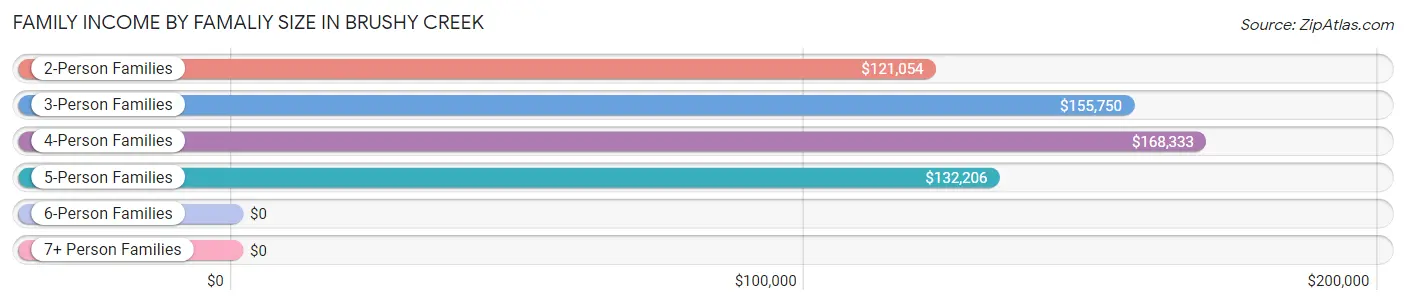
| Income Bracket | # Families | Median Income |
| 2-Person Families | 1,789 (30.0%) | $121,054 |
| 3-Person Families | 1,473 (24.7%) | $155,750 |
| 4-Person Families | 1,868 (31.3%) | $168,333 |
| 5-Person Families | 722 (12.1%) | $132,206 |
| 6-Person Families | 86 (1.4%) | $0 |
| 7+ Person Families | 32 (0.5%) | $0 |
| Total | 5,970 (100.0%) | $143,750 |
Family Income by Number of Earners in Brushy Creek
The median family income in Brushy Creek is $143,750, with families comprising 3+ earners (961) having the highest median family income of $198,679, while families with no earners (505) have the lowest median family income of $82,633, accounting for 16.1% and 8.5% of families, respectively.
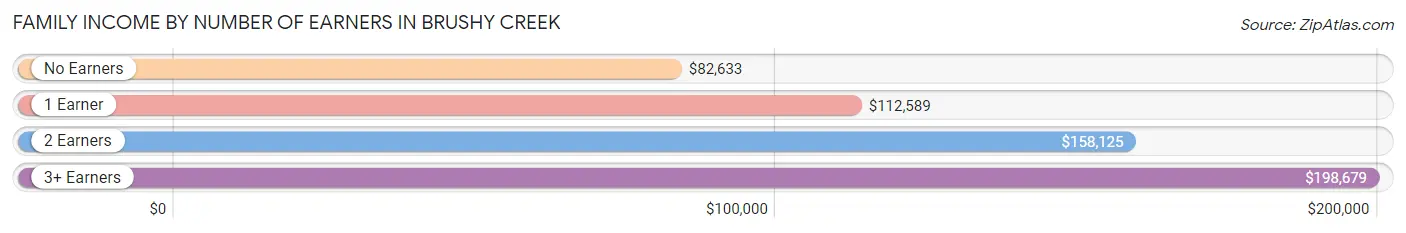
| Number of Earners | # Families | Median Income |
| No Earners | 505 (8.5%) | $82,633 |
| 1 Earner | 1,366 (22.9%) | $112,589 |
| 2 Earners | 3,138 (52.6%) | $158,125 |
| 3+ Earners | 961 (16.1%) | $198,679 |
| Total | 5,970 (100.0%) | $143,750 |
Household Income in Brushy Creek
Household Income Brackets in Brushy Creek
With 1,923 households falling in the category, the $200,000+ income range is the most frequent in Brushy Creek, accounting for 25.2% of all households. In contrast, only 53 households (0.7%) fall into the $10,000 to $14,999 income bracket, making it the least populous group.
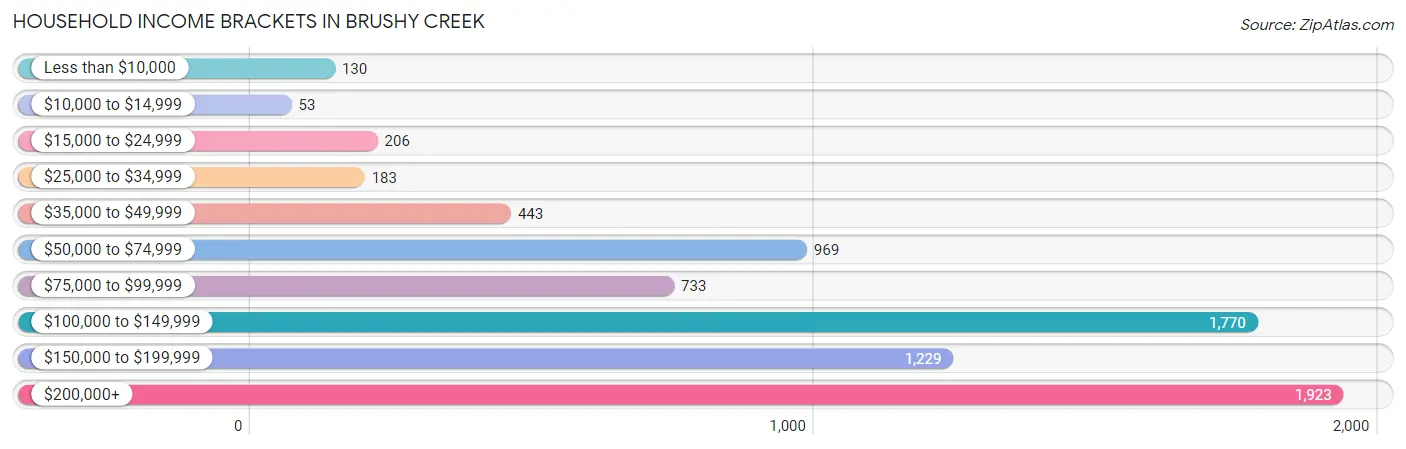
| Income Bracket | # Households | % Households |
| Less than $10,000 | 130 | 1.7% |
| $10,000 to $14,999 | 53 | 0.7% |
| $15,000 to $24,999 | 206 | 2.7% |
| $25,000 to $34,999 | 183 | 2.4% |
| $35,000 to $49,999 | 443 | 5.8% |
| $50,000 to $74,999 | 969 | 12.7% |
| $75,000 to $99,999 | 733 | 9.6% |
| $100,000 to $149,999 | 1,770 | 23.2% |
| $150,000 to $199,999 | 1,229 | 16.1% |
| $200,000+ | 1,923 | 25.2% |
Household Income by Householder Age in Brushy Creek
The median household income in Brushy Creek is $133,060, with the highest median household income of $141,860 found in the 45 to 64 years age bracket for the primary householder. A total of 3,383 households (44.3%) fall into this category. Meanwhile, the 15 to 24 years age bracket for the primary householder has the lowest median household income of $42,554, with 85 households (1.1%) in this group.
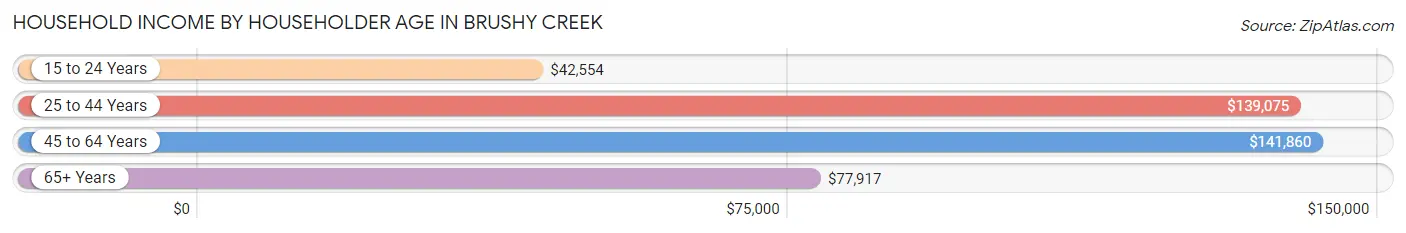
| Income Bracket | # Households | Median Income |
| 15 to 24 Years | 85 (1.1%) | $42,554 |
| 25 to 44 Years | 3,041 (39.9%) | $139,075 |
| 45 to 64 Years | 3,383 (44.3%) | $141,860 |
| 65+ Years | 1,122 (14.7%) | $77,917 |
| Total | 7,631 (100.0%) | $133,060 |
Poverty in Brushy Creek
Income Below Poverty by Sex and Age in Brushy Creek
With 3.0% poverty level for males and 3.9% for females among the residents of Brushy Creek, 75 year old and over males and 65 to 74 year old females are the most vulnerable to poverty, with 79 males (18.4%) and 96 females (14.4%) in their respective age groups living below the poverty level.
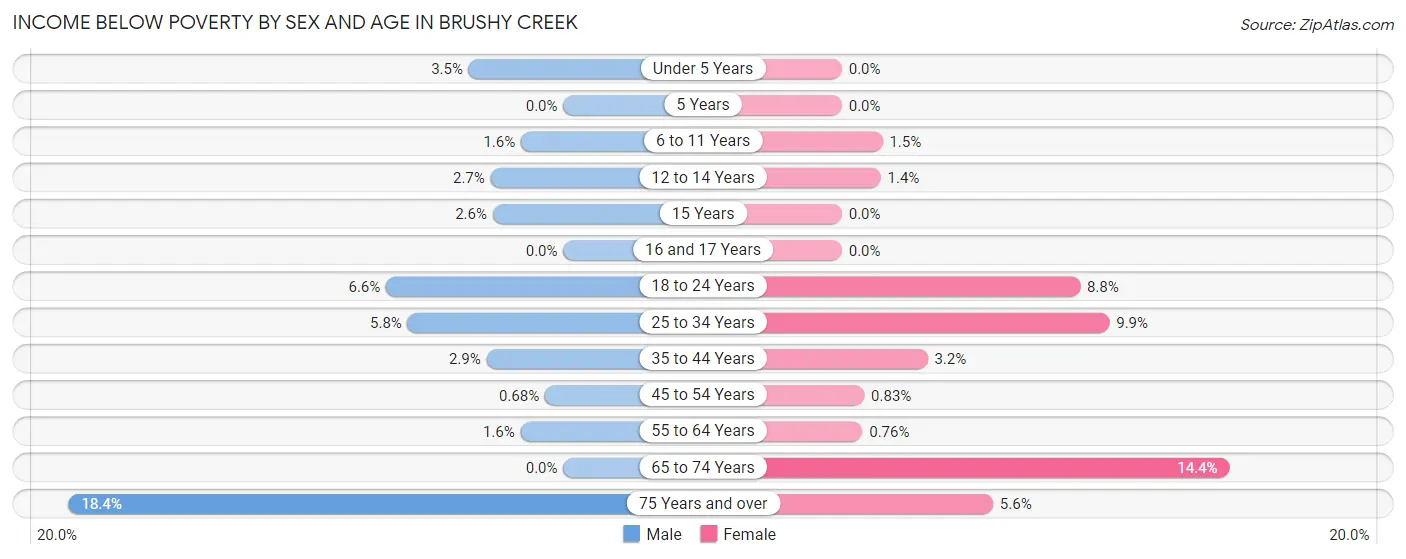
| Age Bracket | Male | Female |
| Under 5 Years | 16 (3.5%) | 0 (0.0%) |
| 5 Years | 0 (0.0%) | 0 (0.0%) |
| 6 to 11 Years | 17 (1.6%) | 20 (1.5%) |
| 12 to 14 Years | 28 (2.7%) | 8 (1.4%) |
| 15 Years | 8 (2.6%) | 0 (0.0%) |
| 16 and 17 Years | 0 (0.0%) | 0 (0.0%) |
| 18 to 24 Years | 53 (6.6%) | 63 (8.8%) |
| 25 to 34 Years | 68 (5.8%) | 105 (9.9%) |
| 35 to 44 Years | 51 (2.9%) | 65 (3.2%) |
| 45 to 54 Years | 14 (0.7%) | 14 (0.8%) |
| 55 to 64 Years | 23 (1.6%) | 9 (0.8%) |
| 65 to 74 Years | 0 (0.0%) | 96 (14.4%) |
| 75 Years and over | 79 (18.4%) | 24 (5.6%) |
| Total | 357 (3.0%) | 404 (3.9%) |
Income Above Poverty by Sex and Age in Brushy Creek
According to the poverty statistics in Brushy Creek, males aged 5 years and females aged under 5 years are the age groups that are most secure financially, with 100.0% of males and 100.0% of females in these age groups living above the poverty line.
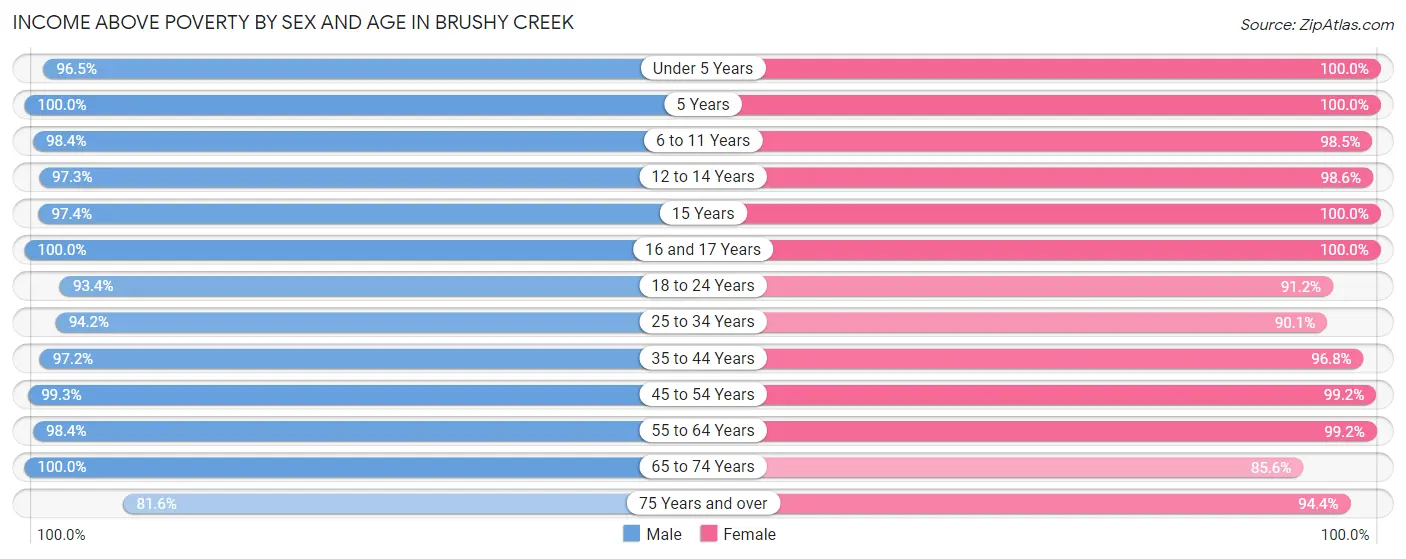
| Age Bracket | Male | Female |
| Under 5 Years | 440 (96.5%) | 469 (100.0%) |
| 5 Years | 152 (100.0%) | 39 (100.0%) |
| 6 to 11 Years | 1,069 (98.4%) | 1,301 (98.5%) |
| 12 to 14 Years | 1,008 (97.3%) | 547 (98.6%) |
| 15 Years | 297 (97.4%) | 74 (100.0%) |
| 16 and 17 Years | 506 (100.0%) | 200 (100.0%) |
| 18 to 24 Years | 752 (93.4%) | 650 (91.2%) |
| 25 to 34 Years | 1,108 (94.2%) | 952 (90.1%) |
| 35 to 44 Years | 1,736 (97.2%) | 1,978 (96.8%) |
| 45 to 54 Years | 2,060 (99.3%) | 1,665 (99.2%) |
| 55 to 64 Years | 1,422 (98.4%) | 1,178 (99.2%) |
| 65 to 74 Years | 552 (100.0%) | 571 (85.6%) |
| 75 Years and over | 351 (81.6%) | 404 (94.4%) |
| Total | 11,453 (97.0%) | 10,028 (96.1%) |
Income Below Poverty Among Married-Couple Families in Brushy Creek
The poverty statistics for married-couple families in Brushy Creek show that 1.1% or 55 of the total 5,242 families live below the poverty line. Families with no children have the highest poverty rate of 1.5%, comprising of 34 families. On the other hand, families with 3 or 4 children have the lowest poverty rate of 0.0%, which includes 0 families.
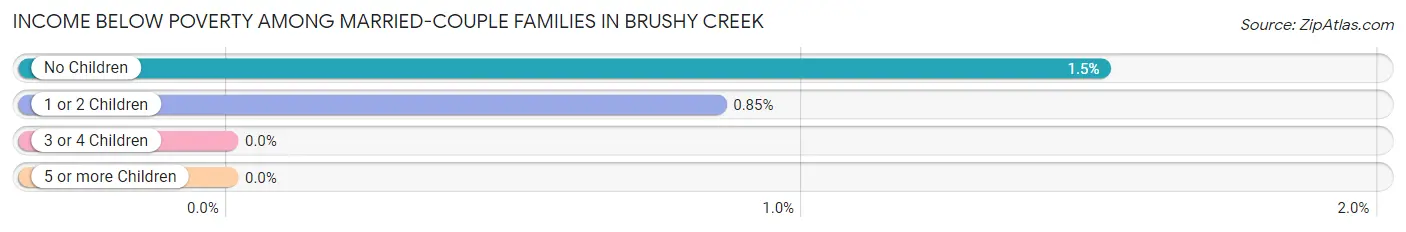
| Children | Above Poverty | Below Poverty |
| No Children | 2,201 (98.5%) | 34 (1.5%) |
| 1 or 2 Children | 2,443 (99.2%) | 21 (0.9%) |
| 3 or 4 Children | 543 (100.0%) | 0 (0.0%) |
| 5 or more Children | 0 (0.0%) | 0 (0.0%) |
| Total | 5,187 (99.0%) | 55 (1.1%) |
Income Below Poverty Among Single-Parent Households in Brushy Creek
According to the poverty data in Brushy Creek, 7.6% or 9 single-father households and 7.7% or 47 single-mother households are living below the poverty line. Among single-father households, those with no children have the highest poverty rate, with 9 households (45.0%) experiencing poverty. Likewise, among single-mother households, those with 1 or 2 children have the highest poverty rate, with 47 households (11.4%) falling below the poverty line.
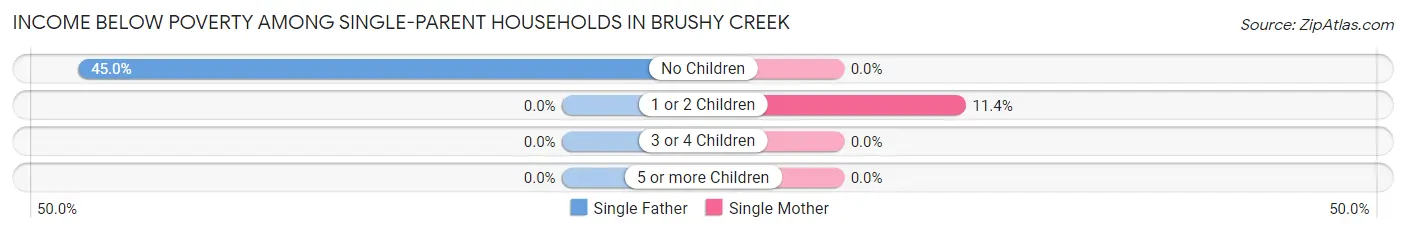
| Children | Single Father | Single Mother |
| No Children | 9 (45.0%) | 0 (0.0%) |
| 1 or 2 Children | 0 (0.0%) | 47 (11.4%) |
| 3 or 4 Children | 0 (0.0%) | 0 (0.0%) |
| 5 or more Children | 0 (0.0%) | 0 (0.0%) |
| Total | 9 (7.6%) | 47 (7.7%) |
Income Below Poverty Among Married-Couple vs Single-Parent Households in Brushy Creek
The poverty data for Brushy Creek shows that 55 of the married-couple family households (1.1%) and 56 of the single-parent households (7.7%) are living below the poverty level. Within the married-couple family households, those with no children have the highest poverty rate, with 34 households (1.5%) falling below the poverty line. Among the single-parent households, those with 1 or 2 children have the highest poverty rate, with 47 household (9.2%) living below poverty.
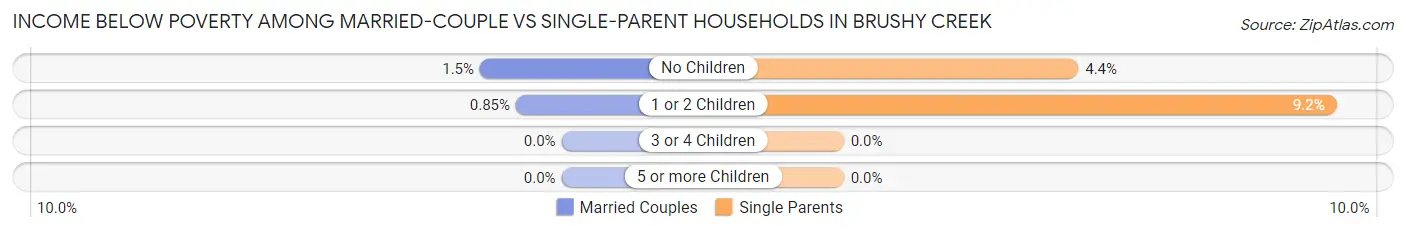
| Children | Married-Couple Families | Single-Parent Households |
| No Children | 34 (1.5%) | 9 (4.4%) |
| 1 or 2 Children | 21 (0.9%) | 47 (9.2%) |
| 3 or 4 Children | 0 (0.0%) | 0 (0.0%) |
| 5 or more Children | 0 (0.0%) | 0 (0.0%) |
| Total | 55 (1.1%) | 56 (7.7%) |
Race in Brushy Creek
The most populous races in Brushy Creek are White / Caucasian (15,374 | 69.0%), Hispanic or Latino (4,342 | 19.5%), and Asian (2,727 | 12.2%).
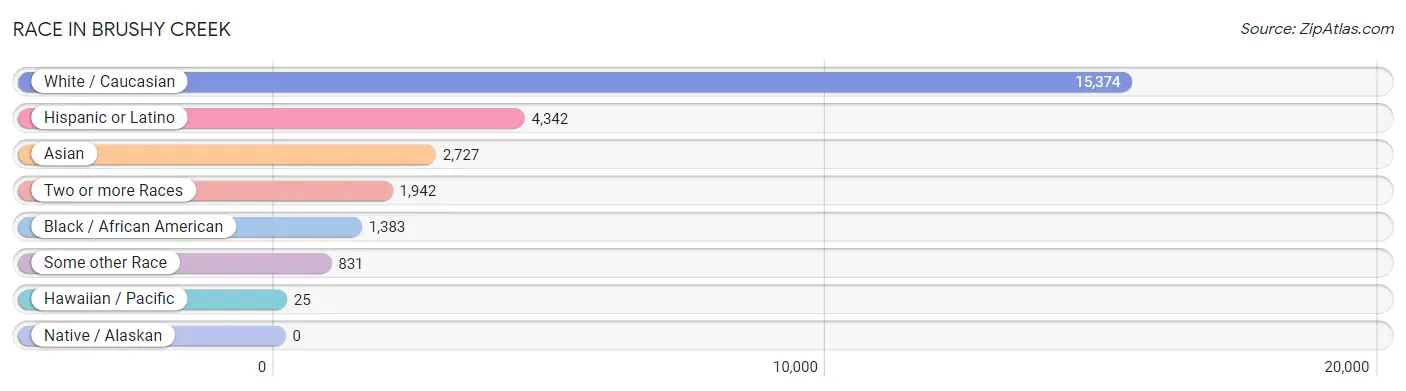
| Race | # Population | % Population |
| Asian | 2,727 | 12.2% |
| Black / African American | 1,383 | 6.2% |
| Hawaiian / Pacific | 25 | 0.1% |
| Hispanic or Latino | 4,342 | 19.5% |
| Native / Alaskan | 0 | 0.0% |
| White / Caucasian | 15,374 | 69.0% |
| Two or more Races | 1,942 | 8.7% |
| Some other Race | 831 | 3.7% |
| Total | 22,282 | 100.0% |
Ancestry in Brushy Creek
The most populous ancestries reported in Brushy Creek are Mexican (3,523 | 15.8%), German (3,341 | 15.0%), English (2,474 | 11.1%), Irish (2,017 | 9.0%), and Thai (1,436 | 6.4%), together accounting for 57.4% of all Brushy Creek residents.
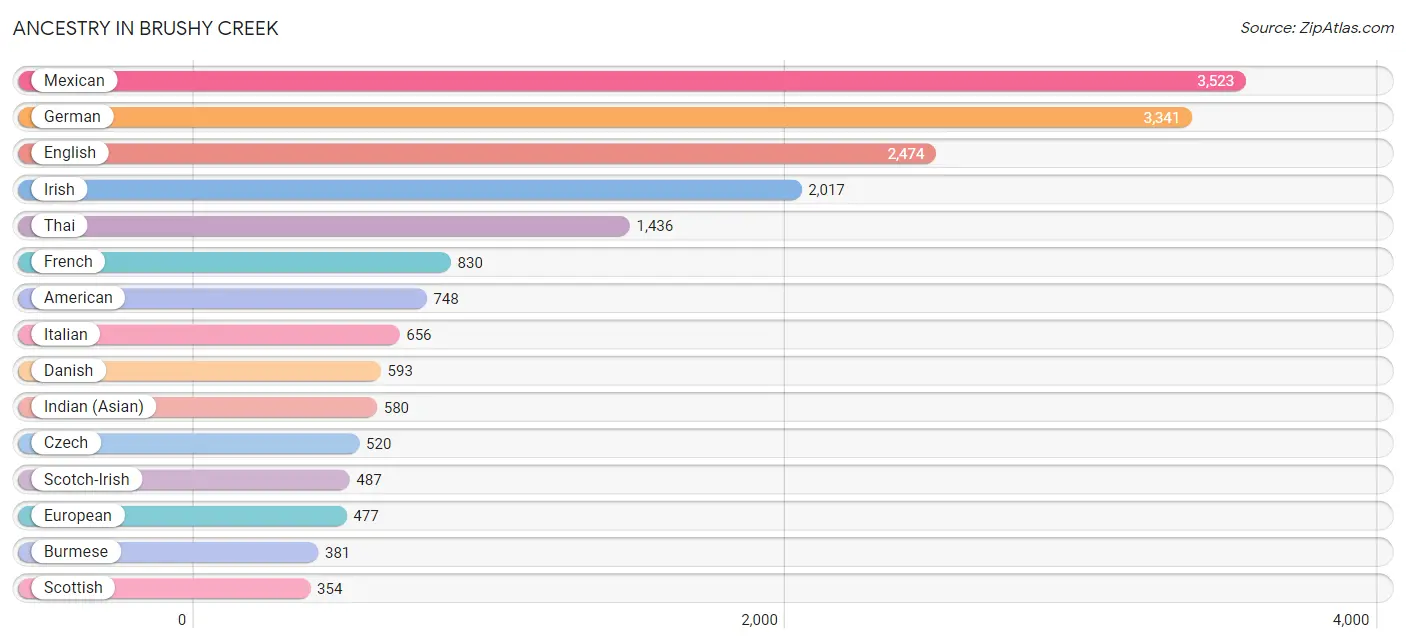
| Ancestry | # Population | % Population |
| African | 187 | 0.8% |
| American | 748 | 3.4% |
| Arab | 78 | 0.4% |
| Argentinean | 28 | 0.1% |
| Austrian | 28 | 0.1% |
| Bahamian | 195 | 0.9% |
| Bhutanese | 113 | 0.5% |
| Brazilian | 30 | 0.1% |
| British | 154 | 0.7% |
| Burmese | 381 | 1.7% |
| Canadian | 91 | 0.4% |
| Central American | 116 | 0.5% |
| Cherokee | 102 | 0.5% |
| Colombian | 116 | 0.5% |
| Costa Rican | 51 | 0.2% |
| Cuban | 252 | 1.1% |
| Czech | 520 | 2.3% |
| Czechoslovakian | 69 | 0.3% |
| Danish | 593 | 2.7% |
| Dutch | 197 | 0.9% |
| Eastern European | 48 | 0.2% |
| Ecuadorian | 33 | 0.2% |
| English | 2,474 | 11.1% |
| Ethiopian | 38 | 0.2% |
| European | 477 | 2.1% |
| Filipino | 135 | 0.6% |
| Finnish | 59 | 0.3% |
| French | 830 | 3.7% |
| French Canadian | 202 | 0.9% |
| German | 3,341 | 15.0% |
| Hungarian | 158 | 0.7% |
| Indian (Asian) | 580 | 2.6% |
| Irish | 2,017 | 9.0% |
| Italian | 656 | 2.9% |
| Jamaican | 7 | 0.0% |
| Kenyan | 12 | 0.1% |
| Korean | 246 | 1.1% |
| Lebanese | 30 | 0.1% |
| Lithuanian | 19 | 0.1% |
| Luxembourger | 15 | 0.1% |
| Mexican | 3,523 | 15.8% |
| Native Hawaiian | 9 | 0.0% |
| Nigerian | 10 | 0.0% |
| Northern European | 116 | 0.5% |
| Norwegian | 190 | 0.9% |
| Pakistani | 49 | 0.2% |
| Palestinian | 34 | 0.2% |
| Panamanian | 65 | 0.3% |
| Polish | 311 | 1.4% |
| Portuguese | 29 | 0.1% |
| Potawatomi | 63 | 0.3% |
| Puerto Rican | 164 | 0.7% |
| Romanian | 8 | 0.0% |
| Russian | 16 | 0.1% |
| Samoan | 25 | 0.1% |
| Scandinavian | 77 | 0.4% |
| Scotch-Irish | 487 | 2.2% |
| Scottish | 354 | 1.6% |
| Slovak | 39 | 0.2% |
| Slovene | 13 | 0.1% |
| South African | 30 | 0.1% |
| South American | 235 | 1.1% |
| Spanish | 19 | 0.1% |
| Sri Lankan | 149 | 0.7% |
| Subsaharan African | 296 | 1.3% |
| Swedish | 276 | 1.2% |
| Swiss | 189 | 0.9% |
| Thai | 1,436 | 6.4% |
| Turkish | 38 | 0.2% |
| Ukrainian | 49 | 0.2% |
| Venezuelan | 58 | 0.3% |
| Welsh | 103 | 0.5% |
| Yugoslavian | 7 | 0.0% | View All 73 Rows |
Immigrants in Brushy Creek
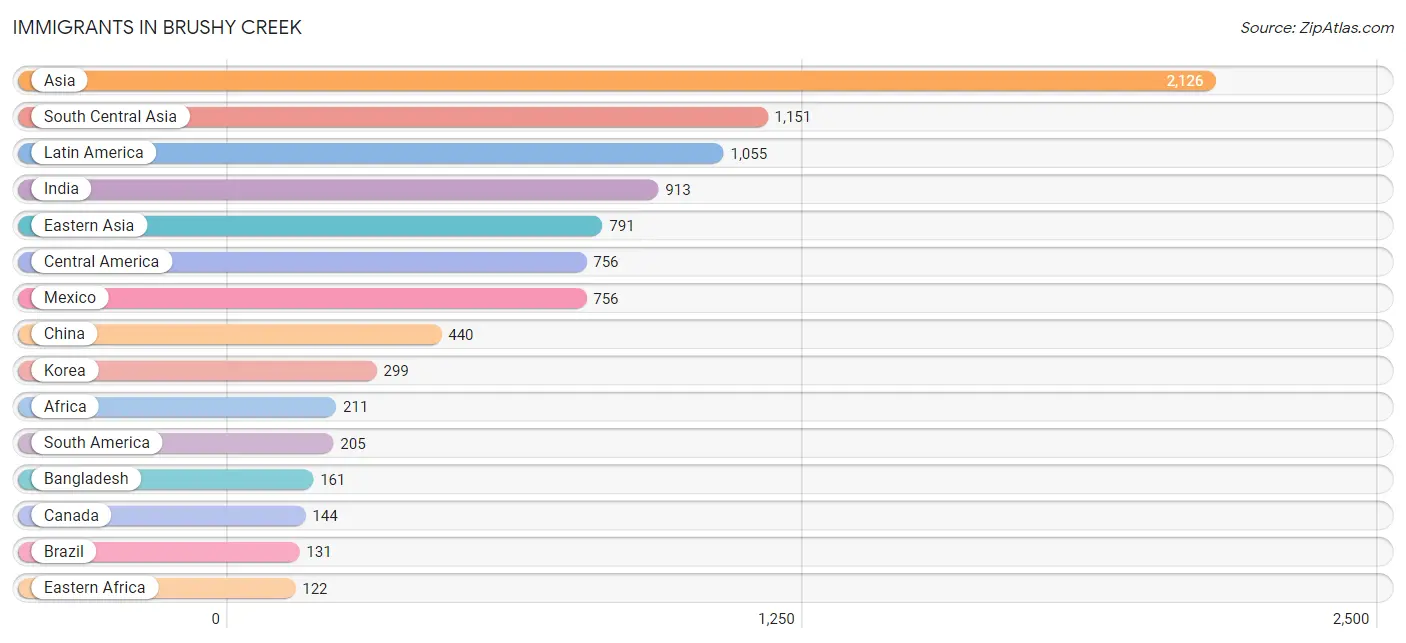
The most numerous immigrant groups reported in Brushy Creek came from Asia (2,126 | 9.5%), South Central Asia (1,151 | 5.2%), Latin America (1,055 | 4.7%), India (913 | 4.1%), and Eastern Asia (791 | 3.5%), together accounting for 27.1% of all Brushy Creek residents.
| Immigration Origin | # Population | % Population |
| Africa | 211 | 0.9% |
| Asia | 2,126 | 9.5% |
| Bahamas | 68 | 0.3% |
| Bangladesh | 161 | 0.7% |
| Brazil | 131 | 0.6% |
| Canada | 144 | 0.6% |
| Caribbean | 94 | 0.4% |
| Central America | 756 | 3.4% |
| China | 440 | 2.0% |
| Colombia | 41 | 0.2% |
| Congo | 9 | 0.0% |
| Cuba | 19 | 0.1% |
| Eastern Africa | 122 | 0.5% |
| Eastern Asia | 791 | 3.5% |
| Eastern Europe | 94 | 0.4% |
| Ethiopia | 48 | 0.2% |
| Europe | 119 | 0.5% |
| Germany | 7 | 0.0% |
| Hong Kong | 13 | 0.1% |
| India | 913 | 4.1% |
| Iran | 8 | 0.0% |
| Israel | 39 | 0.2% |
| Jamaica | 7 | 0.0% |
| Japan | 52 | 0.2% |
| Kenya | 3 | 0.0% |
| Korea | 299 | 1.3% |
| Latin America | 1,055 | 4.7% |
| Mexico | 756 | 3.4% |
| Middle Africa | 9 | 0.0% |
| Nigeria | 80 | 0.4% |
| Northern Europe | 18 | 0.1% |
| Pakistan | 16 | 0.1% |
| Philippines | 27 | 0.1% |
| Poland | 10 | 0.0% |
| Russia | 47 | 0.2% |
| South America | 205 | 0.9% |
| South Central Asia | 1,151 | 5.2% |
| South Eastern Asia | 115 | 0.5% |
| Sri Lanka | 34 | 0.2% |
| Taiwan | 107 | 0.5% |
| Turkey | 19 | 0.1% |
| Ukraine | 37 | 0.2% |
| Uzbekistan | 19 | 0.1% |
| Venezuela | 33 | 0.2% |
| Vietnam | 88 | 0.4% |
| Western Africa | 80 | 0.4% |
| Western Asia | 69 | 0.3% |
| Western Europe | 7 | 0.0% | View All 48 Rows |
Sex and Age in Brushy Creek
Sex and Age in Brushy Creek
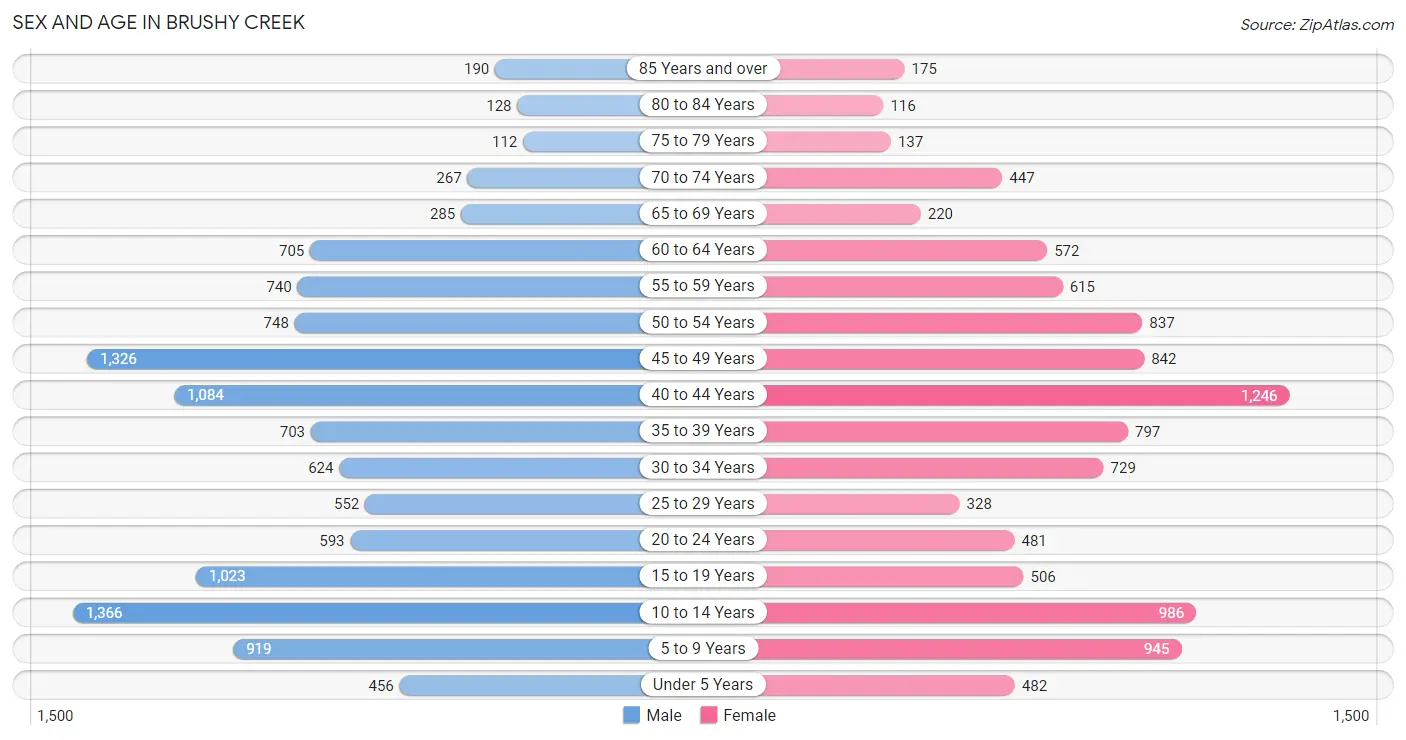
The most populous age groups in Brushy Creek are 10 to 14 Years (1,366 | 11.6%) for men and 40 to 44 Years (1,246 | 11.9%) for women.
| Age Bracket | Male | Female |
| Under 5 Years | 456 (3.9%) | 482 (4.6%) |
| 5 to 9 Years | 919 (7.8%) | 945 (9.0%) |
| 10 to 14 Years | 1,366 (11.6%) | 986 (9.4%) |
| 15 to 19 Years | 1,023 (8.6%) | 506 (4.8%) |
| 20 to 24 Years | 593 (5.0%) | 481 (4.6%) |
| 25 to 29 Years | 552 (4.7%) | 328 (3.1%) |
| 30 to 34 Years | 624 (5.3%) | 729 (7.0%) |
| 35 to 39 Years | 703 (5.9%) | 797 (7.6%) |
| 40 to 44 Years | 1,084 (9.2%) | 1,246 (11.9%) |
| 45 to 49 Years | 1,326 (11.2%) | 842 (8.1%) |
| 50 to 54 Years | 748 (6.3%) | 837 (8.0%) |
| 55 to 59 Years | 740 (6.3%) | 615 (5.9%) |
| 60 to 64 Years | 705 (6.0%) | 572 (5.5%) |
| 65 to 69 Years | 285 (2.4%) | 220 (2.1%) |
| 70 to 74 Years | 267 (2.3%) | 447 (4.3%) |
| 75 to 79 Years | 112 (0.9%) | 137 (1.3%) |
| 80 to 84 Years | 128 (1.1%) | 116 (1.1%) |
| 85 Years and over | 190 (1.6%) | 175 (1.7%) |
| Total | 11,821 (100.0%) | 10,461 (100.0%) |
Families and Households in Brushy Creek
Median Family Size in Brushy Creek
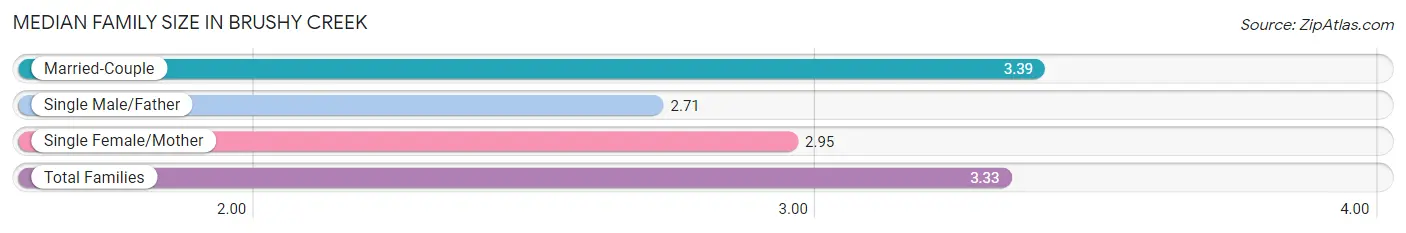
The median family size in Brushy Creek is 3.33 persons per family, with married-couple families (5,242 | 87.8%) accounting for the largest median family size of 3.39 persons per family. On the other hand, single male/father families (118 | 2.0%) represent the smallest median family size with 2.71 persons per family.
| Family Type | # Families | Family Size |
| Married-Couple | 5,242 (87.8%) | 3.39 |
| Single Male/Father | 118 (2.0%) | 2.71 |
| Single Female/Mother | 610 (10.2%) | 2.95 |
| Total Families | 5,970 (100.0%) | 3.33 |
Median Household Size in Brushy Creek
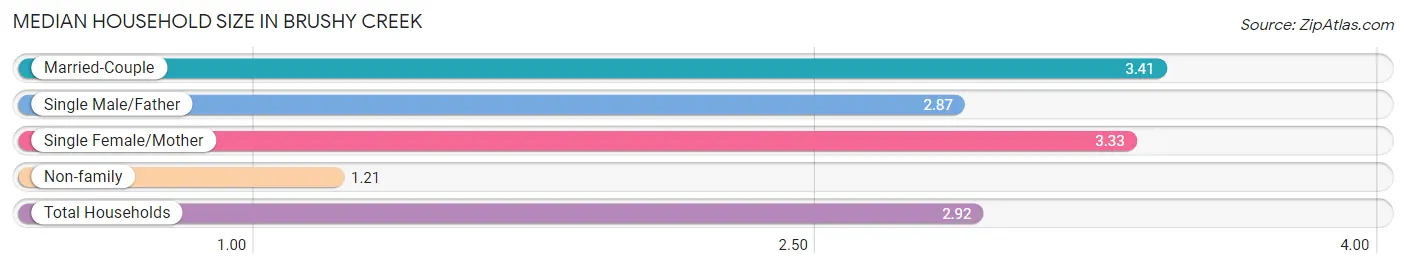
The median household size in Brushy Creek is 2.92 persons per household, with married-couple households (5,242 | 68.7%) accounting for the largest median household size of 3.41 persons per household. non-family households (1,661 | 21.8%) represent the smallest median household size with 1.21 persons per household.
| Household Type | # Households | Household Size |
| Married-Couple | 5,242 (68.7%) | 3.41 |
| Single Male/Father | 118 (1.5%) | 2.87 |
| Single Female/Mother | 610 (8.0%) | 3.33 |
| Non-family | 1,661 (21.8%) | 1.21 |
| Total Households | 7,631 (100.0%) | 2.92 |
Household Size by Marriage Status in Brushy Creek
Out of a total of 7,631 households in Brushy Creek, 5,970 (78.2%) are family households, while 1,661 (21.8%) are nonfamily households. The most numerous type of family households are 4-person households, comprising 1,905, and the most common type of nonfamily households are 1-person households, comprising 1,378.
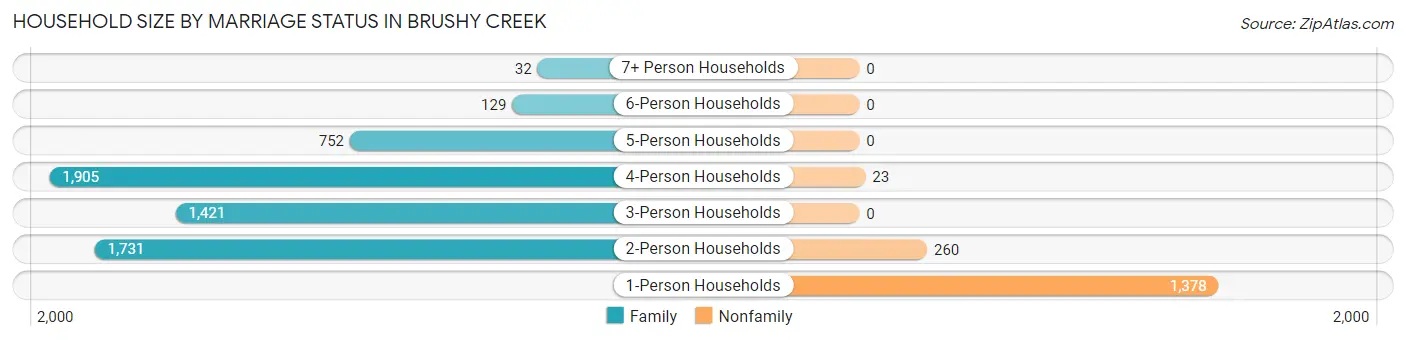
| Household Size | Family Households | Nonfamily Households |
| 1-Person Households | - | 1,378 (18.1%) |
| 2-Person Households | 1,731 (22.7%) | 260 (3.4%) |
| 3-Person Households | 1,421 (18.6%) | 0 (0.0%) |
| 4-Person Households | 1,905 (25.0%) | 23 (0.3%) |
| 5-Person Households | 752 (9.9%) | 0 (0.0%) |
| 6-Person Households | 129 (1.7%) | 0 (0.0%) |
| 7+ Person Households | 32 (0.4%) | 0 (0.0%) |
| Total | 5,970 (78.2%) | 1,661 (21.8%) |
Female Fertility in Brushy Creek
Fertility by Age in Brushy Creek
Average fertility rate in Brushy Creek is 27.0 births per 1,000 women. Women in the age bracket of 20 to 34 years have the highest fertility rate with 85.0 births per 1,000 women. Women in the age bracket of 20 to 34 years acount for 95.6% of all women with births.
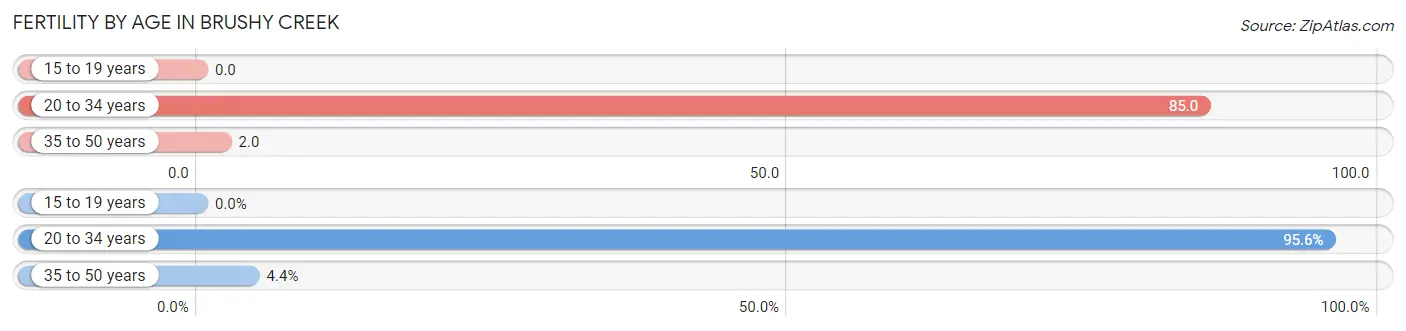
| Age Bracket | Women with Births | Births / 1,000 Women |
| 15 to 19 years | 0 (0.0%) | 0.0 |
| 20 to 34 years | 131 (95.6%) | 85.0 |
| 35 to 50 years | 6 (4.4%) | 2.0 |
| Total | 137 (100.0%) | 27.0 |
Fertility by Age by Marriage Status in Brushy Creek
93.4% of women with births (137) in Brushy Creek are married. The highest percentage of unmarried women with births falls into 20 to 34 years age bracket with 6.9% of them unmarried at the time of birth, while the lowest percentage of unmarried women with births belong to 35 to 50 years age bracket with 0.0% of them unmarried.
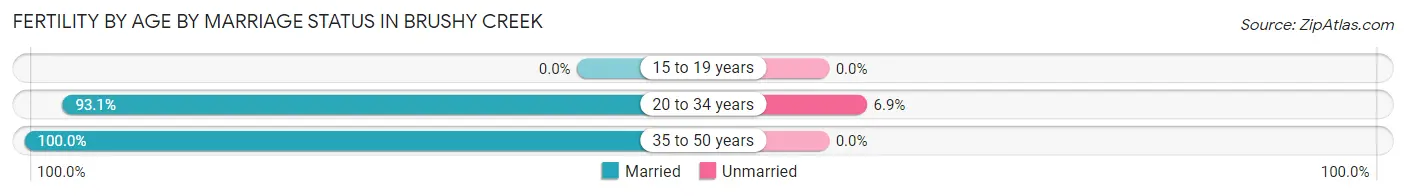
| Age Bracket | Married | Unmarried |
| 15 to 19 years | 0 (0.0%) | 0 (0.0%) |
| 20 to 34 years | 122 (93.1%) | 9 (6.9%) |
| 35 to 50 years | 6 (100.0%) | 0 (0.0%) |
| Total | 128 (93.4%) | 9 (6.6%) |
Fertility by Education in Brushy Creek
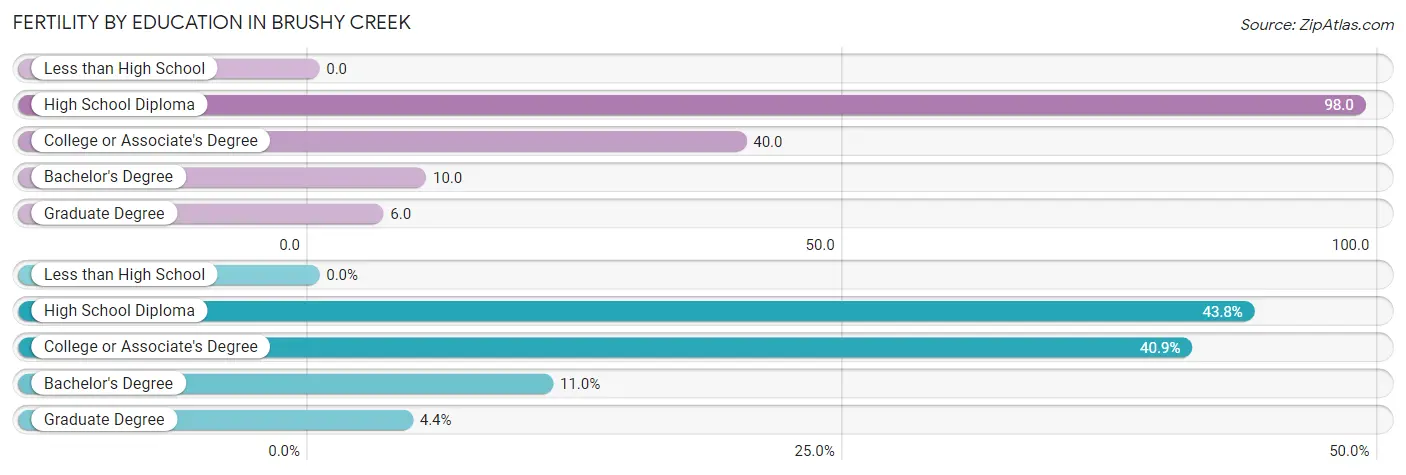
| Educational Attainment | Women with Births | Births / 1,000 Women |
| Less than High School | 0 (0.0%) | 0.0 |
| High School Diploma | 60 (43.8%) | 98.0 |
| College or Associate's Degree | 56 (40.9%) | 40.0 |
| Bachelor's Degree | 15 (11.0%) | 10.0 |
| Graduate Degree | 6 (4.4%) | 6.0 |
| Total | 137 (100.0%) | 27.0 |
Fertility by Education by Marriage Status in Brushy Creek
6.6% of women with births in Brushy Creek are unmarried. Women with the educational attainment of college or associate's degree are most likely to be married with 100.0% of them married at childbirth, while women with the educational attainment of high school diploma are least likely to be married with 15.0% of them unmarried at childbirth.
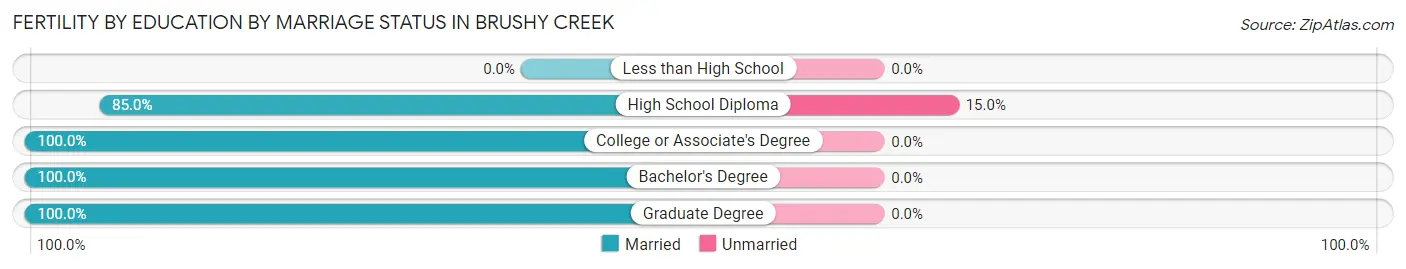
| Educational Attainment | Married | Unmarried |
| Less than High School | 0 (0.0%) | 0 (0.0%) |
| High School Diploma | 51 (85.0%) | 9 (15.0%) |
| College or Associate's Degree | 56 (100.0%) | 0 (0.0%) |
| Bachelor's Degree | 15 (100.0%) | 0 (0.0%) |
| Graduate Degree | 6 (100.0%) | 0 (0.0%) |
| Total | 128 (93.4%) | 9 (6.6%) |
Employment Characteristics in Brushy Creek
Employment by Class of Employer in Brushy Creek
Among the 11,830 employed individuals in Brushy Creek, private company employees (8,064 | 68.2%), self-employed (not incorporated) (800 | 6.8%), and local government employees (778 | 6.6%) make up the most common classes of employment.
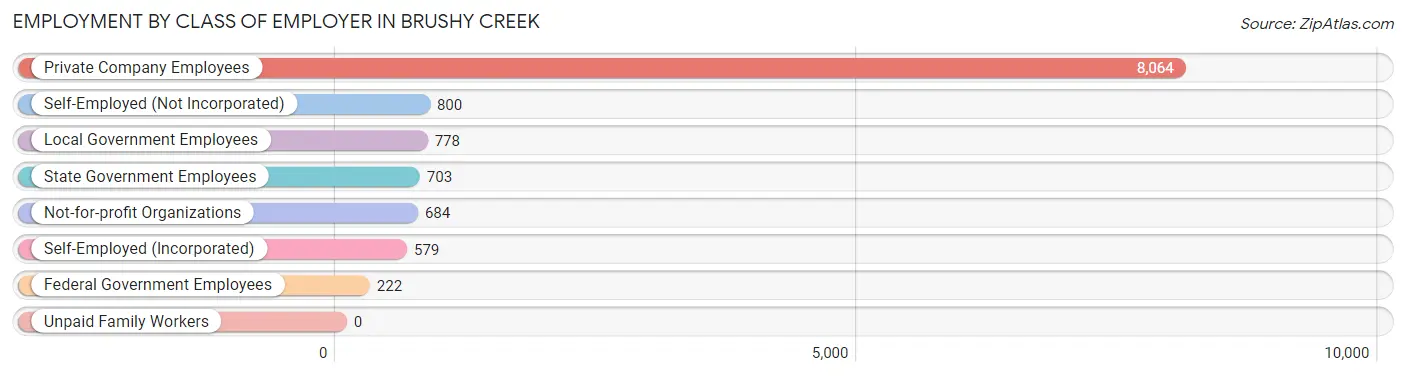
| Employer Class | # Employees | % Employees |
| Private Company Employees | 8,064 | 68.2% |
| Self-Employed (Incorporated) | 579 | 4.9% |
| Self-Employed (Not Incorporated) | 800 | 6.8% |
| Not-for-profit Organizations | 684 | 5.8% |
| Local Government Employees | 778 | 6.6% |
| State Government Employees | 703 | 5.9% |
| Federal Government Employees | 222 | 1.9% |
| Unpaid Family Workers | 0 | 0.0% |
| Total | 11,830 | 100.0% |
Employment Status by Age in Brushy Creek
According to the labor force statistics for Brushy Creek, out of the total population over 16 years of age (16,749), 74.0% or 12,394 individuals are in the labor force, with 3.4% or 421 of them unemployed. The age group with the highest labor force participation rate is 25 to 29 years, with 92.2% or 811 individuals in the labor force. Within the labor force, the 55 to 59 years age range has the highest percentage of unemployed individuals, with 9.0% or 97 of them being unemployed.
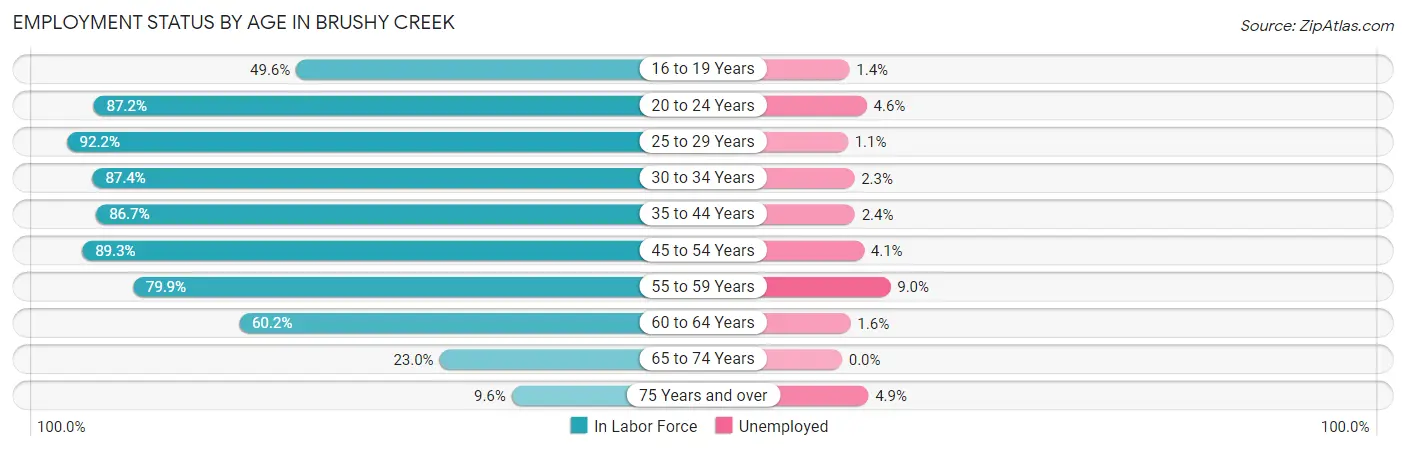
| Age Bracket | In Labor Force | Unemployed |
| 16 to 19 Years | 570 (49.6%) | 8 (1.4%) |
| 20 to 24 Years | 937 (87.2%) | 43 (4.6%) |
| 25 to 29 Years | 811 (92.2%) | 9 (1.1%) |
| 30 to 34 Years | 1,183 (87.4%) | 27 (2.3%) |
| 35 to 44 Years | 3,321 (86.7%) | 80 (2.4%) |
| 45 to 54 Years | 3,351 (89.3%) | 137 (4.1%) |
| 55 to 59 Years | 1,083 (79.9%) | 97 (9.0%) |
| 60 to 64 Years | 769 (60.2%) | 12 (1.6%) |
| 65 to 74 Years | 280 (23.0%) | 0 (0.0%) |
| 75 Years and over | 82 (9.6%) | 4 (4.9%) |
| Total | 12,394 (74.0%) | 421 (3.4%) |
Employment Status by Educational Attainment in Brushy Creek
According to labor force statistics for Brushy Creek, 84.5% of individuals (10,519) out of the total population between 25 and 64 years of age (12,448) are in the labor force, with 3.4% or 358 of them being unemployed. The group with the highest labor force participation rate are those with the educational attainment of bachelor's degree or higher, with 89.0% or 6,586 individuals in the labor force. Within the labor force, individuals with less than high school education have the highest percentage of unemployment, with 34.3% or 86 of them being unemployed.
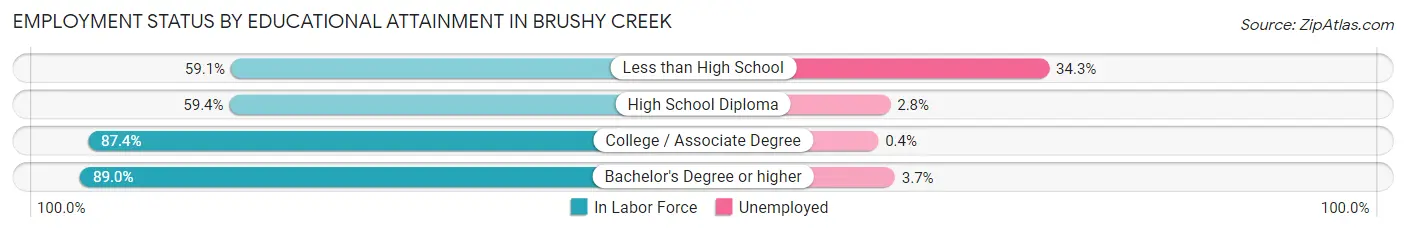
| Educational Attainment | In Labor Force | Unemployed |
| Less than High School | 251 (59.1%) | 146 (34.3%) |
| High School Diploma | 756 (59.4%) | 36 (2.8%) |
| College / Associate Degree | 2,929 (87.4%) | 13 (0.4%) |
| Bachelor's Degree or higher | 6,586 (89.0%) | 274 (3.7%) |
| Total | 10,519 (84.5%) | 423 (3.4%) |
Employment Occupations by Sex in Brushy Creek
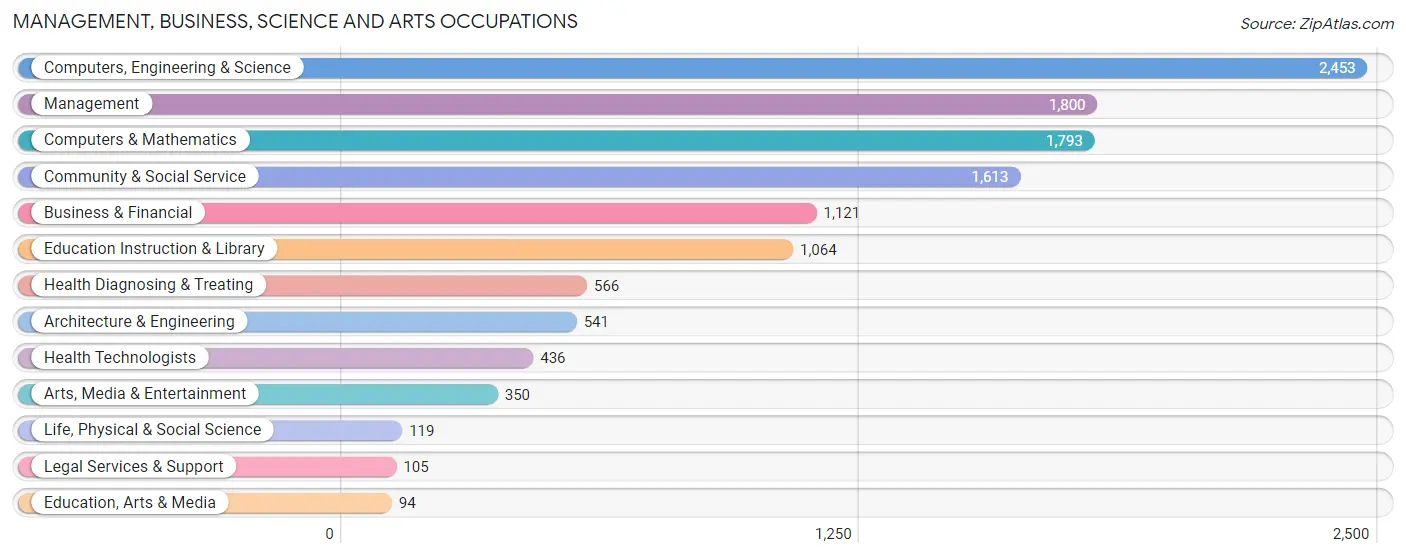
Management, Business, Science and Arts Occupations
The most common Management, Business, Science and Arts occupations in Brushy Creek are Computers, Engineering & Science (2,453 | 20.5%), Management (1,800 | 15.1%), Computers & Mathematics (1,793 | 15.0%), Community & Social Service (1,613 | 13.5%), and Business & Financial (1,121 | 9.4%).
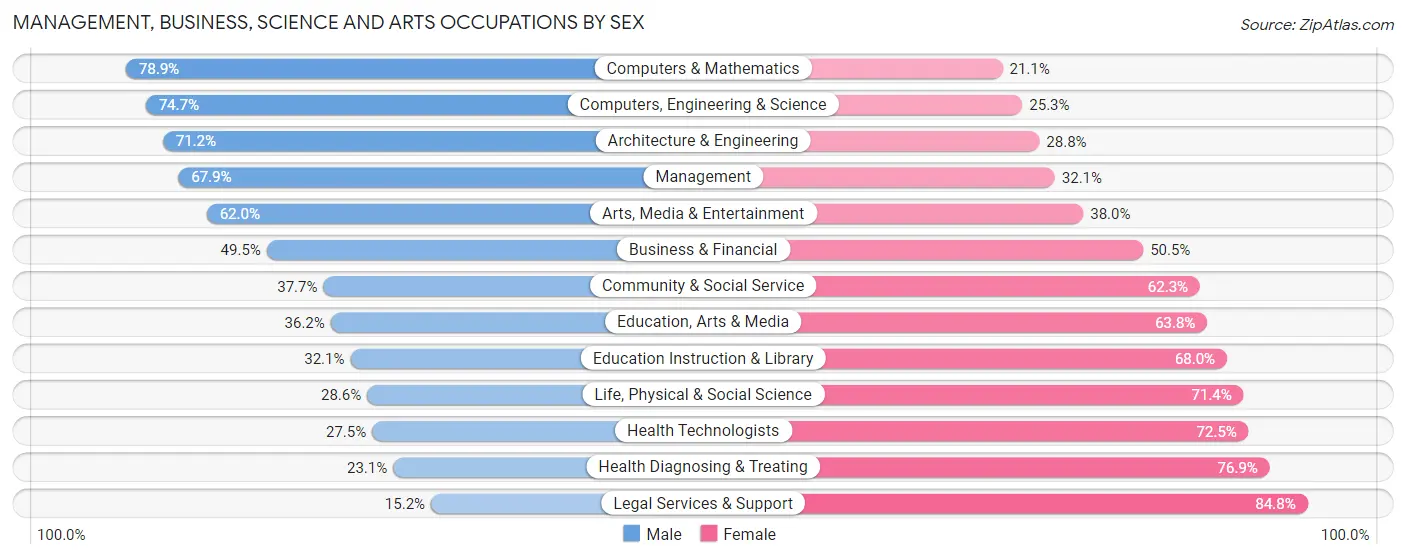
Management, Business, Science and Arts Occupations by Sex
Within the Management, Business, Science and Arts occupations in Brushy Creek, the most male-oriented occupations are Computers & Mathematics (78.9%), Computers, Engineering & Science (74.7%), and Architecture & Engineering (71.2%), while the most female-oriented occupations are Legal Services & Support (84.8%), Health Diagnosing & Treating (76.9%), and Health Technologists (72.5%).
| Occupation | Male | Female |
| Management | 1,223 (67.9%) | 577 (32.1%) |
| Business & Financial | 555 (49.5%) | 566 (50.5%) |
| Computers, Engineering & Science | 1,833 (74.7%) | 620 (25.3%) |
| Computers & Mathematics | 1,414 (78.9%) | 379 (21.1%) |
| Architecture & Engineering | 385 (71.2%) | 156 (28.8%) |
| Life, Physical & Social Science | 34 (28.6%) | 85 (71.4%) |
| Community & Social Service | 608 (37.7%) | 1,005 (62.3%) |
| Education, Arts & Media | 34 (36.2%) | 60 (63.8%) |
| Legal Services & Support | 16 (15.2%) | 89 (84.8%) |
| Education Instruction & Library | 341 (32.1%) | 723 (67.9%) |
| Arts, Media & Entertainment | 217 (62.0%) | 133 (38.0%) |
| Health Diagnosing & Treating | 131 (23.1%) | 435 (76.9%) |
| Health Technologists | 120 (27.5%) | 316 (72.5%) |
| Total (Category) | 4,350 (57.6%) | 3,203 (42.4%) |
| Total (Overall) | 6,699 (56.1%) | 5,248 (43.9%) |
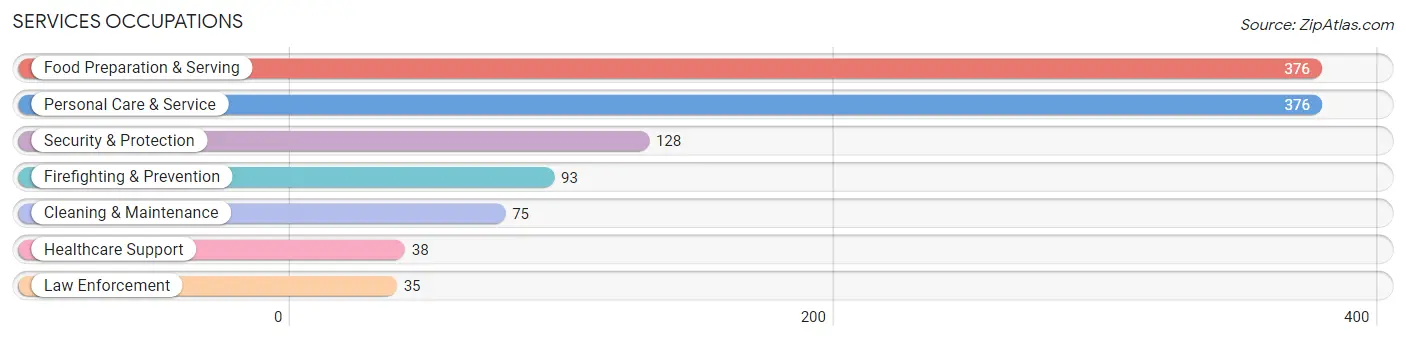
Services Occupations
The most common Services occupations in Brushy Creek are Food Preparation & Serving (376 | 3.2%), Personal Care & Service (376 | 3.2%), Security & Protection (128 | 1.1%), Firefighting & Prevention (93 | 0.8%), and Cleaning & Maintenance (75 | 0.6%).
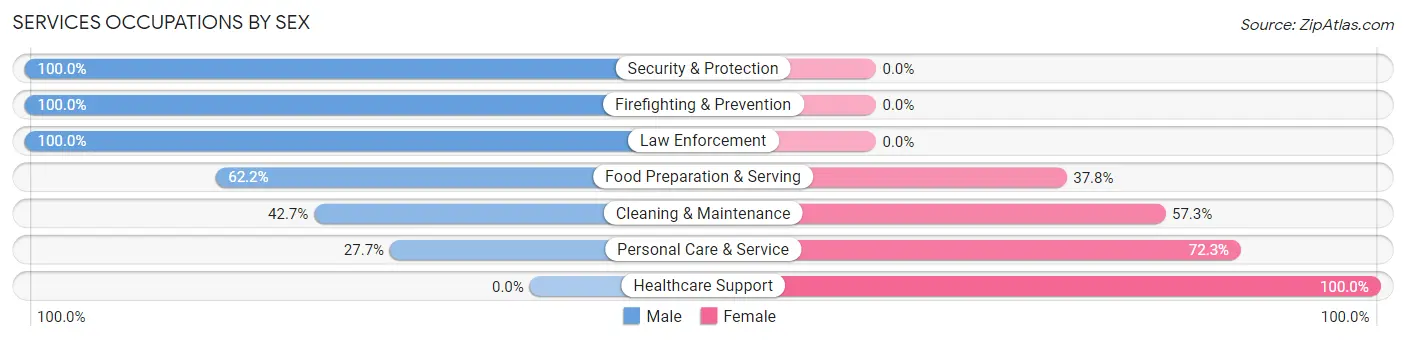
Services Occupations by Sex
Within the Services occupations in Brushy Creek, the most male-oriented occupations are Security & Protection (100.0%), Firefighting & Prevention (100.0%), and Law Enforcement (100.0%), while the most female-oriented occupations are Healthcare Support (100.0%), Personal Care & Service (72.3%), and Cleaning & Maintenance (57.3%).
| Occupation | Male | Female |
| Healthcare Support | 0 (0.0%) | 38 (100.0%) |
| Security & Protection | 128 (100.0%) | 0 (0.0%) |
| Firefighting & Prevention | 93 (100.0%) | 0 (0.0%) |
| Law Enforcement | 35 (100.0%) | 0 (0.0%) |
| Food Preparation & Serving | 234 (62.2%) | 142 (37.8%) |
| Cleaning & Maintenance | 32 (42.7%) | 43 (57.3%) |
| Personal Care & Service | 104 (27.7%) | 272 (72.3%) |
| Total (Category) | 498 (50.1%) | 495 (49.8%) |
| Total (Overall) | 6,699 (56.1%) | 5,248 (43.9%) |
Sales and Office Occupations
The most common Sales and Office occupations in Brushy Creek are Sales & Related (1,372 | 11.5%), and Office & Administration (1,036 | 8.7%).

Sales and Office Occupations by Sex
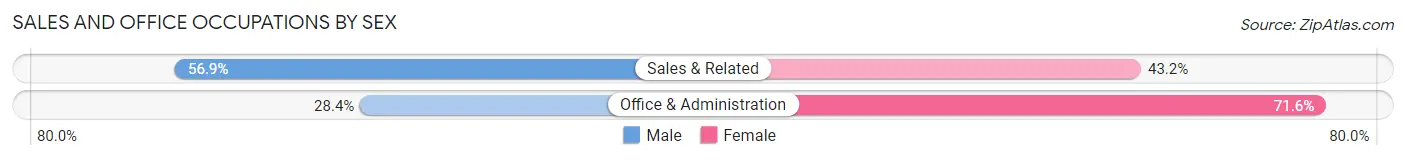
| Occupation | Male | Female |
| Sales & Related | 780 (56.9%) | 592 (43.1%) |
| Office & Administration | 294 (28.4%) | 742 (71.6%) |
| Total (Category) | 1,074 (44.6%) | 1,334 (55.4%) |
| Total (Overall) | 6,699 (56.1%) | 5,248 (43.9%) |
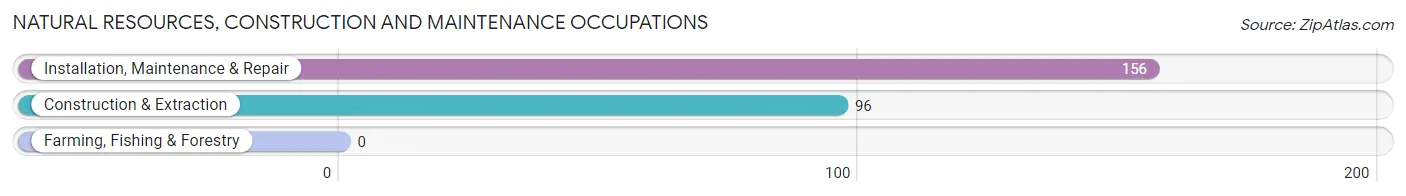
Natural Resources, Construction and Maintenance Occupations
The most common Natural Resources, Construction and Maintenance occupations in Brushy Creek are Installation, Maintenance & Repair (156 | 1.3%), and Construction & Extraction (96 | 0.8%).
Natural Resources, Construction and Maintenance Occupations by Sex
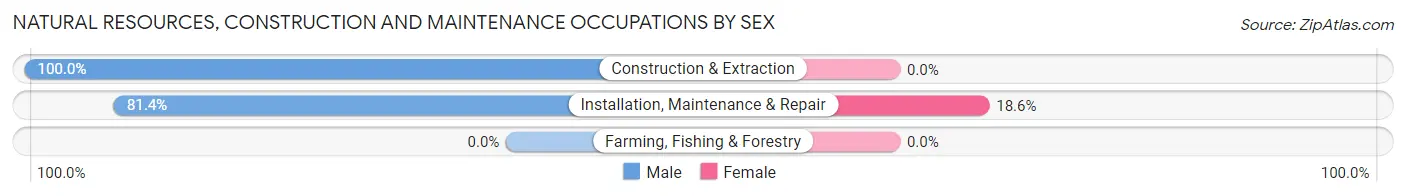
| Occupation | Male | Female |
| Farming, Fishing & Forestry | 0 (0.0%) | 0 (0.0%) |
| Construction & Extraction | 96 (100.0%) | 0 (0.0%) |
| Installation, Maintenance & Repair | 127 (81.4%) | 29 (18.6%) |
| Total (Category) | 223 (88.5%) | 29 (11.5%) |
| Total (Overall) | 6,699 (56.1%) | 5,248 (43.9%) |
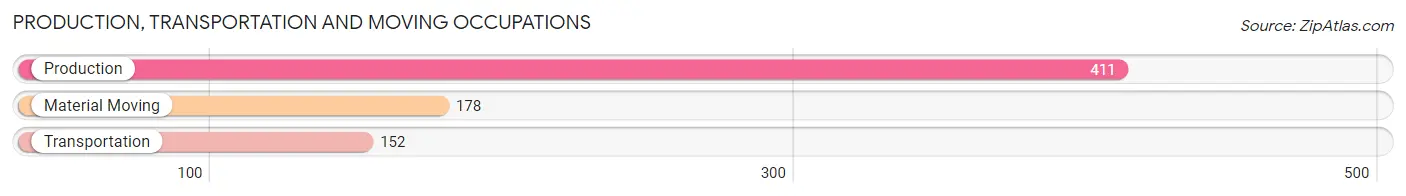
Production, Transportation and Moving Occupations
The most common Production, Transportation and Moving occupations in Brushy Creek are Production (411 | 3.4%), Material Moving (178 | 1.5%), and Transportation (152 | 1.3%).
Production, Transportation and Moving Occupations by Sex
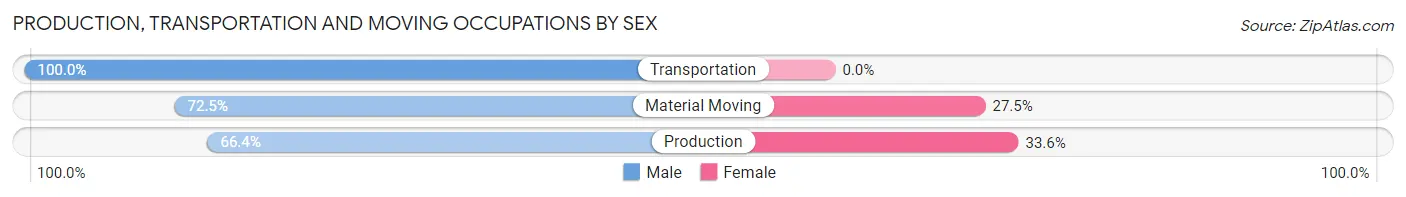
| Occupation | Male | Female |
| Production | 273 (66.4%) | 138 (33.6%) |
| Transportation | 152 (100.0%) | 0 (0.0%) |
| Material Moving | 129 (72.5%) | 49 (27.5%) |
| Total (Category) | 554 (74.8%) | 187 (25.2%) |
| Total (Overall) | 6,699 (56.1%) | 5,248 (43.9%) |
Employment Industries by Sex in Brushy Creek
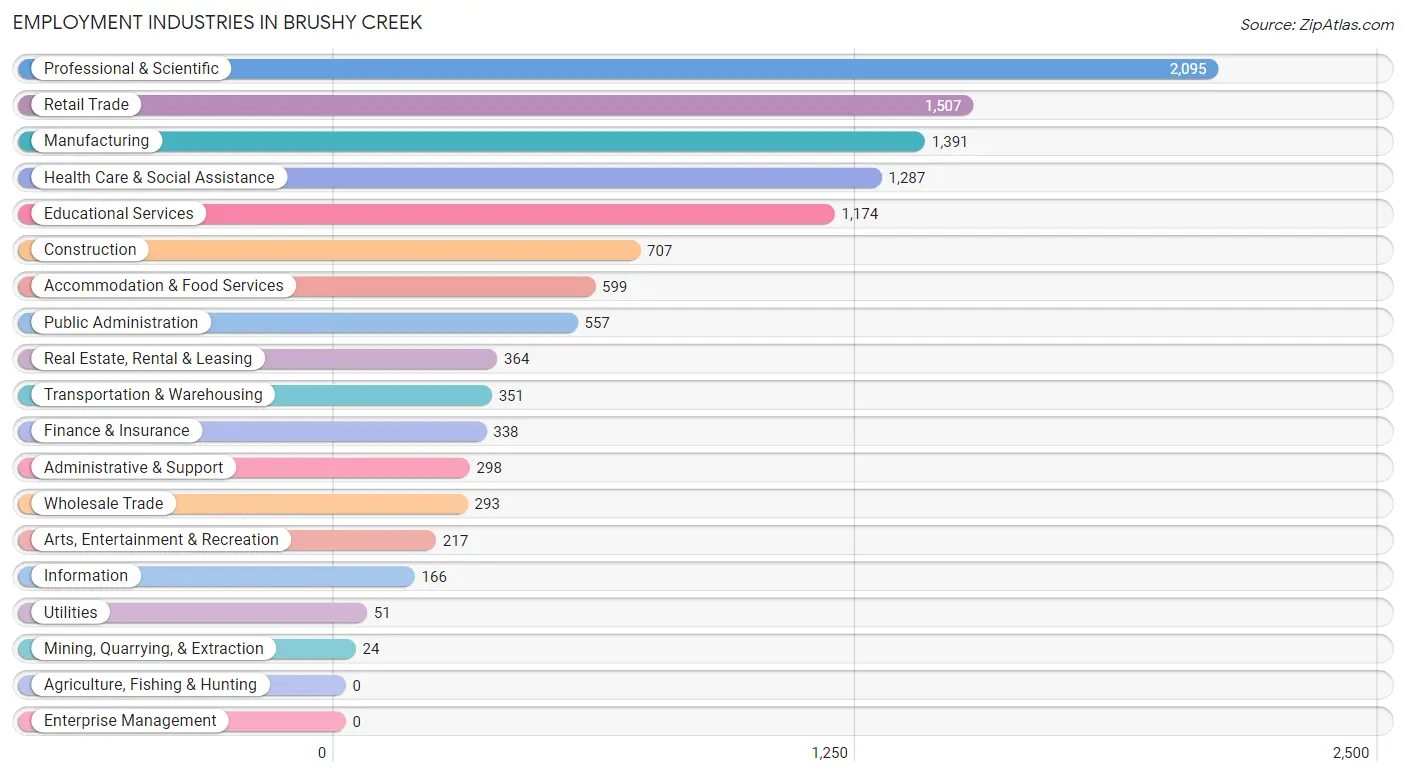
Employment Industries in Brushy Creek
The major employment industries in Brushy Creek include Professional & Scientific (2,095 | 17.5%), Retail Trade (1,507 | 12.6%), Manufacturing (1,391 | 11.6%), Health Care & Social Assistance (1,287 | 10.8%), and Educational Services (1,174 | 9.8%).
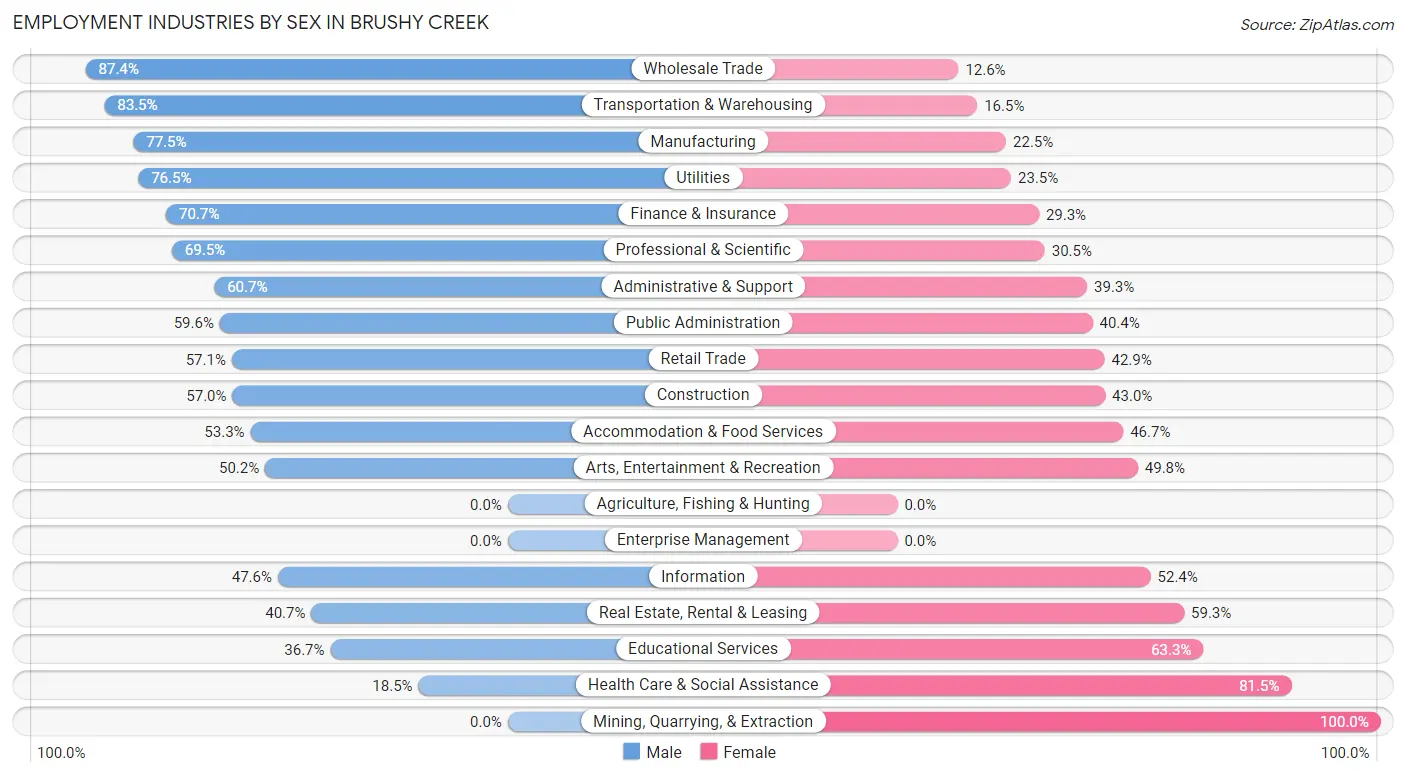
Employment Industries by Sex in Brushy Creek
The Brushy Creek industries that see more men than women are Wholesale Trade (87.4%), Transportation & Warehousing (83.5%), and Manufacturing (77.5%), whereas the industries that tend to have a higher number of women are Mining, Quarrying, & Extraction (100.0%), Health Care & Social Assistance (81.5%), and Educational Services (63.3%).
| Industry | Male | Female |
| Agriculture, Fishing & Hunting | 0 (0.0%) | 0 (0.0%) |
| Mining, Quarrying, & Extraction | 0 (0.0%) | 24 (100.0%) |
| Construction | 403 (57.0%) | 304 (43.0%) |
| Manufacturing | 1,078 (77.5%) | 313 (22.5%) |
| Wholesale Trade | 256 (87.4%) | 37 (12.6%) |
| Retail Trade | 861 (57.1%) | 646 (42.9%) |
| Transportation & Warehousing | 293 (83.5%) | 58 (16.5%) |
| Utilities | 39 (76.5%) | 12 (23.5%) |
| Information | 79 (47.6%) | 87 (52.4%) |
| Finance & Insurance | 239 (70.7%) | 99 (29.3%) |
| Real Estate, Rental & Leasing | 148 (40.7%) | 216 (59.3%) |
| Professional & Scientific | 1,456 (69.5%) | 639 (30.5%) |
| Enterprise Management | 0 (0.0%) | 0 (0.0%) |
| Administrative & Support | 181 (60.7%) | 117 (39.3%) |
| Educational Services | 431 (36.7%) | 743 (63.3%) |
| Health Care & Social Assistance | 238 (18.5%) | 1,049 (81.5%) |
| Arts, Entertainment & Recreation | 109 (50.2%) | 108 (49.8%) |
| Accommodation & Food Services | 319 (53.3%) | 280 (46.7%) |
| Public Administration | 332 (59.6%) | 225 (40.4%) |
| Total | 6,699 (56.1%) | 5,248 (43.9%) |
Education in Brushy Creek
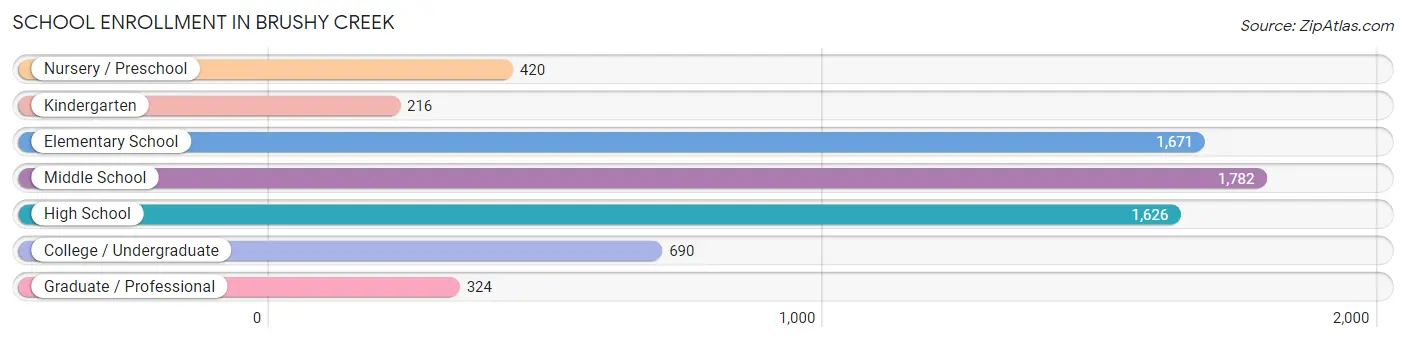
School Enrollment in Brushy Creek
The most common levels of schooling among the 6,729 students in Brushy Creek are middle school (1,782 | 26.5%), elementary school (1,671 | 24.8%), and high school (1,626 | 24.2%).
| School Level | # Students | % Students |
| Nursery / Preschool | 420 | 6.2% |
| Kindergarten | 216 | 3.2% |
| Elementary School | 1,671 | 24.8% |
| Middle School | 1,782 | 26.5% |
| High School | 1,626 | 24.2% |
| College / Undergraduate | 690 | 10.2% |
| Graduate / Professional | 324 | 4.8% |
| Total | 6,729 | 100.0% |
School Enrollment by Age by Funding Source in Brushy Creek
Out of a total of 6,729 students who are enrolled in schools in Brushy Creek, 760 (11.3%) attend a private institution, while the remaining 5,969 (88.7%) are enrolled in public schools. The age group of 3 to 4 year olds has the highest likelihood of being enrolled in private schools, with 185 (57.8% in the age bracket) enrolled. Conversely, the age group of 18 to 19 year olds has the lowest likelihood of being enrolled in a private school, with 309 (100.0% in the age bracket) attending a public institution.
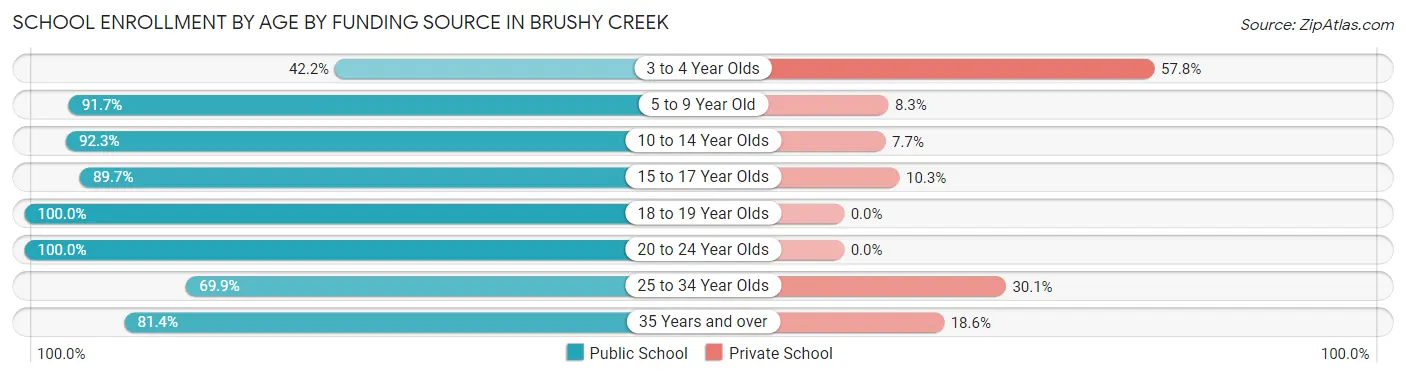
| Age Bracket | Public School | Private School |
| 3 to 4 Year Olds | 135 (42.2%) | 185 (57.8%) |
| 5 to 9 Year Old | 1,654 (91.7%) | 149 (8.3%) |
| 10 to 14 Year Olds | 2,160 (92.3%) | 181 (7.7%) |
| 15 to 17 Year Olds | 973 (89.7%) | 112 (10.3%) |
| 18 to 19 Year Olds | 309 (100.0%) | 0 (0.0%) |
| 20 to 24 Year Olds | 304 (100.0%) | 0 (0.0%) |
| 25 to 34 Year Olds | 160 (69.9%) | 69 (30.1%) |
| 35 Years and over | 275 (81.4%) | 63 (18.6%) |
| Total | 5,969 (88.7%) | 760 (11.3%) |
Educational Attainment by Field of Study in Brushy Creek
Engineering (1,572 | 17.1%), business (1,397 | 15.2%), communications (775 | 8.5%), computers & mathematics (719 | 7.8%), and education (645 | 7.0%) are the most common fields of study among 9,169 individuals in Brushy Creek who have obtained a bachelor's degree or higher.
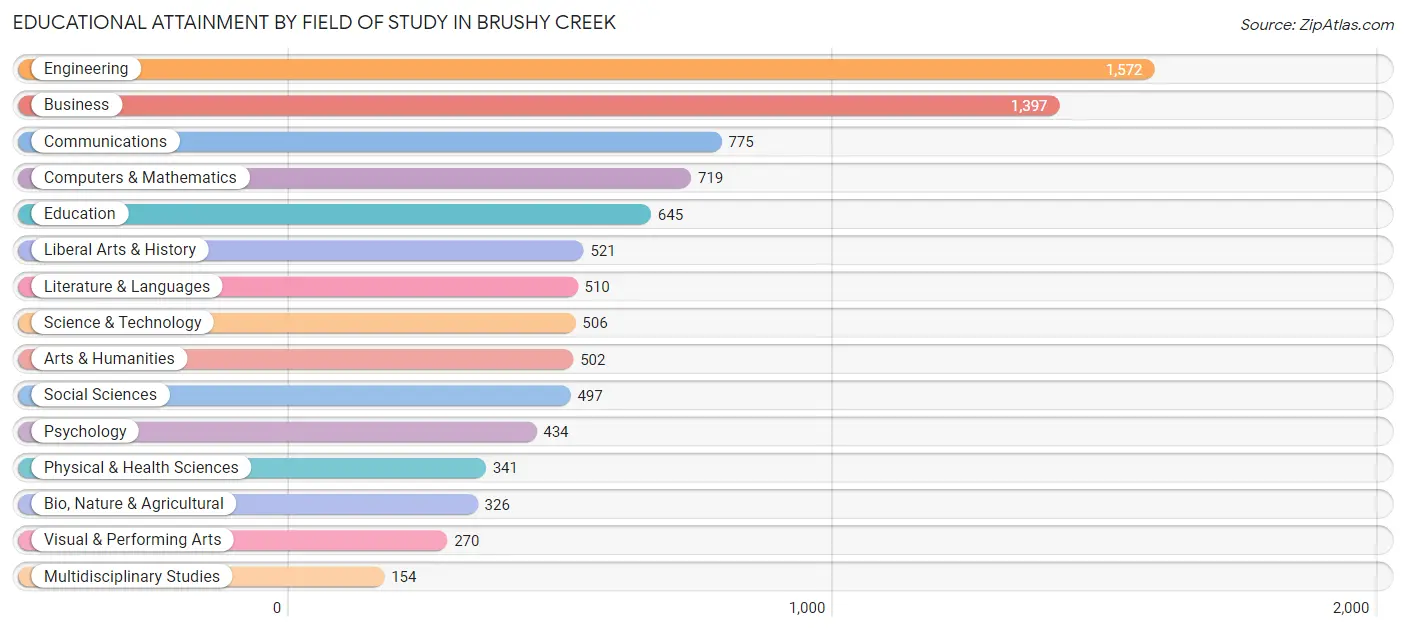
| Field of Study | # Graduates | % Graduates |
| Computers & Mathematics | 719 | 7.8% |
| Bio, Nature & Agricultural | 326 | 3.6% |
| Physical & Health Sciences | 341 | 3.7% |
| Psychology | 434 | 4.7% |
| Social Sciences | 497 | 5.4% |
| Engineering | 1,572 | 17.1% |
| Multidisciplinary Studies | 154 | 1.7% |
| Science & Technology | 506 | 5.5% |
| Business | 1,397 | 15.2% |
| Education | 645 | 7.0% |
| Literature & Languages | 510 | 5.6% |
| Liberal Arts & History | 521 | 5.7% |
| Visual & Performing Arts | 270 | 2.9% |
| Communications | 775 | 8.5% |
| Arts & Humanities | 502 | 5.5% |
| Total | 9,169 | 100.0% |
Transportation & Commute in Brushy Creek
Vehicle Availability by Sex in Brushy Creek
The most prevalent vehicle ownership categories in Brushy Creek are males with 2 vehicles (3,366, accounting for 50.6%) and females with 2 vehicles (2,673, making up 65.0%).
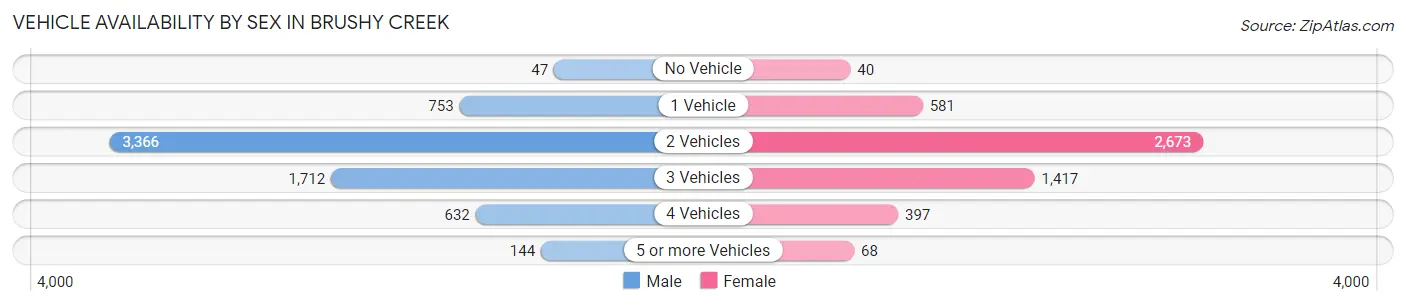
| Vehicles Available | Male | Female |
| No Vehicle | 47 (0.7%) | 40 (0.8%) |
| 1 Vehicle | 753 (11.3%) | 581 (11.2%) |
| 2 Vehicles | 3,366 (50.6%) | 2,673 (51.6%) |
| 3 Vehicles | 1,712 (25.7%) | 1,417 (27.4%) |
| 4 Vehicles | 632 (9.5%) | 397 (7.7%) |
| 5 or more Vehicles | 144 (2.2%) | 68 (1.3%) |
| Total | 6,654 (100.0%) | 5,176 (100.0%) |
Commute Time in Brushy Creek
The most frequently occuring commute durations in Brushy Creek are 20 to 24 minutes (1,821 commuters, 20.3%), 30 to 34 minutes (1,560 commuters, 17.4%), and 15 to 19 minutes (1,481 commuters, 16.5%).
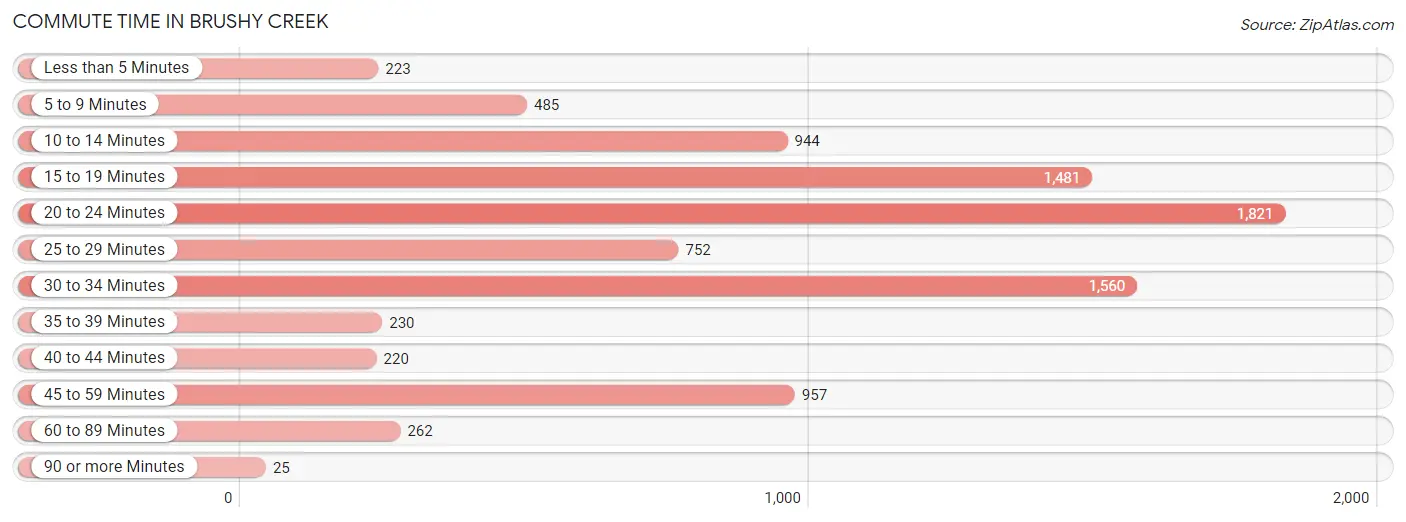
| Commute Time | # Commuters | % Commuters |
| Less than 5 Minutes | 223 | 2.5% |
| 5 to 9 Minutes | 485 | 5.4% |
| 10 to 14 Minutes | 944 | 10.5% |
| 15 to 19 Minutes | 1,481 | 16.5% |
| 20 to 24 Minutes | 1,821 | 20.3% |
| 25 to 29 Minutes | 752 | 8.4% |
| 30 to 34 Minutes | 1,560 | 17.4% |
| 35 to 39 Minutes | 230 | 2.6% |
| 40 to 44 Minutes | 220 | 2.5% |
| 45 to 59 Minutes | 957 | 10.7% |
| 60 to 89 Minutes | 262 | 2.9% |
| 90 or more Minutes | 25 | 0.3% |
Commute Time by Sex in Brushy Creek
The most common commute times in Brushy Creek are 30 to 34 minutes (1,054 commuters, 20.6%) for males and 20 to 24 minutes (783 commuters, 20.4%) for females.
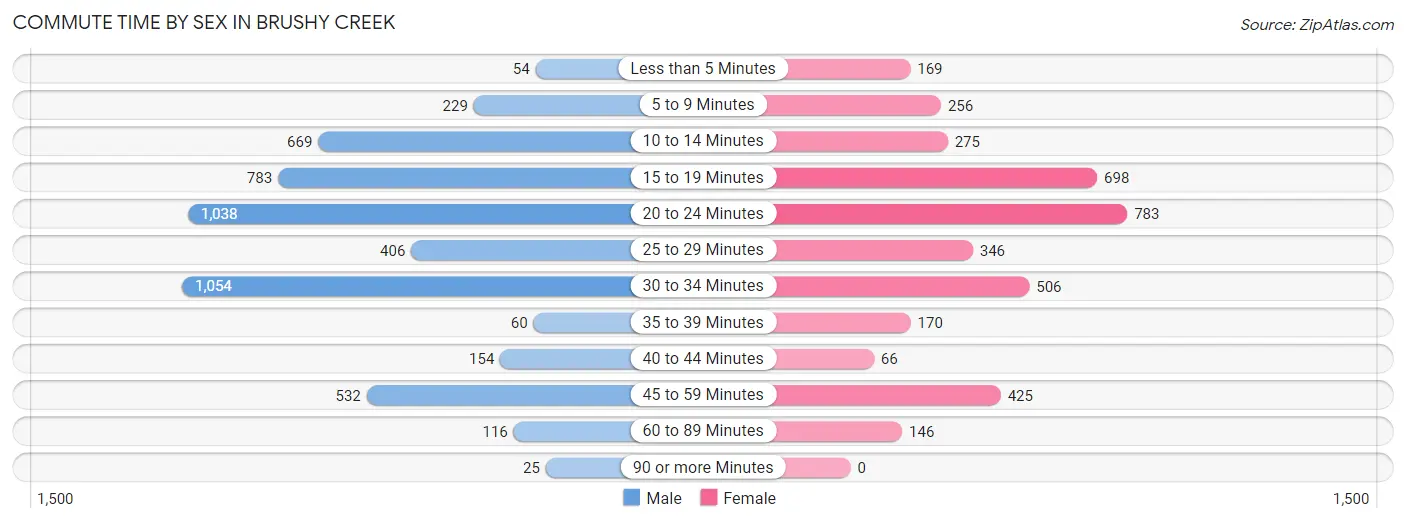
| Commute Time | Male | Female |
| Less than 5 Minutes | 54 (1.1%) | 169 (4.4%) |
| 5 to 9 Minutes | 229 (4.5%) | 256 (6.7%) |
| 10 to 14 Minutes | 669 (13.1%) | 275 (7.2%) |
| 15 to 19 Minutes | 783 (15.3%) | 698 (18.2%) |
| 20 to 24 Minutes | 1,038 (20.3%) | 783 (20.4%) |
| 25 to 29 Minutes | 406 (7.9%) | 346 (9.0%) |
| 30 to 34 Minutes | 1,054 (20.6%) | 506 (13.2%) |
| 35 to 39 Minutes | 60 (1.2%) | 170 (4.4%) |
| 40 to 44 Minutes | 154 (3.0%) | 66 (1.7%) |
| 45 to 59 Minutes | 532 (10.4%) | 425 (11.1%) |
| 60 to 89 Minutes | 116 (2.3%) | 146 (3.8%) |
| 90 or more Minutes | 25 (0.5%) | 0 (0.0%) |
Time of Departure to Work by Sex in Brushy Creek
The most frequent times of departure to work in Brushy Creek are 7:00 AM to 7:29 AM (748, 14.6%) for males and 7:30 AM to 7:59 AM (718, 18.7%) for females.
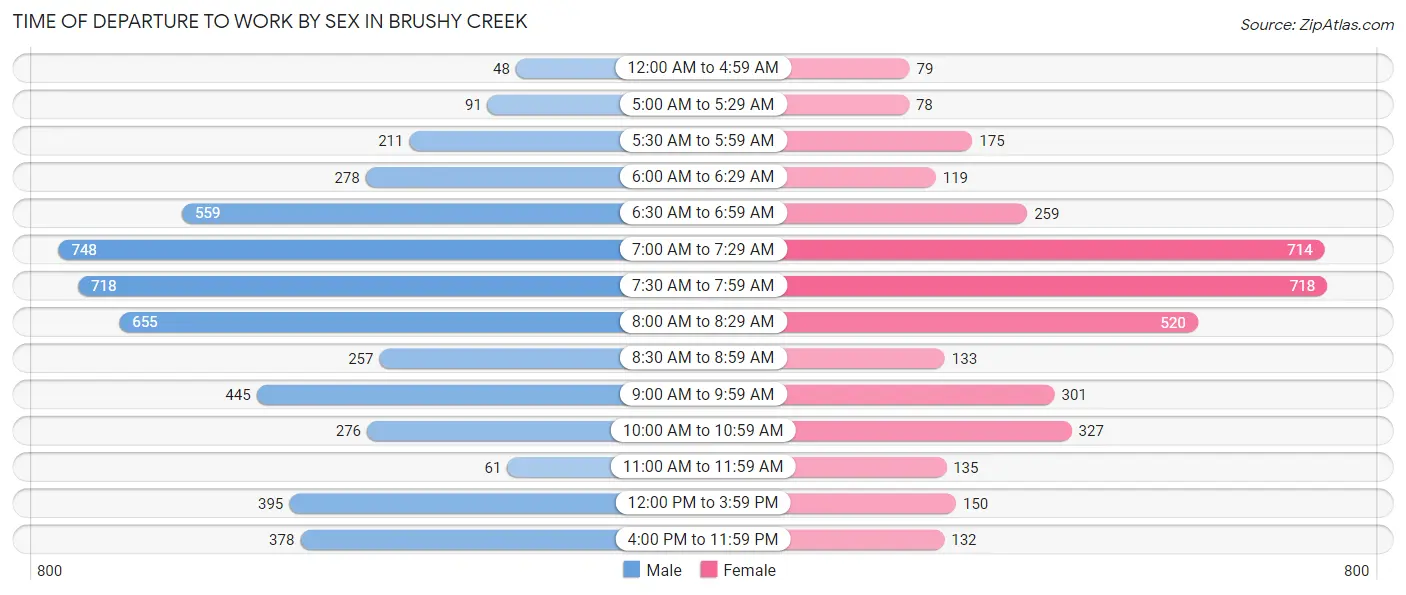
| Time of Departure | Male | Female |
| 12:00 AM to 4:59 AM | 48 (0.9%) | 79 (2.1%) |
| 5:00 AM to 5:29 AM | 91 (1.8%) | 78 (2.0%) |
| 5:30 AM to 5:59 AM | 211 (4.1%) | 175 (4.6%) |
| 6:00 AM to 6:29 AM | 278 (5.4%) | 119 (3.1%) |
| 6:30 AM to 6:59 AM | 559 (10.9%) | 259 (6.7%) |
| 7:00 AM to 7:29 AM | 748 (14.6%) | 714 (18.6%) |
| 7:30 AM to 7:59 AM | 718 (14.0%) | 718 (18.7%) |
| 8:00 AM to 8:29 AM | 655 (12.8%) | 520 (13.5%) |
| 8:30 AM to 8:59 AM | 257 (5.0%) | 133 (3.5%) |
| 9:00 AM to 9:59 AM | 445 (8.7%) | 301 (7.8%) |
| 10:00 AM to 10:59 AM | 276 (5.4%) | 327 (8.5%) |
| 11:00 AM to 11:59 AM | 61 (1.2%) | 135 (3.5%) |
| 12:00 PM to 3:59 PM | 395 (7.7%) | 150 (3.9%) |
| 4:00 PM to 11:59 PM | 378 (7.4%) | 132 (3.4%) |
| Total | 5,120 (100.0%) | 3,840 (100.0%) |
Housing Occupancy in Brushy Creek
Occupancy by Ownership in Brushy Creek
Of the total 7,631 dwellings in Brushy Creek, owner-occupied units account for 5,722 (75.0%), while renter-occupied units make up 1,909 (25.0%).
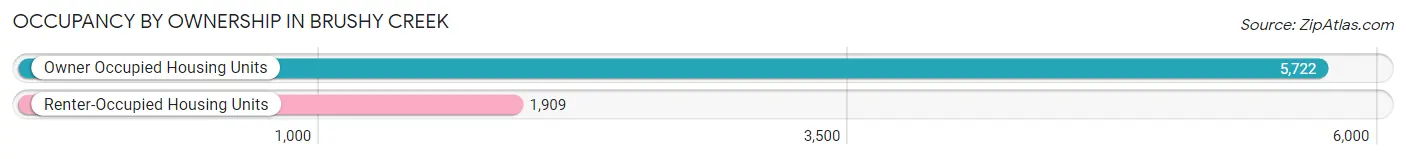
| Occupancy | # Housing Units | % Housing Units |
| Owner Occupied Housing Units | 5,722 | 75.0% |
| Renter-Occupied Housing Units | 1,909 | 25.0% |
| Total Occupied Housing Units | 7,631 | 100.0% |
Occupancy by Household Size in Brushy Creek
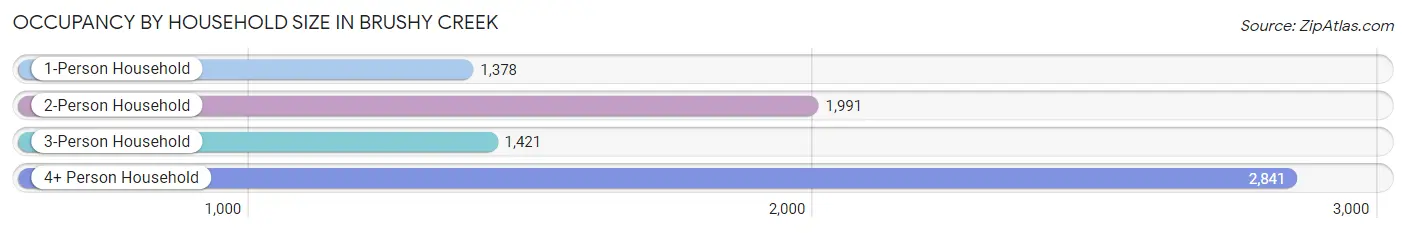
| Household Size | # Housing Units | % Housing Units |
| 1-Person Household | 1,378 | 18.1% |
| 2-Person Household | 1,991 | 26.1% |
| 3-Person Household | 1,421 | 18.6% |
| 4+ Person Household | 2,841 | 37.2% |
| Total Housing Units | 7,631 | 100.0% |
Occupancy by Ownership by Household Size in Brushy Creek
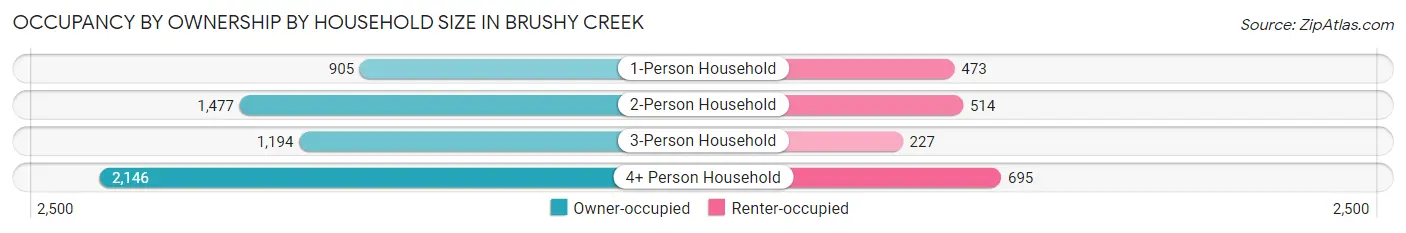
| Household Size | Owner-occupied | Renter-occupied |
| 1-Person Household | 905 (65.7%) | 473 (34.3%) |
| 2-Person Household | 1,477 (74.2%) | 514 (25.8%) |
| 3-Person Household | 1,194 (84.0%) | 227 (16.0%) |
| 4+ Person Household | 2,146 (75.5%) | 695 (24.5%) |
| Total Housing Units | 5,722 (75.0%) | 1,909 (25.0%) |
Occupancy by Educational Attainment in Brushy Creek
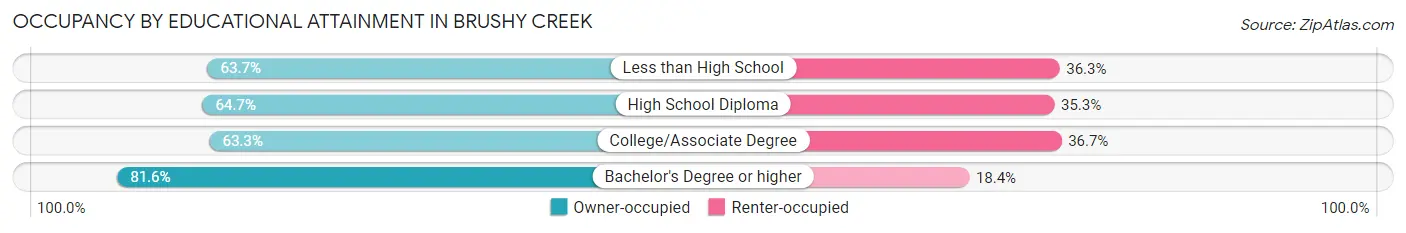
| Household Size | Owner-occupied | Renter-occupied |
| Less than High School | 86 (63.7%) | 49 (36.3%) |
| High School Diploma | 378 (64.7%) | 206 (35.3%) |
| College/Associate Degree | 1,326 (63.3%) | 768 (36.7%) |
| Bachelor's Degree or higher | 3,932 (81.6%) | 886 (18.4%) |
Occupancy by Age of Householder in Brushy Creek
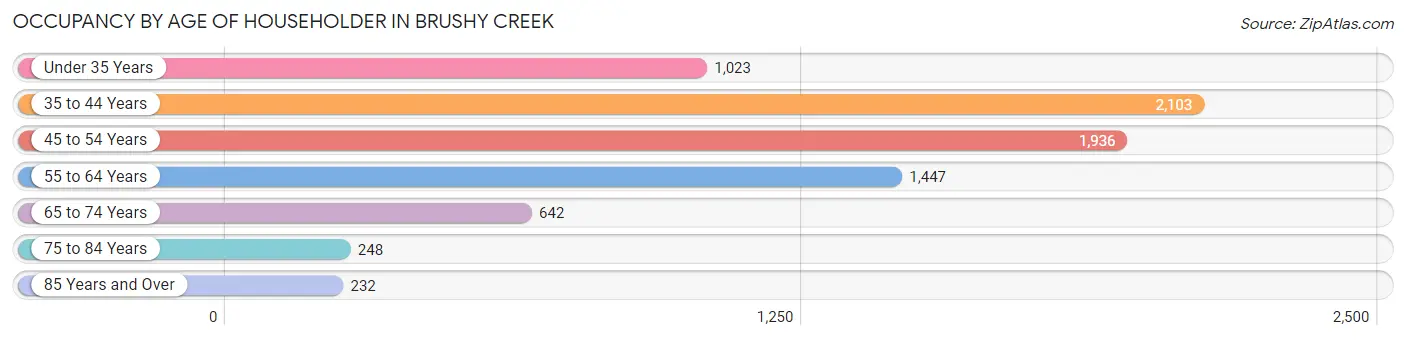
| Age Bracket | # Households | % Households |
| Under 35 Years | 1,023 | 13.4% |
| 35 to 44 Years | 2,103 | 27.6% |
| 45 to 54 Years | 1,936 | 25.4% |
| 55 to 64 Years | 1,447 | 19.0% |
| 65 to 74 Years | 642 | 8.4% |
| 75 to 84 Years | 248 | 3.3% |
| 85 Years and Over | 232 | 3.0% |
| Total | 7,631 | 100.0% |
Housing Finances in Brushy Creek
Median Income by Occupancy in Brushy Creek
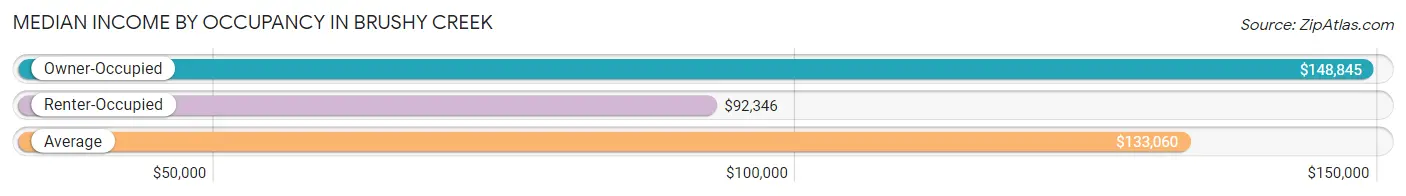
| Occupancy Type | # Households | Median Income |
| Owner-Occupied | 5,722 (75.0%) | $148,845 |
| Renter-Occupied | 1,909 (25.0%) | $92,346 |
| Average | 7,631 (100.0%) | $133,060 |
Occupancy by Householder Income Bracket in Brushy Creek
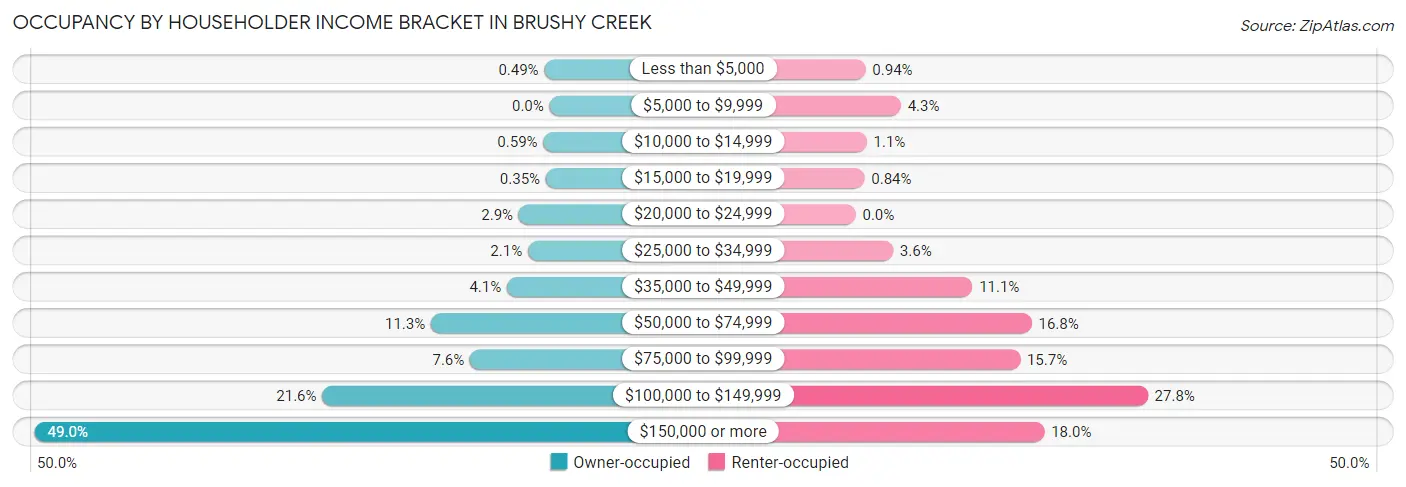
| Income Bracket | Owner-occupied | Renter-occupied |
| Less than $5,000 | 28 (0.5%) | 18 (0.9%) |
| $5,000 to $9,999 | 0 (0.0%) | 82 (4.3%) |
| $10,000 to $14,999 | 34 (0.6%) | 20 (1.1%) |
| $15,000 to $19,999 | 20 (0.4%) | 16 (0.8%) |
| $20,000 to $24,999 | 167 (2.9%) | 0 (0.0%) |
| $25,000 to $34,999 | 118 (2.1%) | 68 (3.6%) |
| $35,000 to $49,999 | 232 (4.1%) | 212 (11.1%) |
| $50,000 to $74,999 | 646 (11.3%) | 320 (16.8%) |
| $75,000 to $99,999 | 433 (7.6%) | 299 (15.7%) |
| $100,000 to $149,999 | 1,238 (21.6%) | 531 (27.8%) |
| $150,000 or more | 2,806 (49.0%) | 343 (18.0%) |
| Total | 5,722 (100.0%) | 1,909 (100.0%) |
Monthly Housing Cost Tiers in Brushy Creek
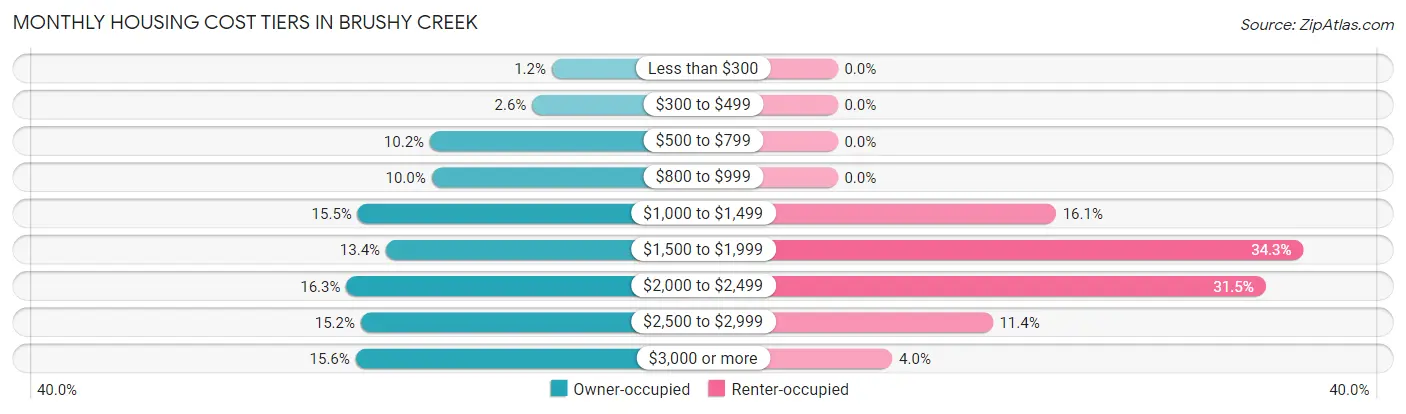
| Monthly Cost | Owner-occupied | Renter-occupied |
| Less than $300 | 67 (1.2%) | 0 (0.0%) |
| $300 to $499 | 150 (2.6%) | 0 (0.0%) |
| $500 to $799 | 581 (10.2%) | 0 (0.0%) |
| $800 to $999 | 574 (10.0%) | 0 (0.0%) |
| $1,000 to $1,499 | 885 (15.5%) | 307 (16.1%) |
| $1,500 to $1,999 | 766 (13.4%) | 655 (34.3%) |
| $2,000 to $2,499 | 933 (16.3%) | 602 (31.5%) |
| $2,500 to $2,999 | 872 (15.2%) | 218 (11.4%) |
| $3,000 or more | 894 (15.6%) | 77 (4.0%) |
| Total | 5,722 (100.0%) | 1,909 (100.0%) |
Physical Housing Characteristics in Brushy Creek
Housing Structures in Brushy Creek
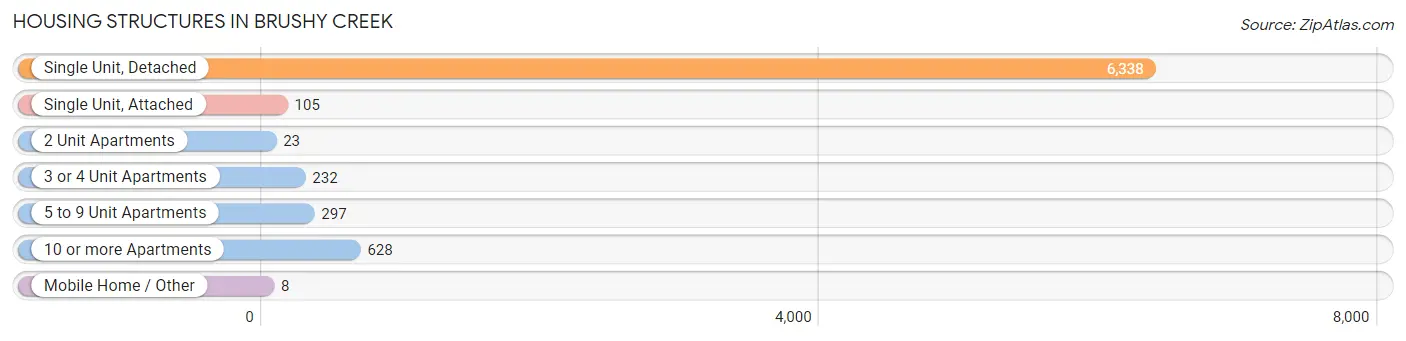
| Structure Type | # Housing Units | % Housing Units |
| Single Unit, Detached | 6,338 | 83.1% |
| Single Unit, Attached | 105 | 1.4% |
| 2 Unit Apartments | 23 | 0.3% |
| 3 or 4 Unit Apartments | 232 | 3.0% |
| 5 to 9 Unit Apartments | 297 | 3.9% |
| 10 or more Apartments | 628 | 8.2% |
| Mobile Home / Other | 8 | 0.1% |
| Total | 7,631 | 100.0% |
Housing Structures by Occupancy in Brushy Creek
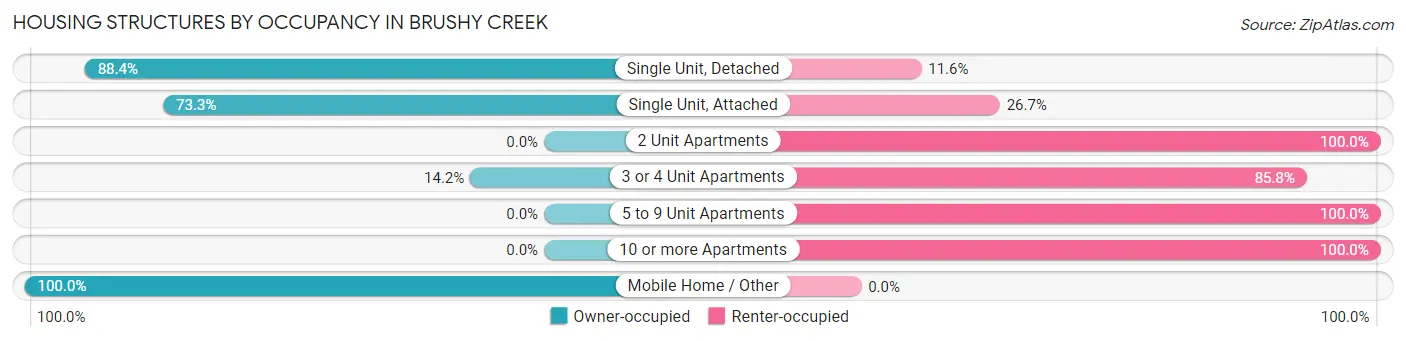
| Structure Type | Owner-occupied | Renter-occupied |
| Single Unit, Detached | 5,604 (88.4%) | 734 (11.6%) |
| Single Unit, Attached | 77 (73.3%) | 28 (26.7%) |
| 2 Unit Apartments | 0 (0.0%) | 23 (100.0%) |
| 3 or 4 Unit Apartments | 33 (14.2%) | 199 (85.8%) |
| 5 to 9 Unit Apartments | 0 (0.0%) | 297 (100.0%) |
| 10 or more Apartments | 0 (0.0%) | 628 (100.0%) |
| Mobile Home / Other | 8 (100.0%) | 0 (0.0%) |
| Total | 5,722 (75.0%) | 1,909 (25.0%) |
Housing Structures by Number of Rooms in Brushy Creek
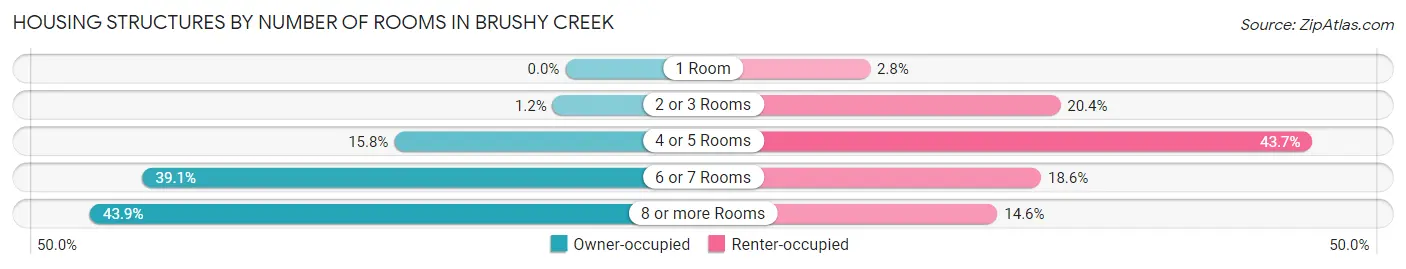
| Number of Rooms | Owner-occupied | Renter-occupied |
| 1 Room | 0 (0.0%) | 53 (2.8%) |
| 2 or 3 Rooms | 67 (1.2%) | 389 (20.4%) |
| 4 or 5 Rooms | 905 (15.8%) | 834 (43.7%) |
| 6 or 7 Rooms | 2,236 (39.1%) | 355 (18.6%) |
| 8 or more Rooms | 2,514 (43.9%) | 278 (14.6%) |
| Total | 5,722 (100.0%) | 1,909 (100.0%) |
Housing Structure by Heating Type in Brushy Creek
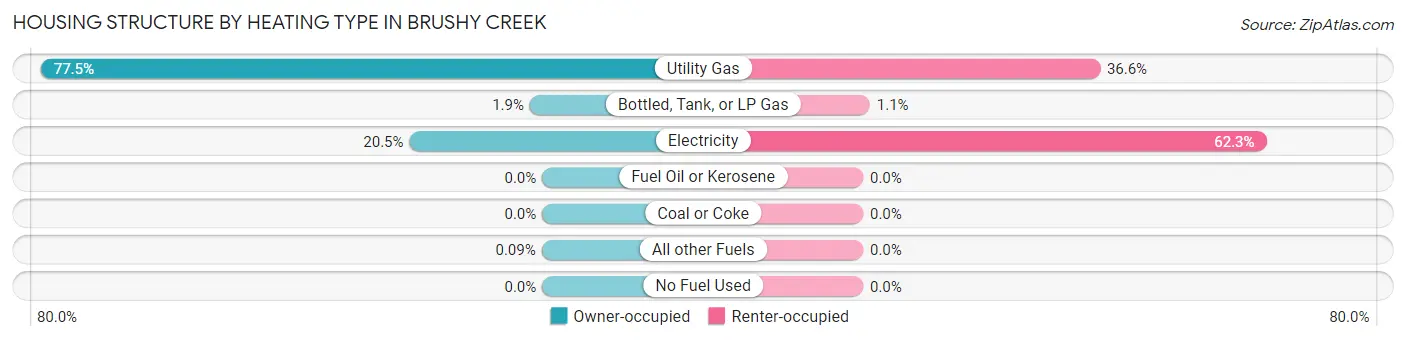
| Heating Type | Owner-occupied | Renter-occupied |
| Utility Gas | 4,434 (77.5%) | 699 (36.6%) |
| Bottled, Tank, or LP Gas | 109 (1.9%) | 20 (1.1%) |
| Electricity | 1,174 (20.5%) | 1,190 (62.3%) |
| Fuel Oil or Kerosene | 0 (0.0%) | 0 (0.0%) |
| Coal or Coke | 0 (0.0%) | 0 (0.0%) |
| All other Fuels | 5 (0.1%) | 0 (0.0%) |
| No Fuel Used | 0 (0.0%) | 0 (0.0%) |
| Total | 5,722 (100.0%) | 1,909 (100.0%) |
Household Vehicle Usage in Brushy Creek
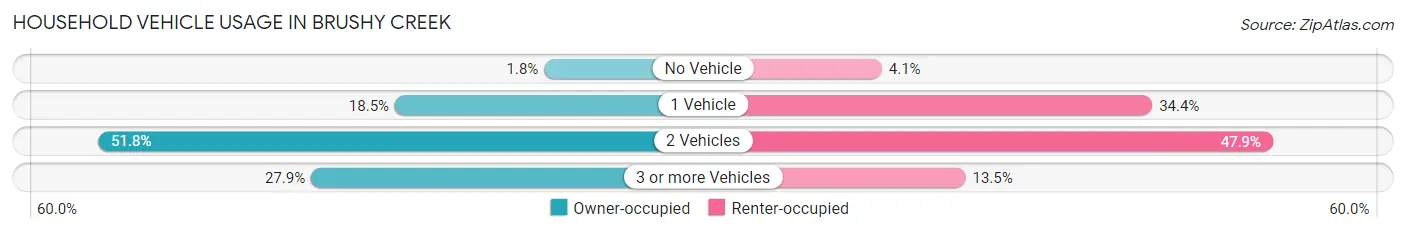
| Vehicles per Household | Owner-occupied | Renter-occupied |
| No Vehicle | 103 (1.8%) | 79 (4.1%) |
| 1 Vehicle | 1,060 (18.5%) | 657 (34.4%) |
| 2 Vehicles | 2,962 (51.8%) | 915 (47.9%) |
| 3 or more Vehicles | 1,597 (27.9%) | 258 (13.5%) |
| Total | 5,722 (100.0%) | 1,909 (100.0%) |
Real Estate & Mortgages in Brushy Creek
Real Estate and Mortgage Overview in Brushy Creek
| Characteristic | Without Mortgage | With Mortgage |
| Housing Units | 2,130 | 3,592 |
| Median Property Value | $364,000 | $435,900 |
| Median Household Income | $121,552 | $1,993 |
| Monthly Housing Costs | $916 | $894 |
| Real Estate Taxes | $6,543 | $14 |
Property Value by Mortgage Status in Brushy Creek
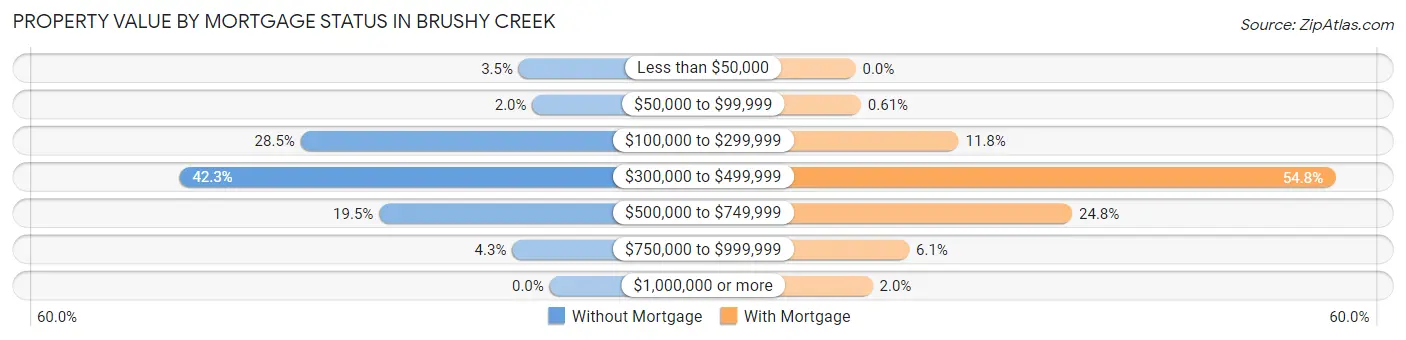
| Property Value | Without Mortgage | With Mortgage |
| Less than $50,000 | 75 (3.5%) | 0 (0.0%) |
| $50,000 to $99,999 | 42 (2.0%) | 22 (0.6%) |
| $100,000 to $299,999 | 606 (28.4%) | 423 (11.8%) |
| $300,000 to $499,999 | 901 (42.3%) | 1,968 (54.8%) |
| $500,000 to $749,999 | 415 (19.5%) | 889 (24.7%) |
| $750,000 to $999,999 | 91 (4.3%) | 220 (6.1%) |
| $1,000,000 or more | 0 (0.0%) | 70 (1.9%) |
| Total | 2,130 (100.0%) | 3,592 (100.0%) |
Household Income by Mortgage Status in Brushy Creek
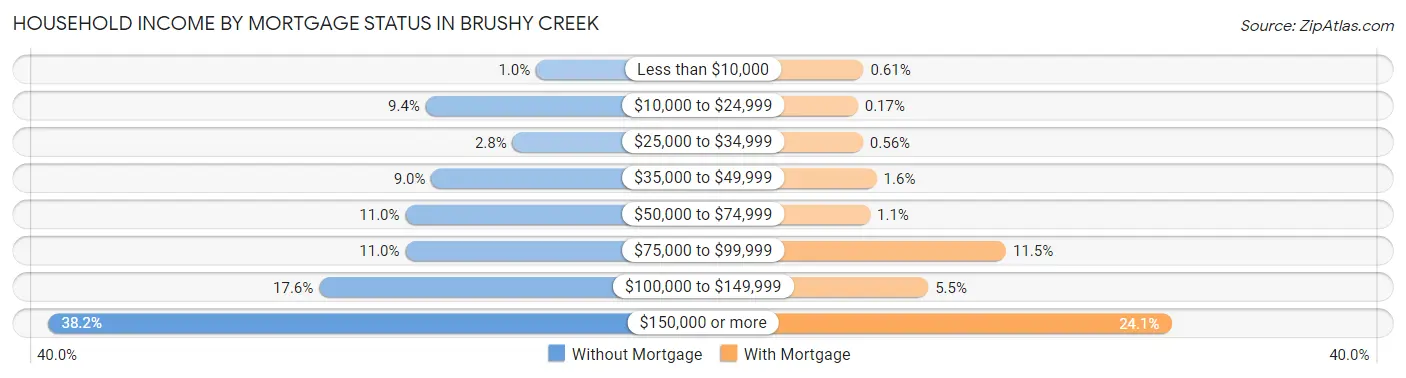
| Household Income | Without Mortgage | With Mortgage |
| Less than $10,000 | 22 (1.0%) | 22 (0.6%) |
| $10,000 to $24,999 | 201 (9.4%) | 6 (0.2%) |
| $25,000 to $34,999 | 60 (2.8%) | 20 (0.6%) |
| $35,000 to $49,999 | 192 (9.0%) | 58 (1.6%) |
| $50,000 to $74,999 | 234 (11.0%) | 40 (1.1%) |
| $75,000 to $99,999 | 234 (11.0%) | 412 (11.5%) |
| $100,000 to $149,999 | 374 (17.6%) | 199 (5.5%) |
| $150,000 or more | 813 (38.2%) | 864 (24.0%) |
| Total | 2,130 (100.0%) | 3,592 (100.0%) |
Property Value to Household Income Ratio in Brushy Creek
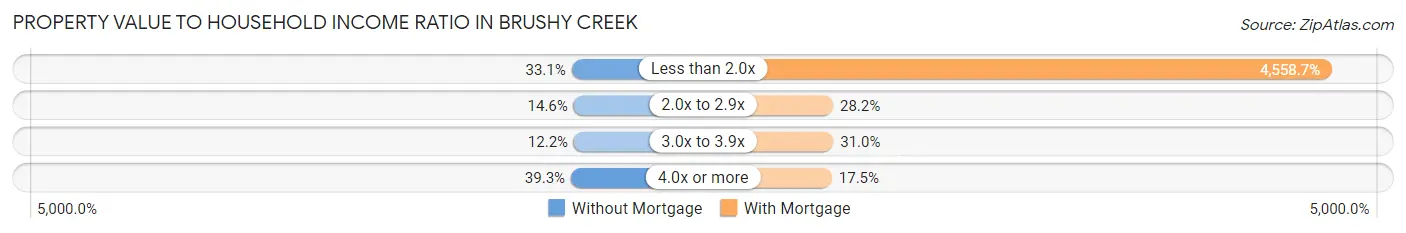
| Value-to-Income Ratio | Without Mortgage | With Mortgage |
| Less than 2.0x | 704 (33.1%) | 163,750 (4,558.7%) |
| 2.0x to 2.9x | 311 (14.6%) | 1,011 (28.1%) |
| 3.0x to 3.9x | 260 (12.2%) | 1,114 (31.0%) |
| 4.0x or more | 838 (39.3%) | 628 (17.5%) |
| Total | 2,130 (100.0%) | 3,592 (100.0%) |
Real Estate Taxes by Mortgage Status in Brushy Creek
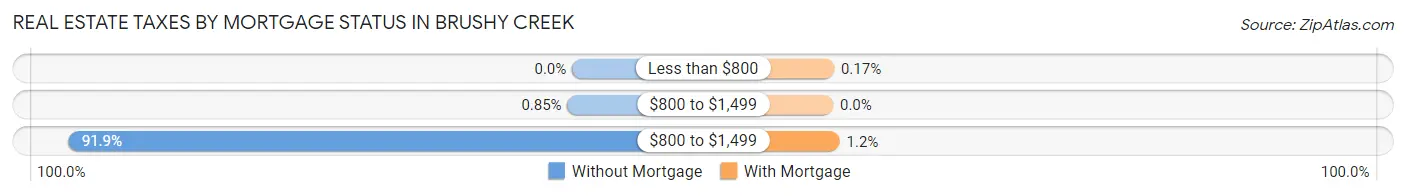
| Property Taxes | Without Mortgage | With Mortgage |
| Less than $800 | 0 (0.0%) | 6 (0.2%) |
| $800 to $1,499 | 18 (0.9%) | 0 (0.0%) |
| $800 to $1,499 | 1,958 (91.9%) | 43 (1.2%) |
| Total | 2,130 (100.0%) | 3,592 (100.0%) |
Health & Disability in Brushy Creek
Health Insurance Coverage by Age in Brushy Creek
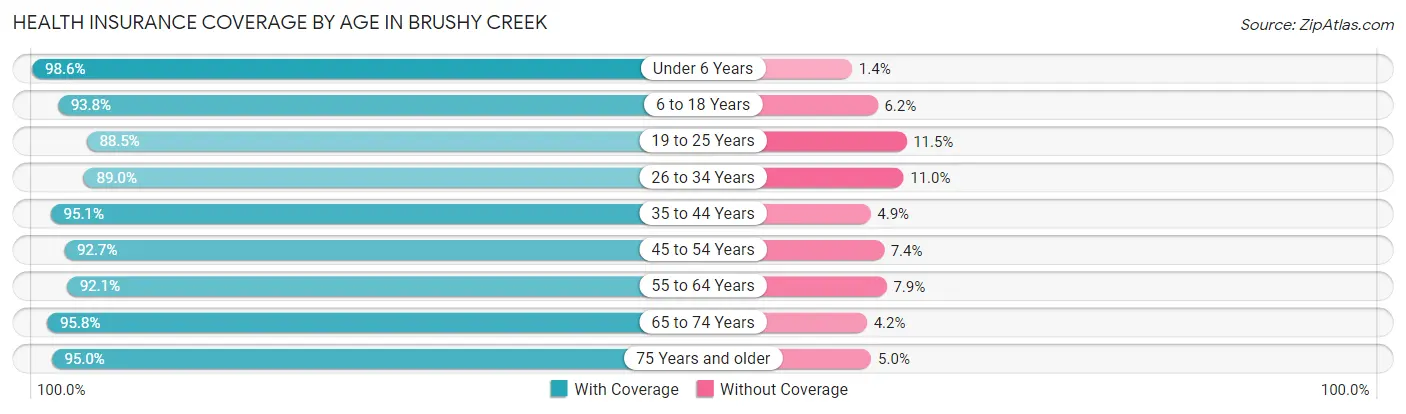
| Age Bracket | With Coverage | Without Coverage |
| Under 6 Years | 1,113 (98.6%) | 16 (1.4%) |
| 6 to 18 Years | 5,013 (93.8%) | 330 (6.2%) |
| 19 to 25 Years | 1,234 (88.5%) | 161 (11.5%) |
| 26 to 34 Years | 1,867 (89.0%) | 231 (11.0%) |
| 35 to 44 Years | 3,644 (95.1%) | 186 (4.9%) |
| 45 to 54 Years | 3,477 (92.6%) | 276 (7.3%) |
| 55 to 64 Years | 2,425 (92.1%) | 207 (7.9%) |
| 65 to 74 Years | 1,168 (95.8%) | 51 (4.2%) |
| 75 Years and older | 815 (95.0%) | 43 (5.0%) |
| Total | 20,756 (93.3%) | 1,501 (6.7%) |
Health Insurance Coverage by Citizenship Status in Brushy Creek
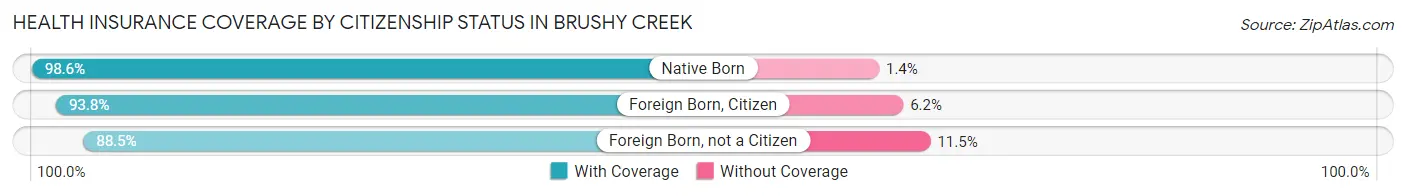
| Citizenship Status | With Coverage | Without Coverage |
| Native Born | 1,113 (98.6%) | 16 (1.4%) |
| Foreign Born, Citizen | 5,013 (93.8%) | 330 (6.2%) |
| Foreign Born, not a Citizen | 1,234 (88.5%) | 161 (11.5%) |
Health Insurance Coverage by Household Income in Brushy Creek
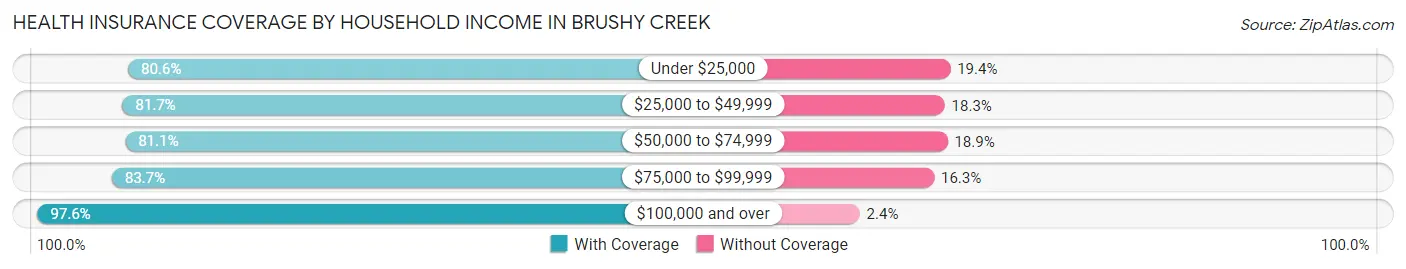
| Household Income | With Coverage | Without Coverage |
| Under $25,000 | 416 (80.6%) | 100 (19.4%) |
| $25,000 to $49,999 | 1,123 (81.7%) | 252 (18.3%) |
| $50,000 to $74,999 | 1,872 (81.1%) | 435 (18.9%) |
| $75,000 to $99,999 | 1,664 (83.7%) | 325 (16.3%) |
| $100,000 and over | 15,657 (97.6%) | 386 (2.4%) |
Public vs Private Health Insurance Coverage by Age in Brushy Creek
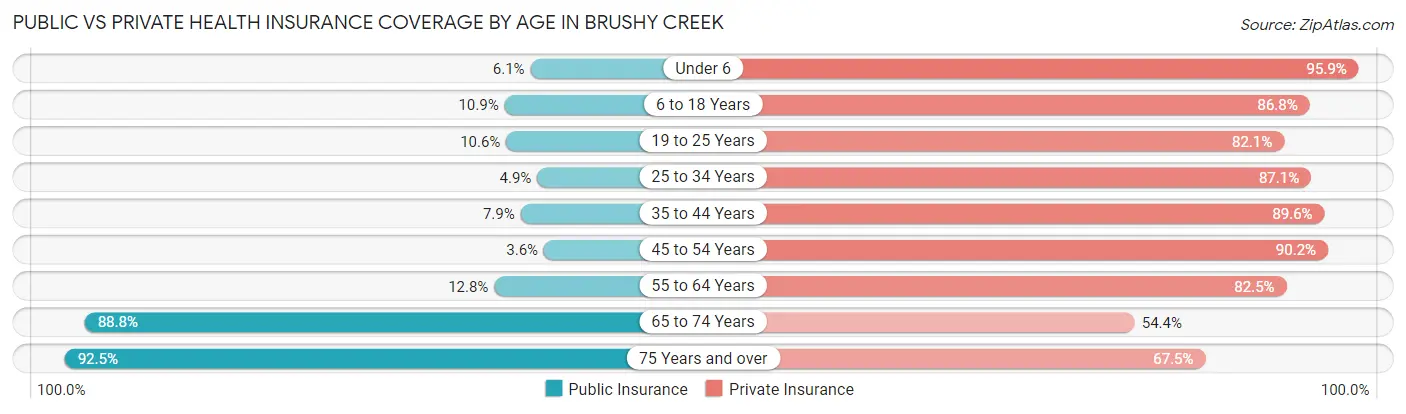
| Age Bracket | Public Insurance | Private Insurance |
| Under 6 | 69 (6.1%) | 1,083 (95.9%) |
| 6 to 18 Years | 584 (10.9%) | 4,639 (86.8%) |
| 19 to 25 Years | 148 (10.6%) | 1,145 (82.1%) |
| 25 to 34 Years | 102 (4.9%) | 1,827 (87.1%) |
| 35 to 44 Years | 304 (7.9%) | 3,431 (89.6%) |
| 45 to 54 Years | 135 (3.6%) | 3,386 (90.2%) |
| 55 to 64 Years | 338 (12.8%) | 2,172 (82.5%) |
| 65 to 74 Years | 1,083 (88.8%) | 663 (54.4%) |
| 75 Years and over | 794 (92.5%) | 579 (67.5%) |
| Total | 3,557 (16.0%) | 18,925 (85.0%) |
Disability Status by Sex by Age in Brushy Creek
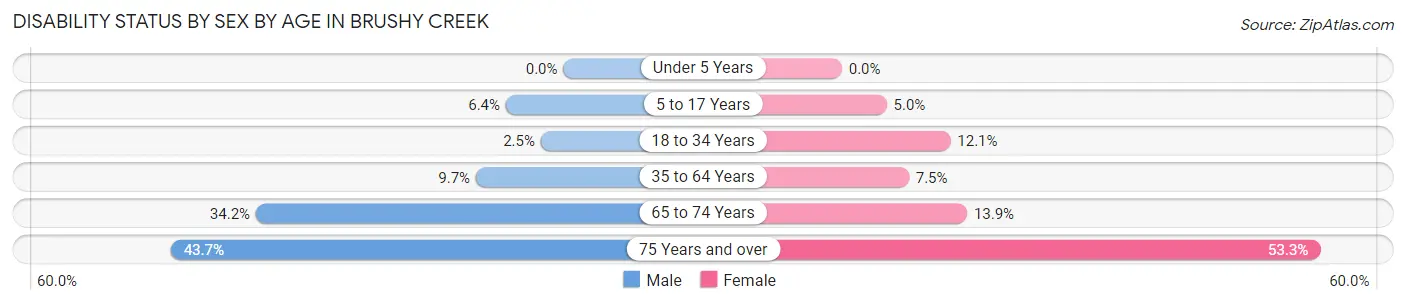
| Age Bracket | Male | Female |
| Under 5 Years | 0 (0.0%) | 0 (0.0%) |
| 5 to 17 Years | 198 (6.4%) | 110 (5.0%) |
| 18 to 34 Years | 49 (2.5%) | 214 (12.1%) |
| 35 to 64 Years | 517 (9.7%) | 366 (7.5%) |
| 65 to 74 Years | 189 (34.2%) | 93 (13.9%) |
| 75 Years and over | 188 (43.7%) | 228 (53.3%) |
Disability Class by Sex by Age in Brushy Creek
Disability Class: Hearing Difficulty
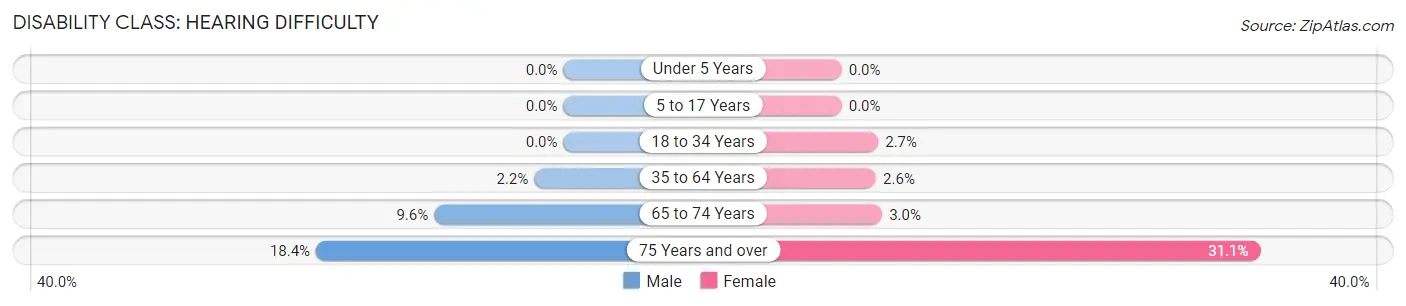
| Age Bracket | Male | Female |
| Under 5 Years | 0 (0.0%) | 0 (0.0%) |
| 5 to 17 Years | 0 (0.0%) | 0 (0.0%) |
| 18 to 34 Years | 0 (0.0%) | 48 (2.7%) |
| 35 to 64 Years | 115 (2.2%) | 125 (2.5%) |
| 65 to 74 Years | 53 (9.6%) | 20 (3.0%) |
| 75 Years and over | 79 (18.4%) | 133 (31.1%) |
Disability Class: Vision Difficulty
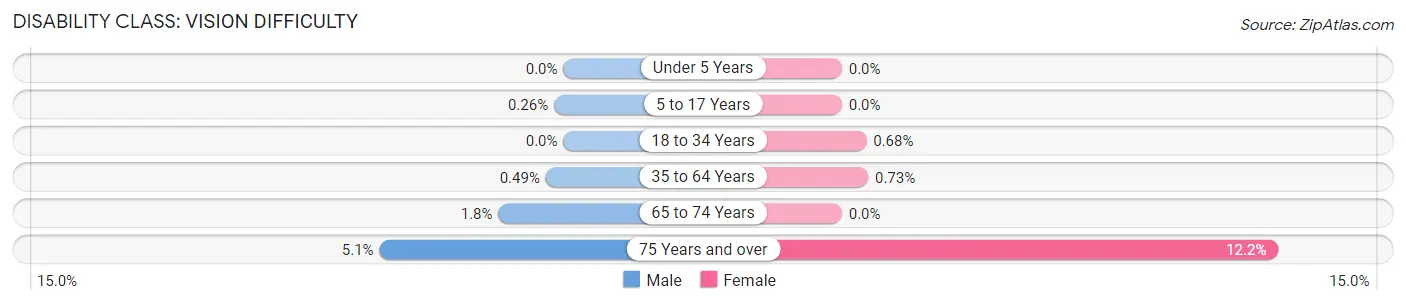
| Age Bracket | Male | Female |
| Under 5 Years | 0 (0.0%) | 0 (0.0%) |
| 5 to 17 Years | 8 (0.3%) | 0 (0.0%) |
| 18 to 34 Years | 0 (0.0%) | 12 (0.7%) |
| 35 to 64 Years | 26 (0.5%) | 36 (0.7%) |
| 65 to 74 Years | 10 (1.8%) | 0 (0.0%) |
| 75 Years and over | 22 (5.1%) | 52 (12.1%) |
Disability Class: Cognitive Difficulty
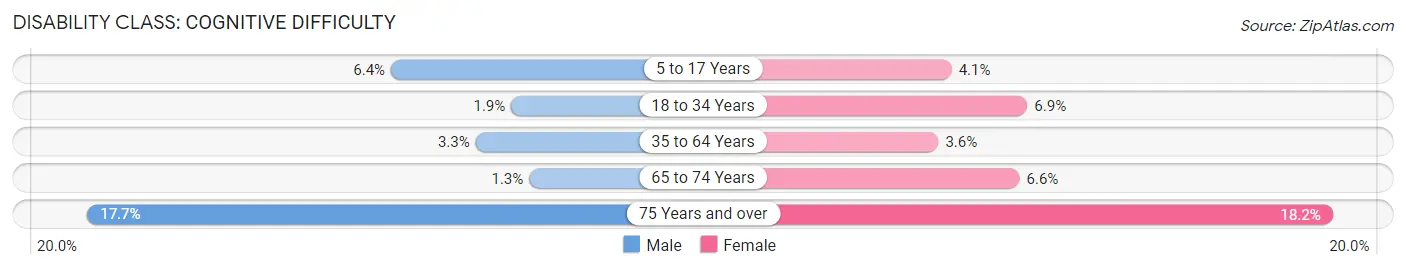
| Age Bracket | Male | Female |
| 5 to 17 Years | 198 (6.4%) | 90 (4.1%) |
| 18 to 34 Years | 38 (1.9%) | 122 (6.9%) |
| 35 to 64 Years | 173 (3.3%) | 176 (3.6%) |
| 65 to 74 Years | 7 (1.3%) | 44 (6.6%) |
| 75 Years and over | 76 (17.7%) | 78 (18.2%) |
Disability Class: Ambulatory Difficulty
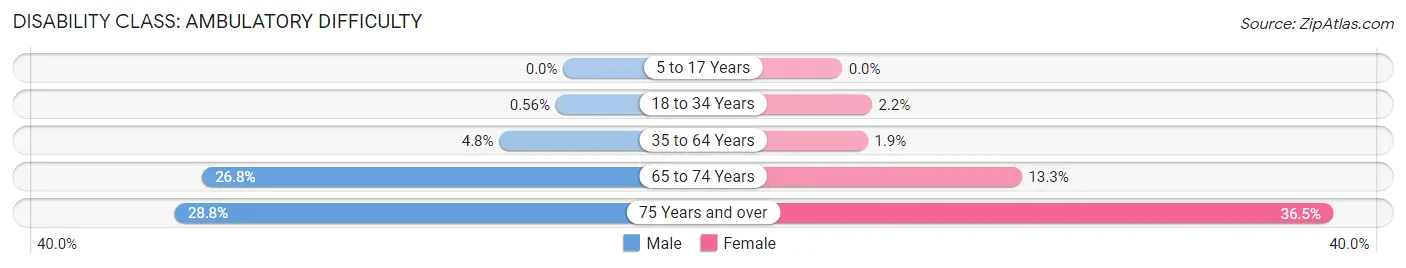
| Age Bracket | Male | Female |
| 5 to 17 Years | 0 (0.0%) | 0 (0.0%) |
| 18 to 34 Years | 11 (0.6%) | 39 (2.2%) |
| 35 to 64 Years | 252 (4.8%) | 94 (1.9%) |
| 65 to 74 Years | 148 (26.8%) | 89 (13.3%) |
| 75 Years and over | 124 (28.8%) | 156 (36.4%) |
Disability Class: Self-Care Difficulty
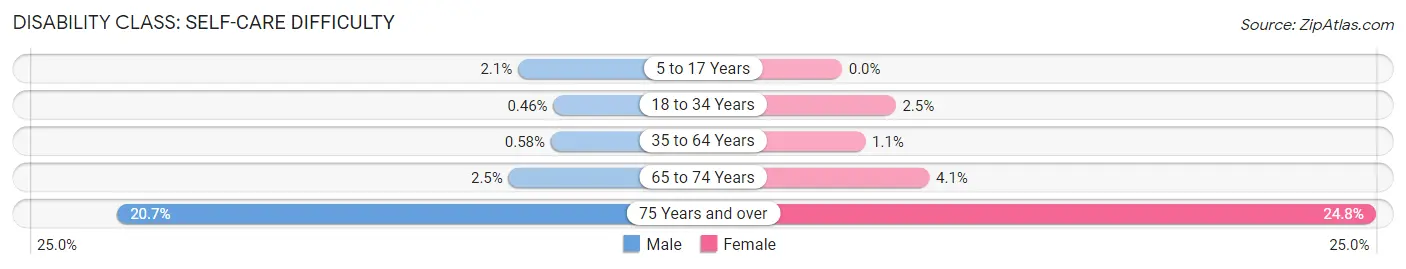
| Age Bracket | Male | Female |
| 5 to 17 Years | 65 (2.1%) | 0 (0.0%) |
| 18 to 34 Years | 9 (0.5%) | 44 (2.5%) |
| 35 to 64 Years | 31 (0.6%) | 53 (1.1%) |
| 65 to 74 Years | 14 (2.5%) | 27 (4.1%) |
| 75 Years and over | 89 (20.7%) | 106 (24.8%) |
Technology Access in Brushy Creek
Computing Device Access in Brushy Creek
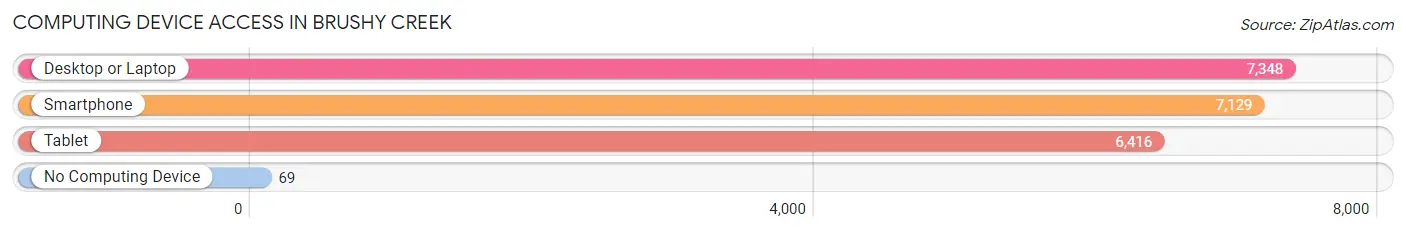
| Device Type | # Households | % Households |
| Desktop or Laptop | 7,348 | 96.3% |
| Smartphone | 7,129 | 93.4% |
| Tablet | 6,416 | 84.1% |
| No Computing Device | 69 | 0.9% |
| Total | 7,631 | 100.0% |
Internet Access in Brushy Creek
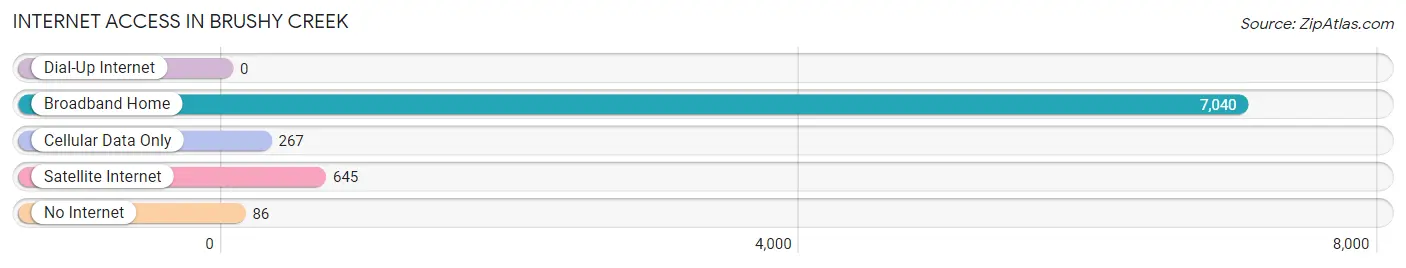
| Internet Type | # Households | % Households |
| Dial-Up Internet | 0 | 0.0% |
| Broadband Home | 7,040 | 92.3% |
| Cellular Data Only | 267 | 3.5% |
| Satellite Internet | 645 | 8.5% |
| No Internet | 86 | 1.1% |
| Total | 7,631 | 100.0% |
Brushy Creek Summary
Brushy Creek is a small unincorporated community located in Williamson County, Texas. It is situated about 25 miles north of Austin and is part of the Austin–Round Rock–Georgetown metropolitan area. The community is named after Brushy Creek, a tributary of the San Gabriel River that runs through the area.
History
The area that is now Brushy Creek was originally inhabited by the Tonkawa and Comanche Native American tribes. The first European settlers arrived in the area in the mid-1800s and established a small farming community. The community was officially established in 1876 when the Brushy Creek post office was established.
In the early 1900s, the community began to grow as more people moved to the area. The population peaked in the 1940s and 1950s, when the community had a population of around 500 people. The population began to decline in the 1960s and 1970s as people moved away from the area.
Geography
Brushy Creek is located in Williamson County, Texas. It is situated about 25 miles north of Austin and is part of the Austin–Round Rock–Georgetown metropolitan area. The community is located on the banks of Brushy Creek, a tributary of the San Gabriel River. The area is mostly flat with some rolling hills. The climate is humid subtropical with hot summers and mild winters.
Economy
The economy of Brushy Creek is largely based on agriculture. The area is home to several farms and ranches that produce a variety of crops and livestock. The community also has a few small businesses, including a gas station, a convenience store, and a few restaurants.
Demographics
As of the 2010 census, the population of Brushy Creek was 1,845. The racial makeup of the community was 79.3% White, 11.2% Hispanic or Latino, 6.2% African American, and 3.3% other. The median household income was $50,972 and the median home value was $179,400.
Conclusion
Brushy Creek is a small unincorporated community located in Williamson County, Texas. It is situated about 25 miles north of Austin and is part of the Austin–Round Rock–Georgetown metropolitan area. The community is named after Brushy Creek, a tributary of the San Gabriel River that runs through the area. The economy of Brushy Creek is largely based on agriculture, with some small businesses in the area. The population of Brushy Creek was 1,845 as of the 2010 census, with a median household income of $50,972 and a median home value of $179,400.
Common Questions
What is Per Capita Income in Brushy Creek?
Per Capita income in Brushy Creek is $53,528.
What is the Median Family Income in Brushy Creek?
Median Family Income in Brushy Creek is $143,750.
What is the Median Household income in Brushy Creek?
Median Household Income in Brushy Creek is $133,060.
What is Income or Wage Gap in Brushy Creek?
Income or Wage Gap in Brushy Creek is 48.0%.
Women in Brushy Creek earn 52.0 cents for every dollar earned by a man.
What is Inequality or Gini Index in Brushy Creek?
Inequality or Gini Index in Brushy Creek is 0.38.
What is the Total Population of Brushy Creek?
Total Population of Brushy Creek is 22,282.
What is the Total Male Population of Brushy Creek?
Total Male Population of Brushy Creek is 11,821.
What is the Total Female Population of Brushy Creek?
Total Female Population of Brushy Creek is 10,461.
What is the Ratio of Males per 100 Females in Brushy Creek?
There are 113.00 Males per 100 Females in Brushy Creek.
What is the Ratio of Females per 100 Males in Brushy Creek?
There are 88.50 Females per 100 Males in Brushy Creek.
What is the Median Population Age in Brushy Creek?
Median Population Age in Brushy Creek is 38.8 Years.
What is the Average Family Size in Brushy Creek
Average Family Size in Brushy Creek is 3.3 People.
What is the Average Household Size in Brushy Creek
Average Household Size in Brushy Creek is 2.9 People.
How Large is the Labor Force in Brushy Creek?
There are 12,394 People in the Labor Forcein in Brushy Creek.
What is the Percentage of People in the Labor Force in Brushy Creek?
74.0% of People are in the Labor Force in Brushy Creek.
What is the Unemployment Rate in Brushy Creek?
Unemployment Rate in Brushy Creek is 3.4%.