South Bay, FL Map & Demographics
South Bay Map
South Bay Overview
$9,350
PER CAPITA INCOME
$55,439
AVG FAMILY INCOME
$48,438
AVG HOUSEHOLD INCOME
8.4%
WAGE / INCOME GAP [ % ]
91.6¢/ $1
WAGE / INCOME GAP [ $ ]
$6,489
FAMILY INCOME DEFICIT
0.43
INEQUALITY / GINI INDEX
4,830
TOTAL POPULATION
3,592
MALE POPULATION
1,238
FEMALE POPULATION
290.15
MALES / 100 FEMALES
34.47
FEMALES / 100 MALES
40.9
MEDIAN AGE
3.6
AVG FAMILY SIZE
3.1
AVG HOUSEHOLD SIZE
1,056
LABOR FORCE [ PEOPLE ]
25.2%
PERCENT IN LABOR FORCE
9.4%
UNEMPLOYMENT RATE
South Bay Zip Codes
South Bay Area Codes
Income in South Bay
Income Overview in South Bay
Per Capita Income in South Bay is $9,350, while median incomes of families and households are $55,439 and $48,438 respectively.
| Characteristic | Number | Measure |
| Per Capita Income | 4,830 | $9,350 |
| Median Family Income | 551 | $55,439 |
| Mean Family Income | 551 | $62,586 |
| Median Household Income | 725 | $48,438 |
| Mean Household Income | 725 | $55,707 |
| Income Deficit | 551 | $6,489 |
| Wage / Income Gap (%) | 4,830 | 8.39% |
| Wage / Income Gap ($) | 4,830 | 91.61¢ per $1 |
| Gini / Inequality Index | 4,830 | 0.43 |
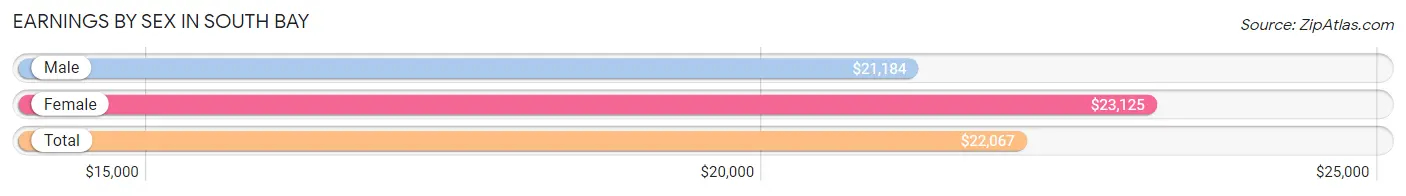
Earnings by Sex in South Bay
Average Earnings in South Bay are $22,067, $21,184 for men and $23,125 for women, a difference of 8.4%.
| Sex | Number | Average Earnings |
| Male | 708 (57.3%) | $21,184 |
| Female | 527 (42.7%) | $23,125 |
| Total | 1,235 (100.0%) | $22,067 |
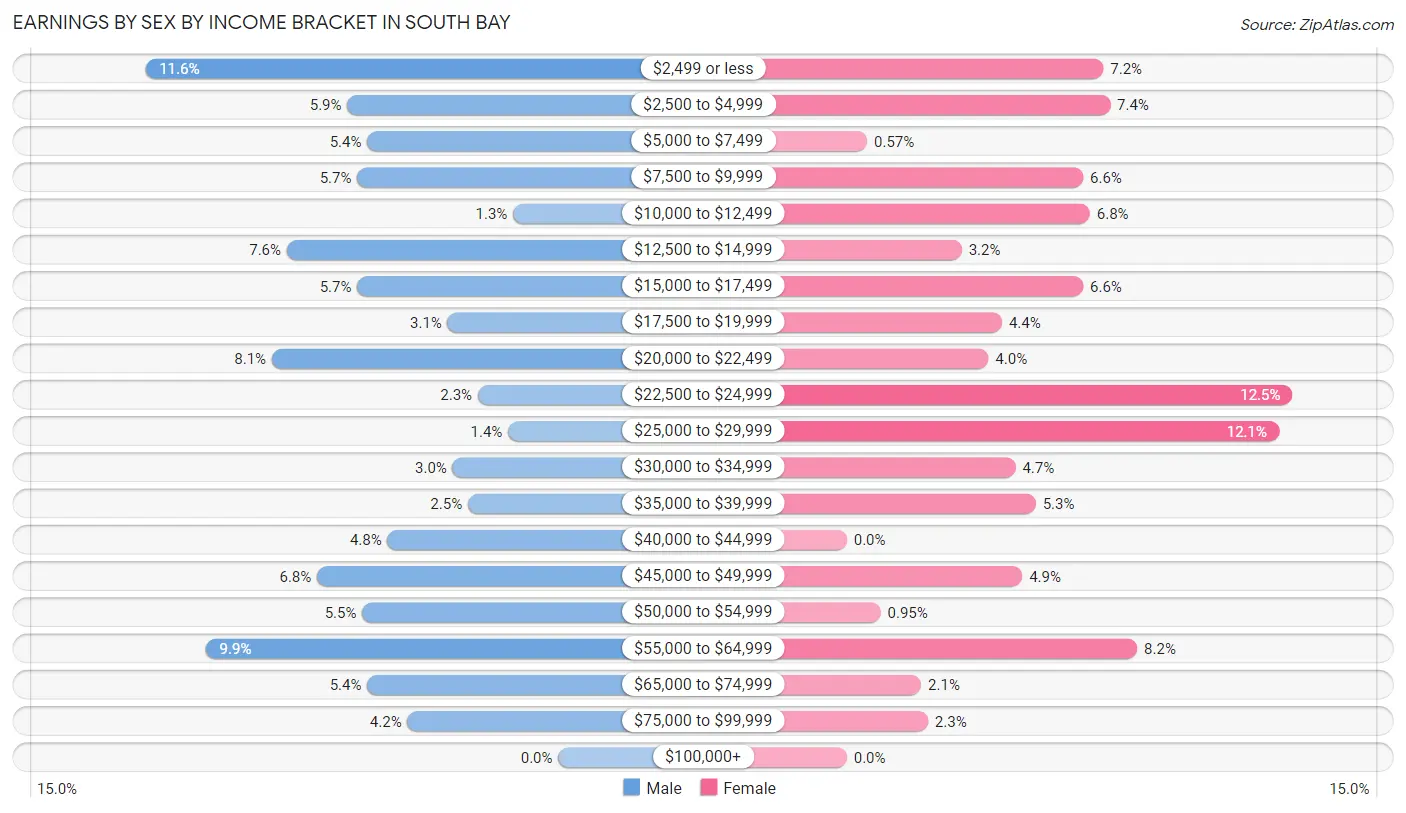
Earnings by Sex by Income Bracket in South Bay
The most common earnings brackets in South Bay are $2,499 or less for men (82 | 11.6%) and $22,500 to $24,999 for women (66 | 12.5%).
| Income | Male | Female |
| $2,499 or less | 82 (11.6%) | 38 (7.2%) |
| $2,500 to $4,999 | 42 (5.9%) | 39 (7.4%) |
| $5,000 to $7,499 | 38 (5.4%) | 3 (0.6%) |
| $7,500 to $9,999 | 40 (5.7%) | 35 (6.6%) |
| $10,000 to $12,499 | 9 (1.3%) | 36 (6.8%) |
| $12,500 to $14,999 | 54 (7.6%) | 17 (3.2%) |
| $15,000 to $17,499 | 40 (5.7%) | 35 (6.6%) |
| $17,500 to $19,999 | 22 (3.1%) | 23 (4.4%) |
| $20,000 to $22,499 | 57 (8.1%) | 21 (4.0%) |
| $22,500 to $24,999 | 16 (2.3%) | 66 (12.5%) |
| $25,000 to $29,999 | 10 (1.4%) | 64 (12.1%) |
| $30,000 to $34,999 | 21 (3.0%) | 25 (4.7%) |
| $35,000 to $39,999 | 18 (2.5%) | 28 (5.3%) |
| $40,000 to $44,999 | 34 (4.8%) | 0 (0.0%) |
| $45,000 to $49,999 | 48 (6.8%) | 26 (4.9%) |
| $50,000 to $54,999 | 39 (5.5%) | 5 (0.9%) |
| $55,000 to $64,999 | 70 (9.9%) | 43 (8.2%) |
| $65,000 to $74,999 | 38 (5.4%) | 11 (2.1%) |
| $75,000 to $99,999 | 30 (4.2%) | 12 (2.3%) |
| $100,000+ | 0 (0.0%) | 0 (0.0%) |
| Total | 708 (100.0%) | 527 (100.0%) |
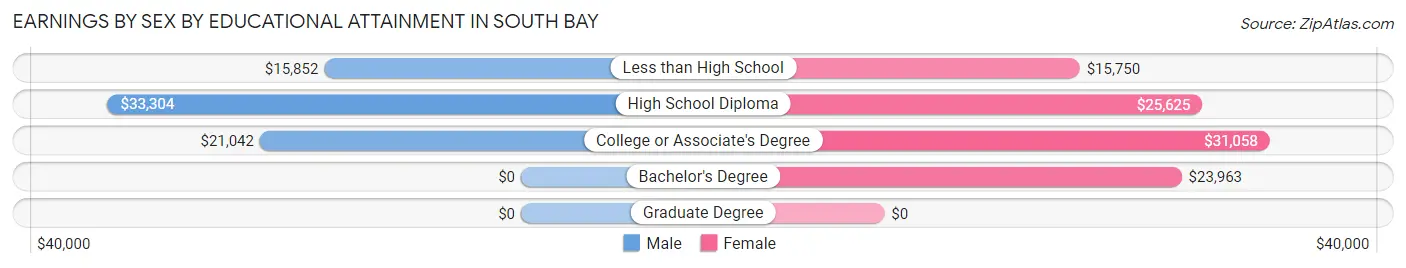
Earnings by Sex by Educational Attainment in South Bay
Average earnings in South Bay are $21,447 for men and $24,186 for women, a difference of 11.3%. Men with an educational attainment of high school diploma enjoy the highest average annual earnings of $33,304, while those with less than high school education earn the least with $15,852. Women with an educational attainment of college or associate's degree earn the most with the average annual earnings of $31,058, while those with less than high school education have the smallest earnings of $15,750.
| Educational Attainment | Male Income | Female Income |
| Less than High School | $15,852 | $15,750 |
| High School Diploma | $33,304 | $25,625 |
| College or Associate's Degree | $21,042 | $31,058 |
| Bachelor's Degree | - | - |
| Graduate Degree | - | - |
| Total | $21,447 | $24,186 |
Family Income in South Bay
Family Income Brackets in South Bay
According to the South Bay family income data, there are 147 families falling into the $15,000 to $24,999 income range, which is the most common income bracket and makes up 26.7% of all families.
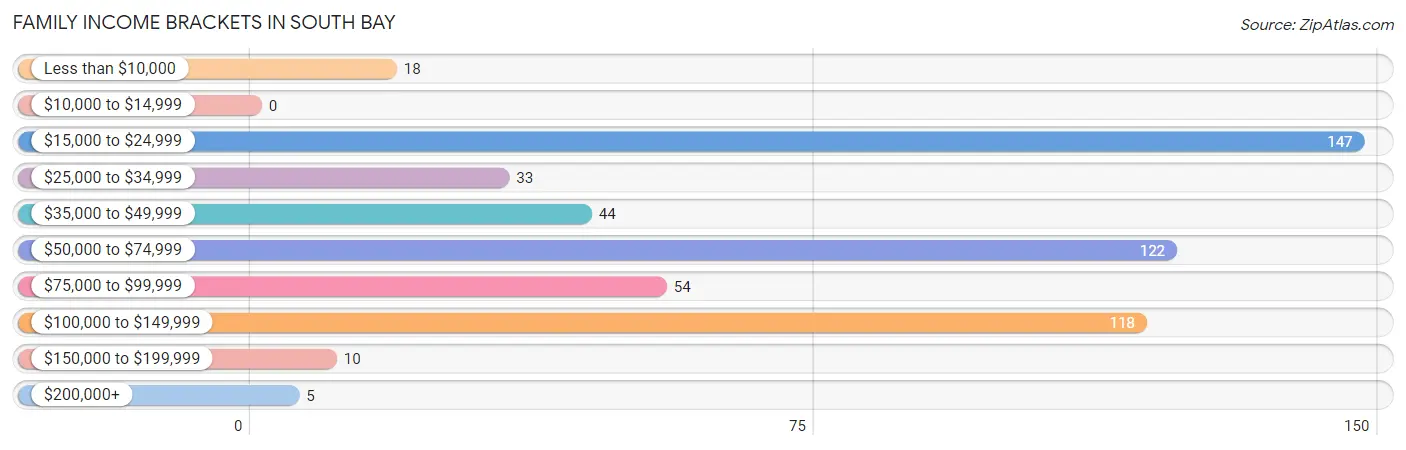
| Income Bracket | # Families | % Families |
| Less than $10,000 | 18 | 3.3% |
| $10,000 to $14,999 | 0 | 0.0% |
| $15,000 to $24,999 | 147 | 26.7% |
| $25,000 to $34,999 | 33 | 6.0% |
| $35,000 to $49,999 | 44 | 8.0% |
| $50,000 to $74,999 | 122 | 22.1% |
| $75,000 to $99,999 | 54 | 9.8% |
| $100,000 to $149,999 | 118 | 21.4% |
| $150,000 to $199,999 | 10 | 1.8% |
| $200,000+ | 5 | 0.9% |
Family Income by Famaliy Size in South Bay
6-person families (16 | 2.9%) account for the highest median family income in South Bay with $153,000 per family, while 2-person families (192 | 34.8%) have the highest median income of $31,364 per family member.
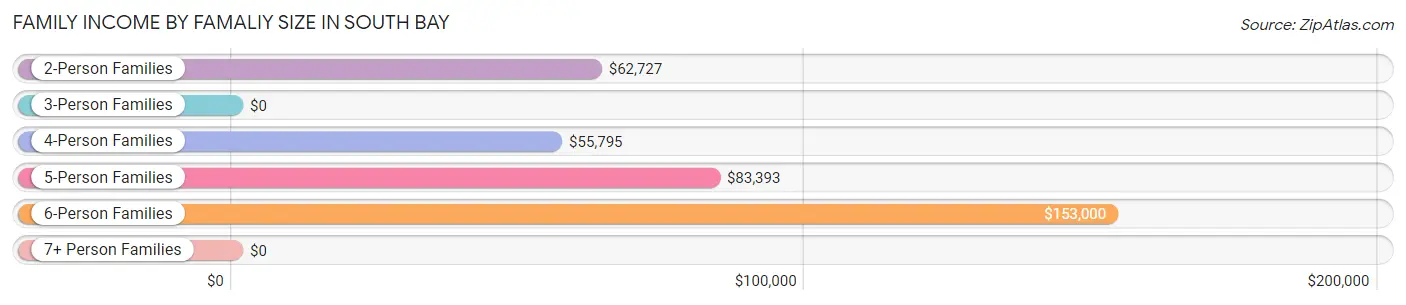
| Income Bracket | # Families | Median Income |
| 2-Person Families | 192 (34.8%) | $62,727 |
| 3-Person Families | 129 (23.4%) | $0 |
| 4-Person Families | 102 (18.5%) | $55,795 |
| 5-Person Families | 112 (20.3%) | $83,393 |
| 6-Person Families | 16 (2.9%) | $153,000 |
| 7+ Person Families | 0 (0.0%) | $0 |
| Total | 551 (100.0%) | $55,439 |
Family Income by Number of Earners in South Bay
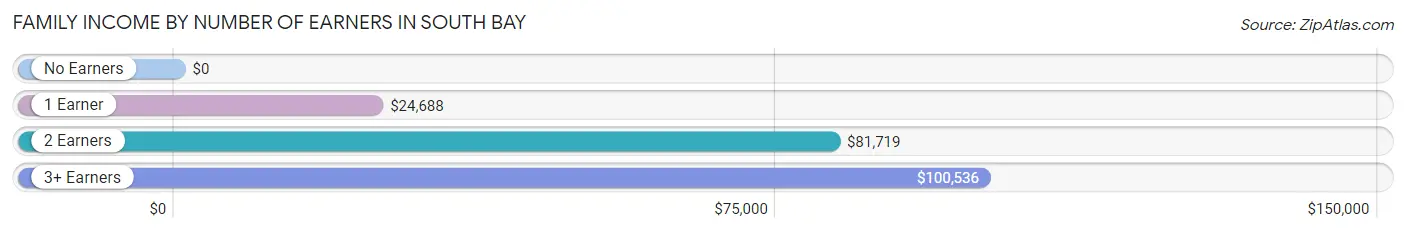
| Number of Earners | # Families | Median Income |
| No Earners | 51 (9.3%) | $0 |
| 1 Earner | 238 (43.2%) | $24,688 |
| 2 Earners | 190 (34.5%) | $81,719 |
| 3+ Earners | 72 (13.1%) | $100,536 |
| Total | 551 (100.0%) | $55,439 |
Household Income in South Bay
Household Income Brackets in South Bay
With 169 households falling in the category, the $15,000 to $24,999 income range is the most frequent in South Bay, accounting for 23.3% of all households. In contrast, only 5 households (0.7%) fall into the $200,000+ income bracket, making it the least populous group.
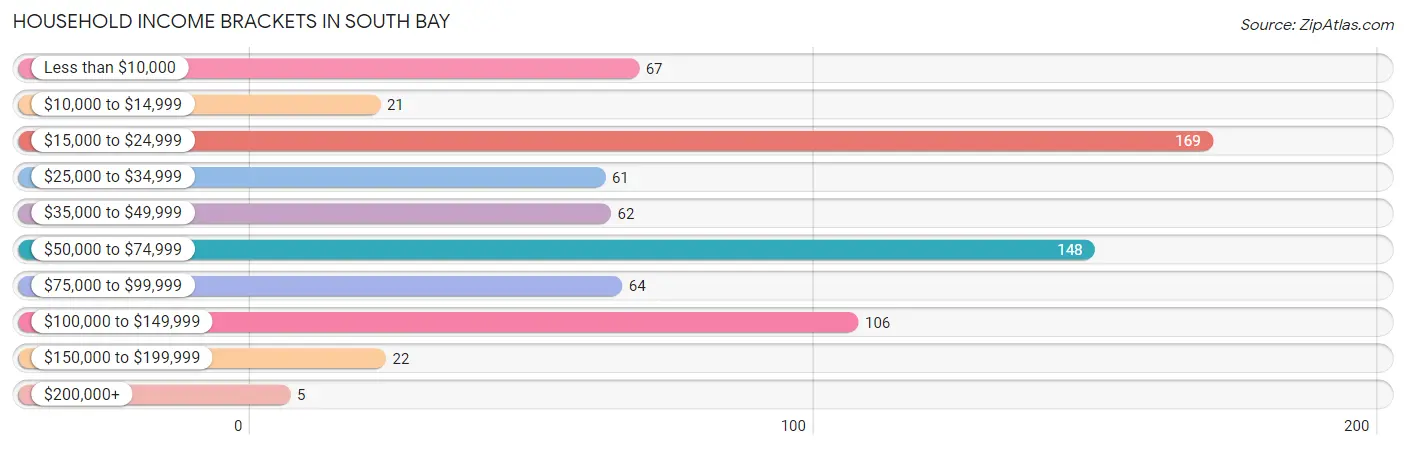
| Income Bracket | # Households | % Households |
| Less than $10,000 | 67 | 9.2% |
| $10,000 to $14,999 | 21 | 2.9% |
| $15,000 to $24,999 | 169 | 23.3% |
| $25,000 to $34,999 | 61 | 8.4% |
| $35,000 to $49,999 | 62 | 8.6% |
| $50,000 to $74,999 | 148 | 20.4% |
| $75,000 to $99,999 | 64 | 8.8% |
| $100,000 to $149,999 | 106 | 14.6% |
| $150,000 to $199,999 | 22 | 3.0% |
| $200,000+ | 5 | 0.7% |
Household Income by Householder Age in South Bay
The median household income in South Bay is $48,438, with the highest median household income of $62,933 found in the 45 to 64 years age bracket for the primary householder. A total of 261 households (36.0%) fall into this category. Meanwhile, the 15 to 24 years age bracket for the primary householder has the lowest median household income of $0, with 8 households (1.1%) in this group.
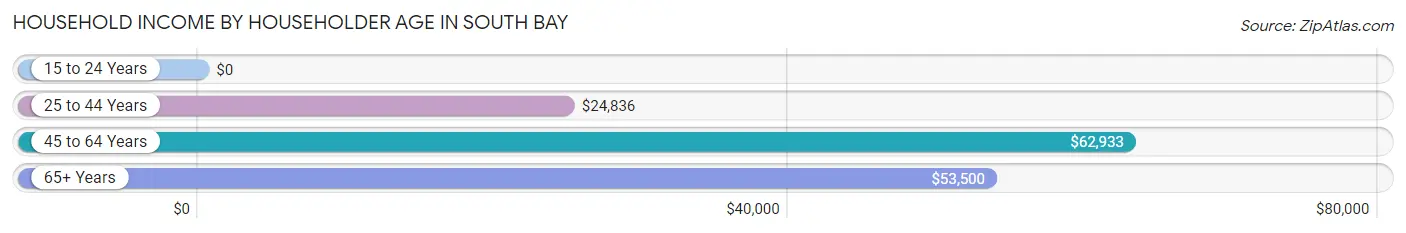
| Income Bracket | # Households | Median Income |
| 15 to 24 Years | 8 (1.1%) | $0 |
| 25 to 44 Years | 268 (37.0%) | $24,836 |
| 45 to 64 Years | 261 (36.0%) | $62,933 |
| 65+ Years | 188 (25.9%) | $53,500 |
| Total | 725 (100.0%) | $48,438 |
Poverty in South Bay
Income Below Poverty by Sex and Age in South Bay
With 33.6% poverty level for males and 30.7% for females among the residents of South Bay, 6 to 11 year old males and 6 to 11 year old females are the most vulnerable to poverty, with 68 males (58.6%) and 111 females (65.7%) in their respective age groups living below the poverty level.
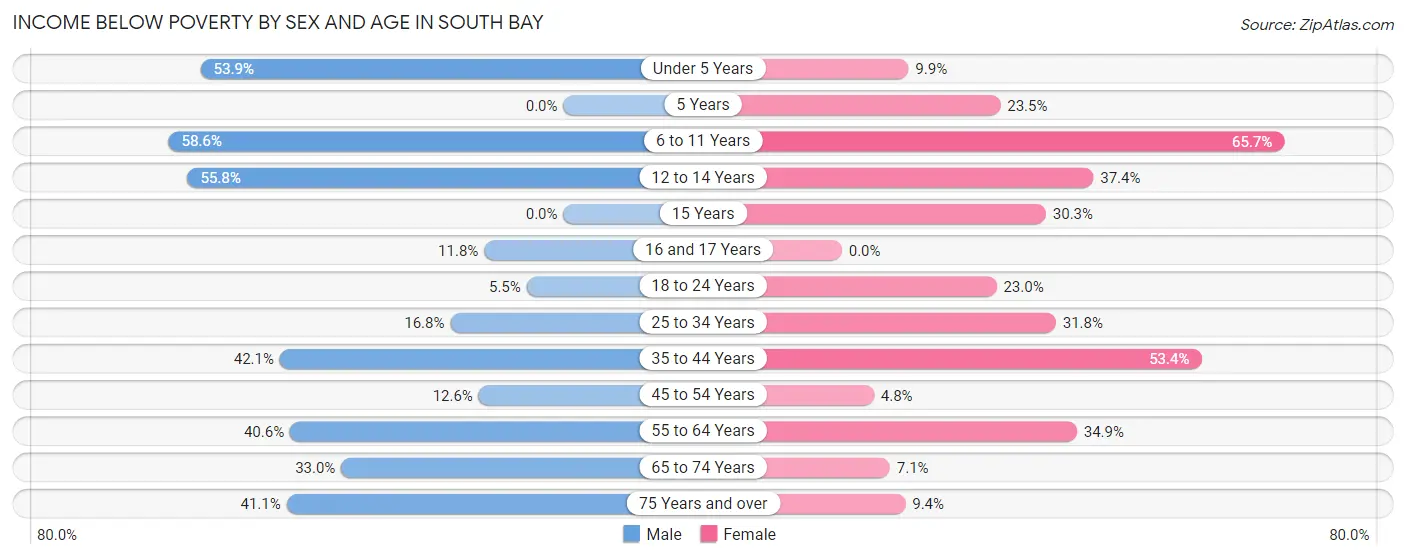
| Age Bracket | Male | Female |
| Under 5 Years | 42 (53.8%) | 9 (9.9%) |
| 5 Years | 0 (0.0%) | 4 (23.5%) |
| 6 to 11 Years | 68 (58.6%) | 111 (65.7%) |
| 12 to 14 Years | 24 (55.8%) | 31 (37.3%) |
| 15 Years | 0 (0.0%) | 10 (30.3%) |
| 16 and 17 Years | 2 (11.8%) | 0 (0.0%) |
| 18 to 24 Years | 3 (5.4%) | 17 (23.0%) |
| 25 to 34 Years | 22 (16.8%) | 41 (31.8%) |
| 35 to 44 Years | 64 (42.1%) | 87 (53.4%) |
| 45 to 54 Years | 21 (12.6%) | 7 (4.8%) |
| 55 to 64 Years | 41 (40.6%) | 52 (34.9%) |
| 65 to 74 Years | 32 (33.0%) | 6 (7.1%) |
| 75 Years and over | 30 (41.1%) | 5 (9.4%) |
| Total | 349 (33.6%) | 380 (30.7%) |
Income Above Poverty by Sex and Age in South Bay
According to the poverty statistics in South Bay, males aged 5 years and females aged 16 and 17 years are the age groups that are most secure financially, with 100.0% of males and 100.0% of females in these age groups living above the poverty line.
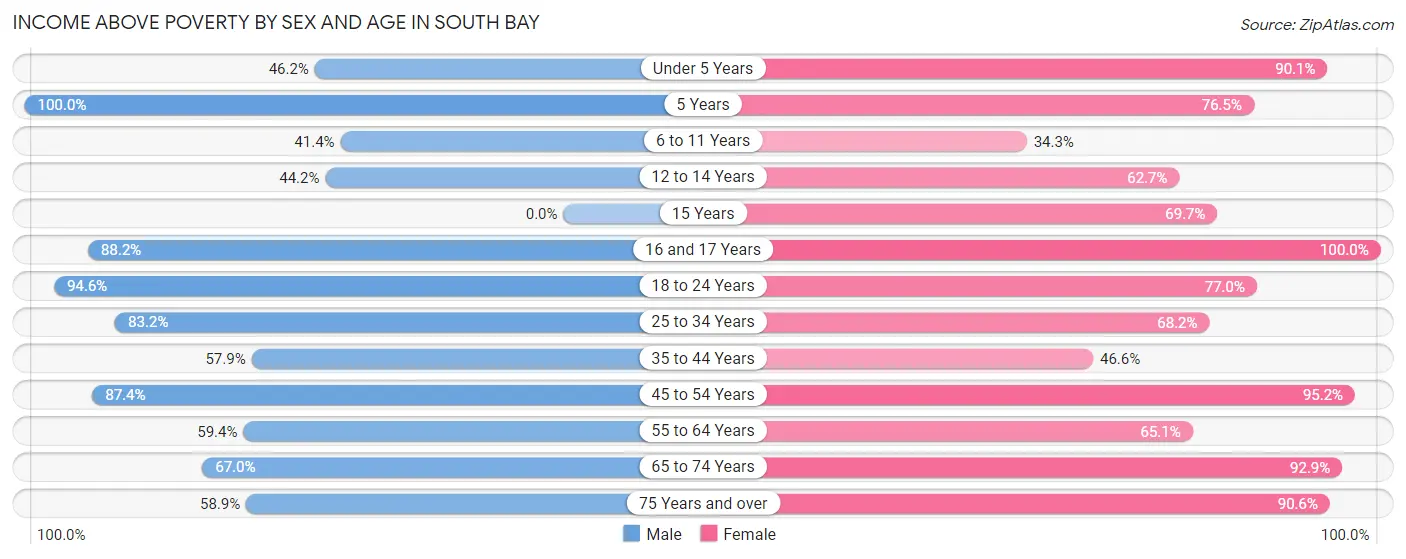
| Age Bracket | Male | Female |
| Under 5 Years | 36 (46.2%) | 82 (90.1%) |
| 5 Years | 10 (100.0%) | 13 (76.5%) |
| 6 to 11 Years | 48 (41.4%) | 58 (34.3%) |
| 12 to 14 Years | 19 (44.2%) | 52 (62.6%) |
| 15 Years | 0 (0.0%) | 23 (69.7%) |
| 16 and 17 Years | 15 (88.2%) | 46 (100.0%) |
| 18 to 24 Years | 52 (94.6%) | 57 (77.0%) |
| 25 to 34 Years | 109 (83.2%) | 88 (68.2%) |
| 35 to 44 Years | 88 (57.9%) | 76 (46.6%) |
| 45 to 54 Years | 146 (87.4%) | 140 (95.2%) |
| 55 to 64 Years | 60 (59.4%) | 97 (65.1%) |
| 65 to 74 Years | 65 (67.0%) | 78 (92.9%) |
| 75 Years and over | 43 (58.9%) | 48 (90.6%) |
| Total | 691 (66.4%) | 858 (69.3%) |
Income Below Poverty Among Married-Couple Families in South Bay
The poverty statistics for married-couple families in South Bay show that 11.4% or 32 of the total 281 families live below the poverty line. Families with no children have the highest poverty rate of 17.8%, comprising of 23 families. On the other hand, families with 3 or 4 children have the lowest poverty rate of 0.0%, which includes 0 families.
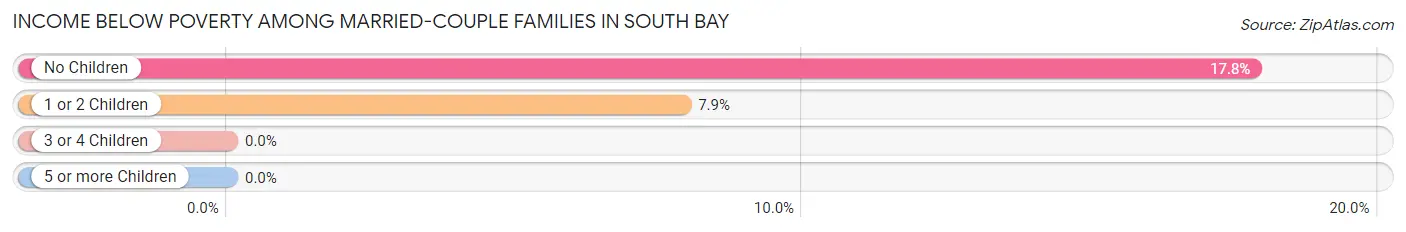
| Children | Above Poverty | Below Poverty |
| No Children | 106 (82.2%) | 23 (17.8%) |
| 1 or 2 Children | 105 (92.1%) | 9 (7.9%) |
| 3 or 4 Children | 38 (100.0%) | 0 (0.0%) |
| 5 or more Children | 0 (0.0%) | 0 (0.0%) |
| Total | 249 (88.6%) | 32 (11.4%) |
Income Below Poverty Among Single-Parent Households in South Bay
According to the poverty data in South Bay, 52.7% or 49 single-father households and 50.8% or 90 single-mother households are living below the poverty line. Among single-father households, those with 3 or 4 children have the highest poverty rate, with 22 households (68.8%) experiencing poverty. Likewise, among single-mother households, those with 3 or 4 children have the highest poverty rate, with 20 households (100.0%) falling below the poverty line.
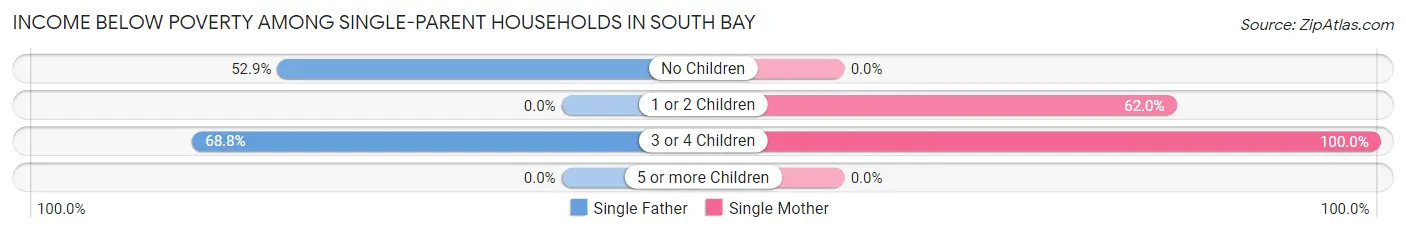
| Children | Single Father | Single Mother |
| No Children | 27 (52.9%) | 0 (0.0%) |
| 1 or 2 Children | 0 (0.0%) | 70 (62.0%) |
| 3 or 4 Children | 22 (68.8%) | 20 (100.0%) |
| 5 or more Children | 0 (0.0%) | 0 (0.0%) |
| Total | 49 (52.7%) | 90 (50.8%) |
Income Below Poverty Among Married-Couple vs Single-Parent Households in South Bay
The poverty data for South Bay shows that 32 of the married-couple family households (11.4%) and 139 of the single-parent households (51.5%) are living below the poverty level. Within the married-couple family households, those with no children have the highest poverty rate, with 23 households (17.8%) falling below the poverty line. Among the single-parent households, those with 3 or 4 children have the highest poverty rate, with 42 household (80.8%) living below poverty.
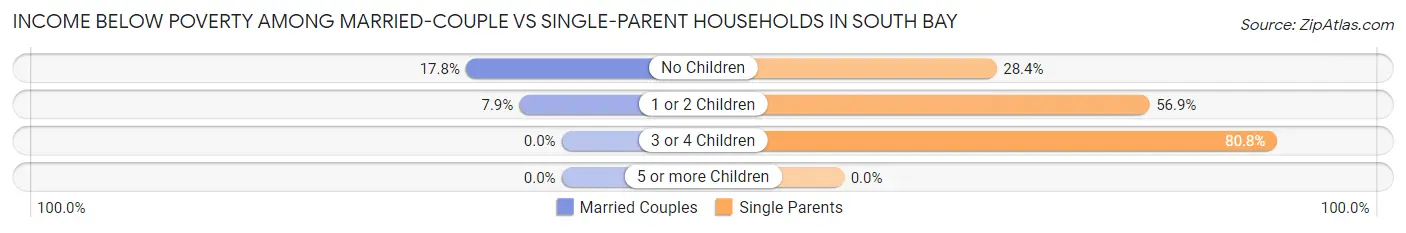
| Children | Married-Couple Families | Single-Parent Households |
| No Children | 23 (17.8%) | 27 (28.4%) |
| 1 or 2 Children | 9 (7.9%) | 70 (56.9%) |
| 3 or 4 Children | 0 (0.0%) | 42 (80.8%) |
| 5 or more Children | 0 (0.0%) | 0 (0.0%) |
| Total | 32 (11.4%) | 139 (51.5%) |
Race in South Bay
The most populous races in South Bay are Black / African American (2,760 | 57.1%), White / Caucasian (1,258 | 26.1%), and Hispanic or Latino (1,174 | 24.3%).
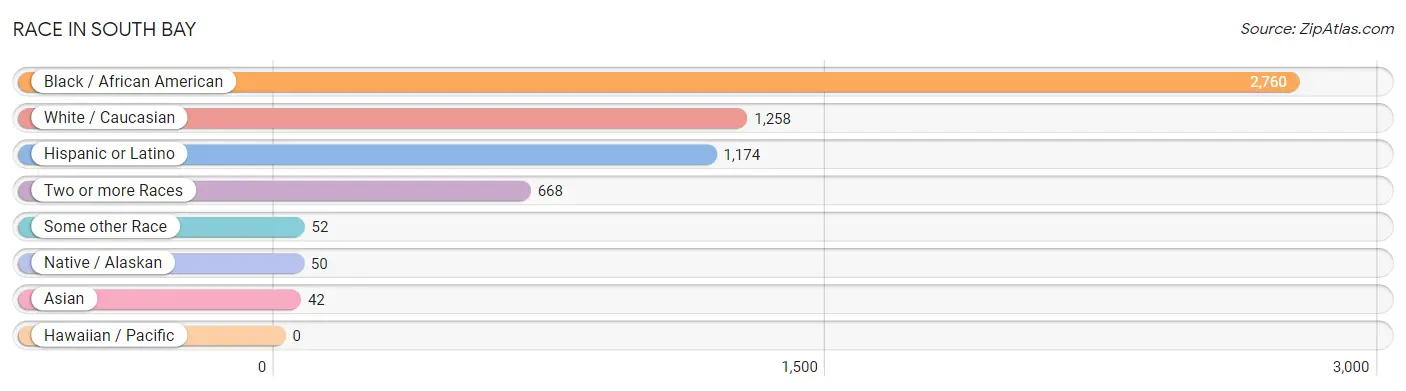
| Race | # Population | % Population |
| Asian | 42 | 0.9% |
| Black / African American | 2,760 | 57.1% |
| Hawaiian / Pacific | 0 | 0.0% |
| Hispanic or Latino | 1,174 | 24.3% |
| Native / Alaskan | 50 | 1.0% |
| White / Caucasian | 1,258 | 26.1% |
| Two or more Races | 668 | 13.8% |
| Some other Race | 52 | 1.1% |
| Total | 4,830 | 100.0% |
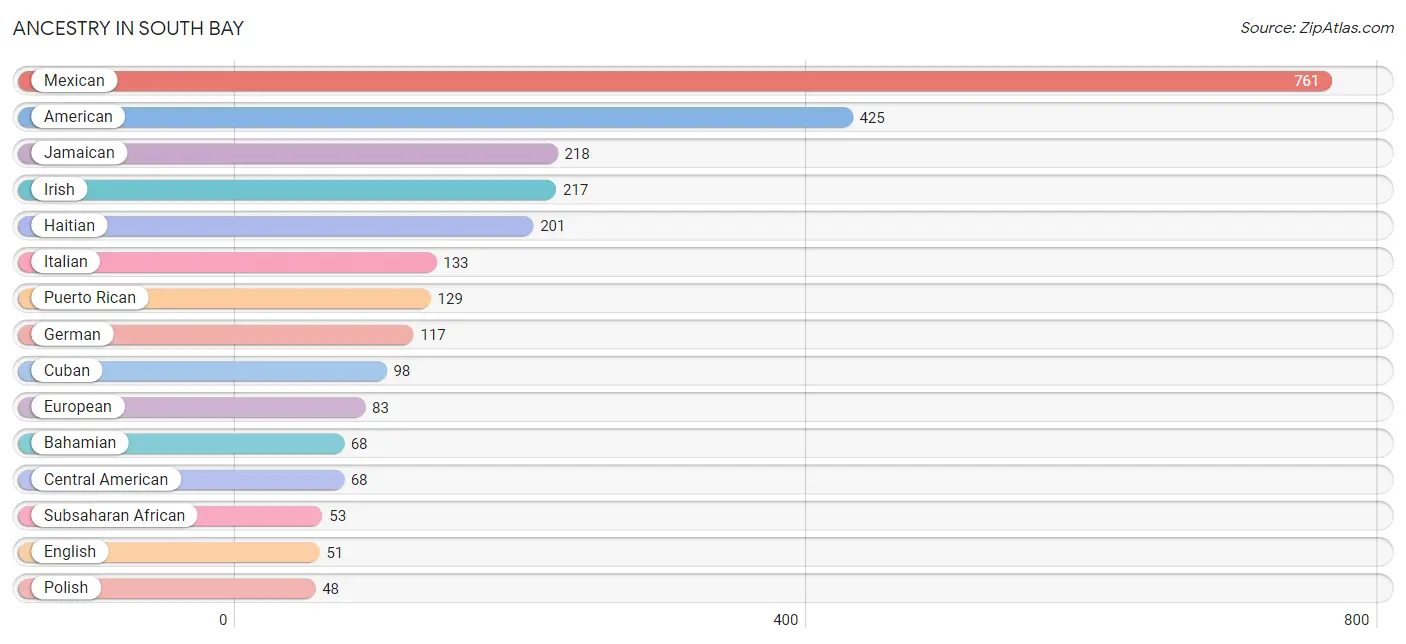
Ancestry in South Bay
The most populous ancestries reported in South Bay are Mexican (761 | 15.8%), American (425 | 8.8%), Jamaican (218 | 4.5%), Irish (217 | 4.5%), and Haitian (201 | 4.2%), together accounting for 37.7% of all South Bay residents.
| Ancestry | # Population | % Population |
| African | 37 | 0.8% |
| American | 425 | 8.8% |
| Apache | 31 | 0.6% |
| Argentinean | 9 | 0.2% |
| Bahamian | 68 | 1.4% |
| Barbadian | 11 | 0.2% |
| Brazilian | 4 | 0.1% |
| British West Indian | 12 | 0.3% |
| Canadian | 22 | 0.5% |
| Central American | 68 | 1.4% |
| Central American Indian | 7 | 0.1% |
| Cherokee | 9 | 0.2% |
| Choctaw | 9 | 0.2% |
| Colombian | 26 | 0.5% |
| Crow | 31 | 0.6% |
| Cuban | 98 | 2.0% |
| Dominican | 35 | 0.7% |
| Dutch | 32 | 0.7% |
| English | 51 | 1.1% |
| European | 83 | 1.7% |
| French | 19 | 0.4% |
| French Canadian | 7 | 0.1% |
| German | 117 | 2.4% |
| Greek | 4 | 0.1% |
| Haitian | 201 | 4.2% |
| Honduran | 11 | 0.2% |
| Irish | 217 | 4.5% |
| Israeli | 35 | 0.7% |
| Italian | 133 | 2.8% |
| Jamaican | 218 | 4.5% |
| Korean | 4 | 0.1% |
| Mexican | 761 | 15.8% |
| Mexican American Indian | 19 | 0.4% |
| Nicaraguan | 21 | 0.4% |
| Nigerian | 16 | 0.3% |
| Norwegian | 9 | 0.2% |
| Panamanian | 4 | 0.1% |
| Peruvian | 1 | 0.0% |
| Polish | 48 | 1.0% |
| Puerto Rican | 129 | 2.7% |
| Romanian | 4 | 0.1% |
| Russian | 8 | 0.2% |
| Salvadoran | 32 | 0.7% |
| Scottish | 45 | 0.9% |
| Seminole | 16 | 0.3% |
| Sioux | 14 | 0.3% |
| South American | 36 | 0.7% |
| Subsaharan African | 53 | 1.1% |
| Vietnamese | 38 | 0.8% |
| Welsh | 13 | 0.3% |
| West Indian | 4 | 0.1% |
| Yugoslavian | 5 | 0.1% | View All 52 Rows |
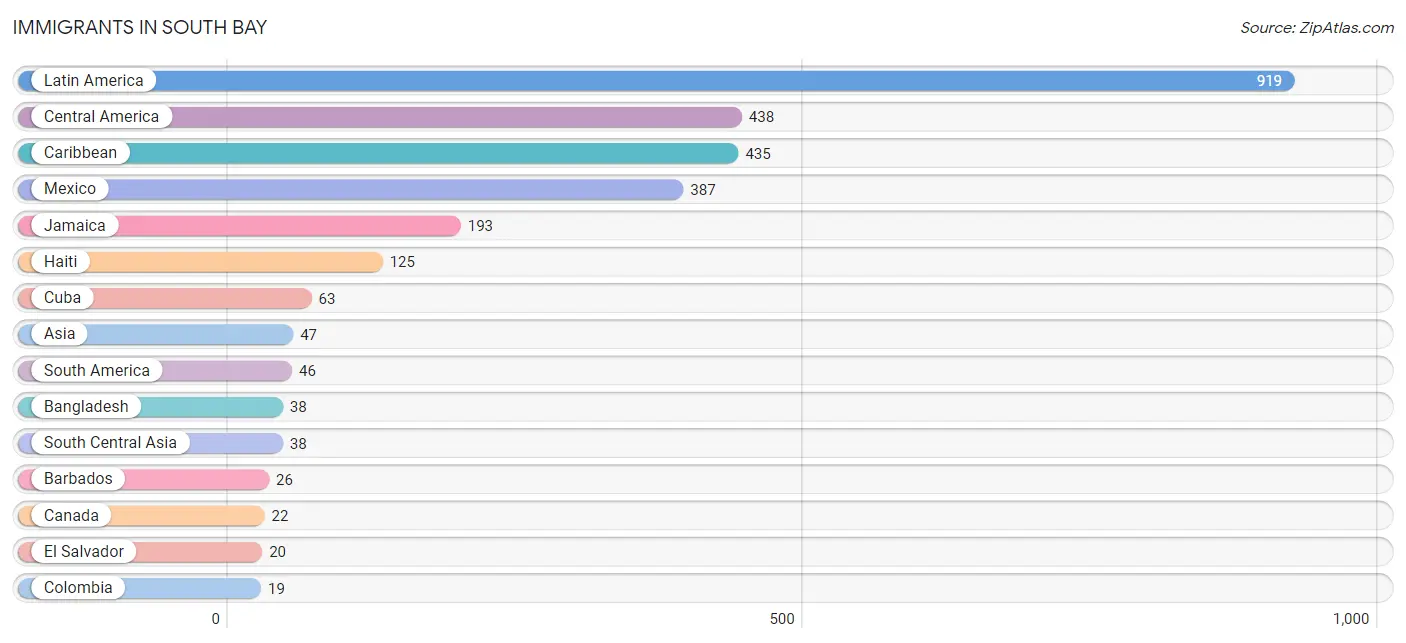
Immigrants in South Bay
The most numerous immigrant groups reported in South Bay came from Latin America (919 | 19.0%), Central America (438 | 9.1%), Caribbean (435 | 9.0%), Mexico (387 | 8.0%), and Jamaica (193 | 4.0%), together accounting for 49.1% of all South Bay residents.
| Immigration Origin | # Population | % Population |
| Argentina | 9 | 0.2% |
| Asia | 47 | 1.0% |
| Bahamas | 12 | 0.3% |
| Bangladesh | 38 | 0.8% |
| Barbados | 26 | 0.5% |
| Bosnia and Herzegovina | 5 | 0.1% |
| Brazil | 11 | 0.2% |
| Canada | 22 | 0.5% |
| Caribbean | 435 | 9.0% |
| Central America | 438 | 9.1% |
| Colombia | 19 | 0.4% |
| Cuba | 63 | 1.3% |
| Dominican Republic | 4 | 0.1% |
| Eastern Europe | 5 | 0.1% |
| El Salvador | 20 | 0.4% |
| Europe | 5 | 0.1% |
| Haiti | 125 | 2.6% |
| Honduras | 6 | 0.1% |
| Israel | 9 | 0.2% |
| Jamaica | 193 | 4.0% |
| Latin America | 919 | 19.0% |
| Mexico | 387 | 8.0% |
| Nicaragua | 9 | 0.2% |
| Panama | 4 | 0.1% |
| South America | 46 | 0.9% |
| South Central Asia | 38 | 0.8% |
| Western Asia | 9 | 0.2% | View All 27 Rows |
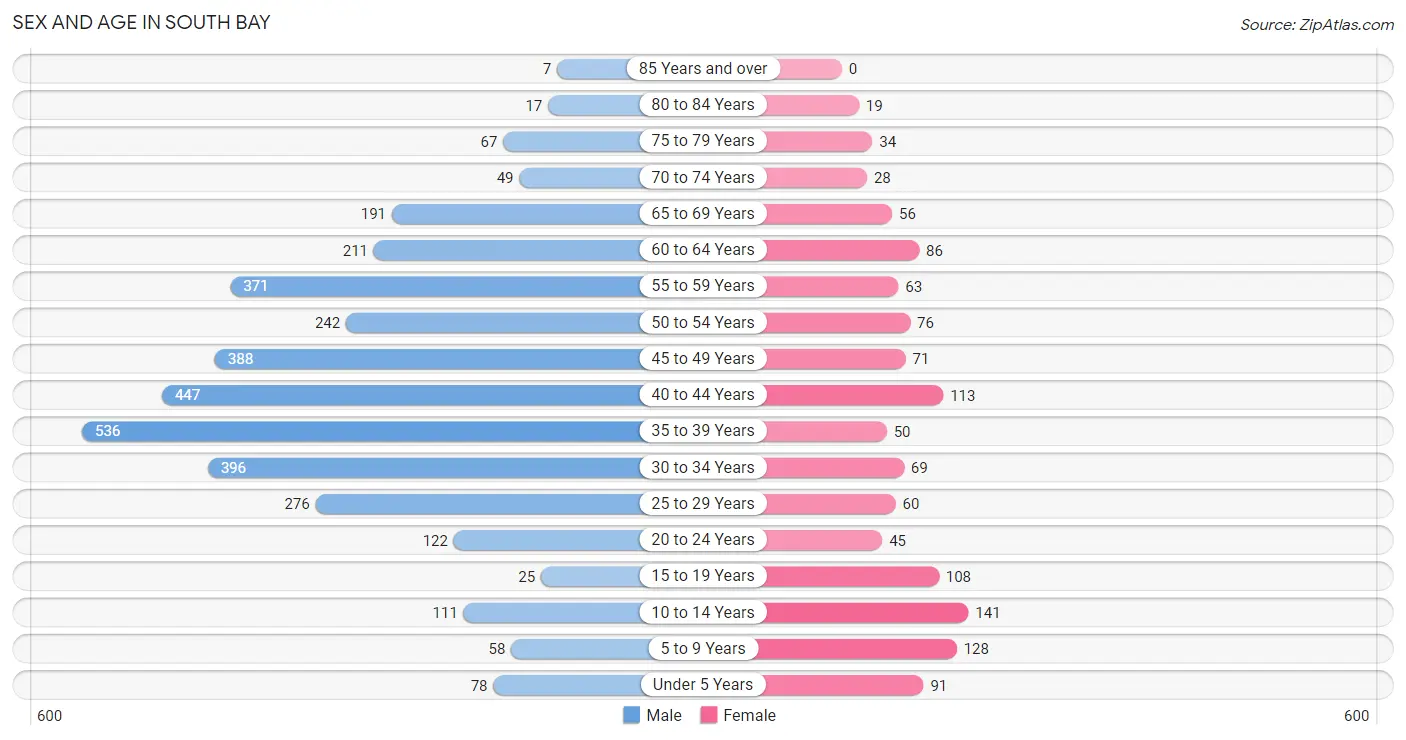
Sex and Age in South Bay
Sex and Age in South Bay
The most populous age groups in South Bay are 35 to 39 Years (536 | 14.9%) for men and 10 to 14 Years (141 | 11.4%) for women.
| Age Bracket | Male | Female |
| Under 5 Years | 78 (2.2%) | 91 (7.3%) |
| 5 to 9 Years | 58 (1.6%) | 128 (10.3%) |
| 10 to 14 Years | 111 (3.1%) | 141 (11.4%) |
| 15 to 19 Years | 25 (0.7%) | 108 (8.7%) |
| 20 to 24 Years | 122 (3.4%) | 45 (3.6%) |
| 25 to 29 Years | 276 (7.7%) | 60 (4.9%) |
| 30 to 34 Years | 396 (11.0%) | 69 (5.6%) |
| 35 to 39 Years | 536 (14.9%) | 50 (4.0%) |
| 40 to 44 Years | 447 (12.4%) | 113 (9.1%) |
| 45 to 49 Years | 388 (10.8%) | 71 (5.7%) |
| 50 to 54 Years | 242 (6.7%) | 76 (6.1%) |
| 55 to 59 Years | 371 (10.3%) | 63 (5.1%) |
| 60 to 64 Years | 211 (5.9%) | 86 (7.0%) |
| 65 to 69 Years | 191 (5.3%) | 56 (4.5%) |
| 70 to 74 Years | 49 (1.4%) | 28 (2.3%) |
| 75 to 79 Years | 67 (1.9%) | 34 (2.8%) |
| 80 to 84 Years | 17 (0.5%) | 19 (1.5%) |
| 85 Years and over | 7 (0.2%) | 0 (0.0%) |
| Total | 3,592 (100.0%) | 1,238 (100.0%) |
Families and Households in South Bay
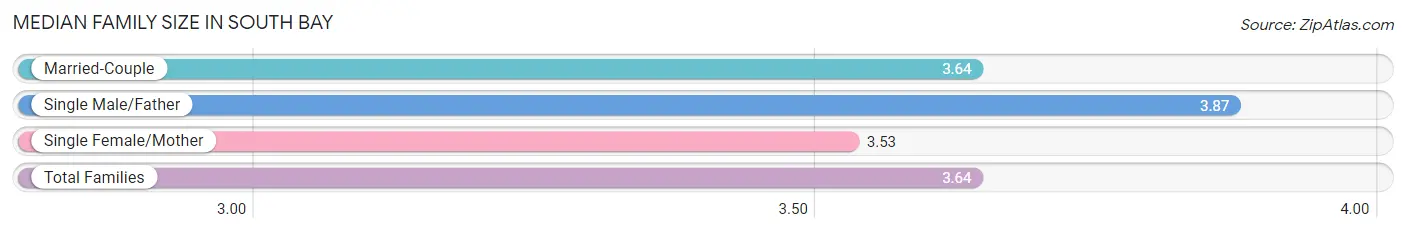
Median Family Size in South Bay
The median family size in South Bay is 3.64 persons per family, with single male/father families (93 | 16.9%) accounting for the largest median family size of 3.87 persons per family. On the other hand, single female/mother families (177 | 32.1%) represent the smallest median family size with 3.53 persons per family.
| Family Type | # Families | Family Size |
| Married-Couple | 281 (51.0%) | 3.64 |
| Single Male/Father | 93 (16.9%) | 3.87 |
| Single Female/Mother | 177 (32.1%) | 3.53 |
| Total Families | 551 (100.0%) | 3.64 |
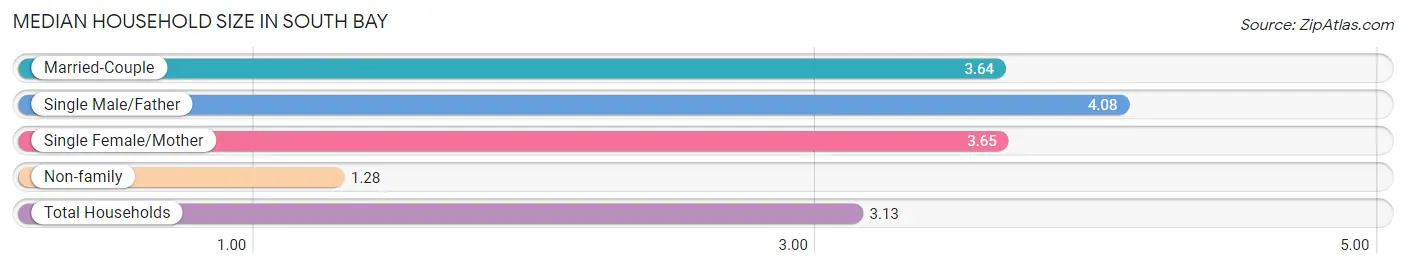
Median Household Size in South Bay
The median household size in South Bay is 3.13 persons per household, with single male/father households (93 | 12.8%) accounting for the largest median household size of 4.08 persons per household. non-family households (174 | 24.0%) represent the smallest median household size with 1.28 persons per household.
| Household Type | # Households | Household Size |
| Married-Couple | 281 (38.8%) | 3.64 |
| Single Male/Father | 93 (12.8%) | 4.08 |
| Single Female/Mother | 177 (24.4%) | 3.65 |
| Non-family | 174 (24.0%) | 1.28 |
| Total Households | 725 (100.0%) | 3.13 |
Household Size by Marriage Status in South Bay
Out of a total of 725 households in South Bay, 551 (76.0%) are family households, while 174 (24.0%) are nonfamily households. The most numerous type of family households are 2-person households, comprising 192, and the most common type of nonfamily households are 1-person households, comprising 133.
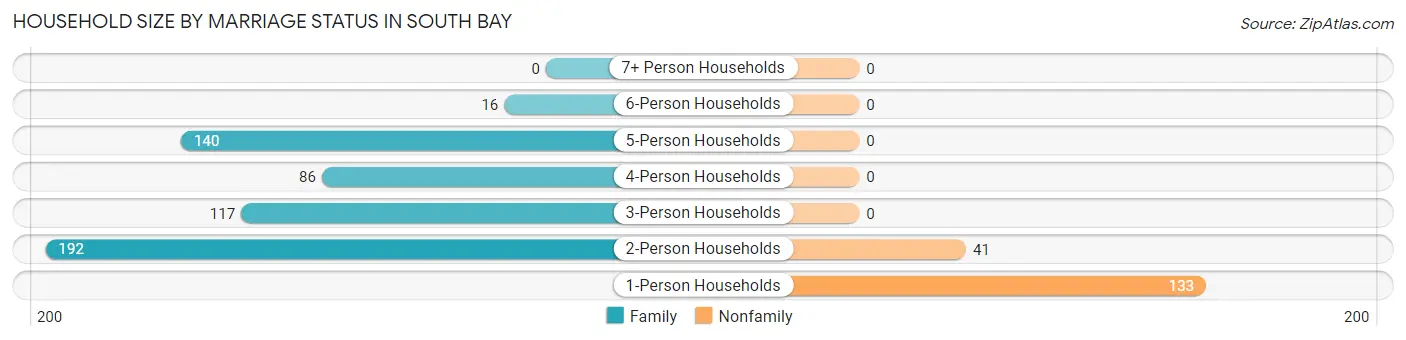
| Household Size | Family Households | Nonfamily Households |
| 1-Person Households | - | 133 (18.3%) |
| 2-Person Households | 192 (26.5%) | 41 (5.7%) |
| 3-Person Households | 117 (16.1%) | 0 (0.0%) |
| 4-Person Households | 86 (11.9%) | 0 (0.0%) |
| 5-Person Households | 140 (19.3%) | 0 (0.0%) |
| 6-Person Households | 16 (2.2%) | 0 (0.0%) |
| 7+ Person Households | 0 (0.0%) | 0 (0.0%) |
| Total | 551 (76.0%) | 174 (24.0%) |
Female Fertility in South Bay
Fertility by Age in South Bay
Average fertility rate in South Bay is 17.0 births per 1,000 women. Women in the age bracket of 20 to 34 years have the highest fertility rate with 52.0 births per 1,000 women. Women in the age bracket of 20 to 34 years acount for 100.0% of all women with births.
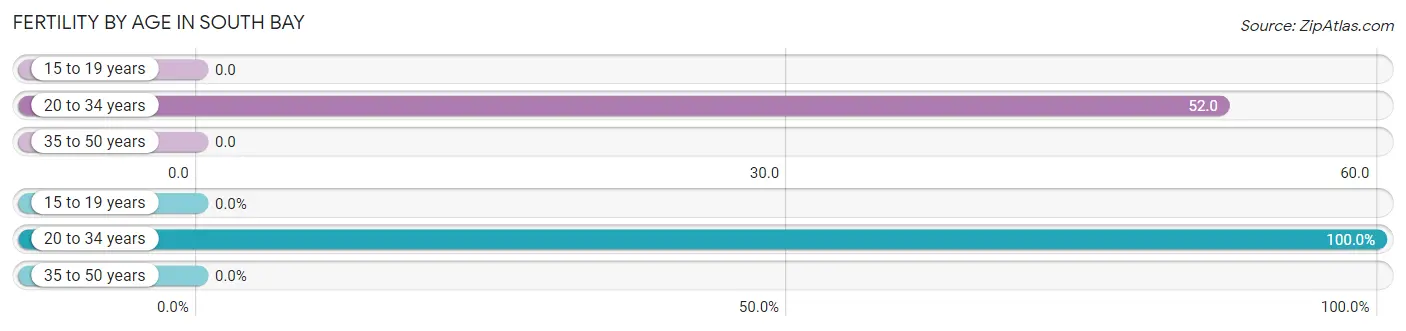
| Age Bracket | Women with Births | Births / 1,000 Women |
| 15 to 19 years | 0 (0.0%) | 0.0 |
| 20 to 34 years | 9 (100.0%) | 52.0 |
| 35 to 50 years | 0 (0.0%) | 0.0 |
| Total | 9 (100.0%) | 17.0 |
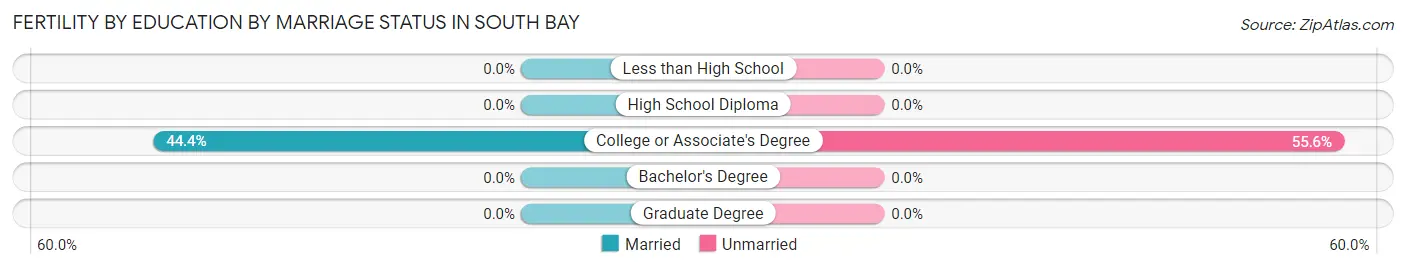
Fertility by Age by Marriage Status in South Bay
44.4% of women with births (9) in South Bay are married. The highest percentage of unmarried women with births falls into 20 to 34 years age bracket with 55.6% of them unmarried at the time of birth, while the lowest percentage of unmarried women with births belong to 20 to 34 years age bracket with 55.6% of them unmarried.
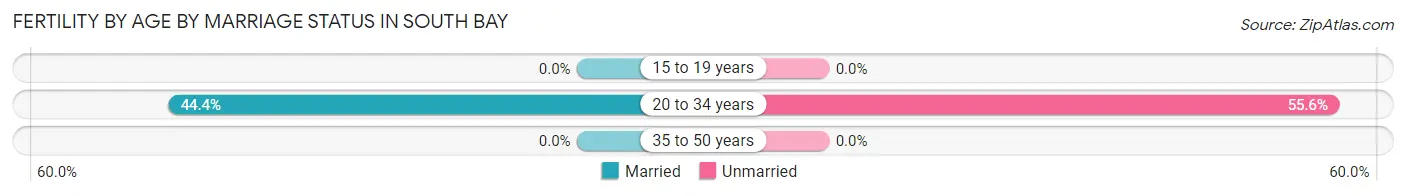
| Age Bracket | Married | Unmarried |
| 15 to 19 years | 0 (0.0%) | 0 (0.0%) |
| 20 to 34 years | 4 (44.4%) | 5 (55.6%) |
| 35 to 50 years | 0 (0.0%) | 0 (0.0%) |
| Total | 4 (44.4%) | 5 (55.6%) |
Fertility by Education in South Bay
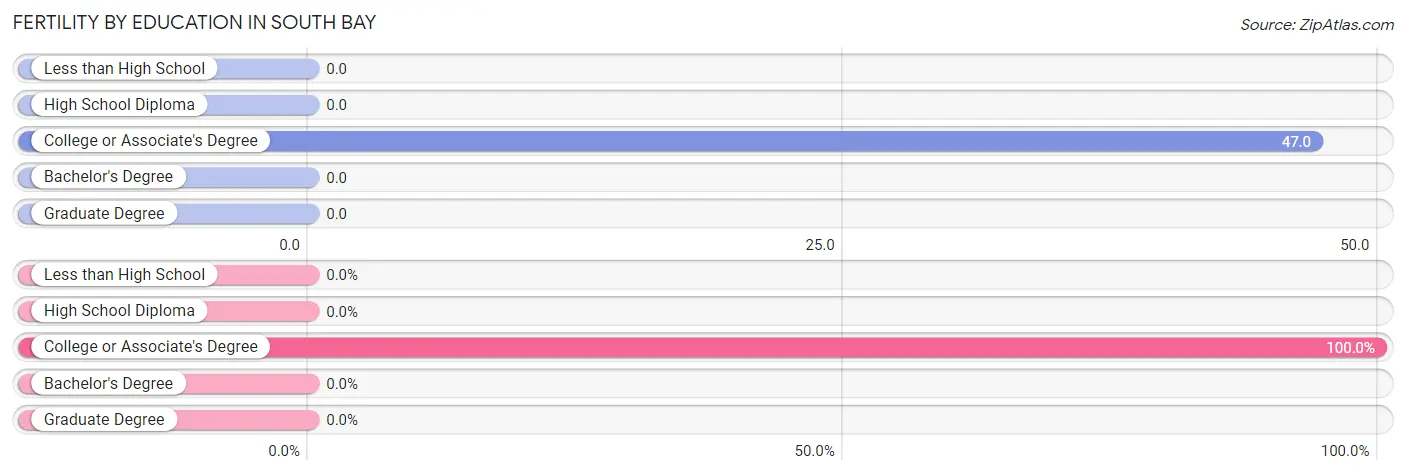
| Educational Attainment | Women with Births | Births / 1,000 Women |
| Less than High School | 0 (0.0%) | 0.0 |
| High School Diploma | 0 (0.0%) | 0.0 |
| College or Associate's Degree | 9 (100.0%) | 47.0 |
| Bachelor's Degree | 0 (0.0%) | 0.0 |
| Graduate Degree | 0 (0.0%) | 0.0 |
| Total | 9 (100.0%) | 17.0 |
Fertility by Education by Marriage Status in South Bay
55.6% of women with births in South Bay are unmarried. Women with the educational attainment of college or associate's degree are most likely to be married with 44.4% of them married at childbirth, while women with the educational attainment of college or associate's degree are least likely to be married with 55.6% of them unmarried at childbirth.
| Educational Attainment | Married | Unmarried |
| Less than High School | 0 (0.0%) | 0 (0.0%) |
| High School Diploma | 0 (0.0%) | 0 (0.0%) |
| College or Associate's Degree | 4 (44.4%) | 5 (55.6%) |
| Bachelor's Degree | 0 (0.0%) | 0 (0.0%) |
| Graduate Degree | 0 (0.0%) | 0 (0.0%) |
| Total | 4 (44.4%) | 5 (55.6%) |
Employment Characteristics in South Bay
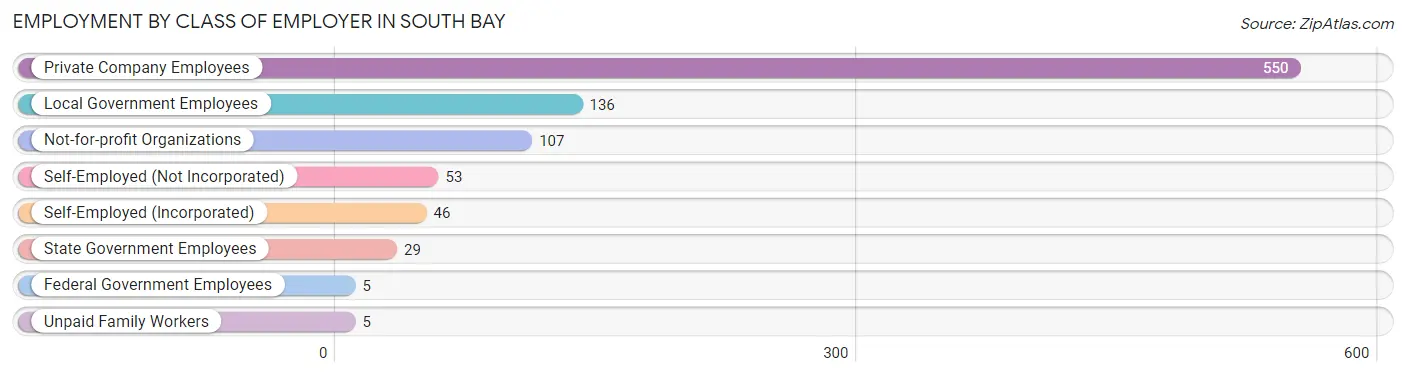
Employment by Class of Employer in South Bay
Among the 931 employed individuals in South Bay, private company employees (550 | 59.1%), local government employees (136 | 14.6%), and not-for-profit organizations (107 | 11.5%) make up the most common classes of employment.
| Employer Class | # Employees | % Employees |
| Private Company Employees | 550 | 59.1% |
| Self-Employed (Incorporated) | 46 | 4.9% |
| Self-Employed (Not Incorporated) | 53 | 5.7% |
| Not-for-profit Organizations | 107 | 11.5% |
| Local Government Employees | 136 | 14.6% |
| State Government Employees | 29 | 3.1% |
| Federal Government Employees | 5 | 0.5% |
| Unpaid Family Workers | 5 | 0.5% |
| Total | 931 | 100.0% |
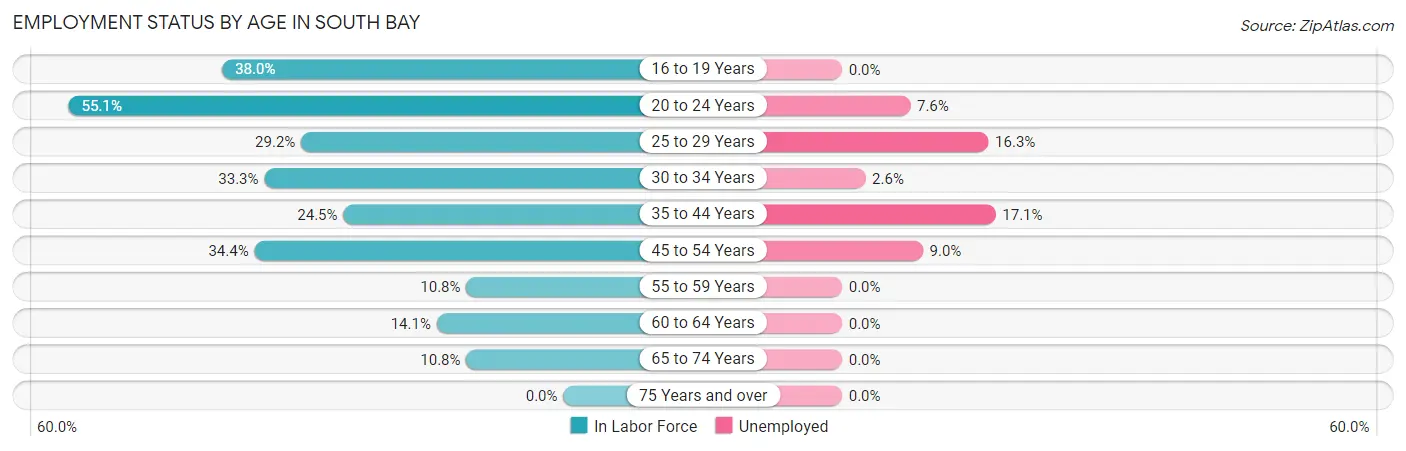
Employment Status by Age in South Bay
According to the labor force statistics for South Bay, out of the total population over 16 years of age (4,190), 25.2% or 1,056 individuals are in the labor force, with 9.4% or 99 of them unemployed. The age group with the highest labor force participation rate is 20 to 24 years, with 55.1% or 92 individuals in the labor force. Within the labor force, the 35 to 44 years age range has the highest percentage of unemployed individuals, with 17.1% or 48 of them being unemployed.
| Age Bracket | In Labor Force | Unemployed |
| 16 to 19 Years | 38 (38.0%) | 0 (0.0%) |
| 20 to 24 Years | 92 (55.1%) | 7 (7.6%) |
| 25 to 29 Years | 98 (29.2%) | 16 (16.3%) |
| 30 to 34 Years | 155 (33.3%) | 4 (2.6%) |
| 35 to 44 Years | 281 (24.5%) | 48 (17.1%) |
| 45 to 54 Years | 267 (34.4%) | 24 (9.0%) |
| 55 to 59 Years | 47 (10.8%) | 0 (0.0%) |
| 60 to 64 Years | 42 (14.1%) | 0 (0.0%) |
| 65 to 74 Years | 35 (10.8%) | 0 (0.0%) |
| 75 Years and over | 0 (0.0%) | 0 (0.0%) |
| Total | 1,056 (25.2%) | 99 (9.4%) |
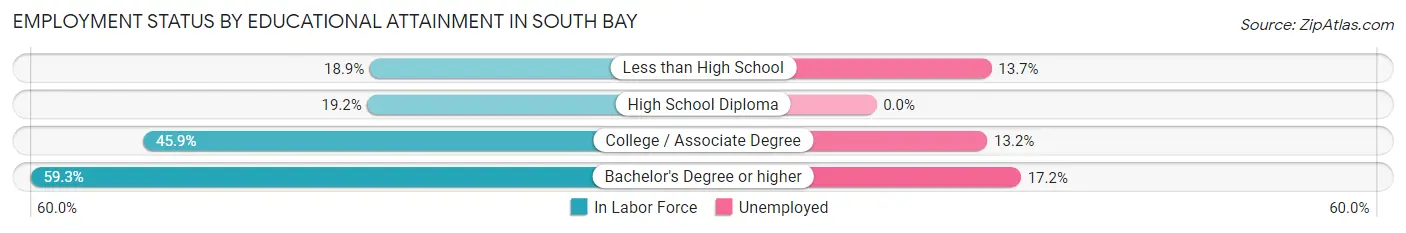
Employment Status by Educational Attainment in South Bay
According to labor force statistics for South Bay, 25.8% of individuals (891) out of the total population between 25 and 64 years of age (3,455) are in the labor force, with 10.3% or 92 of them being unemployed. The group with the highest labor force participation rate are those with the educational attainment of bachelor's degree or higher, with 59.3% or 134 individuals in the labor force. Within the labor force, individuals with bachelor's degree or higher education have the highest percentage of unemployment, with 17.2% or 23 of them being unemployed.
| Educational Attainment | In Labor Force | Unemployed |
| Less than High School | 271 (18.9%) | 197 (13.7%) |
| High School Diploma | 243 (19.2%) | 0 (0.0%) |
| College / Associate Degree | 242 (45.9%) | 70 (13.2%) |
| Bachelor's Degree or higher | 134 (59.3%) | 39 (17.2%) |
| Total | 891 (25.8%) | 356 (10.3%) |
Employment Occupations by Sex in South Bay
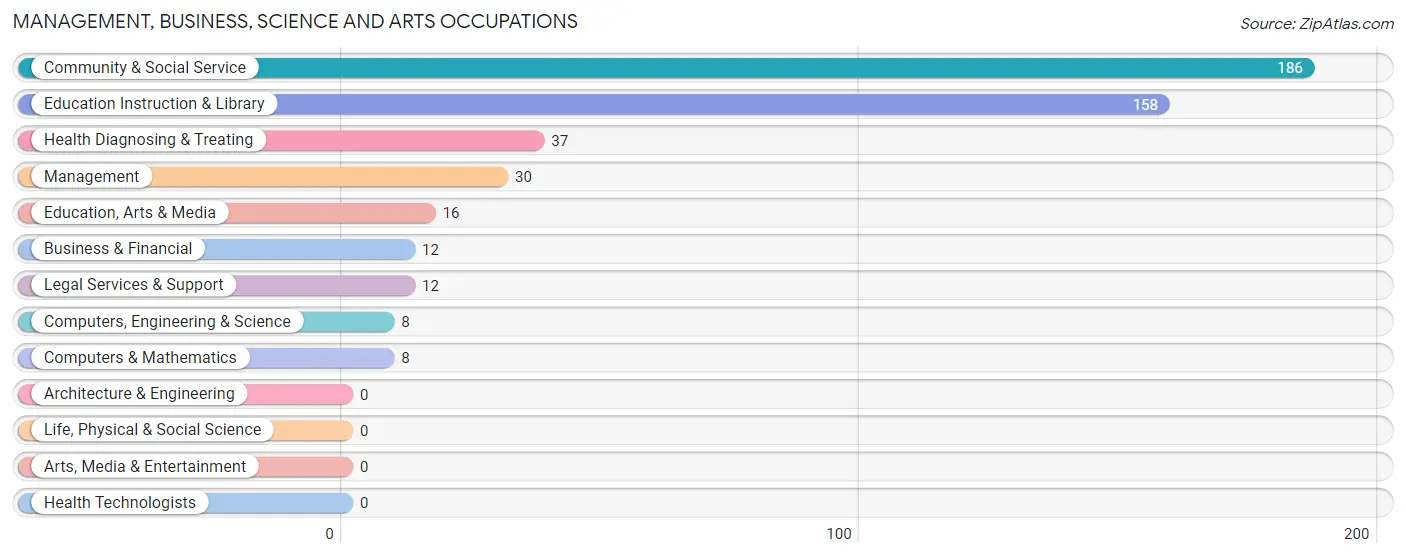
Management, Business, Science and Arts Occupations
The most common Management, Business, Science and Arts occupations in South Bay are Community & Social Service (186 | 19.5%), Education Instruction & Library (158 | 16.5%), Health Diagnosing & Treating (37 | 3.9%), Management (30 | 3.1%), and Education, Arts & Media (16 | 1.7%).
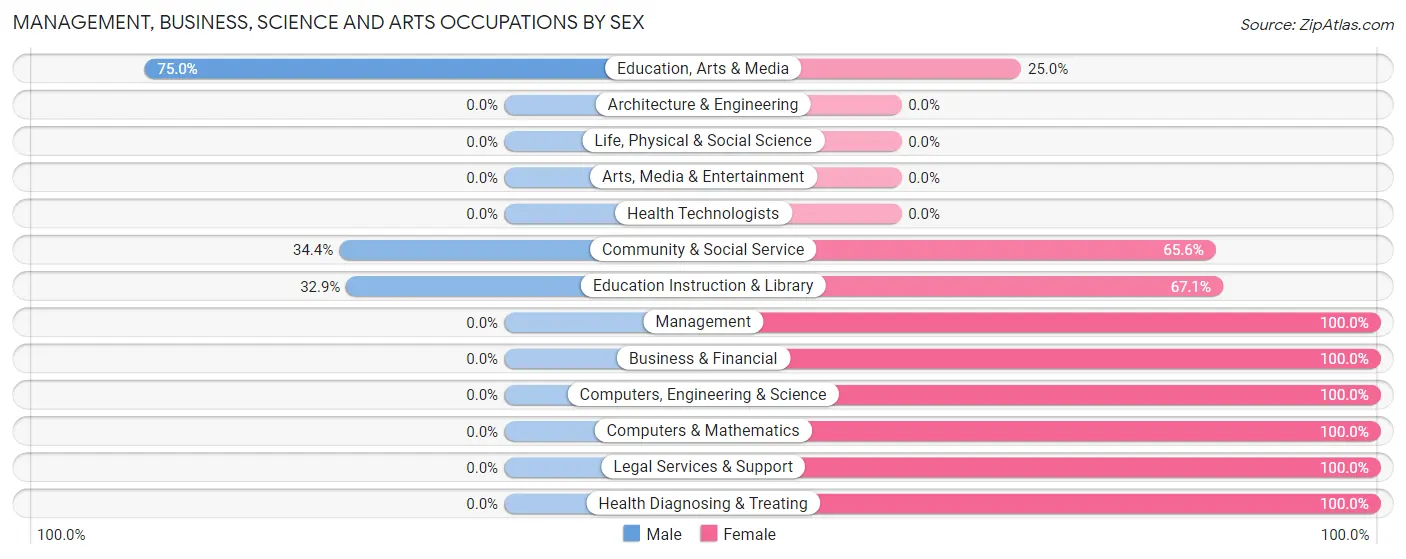
Management, Business, Science and Arts Occupations by Sex
Within the Management, Business, Science and Arts occupations in South Bay, the most male-oriented occupations are Education, Arts & Media (75.0%), Community & Social Service (34.4%), and Education Instruction & Library (32.9%), while the most female-oriented occupations are Management (100.0%), Business & Financial (100.0%), and Computers, Engineering & Science (100.0%).
| Occupation | Male | Female |
| Management | 0 (0.0%) | 30 (100.0%) |
| Business & Financial | 0 (0.0%) | 12 (100.0%) |
| Computers, Engineering & Science | 0 (0.0%) | 8 (100.0%) |
| Computers & Mathematics | 0 (0.0%) | 8 (100.0%) |
| Architecture & Engineering | 0 (0.0%) | 0 (0.0%) |
| Life, Physical & Social Science | 0 (0.0%) | 0 (0.0%) |
| Community & Social Service | 64 (34.4%) | 122 (65.6%) |
| Education, Arts & Media | 12 (75.0%) | 4 (25.0%) |
| Legal Services & Support | 0 (0.0%) | 12 (100.0%) |
| Education Instruction & Library | 52 (32.9%) | 106 (67.1%) |
| Arts, Media & Entertainment | 0 (0.0%) | 0 (0.0%) |
| Health Diagnosing & Treating | 0 (0.0%) | 37 (100.0%) |
| Health Technologists | 0 (0.0%) | 0 (0.0%) |
| Total (Category) | 64 (23.4%) | 209 (76.6%) |
| Total (Overall) | 526 (55.0%) | 430 (45.0%) |
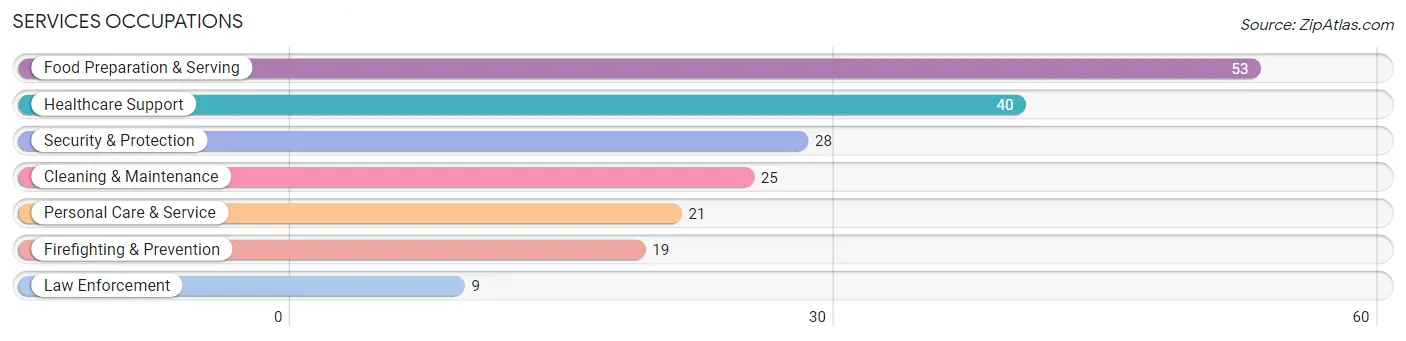
Services Occupations
The most common Services occupations in South Bay are Food Preparation & Serving (53 | 5.5%), Healthcare Support (40 | 4.2%), Security & Protection (28 | 2.9%), Cleaning & Maintenance (25 | 2.6%), and Personal Care & Service (21 | 2.2%).
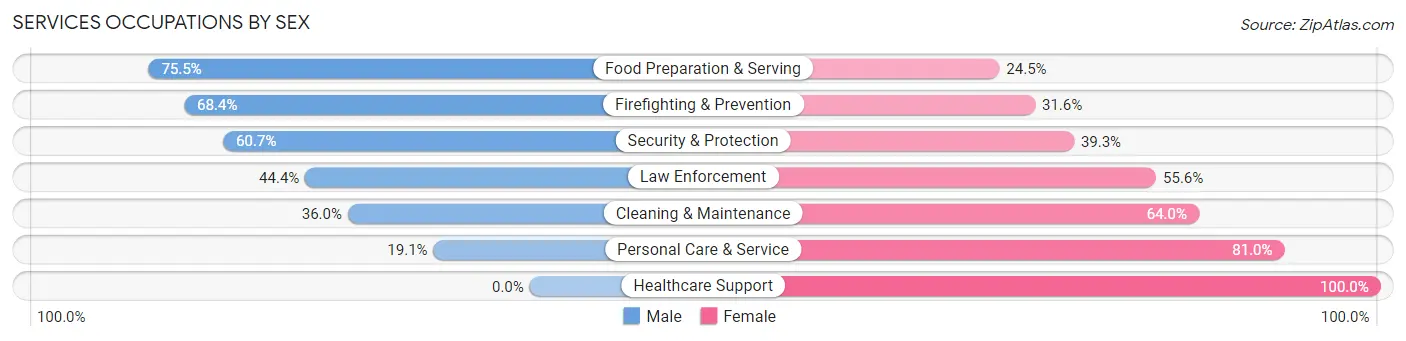
Services Occupations by Sex
Within the Services occupations in South Bay, the most male-oriented occupations are Food Preparation & Serving (75.5%), Firefighting & Prevention (68.4%), and Security & Protection (60.7%), while the most female-oriented occupations are Healthcare Support (100.0%), Personal Care & Service (80.9%), and Cleaning & Maintenance (64.0%).
| Occupation | Male | Female |
| Healthcare Support | 0 (0.0%) | 40 (100.0%) |
| Security & Protection | 17 (60.7%) | 11 (39.3%) |
| Firefighting & Prevention | 13 (68.4%) | 6 (31.6%) |
| Law Enforcement | 4 (44.4%) | 5 (55.6%) |
| Food Preparation & Serving | 40 (75.5%) | 13 (24.5%) |
| Cleaning & Maintenance | 9 (36.0%) | 16 (64.0%) |
| Personal Care & Service | 4 (19.1%) | 17 (80.9%) |
| Total (Category) | 70 (41.9%) | 97 (58.1%) |
| Total (Overall) | 526 (55.0%) | 430 (45.0%) |
Sales and Office Occupations
The most common Sales and Office occupations in South Bay are Office & Administration (86 | 9.0%), and Sales & Related (37 | 3.9%).
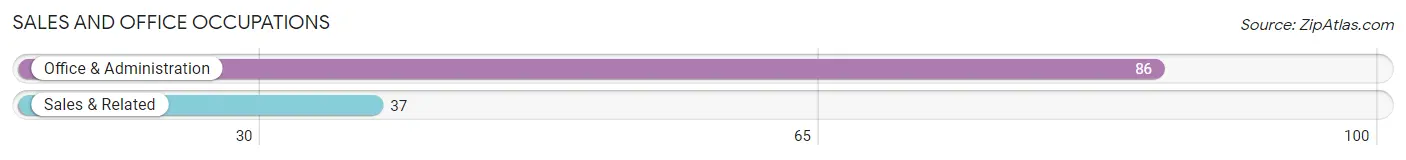
Sales and Office Occupations by Sex
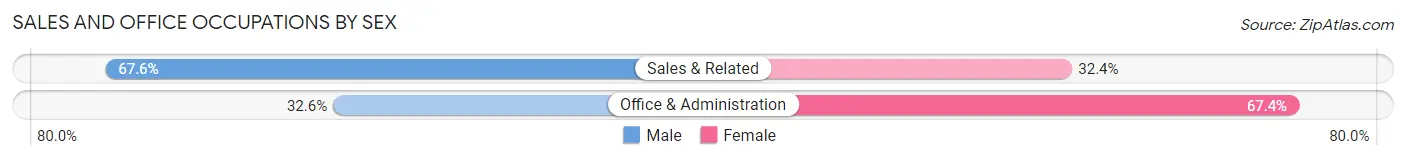
| Occupation | Male | Female |
| Sales & Related | 25 (67.6%) | 12 (32.4%) |
| Office & Administration | 28 (32.6%) | 58 (67.4%) |
| Total (Category) | 53 (43.1%) | 70 (56.9%) |
| Total (Overall) | 526 (55.0%) | 430 (45.0%) |
Natural Resources, Construction and Maintenance Occupations
The most common Natural Resources, Construction and Maintenance occupations in South Bay are Farming, Fishing & Forestry (77 | 8.1%), Installation, Maintenance & Repair (52 | 5.4%), and Construction & Extraction (50 | 5.2%).
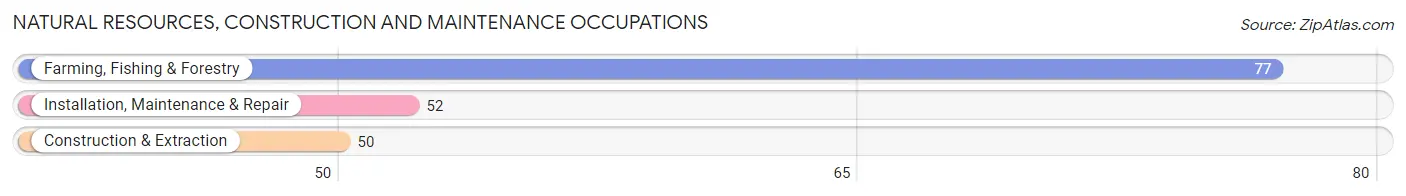
Natural Resources, Construction and Maintenance Occupations by Sex
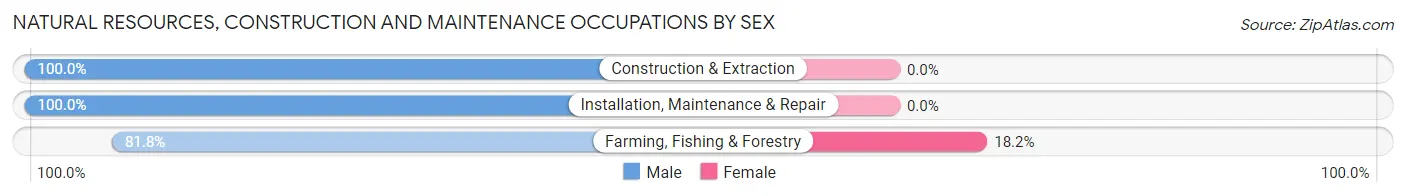
| Occupation | Male | Female |
| Farming, Fishing & Forestry | 63 (81.8%) | 14 (18.2%) |
| Construction & Extraction | 50 (100.0%) | 0 (0.0%) |
| Installation, Maintenance & Repair | 52 (100.0%) | 0 (0.0%) |
| Total (Category) | 165 (92.2%) | 14 (7.8%) |
| Total (Overall) | 526 (55.0%) | 430 (45.0%) |
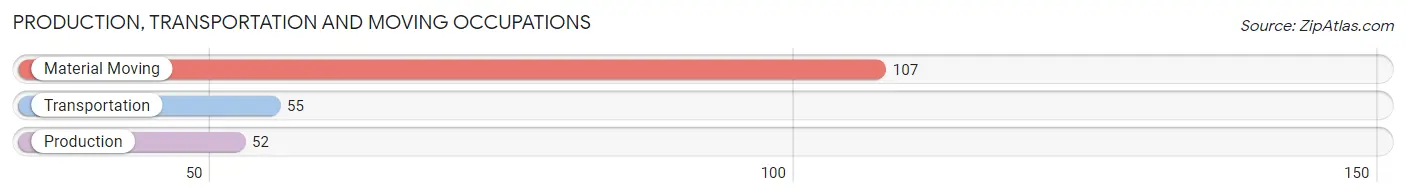
Production, Transportation and Moving Occupations
The most common Production, Transportation and Moving occupations in South Bay are Material Moving (107 | 11.2%), Transportation (55 | 5.8%), and Production (52 | 5.4%).
Production, Transportation and Moving Occupations by Sex
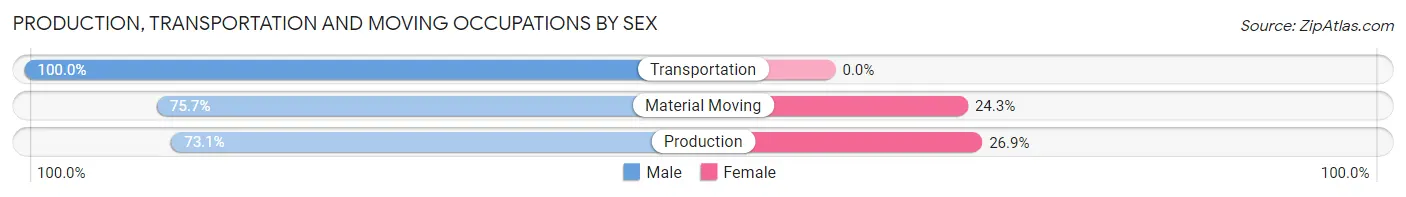
| Occupation | Male | Female |
| Production | 38 (73.1%) | 14 (26.9%) |
| Transportation | 55 (100.0%) | 0 (0.0%) |
| Material Moving | 81 (75.7%) | 26 (24.3%) |
| Total (Category) | 174 (81.3%) | 40 (18.7%) |
| Total (Overall) | 526 (55.0%) | 430 (45.0%) |
Employment Industries by Sex in South Bay
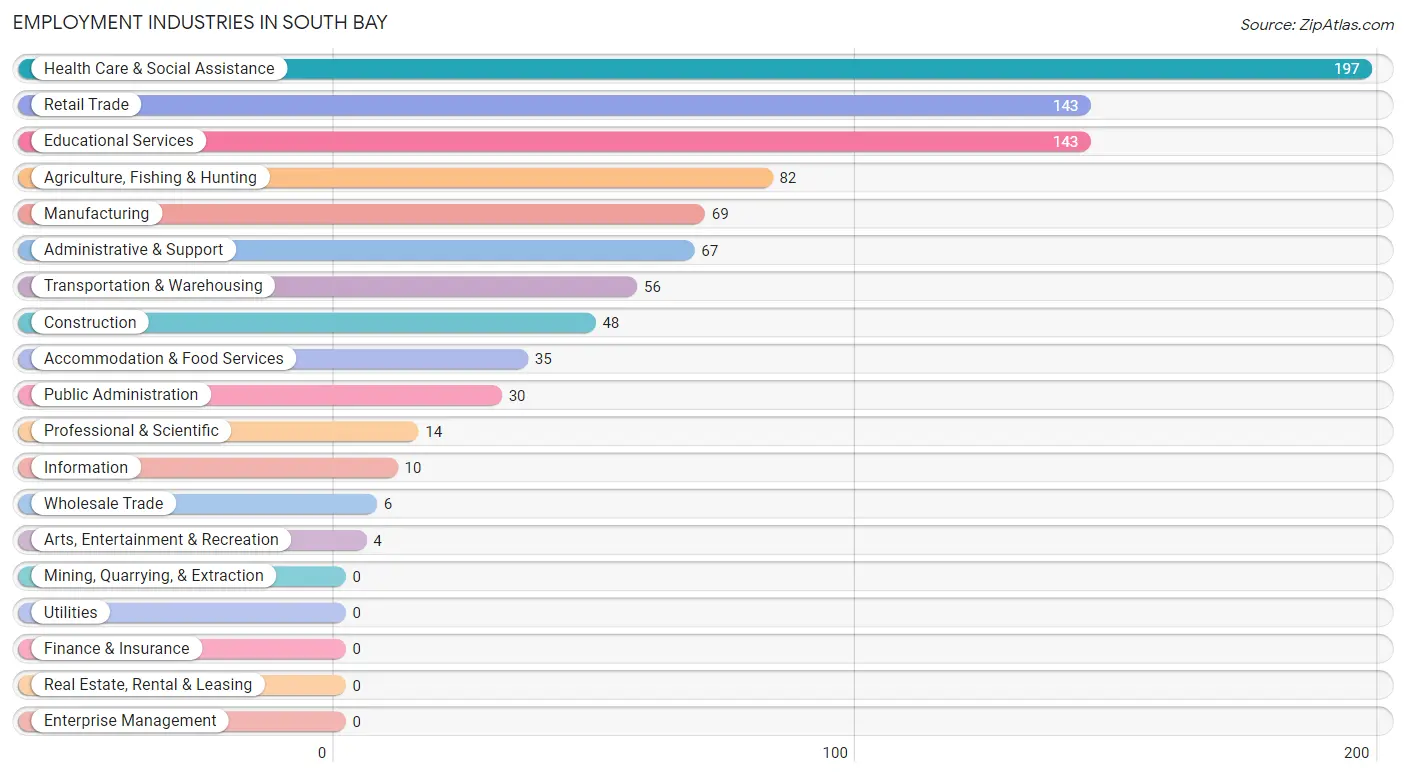
Employment Industries in South Bay
The major employment industries in South Bay include Health Care & Social Assistance (197 | 20.6%), Retail Trade (143 | 15.0%), Educational Services (143 | 15.0%), Agriculture, Fishing & Hunting (82 | 8.6%), and Manufacturing (69 | 7.2%).
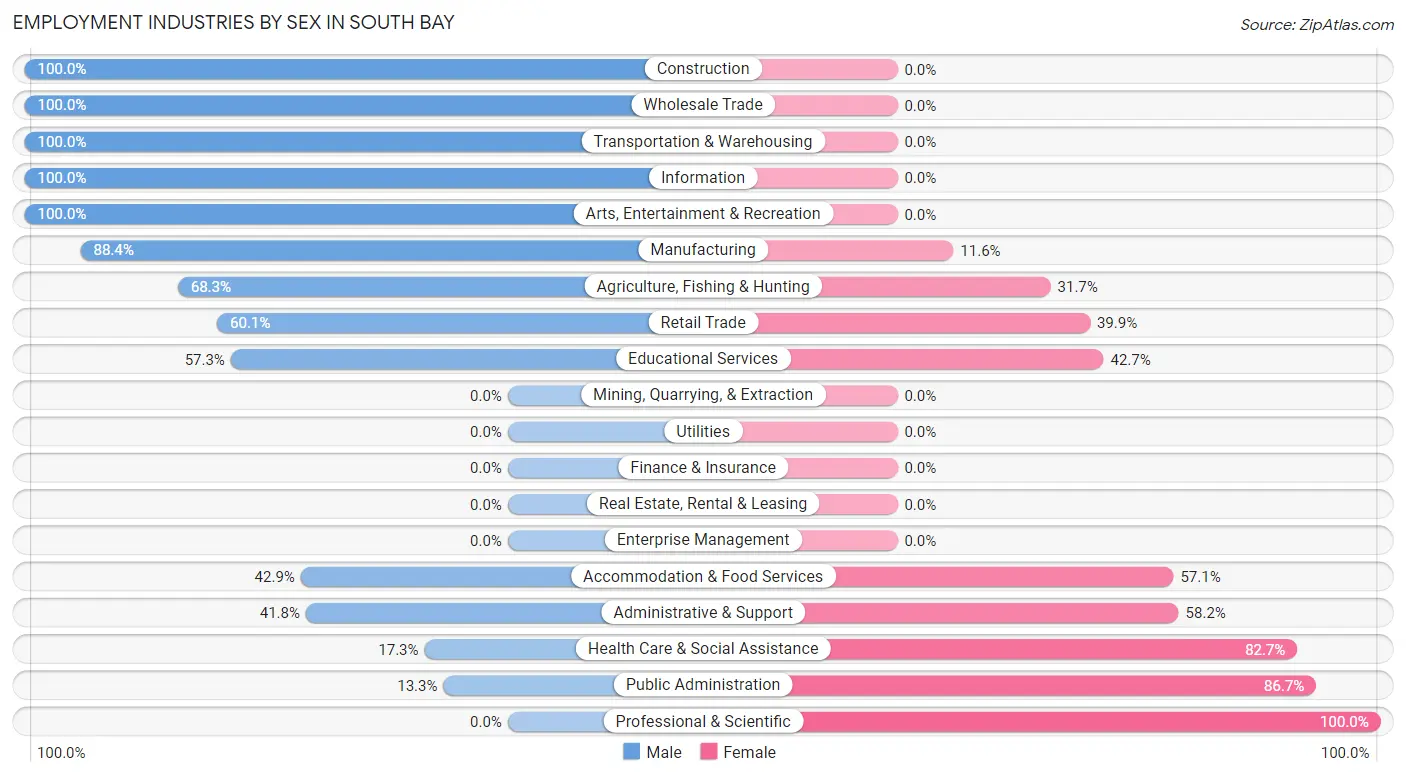
Employment Industries by Sex in South Bay
The South Bay industries that see more men than women are Construction (100.0%), Wholesale Trade (100.0%), and Transportation & Warehousing (100.0%), whereas the industries that tend to have a higher number of women are Professional & Scientific (100.0%), Public Administration (86.7%), and Health Care & Social Assistance (82.7%).
| Industry | Male | Female |
| Agriculture, Fishing & Hunting | 56 (68.3%) | 26 (31.7%) |
| Mining, Quarrying, & Extraction | 0 (0.0%) | 0 (0.0%) |
| Construction | 48 (100.0%) | 0 (0.0%) |
| Manufacturing | 61 (88.4%) | 8 (11.6%) |
| Wholesale Trade | 6 (100.0%) | 0 (0.0%) |
| Retail Trade | 86 (60.1%) | 57 (39.9%) |
| Transportation & Warehousing | 56 (100.0%) | 0 (0.0%) |
| Utilities | 0 (0.0%) | 0 (0.0%) |
| Information | 10 (100.0%) | 0 (0.0%) |
| Finance & Insurance | 0 (0.0%) | 0 (0.0%) |
| Real Estate, Rental & Leasing | 0 (0.0%) | 0 (0.0%) |
| Professional & Scientific | 0 (0.0%) | 14 (100.0%) |
| Enterprise Management | 0 (0.0%) | 0 (0.0%) |
| Administrative & Support | 28 (41.8%) | 39 (58.2%) |
| Educational Services | 82 (57.3%) | 61 (42.7%) |
| Health Care & Social Assistance | 34 (17.3%) | 163 (82.7%) |
| Arts, Entertainment & Recreation | 4 (100.0%) | 0 (0.0%) |
| Accommodation & Food Services | 15 (42.9%) | 20 (57.1%) |
| Public Administration | 4 (13.3%) | 26 (86.7%) |
| Total | 526 (55.0%) | 430 (45.0%) |
Education in South Bay
School Enrollment in South Bay
The most common levels of schooling among the 1,313 students in South Bay are high school (571 | 43.5%), middle school (273 | 20.8%), and elementary school (166 | 12.6%).
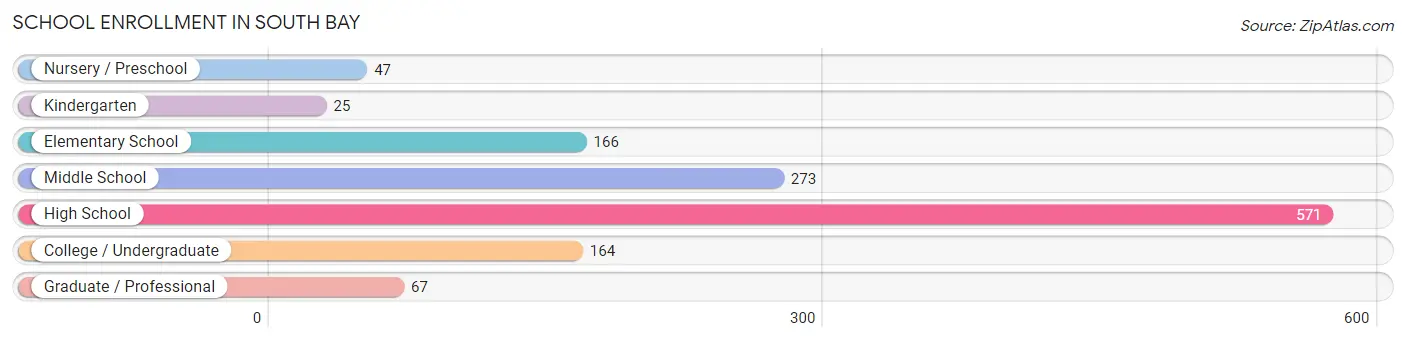
| School Level | # Students | % Students |
| Nursery / Preschool | 47 | 3.6% |
| Kindergarten | 25 | 1.9% |
| Elementary School | 166 | 12.6% |
| Middle School | 273 | 20.8% |
| High School | 571 | 43.5% |
| College / Undergraduate | 164 | 12.5% |
| Graduate / Professional | 67 | 5.1% |
| Total | 1,313 | 100.0% |
School Enrollment by Age by Funding Source in South Bay
Out of a total of 1,313 students who are enrolled in schools in South Bay, 572 (43.6%) attend a private institution, while the remaining 741 (56.4%) are enrolled in public schools. The age group of 35 years and over has the highest likelihood of being enrolled in private schools, with 378 (84.2% in the age bracket) enrolled. Conversely, the age group of 18 to 19 year olds has the lowest likelihood of being enrolled in a private school, with 37 (100.0% in the age bracket) attending a public institution.
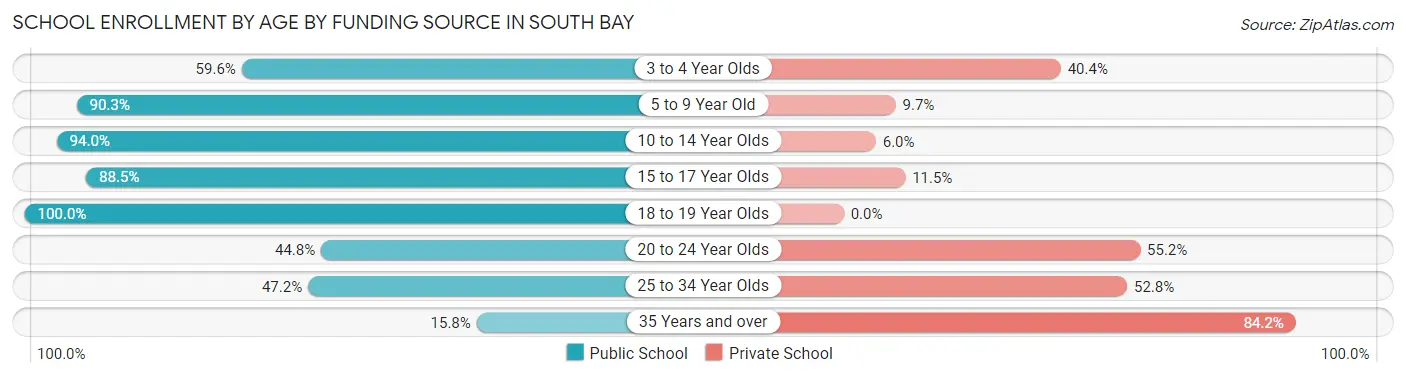
| Age Bracket | Public School | Private School |
| 3 to 4 Year Olds | 28 (59.6%) | 19 (40.4%) |
| 5 to 9 Year Old | 168 (90.3%) | 18 (9.7%) |
| 10 to 14 Year Olds | 236 (94.0%) | 15 (6.0%) |
| 15 to 17 Year Olds | 85 (88.5%) | 11 (11.5%) |
| 18 to 19 Year Olds | 37 (100.0%) | 0 (0.0%) |
| 20 to 24 Year Olds | 30 (44.8%) | 37 (55.2%) |
| 25 to 34 Year Olds | 85 (47.2%) | 95 (52.8%) |
| 35 Years and over | 71 (15.8%) | 378 (84.2%) |
| Total | 741 (56.4%) | 572 (43.6%) |
Educational Attainment by Field of Study in South Bay
Education (95 | 34.1%), business (44 | 15.8%), psychology (30 | 10.7%), engineering (29 | 10.4%), and bio, nature & agricultural (25 | 9.0%) are the most common fields of study among 279 individuals in South Bay who have obtained a bachelor's degree or higher.
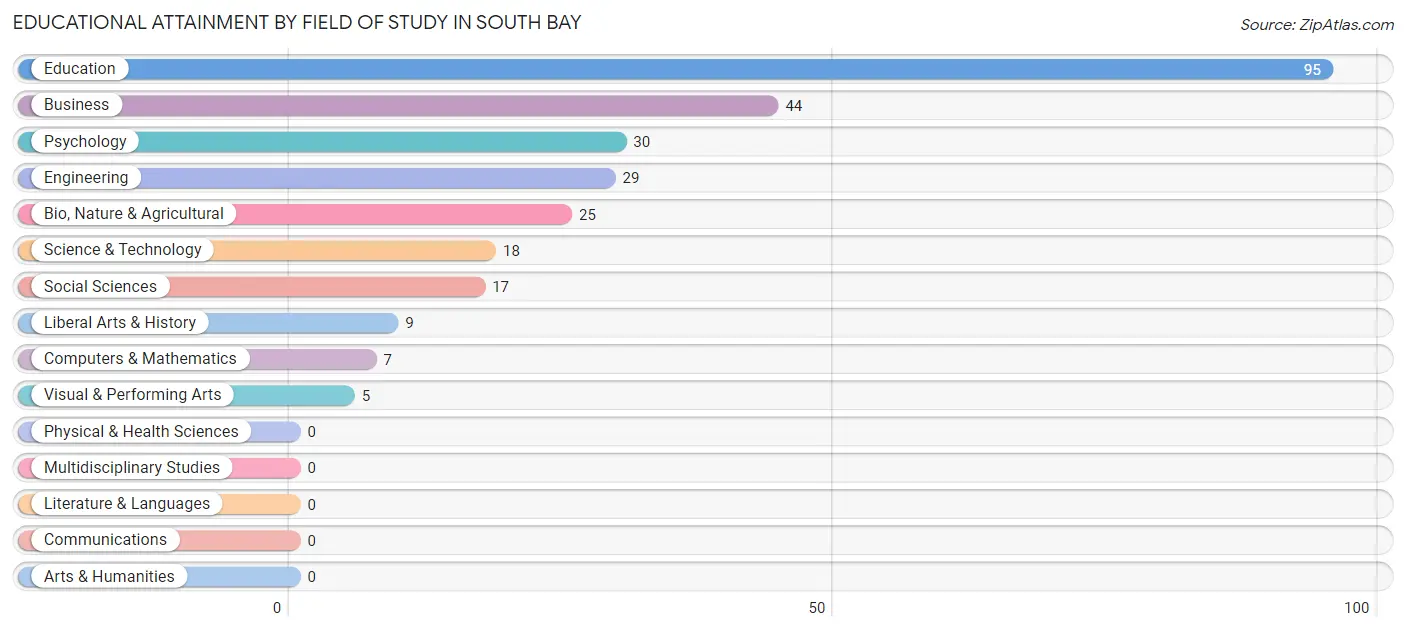
| Field of Study | # Graduates | % Graduates |
| Computers & Mathematics | 7 | 2.5% |
| Bio, Nature & Agricultural | 25 | 9.0% |
| Physical & Health Sciences | 0 | 0.0% |
| Psychology | 30 | 10.7% |
| Social Sciences | 17 | 6.1% |
| Engineering | 29 | 10.4% |
| Multidisciplinary Studies | 0 | 0.0% |
| Science & Technology | 18 | 6.5% |
| Business | 44 | 15.8% |
| Education | 95 | 34.1% |
| Literature & Languages | 0 | 0.0% |
| Liberal Arts & History | 9 | 3.2% |
| Visual & Performing Arts | 5 | 1.8% |
| Communications | 0 | 0.0% |
| Arts & Humanities | 0 | 0.0% |
| Total | 279 | 100.0% |
Transportation & Commute in South Bay
Vehicle Availability by Sex in South Bay
The most prevalent vehicle ownership categories in South Bay are males with 2 vehicles (171, accounting for 33.1%) and females with 2 vehicles (101, making up 41.6%).

| Vehicles Available | Male | Female |
| No Vehicle | 78 (15.1%) | 44 (10.7%) |
| 1 Vehicle | 99 (19.2%) | 117 (28.5%) |
| 2 Vehicles | 171 (33.1%) | 101 (24.6%) |
| 3 Vehicles | 98 (19.0%) | 63 (15.3%) |
| 4 Vehicles | 56 (10.8%) | 74 (18.0%) |
| 5 or more Vehicles | 14 (2.7%) | 12 (2.9%) |
| Total | 516 (100.0%) | 411 (100.0%) |
Commute Time in South Bay
The most frequently occuring commute durations in South Bay are 15 to 19 minutes (217 commuters, 24.3%), 60 to 89 minutes (130 commuters, 14.6%), and 10 to 14 minutes (111 commuters, 12.4%).
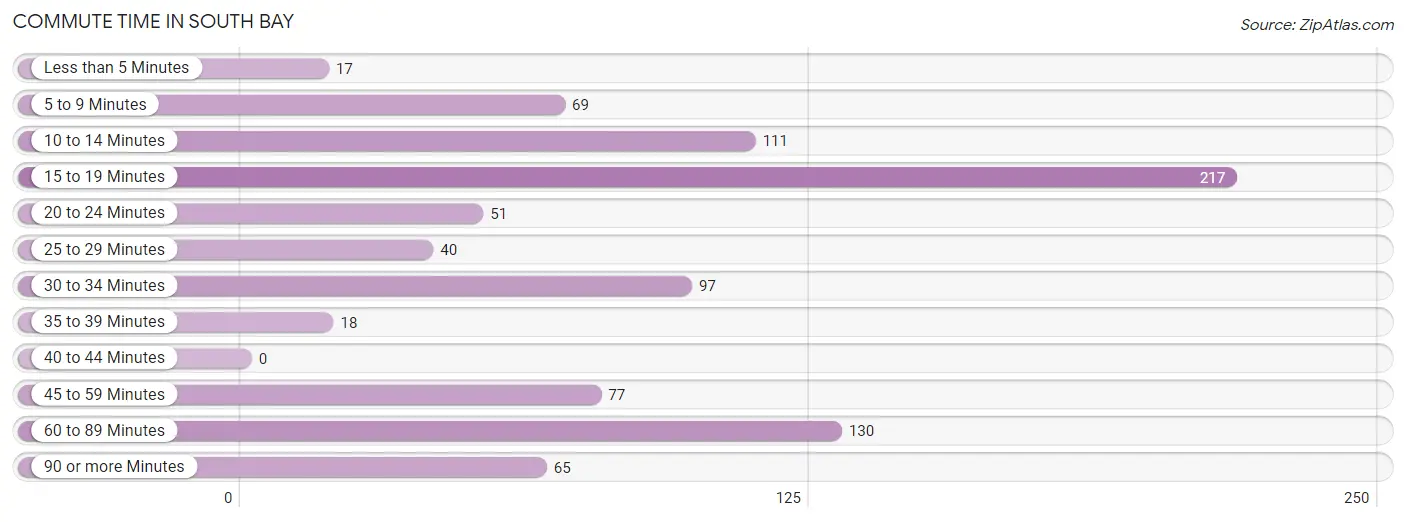
| Commute Time | # Commuters | % Commuters |
| Less than 5 Minutes | 17 | 1.9% |
| 5 to 9 Minutes | 69 | 7.7% |
| 10 to 14 Minutes | 111 | 12.4% |
| 15 to 19 Minutes | 217 | 24.3% |
| 20 to 24 Minutes | 51 | 5.7% |
| 25 to 29 Minutes | 40 | 4.5% |
| 30 to 34 Minutes | 97 | 10.9% |
| 35 to 39 Minutes | 18 | 2.0% |
| 40 to 44 Minutes | 0 | 0.0% |
| 45 to 59 Minutes | 77 | 8.6% |
| 60 to 89 Minutes | 130 | 14.6% |
| 90 or more Minutes | 65 | 7.3% |
Commute Time by Sex in South Bay
The most common commute times in South Bay are 15 to 19 minutes (95 commuters, 19.2%) for males and 15 to 19 minutes (122 commuters, 30.7%) for females.
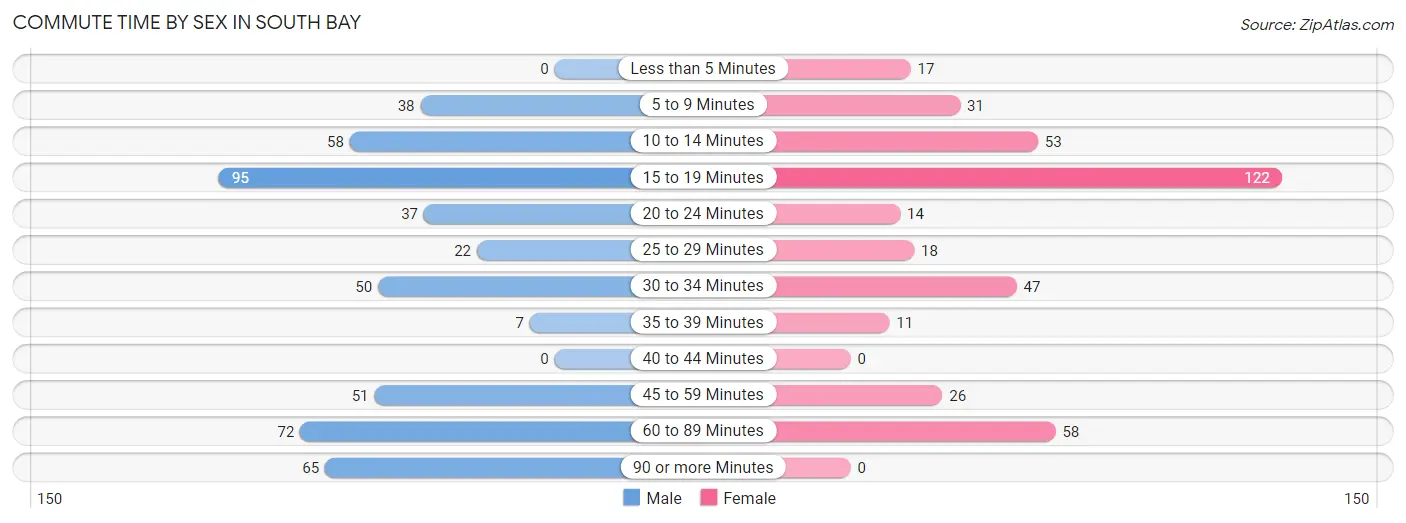
| Commute Time | Male | Female |
| Less than 5 Minutes | 0 (0.0%) | 17 (4.3%) |
| 5 to 9 Minutes | 38 (7.7%) | 31 (7.8%) |
| 10 to 14 Minutes | 58 (11.7%) | 53 (13.4%) |
| 15 to 19 Minutes | 95 (19.2%) | 122 (30.7%) |
| 20 to 24 Minutes | 37 (7.5%) | 14 (3.5%) |
| 25 to 29 Minutes | 22 (4.4%) | 18 (4.5%) |
| 30 to 34 Minutes | 50 (10.1%) | 47 (11.8%) |
| 35 to 39 Minutes | 7 (1.4%) | 11 (2.8%) |
| 40 to 44 Minutes | 0 (0.0%) | 0 (0.0%) |
| 45 to 59 Minutes | 51 (10.3%) | 26 (6.6%) |
| 60 to 89 Minutes | 72 (14.5%) | 58 (14.6%) |
| 90 or more Minutes | 65 (13.1%) | 0 (0.0%) |
Time of Departure to Work by Sex in South Bay
The most frequent times of departure to work in South Bay are 7:00 AM to 7:29 AM (116, 23.4%) for males and 7:30 AM to 7:59 AM (115, 29.0%) for females.
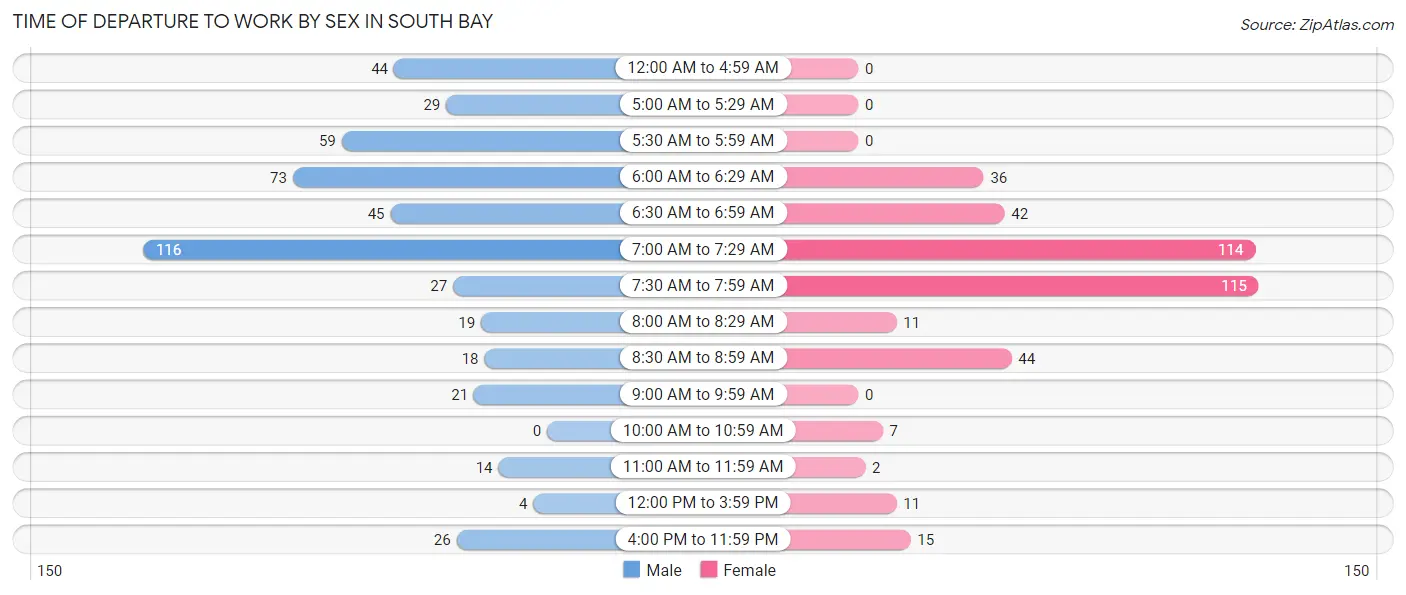
| Time of Departure | Male | Female |
| 12:00 AM to 4:59 AM | 44 (8.9%) | 0 (0.0%) |
| 5:00 AM to 5:29 AM | 29 (5.9%) | 0 (0.0%) |
| 5:30 AM to 5:59 AM | 59 (11.9%) | 0 (0.0%) |
| 6:00 AM to 6:29 AM | 73 (14.7%) | 36 (9.1%) |
| 6:30 AM to 6:59 AM | 45 (9.1%) | 42 (10.6%) |
| 7:00 AM to 7:29 AM | 116 (23.4%) | 114 (28.7%) |
| 7:30 AM to 7:59 AM | 27 (5.4%) | 115 (29.0%) |
| 8:00 AM to 8:29 AM | 19 (3.8%) | 11 (2.8%) |
| 8:30 AM to 8:59 AM | 18 (3.6%) | 44 (11.1%) |
| 9:00 AM to 9:59 AM | 21 (4.2%) | 0 (0.0%) |
| 10:00 AM to 10:59 AM | 0 (0.0%) | 7 (1.8%) |
| 11:00 AM to 11:59 AM | 14 (2.8%) | 2 (0.5%) |
| 12:00 PM to 3:59 PM | 4 (0.8%) | 11 (2.8%) |
| 4:00 PM to 11:59 PM | 26 (5.2%) | 15 (3.8%) |
| Total | 495 (100.0%) | 397 (100.0%) |
Housing Occupancy in South Bay
Occupancy by Ownership in South Bay
Of the total 725 dwellings in South Bay, owner-occupied units account for 422 (58.2%), while renter-occupied units make up 303 (41.8%).
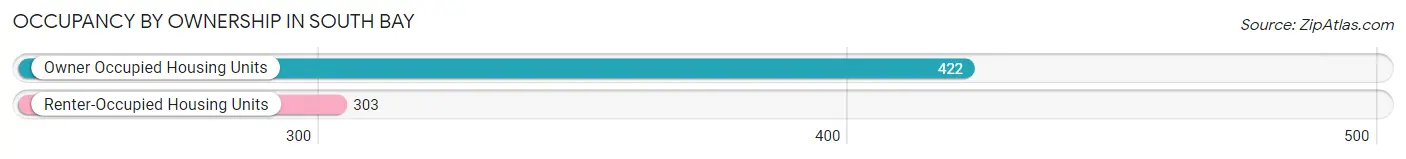
| Occupancy | # Housing Units | % Housing Units |
| Owner Occupied Housing Units | 422 | 58.2% |
| Renter-Occupied Housing Units | 303 | 41.8% |
| Total Occupied Housing Units | 725 | 100.0% |
Occupancy by Household Size in South Bay
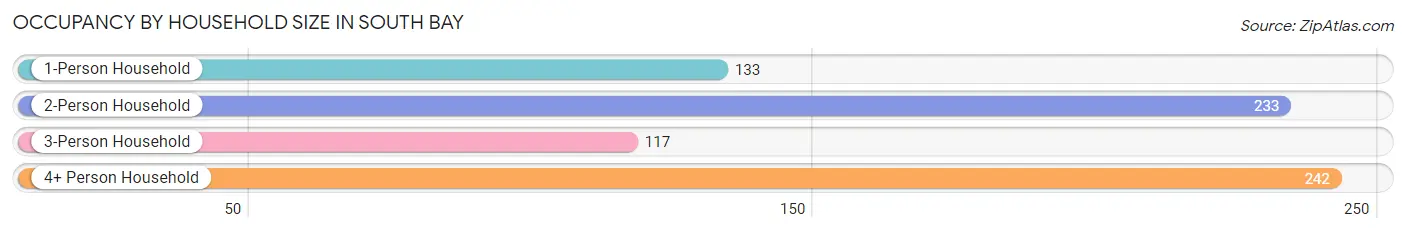
| Household Size | # Housing Units | % Housing Units |
| 1-Person Household | 133 | 18.3% |
| 2-Person Household | 233 | 32.1% |
| 3-Person Household | 117 | 16.1% |
| 4+ Person Household | 242 | 33.4% |
| Total Housing Units | 725 | 100.0% |
Occupancy by Ownership by Household Size in South Bay
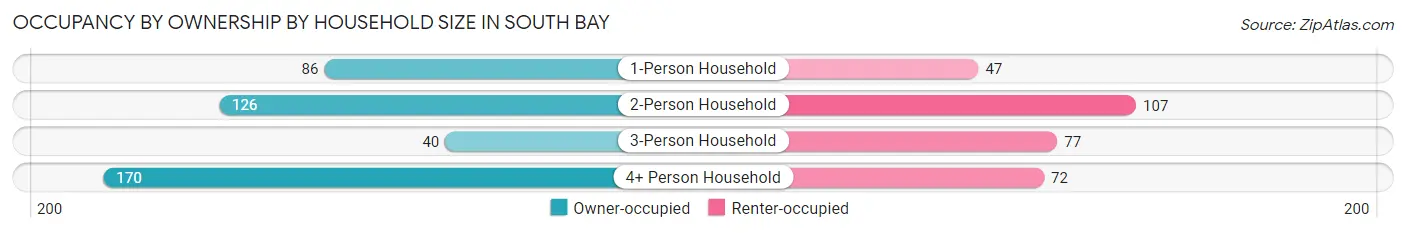
| Household Size | Owner-occupied | Renter-occupied |
| 1-Person Household | 86 (64.7%) | 47 (35.3%) |
| 2-Person Household | 126 (54.1%) | 107 (45.9%) |
| 3-Person Household | 40 (34.2%) | 77 (65.8%) |
| 4+ Person Household | 170 (70.3%) | 72 (29.7%) |
| Total Housing Units | 422 (58.2%) | 303 (41.8%) |
Occupancy by Educational Attainment in South Bay
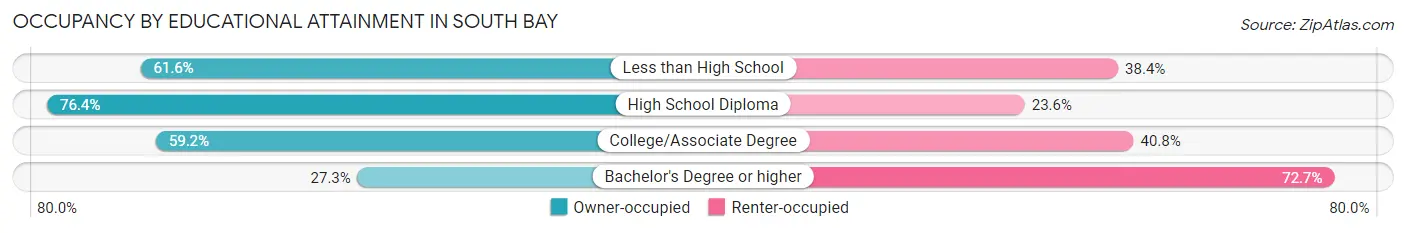
| Household Size | Owner-occupied | Renter-occupied |
| Less than High School | 167 (61.6%) | 104 (38.4%) |
| High School Diploma | 120 (76.4%) | 37 (23.6%) |
| College/Associate Degree | 100 (59.2%) | 69 (40.8%) |
| Bachelor's Degree or higher | 35 (27.3%) | 93 (72.7%) |
Occupancy by Age of Householder in South Bay
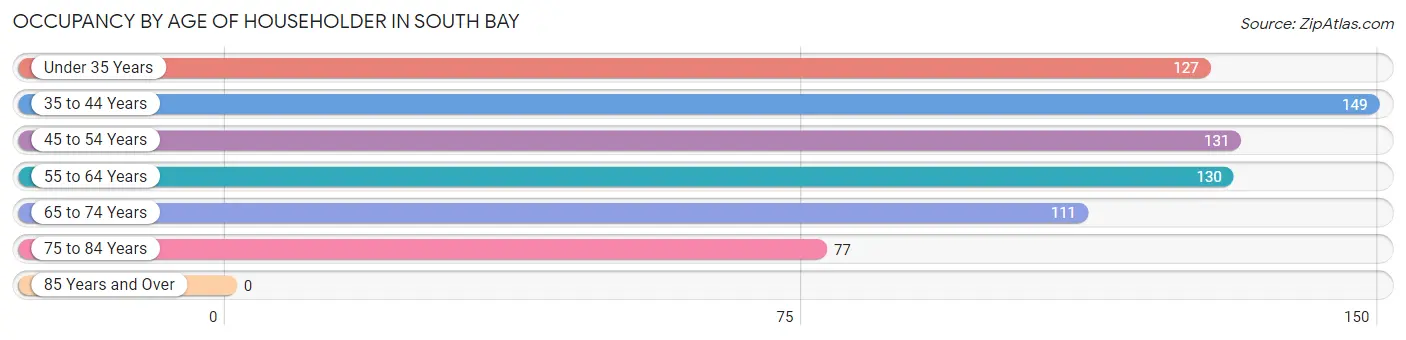
| Age Bracket | # Households | % Households |
| Under 35 Years | 127 | 17.5% |
| 35 to 44 Years | 149 | 20.5% |
| 45 to 54 Years | 131 | 18.1% |
| 55 to 64 Years | 130 | 17.9% |
| 65 to 74 Years | 111 | 15.3% |
| 75 to 84 Years | 77 | 10.6% |
| 85 Years and Over | 0 | 0.0% |
| Total | 725 | 100.0% |
Housing Finances in South Bay
Median Income by Occupancy in South Bay
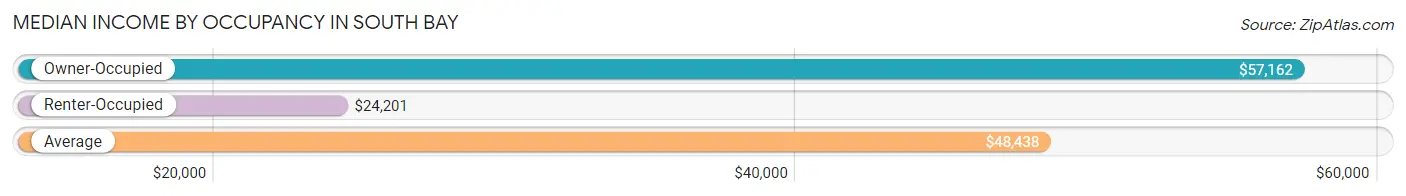
| Occupancy Type | # Households | Median Income |
| Owner-Occupied | 422 (58.2%) | $57,162 |
| Renter-Occupied | 303 (41.8%) | $24,201 |
| Average | 725 (100.0%) | $48,438 |
Occupancy by Householder Income Bracket in South Bay
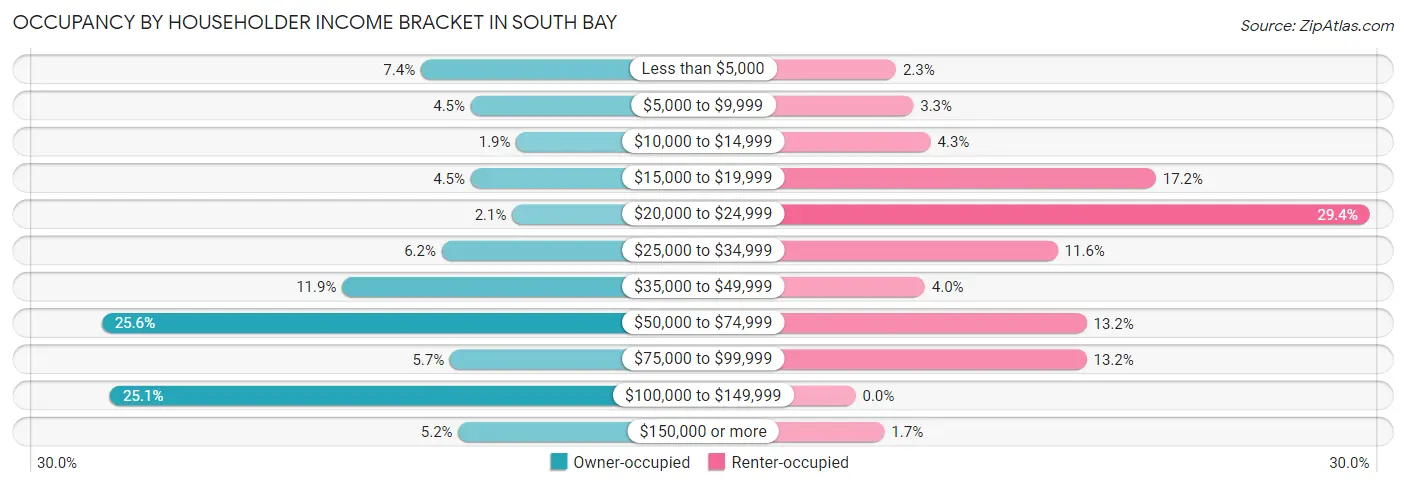
| Income Bracket | Owner-occupied | Renter-occupied |
| Less than $5,000 | 31 (7.3%) | 7 (2.3%) |
| $5,000 to $9,999 | 19 (4.5%) | 10 (3.3%) |
| $10,000 to $14,999 | 8 (1.9%) | 13 (4.3%) |
| $15,000 to $19,999 | 19 (4.5%) | 52 (17.2%) |
| $20,000 to $24,999 | 9 (2.1%) | 89 (29.4%) |
| $25,000 to $34,999 | 26 (6.2%) | 35 (11.6%) |
| $35,000 to $49,999 | 50 (11.8%) | 12 (4.0%) |
| $50,000 to $74,999 | 108 (25.6%) | 40 (13.2%) |
| $75,000 to $99,999 | 24 (5.7%) | 40 (13.2%) |
| $100,000 to $149,999 | 106 (25.1%) | 0 (0.0%) |
| $150,000 or more | 22 (5.2%) | 5 (1.7%) |
| Total | 422 (100.0%) | 303 (100.0%) |
Monthly Housing Cost Tiers in South Bay
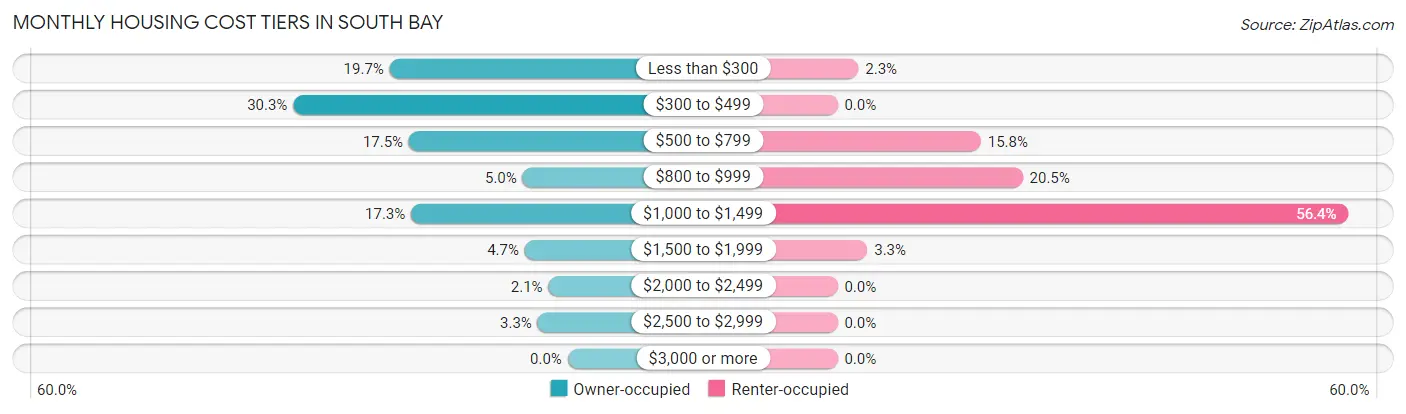
| Monthly Cost | Owner-occupied | Renter-occupied |
| Less than $300 | 83 (19.7%) | 7 (2.3%) |
| $300 to $499 | 128 (30.3%) | 0 (0.0%) |
| $500 to $799 | 74 (17.5%) | 48 (15.8%) |
| $800 to $999 | 21 (5.0%) | 62 (20.5%) |
| $1,000 to $1,499 | 73 (17.3%) | 171 (56.4%) |
| $1,500 to $1,999 | 20 (4.7%) | 10 (3.3%) |
| $2,000 to $2,499 | 9 (2.1%) | 0 (0.0%) |
| $2,500 to $2,999 | 14 (3.3%) | 0 (0.0%) |
| $3,000 or more | 0 (0.0%) | 0 (0.0%) |
| Total | 422 (100.0%) | 303 (100.0%) |
Physical Housing Characteristics in South Bay
Housing Structures in South Bay
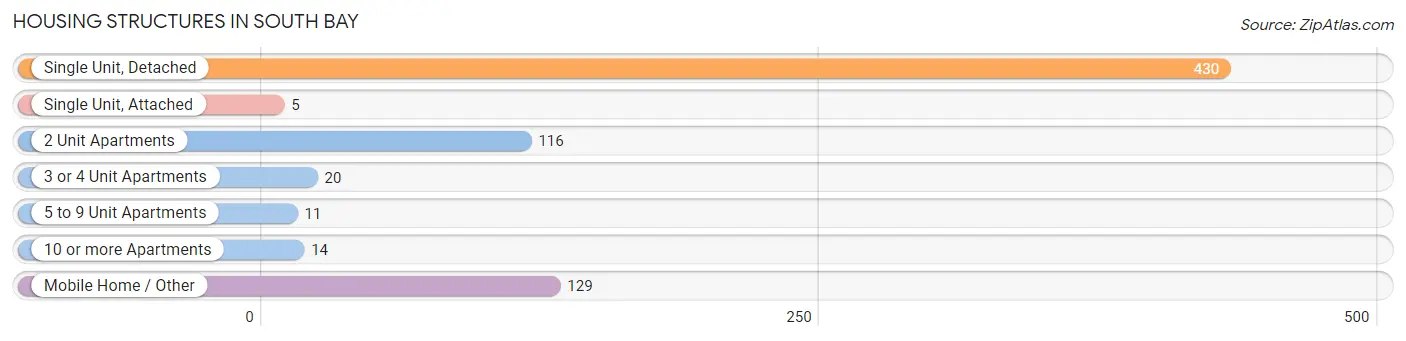
| Structure Type | # Housing Units | % Housing Units |
| Single Unit, Detached | 430 | 59.3% |
| Single Unit, Attached | 5 | 0.7% |
| 2 Unit Apartments | 116 | 16.0% |
| 3 or 4 Unit Apartments | 20 | 2.8% |
| 5 to 9 Unit Apartments | 11 | 1.5% |
| 10 or more Apartments | 14 | 1.9% |
| Mobile Home / Other | 129 | 17.8% |
| Total | 725 | 100.0% |
Housing Structures by Occupancy in South Bay
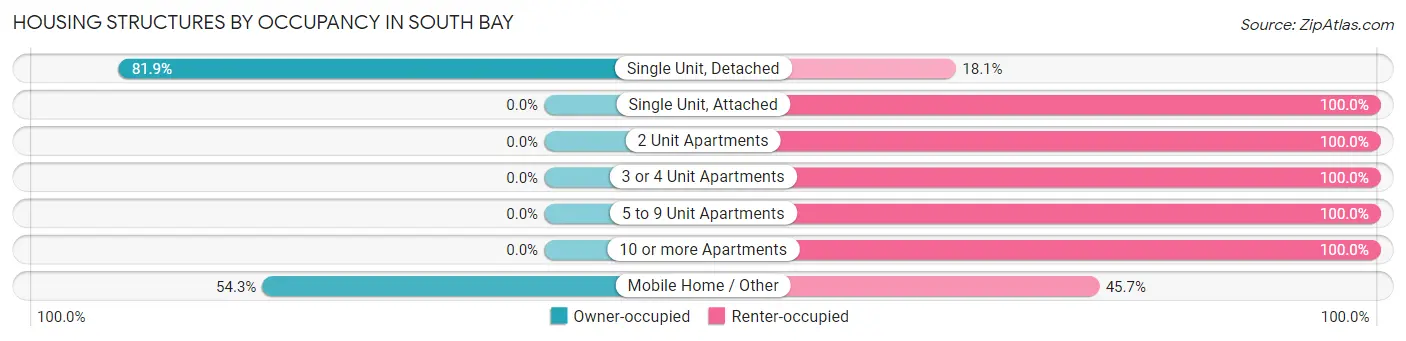
| Structure Type | Owner-occupied | Renter-occupied |
| Single Unit, Detached | 352 (81.9%) | 78 (18.1%) |
| Single Unit, Attached | 0 (0.0%) | 5 (100.0%) |
| 2 Unit Apartments | 0 (0.0%) | 116 (100.0%) |
| 3 or 4 Unit Apartments | 0 (0.0%) | 20 (100.0%) |
| 5 to 9 Unit Apartments | 0 (0.0%) | 11 (100.0%) |
| 10 or more Apartments | 0 (0.0%) | 14 (100.0%) |
| Mobile Home / Other | 70 (54.3%) | 59 (45.7%) |
| Total | 422 (58.2%) | 303 (41.8%) |
Housing Structures by Number of Rooms in South Bay
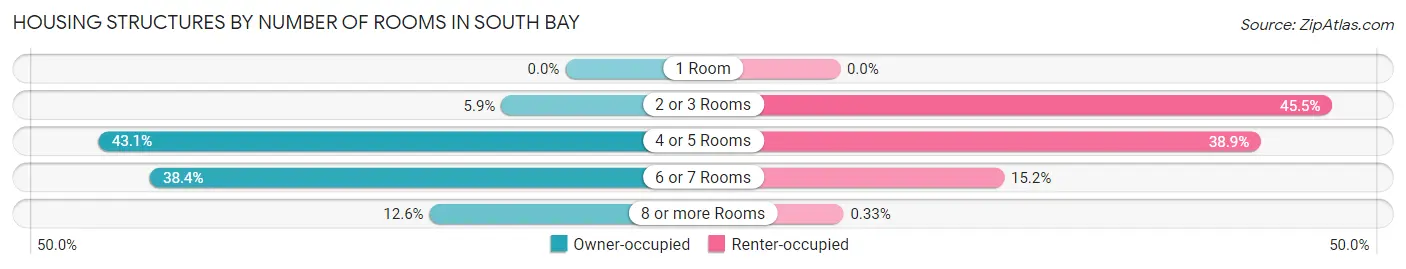
| Number of Rooms | Owner-occupied | Renter-occupied |
| 1 Room | 0 (0.0%) | 0 (0.0%) |
| 2 or 3 Rooms | 25 (5.9%) | 138 (45.5%) |
| 4 or 5 Rooms | 182 (43.1%) | 118 (38.9%) |
| 6 or 7 Rooms | 162 (38.4%) | 46 (15.2%) |
| 8 or more Rooms | 53 (12.6%) | 1 (0.3%) |
| Total | 422 (100.0%) | 303 (100.0%) |
Housing Structure by Heating Type in South Bay
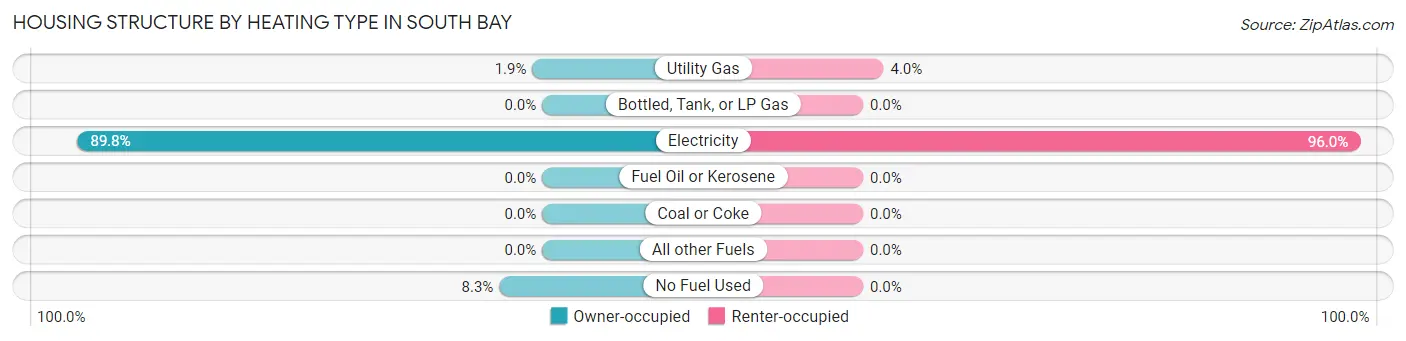
| Heating Type | Owner-occupied | Renter-occupied |
| Utility Gas | 8 (1.9%) | 12 (4.0%) |
| Bottled, Tank, or LP Gas | 0 (0.0%) | 0 (0.0%) |
| Electricity | 379 (89.8%) | 291 (96.0%) |
| Fuel Oil or Kerosene | 0 (0.0%) | 0 (0.0%) |
| Coal or Coke | 0 (0.0%) | 0 (0.0%) |
| All other Fuels | 0 (0.0%) | 0 (0.0%) |
| No Fuel Used | 35 (8.3%) | 0 (0.0%) |
| Total | 422 (100.0%) | 303 (100.0%) |
Household Vehicle Usage in South Bay
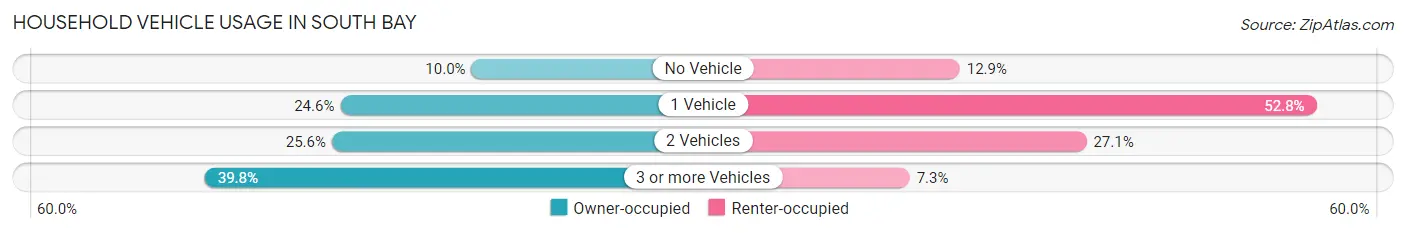
| Vehicles per Household | Owner-occupied | Renter-occupied |
| No Vehicle | 42 (10.0%) | 39 (12.9%) |
| 1 Vehicle | 104 (24.6%) | 160 (52.8%) |
| 2 Vehicles | 108 (25.6%) | 82 (27.1%) |
| 3 or more Vehicles | 168 (39.8%) | 22 (7.3%) |
| Total | 422 (100.0%) | 303 (100.0%) |
Real Estate & Mortgages in South Bay
Real Estate and Mortgage Overview in South Bay
| Characteristic | Without Mortgage | With Mortgage |
| Housing Units | 273 | 149 |
| Median Property Value | $107,500 | $156,300 |
| Median Household Income | $50,938 | $0 |
| Monthly Housing Costs | $369 | $0 |
| Real Estate Taxes | $982 | $15 |
Property Value by Mortgage Status in South Bay
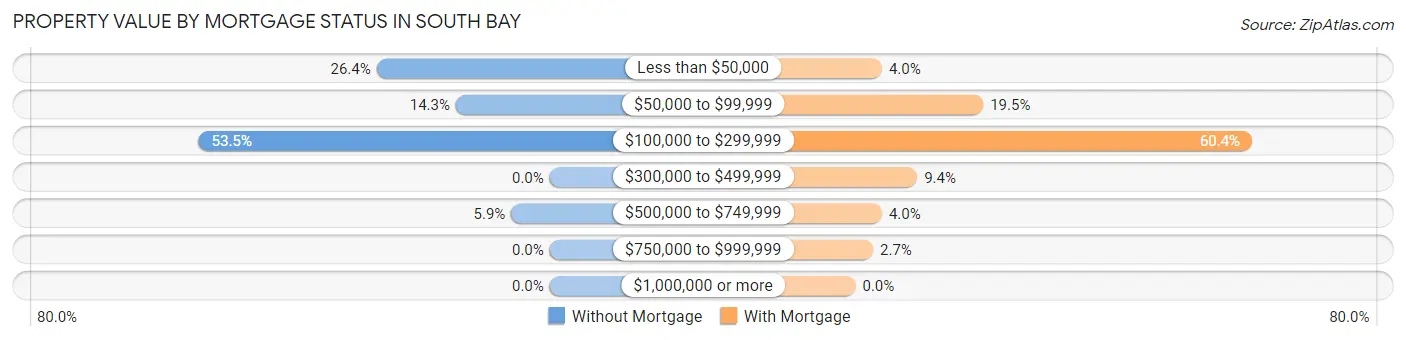
| Property Value | Without Mortgage | With Mortgage |
| Less than $50,000 | 72 (26.4%) | 6 (4.0%) |
| $50,000 to $99,999 | 39 (14.3%) | 29 (19.5%) |
| $100,000 to $299,999 | 146 (53.5%) | 90 (60.4%) |
| $300,000 to $499,999 | 0 (0.0%) | 14 (9.4%) |
| $500,000 to $749,999 | 16 (5.9%) | 6 (4.0%) |
| $750,000 to $999,999 | 0 (0.0%) | 4 (2.7%) |
| $1,000,000 or more | 0 (0.0%) | 0 (0.0%) |
| Total | 273 (100.0%) | 149 (100.0%) |
Household Income by Mortgage Status in South Bay
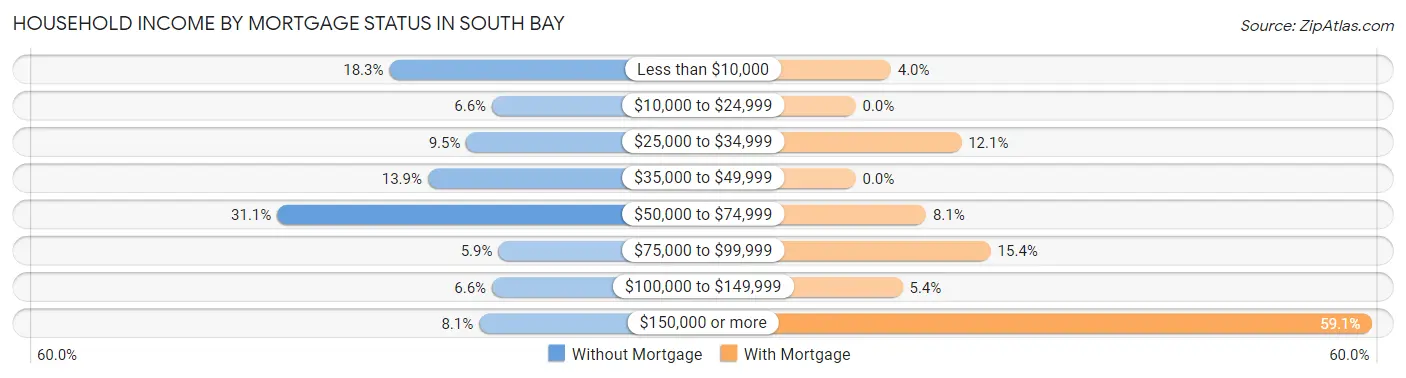
| Household Income | Without Mortgage | With Mortgage |
| Less than $10,000 | 50 (18.3%) | 6 (4.0%) |
| $10,000 to $24,999 | 18 (6.6%) | 0 (0.0%) |
| $25,000 to $34,999 | 26 (9.5%) | 18 (12.1%) |
| $35,000 to $49,999 | 38 (13.9%) | 0 (0.0%) |
| $50,000 to $74,999 | 85 (31.1%) | 12 (8.1%) |
| $75,000 to $99,999 | 16 (5.9%) | 23 (15.4%) |
| $100,000 to $149,999 | 18 (6.6%) | 8 (5.4%) |
| $150,000 or more | 22 (8.1%) | 88 (59.1%) |
| Total | 273 (100.0%) | 149 (100.0%) |
Property Value to Household Income Ratio in South Bay
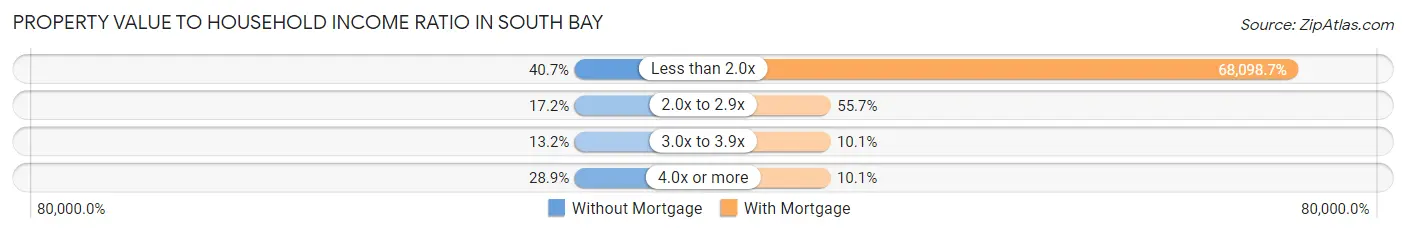
| Value-to-Income Ratio | Without Mortgage | With Mortgage |
| Less than 2.0x | 111 (40.7%) | 101,467 (68,098.7%) |
| 2.0x to 2.9x | 47 (17.2%) | 83 (55.7%) |
| 3.0x to 3.9x | 36 (13.2%) | 15 (10.1%) |
| 4.0x or more | 79 (28.9%) | 15 (10.1%) |
| Total | 273 (100.0%) | 149 (100.0%) |
Real Estate Taxes by Mortgage Status in South Bay
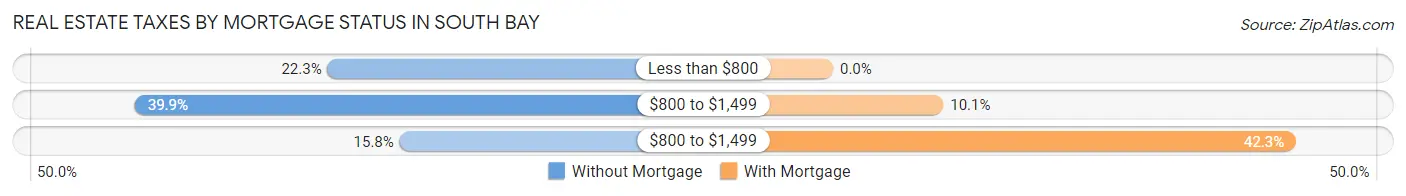
| Property Taxes | Without Mortgage | With Mortgage |
| Less than $800 | 61 (22.3%) | 0 (0.0%) |
| $800 to $1,499 | 109 (39.9%) | 15 (10.1%) |
| $800 to $1,499 | 43 (15.8%) | 63 (42.3%) |
| Total | 273 (100.0%) | 149 (100.0%) |
Health & Disability in South Bay
Health Insurance Coverage by Age in South Bay
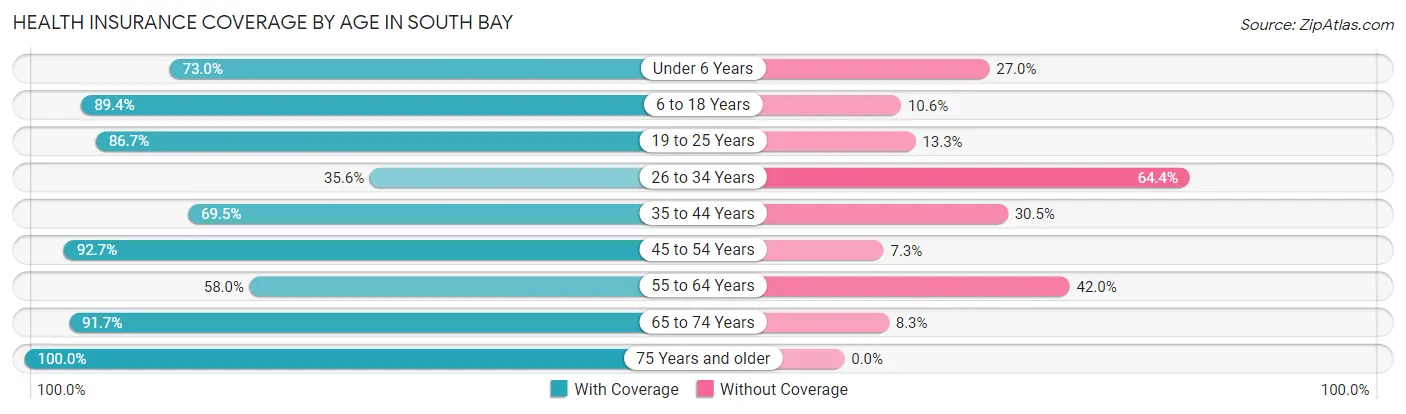
| Age Bracket | With Coverage | Without Coverage |
| Under 6 Years | 143 (73.0%) | 53 (27.0%) |
| 6 to 18 Years | 474 (89.4%) | 56 (10.6%) |
| 19 to 25 Years | 98 (86.7%) | 15 (13.3%) |
| 26 to 34 Years | 90 (35.6%) | 163 (64.4%) |
| 35 to 44 Years | 219 (69.5%) | 96 (30.5%) |
| 45 to 54 Years | 291 (92.7%) | 23 (7.3%) |
| 55 to 64 Years | 145 (58.0%) | 105 (42.0%) |
| 65 to 74 Years | 166 (91.7%) | 15 (8.3%) |
| 75 Years and older | 126 (100.0%) | 0 (0.0%) |
| Total | 1,752 (76.9%) | 526 (23.1%) |
Health Insurance Coverage by Citizenship Status in South Bay
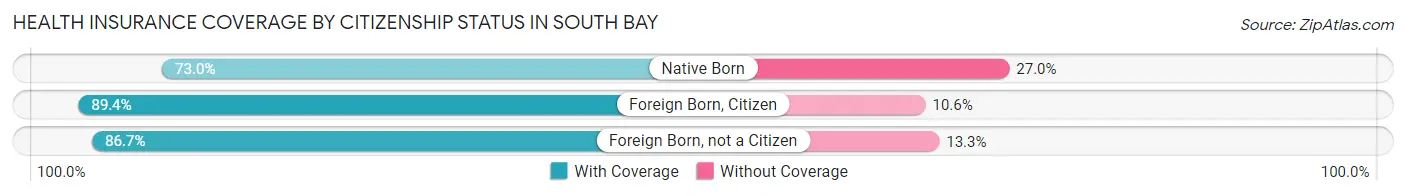
| Citizenship Status | With Coverage | Without Coverage |
| Native Born | 143 (73.0%) | 53 (27.0%) |
| Foreign Born, Citizen | 474 (89.4%) | 56 (10.6%) |
| Foreign Born, not a Citizen | 98 (86.7%) | 15 (13.3%) |
Health Insurance Coverage by Household Income in South Bay
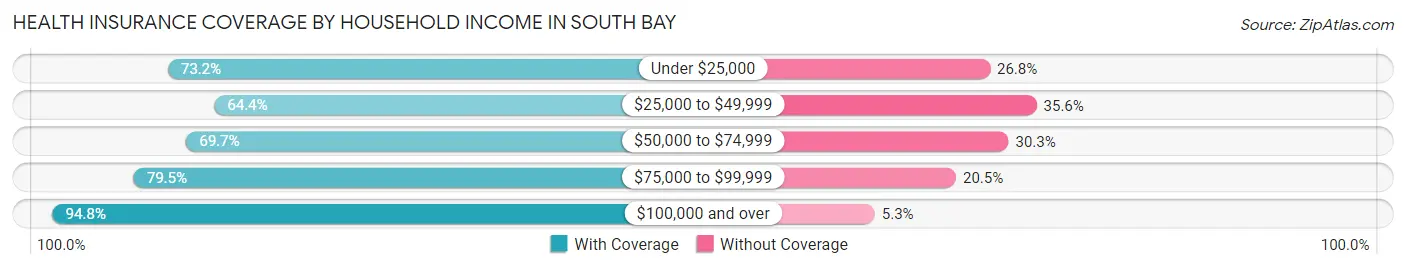
| Household Income | With Coverage | Without Coverage |
| Under $25,000 | 431 (73.2%) | 158 (26.8%) |
| $25,000 to $49,999 | 261 (64.4%) | 144 (35.6%) |
| $50,000 to $74,999 | 329 (69.7%) | 143 (30.3%) |
| $75,000 to $99,999 | 202 (79.5%) | 52 (20.5%) |
| $100,000 and over | 523 (94.8%) | 29 (5.2%) |
Public vs Private Health Insurance Coverage by Age in South Bay
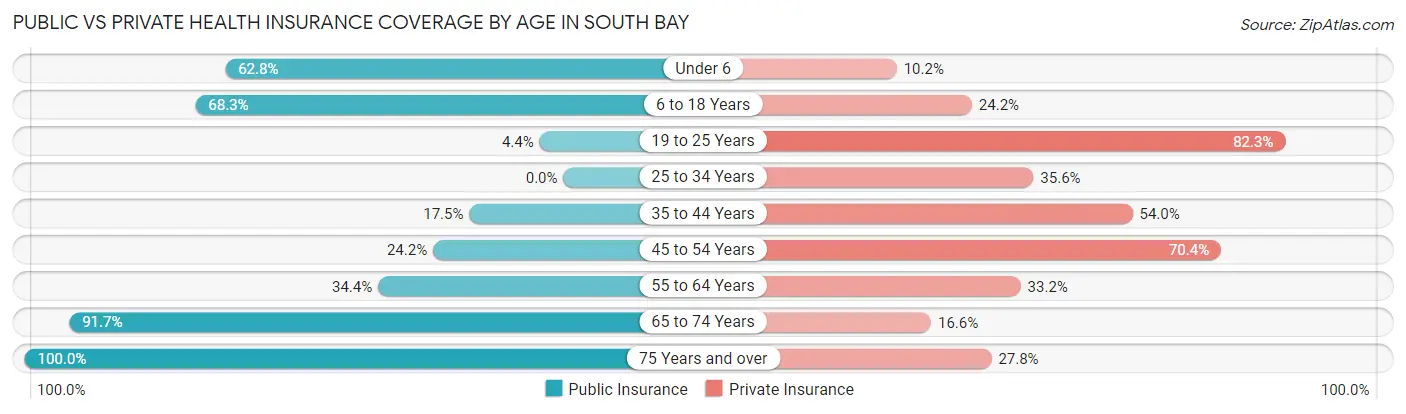
| Age Bracket | Public Insurance | Private Insurance |
| Under 6 | 123 (62.8%) | 20 (10.2%) |
| 6 to 18 Years | 362 (68.3%) | 128 (24.1%) |
| 19 to 25 Years | 5 (4.4%) | 93 (82.3%) |
| 25 to 34 Years | 0 (0.0%) | 90 (35.6%) |
| 35 to 44 Years | 55 (17.5%) | 170 (54.0%) |
| 45 to 54 Years | 76 (24.2%) | 221 (70.4%) |
| 55 to 64 Years | 86 (34.4%) | 83 (33.2%) |
| 65 to 74 Years | 166 (91.7%) | 30 (16.6%) |
| 75 Years and over | 126 (100.0%) | 35 (27.8%) |
| Total | 999 (43.9%) | 870 (38.2%) |
Disability Status by Sex by Age in South Bay
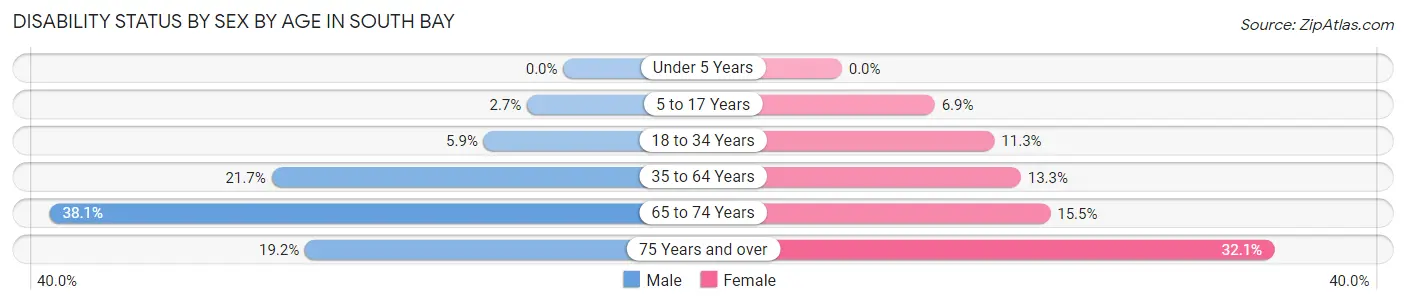
| Age Bracket | Male | Female |
| Under 5 Years | 0 (0.0%) | 0 (0.0%) |
| 5 to 17 Years | 5 (2.7%) | 24 (6.9%) |
| 18 to 34 Years | 11 (5.9%) | 23 (11.3%) |
| 35 to 64 Years | 91 (21.7%) | 61 (13.3%) |
| 65 to 74 Years | 37 (38.1%) | 13 (15.5%) |
| 75 Years and over | 14 (19.2%) | 17 (32.1%) |
Disability Class by Sex by Age in South Bay
Disability Class: Hearing Difficulty
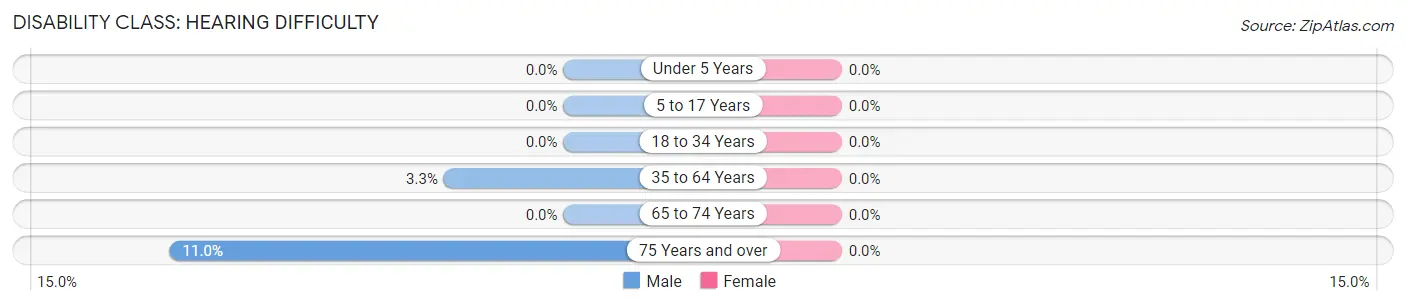
| Age Bracket | Male | Female |
| Under 5 Years | 0 (0.0%) | 0 (0.0%) |
| 5 to 17 Years | 0 (0.0%) | 0 (0.0%) |
| 18 to 34 Years | 0 (0.0%) | 0 (0.0%) |
| 35 to 64 Years | 14 (3.3%) | 0 (0.0%) |
| 65 to 74 Years | 0 (0.0%) | 0 (0.0%) |
| 75 Years and over | 8 (11.0%) | 0 (0.0%) |
Disability Class: Vision Difficulty
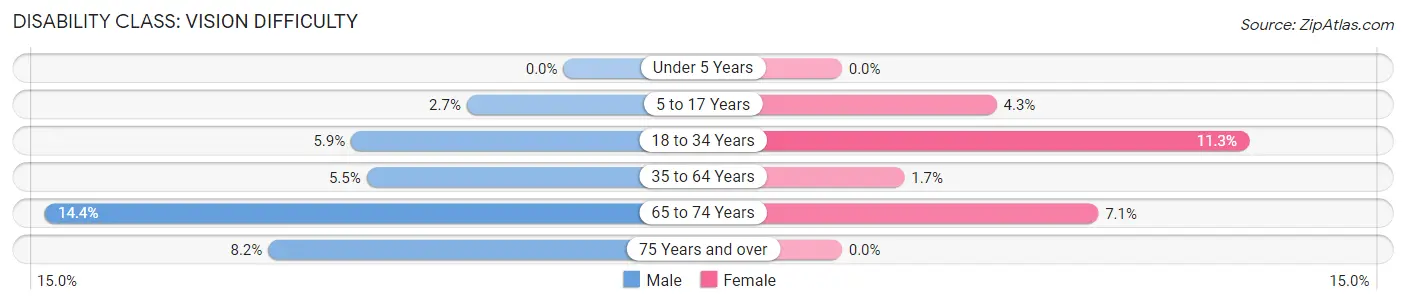
| Age Bracket | Male | Female |
| Under 5 Years | 0 (0.0%) | 0 (0.0%) |
| 5 to 17 Years | 5 (2.7%) | 15 (4.3%) |
| 18 to 34 Years | 11 (5.9%) | 23 (11.3%) |
| 35 to 64 Years | 23 (5.5%) | 8 (1.7%) |
| 65 to 74 Years | 14 (14.4%) | 6 (7.1%) |
| 75 Years and over | 6 (8.2%) | 0 (0.0%) |
Disability Class: Cognitive Difficulty
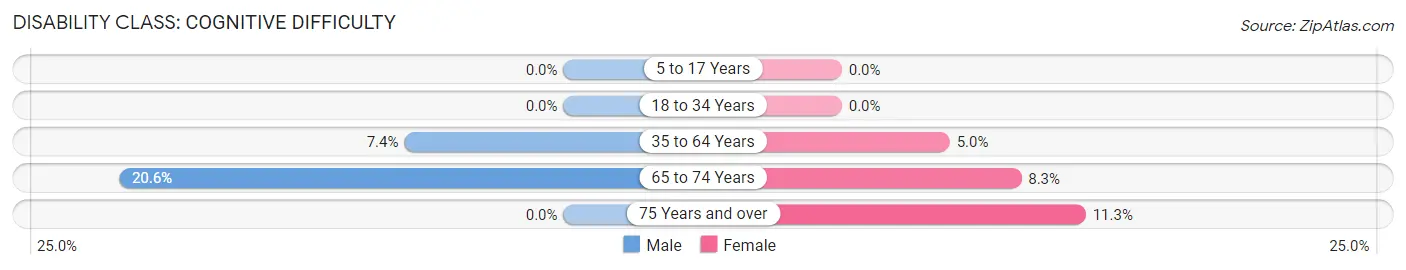
| Age Bracket | Male | Female |
| 5 to 17 Years | 0 (0.0%) | 0 (0.0%) |
| 18 to 34 Years | 0 (0.0%) | 0 (0.0%) |
| 35 to 64 Years | 31 (7.4%) | 23 (5.0%) |
| 65 to 74 Years | 20 (20.6%) | 7 (8.3%) |
| 75 Years and over | 0 (0.0%) | 6 (11.3%) |
Disability Class: Ambulatory Difficulty

| Age Bracket | Male | Female |
| 5 to 17 Years | 0 (0.0%) | 0 (0.0%) |
| 18 to 34 Years | 0 (0.0%) | 0 (0.0%) |
| 35 to 64 Years | 23 (5.5%) | 44 (9.6%) |
| 65 to 74 Years | 8 (8.3%) | 7 (8.3%) |
| 75 Years and over | 0 (0.0%) | 17 (32.1%) |
Disability Class: Self-Care Difficulty
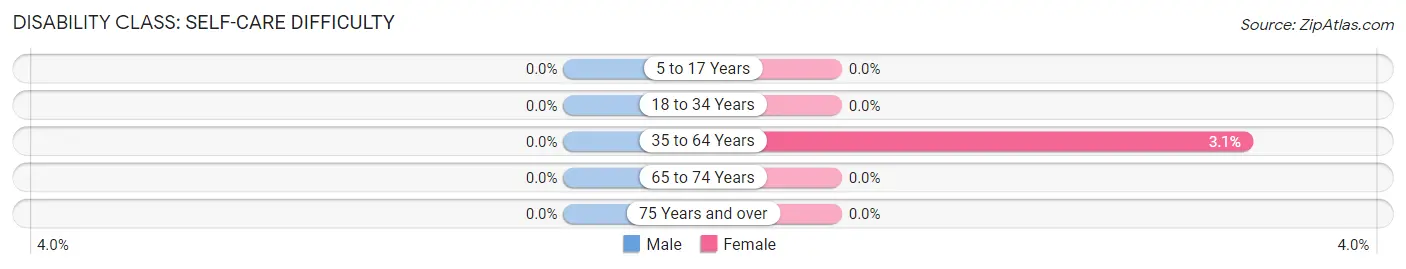
| Age Bracket | Male | Female |
| 5 to 17 Years | 0 (0.0%) | 0 (0.0%) |
| 18 to 34 Years | 0 (0.0%) | 0 (0.0%) |
| 35 to 64 Years | 0 (0.0%) | 14 (3.0%) |
| 65 to 74 Years | 0 (0.0%) | 0 (0.0%) |
| 75 Years and over | 0 (0.0%) | 0 (0.0%) |
Technology Access in South Bay
Computing Device Access in South Bay
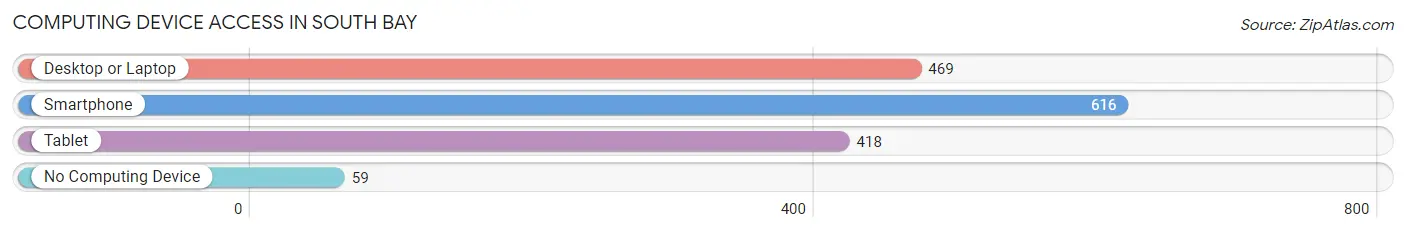
| Device Type | # Households | % Households |
| Desktop or Laptop | 469 | 64.7% |
| Smartphone | 616 | 85.0% |
| Tablet | 418 | 57.7% |
| No Computing Device | 59 | 8.1% |
| Total | 725 | 100.0% |
Internet Access in South Bay
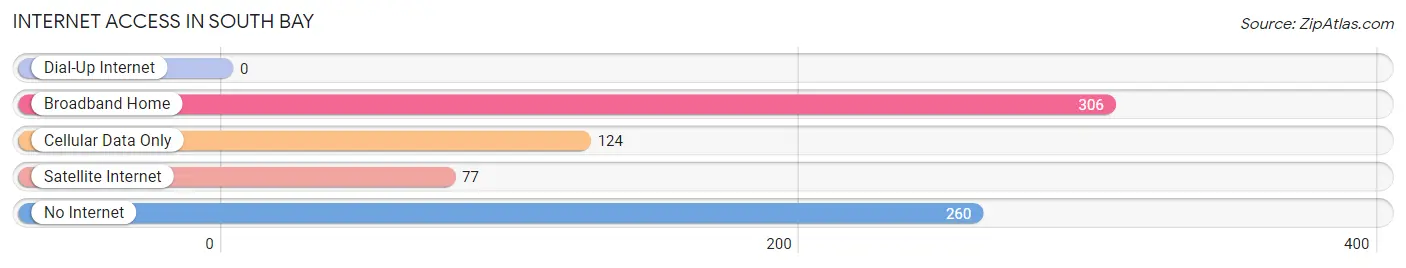
| Internet Type | # Households | % Households |
| Dial-Up Internet | 0 | 0.0% |
| Broadband Home | 306 | 42.2% |
| Cellular Data Only | 124 | 17.1% |
| Satellite Internet | 77 | 10.6% |
| No Internet | 260 | 35.9% |
| Total | 725 | 100.0% |
South Bay Summary
Bay County is located in the Florida Panhandle, along the Gulf of Mexico. It is bordered by Gulf, Calhoun, and Washington counties. The county seat is Panama City, and the largest city is Panama City Beach. The county is home to a population of approximately 170,000 people.
History
Bay County was established in 1913 from parts of Washington and Calhoun counties. The county was named for St. Andrew Bay, which is located in the county. The area was originally inhabited by Native American tribes, including the Apalachee, Creek, and Seminole. The first European settlers arrived in the area in the early 19th century, and the county was officially established in 1913.
Geography
Bay County is located in the Florida Panhandle, along the Gulf of Mexico. It is bordered by Gulf, Calhoun, and Washington counties. The county has a total area of 1,033 square miles, of which 890 square miles is land and 143 square miles is water. The county is home to several rivers, including the Chipola River, the Apalachicola River, and the Econfina River. The county also contains several lakes, including Lake Powell, Lake Merial, and Lake Wimico.
Economy
The economy of Bay County is largely based on tourism, agriculture, and military installations. The county is home to several military installations, including Tyndall Air Force Base, Naval Support Activity Panama City, and Eglin Air Force Base. The county is also home to several tourist attractions, including Panama City Beach, St. Andrews State Park, and Shell Island. Agriculture is also an important part of the economy, with crops such as corn, soybeans, and cotton being grown in the county.
Demographics
As of the 2010 census, Bay County had a population of 168,852. The racial makeup of the county was 79.2% White, 14.3% African American, 0.7% Native American, 2.2% Asian, 0.1% Pacific Islander, 1.7% from other races, and 1.8% from two or more races. Hispanic or Latino of any race were 5.2% of the population.
The median income for a household in the county was $41,922, and the median income for a family was $50,890. The per capita income for the county was $22,845. About 13.2% of families and 17.2% of the population were below the poverty line, including 25.2% of those under age 18 and 10.2% of those age 65 or over.
Common Questions
What is Per Capita Income in South Bay?
Per Capita income in South Bay is $9,350.
What is the Median Family Income in South Bay?
Median Family Income in South Bay is $55,439.
What is the Median Household income in South Bay?
Median Household Income in South Bay is $48,438.
What is Income or Wage Gap in South Bay?
Income or Wage Gap in South Bay is 8.4%.
Women in South Bay earn 91.6 cents for every dollar earned by a man.
What is Family Income Deficit in South Bay?
Family Income Deficit in South Bay is $6,489.
Families that are below poverty line in South Bay earn $6,489 less on average than the poverty threshold level.
What is Inequality or Gini Index in South Bay?
Inequality or Gini Index in South Bay is 0.43.
What is the Total Population of South Bay?
Total Population of South Bay is 4,830.
What is the Total Male Population of South Bay?
Total Male Population of South Bay is 3,592.
What is the Total Female Population of South Bay?
Total Female Population of South Bay is 1,238.
What is the Ratio of Males per 100 Females in South Bay?
There are 290.15 Males per 100 Females in South Bay.
What is the Ratio of Females per 100 Males in South Bay?
There are 34.47 Females per 100 Males in South Bay.
What is the Median Population Age in South Bay?
Median Population Age in South Bay is 40.9 Years.
What is the Average Family Size in South Bay
Average Family Size in South Bay is 3.6 People.
What is the Average Household Size in South Bay
Average Household Size in South Bay is 3.1 People.
How Large is the Labor Force in South Bay?
There are 1,056 People in the Labor Forcein in South Bay.
What is the Percentage of People in the Labor Force in South Bay?
25.2% of People are in the Labor Force in South Bay.
What is the Unemployment Rate in South Bay?
Unemployment Rate in South Bay is 9.4%.