Stock Island, FL Map & Demographics
Stock Island Map
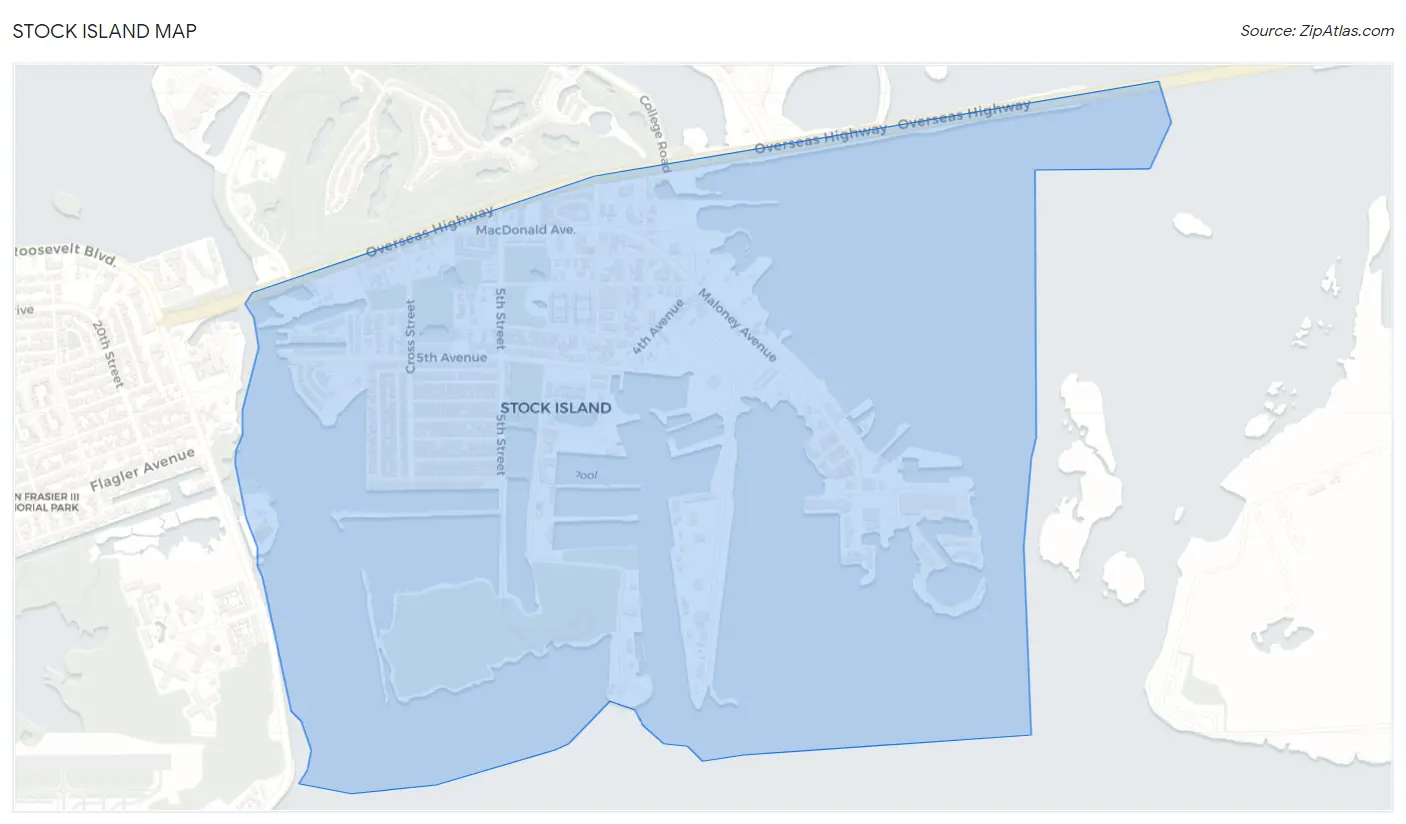
Stock Island Overview
$29,501
PER CAPITA INCOME
$62,135
AVG FAMILY INCOME
$62,309
AVG HOUSEHOLD INCOME
33.3%
WAGE / INCOME GAP [ % ]
66.7¢/ $1
WAGE / INCOME GAP [ $ ]
0.45
INEQUALITY / GINI INDEX
4,564
TOTAL POPULATION
2,207
MALE POPULATION
2,357
FEMALE POPULATION
93.64
MALES / 100 FEMALES
106.80
FEMALES / 100 MALES
34.6
MEDIAN AGE
3.2
AVG FAMILY SIZE
2.7
AVG HOUSEHOLD SIZE
2,501
LABOR FORCE [ PEOPLE ]
70.5%
PERCENT IN LABOR FORCE
1.6%
UNEMPLOYMENT RATE
Stock Island Area Codes
Income in Stock Island
Income Overview in Stock Island
Per Capita Income in Stock Island is $29,501, while median incomes of families and households are $62,135 and $62,309 respectively.
| Characteristic | Number | Measure |
| Per Capita Income | 4,564 | $29,501 |
| Median Family Income | 1,095 | $62,135 |
| Mean Family Income | 1,095 | $84,095 |
| Median Household Income | 1,663 | $62,309 |
| Mean Household Income | 1,663 | $78,554 |
| Income Deficit | 1,095 | $0 |
| Wage / Income Gap (%) | 4,564 | 33.25% |
| Wage / Income Gap ($) | 4,564 | 66.75¢ per $1 |
| Gini / Inequality Index | 4,564 | 0.45 |
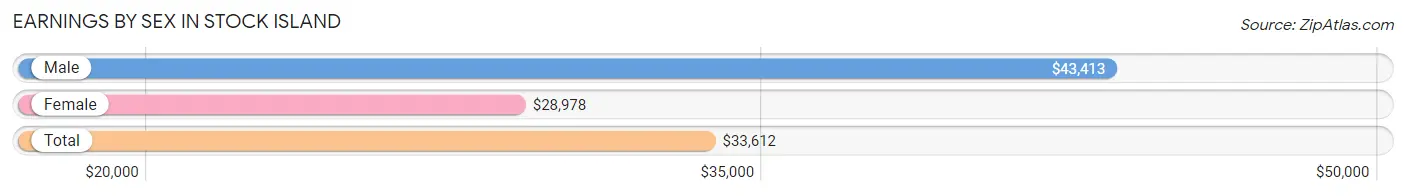
Earnings by Sex in Stock Island
Average Earnings in Stock Island are $33,612, $43,413 for men and $28,978 for women, a difference of 33.3%.
| Sex | Number | Average Earnings |
| Male | 1,309 (51.0%) | $43,413 |
| Female | 1,258 (49.0%) | $28,978 |
| Total | 2,567 (100.0%) | $33,612 |
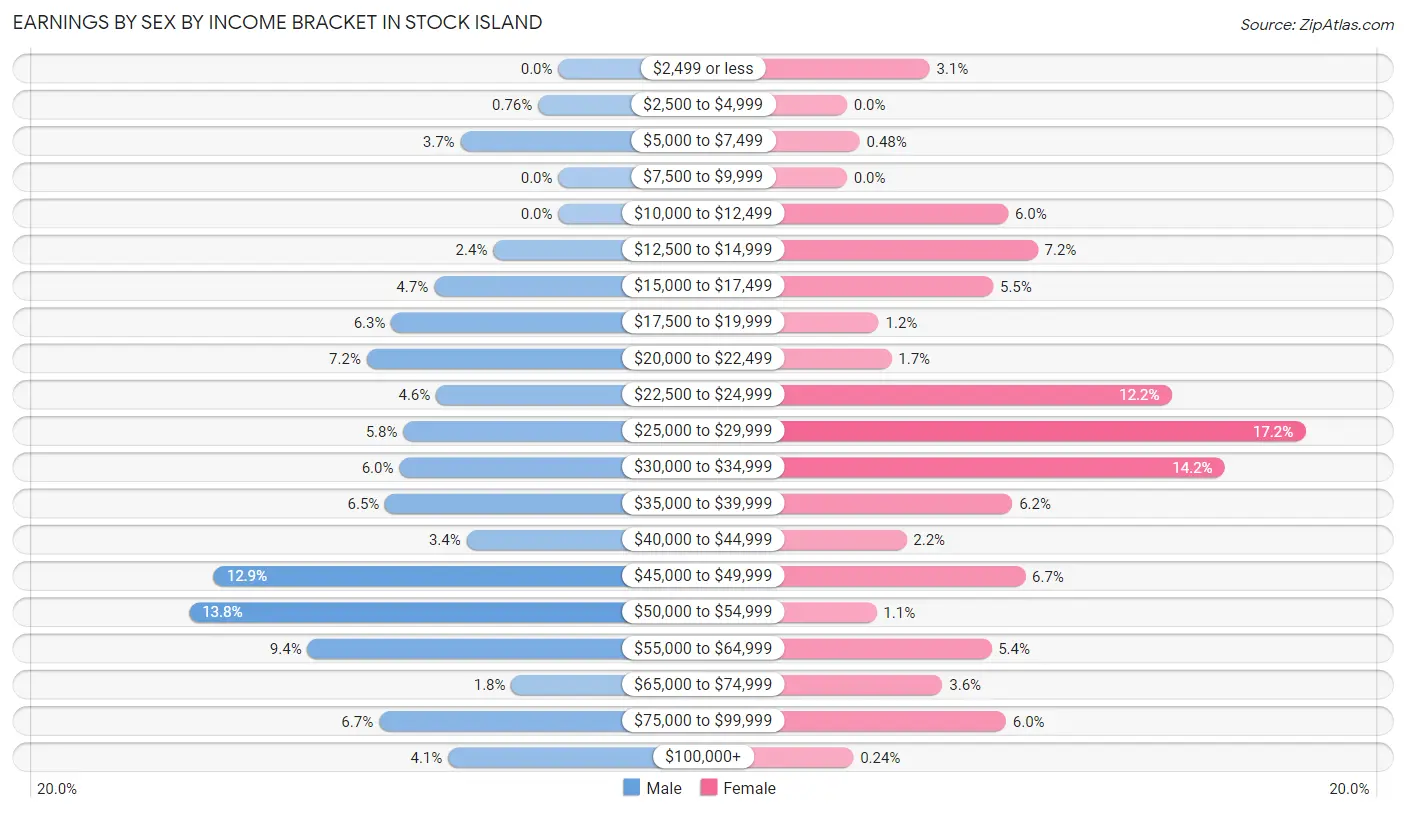
Earnings by Sex by Income Bracket in Stock Island
The most common earnings brackets in Stock Island are $50,000 to $54,999 for men (181 | 13.8%) and $25,000 to $29,999 for women (216 | 17.2%).
| Income | Male | Female |
| $2,499 or less | 0 (0.0%) | 39 (3.1%) |
| $2,500 to $4,999 | 10 (0.8%) | 0 (0.0%) |
| $5,000 to $7,499 | 48 (3.7%) | 6 (0.5%) |
| $7,500 to $9,999 | 0 (0.0%) | 0 (0.0%) |
| $10,000 to $12,499 | 0 (0.0%) | 76 (6.0%) |
| $12,500 to $14,999 | 32 (2.4%) | 90 (7.1%) |
| $15,000 to $17,499 | 61 (4.7%) | 69 (5.5%) |
| $17,500 to $19,999 | 82 (6.3%) | 15 (1.2%) |
| $20,000 to $22,499 | 94 (7.2%) | 21 (1.7%) |
| $22,500 to $24,999 | 60 (4.6%) | 153 (12.2%) |
| $25,000 to $29,999 | 76 (5.8%) | 216 (17.2%) |
| $30,000 to $34,999 | 78 (6.0%) | 178 (14.1%) |
| $35,000 to $39,999 | 85 (6.5%) | 78 (6.2%) |
| $40,000 to $44,999 | 45 (3.4%) | 28 (2.2%) |
| $45,000 to $49,999 | 169 (12.9%) | 84 (6.7%) |
| $50,000 to $54,999 | 181 (13.8%) | 14 (1.1%) |
| $55,000 to $64,999 | 123 (9.4%) | 68 (5.4%) |
| $65,000 to $74,999 | 23 (1.8%) | 45 (3.6%) |
| $75,000 to $99,999 | 88 (6.7%) | 75 (6.0%) |
| $100,000+ | 54 (4.1%) | 3 (0.2%) |
| Total | 1,309 (100.0%) | 1,258 (100.0%) |
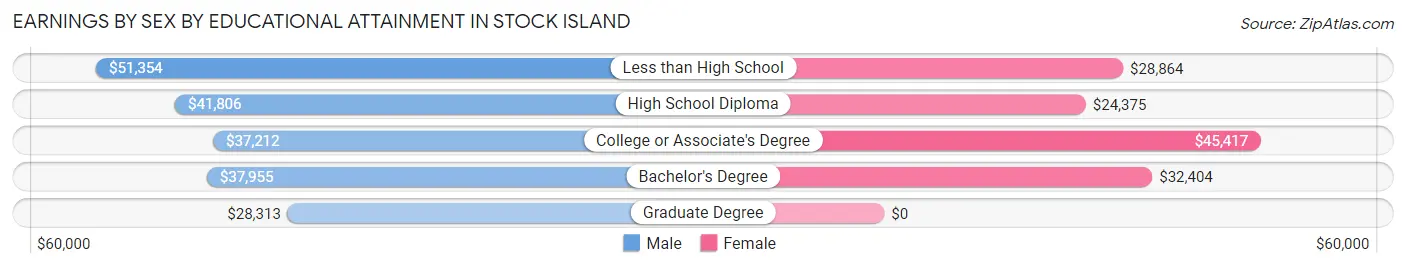
Earnings by Sex by Educational Attainment in Stock Island
Average earnings in Stock Island are $44,904 for men and $28,914 for women, a difference of 35.6%. Men with an educational attainment of less than high school enjoy the highest average annual earnings of $51,354, while those with graduate degree education earn the least with $28,313. Women with an educational attainment of college or associate's degree earn the most with the average annual earnings of $45,417, while those with high school diploma education have the smallest earnings of $24,375.
| Educational Attainment | Male Income | Female Income |
| Less than High School | $51,354 | $28,864 |
| High School Diploma | $41,806 | $24,375 |
| College or Associate's Degree | $37,212 | $45,417 |
| Bachelor's Degree | $37,955 | $32,404 |
| Graduate Degree | $28,313 | $0 |
| Total | $44,904 | $28,914 |
Family Income in Stock Island
Family Income Brackets in Stock Island
According to the Stock Island family income data, there are 198 families falling into the $75,000 to $99,999 income range, which is the most common income bracket and makes up 18.1% of all families. Conversely, the $10,000 to $14,999 income bracket is the least frequent group with only 12 families (1.1%) belonging to this category.
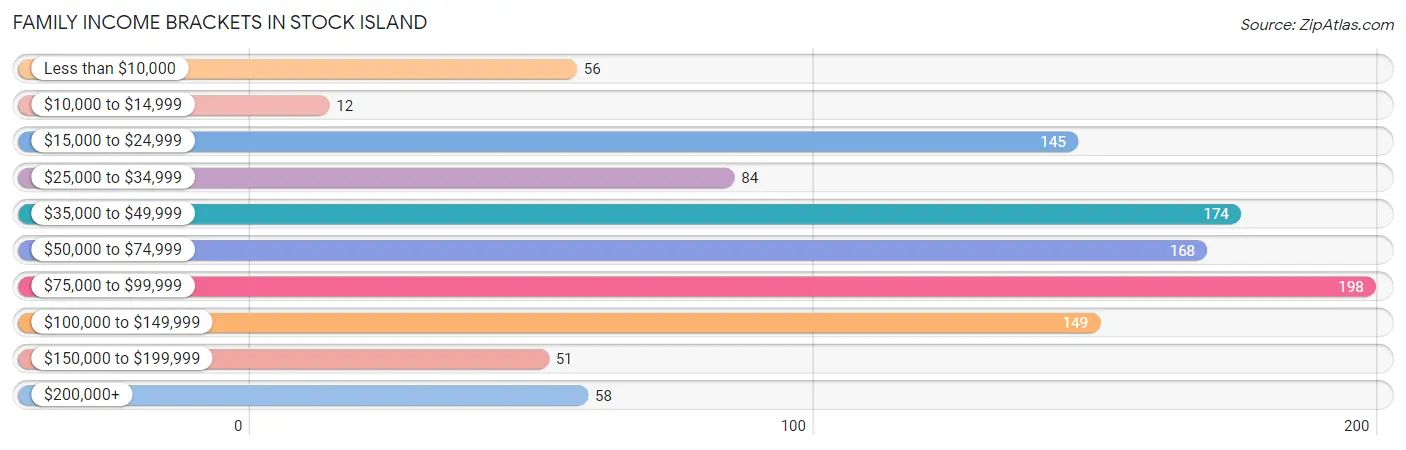
| Income Bracket | # Families | % Families |
| Less than $10,000 | 56 | 5.1% |
| $10,000 to $14,999 | 12 | 1.1% |
| $15,000 to $24,999 | 145 | 13.2% |
| $25,000 to $34,999 | 84 | 7.7% |
| $35,000 to $49,999 | 174 | 15.9% |
| $50,000 to $74,999 | 168 | 15.3% |
| $75,000 to $99,999 | 198 | 18.1% |
| $100,000 to $149,999 | 149 | 13.6% |
| $150,000 to $199,999 | 51 | 4.7% |
| $200,000+ | 58 | 5.3% |
Family Income by Famaliy Size in Stock Island
5-person families (105 | 9.6%) account for the highest median family income in Stock Island with $76,377 per family, while 3-person families (331 | 30.2%) have the highest median income of $25,359 per family member.
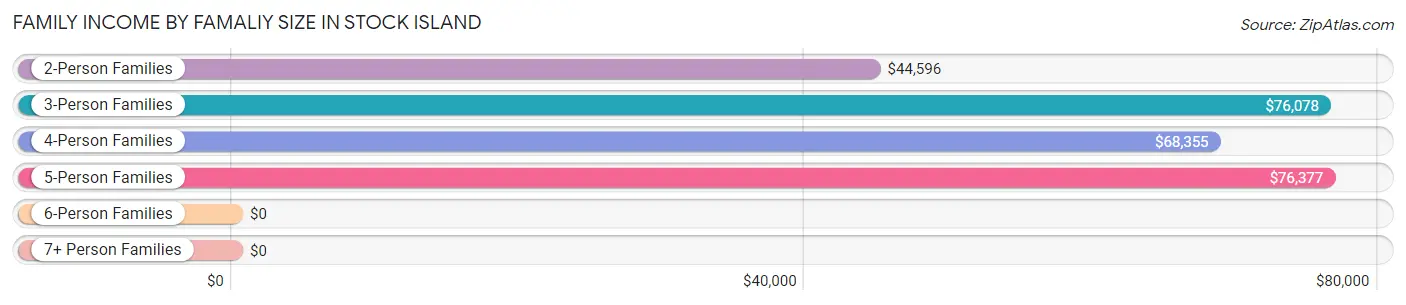
| Income Bracket | # Families | Median Income |
| 2-Person Families | 502 (45.8%) | $44,596 |
| 3-Person Families | 331 (30.2%) | $76,078 |
| 4-Person Families | 113 (10.3%) | $68,355 |
| 5-Person Families | 105 (9.6%) | $76,377 |
| 6-Person Families | 44 (4.0%) | $0 |
| 7+ Person Families | 0 (0.0%) | $0 |
| Total | 1,095 (100.0%) | $62,135 |
Family Income by Number of Earners in Stock Island
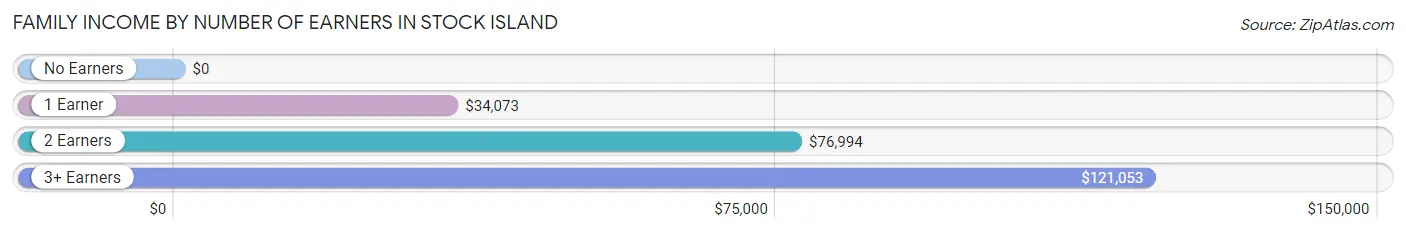
| Number of Earners | # Families | Median Income |
| No Earners | 130 (11.9%) | $0 |
| 1 Earner | 357 (32.6%) | $34,073 |
| 2 Earners | 552 (50.4%) | $76,994 |
| 3+ Earners | 56 (5.1%) | $121,053 |
| Total | 1,095 (100.0%) | $62,135 |
Household Income in Stock Island
Household Income Brackets in Stock Island
With 356 households falling in the category, the $50,000 to $74,999 income range is the most frequent in Stock Island, accounting for 21.4% of all households. In contrast, only 22 households (1.3%) fall into the $10,000 to $14,999 income bracket, making it the least populous group.
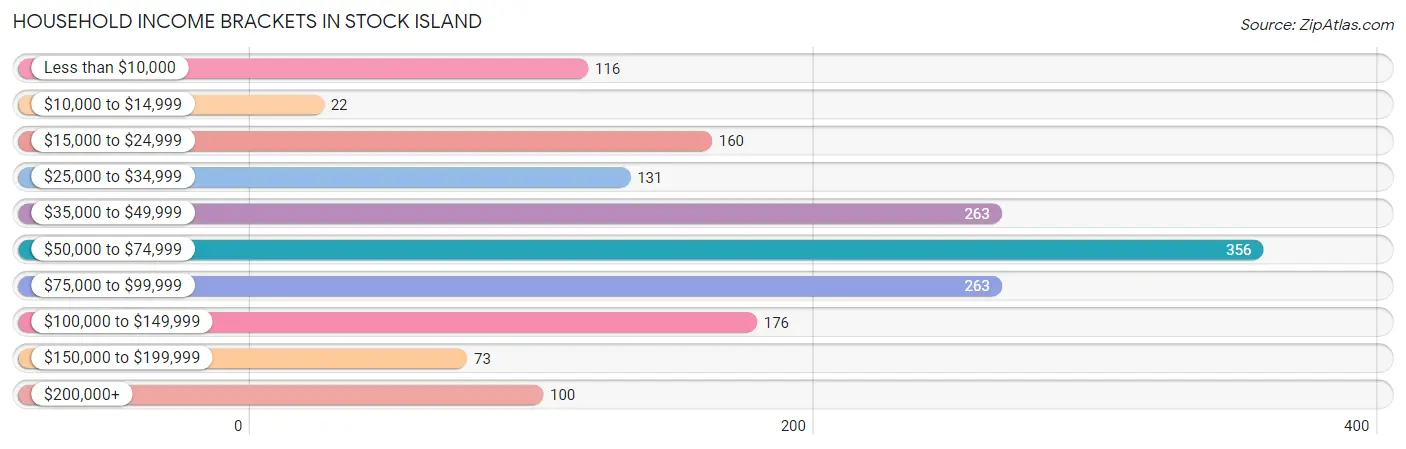
| Income Bracket | # Households | % Households |
| Less than $10,000 | 116 | 7.0% |
| $10,000 to $14,999 | 22 | 1.3% |
| $15,000 to $24,999 | 160 | 9.6% |
| $25,000 to $34,999 | 131 | 7.9% |
| $35,000 to $49,999 | 263 | 15.8% |
| $50,000 to $74,999 | 356 | 21.4% |
| $75,000 to $99,999 | 263 | 15.8% |
| $100,000 to $149,999 | 176 | 10.6% |
| $150,000 to $199,999 | 73 | 4.4% |
| $200,000+ | 100 | 6.0% |
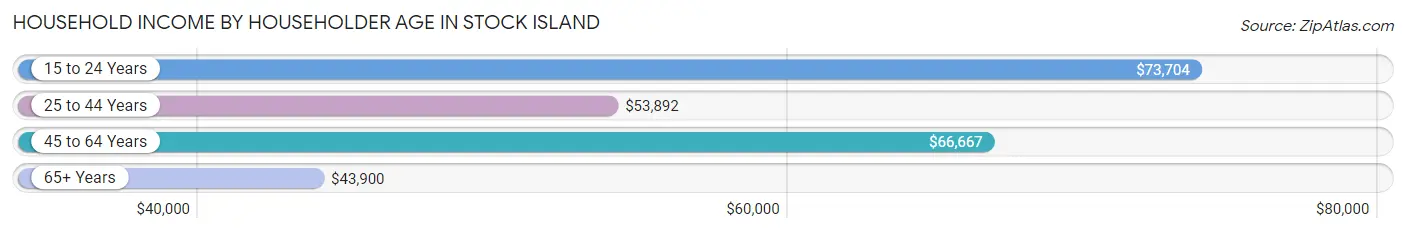
Household Income by Householder Age in Stock Island
The median household income in Stock Island is $62,309, with the highest median household income of $73,704 found in the 15 to 24 years age bracket for the primary householder. A total of 80 households (4.8%) fall into this category. Meanwhile, the 65+ years age bracket for the primary householder has the lowest median household income of $43,900, with 328 households (19.7%) in this group.
| Income Bracket | # Households | Median Income |
| 15 to 24 Years | 80 (4.8%) | $73,704 |
| 25 to 44 Years | 811 (48.8%) | $53,892 |
| 45 to 64 Years | 444 (26.7%) | $66,667 |
| 65+ Years | 328 (19.7%) | $43,900 |
| Total | 1,663 (100.0%) | $62,309 |
Poverty in Stock Island
Income Below Poverty by Sex and Age in Stock Island
With 15.8% poverty level for males and 24.0% for females among the residents of Stock Island, 16 and 17 year old males and 6 to 11 year old females are the most vulnerable to poverty, with 17 males (100.0%) and 74 females (61.7%) in their respective age groups living below the poverty level.
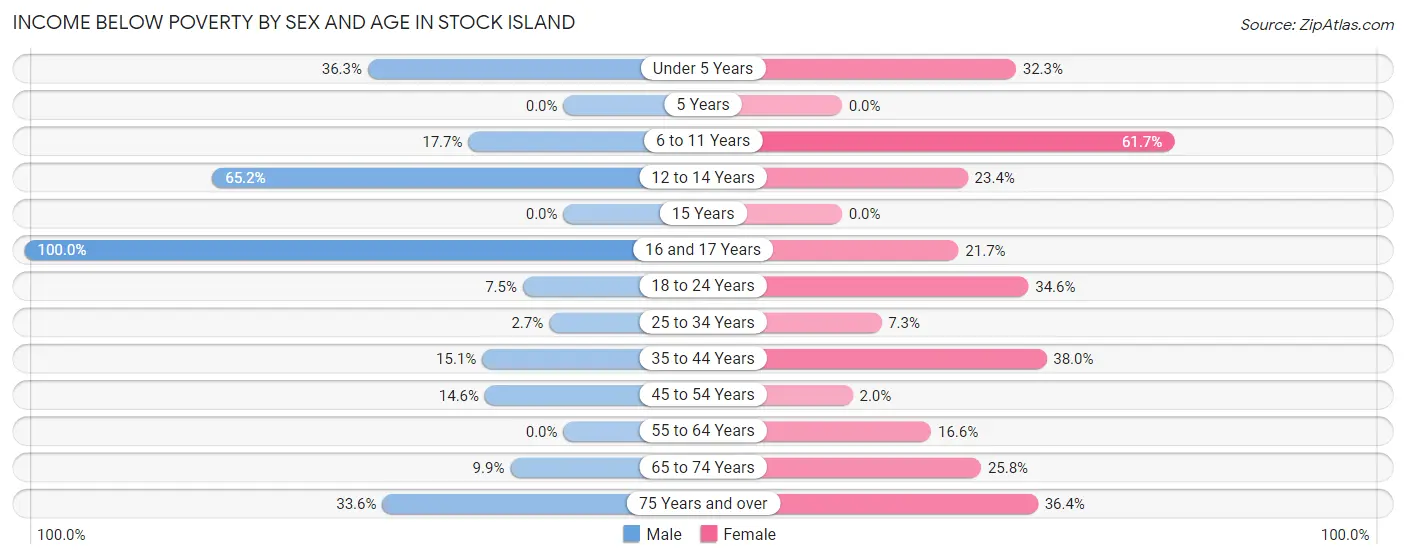
| Age Bracket | Male | Female |
| Under 5 Years | 94 (36.3%) | 73 (32.3%) |
| 5 Years | 0 (0.0%) | 0 (0.0%) |
| 6 to 11 Years | 30 (17.6%) | 74 (61.7%) |
| 12 to 14 Years | 43 (65.1%) | 32 (23.4%) |
| 15 Years | 0 (0.0%) | 0 (0.0%) |
| 16 and 17 Years | 17 (100.0%) | 21 (21.6%) |
| 18 to 24 Years | 10 (7.5%) | 90 (34.6%) |
| 25 to 34 Years | 13 (2.7%) | 25 (7.3%) |
| 35 to 44 Years | 52 (15.1%) | 167 (38.0%) |
| 45 to 54 Years | 29 (14.6%) | 7 (2.0%) |
| 55 to 64 Years | 0 (0.0%) | 30 (16.6%) |
| 65 to 74 Years | 21 (9.9%) | 31 (25.8%) |
| 75 Years and over | 40 (33.6%) | 16 (36.4%) |
| Total | 349 (15.8%) | 566 (24.0%) |
Income Above Poverty by Sex and Age in Stock Island
According to the poverty statistics in Stock Island, males aged 55 to 64 years and females aged 5 years are the age groups that are most secure financially, with 100.0% of males and 100.0% of females in these age groups living above the poverty line.
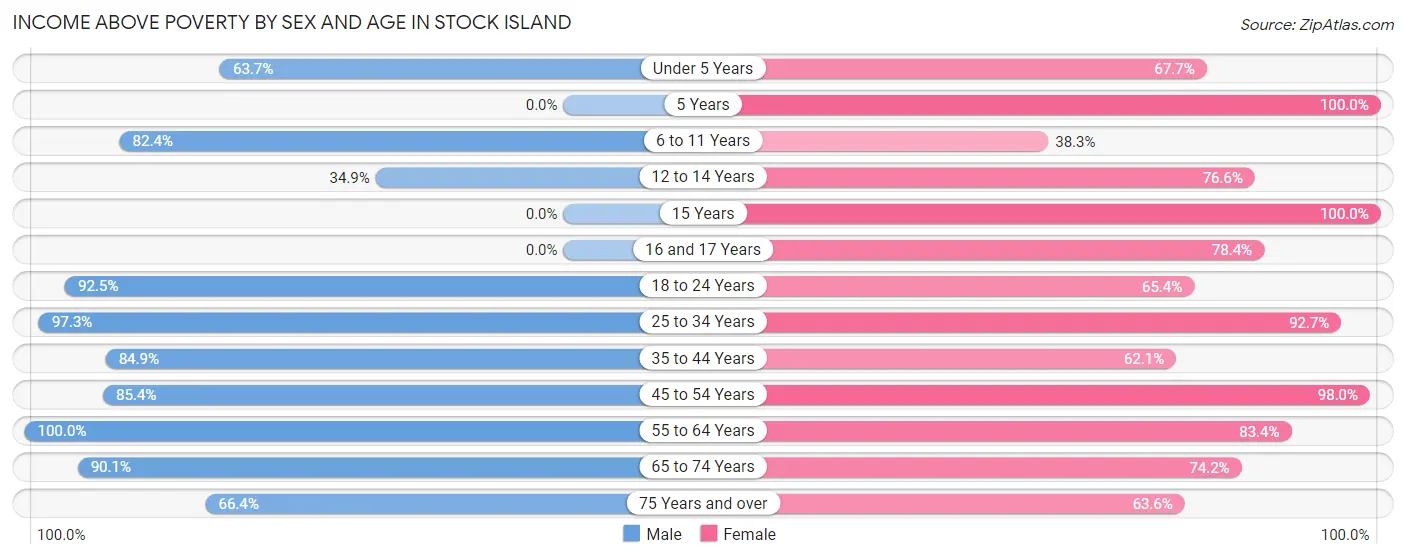
| Age Bracket | Male | Female |
| Under 5 Years | 165 (63.7%) | 153 (67.7%) |
| 5 Years | 0 (0.0%) | 35 (100.0%) |
| 6 to 11 Years | 140 (82.4%) | 46 (38.3%) |
| 12 to 14 Years | 23 (34.8%) | 105 (76.6%) |
| 15 Years | 0 (0.0%) | 3 (100.0%) |
| 16 and 17 Years | 0 (0.0%) | 76 (78.3%) |
| 18 to 24 Years | 123 (92.5%) | 170 (65.4%) |
| 25 to 34 Years | 475 (97.3%) | 317 (92.7%) |
| 35 to 44 Years | 293 (84.9%) | 273 (62.1%) |
| 45 to 54 Years | 170 (85.4%) | 345 (98.0%) |
| 55 to 64 Years | 198 (100.0%) | 151 (83.4%) |
| 65 to 74 Years | 192 (90.1%) | 89 (74.2%) |
| 75 Years and over | 79 (66.4%) | 28 (63.6%) |
| Total | 1,858 (84.2%) | 1,791 (76.0%) |
Income Below Poverty Among Married-Couple Families in Stock Island
The poverty statistics for married-couple families in Stock Island show that 7.8% or 54 of the total 696 families live below the poverty line. Families with 3 or 4 children have the highest poverty rate of 25.2%, comprising of 31 families. On the other hand, families with 1 or 2 children have the lowest poverty rate of 0.0%, which includes 0 families.
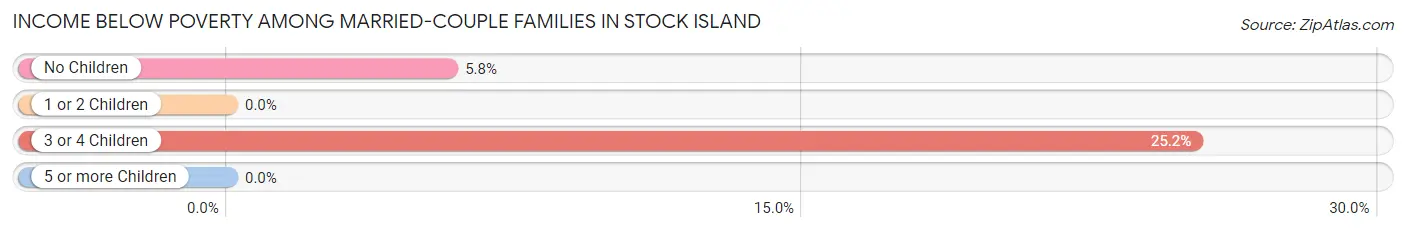
| Children | Above Poverty | Below Poverty |
| No Children | 377 (94.3%) | 23 (5.8%) |
| 1 or 2 Children | 173 (100.0%) | 0 (0.0%) |
| 3 or 4 Children | 92 (74.8%) | 31 (25.2%) |
| 5 or more Children | 0 (0.0%) | 0 (0.0%) |
| Total | 642 (92.2%) | 54 (7.8%) |
Income Below Poverty Among Single-Parent Households in Stock Island
According to the poverty data in Stock Island, 24.0% or 36 single-father households and 49.0% or 122 single-mother households are living below the poverty line. Among single-father households, those with 1 or 2 children have the highest poverty rate, with 36 households (36.0%) experiencing poverty. Likewise, among single-mother households, those with 3 or 4 children have the highest poverty rate, with 29 households (100.0%) falling below the poverty line.
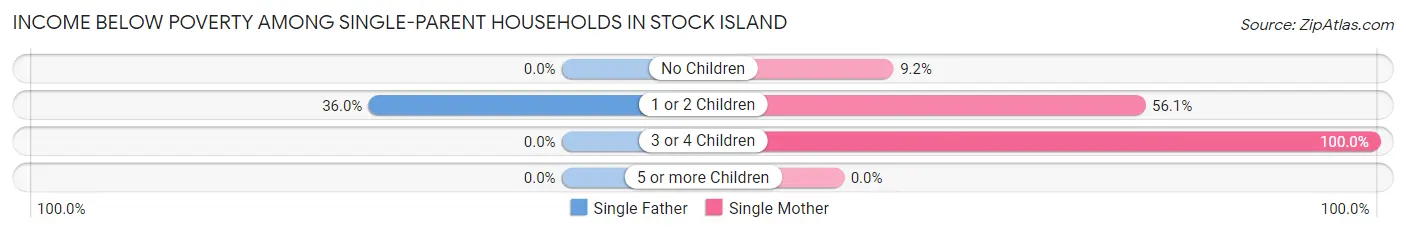
| Children | Single Father | Single Mother |
| No Children | 0 (0.0%) | 6 (9.2%) |
| 1 or 2 Children | 36 (36.0%) | 87 (56.1%) |
| 3 or 4 Children | 0 (0.0%) | 29 (100.0%) |
| 5 or more Children | 0 (0.0%) | 0 (0.0%) |
| Total | 36 (24.0%) | 122 (49.0%) |
Income Below Poverty Among Married-Couple vs Single-Parent Households in Stock Island
The poverty data for Stock Island shows that 54 of the married-couple family households (7.8%) and 158 of the single-parent households (39.6%) are living below the poverty level. Within the married-couple family households, those with 3 or 4 children have the highest poverty rate, with 31 households (25.2%) falling below the poverty line. Among the single-parent households, those with 3 or 4 children have the highest poverty rate, with 29 household (100.0%) living below poverty.
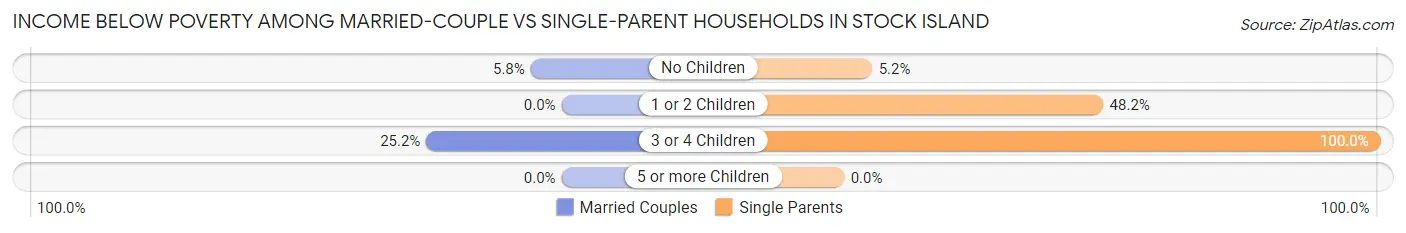
| Children | Married-Couple Families | Single-Parent Households |
| No Children | 23 (5.8%) | 6 (5.2%) |
| 1 or 2 Children | 0 (0.0%) | 123 (48.2%) |
| 3 or 4 Children | 31 (25.2%) | 29 (100.0%) |
| 5 or more Children | 0 (0.0%) | 0 (0.0%) |
| Total | 54 (7.8%) | 158 (39.6%) |
Race in Stock Island
The most populous races in Stock Island are White / Caucasian (2,168 | 47.5%), Hispanic or Latino (2,113 | 46.3%), and Black / African American (1,161 | 25.4%).
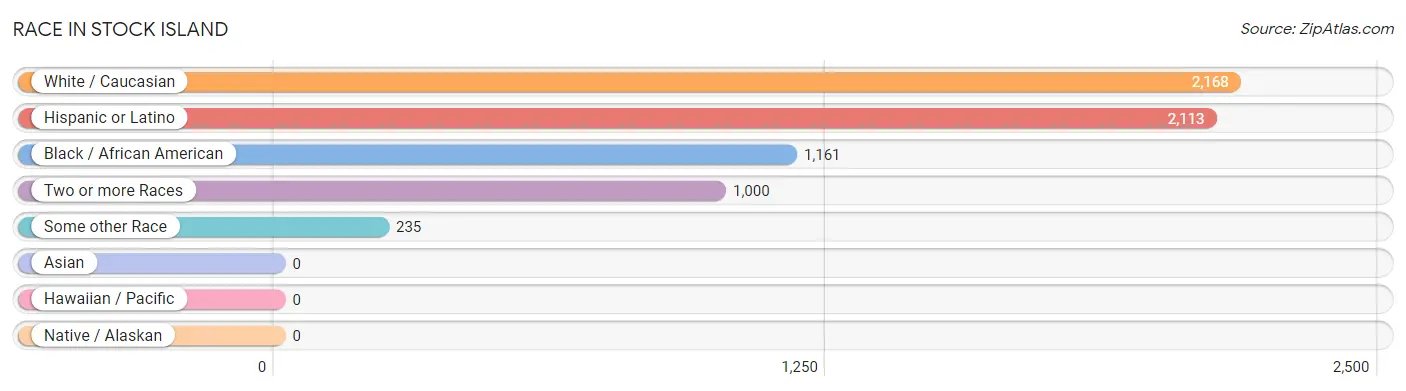
| Race | # Population | % Population |
| Asian | 0 | 0.0% |
| Black / African American | 1,161 | 25.4% |
| Hawaiian / Pacific | 0 | 0.0% |
| Hispanic or Latino | 2,113 | 46.3% |
| Native / Alaskan | 0 | 0.0% |
| White / Caucasian | 2,168 | 47.5% |
| Two or more Races | 1,000 | 21.9% |
| Some other Race | 235 | 5.1% |
| Total | 4,564 | 100.0% |
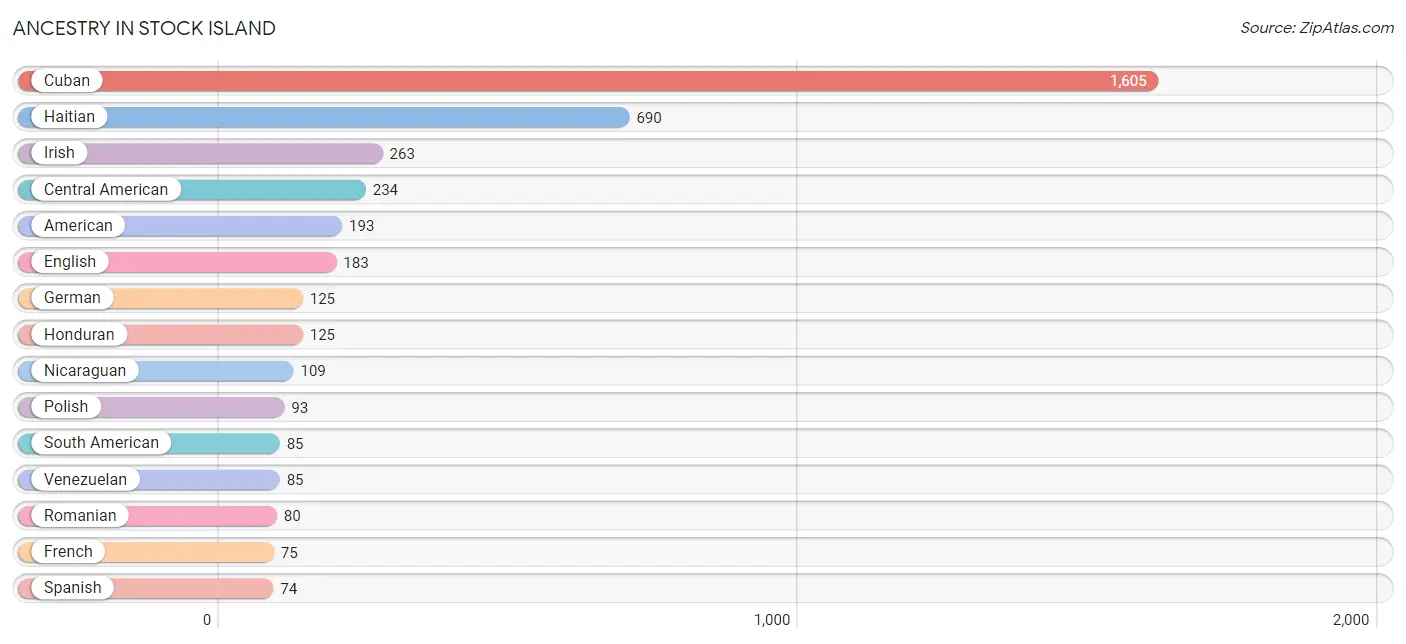
Ancestry in Stock Island
The most populous ancestries reported in Stock Island are Cuban (1,605 | 35.2%), Haitian (690 | 15.1%), Irish (263 | 5.8%), Central American (234 | 5.1%), and American (193 | 4.2%), together accounting for 65.4% of all Stock Island residents.
| Ancestry | # Population | % Population |
| American | 193 | 4.2% |
| Australian | 13 | 0.3% |
| Bahamian | 70 | 1.5% |
| Central American | 234 | 5.1% |
| Cherokee | 6 | 0.1% |
| Cuban | 1,605 | 35.2% |
| Czech | 7 | 0.2% |
| Dominican | 25 | 0.5% |
| Dutch | 14 | 0.3% |
| Eastern European | 38 | 0.8% |
| English | 183 | 4.0% |
| European | 19 | 0.4% |
| French | 75 | 1.6% |
| German | 125 | 2.7% |
| Haitian | 690 | 15.1% |
| Honduran | 125 | 2.7% |
| Hungarian | 24 | 0.5% |
| Irish | 263 | 5.8% |
| Italian | 69 | 1.5% |
| Jamaican | 27 | 0.6% |
| Mexican | 56 | 1.2% |
| Nicaraguan | 109 | 2.4% |
| Polish | 93 | 2.0% |
| Portuguese | 38 | 0.8% |
| Puerto Rican | 34 | 0.7% |
| Romanian | 80 | 1.8% |
| Russian | 39 | 0.9% |
| Scandinavian | 6 | 0.1% |
| Scotch-Irish | 10 | 0.2% |
| Scottish | 44 | 1.0% |
| Slovak | 7 | 0.2% |
| South American | 85 | 1.9% |
| Spanish | 74 | 1.6% |
| Ukrainian | 73 | 1.6% |
| Venezuelan | 85 | 1.9% |
| Welsh | 33 | 0.7% | View All 36 Rows |
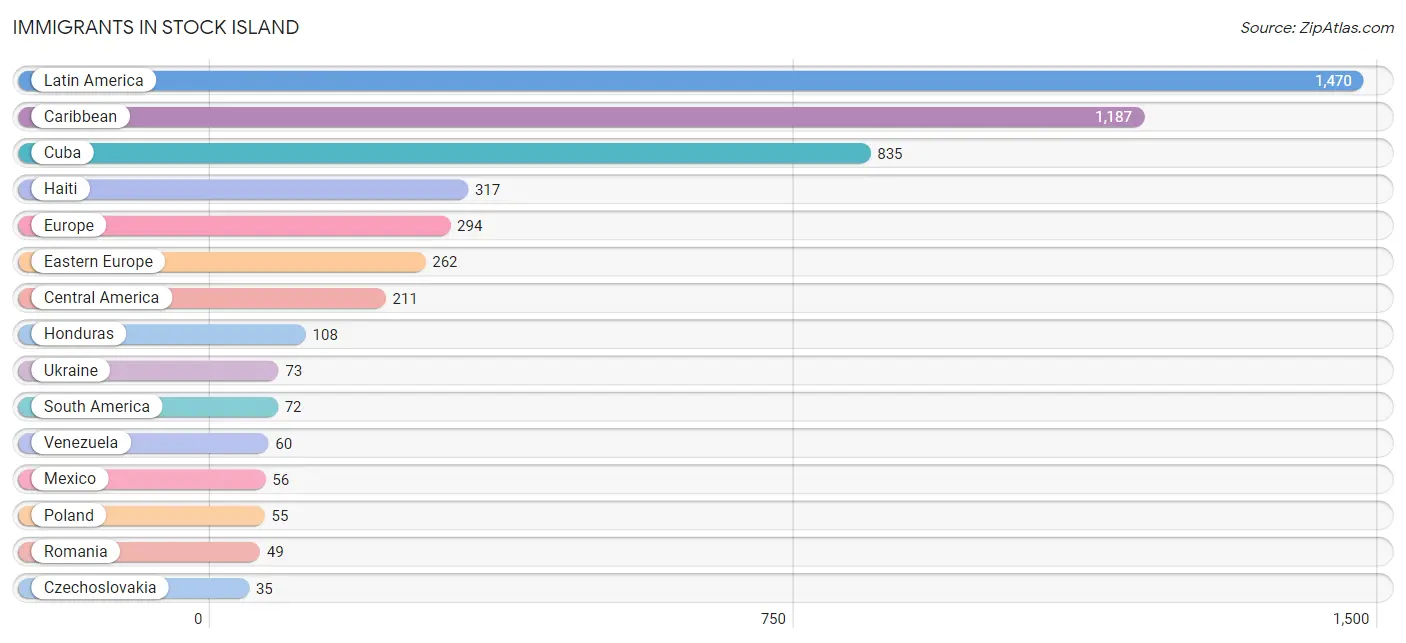
Immigrants in Stock Island
The most numerous immigrant groups reported in Stock Island came from Latin America (1,470 | 32.2%), Caribbean (1,187 | 26.0%), Cuba (835 | 18.3%), Haiti (317 | 7.0%), and Europe (294 | 6.4%), together accounting for 89.9% of all Stock Island residents.
| Immigration Origin | # Population | % Population |
| Australia | 9 | 0.2% |
| Belize | 12 | 0.3% |
| Bolivia | 12 | 0.3% |
| Canada | 7 | 0.2% |
| Caribbean | 1,187 | 26.0% |
| Central America | 211 | 4.6% |
| Cuba | 835 | 18.3% |
| Czechoslovakia | 35 | 0.8% |
| Dominican Republic | 25 | 0.5% |
| Eastern Europe | 262 | 5.7% |
| England | 9 | 0.2% |
| Europe | 294 | 6.4% |
| Haiti | 317 | 7.0% |
| Honduras | 108 | 2.4% |
| Hungary | 19 | 0.4% |
| Jamaica | 10 | 0.2% |
| Latin America | 1,470 | 32.2% |
| Mexico | 56 | 1.2% |
| Moldova | 31 | 0.7% |
| Nicaragua | 35 | 0.8% |
| Northern Europe | 32 | 0.7% |
| Oceania | 9 | 0.2% |
| Poland | 55 | 1.2% |
| Romania | 49 | 1.1% |
| South America | 72 | 1.6% |
| Ukraine | 73 | 1.6% |
| Venezuela | 60 | 1.3% | View All 27 Rows |
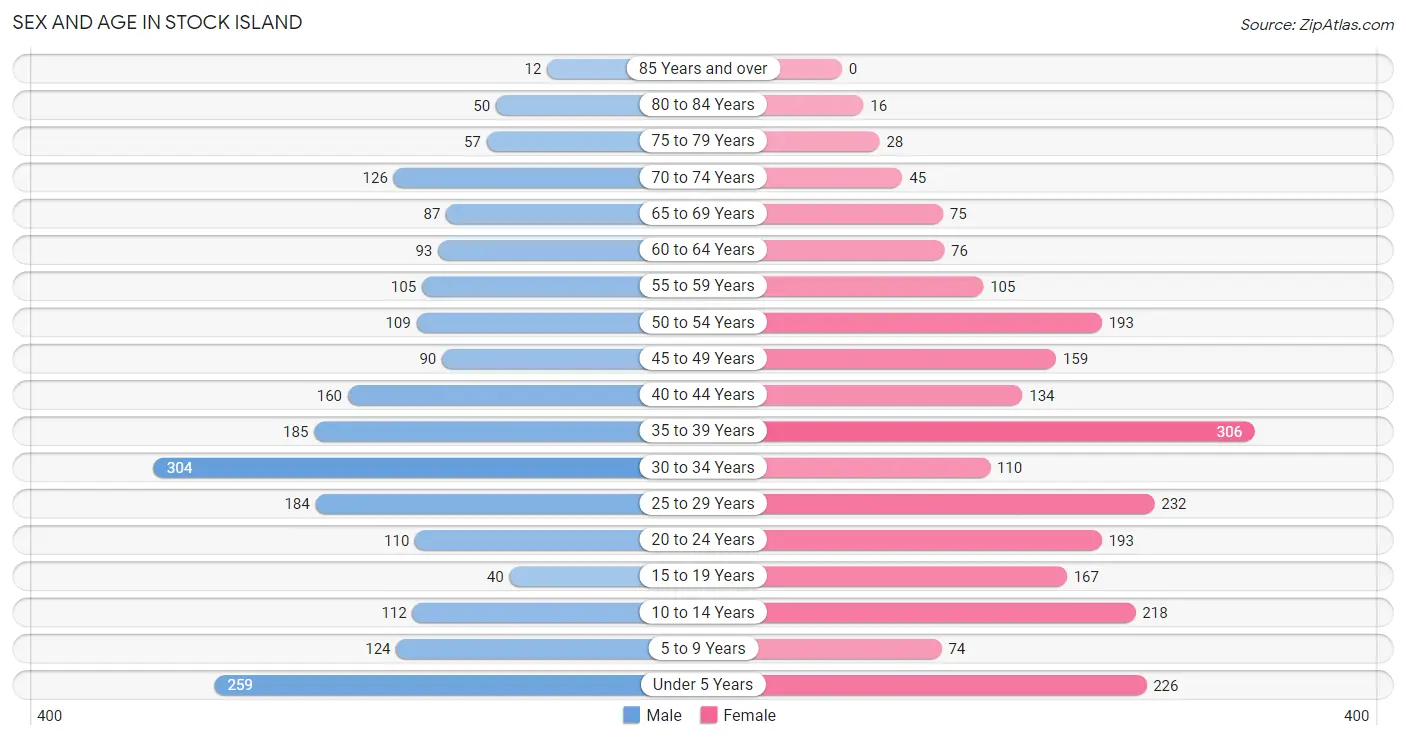
Sex and Age in Stock Island
Sex and Age in Stock Island
The most populous age groups in Stock Island are 30 to 34 Years (304 | 13.8%) for men and 35 to 39 Years (306 | 13.0%) for women.
| Age Bracket | Male | Female |
| Under 5 Years | 259 (11.7%) | 226 (9.6%) |
| 5 to 9 Years | 124 (5.6%) | 74 (3.1%) |
| 10 to 14 Years | 112 (5.1%) | 218 (9.2%) |
| 15 to 19 Years | 40 (1.8%) | 167 (7.1%) |
| 20 to 24 Years | 110 (5.0%) | 193 (8.2%) |
| 25 to 29 Years | 184 (8.3%) | 232 (9.8%) |
| 30 to 34 Years | 304 (13.8%) | 110 (4.7%) |
| 35 to 39 Years | 185 (8.4%) | 306 (13.0%) |
| 40 to 44 Years | 160 (7.2%) | 134 (5.7%) |
| 45 to 49 Years | 90 (4.1%) | 159 (6.8%) |
| 50 to 54 Years | 109 (4.9%) | 193 (8.2%) |
| 55 to 59 Years | 105 (4.8%) | 105 (4.4%) |
| 60 to 64 Years | 93 (4.2%) | 76 (3.2%) |
| 65 to 69 Years | 87 (3.9%) | 75 (3.2%) |
| 70 to 74 Years | 126 (5.7%) | 45 (1.9%) |
| 75 to 79 Years | 57 (2.6%) | 28 (1.2%) |
| 80 to 84 Years | 50 (2.3%) | 16 (0.7%) |
| 85 Years and over | 12 (0.5%) | 0 (0.0%) |
| Total | 2,207 (100.0%) | 2,357 (100.0%) |
Families and Households in Stock Island
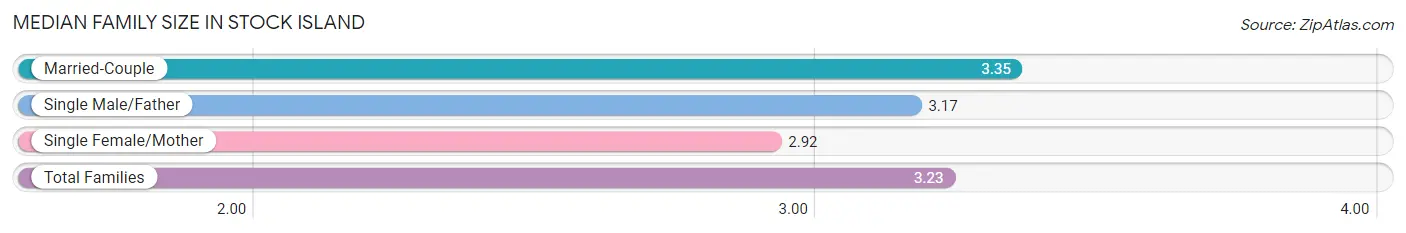
Median Family Size in Stock Island
The median family size in Stock Island is 3.23 persons per family, with married-couple families (696 | 63.6%) accounting for the largest median family size of 3.35 persons per family. On the other hand, single female/mother families (249 | 22.7%) represent the smallest median family size with 2.92 persons per family.
| Family Type | # Families | Family Size |
| Married-Couple | 696 (63.6%) | 3.35 |
| Single Male/Father | 150 (13.7%) | 3.17 |
| Single Female/Mother | 249 (22.7%) | 2.92 |
| Total Families | 1,095 (100.0%) | 3.23 |
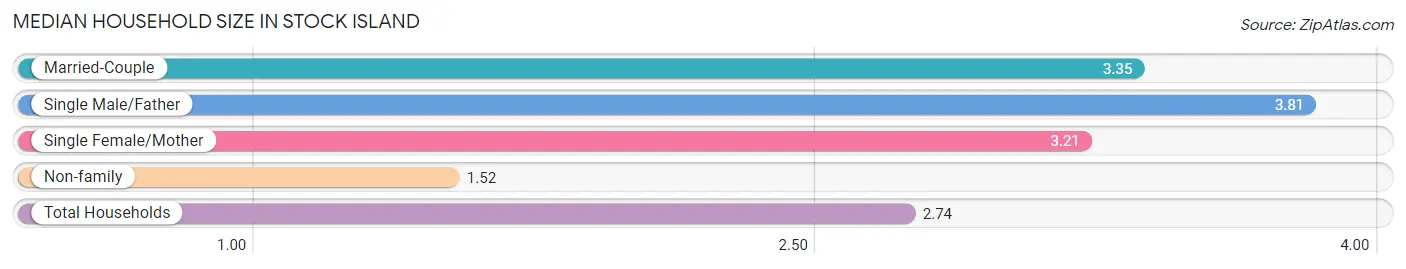
Median Household Size in Stock Island
The median household size in Stock Island is 2.74 persons per household, with single male/father households (150 | 9.0%) accounting for the largest median household size of 3.81 persons per household. non-family households (568 | 34.2%) represent the smallest median household size with 1.52 persons per household.
| Household Type | # Households | Household Size |
| Married-Couple | 696 (41.8%) | 3.35 |
| Single Male/Father | 150 (9.0%) | 3.81 |
| Single Female/Mother | 249 (15.0%) | 3.21 |
| Non-family | 568 (34.2%) | 1.52 |
| Total Households | 1,663 (100.0%) | 2.74 |
Household Size by Marriage Status in Stock Island
Out of a total of 1,663 households in Stock Island, 1,095 (65.8%) are family households, while 568 (34.2%) are nonfamily households. The most numerous type of family households are 2-person households, comprising 422, and the most common type of nonfamily households are 1-person households, comprising 309.
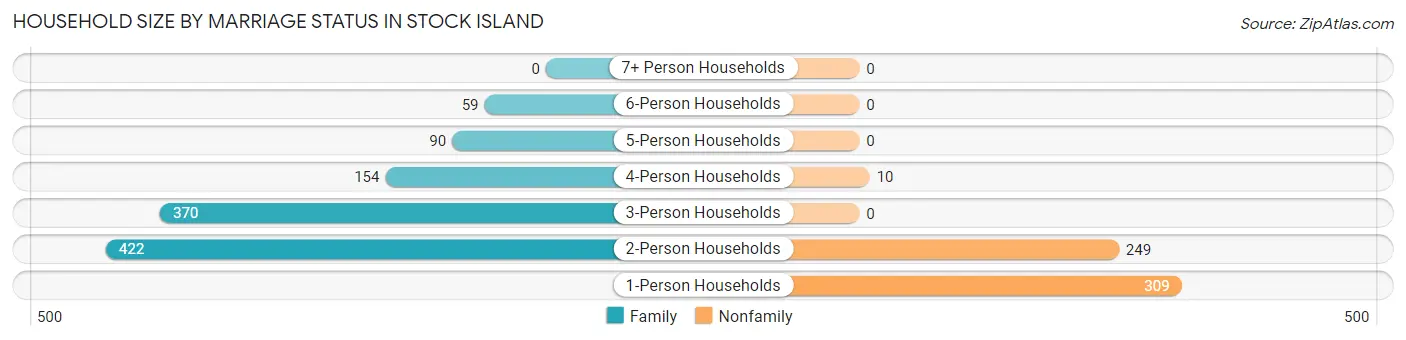
| Household Size | Family Households | Nonfamily Households |
| 1-Person Households | - | 309 (18.6%) |
| 2-Person Households | 422 (25.4%) | 249 (15.0%) |
| 3-Person Households | 370 (22.3%) | 0 (0.0%) |
| 4-Person Households | 154 (9.3%) | 10 (0.6%) |
| 5-Person Households | 90 (5.4%) | 0 (0.0%) |
| 6-Person Households | 59 (3.5%) | 0 (0.0%) |
| 7+ Person Households | 0 (0.0%) | 0 (0.0%) |
| Total | 1,095 (65.8%) | 568 (34.2%) |
Female Fertility in Stock Island
Fertility by Age in Stock Island
Average fertility rate in Stock Island is 50.0 births per 1,000 women. Women in the age bracket of 20 to 34 years have the highest fertility rate with 92.0 births per 1,000 women. Women in the age bracket of 20 to 34 years acount for 72.1% of all women with births.
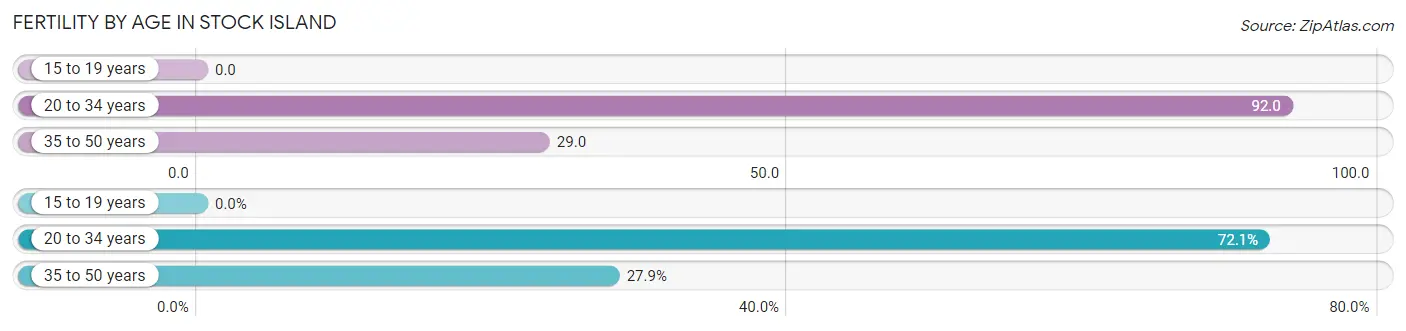
| Age Bracket | Women with Births | Births / 1,000 Women |
| 15 to 19 years | 0 (0.0%) | 0.0 |
| 20 to 34 years | 49 (72.1%) | 92.0 |
| 35 to 50 years | 19 (27.9%) | 29.0 |
| Total | 68 (100.0%) | 50.0 |
Fertility by Age by Marriage Status in Stock Island
66.2% of women with births (68) in Stock Island are married. The highest percentage of unmarried women with births falls into 35 to 50 years age bracket with 52.6% of them unmarried at the time of birth, while the lowest percentage of unmarried women with births belong to 20 to 34 years age bracket with 26.5% of them unmarried.
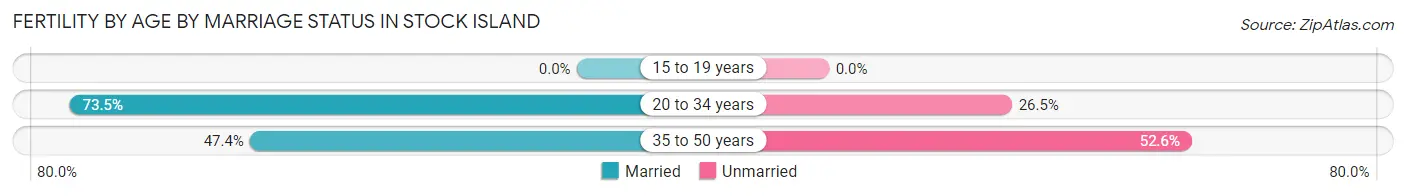
| Age Bracket | Married | Unmarried |
| 15 to 19 years | 0 (0.0%) | 0 (0.0%) |
| 20 to 34 years | 36 (73.5%) | 13 (26.5%) |
| 35 to 50 years | 9 (47.4%) | 10 (52.6%) |
| Total | 45 (66.2%) | 23 (33.8%) |
Fertility by Education in Stock Island
Average fertility rate in Stock Island is 50.0 births per 1,000 women. Women with the education attainment of graduate degree have the highest fertility rate of 127.0 births per 1,000 women, while women with the education attainment of high school diploma have the lowest fertility at 20.0 births per 1,000 women. Women with the education attainment of college or associate's degree represent 27.9% of all women with births.
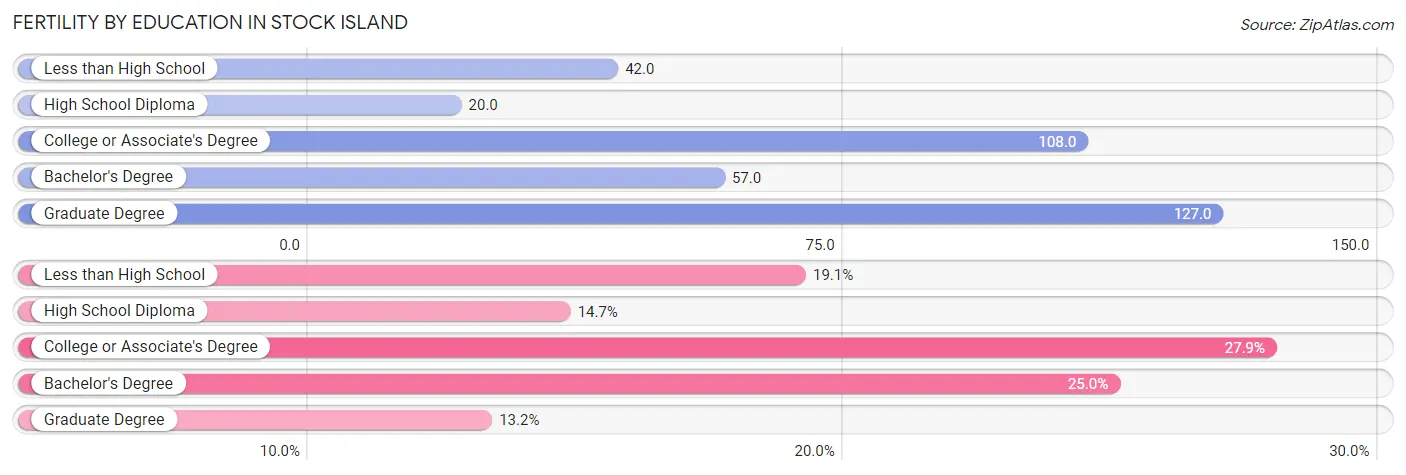
| Educational Attainment | Women with Births | Births / 1,000 Women |
| Less than High School | 13 (19.1%) | 42.0 |
| High School Diploma | 10 (14.7%) | 20.0 |
| College or Associate's Degree | 19 (27.9%) | 108.0 |
| Bachelor's Degree | 17 (25.0%) | 57.0 |
| Graduate Degree | 9 (13.2%) | 127.0 |
| Total | 68 (100.0%) | 50.0 |
Fertility by Education by Marriage Status in Stock Island
33.8% of women with births in Stock Island are unmarried. Women with the educational attainment of college or associate's degree are most likely to be married with 100.0% of them married at childbirth, while women with the educational attainment of less than high school are least likely to be married with 100.0% of them unmarried at childbirth.
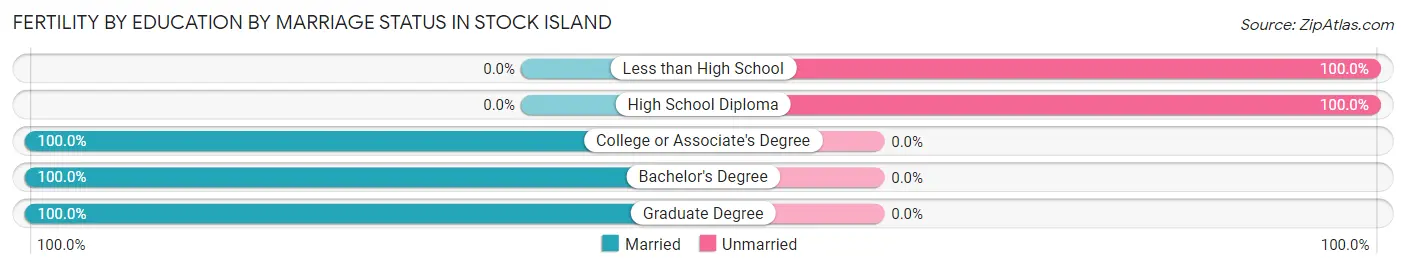
| Educational Attainment | Married | Unmarried |
| Less than High School | 0 (0.0%) | 13 (100.0%) |
| High School Diploma | 0 (0.0%) | 10 (100.0%) |
| College or Associate's Degree | 19 (100.0%) | 0 (0.0%) |
| Bachelor's Degree | 17 (100.0%) | 0 (0.0%) |
| Graduate Degree | 9 (100.0%) | 0 (0.0%) |
| Total | 45 (66.2%) | 23 (33.8%) |
Employment Characteristics in Stock Island
Employment by Class of Employer in Stock Island
Among the 2,408 employed individuals in Stock Island, private company employees (1,696 | 70.4%), local government employees (233 | 9.7%), and not-for-profit organizations (151 | 6.3%) make up the most common classes of employment.
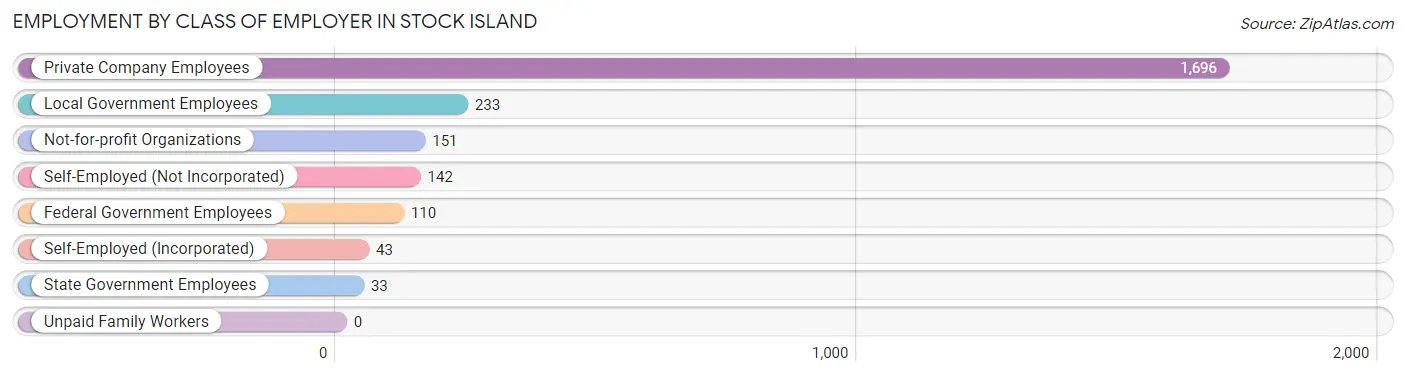
| Employer Class | # Employees | % Employees |
| Private Company Employees | 1,696 | 70.4% |
| Self-Employed (Incorporated) | 43 | 1.8% |
| Self-Employed (Not Incorporated) | 142 | 5.9% |
| Not-for-profit Organizations | 151 | 6.3% |
| Local Government Employees | 233 | 9.7% |
| State Government Employees | 33 | 1.4% |
| Federal Government Employees | 110 | 4.6% |
| Unpaid Family Workers | 0 | 0.0% |
| Total | 2,408 | 100.0% |
Employment Status by Age in Stock Island
According to the labor force statistics for Stock Island, out of the total population over 16 years of age (3,548), 70.5% or 2,501 individuals are in the labor force, with 1.6% or 40 of them unemployed. The age group with the highest labor force participation rate is 25 to 29 years, with 100.0% or 416 individuals in the labor force. Within the labor force, the 25 to 29 years age range has the highest percentage of unemployed individuals, with 6.3% or 26 of them being unemployed.
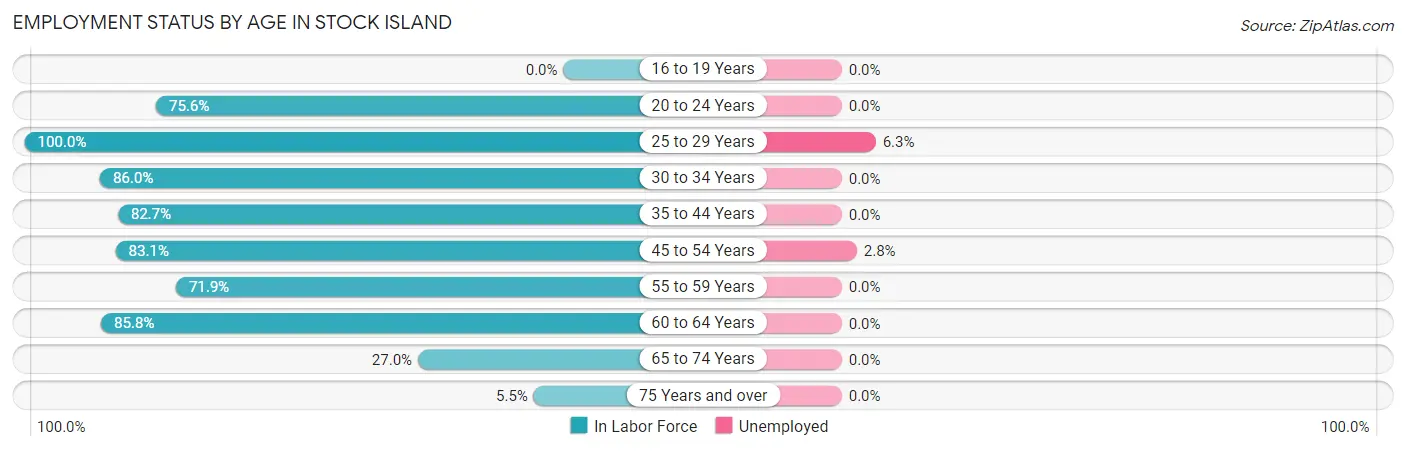
| Age Bracket | In Labor Force | Unemployed |
| 16 to 19 Years | 0 (0.0%) | 0 (0.0%) |
| 20 to 24 Years | 229 (75.6%) | 0 (0.0%) |
| 25 to 29 Years | 416 (100.0%) | 26 (6.3%) |
| 30 to 34 Years | 356 (86.0%) | 0 (0.0%) |
| 35 to 44 Years | 649 (82.7%) | 0 (0.0%) |
| 45 to 54 Years | 458 (83.1%) | 13 (2.8%) |
| 55 to 59 Years | 151 (71.9%) | 0 (0.0%) |
| 60 to 64 Years | 145 (85.8%) | 0 (0.0%) |
| 65 to 74 Years | 90 (27.0%) | 0 (0.0%) |
| 75 Years and over | 9 (5.5%) | 0 (0.0%) |
| Total | 2,501 (70.5%) | 40 (1.6%) |
Employment Status by Educational Attainment in Stock Island
According to labor force statistics for Stock Island, 85.5% of individuals (2,176) out of the total population between 25 and 64 years of age (2,545) are in the labor force, with 1.8% or 39 of them being unemployed. The group with the highest labor force participation rate are those with the educational attainment of high school diploma, with 90.2% or 1,011 individuals in the labor force. Within the labor force, individuals with college / associate degree education have the highest percentage of unemployment, with 5.9% or 26 of them being unemployed.
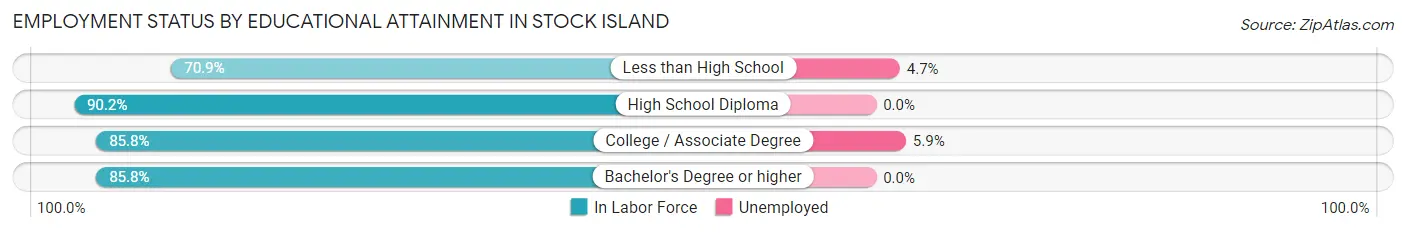
| Educational Attainment | In Labor Force | Unemployed |
| Less than High School | 275 (70.9%) | 18 (4.7%) |
| High School Diploma | 1,011 (90.2%) | 0 (0.0%) |
| College / Associate Degree | 441 (85.8%) | 30 (5.9%) |
| Bachelor's Degree or higher | 448 (85.8%) | 0 (0.0%) |
| Total | 2,176 (85.5%) | 46 (1.8%) |
Employment Occupations by Sex in Stock Island
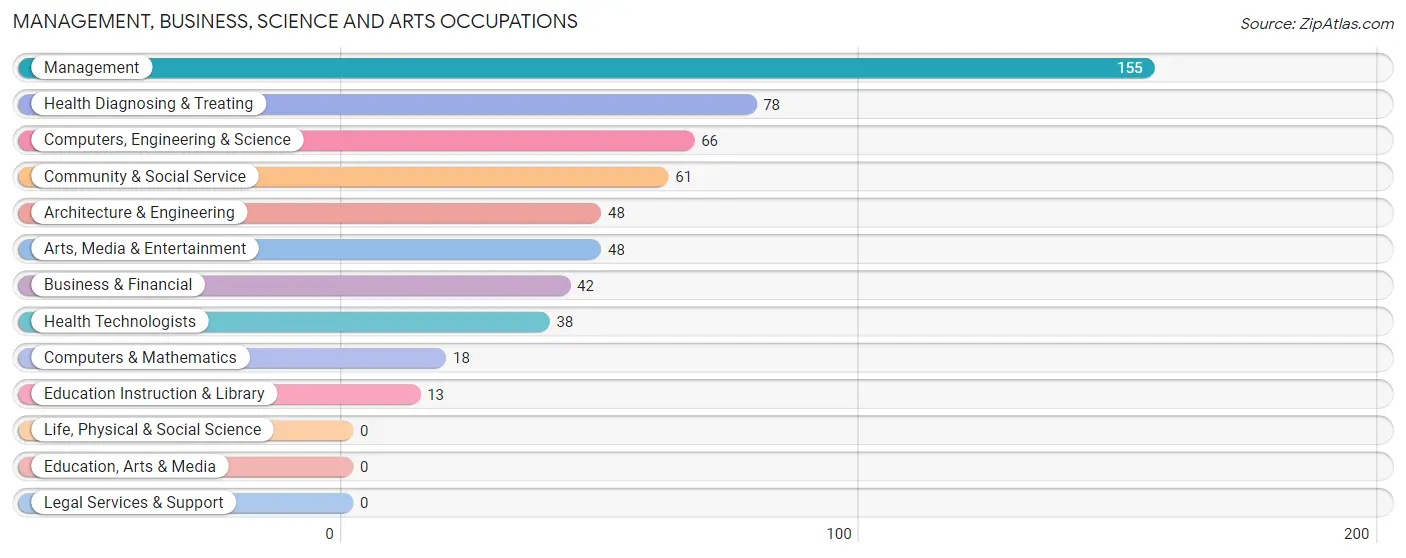
Management, Business, Science and Arts Occupations
The most common Management, Business, Science and Arts occupations in Stock Island are Management (155 | 6.3%), Health Diagnosing & Treating (78 | 3.2%), Computers, Engineering & Science (66 | 2.7%), Community & Social Service (61 | 2.5%), and Architecture & Engineering (48 | 1.9%).
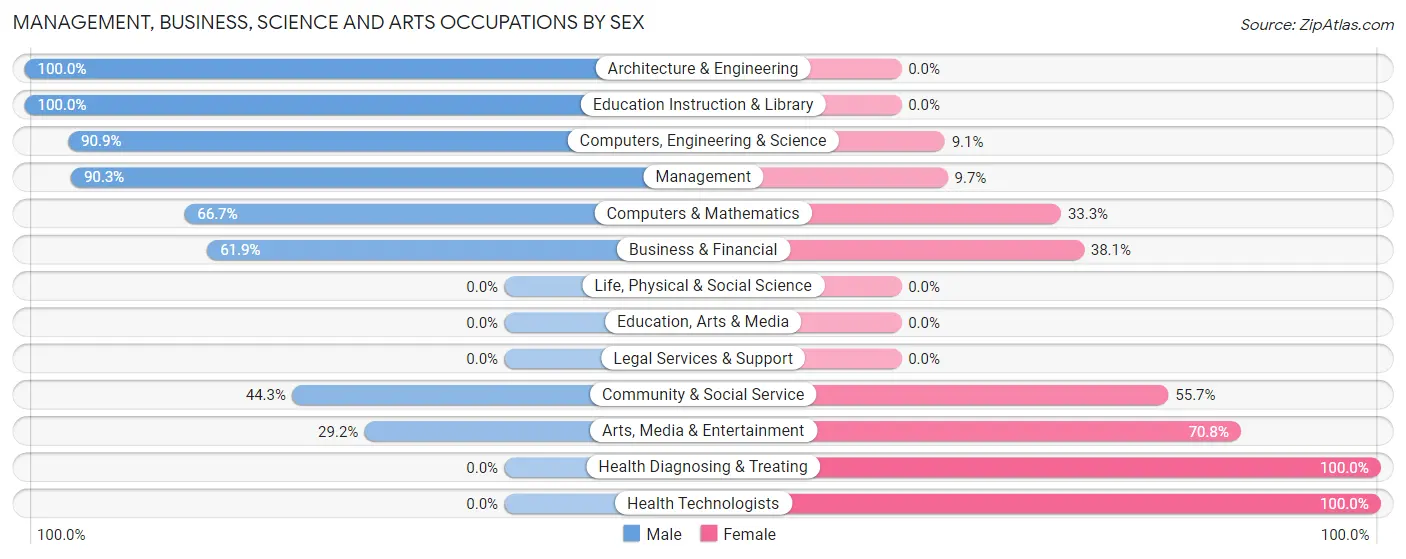
Management, Business, Science and Arts Occupations by Sex
Within the Management, Business, Science and Arts occupations in Stock Island, the most male-oriented occupations are Architecture & Engineering (100.0%), Education Instruction & Library (100.0%), and Computers, Engineering & Science (90.9%), while the most female-oriented occupations are Health Diagnosing & Treating (100.0%), Health Technologists (100.0%), and Arts, Media & Entertainment (70.8%).
| Occupation | Male | Female |
| Management | 140 (90.3%) | 15 (9.7%) |
| Business & Financial | 26 (61.9%) | 16 (38.1%) |
| Computers, Engineering & Science | 60 (90.9%) | 6 (9.1%) |
| Computers & Mathematics | 12 (66.7%) | 6 (33.3%) |
| Architecture & Engineering | 48 (100.0%) | 0 (0.0%) |
| Life, Physical & Social Science | 0 (0.0%) | 0 (0.0%) |
| Community & Social Service | 27 (44.3%) | 34 (55.7%) |
| Education, Arts & Media | 0 (0.0%) | 0 (0.0%) |
| Legal Services & Support | 0 (0.0%) | 0 (0.0%) |
| Education Instruction & Library | 13 (100.0%) | 0 (0.0%) |
| Arts, Media & Entertainment | 14 (29.2%) | 34 (70.8%) |
| Health Diagnosing & Treating | 0 (0.0%) | 78 (100.0%) |
| Health Technologists | 0 (0.0%) | 38 (100.0%) |
| Total (Category) | 253 (62.9%) | 149 (37.1%) |
| Total (Overall) | 1,232 (50.0%) | 1,232 (50.0%) |
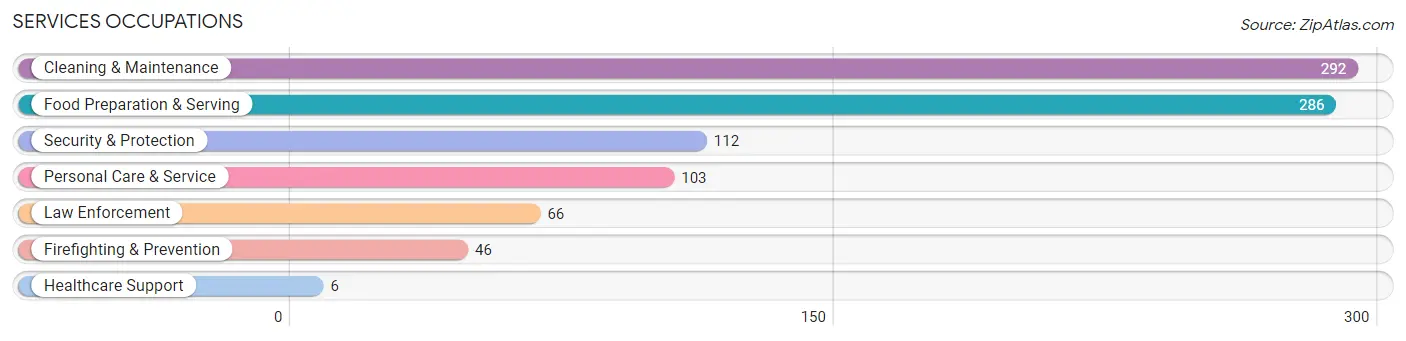
Services Occupations
The most common Services occupations in Stock Island are Cleaning & Maintenance (292 | 11.8%), Food Preparation & Serving (286 | 11.6%), Security & Protection (112 | 4.5%), Personal Care & Service (103 | 4.2%), and Law Enforcement (66 | 2.7%).
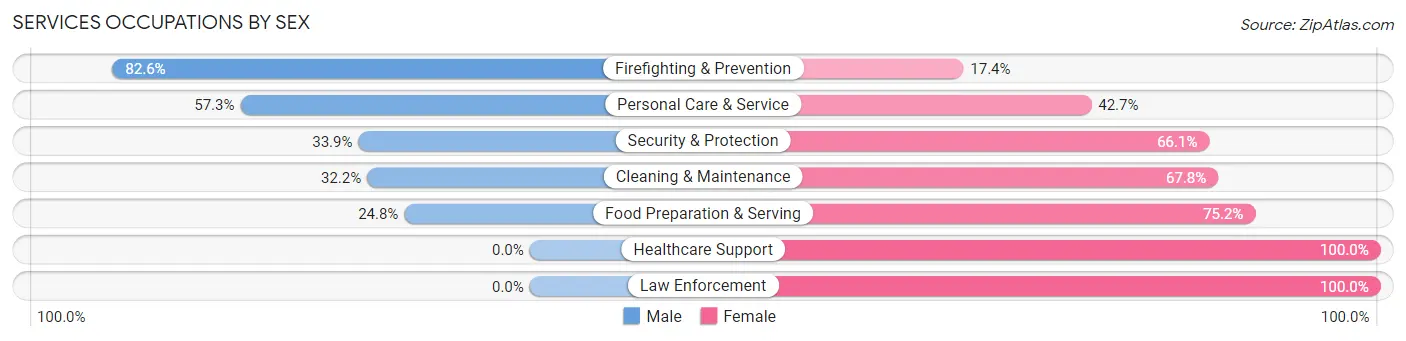
Services Occupations by Sex
Within the Services occupations in Stock Island, the most male-oriented occupations are Firefighting & Prevention (82.6%), Personal Care & Service (57.3%), and Security & Protection (33.9%), while the most female-oriented occupations are Healthcare Support (100.0%), Law Enforcement (100.0%), and Food Preparation & Serving (75.2%).
| Occupation | Male | Female |
| Healthcare Support | 0 (0.0%) | 6 (100.0%) |
| Security & Protection | 38 (33.9%) | 74 (66.1%) |
| Firefighting & Prevention | 38 (82.6%) | 8 (17.4%) |
| Law Enforcement | 0 (0.0%) | 66 (100.0%) |
| Food Preparation & Serving | 71 (24.8%) | 215 (75.2%) |
| Cleaning & Maintenance | 94 (32.2%) | 198 (67.8%) |
| Personal Care & Service | 59 (57.3%) | 44 (42.7%) |
| Total (Category) | 262 (32.8%) | 537 (67.2%) |
| Total (Overall) | 1,232 (50.0%) | 1,232 (50.0%) |
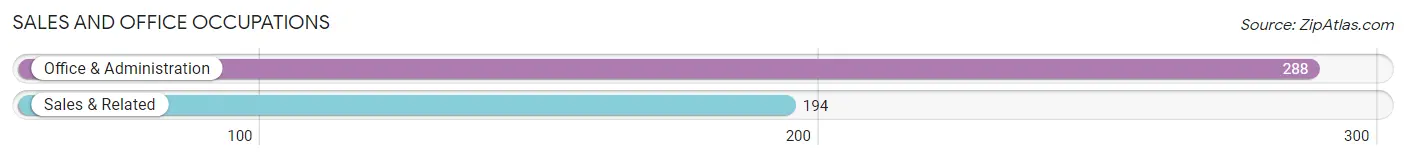
Sales and Office Occupations
The most common Sales and Office occupations in Stock Island are Office & Administration (288 | 11.7%), and Sales & Related (194 | 7.9%).
Sales and Office Occupations by Sex
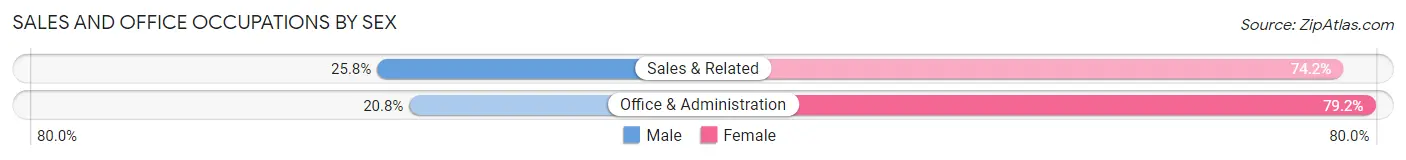
| Occupation | Male | Female |
| Sales & Related | 50 (25.8%) | 144 (74.2%) |
| Office & Administration | 60 (20.8%) | 228 (79.2%) |
| Total (Category) | 110 (22.8%) | 372 (77.2%) |
| Total (Overall) | 1,232 (50.0%) | 1,232 (50.0%) |
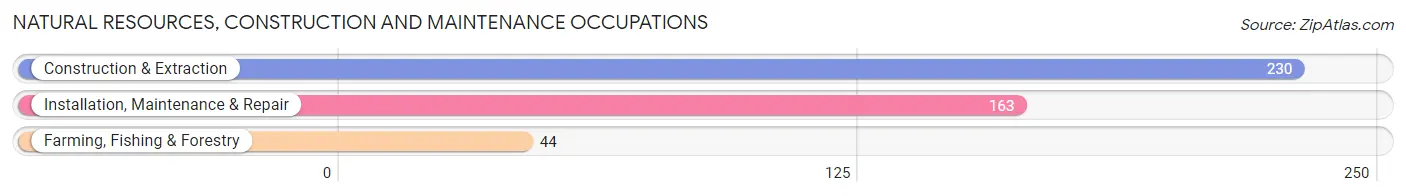
Natural Resources, Construction and Maintenance Occupations
The most common Natural Resources, Construction and Maintenance occupations in Stock Island are Construction & Extraction (230 | 9.3%), Installation, Maintenance & Repair (163 | 6.6%), and Farming, Fishing & Forestry (44 | 1.8%).
Natural Resources, Construction and Maintenance Occupations by Sex
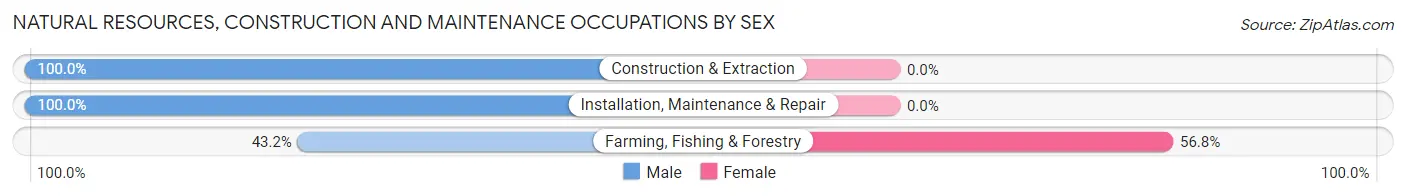
| Occupation | Male | Female |
| Farming, Fishing & Forestry | 19 (43.2%) | 25 (56.8%) |
| Construction & Extraction | 230 (100.0%) | 0 (0.0%) |
| Installation, Maintenance & Repair | 163 (100.0%) | 0 (0.0%) |
| Total (Category) | 412 (94.3%) | 25 (5.7%) |
| Total (Overall) | 1,232 (50.0%) | 1,232 (50.0%) |
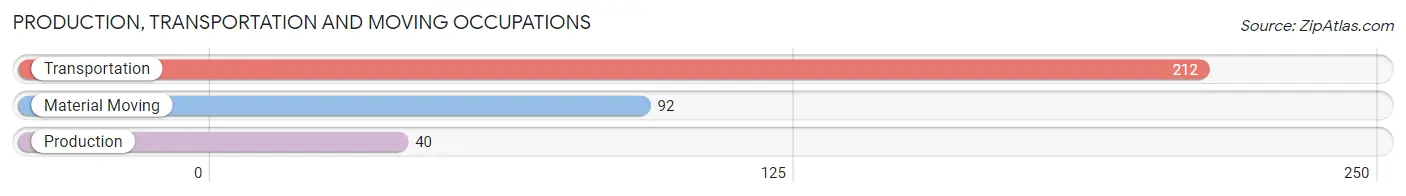
Production, Transportation and Moving Occupations
The most common Production, Transportation and Moving occupations in Stock Island are Transportation (212 | 8.6%), Material Moving (92 | 3.7%), and Production (40 | 1.6%).
Production, Transportation and Moving Occupations by Sex
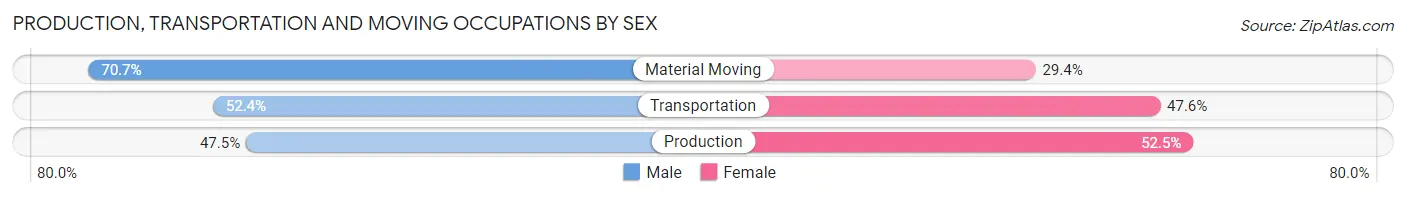
| Occupation | Male | Female |
| Production | 19 (47.5%) | 21 (52.5%) |
| Transportation | 111 (52.4%) | 101 (47.6%) |
| Material Moving | 65 (70.7%) | 27 (29.3%) |
| Total (Category) | 195 (56.7%) | 149 (43.3%) |
| Total (Overall) | 1,232 (50.0%) | 1,232 (50.0%) |
Employment Industries by Sex in Stock Island
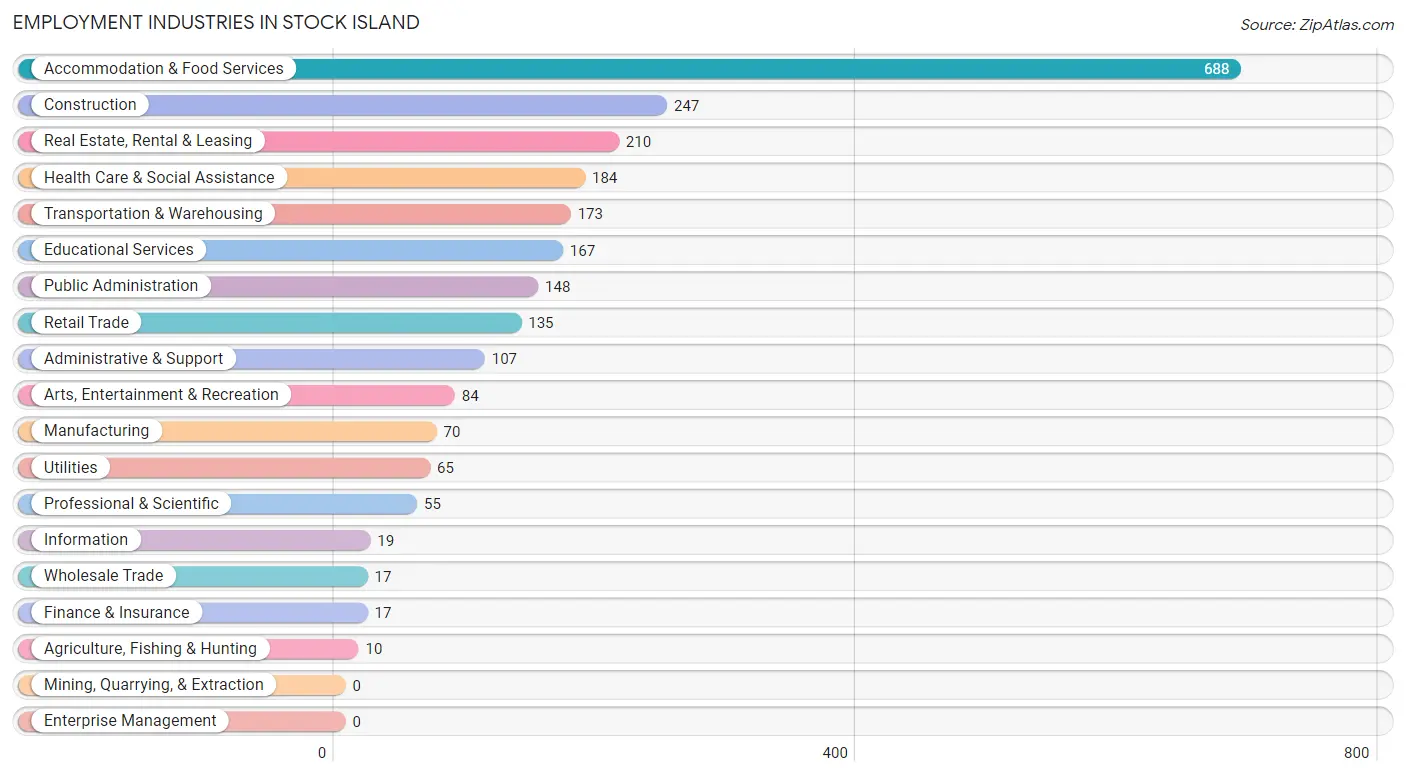
Employment Industries in Stock Island
The major employment industries in Stock Island include Accommodation & Food Services (688 | 27.9%), Construction (247 | 10.0%), Real Estate, Rental & Leasing (210 | 8.5%), Health Care & Social Assistance (184 | 7.5%), and Transportation & Warehousing (173 | 7.0%).
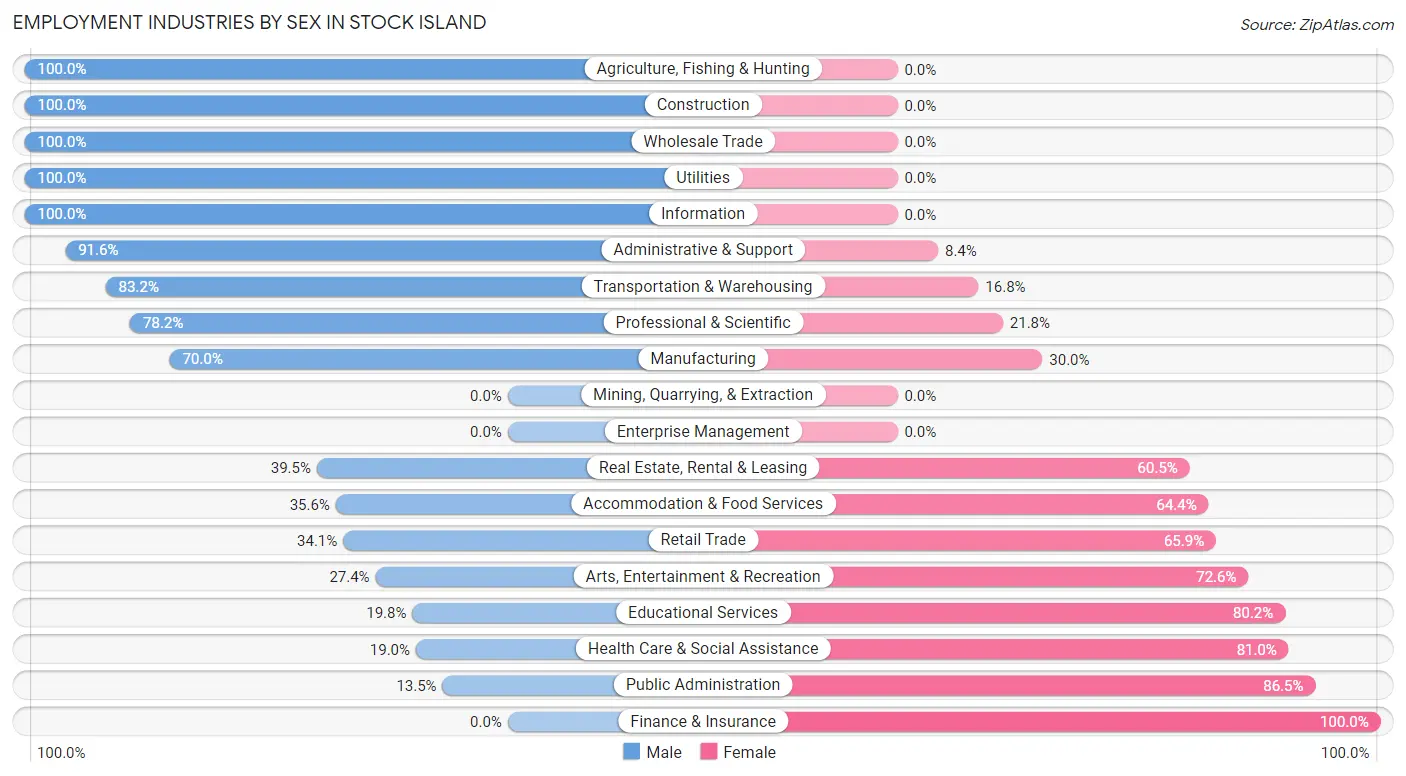
Employment Industries by Sex in Stock Island
The Stock Island industries that see more men than women are Agriculture, Fishing & Hunting (100.0%), Construction (100.0%), and Wholesale Trade (100.0%), whereas the industries that tend to have a higher number of women are Finance & Insurance (100.0%), Public Administration (86.5%), and Health Care & Social Assistance (81.0%).
| Industry | Male | Female |
| Agriculture, Fishing & Hunting | 10 (100.0%) | 0 (0.0%) |
| Mining, Quarrying, & Extraction | 0 (0.0%) | 0 (0.0%) |
| Construction | 247 (100.0%) | 0 (0.0%) |
| Manufacturing | 49 (70.0%) | 21 (30.0%) |
| Wholesale Trade | 17 (100.0%) | 0 (0.0%) |
| Retail Trade | 46 (34.1%) | 89 (65.9%) |
| Transportation & Warehousing | 144 (83.2%) | 29 (16.8%) |
| Utilities | 65 (100.0%) | 0 (0.0%) |
| Information | 19 (100.0%) | 0 (0.0%) |
| Finance & Insurance | 0 (0.0%) | 17 (100.0%) |
| Real Estate, Rental & Leasing | 83 (39.5%) | 127 (60.5%) |
| Professional & Scientific | 43 (78.2%) | 12 (21.8%) |
| Enterprise Management | 0 (0.0%) | 0 (0.0%) |
| Administrative & Support | 98 (91.6%) | 9 (8.4%) |
| Educational Services | 33 (19.8%) | 134 (80.2%) |
| Health Care & Social Assistance | 35 (19.0%) | 149 (81.0%) |
| Arts, Entertainment & Recreation | 23 (27.4%) | 61 (72.6%) |
| Accommodation & Food Services | 245 (35.6%) | 443 (64.4%) |
| Public Administration | 20 (13.5%) | 128 (86.5%) |
| Total | 1,232 (50.0%) | 1,232 (50.0%) |
Education in Stock Island
School Enrollment in Stock Island
The most common levels of schooling among the 896 students in Stock Island are middle school (318 | 35.5%), college / undergraduate (167 | 18.6%), and high school (158 | 17.6%).
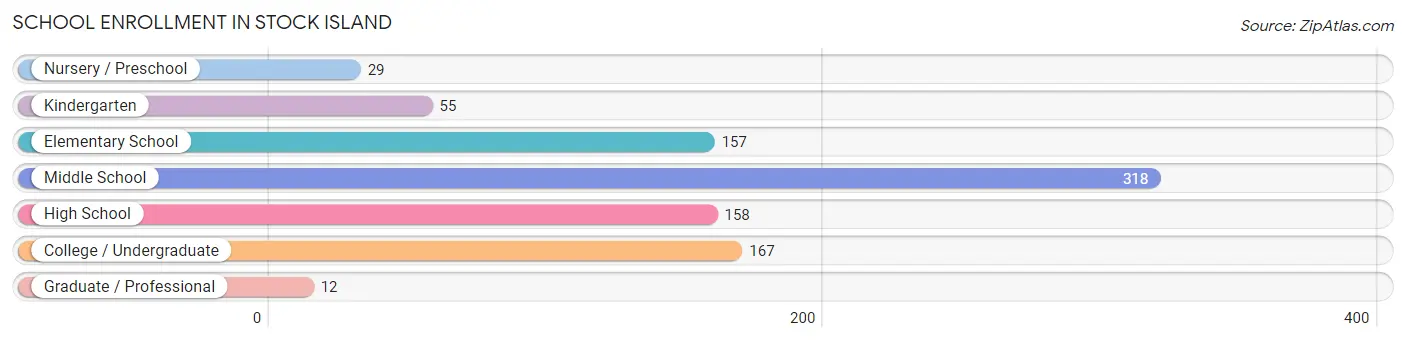
| School Level | # Students | % Students |
| Nursery / Preschool | 29 | 3.2% |
| Kindergarten | 55 | 6.1% |
| Elementary School | 157 | 17.5% |
| Middle School | 318 | 35.5% |
| High School | 158 | 17.6% |
| College / Undergraduate | 167 | 18.6% |
| Graduate / Professional | 12 | 1.3% |
| Total | 896 | 100.0% |
School Enrollment by Age by Funding Source in Stock Island
Out of a total of 896 students who are enrolled in schools in Stock Island, 75 (8.4%) attend a private institution, while the remaining 821 (91.6%) are enrolled in public schools. The age group of 35 years and over has the highest likelihood of being enrolled in private schools, with 14 (100.0% in the age bracket) enrolled. Conversely, the age group of 5 to 9 year old has the lowest likelihood of being enrolled in a private school, with 181 (100.0% in the age bracket) attending a public institution.
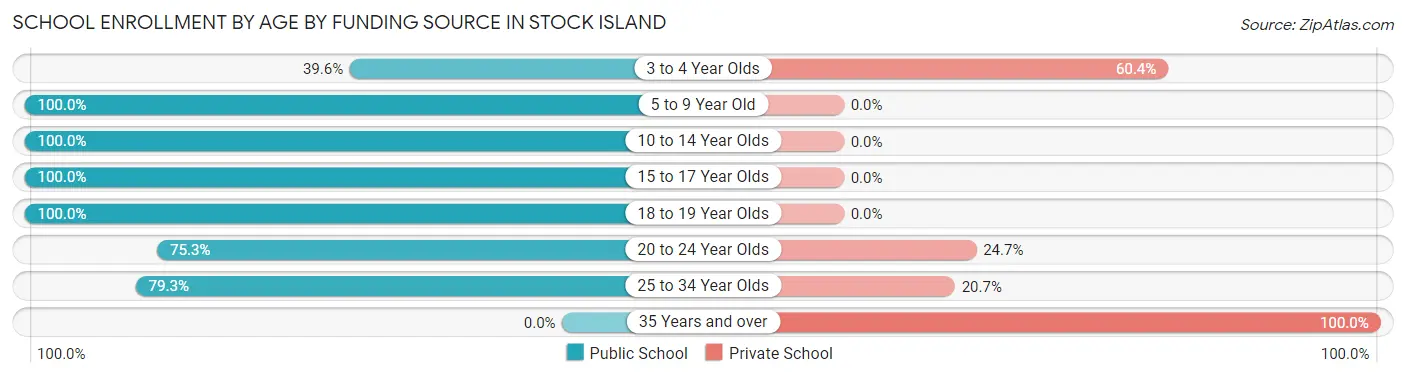
| Age Bracket | Public School | Private School |
| 3 to 4 Year Olds | 19 (39.6%) | 29 (60.4%) |
| 5 to 9 Year Old | 181 (100.0%) | 0 (0.0%) |
| 10 to 14 Year Olds | 330 (100.0%) | 0 (0.0%) |
| 15 to 17 Year Olds | 117 (100.0%) | 0 (0.0%) |
| 18 to 19 Year Olds | 67 (100.0%) | 0 (0.0%) |
| 20 to 24 Year Olds | 61 (75.3%) | 20 (24.7%) |
| 25 to 34 Year Olds | 46 (79.3%) | 12 (20.7%) |
| 35 Years and over | 0 (0.0%) | 14 (100.0%) |
| Total | 821 (91.6%) | 75 (8.4%) |
Educational Attainment by Field of Study in Stock Island
Business (237 | 35.1%), education (78 | 11.5%), computers & mathematics (76 | 11.2%), engineering (61 | 9.0%), and arts & humanities (58 | 8.6%) are the most common fields of study among 676 individuals in Stock Island who have obtained a bachelor's degree or higher.
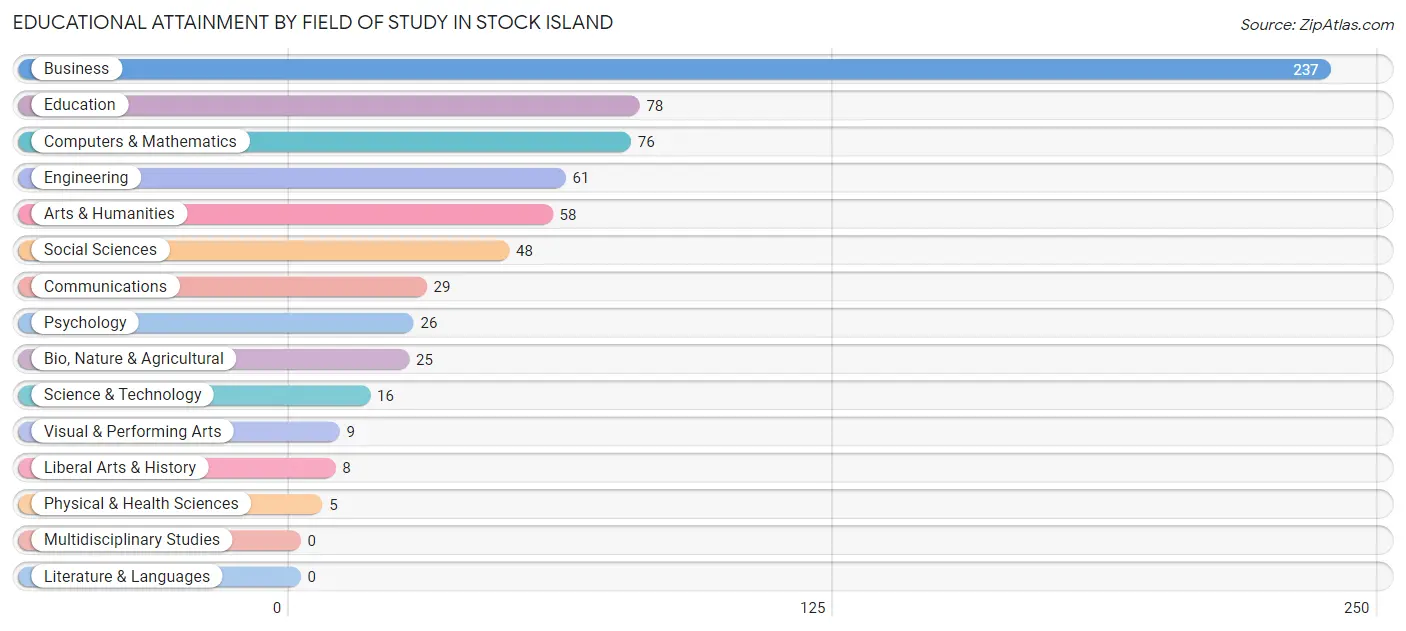
| Field of Study | # Graduates | % Graduates |
| Computers & Mathematics | 76 | 11.2% |
| Bio, Nature & Agricultural | 25 | 3.7% |
| Physical & Health Sciences | 5 | 0.7% |
| Psychology | 26 | 3.8% |
| Social Sciences | 48 | 7.1% |
| Engineering | 61 | 9.0% |
| Multidisciplinary Studies | 0 | 0.0% |
| Science & Technology | 16 | 2.4% |
| Business | 237 | 35.1% |
| Education | 78 | 11.5% |
| Literature & Languages | 0 | 0.0% |
| Liberal Arts & History | 8 | 1.2% |
| Visual & Performing Arts | 9 | 1.3% |
| Communications | 29 | 4.3% |
| Arts & Humanities | 58 | 8.6% |
| Total | 676 | 100.0% |
Transportation & Commute in Stock Island
Vehicle Availability by Sex in Stock Island
The most prevalent vehicle ownership categories in Stock Island are males with 1 vehicle (492, accounting for 41.0%) and females with 1 vehicle (511, making up 40.8%).
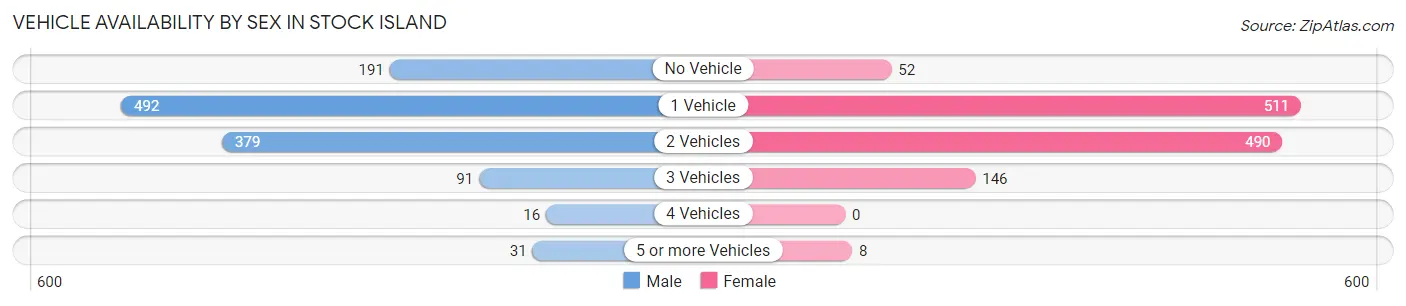
| Vehicles Available | Male | Female |
| No Vehicle | 191 (15.9%) | 52 (4.3%) |
| 1 Vehicle | 492 (41.0%) | 511 (42.3%) |
| 2 Vehicles | 379 (31.6%) | 490 (40.6%) |
| 3 Vehicles | 91 (7.6%) | 146 (12.1%) |
| 4 Vehicles | 16 (1.3%) | 0 (0.0%) |
| 5 or more Vehicles | 31 (2.6%) | 8 (0.7%) |
| Total | 1,200 (100.0%) | 1,207 (100.0%) |
Commute Time in Stock Island
The most frequently occuring commute durations in Stock Island are 15 to 19 minutes (548 commuters, 23.3%), 5 to 9 minutes (468 commuters, 19.9%), and 10 to 14 minutes (424 commuters, 18.0%).
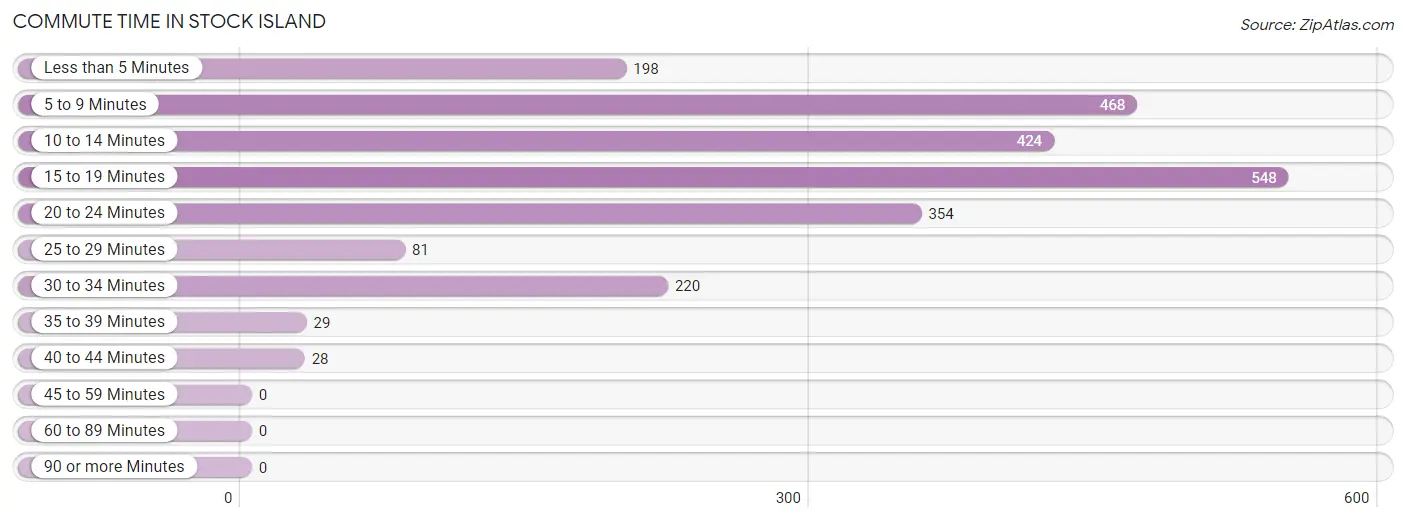
| Commute Time | # Commuters | % Commuters |
| Less than 5 Minutes | 198 | 8.4% |
| 5 to 9 Minutes | 468 | 19.9% |
| 10 to 14 Minutes | 424 | 18.0% |
| 15 to 19 Minutes | 548 | 23.3% |
| 20 to 24 Minutes | 354 | 15.1% |
| 25 to 29 Minutes | 81 | 3.5% |
| 30 to 34 Minutes | 220 | 9.4% |
| 35 to 39 Minutes | 29 | 1.2% |
| 40 to 44 Minutes | 28 | 1.2% |
| 45 to 59 Minutes | 0 | 0.0% |
| 60 to 89 Minutes | 0 | 0.0% |
| 90 or more Minutes | 0 | 0.0% |
Commute Time by Sex in Stock Island
The most common commute times in Stock Island are 10 to 14 minutes (235 commuters, 20.1%) for males and 15 to 19 minutes (333 commuters, 28.2%) for females.
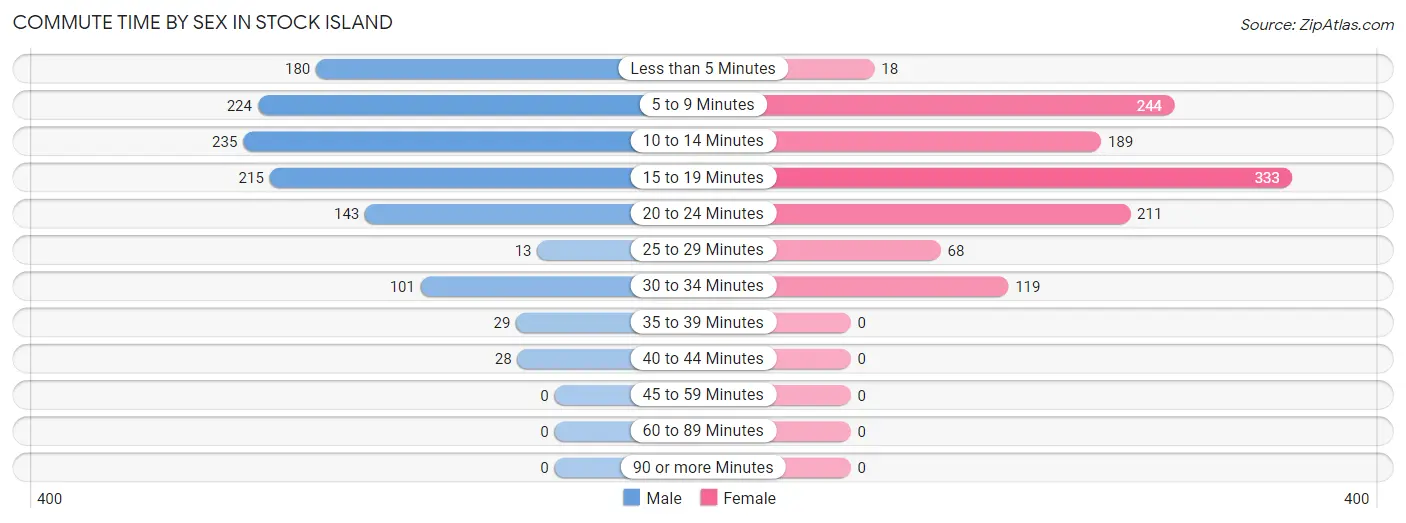
| Commute Time | Male | Female |
| Less than 5 Minutes | 180 (15.4%) | 18 (1.5%) |
| 5 to 9 Minutes | 224 (19.2%) | 244 (20.6%) |
| 10 to 14 Minutes | 235 (20.1%) | 189 (16.0%) |
| 15 to 19 Minutes | 215 (18.4%) | 333 (28.2%) |
| 20 to 24 Minutes | 143 (12.2%) | 211 (17.8%) |
| 25 to 29 Minutes | 13 (1.1%) | 68 (5.8%) |
| 30 to 34 Minutes | 101 (8.6%) | 119 (10.1%) |
| 35 to 39 Minutes | 29 (2.5%) | 0 (0.0%) |
| 40 to 44 Minutes | 28 (2.4%) | 0 (0.0%) |
| 45 to 59 Minutes | 0 (0.0%) | 0 (0.0%) |
| 60 to 89 Minutes | 0 (0.0%) | 0 (0.0%) |
| 90 or more Minutes | 0 (0.0%) | 0 (0.0%) |
Time of Departure to Work by Sex in Stock Island
The most frequent times of departure to work in Stock Island are 7:00 AM to 7:29 AM (310, 26.5%) for males and 7:00 AM to 7:29 AM (235, 19.9%) for females.
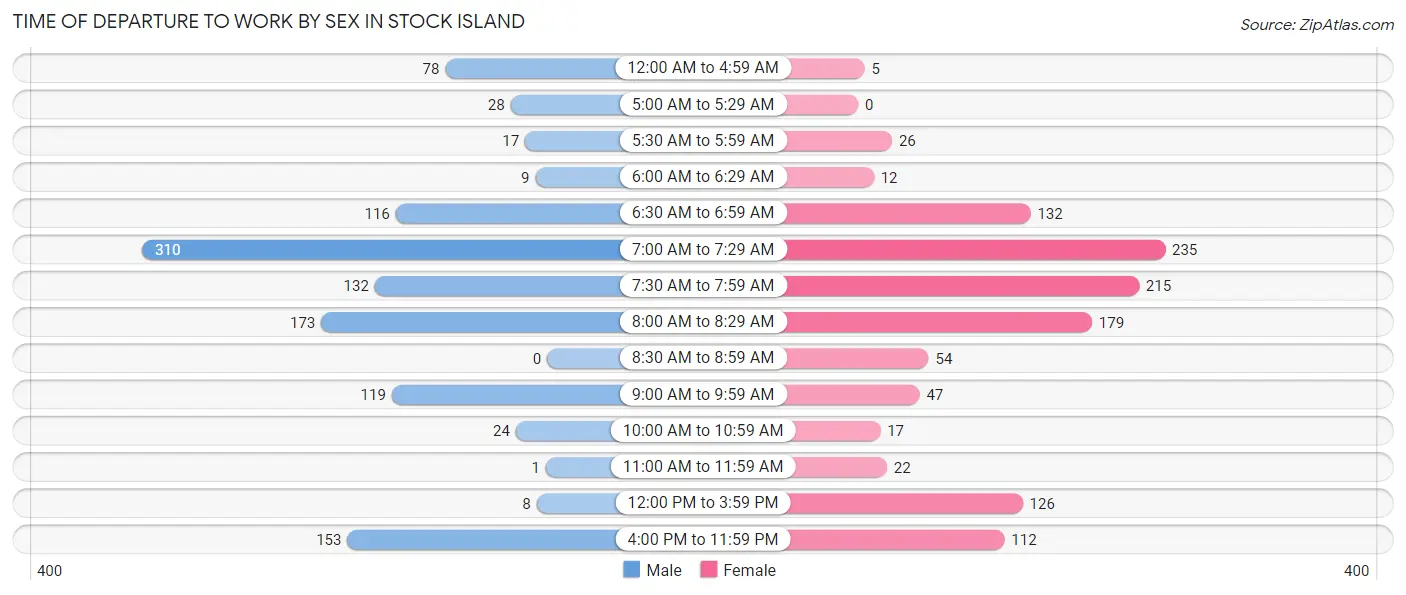
| Time of Departure | Male | Female |
| 12:00 AM to 4:59 AM | 78 (6.7%) | 5 (0.4%) |
| 5:00 AM to 5:29 AM | 28 (2.4%) | 0 (0.0%) |
| 5:30 AM to 5:59 AM | 17 (1.5%) | 26 (2.2%) |
| 6:00 AM to 6:29 AM | 9 (0.8%) | 12 (1.0%) |
| 6:30 AM to 6:59 AM | 116 (9.9%) | 132 (11.2%) |
| 7:00 AM to 7:29 AM | 310 (26.5%) | 235 (19.9%) |
| 7:30 AM to 7:59 AM | 132 (11.3%) | 215 (18.2%) |
| 8:00 AM to 8:29 AM | 173 (14.8%) | 179 (15.1%) |
| 8:30 AM to 8:59 AM | 0 (0.0%) | 54 (4.6%) |
| 9:00 AM to 9:59 AM | 119 (10.2%) | 47 (4.0%) |
| 10:00 AM to 10:59 AM | 24 (2.1%) | 17 (1.4%) |
| 11:00 AM to 11:59 AM | 1 (0.1%) | 22 (1.9%) |
| 12:00 PM to 3:59 PM | 8 (0.7%) | 126 (10.7%) |
| 4:00 PM to 11:59 PM | 153 (13.1%) | 112 (9.5%) |
| Total | 1,168 (100.0%) | 1,182 (100.0%) |
Housing Occupancy in Stock Island
Occupancy by Ownership in Stock Island
Of the total 1,663 dwellings in Stock Island, owner-occupied units account for 451 (27.1%), while renter-occupied units make up 1,212 (72.9%).
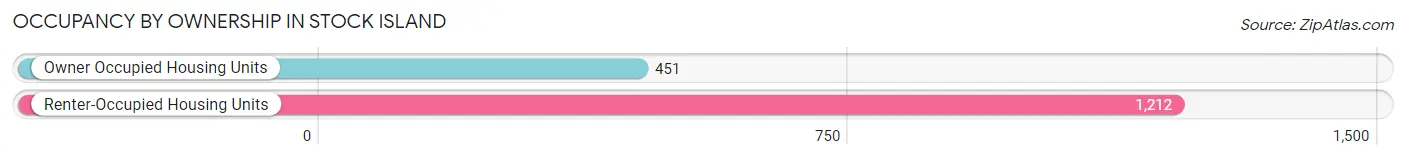
| Occupancy | # Housing Units | % Housing Units |
| Owner Occupied Housing Units | 451 | 27.1% |
| Renter-Occupied Housing Units | 1,212 | 72.9% |
| Total Occupied Housing Units | 1,663 | 100.0% |
Occupancy by Household Size in Stock Island
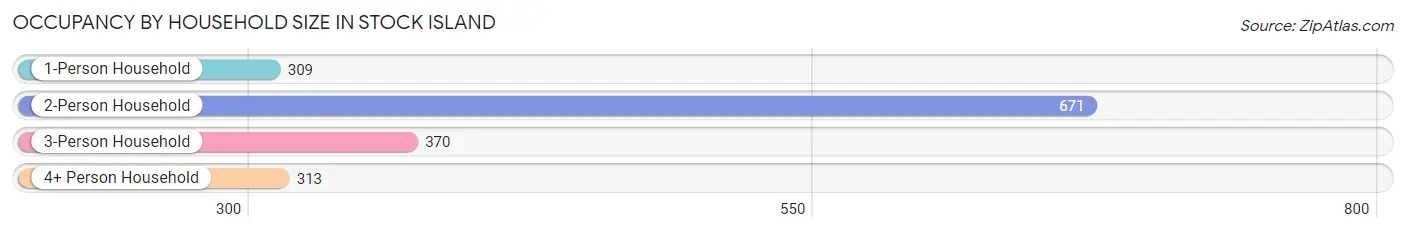
| Household Size | # Housing Units | % Housing Units |
| 1-Person Household | 309 | 18.6% |
| 2-Person Household | 671 | 40.4% |
| 3-Person Household | 370 | 22.3% |
| 4+ Person Household | 313 | 18.8% |
| Total Housing Units | 1,663 | 100.0% |
Occupancy by Ownership by Household Size in Stock Island
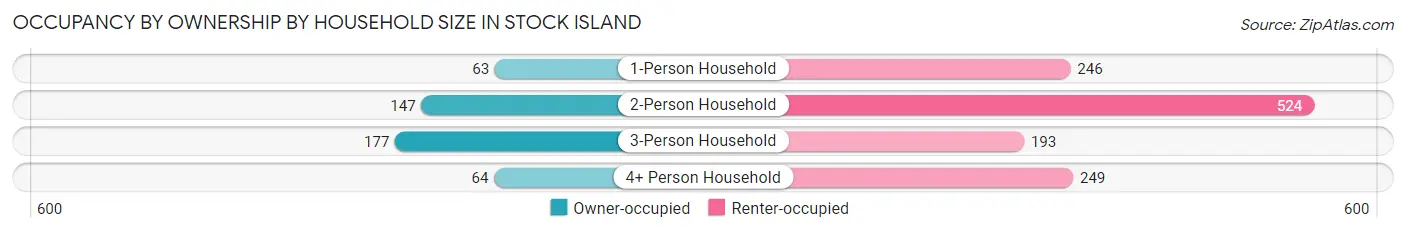
| Household Size | Owner-occupied | Renter-occupied |
| 1-Person Household | 63 (20.4%) | 246 (79.6%) |
| 2-Person Household | 147 (21.9%) | 524 (78.1%) |
| 3-Person Household | 177 (47.8%) | 193 (52.2%) |
| 4+ Person Household | 64 (20.4%) | 249 (79.5%) |
| Total Housing Units | 451 (27.1%) | 1,212 (72.9%) |
Occupancy by Educational Attainment in Stock Island
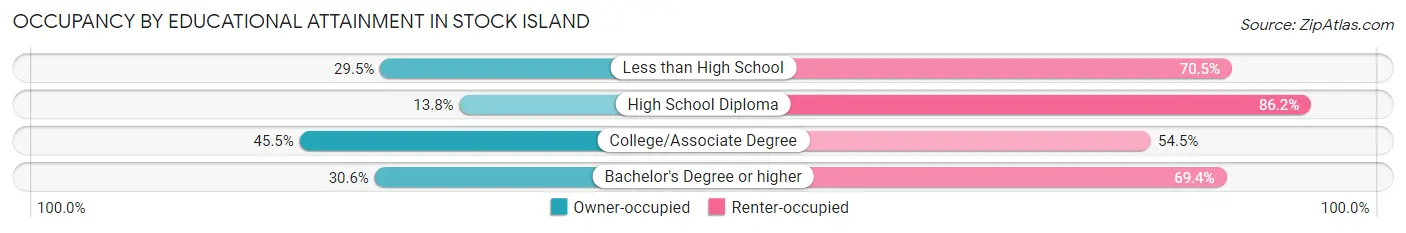
| Household Size | Owner-occupied | Renter-occupied |
| Less than High School | 77 (29.5%) | 184 (70.5%) |
| High School Diploma | 95 (13.8%) | 594 (86.2%) |
| College/Associate Degree | 186 (45.5%) | 223 (54.5%) |
| Bachelor's Degree or higher | 93 (30.6%) | 211 (69.4%) |
Occupancy by Age of Householder in Stock Island
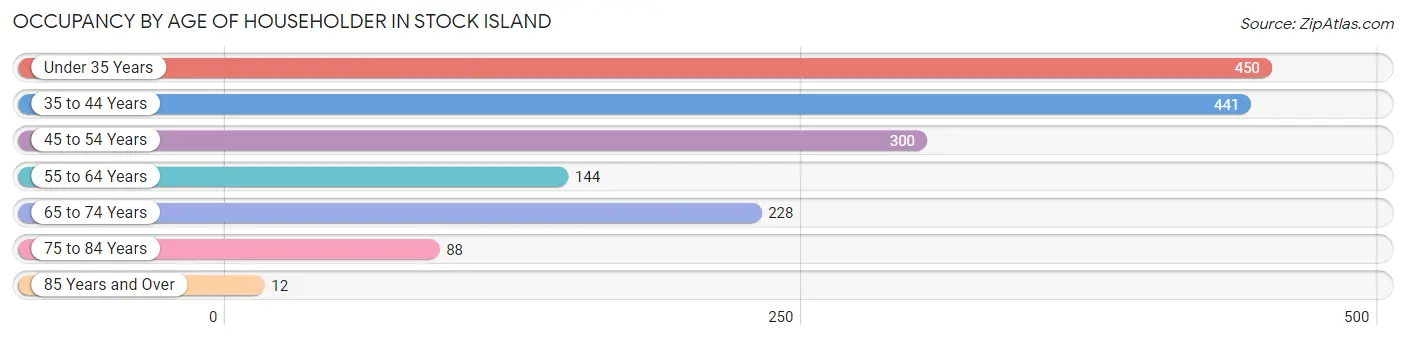
| Age Bracket | # Households | % Households |
| Under 35 Years | 450 | 27.1% |
| 35 to 44 Years | 441 | 26.5% |
| 45 to 54 Years | 300 | 18.0% |
| 55 to 64 Years | 144 | 8.7% |
| 65 to 74 Years | 228 | 13.7% |
| 75 to 84 Years | 88 | 5.3% |
| 85 Years and Over | 12 | 0.7% |
| Total | 1,663 | 100.0% |
Housing Finances in Stock Island
Median Income by Occupancy in Stock Island
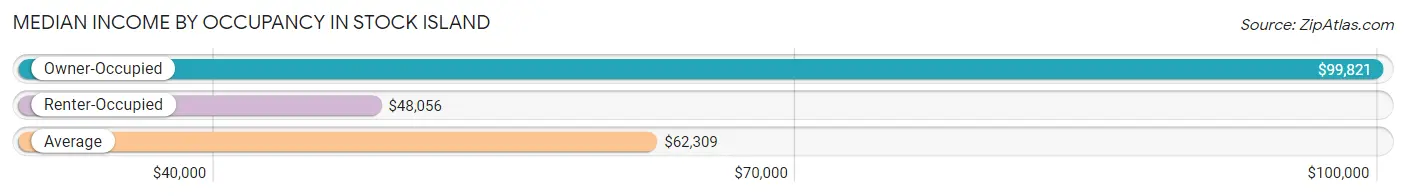
| Occupancy Type | # Households | Median Income |
| Owner-Occupied | 451 (27.1%) | $99,821 |
| Renter-Occupied | 1,212 (72.9%) | $48,056 |
| Average | 1,663 (100.0%) | $62,309 |
Occupancy by Householder Income Bracket in Stock Island
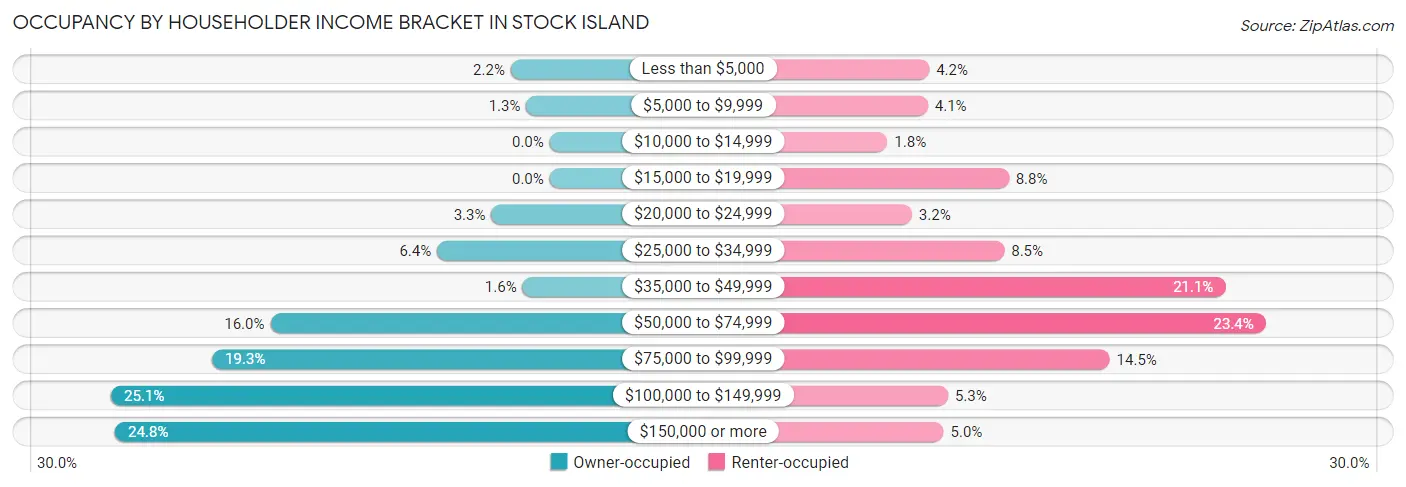
| Income Bracket | Owner-occupied | Renter-occupied |
| Less than $5,000 | 10 (2.2%) | 51 (4.2%) |
| $5,000 to $9,999 | 6 (1.3%) | 50 (4.1%) |
| $10,000 to $14,999 | 0 (0.0%) | 22 (1.8%) |
| $15,000 to $19,999 | 0 (0.0%) | 106 (8.7%) |
| $20,000 to $24,999 | 15 (3.3%) | 39 (3.2%) |
| $25,000 to $34,999 | 29 (6.4%) | 103 (8.5%) |
| $35,000 to $49,999 | 7 (1.5%) | 256 (21.1%) |
| $50,000 to $74,999 | 72 (16.0%) | 284 (23.4%) |
| $75,000 to $99,999 | 87 (19.3%) | 176 (14.5%) |
| $100,000 to $149,999 | 113 (25.1%) | 64 (5.3%) |
| $150,000 or more | 112 (24.8%) | 61 (5.0%) |
| Total | 451 (100.0%) | 1,212 (100.0%) |
Monthly Housing Cost Tiers in Stock Island
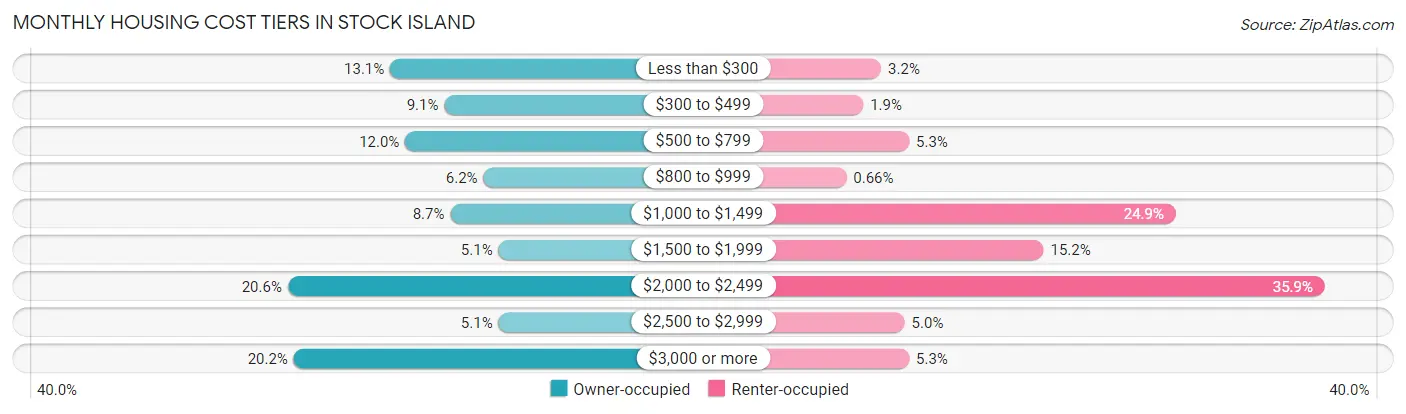
| Monthly Cost | Owner-occupied | Renter-occupied |
| Less than $300 | 59 (13.1%) | 39 (3.2%) |
| $300 to $499 | 41 (9.1%) | 23 (1.9%) |
| $500 to $799 | 54 (12.0%) | 64 (5.3%) |
| $800 to $999 | 28 (6.2%) | 8 (0.7%) |
| $1,000 to $1,499 | 39 (8.6%) | 302 (24.9%) |
| $1,500 to $1,999 | 23 (5.1%) | 184 (15.2%) |
| $2,000 to $2,499 | 93 (20.6%) | 435 (35.9%) |
| $2,500 to $2,999 | 23 (5.1%) | 60 (5.0%) |
| $3,000 or more | 91 (20.2%) | 64 (5.3%) |
| Total | 451 (100.0%) | 1,212 (100.0%) |
Physical Housing Characteristics in Stock Island
Housing Structures in Stock Island
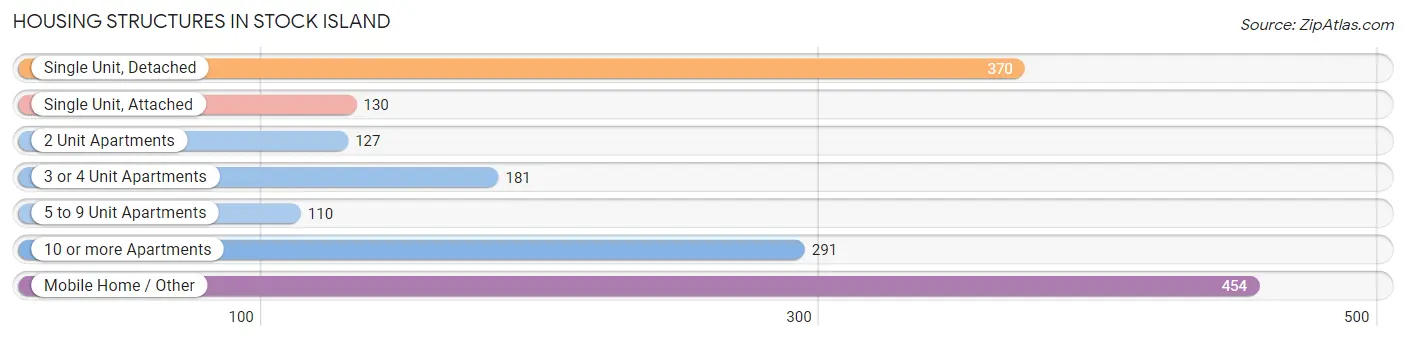
| Structure Type | # Housing Units | % Housing Units |
| Single Unit, Detached | 370 | 22.3% |
| Single Unit, Attached | 130 | 7.8% |
| 2 Unit Apartments | 127 | 7.6% |
| 3 or 4 Unit Apartments | 181 | 10.9% |
| 5 to 9 Unit Apartments | 110 | 6.6% |
| 10 or more Apartments | 291 | 17.5% |
| Mobile Home / Other | 454 | 27.3% |
| Total | 1,663 | 100.0% |
Housing Structures by Occupancy in Stock Island
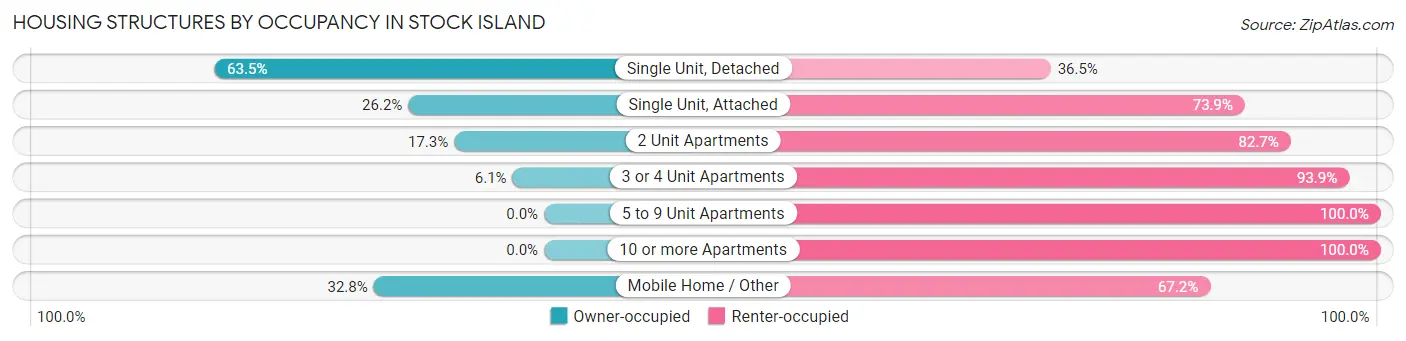
| Structure Type | Owner-occupied | Renter-occupied |
| Single Unit, Detached | 235 (63.5%) | 135 (36.5%) |
| Single Unit, Attached | 34 (26.2%) | 96 (73.9%) |
| 2 Unit Apartments | 22 (17.3%) | 105 (82.7%) |
| 3 or 4 Unit Apartments | 11 (6.1%) | 170 (93.9%) |
| 5 to 9 Unit Apartments | 0 (0.0%) | 110 (100.0%) |
| 10 or more Apartments | 0 (0.0%) | 291 (100.0%) |
| Mobile Home / Other | 149 (32.8%) | 305 (67.2%) |
| Total | 451 (27.1%) | 1,212 (72.9%) |
Housing Structures by Number of Rooms in Stock Island
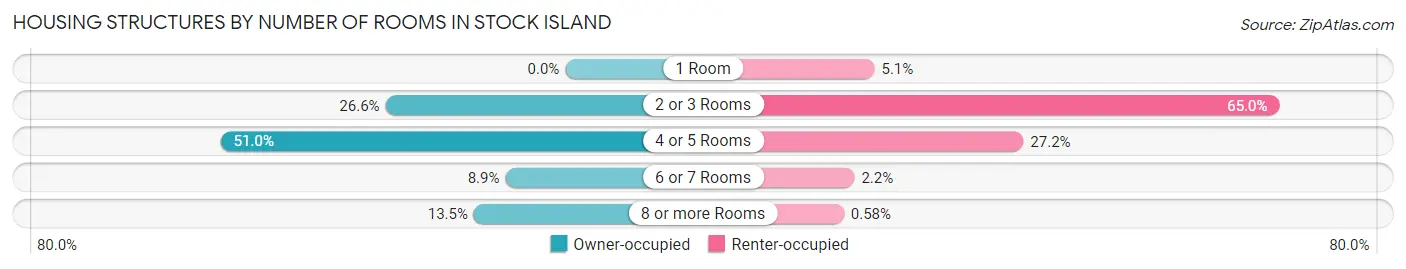
| Number of Rooms | Owner-occupied | Renter-occupied |
| 1 Room | 0 (0.0%) | 62 (5.1%) |
| 2 or 3 Rooms | 120 (26.6%) | 788 (65.0%) |
| 4 or 5 Rooms | 230 (51.0%) | 329 (27.2%) |
| 6 or 7 Rooms | 40 (8.9%) | 26 (2.1%) |
| 8 or more Rooms | 61 (13.5%) | 7 (0.6%) |
| Total | 451 (100.0%) | 1,212 (100.0%) |
Housing Structure by Heating Type in Stock Island
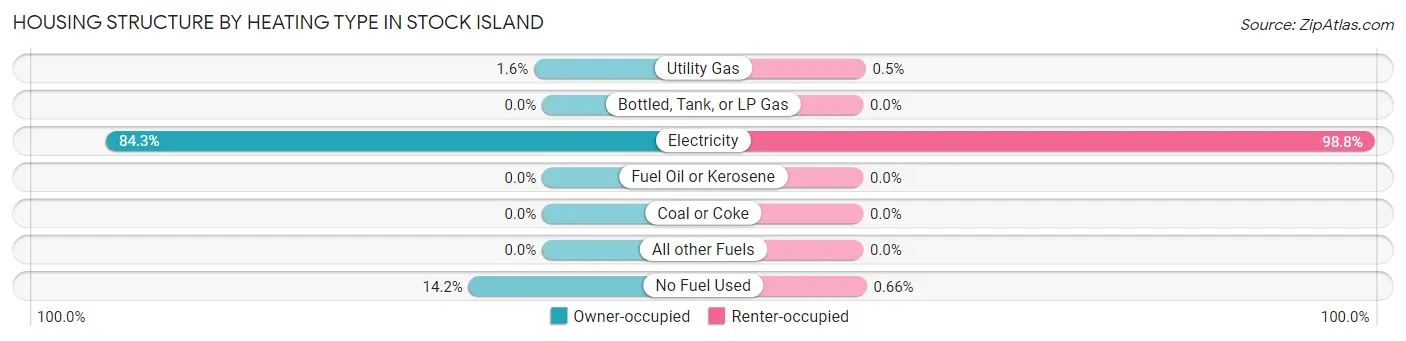
| Heating Type | Owner-occupied | Renter-occupied |
| Utility Gas | 7 (1.5%) | 6 (0.5%) |
| Bottled, Tank, or LP Gas | 0 (0.0%) | 0 (0.0%) |
| Electricity | 380 (84.3%) | 1,198 (98.8%) |
| Fuel Oil or Kerosene | 0 (0.0%) | 0 (0.0%) |
| Coal or Coke | 0 (0.0%) | 0 (0.0%) |
| All other Fuels | 0 (0.0%) | 0 (0.0%) |
| No Fuel Used | 64 (14.2%) | 8 (0.7%) |
| Total | 451 (100.0%) | 1,212 (100.0%) |
Household Vehicle Usage in Stock Island
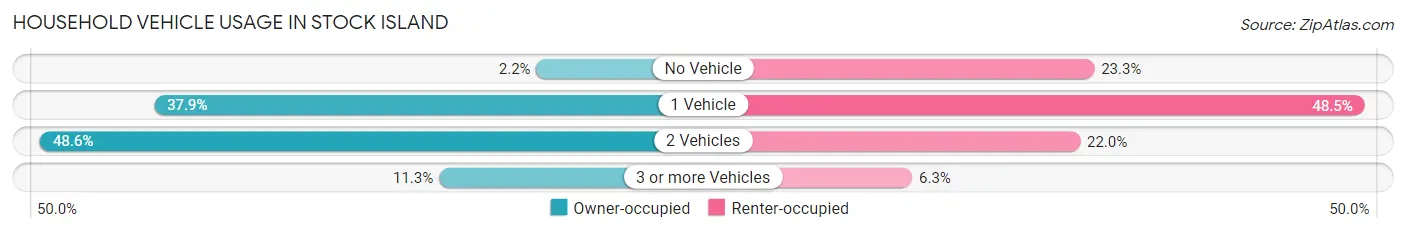
| Vehicles per Household | Owner-occupied | Renter-occupied |
| No Vehicle | 10 (2.2%) | 282 (23.3%) |
| 1 Vehicle | 171 (37.9%) | 588 (48.5%) |
| 2 Vehicles | 219 (48.6%) | 266 (22.0%) |
| 3 or more Vehicles | 51 (11.3%) | 76 (6.3%) |
| Total | 451 (100.0%) | 1,212 (100.0%) |
Real Estate & Mortgages in Stock Island
Real Estate and Mortgage Overview in Stock Island
| Characteristic | Without Mortgage | With Mortgage |
| Housing Units | 185 | 266 |
| Median Property Value | $319,000 | $444,400 |
| Median Household Income | $82,386 | $62 |
| Monthly Housing Costs | $491 | $91 |
| Real Estate Taxes | $1,102 | $0 |
Property Value by Mortgage Status in Stock Island
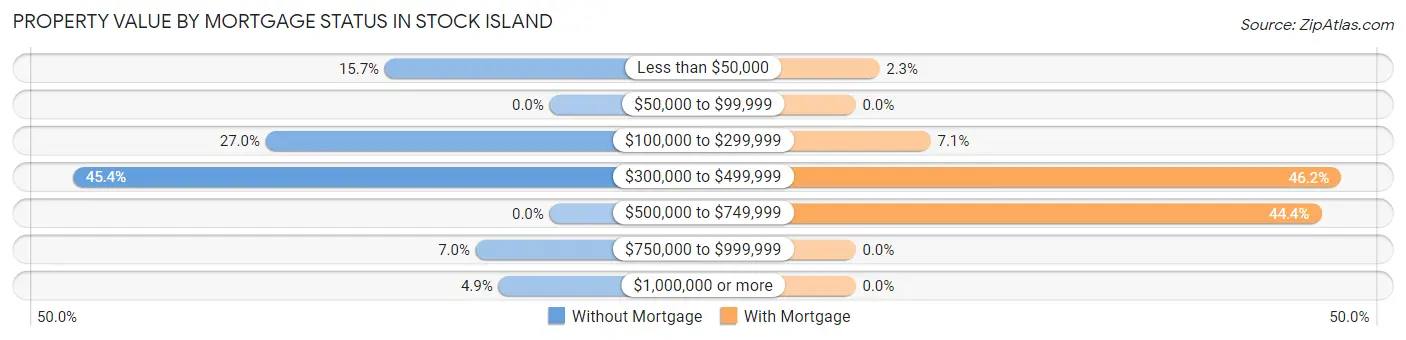
| Property Value | Without Mortgage | With Mortgage |
| Less than $50,000 | 29 (15.7%) | 6 (2.3%) |
| $50,000 to $99,999 | 0 (0.0%) | 0 (0.0%) |
| $100,000 to $299,999 | 50 (27.0%) | 19 (7.1%) |
| $300,000 to $499,999 | 84 (45.4%) | 123 (46.2%) |
| $500,000 to $749,999 | 0 (0.0%) | 118 (44.4%) |
| $750,000 to $999,999 | 13 (7.0%) | 0 (0.0%) |
| $1,000,000 or more | 9 (4.9%) | 0 (0.0%) |
| Total | 185 (100.0%) | 266 (100.0%) |
Household Income by Mortgage Status in Stock Island
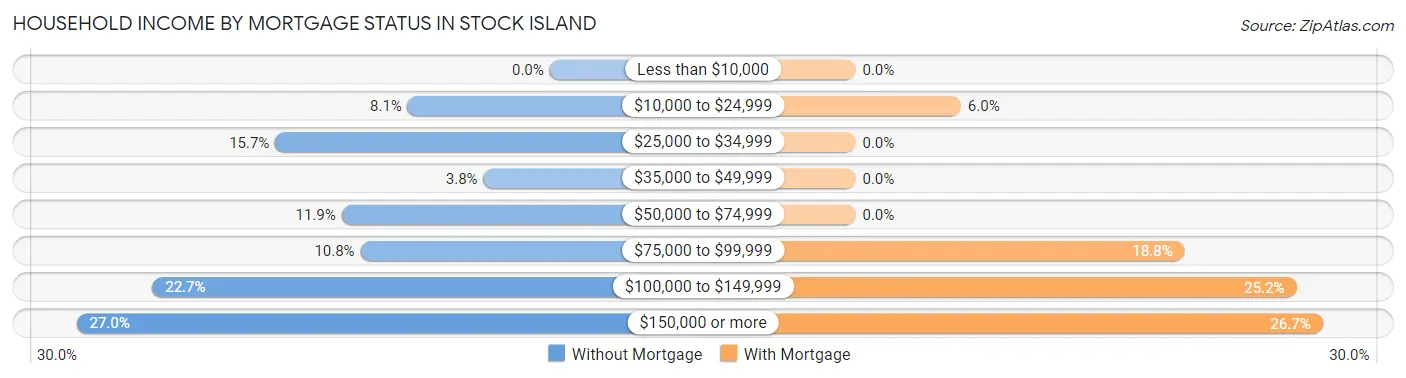
| Household Income | Without Mortgage | With Mortgage |
| Less than $10,000 | 0 (0.0%) | 0 (0.0%) |
| $10,000 to $24,999 | 15 (8.1%) | 16 (6.0%) |
| $25,000 to $34,999 | 29 (15.7%) | 0 (0.0%) |
| $35,000 to $49,999 | 7 (3.8%) | 0 (0.0%) |
| $50,000 to $74,999 | 22 (11.9%) | 0 (0.0%) |
| $75,000 to $99,999 | 20 (10.8%) | 50 (18.8%) |
| $100,000 to $149,999 | 42 (22.7%) | 67 (25.2%) |
| $150,000 or more | 50 (27.0%) | 71 (26.7%) |
| Total | 185 (100.0%) | 266 (100.0%) |
Property Value to Household Income Ratio in Stock Island
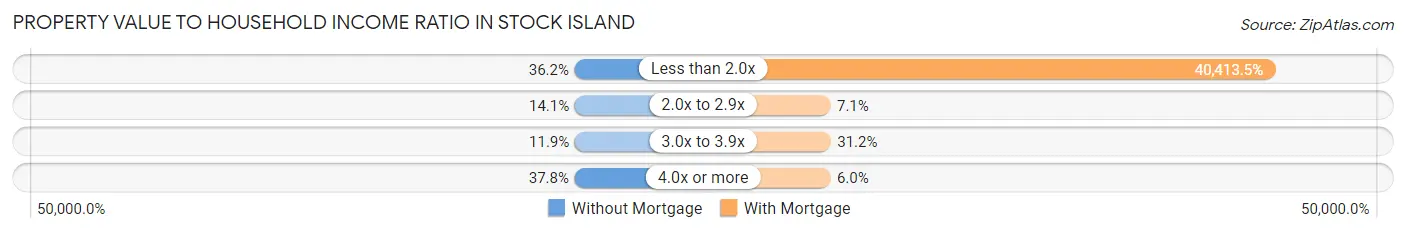
| Value-to-Income Ratio | Without Mortgage | With Mortgage |
| Less than 2.0x | 67 (36.2%) | 107,500 (40,413.5%) |
| 2.0x to 2.9x | 26 (14.1%) | 19 (7.1%) |
| 3.0x to 3.9x | 22 (11.9%) | 83 (31.2%) |
| 4.0x or more | 70 (37.8%) | 16 (6.0%) |
| Total | 185 (100.0%) | 266 (100.0%) |
Real Estate Taxes by Mortgage Status in Stock Island
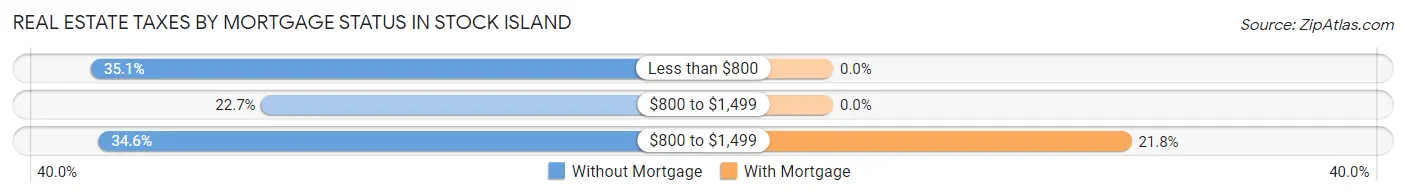
| Property Taxes | Without Mortgage | With Mortgage |
| Less than $800 | 65 (35.1%) | 0 (0.0%) |
| $800 to $1,499 | 42 (22.7%) | 0 (0.0%) |
| $800 to $1,499 | 64 (34.6%) | 58 (21.8%) |
| Total | 185 (100.0%) | 266 (100.0%) |
Health & Disability in Stock Island
Health Insurance Coverage by Age in Stock Island
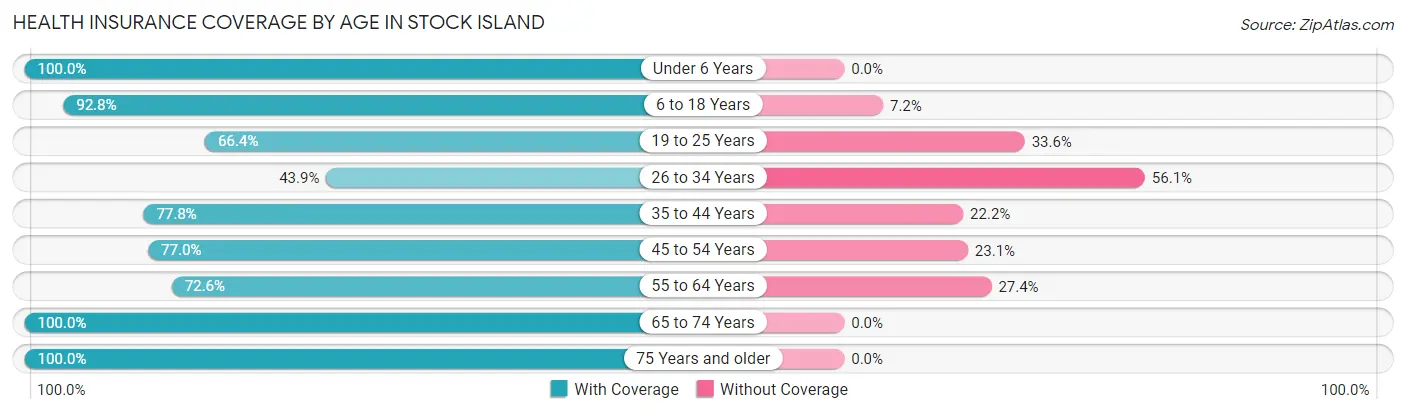
| Age Bracket | With Coverage | Without Coverage |
| Under 6 Years | 520 (100.0%) | 0 (0.0%) |
| 6 to 18 Years | 604 (92.8%) | 47 (7.2%) |
| 19 to 25 Years | 292 (66.4%) | 148 (33.6%) |
| 26 to 34 Years | 326 (43.9%) | 416 (56.1%) |
| 35 to 44 Years | 611 (77.8%) | 174 (22.2%) |
| 45 to 54 Years | 424 (76.9%) | 127 (23.1%) |
| 55 to 64 Years | 275 (72.6%) | 104 (27.4%) |
| 65 to 74 Years | 333 (100.0%) | 0 (0.0%) |
| 75 Years and older | 163 (100.0%) | 0 (0.0%) |
| Total | 3,548 (77.7%) | 1,016 (22.3%) |
Health Insurance Coverage by Citizenship Status in Stock Island
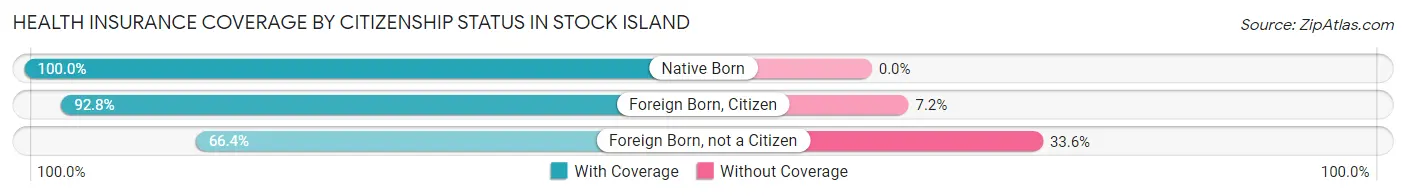
| Citizenship Status | With Coverage | Without Coverage |
| Native Born | 520 (100.0%) | 0 (0.0%) |
| Foreign Born, Citizen | 604 (92.8%) | 47 (7.2%) |
| Foreign Born, not a Citizen | 292 (66.4%) | 148 (33.6%) |
Health Insurance Coverage by Household Income in Stock Island
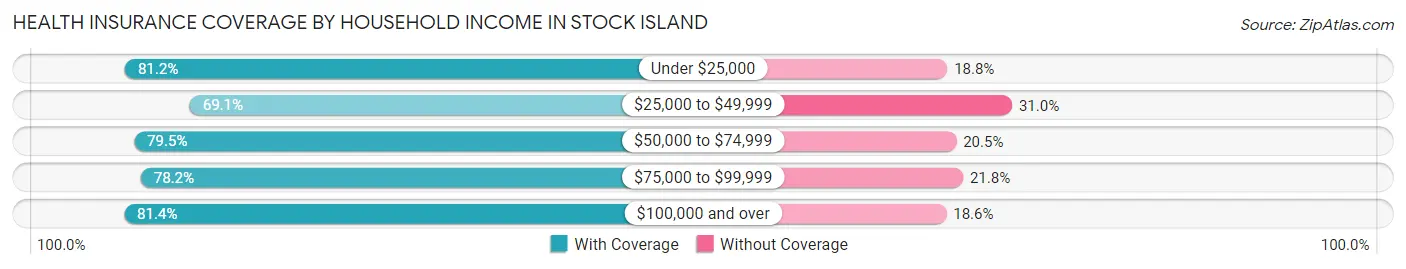
| Household Income | With Coverage | Without Coverage |
| Under $25,000 | 544 (81.2%) | 126 (18.8%) |
| $25,000 to $49,999 | 658 (69.1%) | 295 (30.9%) |
| $50,000 to $74,999 | 640 (79.5%) | 165 (20.5%) |
| $75,000 to $99,999 | 776 (78.2%) | 216 (21.8%) |
| $100,000 and over | 930 (81.4%) | 213 (18.6%) |
Public vs Private Health Insurance Coverage by Age in Stock Island
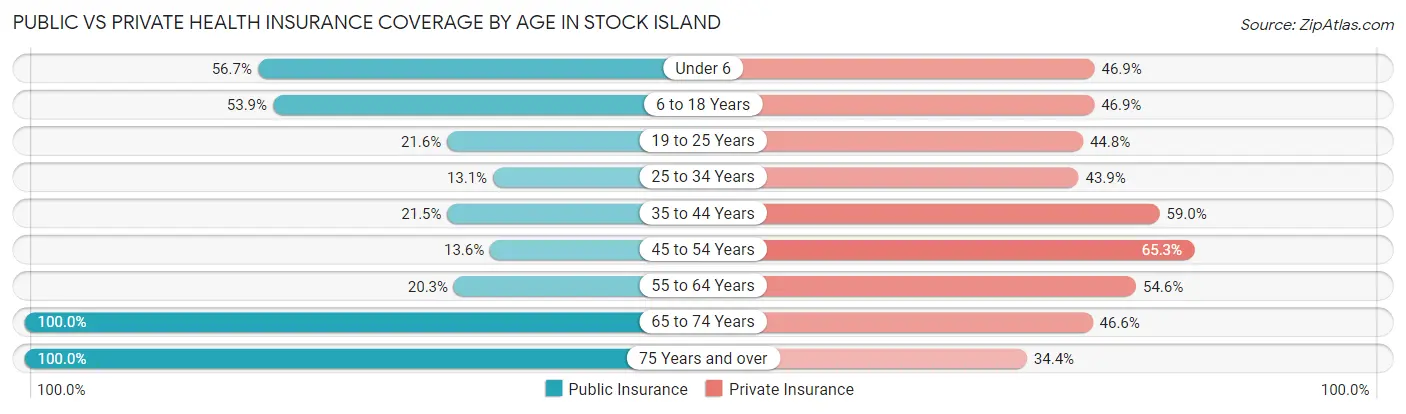
| Age Bracket | Public Insurance | Private Insurance |
| Under 6 | 295 (56.7%) | 244 (46.9%) |
| 6 to 18 Years | 351 (53.9%) | 305 (46.9%) |
| 19 to 25 Years | 95 (21.6%) | 197 (44.8%) |
| 25 to 34 Years | 97 (13.1%) | 326 (43.9%) |
| 35 to 44 Years | 169 (21.5%) | 463 (59.0%) |
| 45 to 54 Years | 75 (13.6%) | 360 (65.3%) |
| 55 to 64 Years | 77 (20.3%) | 207 (54.6%) |
| 65 to 74 Years | 333 (100.0%) | 155 (46.6%) |
| 75 Years and over | 163 (100.0%) | 56 (34.4%) |
| Total | 1,655 (36.3%) | 2,313 (50.7%) |
Disability Status by Sex by Age in Stock Island
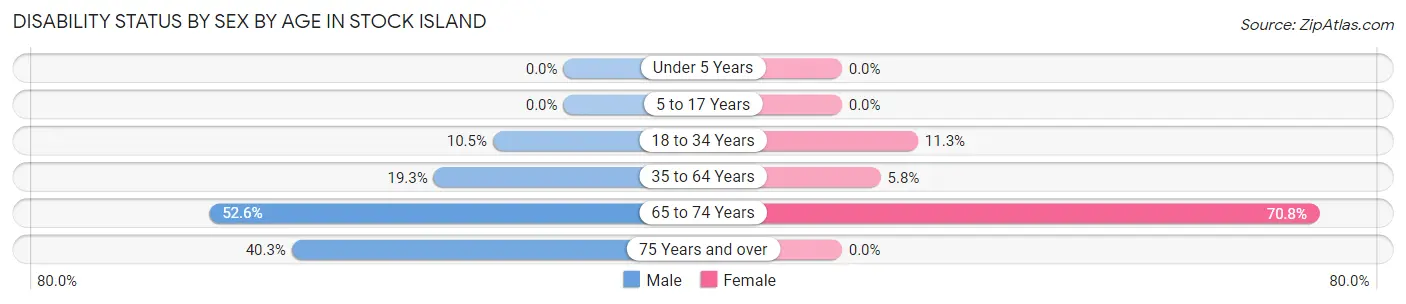
| Age Bracket | Male | Female |
| Under 5 Years | 0 (0.0%) | 0 (0.0%) |
| 5 to 17 Years | 0 (0.0%) | 0 (0.0%) |
| 18 to 34 Years | 65 (10.5%) | 68 (11.3%) |
| 35 to 64 Years | 143 (19.3%) | 56 (5.8%) |
| 65 to 74 Years | 112 (52.6%) | 85 (70.8%) |
| 75 Years and over | 48 (40.3%) | 0 (0.0%) |
Disability Class by Sex by Age in Stock Island
Disability Class: Hearing Difficulty
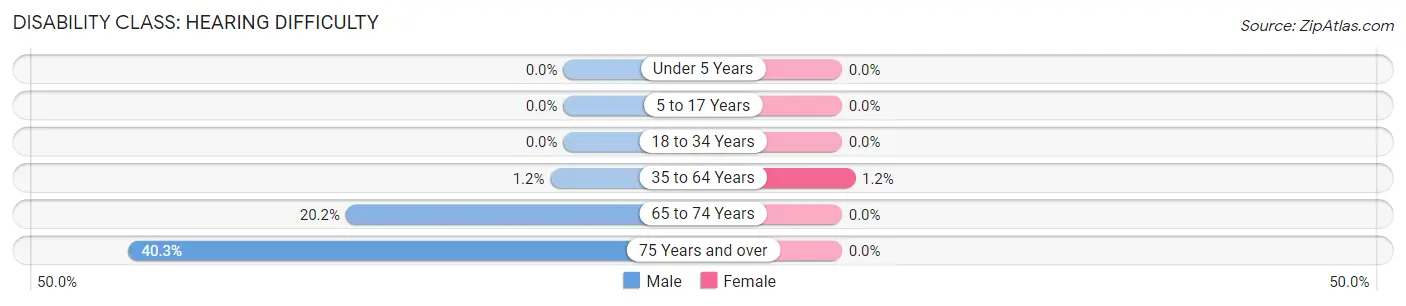
| Age Bracket | Male | Female |
| Under 5 Years | 0 (0.0%) | 0 (0.0%) |
| 5 to 17 Years | 0 (0.0%) | 0 (0.0%) |
| 18 to 34 Years | 0 (0.0%) | 0 (0.0%) |
| 35 to 64 Years | 9 (1.2%) | 12 (1.2%) |
| 65 to 74 Years | 43 (20.2%) | 0 (0.0%) |
| 75 Years and over | 48 (40.3%) | 0 (0.0%) |
Disability Class: Vision Difficulty
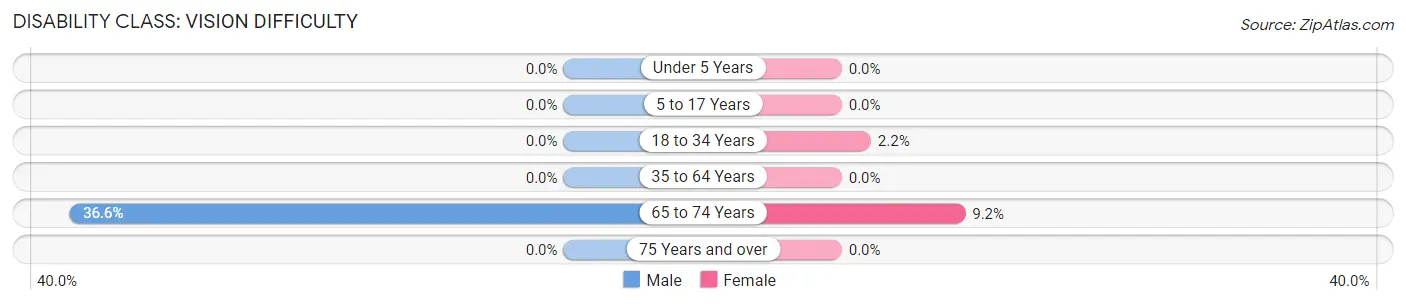
| Age Bracket | Male | Female |
| Under 5 Years | 0 (0.0%) | 0 (0.0%) |
| 5 to 17 Years | 0 (0.0%) | 0 (0.0%) |
| 18 to 34 Years | 0 (0.0%) | 13 (2.2%) |
| 35 to 64 Years | 0 (0.0%) | 0 (0.0%) |
| 65 to 74 Years | 78 (36.6%) | 11 (9.2%) |
| 75 Years and over | 0 (0.0%) | 0 (0.0%) |
Disability Class: Cognitive Difficulty
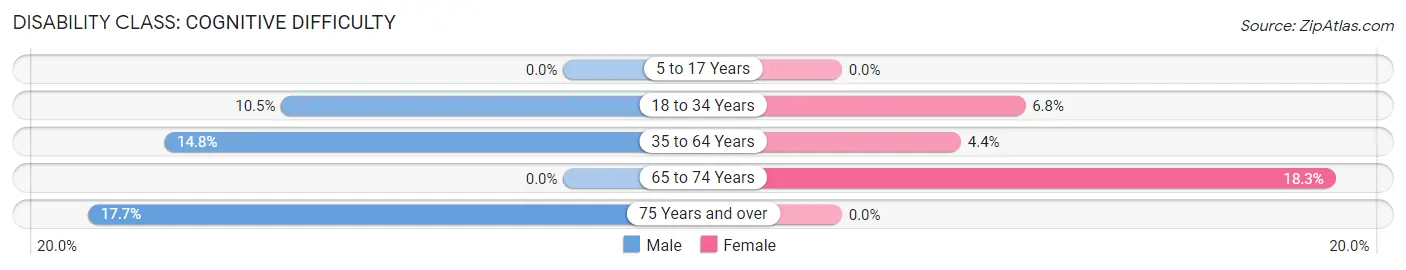
| Age Bracket | Male | Female |
| 5 to 17 Years | 0 (0.0%) | 0 (0.0%) |
| 18 to 34 Years | 65 (10.5%) | 41 (6.8%) |
| 35 to 64 Years | 110 (14.8%) | 43 (4.4%) |
| 65 to 74 Years | 0 (0.0%) | 22 (18.3%) |
| 75 Years and over | 21 (17.6%) | 0 (0.0%) |
Disability Class: Ambulatory Difficulty
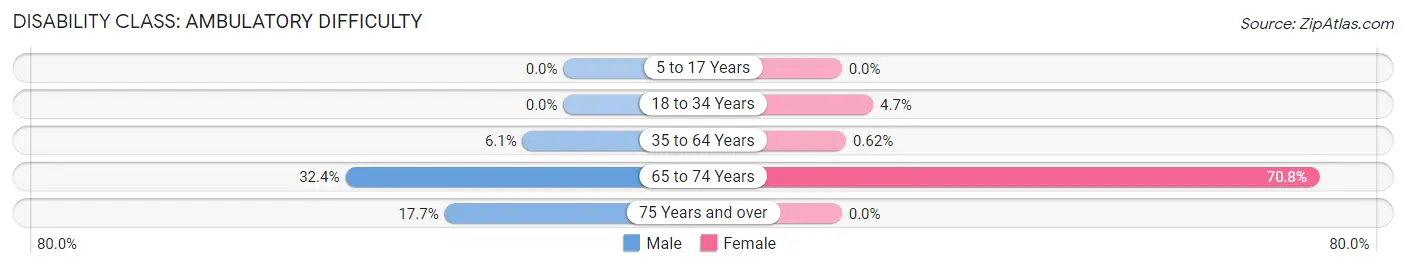
| Age Bracket | Male | Female |
| 5 to 17 Years | 0 (0.0%) | 0 (0.0%) |
| 18 to 34 Years | 0 (0.0%) | 28 (4.6%) |
| 35 to 64 Years | 45 (6.1%) | 6 (0.6%) |
| 65 to 74 Years | 69 (32.4%) | 85 (70.8%) |
| 75 Years and over | 21 (17.6%) | 0 (0.0%) |
Disability Class: Self-Care Difficulty
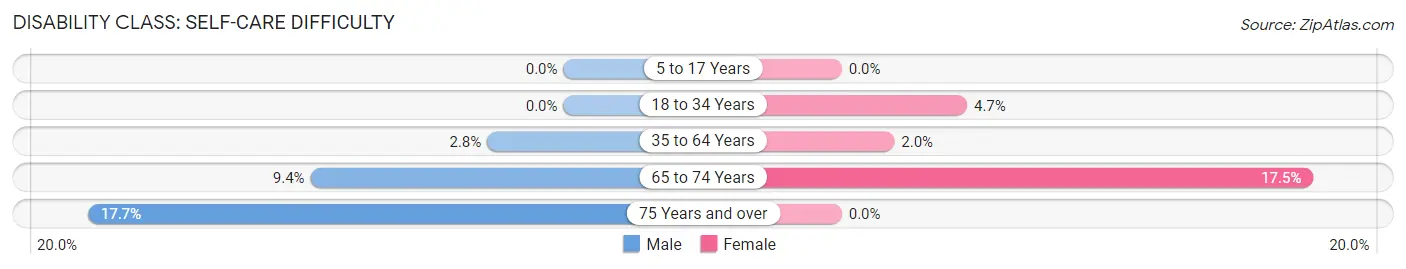
| Age Bracket | Male | Female |
| 5 to 17 Years | 0 (0.0%) | 0 (0.0%) |
| 18 to 34 Years | 0 (0.0%) | 28 (4.6%) |
| 35 to 64 Years | 21 (2.8%) | 19 (1.9%) |
| 65 to 74 Years | 20 (9.4%) | 21 (17.5%) |
| 75 Years and over | 21 (17.6%) | 0 (0.0%) |
Technology Access in Stock Island
Computing Device Access in Stock Island
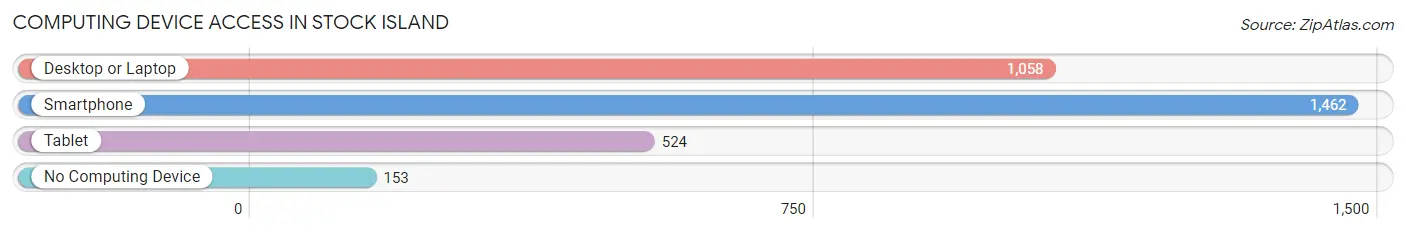
| Device Type | # Households | % Households |
| Desktop or Laptop | 1,058 | 63.6% |
| Smartphone | 1,462 | 87.9% |
| Tablet | 524 | 31.5% |
| No Computing Device | 153 | 9.2% |
| Total | 1,663 | 100.0% |
Internet Access in Stock Island
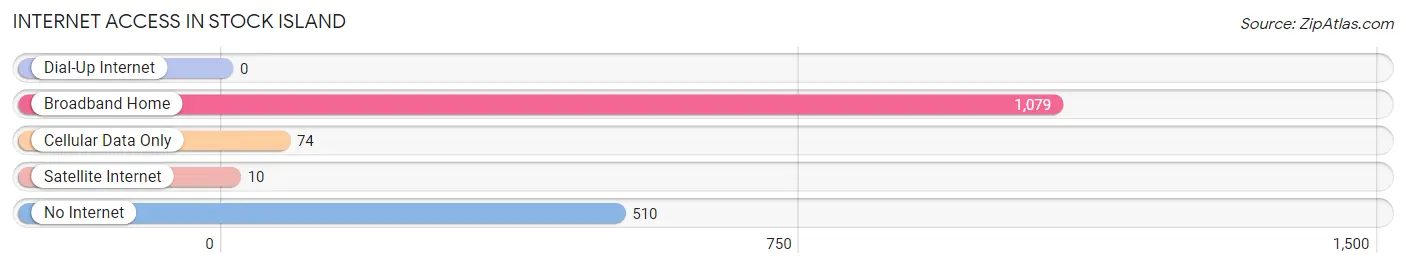
| Internet Type | # Households | % Households |
| Dial-Up Internet | 0 | 0.0% |
| Broadband Home | 1,079 | 64.9% |
| Cellular Data Only | 74 | 4.4% |
| Satellite Internet | 10 | 0.6% |
| No Internet | 510 | 30.7% |
| Total | 1,663 | 100.0% |
Stock Island Summary
History
Stock Island is a small island located in the Florida Keys, just off the coast of Key West. It is part of Monroe County and is connected to Key West by a bridge. The island has a long and varied history, beginning with its first inhabitants, the Calusa Indians, who lived on the island for centuries before the arrival of Europeans.
The first Europeans to visit Stock Island were Spanish explorers in the 16th century. They named the island “Cayo de Pescado”, or “Fish Key”, due to the abundance of fish in the surrounding waters. The island was later renamed “Stock Island” by the British, who used it as a base for their naval operations in the Caribbean.
In the 19th century, Stock Island became a popular destination for fishermen and shrimpers. The island was also home to a number of saloons and brothels, as well as a number of small businesses. In the early 20th century, the island was home to a large Cuban population, who worked in the fishing and shrimping industries.
In the 1950s, Stock Island began to experience a period of rapid growth and development. The island was home to a number of resorts, marinas, and other businesses. In the 1960s, the island was home to a large military base, which was used by the U.S. Navy and Coast Guard.
Today, Stock Island is a popular tourist destination, with a number of resorts, restaurants, and other businesses. The island is also home to a large number of marinas, which are popular with boaters and fishermen.
Geography
Stock Island is located in the Florida Keys, just off the coast of Key West. The island is approximately 4.5 miles long and 1.5 miles wide, with a total area of 6.2 square miles. The island is connected to Key West by a bridge, and is surrounded by the Gulf of Mexico to the west and the Atlantic Ocean to the east.
The island is mostly flat, with an elevation of just 3 feet above sea level. The island is home to a number of small creeks and wetlands, which provide habitat for a variety of wildlife. The island is also home to a number of mangrove forests, which provide habitat for a variety of birds and other wildlife.
Economy
Stock Island is home to a number of businesses, including resorts, restaurants, marinas, and other tourist-related businesses. The island is also home to a number of commercial fishing operations, which provide seafood to local restaurants and markets.
The island is also home to a number of military installations, including the Naval Air Station Key West and the Coast Guard Air Station Key West. These installations provide a significant economic boost to the island, as well as employment opportunities for local residents.
Demographics
As of the 2010 census, Stock Island had a population of 5,265. The population is predominantly white (77.3%), with a small Hispanic population (17.2%). The median household income is $45,945, and the median age is 44.
The island is home to a number of churches, including the Stock Island Baptist Church, the Stock Island Methodist Church, and the Stock Island Catholic Church. The island is also home to a number of schools, including the Stock Island Elementary School and the Stock Island Middle School.
Conclusion
Stock Island is a small island located in the Florida Keys, just off the coast of Key West. The island has a long and varied history, beginning with its first inhabitants, the Calusa Indians. Today, Stock Island is a popular tourist destination, with a number of resorts, restaurants, and other businesses. The island is also home to a number of military installations, which provide a significant economic boost to the island. The population of Stock Island is predominantly white, with a small Hispanic population. The island is home to a number of churches, schools, and other businesses.
Common Questions
What is Per Capita Income in Stock Island?
Per Capita income in Stock Island is $29,501.
What is the Median Family Income in Stock Island?
Median Family Income in Stock Island is $62,135.
What is the Median Household income in Stock Island?
Median Household Income in Stock Island is $62,309.
What is Income or Wage Gap in Stock Island?
Income or Wage Gap in Stock Island is 33.3%.
Women in Stock Island earn 66.7 cents for every dollar earned by a man.
What is Inequality or Gini Index in Stock Island?
Inequality or Gini Index in Stock Island is 0.45.
What is the Total Population of Stock Island?
Total Population of Stock Island is 4,564.
What is the Total Male Population of Stock Island?
Total Male Population of Stock Island is 2,207.
What is the Total Female Population of Stock Island?
Total Female Population of Stock Island is 2,357.
What is the Ratio of Males per 100 Females in Stock Island?
There are 93.64 Males per 100 Females in Stock Island.
What is the Ratio of Females per 100 Males in Stock Island?
There are 106.80 Females per 100 Males in Stock Island.
What is the Median Population Age in Stock Island?
Median Population Age in Stock Island is 34.6 Years.
What is the Average Family Size in Stock Island
Average Family Size in Stock Island is 3.2 People.
What is the Average Household Size in Stock Island
Average Household Size in Stock Island is 2.7 People.
How Large is the Labor Force in Stock Island?
There are 2,501 People in the Labor Forcein in Stock Island.
What is the Percentage of People in the Labor Force in Stock Island?
70.5% of People are in the Labor Force in Stock Island.
What is the Unemployment Rate in Stock Island?
Unemployment Rate in Stock Island is 1.6%.