Harlem, FL Map & Demographics
Harlem Map
Harlem Overview
$17,966
PER CAPITA INCOME
$81,630
AVG FAMILY INCOME
0.36
INEQUALITY / GINI INDEX
2,576
TOTAL POPULATION
868
MALE POPULATION
1,708
FEMALE POPULATION
50.82
MALES / 100 FEMALES
196.77
FEMALES / 100 MALES
27.4
MEDIAN AGE
4.0
AVG FAMILY SIZE
2.9
AVG HOUSEHOLD SIZE
1,233
LABOR FORCE [ PEOPLE ]
67.8%
PERCENT IN LABOR FORCE
16.6%
UNEMPLOYMENT RATE
Income in Harlem
Income Overview in Harlem
| Characteristic | Number | Measure |
| Per Capita Income | 2,576 | $17,966 |
| Median Family Income | 556 | $81,630 |
| Mean Family Income | 556 | $64,497 |
| Median Household Income | 875 | $0 |
| Mean Household Income | 875 | $53,950 |
| Income Deficit | 556 | $0 |
| Wage / Income Gap (%) | 2,576 | 0.00% |
| Wage / Income Gap ($) | 2,576 | 100.00¢ per $1 |
| Gini / Inequality Index | 2,576 | 0.36 |
Earnings by Sex in Harlem
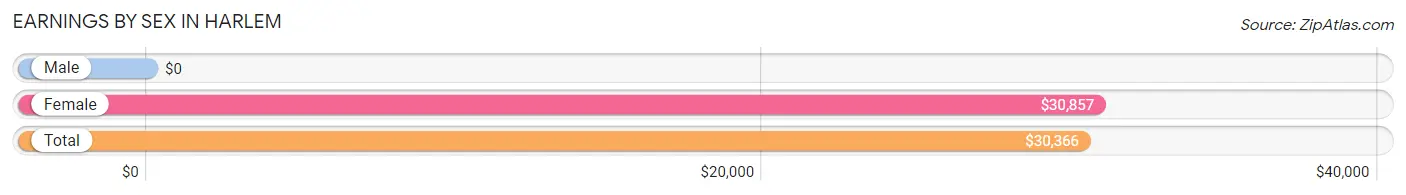
| Sex | Number | Average Earnings |
| Male | 499 (44.0%) | $0 |
| Female | 634 (56.0%) | $30,857 |
| Total | 1,133 (100.0%) | $30,366 |
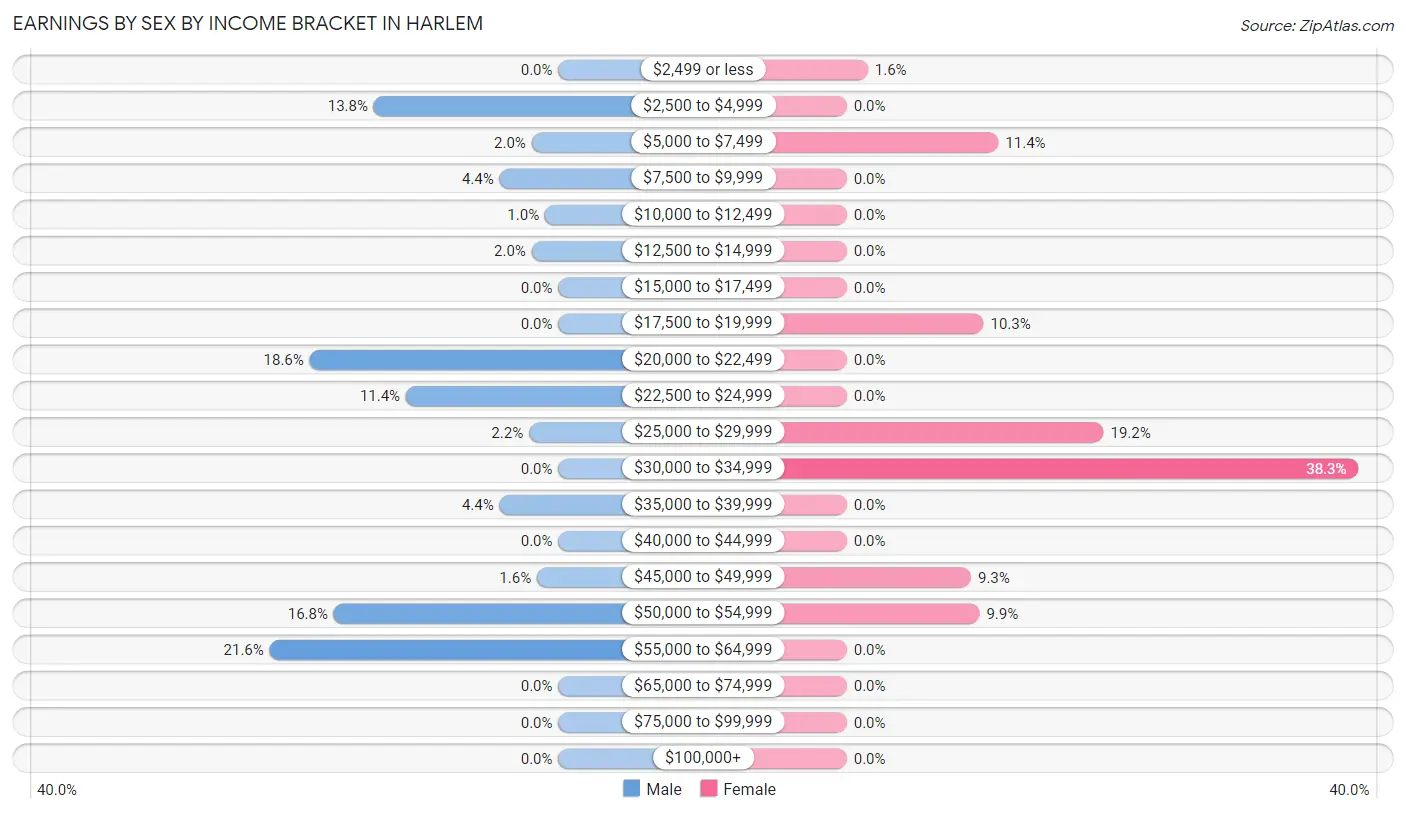
Earnings by Sex by Income Bracket in Harlem
The most common earnings brackets in Harlem are $55,000 to $64,999 for men (108 | 21.6%) and $30,000 to $34,999 for women (243 | 38.3%).
| Income | Male | Female |
| $2,499 or less | 0 (0.0%) | 10 (1.6%) |
| $2,500 to $4,999 | 69 (13.8%) | 0 (0.0%) |
| $5,000 to $7,499 | 10 (2.0%) | 72 (11.4%) |
| $7,500 to $9,999 | 22 (4.4%) | 0 (0.0%) |
| $10,000 to $12,499 | 5 (1.0%) | 0 (0.0%) |
| $12,500 to $14,999 | 10 (2.0%) | 0 (0.0%) |
| $15,000 to $17,499 | 0 (0.0%) | 0 (0.0%) |
| $17,500 to $19,999 | 0 (0.0%) | 65 (10.2%) |
| $20,000 to $22,499 | 93 (18.6%) | 0 (0.0%) |
| $22,500 to $24,999 | 57 (11.4%) | 0 (0.0%) |
| $25,000 to $29,999 | 11 (2.2%) | 122 (19.2%) |
| $30,000 to $34,999 | 0 (0.0%) | 243 (38.3%) |
| $35,000 to $39,999 | 22 (4.4%) | 0 (0.0%) |
| $40,000 to $44,999 | 0 (0.0%) | 0 (0.0%) |
| $45,000 to $49,999 | 8 (1.6%) | 59 (9.3%) |
| $50,000 to $54,999 | 84 (16.8%) | 63 (9.9%) |
| $55,000 to $64,999 | 108 (21.6%) | 0 (0.0%) |
| $65,000 to $74,999 | 0 (0.0%) | 0 (0.0%) |
| $75,000 to $99,999 | 0 (0.0%) | 0 (0.0%) |
| $100,000+ | 0 (0.0%) | 0 (0.0%) |
| Total | 499 (100.0%) | 634 (100.0%) |
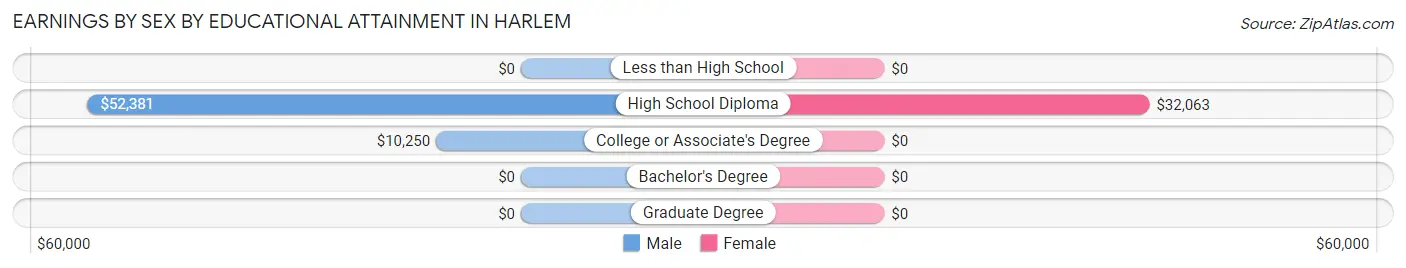
Earnings by Sex by Educational Attainment in Harlem
Average earnings in Harlem are $51,622 for men and $30,857 for women, a difference of 40.2%. Men with an educational attainment of high school diploma enjoy the highest average annual earnings of $52,381, while those with college or associate's degree education earn the least with $10,250. Women with an educational attainment of high school diploma earn the most with the average annual earnings of $32,063, while those with high school diploma education have the smallest earnings of $32,063.
| Educational Attainment | Male Income | Female Income |
| Less than High School | - | - |
| High School Diploma | $52,381 | $32,063 |
| College or Associate's Degree | $10,250 | $0 |
| Bachelor's Degree | - | - |
| Graduate Degree | - | - |
| Total | $51,622 | $30,857 |
Family Income in Harlem
Family Income Brackets in Harlem
According to the Harlem family income data, there are 249 families falling into the $75,000 to $99,999 income range, which is the most common income bracket and makes up 44.8% of all families.
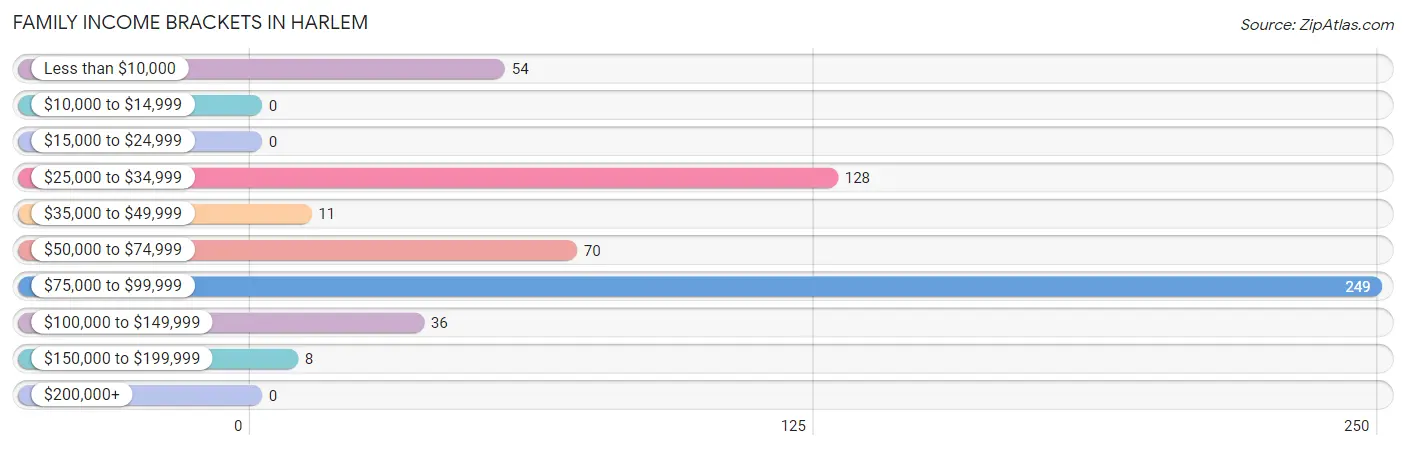
| Income Bracket | # Families | % Families |
| Less than $10,000 | 54 | 9.7% |
| $10,000 to $14,999 | 0 | 0.0% |
| $15,000 to $24,999 | 0 | 0.0% |
| $25,000 to $34,999 | 128 | 23.0% |
| $35,000 to $49,999 | 11 | 2.0% |
| $50,000 to $74,999 | 70 | 12.6% |
| $75,000 to $99,999 | 249 | 44.8% |
| $100,000 to $149,999 | 36 | 6.5% |
| $150,000 to $199,999 | 8 | 1.4% |
| $200,000+ | 0 | 0.0% |
Family Income by Famaliy Size in Harlem
4-person families (151 | 27.2%) account for the highest median family income in Harlem with $82,991 per family, while 4-person families (151 | 27.2%) have the highest median income of $20,748 per family member.
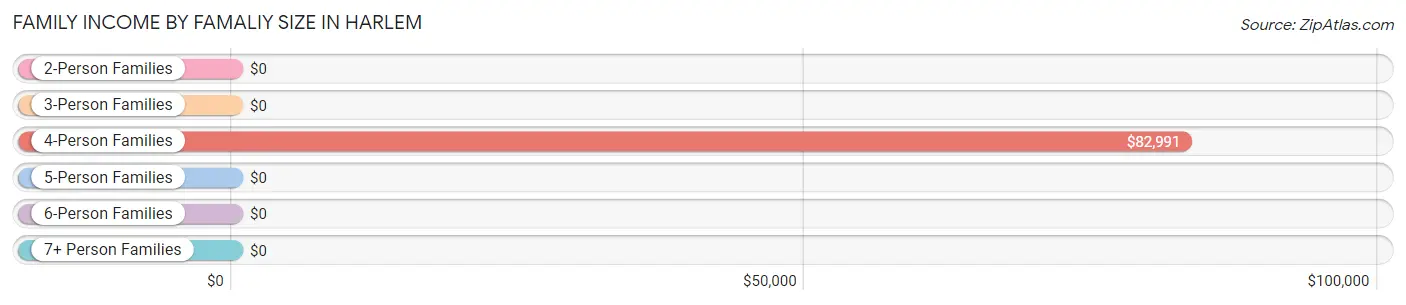
| Income Bracket | # Families | Median Income |
| 2-Person Families | 191 (34.4%) | $0 |
| 3-Person Families | 191 (34.4%) | $0 |
| 4-Person Families | 151 (27.2%) | $82,991 |
| 5-Person Families | 0 (0.0%) | $0 |
| 6-Person Families | 0 (0.0%) | $0 |
| 7+ Person Families | 23 (4.1%) | $0 |
| Total | 556 (100.0%) | $81,630 |
Family Income by Number of Earners in Harlem
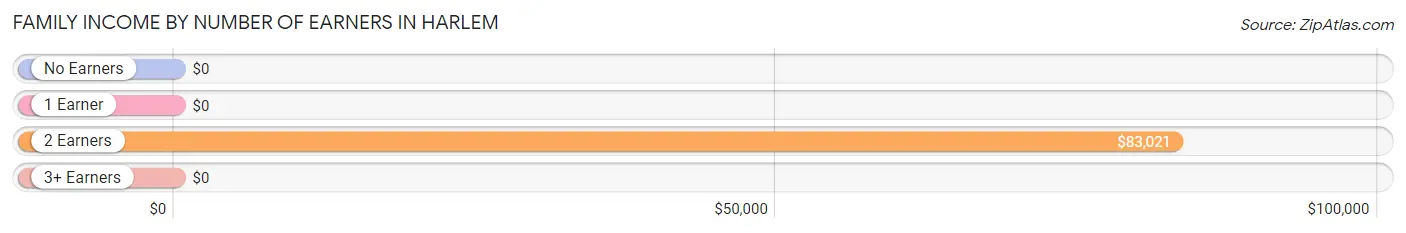
| Number of Earners | # Families | Median Income |
| No Earners | 67 (12.0%) | $0 |
| 1 Earner | 177 (31.8%) | $0 |
| 2 Earners | 281 (50.5%) | $83,021 |
| 3+ Earners | 31 (5.6%) | $0 |
| Total | 556 (100.0%) | $81,630 |
Household Income in Harlem
Household Income Brackets in Harlem
With 298 households falling in the category, the $75,000 to $99,999 income range is the most frequent in Harlem, accounting for 34.1% of all households.
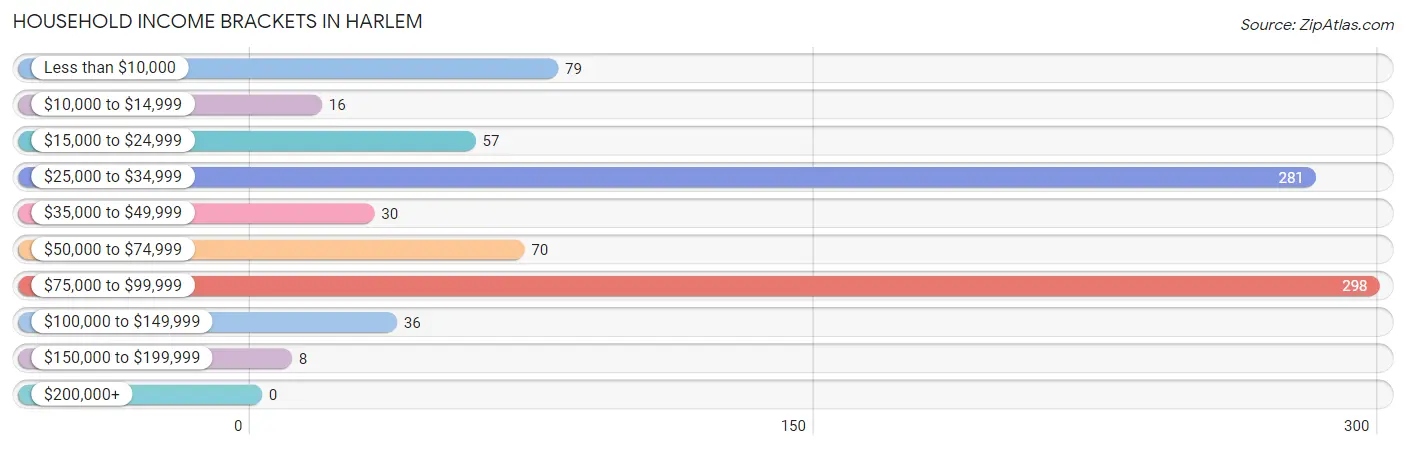
| Income Bracket | # Households | % Households |
| Less than $10,000 | 79 | 9.0% |
| $10,000 to $14,999 | 16 | 1.8% |
| $15,000 to $24,999 | 57 | 6.5% |
| $25,000 to $34,999 | 281 | 32.1% |
| $35,000 to $49,999 | 30 | 3.4% |
| $50,000 to $74,999 | 70 | 8.0% |
| $75,000 to $99,999 | 298 | 34.1% |
| $100,000 to $149,999 | 36 | 4.1% |
| $150,000 to $199,999 | 8 | 0.9% |
| $200,000+ | 0 | 0.0% |
Household Income by Householder Age in Harlem
The median household income in Harlem is $0, with the highest median household income of $88,801 found in the 65+ years age bracket for the primary householder. A total of 267 households (30.5%) fall into this category. Meanwhile, the 15 to 24 years age bracket for the primary householder has the lowest median household income of $0, with 57 households (6.5%) in this group.
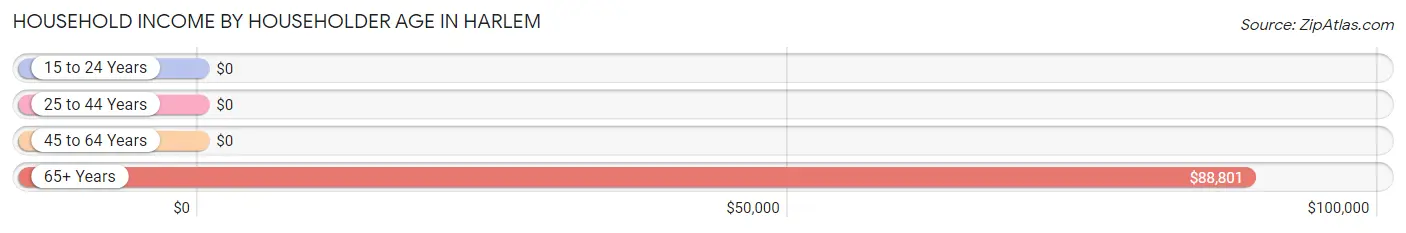
| Income Bracket | # Households | Median Income |
| 15 to 24 Years | 57 (6.5%) | $0 |
| 25 to 44 Years | 171 (19.5%) | $0 |
| 45 to 64 Years | 380 (43.4%) | $0 |
| 65+ Years | 267 (30.5%) | $88,801 |
| Total | 875 (100.0%) | $0 |
Poverty in Harlem
Income Below Poverty by Sex and Age in Harlem
With 9.3% poverty level for males and 6.1% for females among the residents of Harlem, 15 year old males and 55 to 64 year old females are the most vulnerable to poverty, with 65 males (100.0%) and 79 females (37.1%) in their respective age groups living below the poverty level.
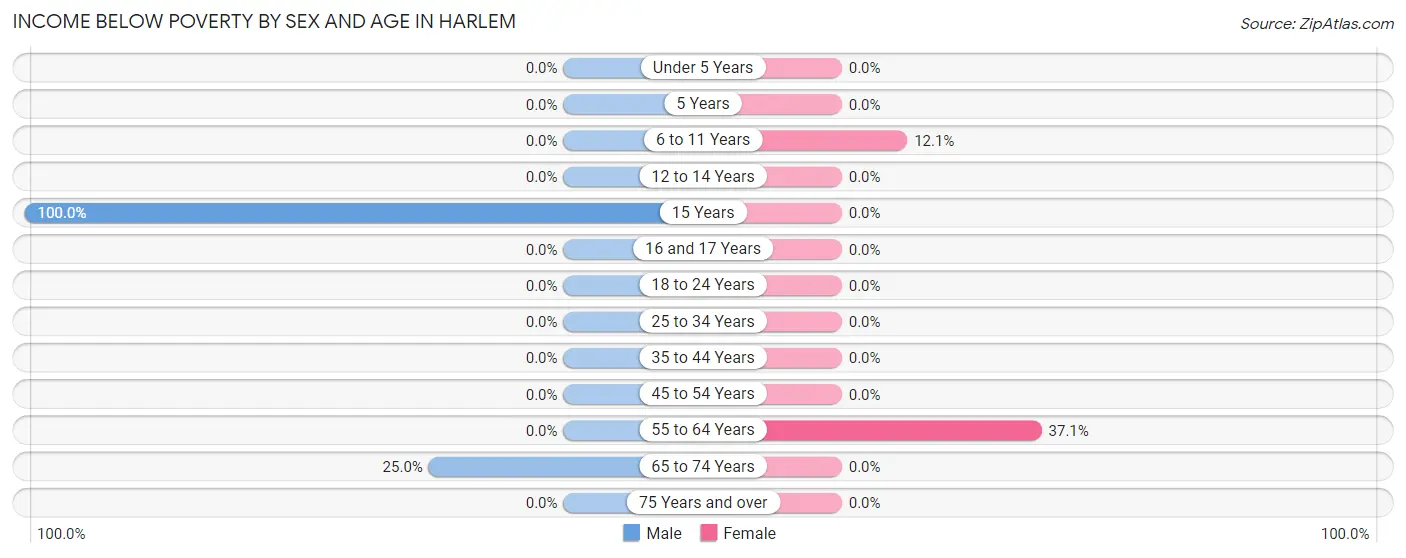
| Age Bracket | Male | Female |
| Under 5 Years | 0 (0.0%) | 0 (0.0%) |
| 5 Years | 0 (0.0%) | 0 (0.0%) |
| 6 to 11 Years | 0 (0.0%) | 25 (12.1%) |
| 12 to 14 Years | 0 (0.0%) | 0 (0.0%) |
| 15 Years | 65 (100.0%) | 0 (0.0%) |
| 16 and 17 Years | 0 (0.0%) | 0 (0.0%) |
| 18 to 24 Years | 0 (0.0%) | 0 (0.0%) |
| 25 to 34 Years | 0 (0.0%) | 0 (0.0%) |
| 35 to 44 Years | 0 (0.0%) | 0 (0.0%) |
| 45 to 54 Years | 0 (0.0%) | 0 (0.0%) |
| 55 to 64 Years | 0 (0.0%) | 79 (37.1%) |
| 65 to 74 Years | 16 (25.0%) | 0 (0.0%) |
| 75 Years and over | 0 (0.0%) | 0 (0.0%) |
| Total | 81 (9.3%) | 104 (6.1%) |
Income Above Poverty by Sex and Age in Harlem
According to the poverty statistics in Harlem, males aged under 5 years and females aged under 5 years are the age groups that are most secure financially, with 100.0% of males and 100.0% of females in these age groups living above the poverty line.
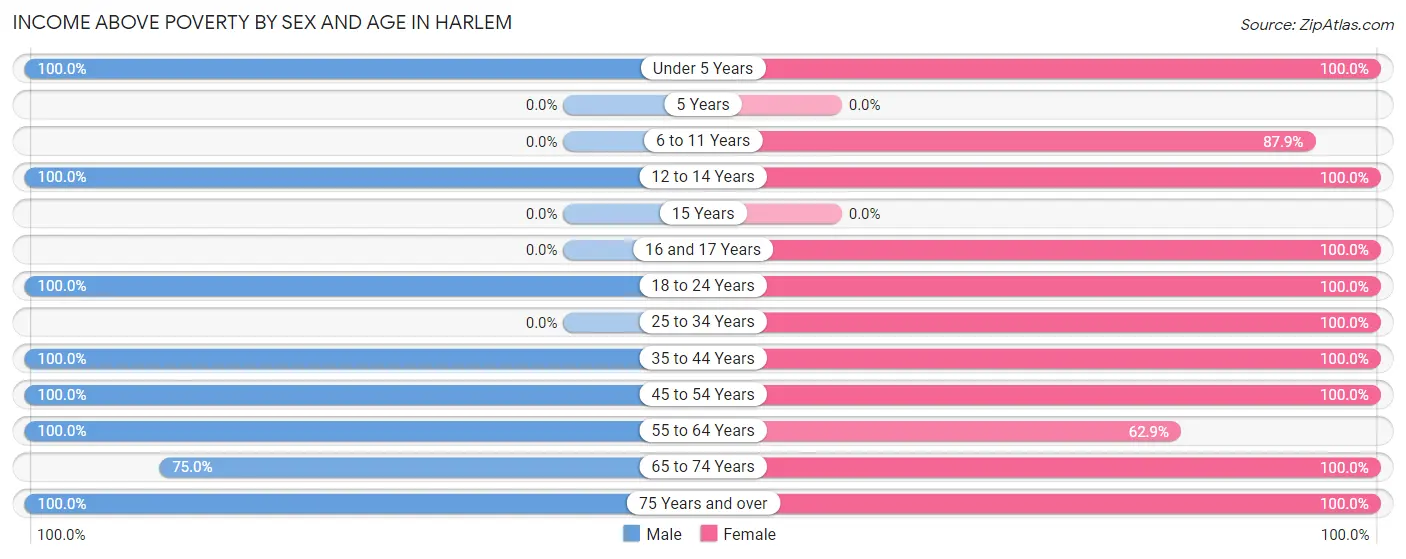
| Age Bracket | Male | Female |
| Under 5 Years | 75 (100.0%) | 248 (100.0%) |
| 5 Years | 0 (0.0%) | 0 (0.0%) |
| 6 to 11 Years | 0 (0.0%) | 181 (87.9%) |
| 12 to 14 Years | 106 (100.0%) | 58 (100.0%) |
| 15 Years | 0 (0.0%) | 0 (0.0%) |
| 16 and 17 Years | 0 (0.0%) | 101 (100.0%) |
| 18 to 24 Years | 224 (100.0%) | 196 (100.0%) |
| 25 to 34 Years | 0 (0.0%) | 105 (100.0%) |
| 35 to 44 Years | 116 (100.0%) | 133 (100.0%) |
| 45 to 54 Years | 143 (100.0%) | 231 (100.0%) |
| 55 to 64 Years | 52 (100.0%) | 134 (62.9%) |
| 65 to 74 Years | 48 (75.0%) | 164 (100.0%) |
| 75 Years and over | 23 (100.0%) | 53 (100.0%) |
| Total | 787 (90.7%) | 1,604 (93.9%) |
Income Below Poverty Among Married-Couple Families in Harlem
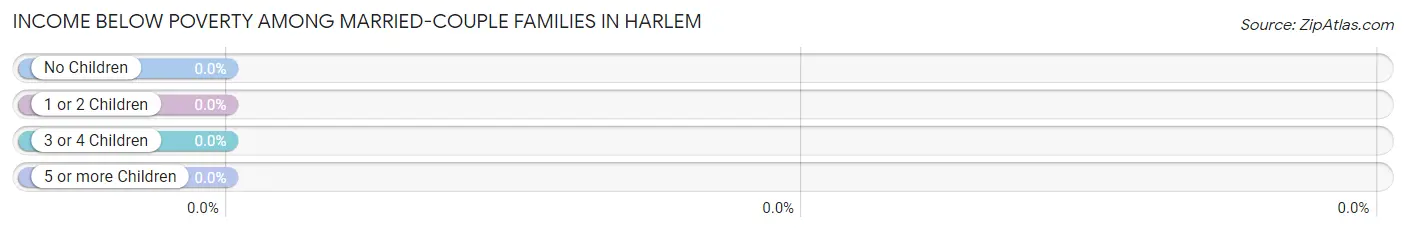
| Children | Above Poverty | Below Poverty |
| No Children | 124 (100.0%) | 0 (0.0%) |
| 1 or 2 Children | 84 (100.0%) | 0 (0.0%) |
| 3 or 4 Children | 0 (0.0%) | 0 (0.0%) |
| 5 or more Children | 0 (0.0%) | 0 (0.0%) |
| Total | 208 (100.0%) | 0 (0.0%) |
Income Below Poverty Among Single-Parent Households in Harlem
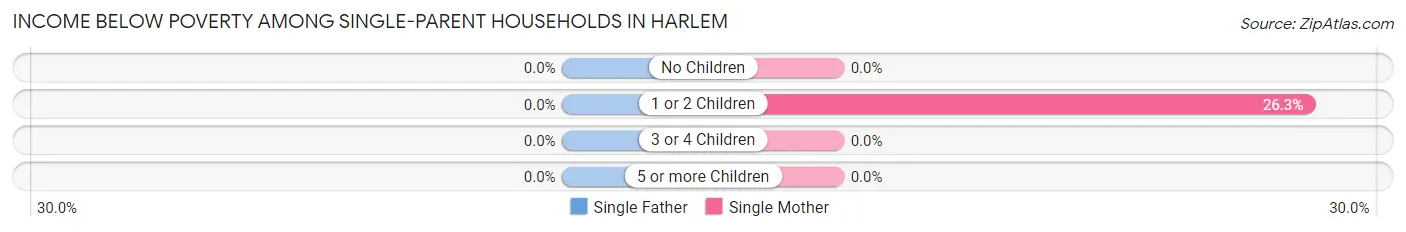
| Children | Single Father | Single Mother |
| No Children | 0 (0.0%) | 0 (0.0%) |
| 1 or 2 Children | 0 (0.0%) | 54 (26.3%) |
| 3 or 4 Children | 0 (0.0%) | 0 (0.0%) |
| 5 or more Children | 0 (0.0%) | 0 (0.0%) |
| Total | 0 (0.0%) | 54 (17.4%) |
Income Below Poverty Among Married-Couple vs Single-Parent Households in Harlem
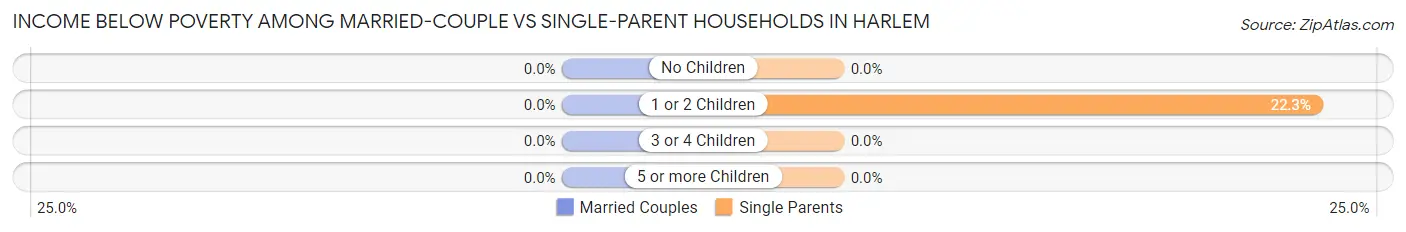
| Children | Married-Couple Families | Single-Parent Households |
| No Children | 0 (0.0%) | 0 (0.0%) |
| 1 or 2 Children | 0 (0.0%) | 54 (22.3%) |
| 3 or 4 Children | 0 (0.0%) | 0 (0.0%) |
| 5 or more Children | 0 (0.0%) | 0 (0.0%) |
| Total | 0 (0.0%) | 54 (15.5%) |
Race in Harlem
The most populous races in Harlem are Black / African American (2,576 | 100.0%), and Hispanic or Latino (16 | 0.6%).
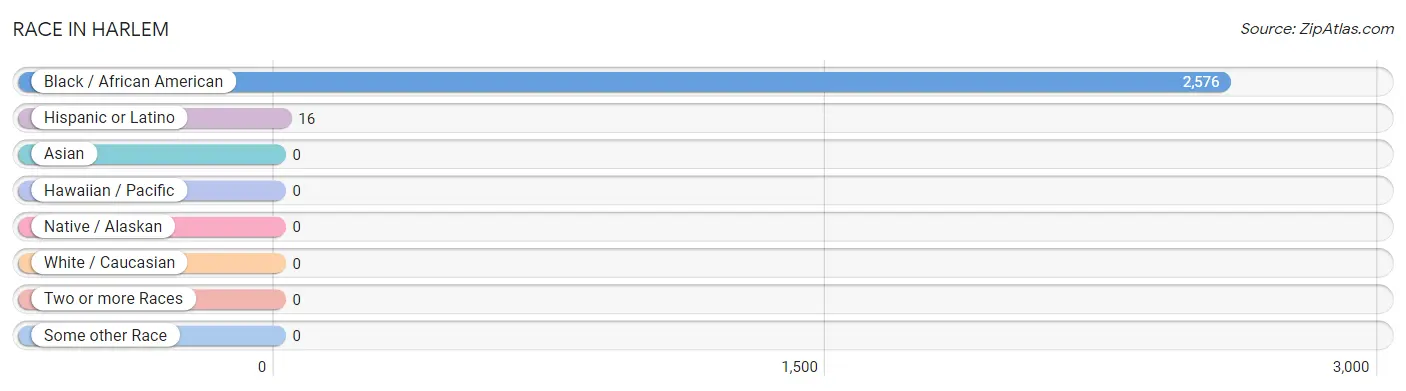
| Race | # Population | % Population |
| Asian | 0 | 0.0% |
| Black / African American | 2,576 | 100.0% |
| Hawaiian / Pacific | 0 | 0.0% |
| Hispanic or Latino | 16 | 0.6% |
| Native / Alaskan | 0 | 0.0% |
| White / Caucasian | 0 | 0.0% |
| Two or more Races | 0 | 0.0% |
| Some other Race | 0 | 0.0% |
| Total | 2,576 | 100.0% |
Ancestry in Harlem
The most populous ancestries reported in Harlem are American (807 | 31.3%), African (76 | 2.9%), Subsaharan African (76 | 2.9%), Bahamian (68 | 2.6%), and Jamaican (57 | 2.2%), together accounting for 42.1% of all Harlem residents.
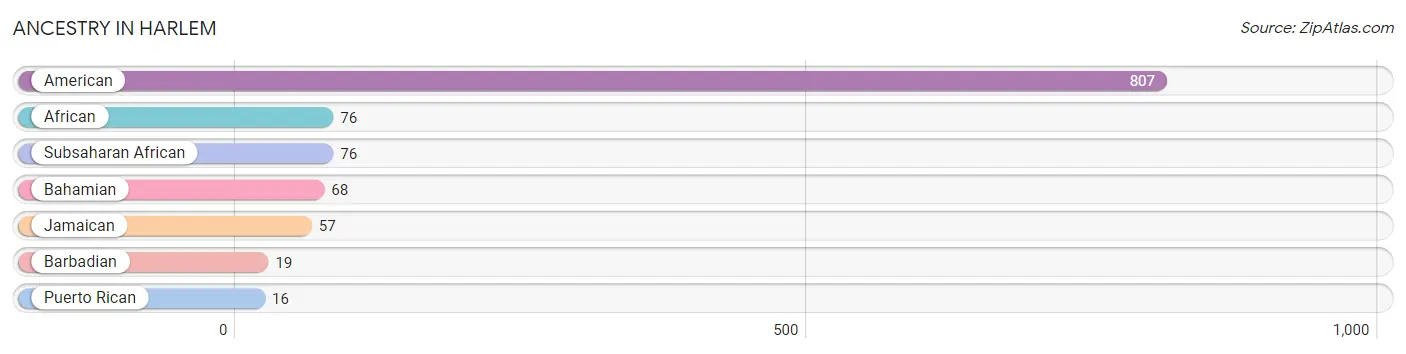
| Ancestry | # Population | % Population |
| African | 76 | 2.9% |
| American | 807 | 31.3% |
| Bahamian | 68 | 2.6% |
| Barbadian | 19 | 0.7% |
| Jamaican | 57 | 2.2% |
| Puerto Rican | 16 | 0.6% |
| Subsaharan African | 76 | 2.9% | View All 7 Rows |
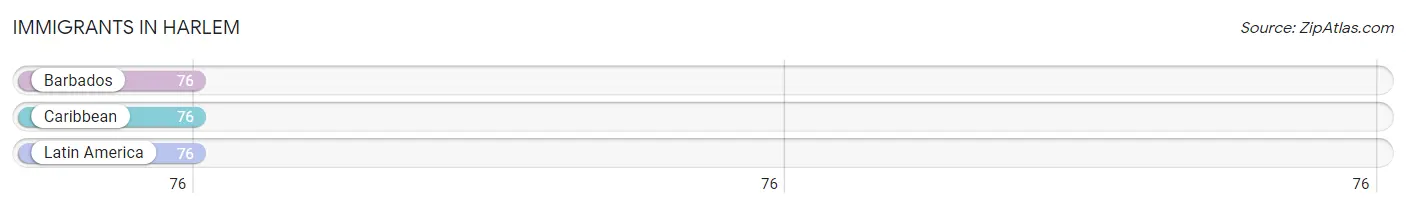
Immigrants in Harlem
The most numerous immigrant groups reported in Harlem came from Barbados (76 | 2.9%), Caribbean (76 | 2.9%), and Latin America (76 | 2.9%), together accounting for 8.8% of all Harlem residents.
| Immigration Origin | # Population | % Population |
| Barbados | 76 | 2.9% |
| Caribbean | 76 | 2.9% |
| Latin America | 76 | 2.9% | View All 3 Rows |
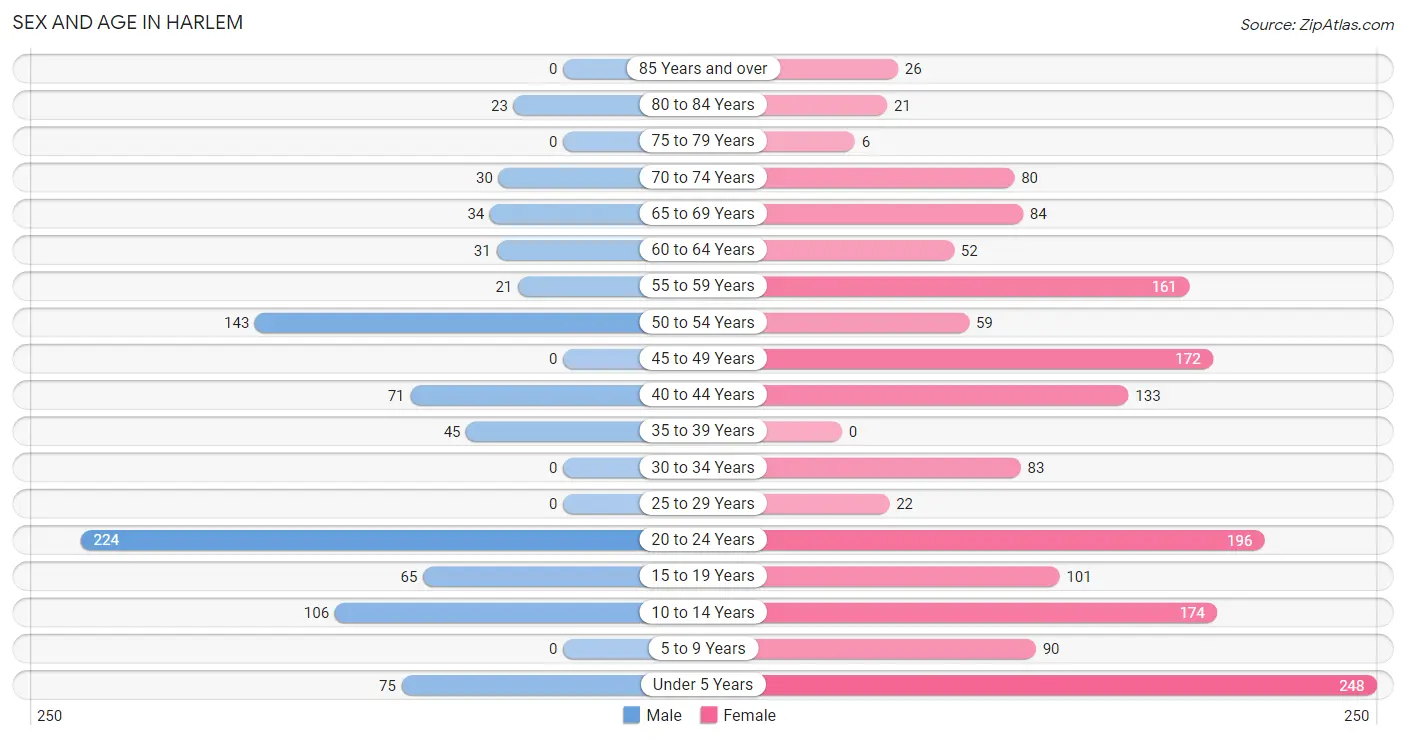
Sex and Age in Harlem
Sex and Age in Harlem
The most populous age groups in Harlem are 20 to 24 Years (224 | 25.8%) for men and Under 5 Years (248 | 14.5%) for women.
| Age Bracket | Male | Female |
| Under 5 Years | 75 (8.6%) | 248 (14.5%) |
| 5 to 9 Years | 0 (0.0%) | 90 (5.3%) |
| 10 to 14 Years | 106 (12.2%) | 174 (10.2%) |
| 15 to 19 Years | 65 (7.5%) | 101 (5.9%) |
| 20 to 24 Years | 224 (25.8%) | 196 (11.5%) |
| 25 to 29 Years | 0 (0.0%) | 22 (1.3%) |
| 30 to 34 Years | 0 (0.0%) | 83 (4.9%) |
| 35 to 39 Years | 45 (5.2%) | 0 (0.0%) |
| 40 to 44 Years | 71 (8.2%) | 133 (7.8%) |
| 45 to 49 Years | 0 (0.0%) | 172 (10.1%) |
| 50 to 54 Years | 143 (16.5%) | 59 (3.5%) |
| 55 to 59 Years | 21 (2.4%) | 161 (9.4%) |
| 60 to 64 Years | 31 (3.6%) | 52 (3.0%) |
| 65 to 69 Years | 34 (3.9%) | 84 (4.9%) |
| 70 to 74 Years | 30 (3.5%) | 80 (4.7%) |
| 75 to 79 Years | 0 (0.0%) | 6 (0.4%) |
| 80 to 84 Years | 23 (2.6%) | 21 (1.2%) |
| 85 Years and over | 0 (0.0%) | 26 (1.5%) |
| Total | 868 (100.0%) | 1,708 (100.0%) |
Families and Households in Harlem
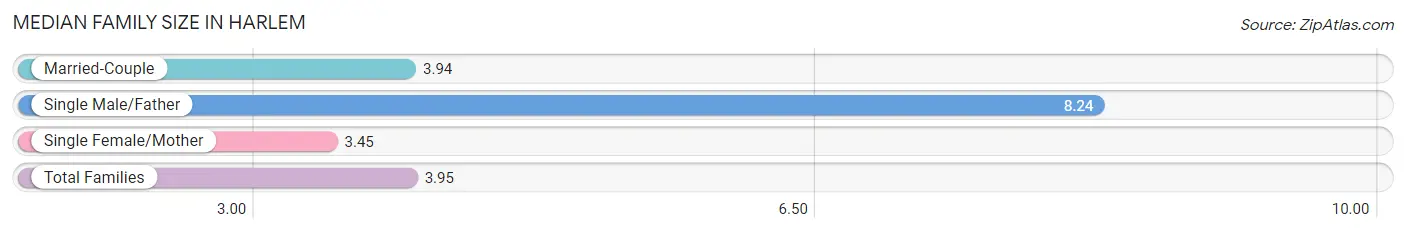
Median Family Size in Harlem
The median family size in Harlem is 3.95 persons per family, with single male/father families (37 | 6.7%) accounting for the largest median family size of 8.24 persons per family. On the other hand, single female/mother families (311 | 55.9%) represent the smallest median family size with 3.45 persons per family.
| Family Type | # Families | Family Size |
| Married-Couple | 208 (37.4%) | 3.94 |
| Single Male/Father | 37 (6.7%) | 8.24 |
| Single Female/Mother | 311 (55.9%) | 3.45 |
| Total Families | 556 (100.0%) | 3.95 |
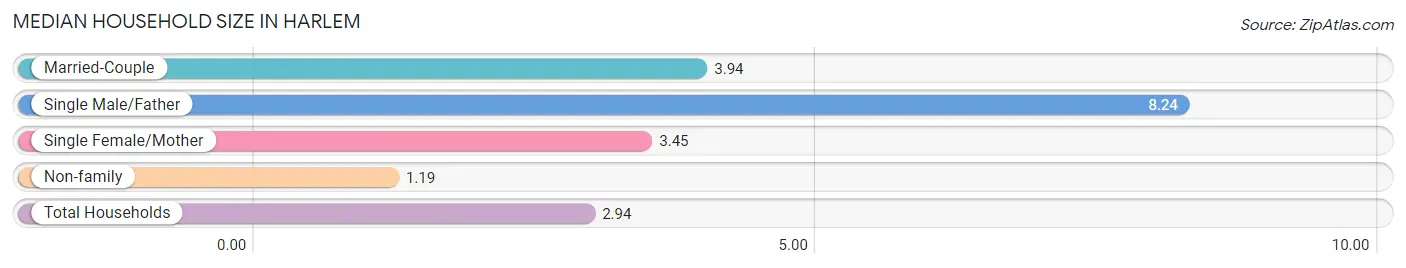
Median Household Size in Harlem
The median household size in Harlem is 2.94 persons per household, with single male/father households (37 | 4.2%) accounting for the largest median household size of 8.24 persons per household. non-family households (319 | 36.5%) represent the smallest median household size with 1.19 persons per household.
| Household Type | # Households | Household Size |
| Married-Couple | 208 (23.8%) | 3.94 |
| Single Male/Father | 37 (4.2%) | 8.24 |
| Single Female/Mother | 311 (35.5%) | 3.45 |
| Non-family | 319 (36.5%) | 1.19 |
| Total Households | 875 (100.0%) | 2.94 |
Household Size by Marriage Status in Harlem
Out of a total of 875 households in Harlem, 556 (63.5%) are family households, while 319 (36.5%) are nonfamily households. The most numerous type of family households are 2-person households, comprising 191, and the most common type of nonfamily households are 1-person households, comprising 270.
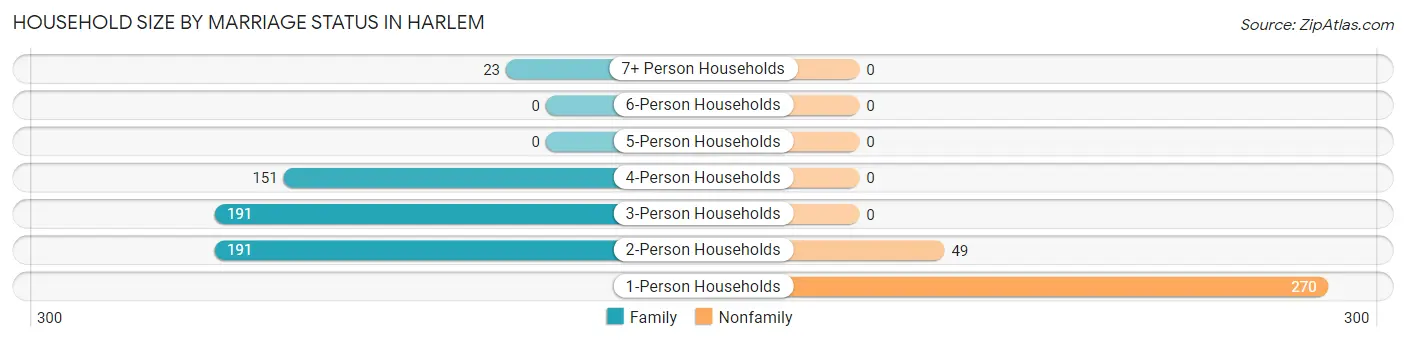
| Household Size | Family Households | Nonfamily Households |
| 1-Person Households | - | 270 (30.9%) |
| 2-Person Households | 191 (21.8%) | 49 (5.6%) |
| 3-Person Households | 191 (21.8%) | 0 (0.0%) |
| 4-Person Households | 151 (17.3%) | 0 (0.0%) |
| 5-Person Households | 0 (0.0%) | 0 (0.0%) |
| 6-Person Households | 0 (0.0%) | 0 (0.0%) |
| 7+ Person Households | 23 (2.6%) | 0 (0.0%) |
| Total | 556 (63.5%) | 319 (36.5%) |
Female Fertility in Harlem
Fertility by Age in Harlem
| Age Bracket | Women with Births | Births / 1,000 Women |
| 15 to 19 years | 0 (0.0%) | 0.0 |
| 20 to 34 years | 0 (0.0%) | 0.0 |
| 35 to 50 years | 0 (0.0%) | 0.0 |
| Total | 0 (0.0%) | 0.0 |
Fertility by Age by Marriage Status in Harlem
| Age Bracket | Married | Unmarried |
| 15 to 19 years | 0 (0.0%) | 0 (0.0%) |
| 20 to 34 years | 0 (0.0%) | 0 (0.0%) |
| 35 to 50 years | 0 (0.0%) | 0 (0.0%) |
| Total | 0 (0.0%) | 0 (0.0%) |
Fertility by Education in Harlem
| Educational Attainment | Women with Births | Births / 1,000 Women |
| Less than High School | 0 (0.0%) | 0.0 |
| High School Diploma | 0 (0.0%) | 0.0 |
| College or Associate's Degree | 0 (0.0%) | 0.0 |
| Bachelor's Degree | 0 (0.0%) | 0.0 |
| Graduate Degree | 0 (0.0%) | 0.0 |
| Total | 0 (0.0%) | 0.0 |
Fertility by Education by Marriage Status in Harlem
| Educational Attainment | Married | Unmarried |
| Less than High School | 0 (0.0%) | 0 (0.0%) |
| High School Diploma | 0 (0.0%) | 0 (0.0%) |
| College or Associate's Degree | 0 (0.0%) | 0 (0.0%) |
| Bachelor's Degree | 0 (0.0%) | 0 (0.0%) |
| Graduate Degree | 0 (0.0%) | 0 (0.0%) |
| Total | 0 (0.0%) | 0 (0.0%) |
Employment Characteristics in Harlem
Employment by Class of Employer in Harlem
Among the 972 employed individuals in Harlem, private company employees (611 | 62.9%), local government employees (194 | 20.0%), and not-for-profit organizations (73 | 7.5%) make up the most common classes of employment.
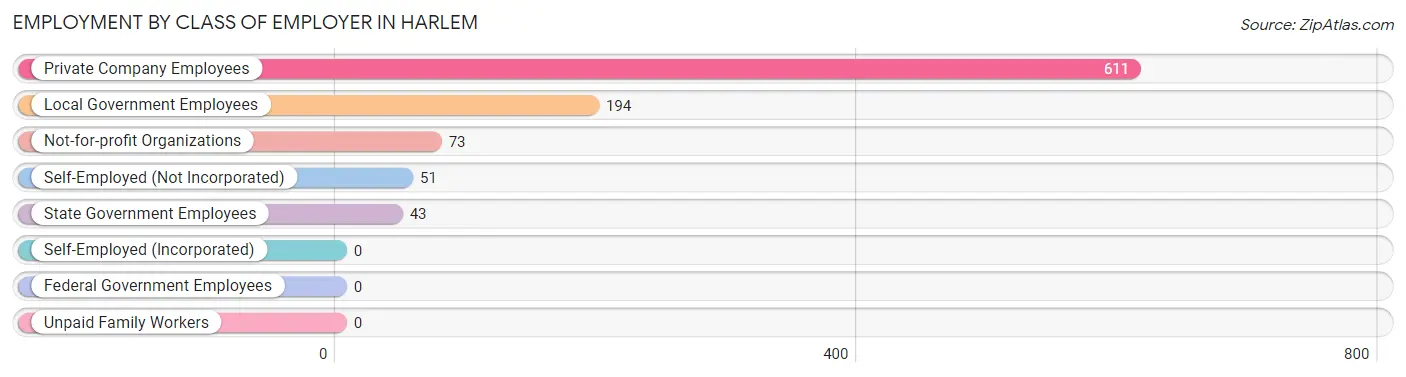
| Employer Class | # Employees | % Employees |
| Private Company Employees | 611 | 62.9% |
| Self-Employed (Incorporated) | 0 | 0.0% |
| Self-Employed (Not Incorporated) | 51 | 5.2% |
| Not-for-profit Organizations | 73 | 7.5% |
| Local Government Employees | 194 | 20.0% |
| State Government Employees | 43 | 4.4% |
| Federal Government Employees | 0 | 0.0% |
| Unpaid Family Workers | 0 | 0.0% |
| Total | 972 | 100.0% |
Employment Status by Age in Harlem
According to the labor force statistics for Harlem, out of the total population over 16 years of age (1,818), 67.8% or 1,233 individuals are in the labor force, with 16.6% or 205 of them unemployed. The age group with the highest labor force participation rate is 25 to 29 years, with 100.0% or 22 individuals in the labor force. Within the labor force, the 60 to 64 years age range has the highest percentage of unemployed individuals, with 59.3% or 16 of them being unemployed.
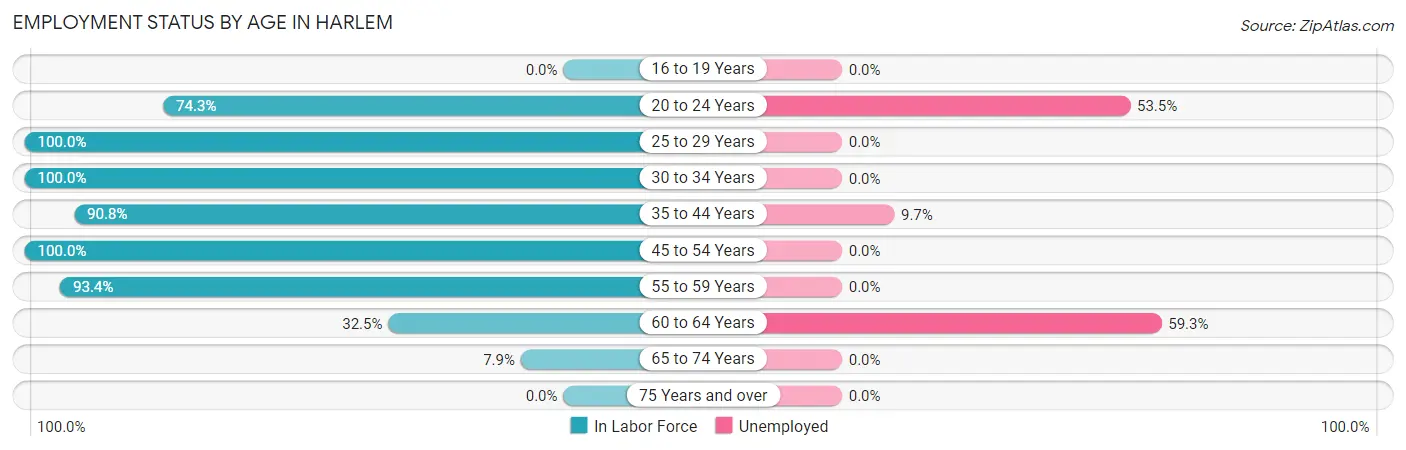
| Age Bracket | In Labor Force | Unemployed |
| 16 to 19 Years | 0 (0.0%) | 0 (0.0%) |
| 20 to 24 Years | 312 (74.3%) | 167 (53.5%) |
| 25 to 29 Years | 22 (100.0%) | 0 (0.0%) |
| 30 to 34 Years | 83 (100.0%) | 0 (0.0%) |
| 35 to 44 Years | 226 (90.8%) | 22 (9.7%) |
| 45 to 54 Years | 374 (100.0%) | 0 (0.0%) |
| 55 to 59 Years | 170 (93.4%) | 0 (0.0%) |
| 60 to 64 Years | 27 (32.5%) | 16 (59.3%) |
| 65 to 74 Years | 18 (7.9%) | 0 (0.0%) |
| 75 Years and over | 0 (0.0%) | 0 (0.0%) |
| Total | 1,233 (67.8%) | 205 (16.6%) |
Employment Status by Educational Attainment in Harlem
According to labor force statistics for Harlem, 90.8% of individuals (902) out of the total population between 25 and 64 years of age (993) are in the labor force, with 4.2% or 38 of them being unemployed. The group with the highest labor force participation rate are those with the educational attainment of less than high school, with 100.0% or 111 individuals in the labor force. Within the labor force, individuals with less than high school education have the highest percentage of unemployment, with 34.2% or 38 of them being unemployed.
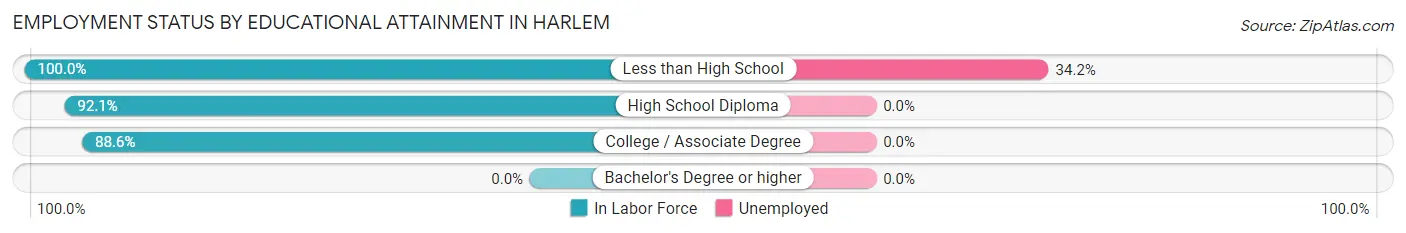
| Educational Attainment | In Labor Force | Unemployed |
| Less than High School | 111 (100.0%) | 38 (34.2%) |
| High School Diploma | 573 (92.1%) | 0 (0.0%) |
| College / Associate Degree | 218 (88.6%) | 0 (0.0%) |
| Bachelor's Degree or higher | 0 (0.0%) | 0 (0.0%) |
| Total | 902 (90.8%) | 42 (4.2%) |
Employment Occupations by Sex in Harlem
Management, Business, Science and Arts Occupations
The most common Management, Business, Science and Arts occupations in Harlem are Community & Social Service (87 | 8.5%), Education Instruction & Library (87 | 8.5%), and Health Diagnosing & Treating (63 | 6.1%).
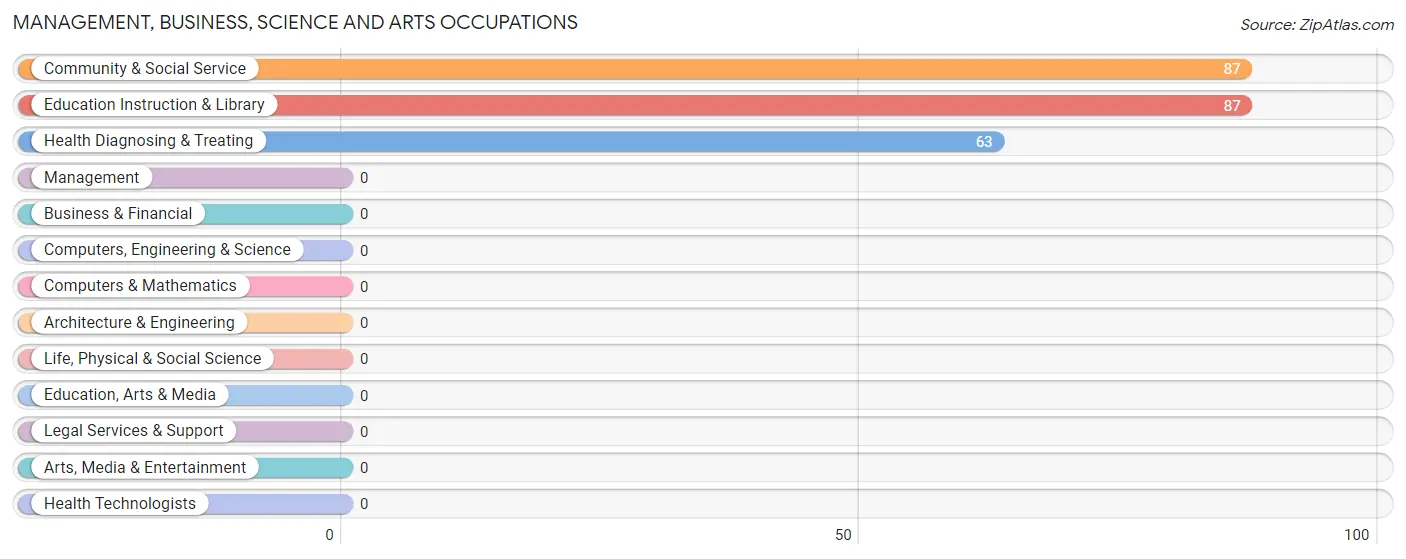
Management, Business, Science and Arts Occupations by Sex
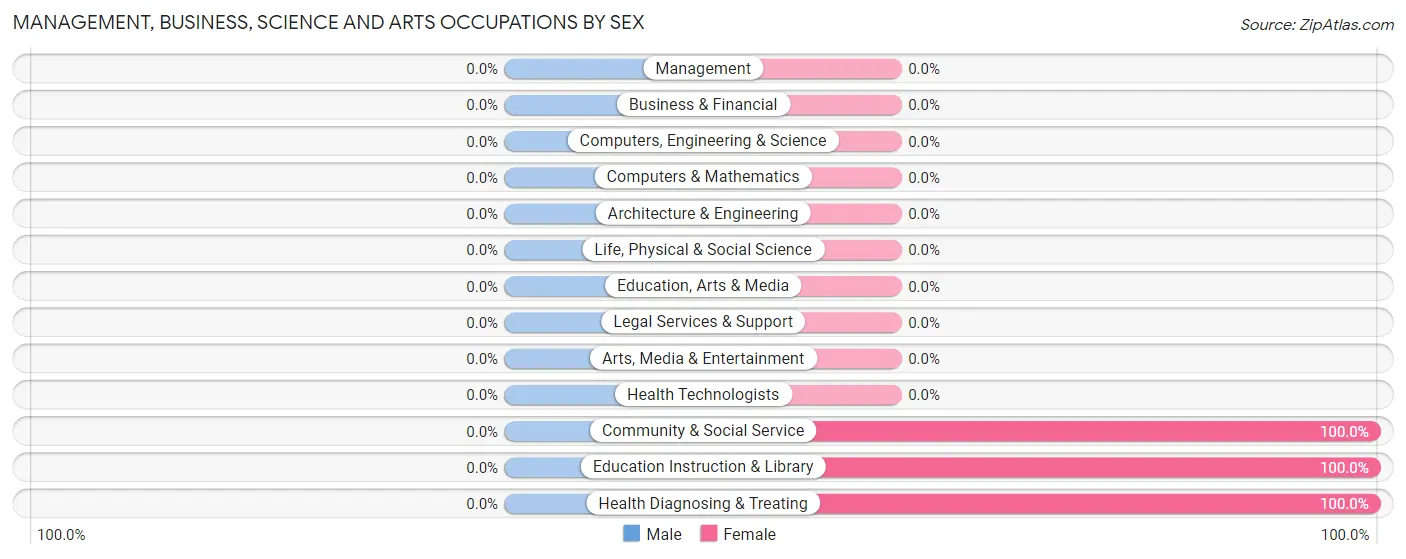
| Occupation | Male | Female |
| Management | 0 (0.0%) | 0 (0.0%) |
| Business & Financial | 0 (0.0%) | 0 (0.0%) |
| Computers, Engineering & Science | 0 (0.0%) | 0 (0.0%) |
| Computers & Mathematics | 0 (0.0%) | 0 (0.0%) |
| Architecture & Engineering | 0 (0.0%) | 0 (0.0%) |
| Life, Physical & Social Science | 0 (0.0%) | 0 (0.0%) |
| Community & Social Service | 0 (0.0%) | 87 (100.0%) |
| Education, Arts & Media | 0 (0.0%) | 0 (0.0%) |
| Legal Services & Support | 0 (0.0%) | 0 (0.0%) |
| Education Instruction & Library | 0 (0.0%) | 87 (100.0%) |
| Arts, Media & Entertainment | 0 (0.0%) | 0 (0.0%) |
| Health Diagnosing & Treating | 0 (0.0%) | 63 (100.0%) |
| Health Technologists | 0 (0.0%) | 0 (0.0%) |
| Total (Category) | 0 (0.0%) | 150 (100.0%) |
| Total (Overall) | 393 (38.3%) | 634 (61.7%) |
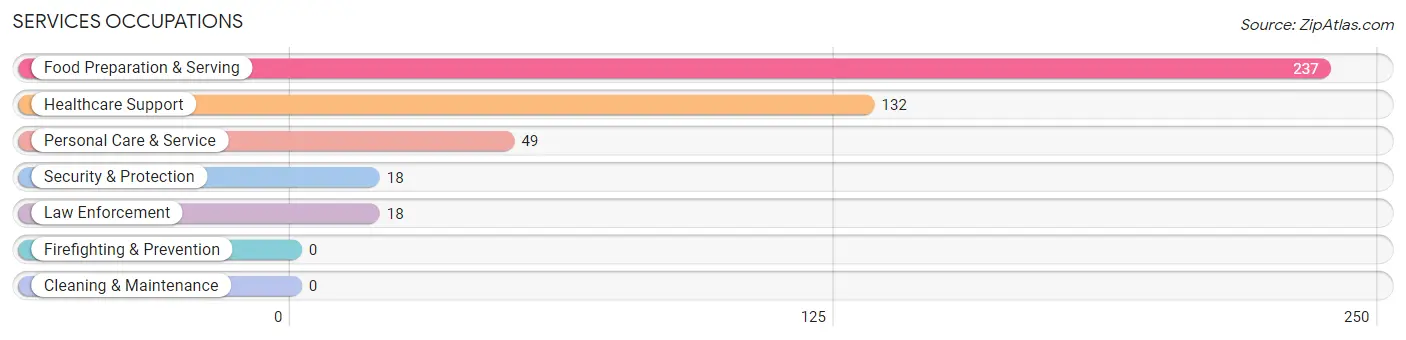
Services Occupations
The most common Services occupations in Harlem are Food Preparation & Serving (237 | 23.1%), Healthcare Support (132 | 12.9%), Personal Care & Service (49 | 4.8%), Security & Protection (18 | 1.8%), and Law Enforcement (18 | 1.8%).
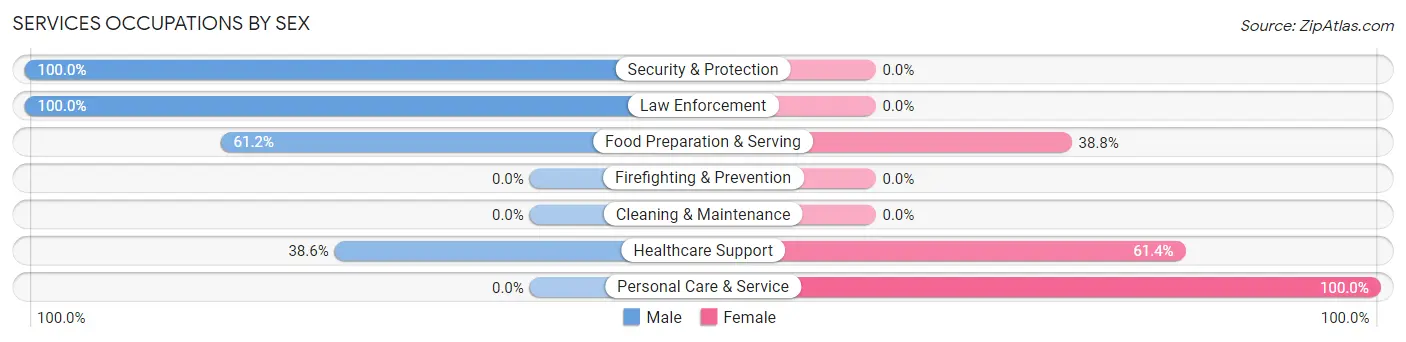
Services Occupations by Sex
Within the Services occupations in Harlem, the most male-oriented occupations are Security & Protection (100.0%), Law Enforcement (100.0%), and Food Preparation & Serving (61.2%), while the most female-oriented occupations are Personal Care & Service (100.0%), Healthcare Support (61.4%), and Food Preparation & Serving (38.8%).
| Occupation | Male | Female |
| Healthcare Support | 51 (38.6%) | 81 (61.4%) |
| Security & Protection | 18 (100.0%) | 0 (0.0%) |
| Firefighting & Prevention | 0 (0.0%) | 0 (0.0%) |
| Law Enforcement | 18 (100.0%) | 0 (0.0%) |
| Food Preparation & Serving | 145 (61.2%) | 92 (38.8%) |
| Cleaning & Maintenance | 0 (0.0%) | 0 (0.0%) |
| Personal Care & Service | 0 (0.0%) | 49 (100.0%) |
| Total (Category) | 214 (49.1%) | 222 (50.9%) |
| Total (Overall) | 393 (38.3%) | 634 (61.7%) |
Sales and Office Occupations
The most common Sales and Office occupations in Harlem are , and Office & Administration (153 | 14.9%).
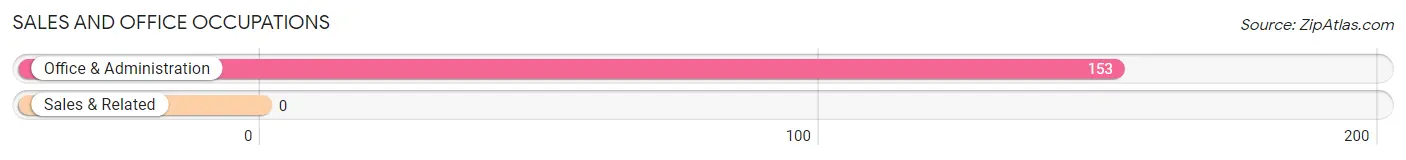
Sales and Office Occupations by Sex
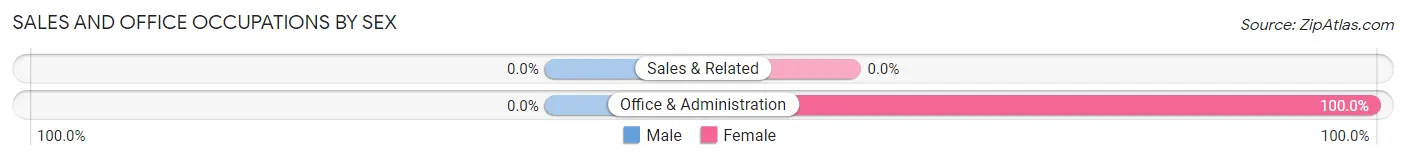
| Occupation | Male | Female |
| Sales & Related | 0 (0.0%) | 0 (0.0%) |
| Office & Administration | 0 (0.0%) | 153 (100.0%) |
| Total (Category) | 0 (0.0%) | 153 (100.0%) |
| Total (Overall) | 393 (38.3%) | 634 (61.7%) |
Natural Resources, Construction and Maintenance Occupations
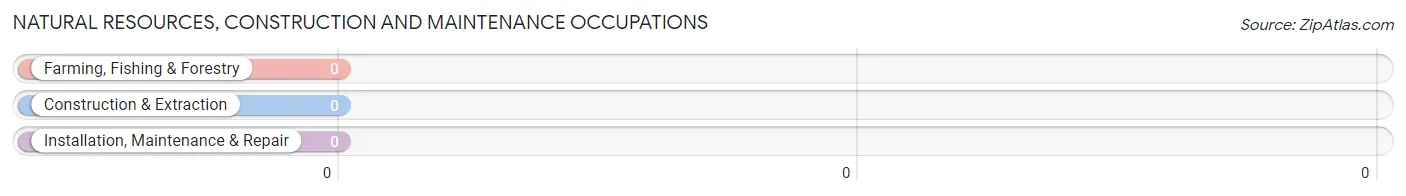
Natural Resources, Construction and Maintenance Occupations by Sex
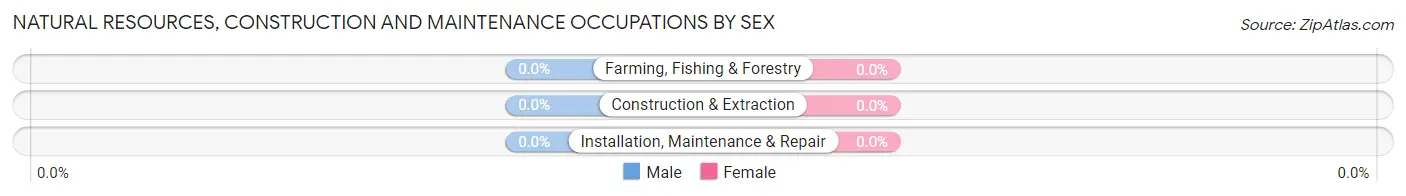
| Occupation | Male | Female |
| Farming, Fishing & Forestry | 0 (0.0%) | 0 (0.0%) |
| Construction & Extraction | 0 (0.0%) | 0 (0.0%) |
| Installation, Maintenance & Repair | 0 (0.0%) | 0 (0.0%) |
| Total (Category) | 0 (0.0%) | 0 (0.0%) |
| Total (Overall) | 393 (38.3%) | 634 (61.7%) |
Production, Transportation and Moving Occupations
The most common Production, Transportation and Moving occupations in Harlem are Transportation (209 | 20.3%), Material Moving (71 | 6.9%), and Production (8 | 0.8%).
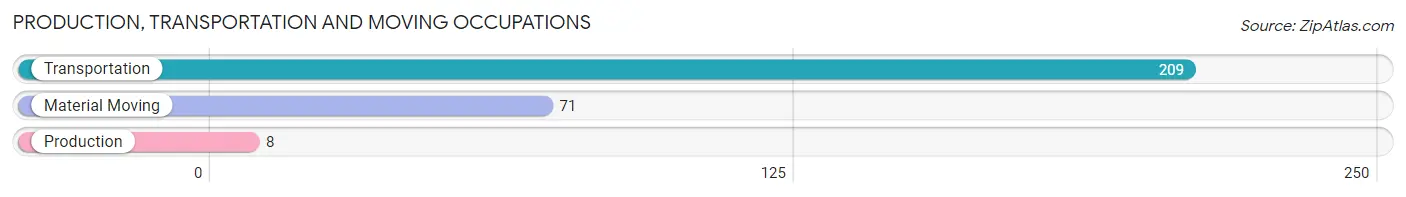
Production, Transportation and Moving Occupations by Sex
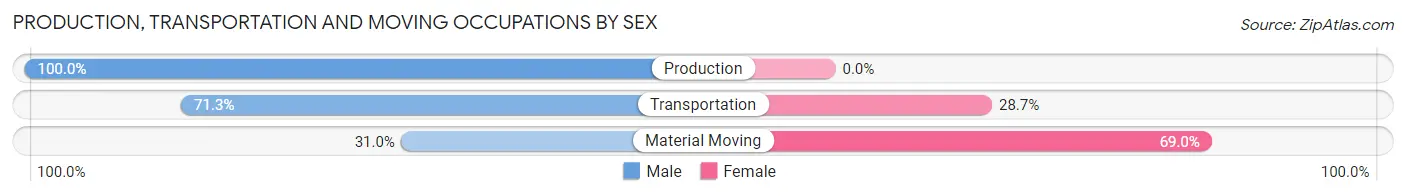
| Occupation | Male | Female |
| Production | 8 (100.0%) | 0 (0.0%) |
| Transportation | 149 (71.3%) | 60 (28.7%) |
| Material Moving | 22 (31.0%) | 49 (69.0%) |
| Total (Category) | 179 (62.2%) | 109 (37.9%) |
| Total (Overall) | 393 (38.3%) | 634 (61.7%) |
Employment Industries by Sex in Harlem
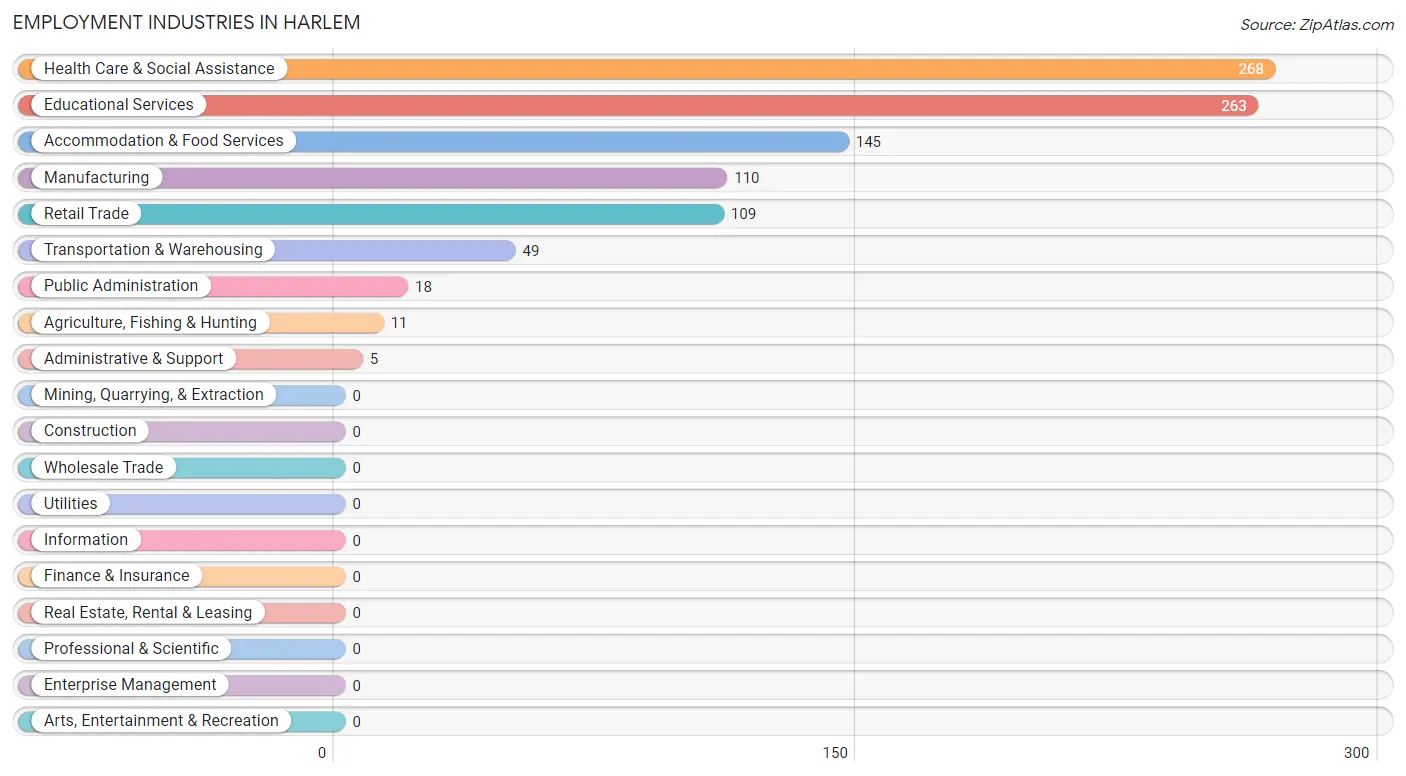
Employment Industries in Harlem
The major employment industries in Harlem include Health Care & Social Assistance (268 | 26.1%), Educational Services (263 | 25.6%), Accommodation & Food Services (145 | 14.1%), Manufacturing (110 | 10.7%), and Retail Trade (109 | 10.6%).
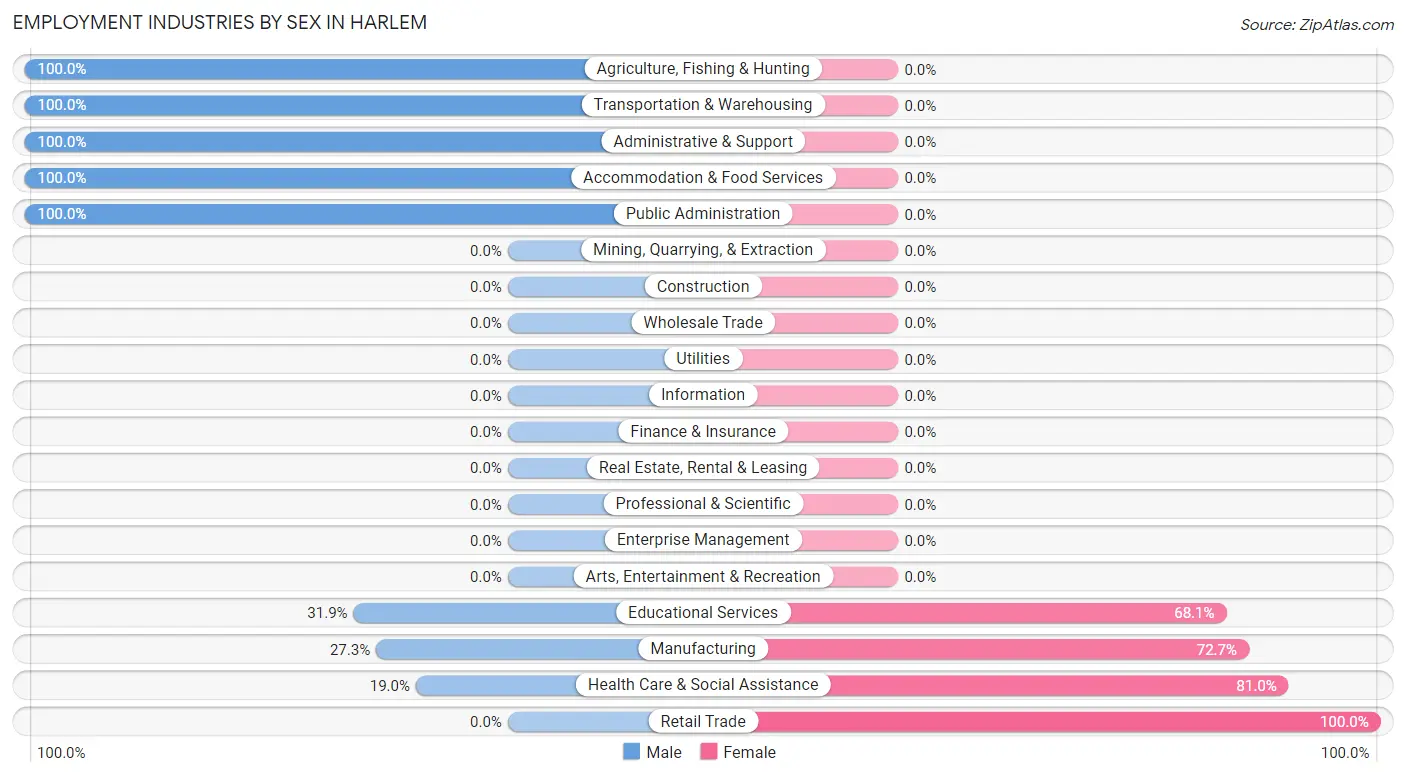
Employment Industries by Sex in Harlem
The Harlem industries that see more men than women are Agriculture, Fishing & Hunting (100.0%), Transportation & Warehousing (100.0%), and Administrative & Support (100.0%), whereas the industries that tend to have a higher number of women are Retail Trade (100.0%), Health Care & Social Assistance (81.0%), and Manufacturing (72.7%).
| Industry | Male | Female |
| Agriculture, Fishing & Hunting | 11 (100.0%) | 0 (0.0%) |
| Mining, Quarrying, & Extraction | 0 (0.0%) | 0 (0.0%) |
| Construction | 0 (0.0%) | 0 (0.0%) |
| Manufacturing | 30 (27.3%) | 80 (72.7%) |
| Wholesale Trade | 0 (0.0%) | 0 (0.0%) |
| Retail Trade | 0 (0.0%) | 109 (100.0%) |
| Transportation & Warehousing | 49 (100.0%) | 0 (0.0%) |
| Utilities | 0 (0.0%) | 0 (0.0%) |
| Information | 0 (0.0%) | 0 (0.0%) |
| Finance & Insurance | 0 (0.0%) | 0 (0.0%) |
| Real Estate, Rental & Leasing | 0 (0.0%) | 0 (0.0%) |
| Professional & Scientific | 0 (0.0%) | 0 (0.0%) |
| Enterprise Management | 0 (0.0%) | 0 (0.0%) |
| Administrative & Support | 5 (100.0%) | 0 (0.0%) |
| Educational Services | 84 (31.9%) | 179 (68.1%) |
| Health Care & Social Assistance | 51 (19.0%) | 217 (81.0%) |
| Arts, Entertainment & Recreation | 0 (0.0%) | 0 (0.0%) |
| Accommodation & Food Services | 145 (100.0%) | 0 (0.0%) |
| Public Administration | 18 (100.0%) | 0 (0.0%) |
| Total | 393 (38.3%) | 634 (61.7%) |
Education in Harlem
School Enrollment in Harlem
The most common levels of schooling among the 856 students in Harlem are high school (225 | 26.3%), elementary school (181 | 21.1%), and graduate / professional (157 | 18.3%).
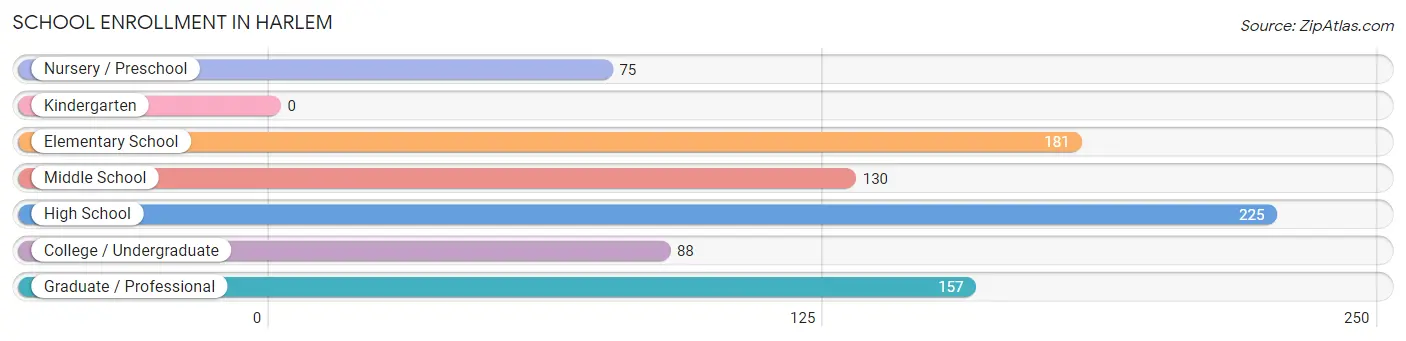
| School Level | # Students | % Students |
| Nursery / Preschool | 75 | 8.8% |
| Kindergarten | 0 | 0.0% |
| Elementary School | 181 | 21.1% |
| Middle School | 130 | 15.2% |
| High School | 225 | 26.3% |
| College / Undergraduate | 88 | 10.3% |
| Graduate / Professional | 157 | 18.3% |
| Total | 856 | 100.0% |
School Enrollment by Age by Funding Source in Harlem
Out of a total of 856 students who are enrolled in schools in Harlem, 47 (5.5%) attend a private institution, while the remaining 809 (94.5%) are enrolled in public schools. The age group of 10 to 14 year olds has the highest likelihood of being enrolled in private schools, with 47 (16.8% in the age bracket) enrolled. Conversely, the age group of 3 to 4 year olds has the lowest likelihood of being enrolled in a private school, with 75 (100.0% in the age bracket) attending a public institution.
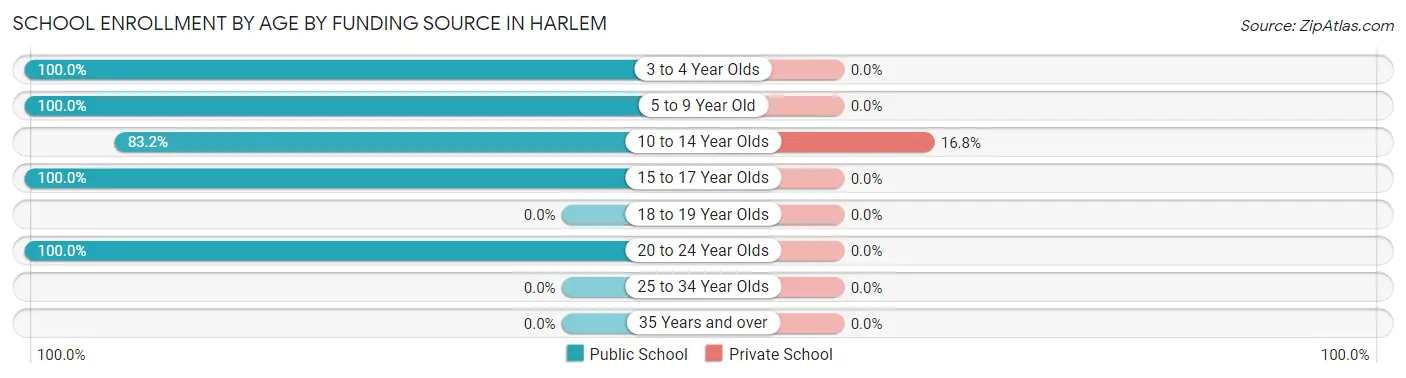
| Age Bracket | Public School | Private School |
| 3 to 4 Year Olds | 75 (100.0%) | 0 (0.0%) |
| 5 to 9 Year Old | 90 (100.0%) | 0 (0.0%) |
| 10 to 14 Year Olds | 233 (83.2%) | 47 (16.8%) |
| 15 to 17 Year Olds | 166 (100.0%) | 0 (0.0%) |
| 18 to 19 Year Olds | 0 (0.0%) | 0 (0.0%) |
| 20 to 24 Year Olds | 245 (100.0%) | 0 (0.0%) |
| 25 to 34 Year Olds | 0 (0.0%) | 0 (0.0%) |
| 35 Years and over | 0 (0.0%) | 0 (0.0%) |
| Total | 809 (94.5%) | 47 (5.5%) |
Educational Attainment by Field of Study in Harlem
Business (14 | 70.0%), and education (6 | 30.0%) are the most common fields of study among 20 individuals in Harlem who have obtained a bachelor's degree or higher.
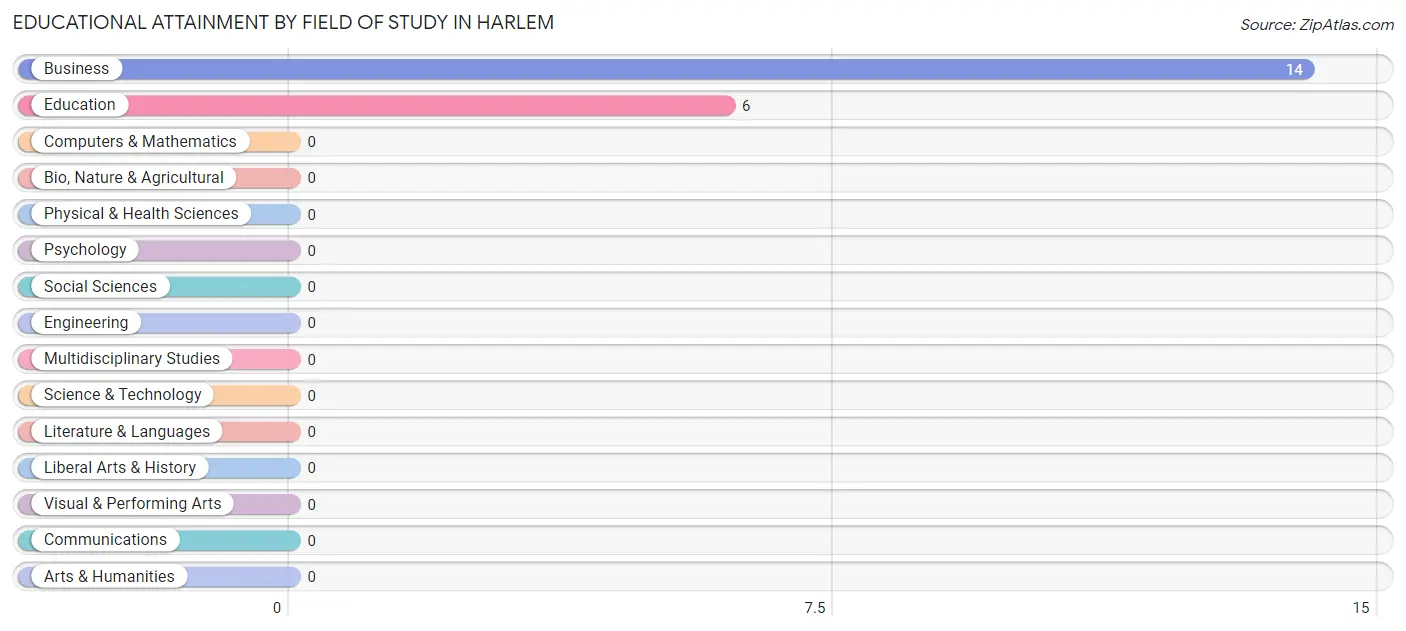
| Field of Study | # Graduates | % Graduates |
| Computers & Mathematics | 0 | 0.0% |
| Bio, Nature & Agricultural | 0 | 0.0% |
| Physical & Health Sciences | 0 | 0.0% |
| Psychology | 0 | 0.0% |
| Social Sciences | 0 | 0.0% |
| Engineering | 0 | 0.0% |
| Multidisciplinary Studies | 0 | 0.0% |
| Science & Technology | 0 | 0.0% |
| Business | 14 | 70.0% |
| Education | 6 | 30.0% |
| Literature & Languages | 0 | 0.0% |
| Liberal Arts & History | 0 | 0.0% |
| Visual & Performing Arts | 0 | 0.0% |
| Communications | 0 | 0.0% |
| Arts & Humanities | 0 | 0.0% |
| Total | 20 | 100.0% |
Transportation & Commute in Harlem
Vehicle Availability by Sex in Harlem
The most prevalent vehicle ownership categories in Harlem are males with 3 vehicles (223, accounting for 58.2%) and females with 3 vehicles (198, making up 37.9%).
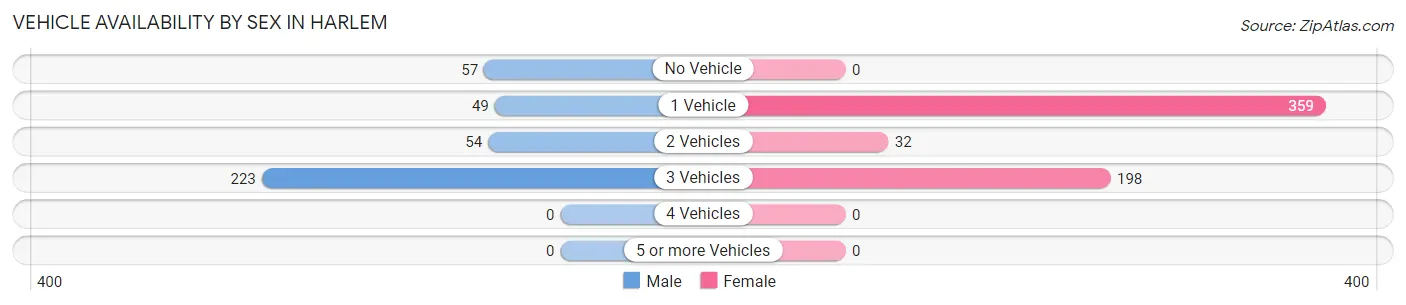
| Vehicles Available | Male | Female |
| No Vehicle | 57 (14.9%) | 0 (0.0%) |
| 1 Vehicle | 49 (12.8%) | 359 (61.0%) |
| 2 Vehicles | 54 (14.1%) | 32 (5.4%) |
| 3 Vehicles | 223 (58.2%) | 198 (33.6%) |
| 4 Vehicles | 0 (0.0%) | 0 (0.0%) |
| 5 or more Vehicles | 0 (0.0%) | 0 (0.0%) |
| Total | 383 (100.0%) | 589 (100.0%) |
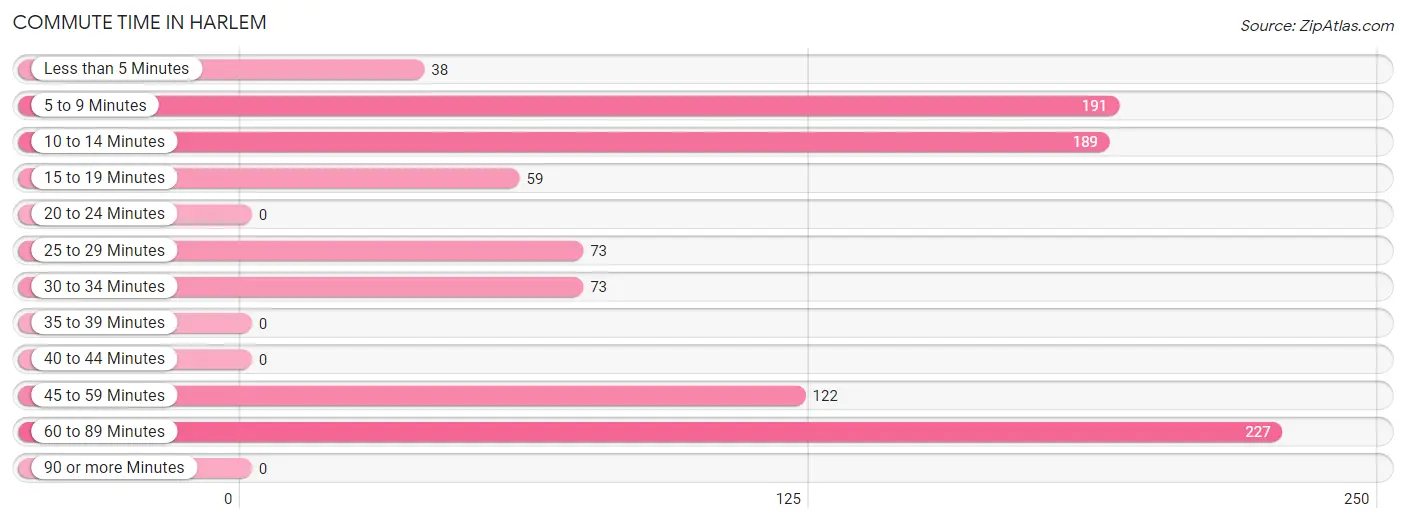
Commute Time in Harlem
The most frequently occuring commute durations in Harlem are 60 to 89 minutes (227 commuters, 23.4%), 5 to 9 minutes (191 commuters, 19.7%), and 10 to 14 minutes (189 commuters, 19.4%).
| Commute Time | # Commuters | % Commuters |
| Less than 5 Minutes | 38 | 3.9% |
| 5 to 9 Minutes | 191 | 19.7% |
| 10 to 14 Minutes | 189 | 19.4% |
| 15 to 19 Minutes | 59 | 6.1% |
| 20 to 24 Minutes | 0 | 0.0% |
| 25 to 29 Minutes | 73 | 7.5% |
| 30 to 34 Minutes | 73 | 7.5% |
| 35 to 39 Minutes | 0 | 0.0% |
| 40 to 44 Minutes | 0 | 0.0% |
| 45 to 59 Minutes | 122 | 12.6% |
| 60 to 89 Minutes | 227 | 23.4% |
| 90 or more Minutes | 0 | 0.0% |
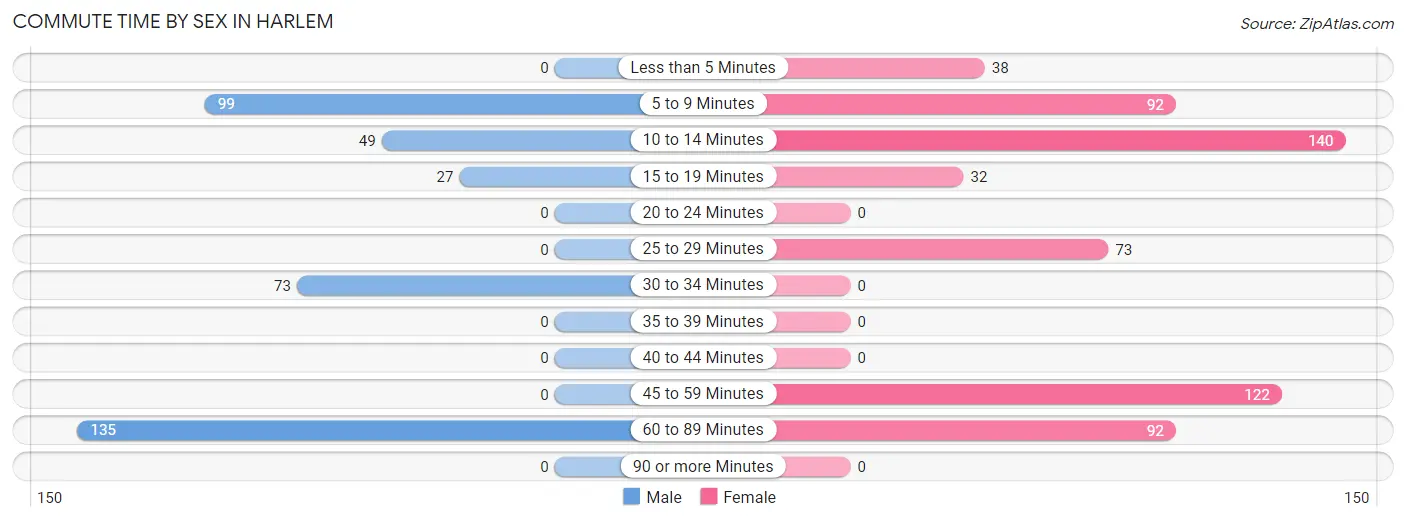
Commute Time by Sex in Harlem
The most common commute times in Harlem are 60 to 89 minutes (135 commuters, 35.2%) for males and 10 to 14 minutes (140 commuters, 23.8%) for females.
| Commute Time | Male | Female |
| Less than 5 Minutes | 0 (0.0%) | 38 (6.5%) |
| 5 to 9 Minutes | 99 (25.9%) | 92 (15.6%) |
| 10 to 14 Minutes | 49 (12.8%) | 140 (23.8%) |
| 15 to 19 Minutes | 27 (7.0%) | 32 (5.4%) |
| 20 to 24 Minutes | 0 (0.0%) | 0 (0.0%) |
| 25 to 29 Minutes | 0 (0.0%) | 73 (12.4%) |
| 30 to 34 Minutes | 73 (19.1%) | 0 (0.0%) |
| 35 to 39 Minutes | 0 (0.0%) | 0 (0.0%) |
| 40 to 44 Minutes | 0 (0.0%) | 0 (0.0%) |
| 45 to 59 Minutes | 0 (0.0%) | 122 (20.7%) |
| 60 to 89 Minutes | 135 (35.2%) | 92 (15.6%) |
| 90 or more Minutes | 0 (0.0%) | 0 (0.0%) |
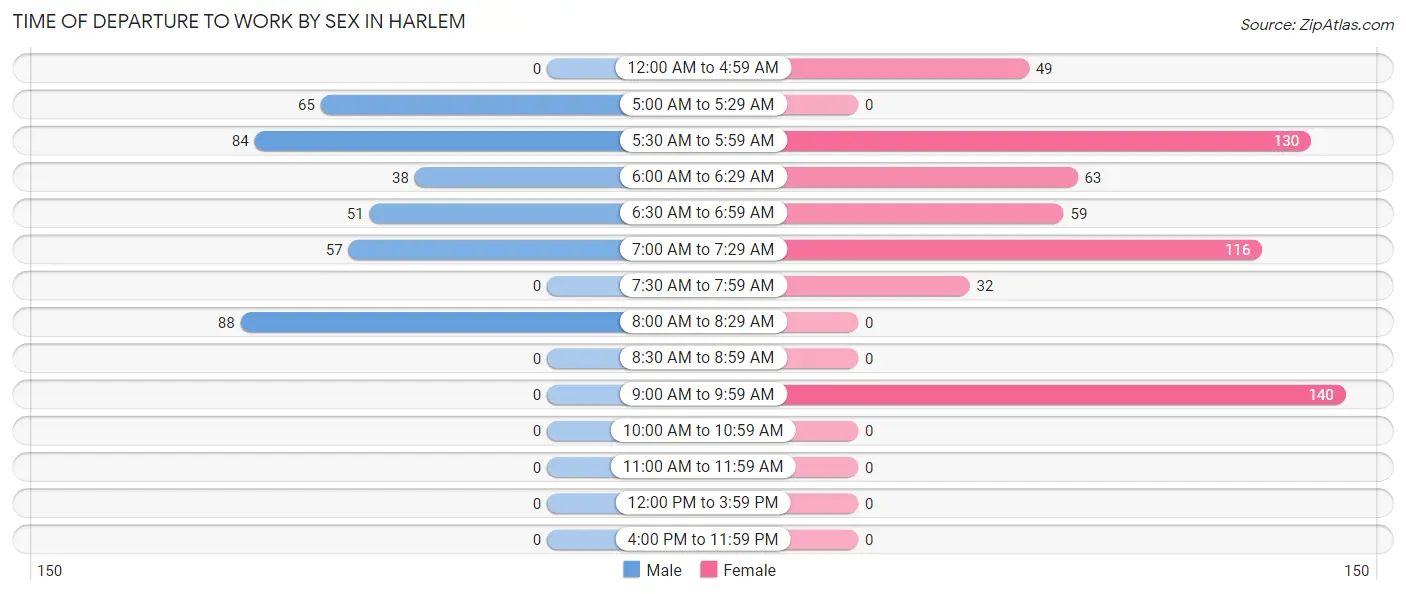
Time of Departure to Work by Sex in Harlem
The most frequent times of departure to work in Harlem are 8:00 AM to 8:29 AM (88, 23.0%) for males and 9:00 AM to 9:59 AM (140, 23.8%) for females.
| Time of Departure | Male | Female |
| 12:00 AM to 4:59 AM | 0 (0.0%) | 49 (8.3%) |
| 5:00 AM to 5:29 AM | 65 (17.0%) | 0 (0.0%) |
| 5:30 AM to 5:59 AM | 84 (21.9%) | 130 (22.1%) |
| 6:00 AM to 6:29 AM | 38 (9.9%) | 63 (10.7%) |
| 6:30 AM to 6:59 AM | 51 (13.3%) | 59 (10.0%) |
| 7:00 AM to 7:29 AM | 57 (14.9%) | 116 (19.7%) |
| 7:30 AM to 7:59 AM | 0 (0.0%) | 32 (5.4%) |
| 8:00 AM to 8:29 AM | 88 (23.0%) | 0 (0.0%) |
| 8:30 AM to 8:59 AM | 0 (0.0%) | 0 (0.0%) |
| 9:00 AM to 9:59 AM | 0 (0.0%) | 140 (23.8%) |
| 10:00 AM to 10:59 AM | 0 (0.0%) | 0 (0.0%) |
| 11:00 AM to 11:59 AM | 0 (0.0%) | 0 (0.0%) |
| 12:00 PM to 3:59 PM | 0 (0.0%) | 0 (0.0%) |
| 4:00 PM to 11:59 PM | 0 (0.0%) | 0 (0.0%) |
| Total | 383 (100.0%) | 589 (100.0%) |
Housing Occupancy in Harlem
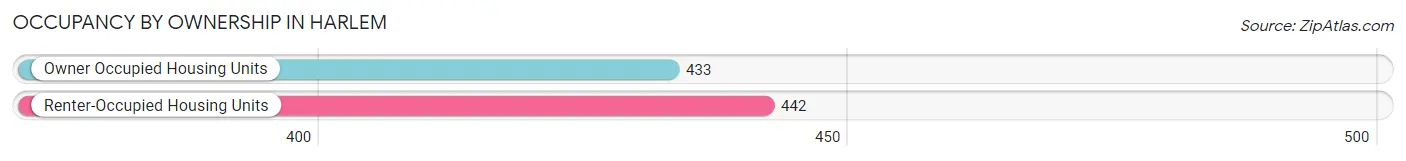
Occupancy by Ownership in Harlem
Of the total 875 dwellings in Harlem, owner-occupied units account for 433 (49.5%), while renter-occupied units make up 442 (50.5%).
| Occupancy | # Housing Units | % Housing Units |
| Owner Occupied Housing Units | 433 | 49.5% |
| Renter-Occupied Housing Units | 442 | 50.5% |
| Total Occupied Housing Units | 875 | 100.0% |
Occupancy by Household Size in Harlem
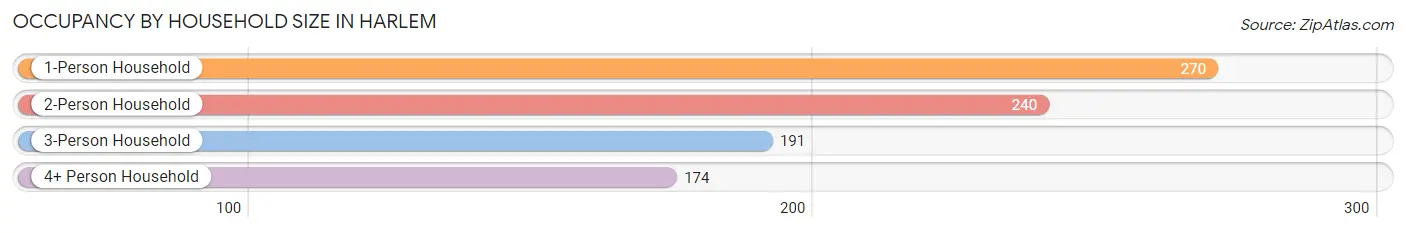
| Household Size | # Housing Units | % Housing Units |
| 1-Person Household | 270 | 30.9% |
| 2-Person Household | 240 | 27.4% |
| 3-Person Household | 191 | 21.8% |
| 4+ Person Household | 174 | 19.9% |
| Total Housing Units | 875 | 100.0% |
Occupancy by Ownership by Household Size in Harlem
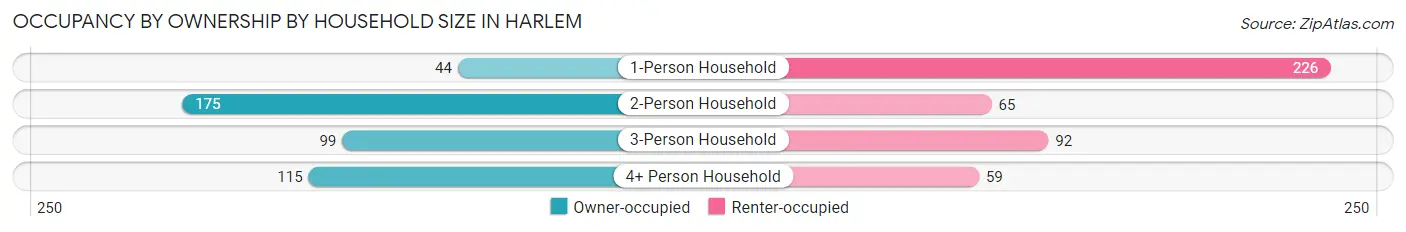
| Household Size | Owner-occupied | Renter-occupied |
| 1-Person Household | 44 (16.3%) | 226 (83.7%) |
| 2-Person Household | 175 (72.9%) | 65 (27.1%) |
| 3-Person Household | 99 (51.8%) | 92 (48.2%) |
| 4+ Person Household | 115 (66.1%) | 59 (33.9%) |
| Total Housing Units | 433 (49.5%) | 442 (50.5%) |
Occupancy by Educational Attainment in Harlem
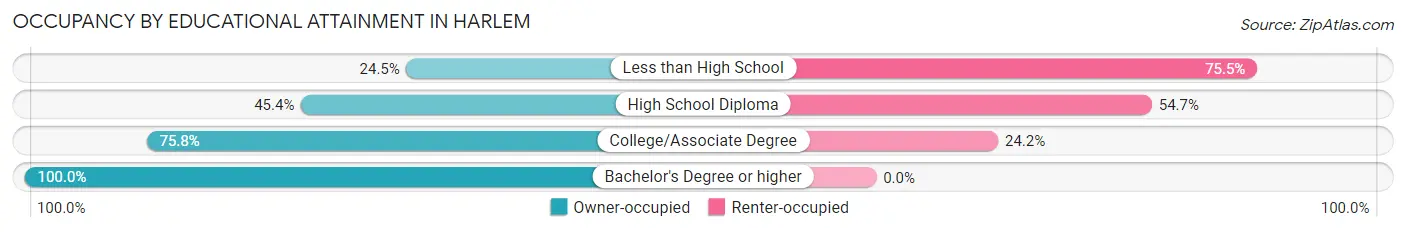
| Household Size | Owner-occupied | Renter-occupied |
| Less than High School | 34 (24.5%) | 105 (75.5%) |
| High School Diploma | 244 (45.4%) | 294 (54.6%) |
| College/Associate Degree | 135 (75.8%) | 43 (24.2%) |
| Bachelor's Degree or higher | 20 (100.0%) | 0 (0.0%) |
Occupancy by Age of Householder in Harlem
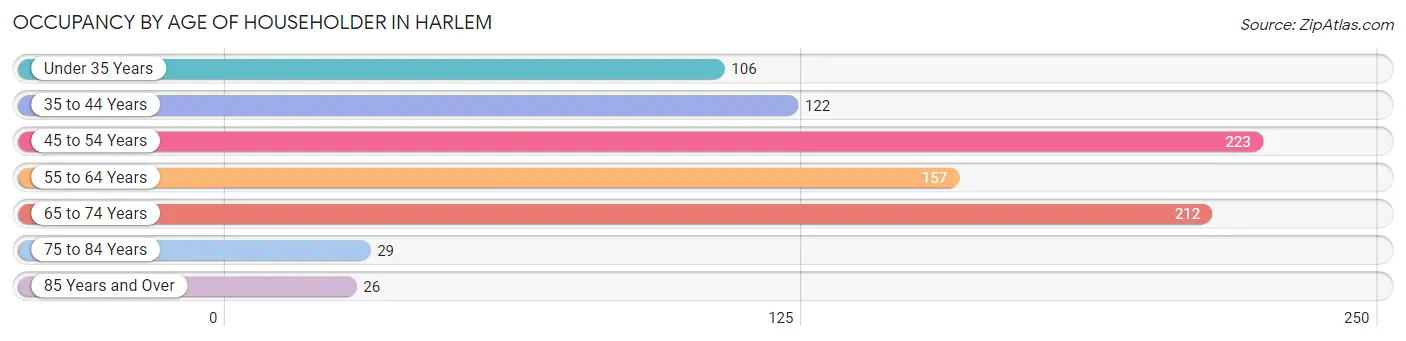
| Age Bracket | # Households | % Households |
| Under 35 Years | 106 | 12.1% |
| 35 to 44 Years | 122 | 13.9% |
| 45 to 54 Years | 223 | 25.5% |
| 55 to 64 Years | 157 | 17.9% |
| 65 to 74 Years | 212 | 24.2% |
| 75 to 84 Years | 29 | 3.3% |
| 85 Years and Over | 26 | 3.0% |
| Total | 875 | 100.0% |
Housing Finances in Harlem
Median Income by Occupancy in Harlem
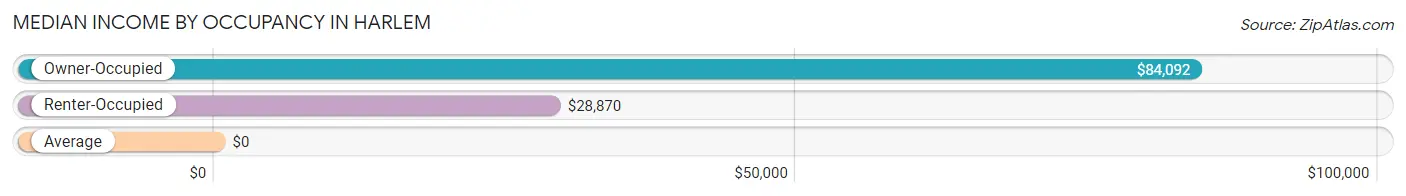
| Occupancy Type | # Households | Median Income |
| Owner-Occupied | 433 (49.5%) | $84,092 |
| Renter-Occupied | 442 (50.5%) | $28,870 |
| Average | 875 (100.0%) | $0 |
Occupancy by Householder Income Bracket in Harlem
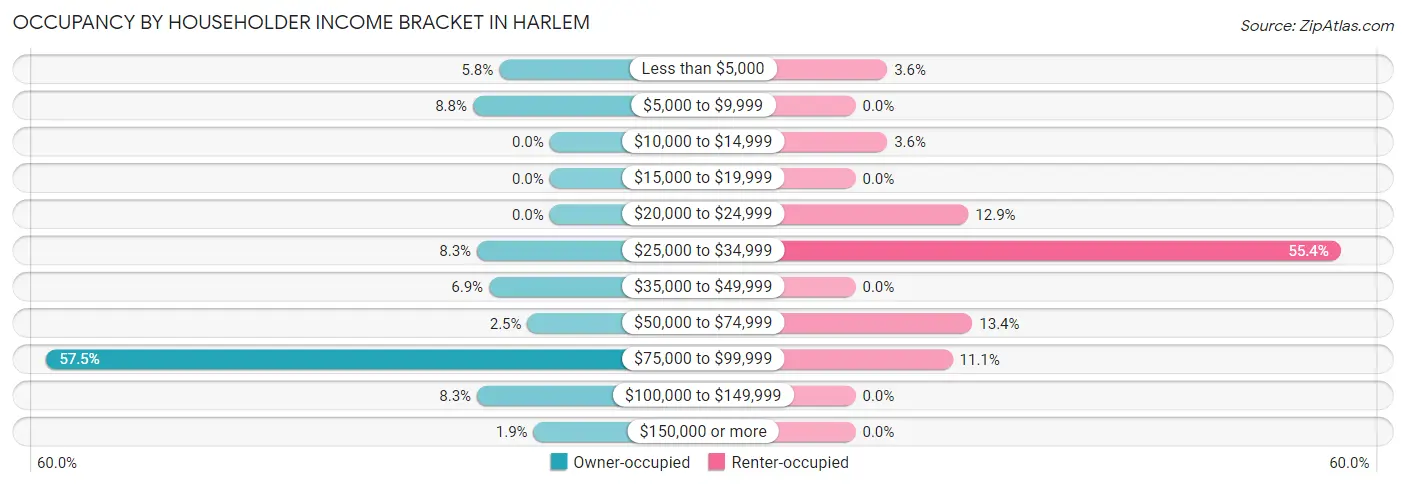
| Income Bracket | Owner-occupied | Renter-occupied |
| Less than $5,000 | 25 (5.8%) | 16 (3.6%) |
| $5,000 to $9,999 | 38 (8.8%) | 0 (0.0%) |
| $10,000 to $14,999 | 0 (0.0%) | 16 (3.6%) |
| $15,000 to $19,999 | 0 (0.0%) | 0 (0.0%) |
| $20,000 to $24,999 | 0 (0.0%) | 57 (12.9%) |
| $25,000 to $34,999 | 36 (8.3%) | 245 (55.4%) |
| $35,000 to $49,999 | 30 (6.9%) | 0 (0.0%) |
| $50,000 to $74,999 | 11 (2.5%) | 59 (13.4%) |
| $75,000 to $99,999 | 249 (57.5%) | 49 (11.1%) |
| $100,000 to $149,999 | 36 (8.3%) | 0 (0.0%) |
| $150,000 or more | 8 (1.8%) | 0 (0.0%) |
| Total | 433 (100.0%) | 442 (100.0%) |
Monthly Housing Cost Tiers in Harlem
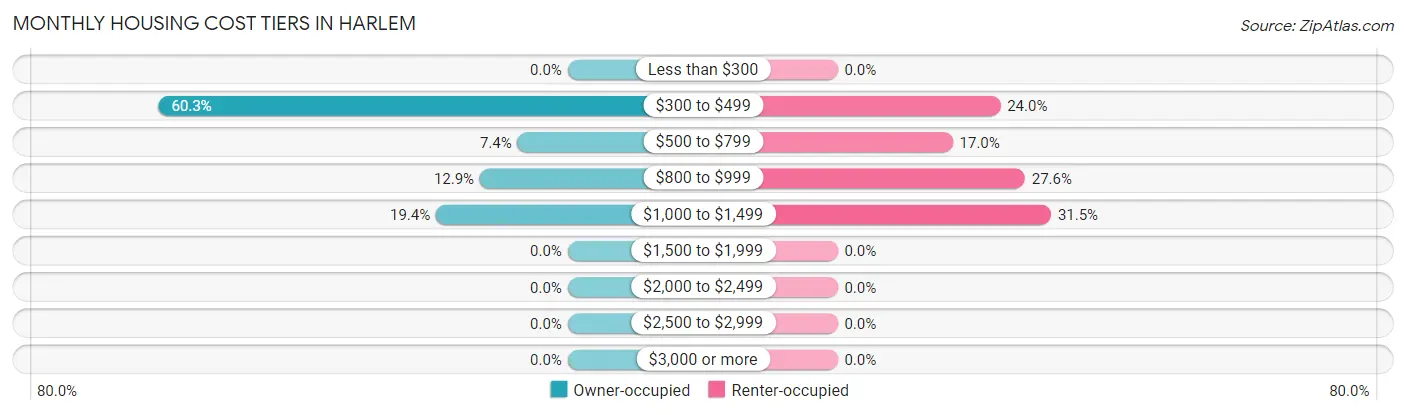
| Monthly Cost | Owner-occupied | Renter-occupied |
| Less than $300 | 0 (0.0%) | 0 (0.0%) |
| $300 to $499 | 261 (60.3%) | 106 (24.0%) |
| $500 to $799 | 32 (7.4%) | 75 (17.0%) |
| $800 to $999 | 56 (12.9%) | 122 (27.6%) |
| $1,000 to $1,499 | 84 (19.4%) | 139 (31.5%) |
| $1,500 to $1,999 | 0 (0.0%) | 0 (0.0%) |
| $2,000 to $2,499 | 0 (0.0%) | 0 (0.0%) |
| $2,500 to $2,999 | 0 (0.0%) | 0 (0.0%) |
| $3,000 or more | 0 (0.0%) | 0 (0.0%) |
| Total | 433 (100.0%) | 442 (100.0%) |
Physical Housing Characteristics in Harlem
Housing Structures in Harlem
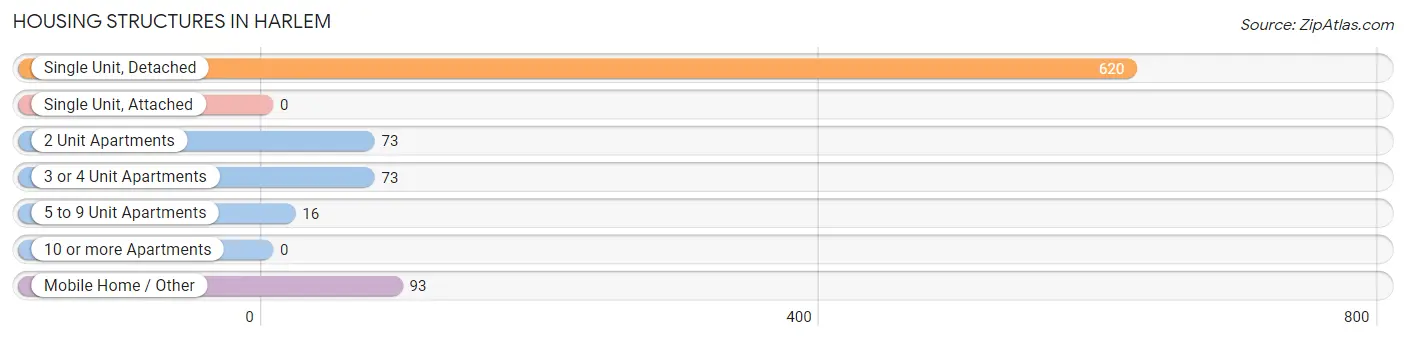
| Structure Type | # Housing Units | % Housing Units |
| Single Unit, Detached | 620 | 70.9% |
| Single Unit, Attached | 0 | 0.0% |
| 2 Unit Apartments | 73 | 8.3% |
| 3 or 4 Unit Apartments | 73 | 8.3% |
| 5 to 9 Unit Apartments | 16 | 1.8% |
| 10 or more Apartments | 0 | 0.0% |
| Mobile Home / Other | 93 | 10.6% |
| Total | 875 | 100.0% |
Housing Structures by Occupancy in Harlem
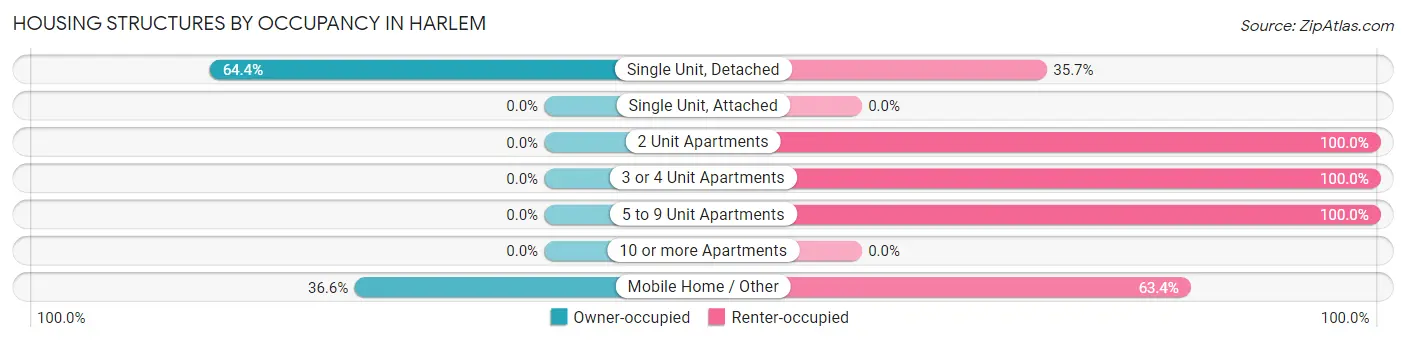
| Structure Type | Owner-occupied | Renter-occupied |
| Single Unit, Detached | 399 (64.3%) | 221 (35.6%) |
| Single Unit, Attached | 0 (0.0%) | 0 (0.0%) |
| 2 Unit Apartments | 0 (0.0%) | 73 (100.0%) |
| 3 or 4 Unit Apartments | 0 (0.0%) | 73 (100.0%) |
| 5 to 9 Unit Apartments | 0 (0.0%) | 16 (100.0%) |
| 10 or more Apartments | 0 (0.0%) | 0 (0.0%) |
| Mobile Home / Other | 34 (36.6%) | 59 (63.4%) |
| Total | 433 (49.5%) | 442 (50.5%) |
Housing Structures by Number of Rooms in Harlem
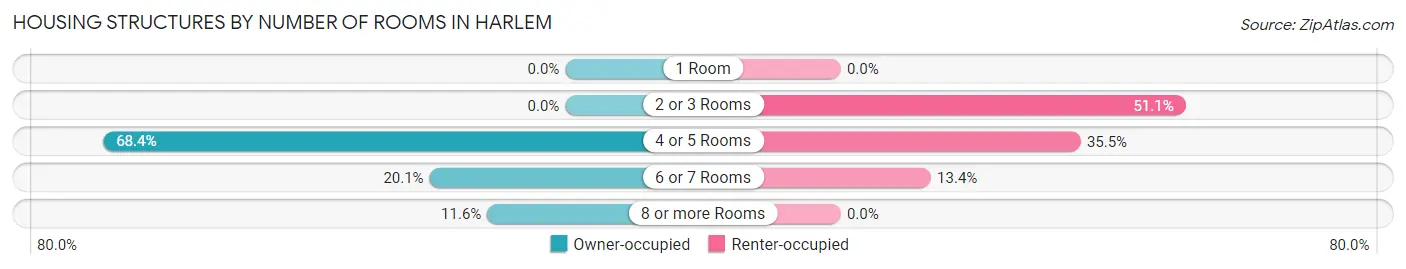
| Number of Rooms | Owner-occupied | Renter-occupied |
| 1 Room | 0 (0.0%) | 0 (0.0%) |
| 2 or 3 Rooms | 0 (0.0%) | 226 (51.1%) |
| 4 or 5 Rooms | 296 (68.4%) | 157 (35.5%) |
| 6 or 7 Rooms | 87 (20.1%) | 59 (13.4%) |
| 8 or more Rooms | 50 (11.6%) | 0 (0.0%) |
| Total | 433 (100.0%) | 442 (100.0%) |
Housing Structure by Heating Type in Harlem
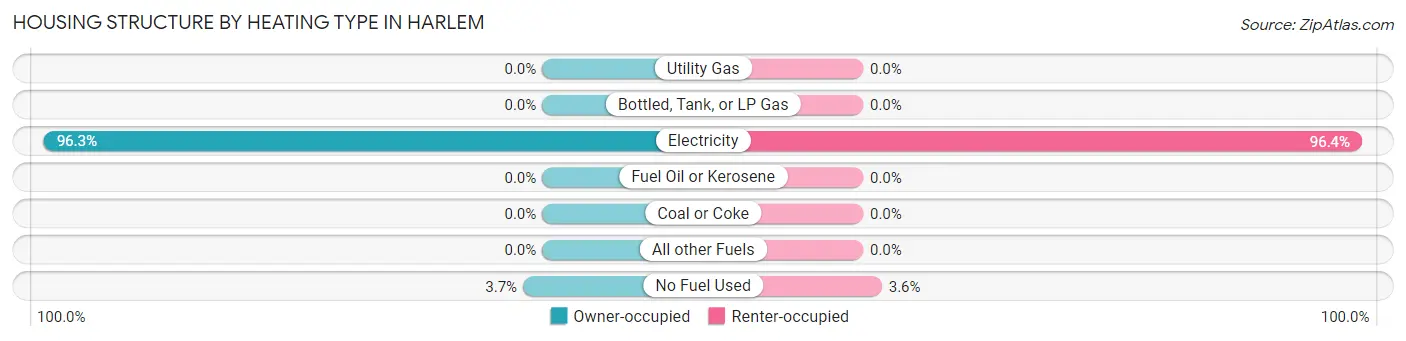
| Heating Type | Owner-occupied | Renter-occupied |
| Utility Gas | 0 (0.0%) | 0 (0.0%) |
| Bottled, Tank, or LP Gas | 0 (0.0%) | 0 (0.0%) |
| Electricity | 417 (96.3%) | 426 (96.4%) |
| Fuel Oil or Kerosene | 0 (0.0%) | 0 (0.0%) |
| Coal or Coke | 0 (0.0%) | 0 (0.0%) |
| All other Fuels | 0 (0.0%) | 0 (0.0%) |
| No Fuel Used | 16 (3.7%) | 16 (3.6%) |
| Total | 433 (100.0%) | 442 (100.0%) |
Household Vehicle Usage in Harlem
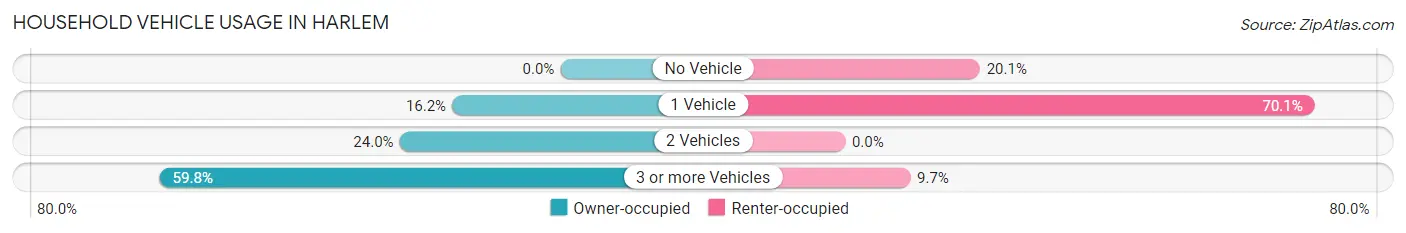
| Vehicles per Household | Owner-occupied | Renter-occupied |
| No Vehicle | 0 (0.0%) | 89 (20.1%) |
| 1 Vehicle | 70 (16.2%) | 310 (70.1%) |
| 2 Vehicles | 104 (24.0%) | 0 (0.0%) |
| 3 or more Vehicles | 259 (59.8%) | 43 (9.7%) |
| Total | 433 (100.0%) | 442 (100.0%) |
Real Estate & Mortgages in Harlem
Real Estate and Mortgage Overview in Harlem
| Characteristic | Without Mortgage | With Mortgage |
| Housing Units | 296 | 137 |
| Median Property Value | - | - |
| Median Household Income | $88,784 | $0 |
| Monthly Housing Costs | $412 | $0 |
| Real Estate Taxes | $1,207 | $19 |
Property Value by Mortgage Status in Harlem
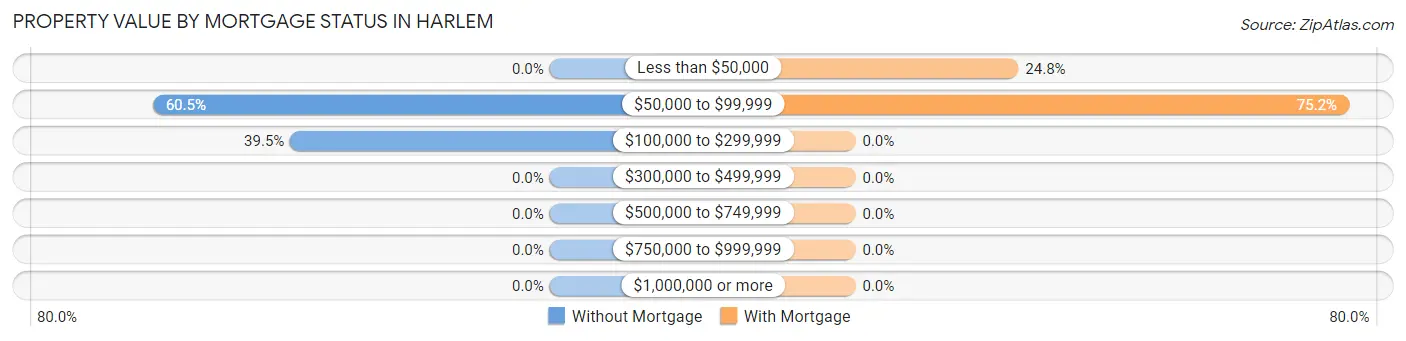
| Property Value | Without Mortgage | With Mortgage |
| Less than $50,000 | 0 (0.0%) | 34 (24.8%) |
| $50,000 to $99,999 | 179 (60.5%) | 103 (75.2%) |
| $100,000 to $299,999 | 117 (39.5%) | 0 (0.0%) |
| $300,000 to $499,999 | 0 (0.0%) | 0 (0.0%) |
| $500,000 to $749,999 | 0 (0.0%) | 0 (0.0%) |
| $750,000 to $999,999 | 0 (0.0%) | 0 (0.0%) |
| $1,000,000 or more | 0 (0.0%) | 0 (0.0%) |
| Total | 296 (100.0%) | 137 (100.0%) |
Household Income by Mortgage Status in Harlem
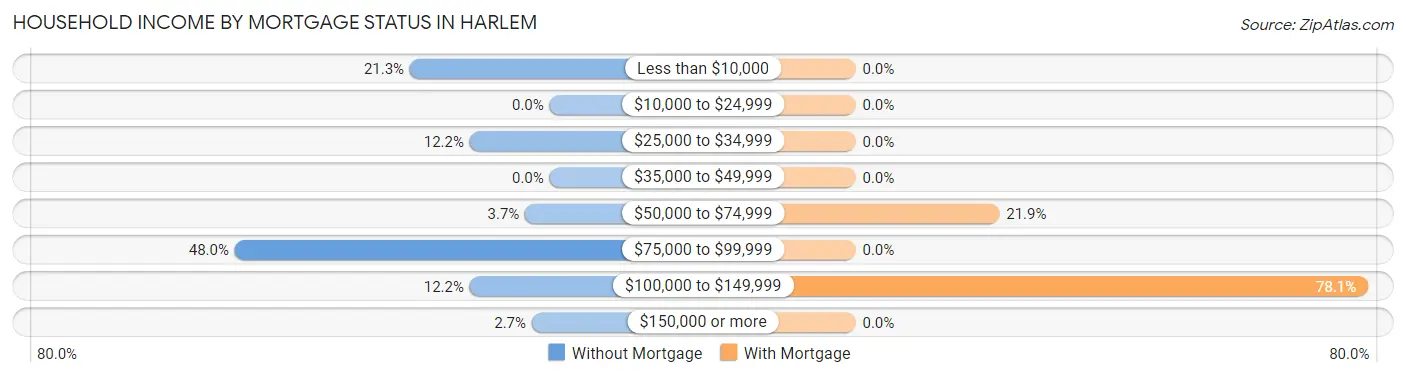
| Household Income | Without Mortgage | With Mortgage |
| Less than $10,000 | 63 (21.3%) | 0 (0.0%) |
| $10,000 to $24,999 | 0 (0.0%) | 0 (0.0%) |
| $25,000 to $34,999 | 36 (12.2%) | 0 (0.0%) |
| $35,000 to $49,999 | 0 (0.0%) | 0 (0.0%) |
| $50,000 to $74,999 | 11 (3.7%) | 30 (21.9%) |
| $75,000 to $99,999 | 142 (48.0%) | 0 (0.0%) |
| $100,000 to $149,999 | 36 (12.2%) | 107 (78.1%) |
| $150,000 or more | 8 (2.7%) | 0 (0.0%) |
| Total | 296 (100.0%) | 137 (100.0%) |
Property Value to Household Income Ratio in Harlem
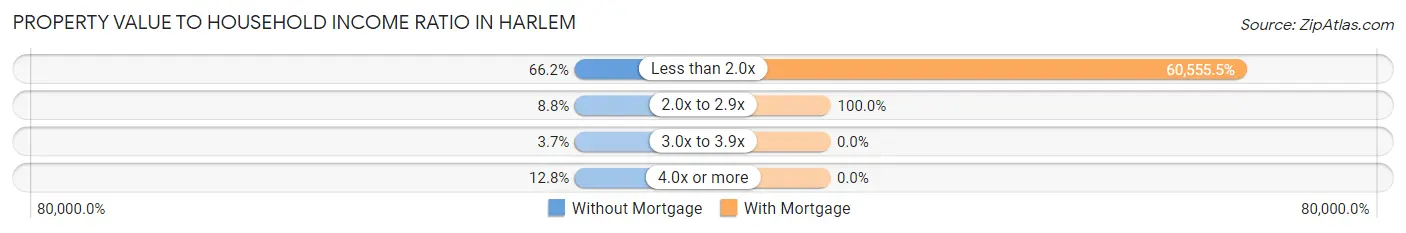
| Value-to-Income Ratio | Without Mortgage | With Mortgage |
| Less than 2.0x | 196 (66.2%) | 82,961 (60,555.5%) |
| 2.0x to 2.9x | 26 (8.8%) | 137 (100.0%) |
| 3.0x to 3.9x | 11 (3.7%) | 0 (0.0%) |
| 4.0x or more | 38 (12.8%) | 0 (0.0%) |
| Total | 296 (100.0%) | 137 (100.0%) |
Real Estate Taxes by Mortgage Status in Harlem
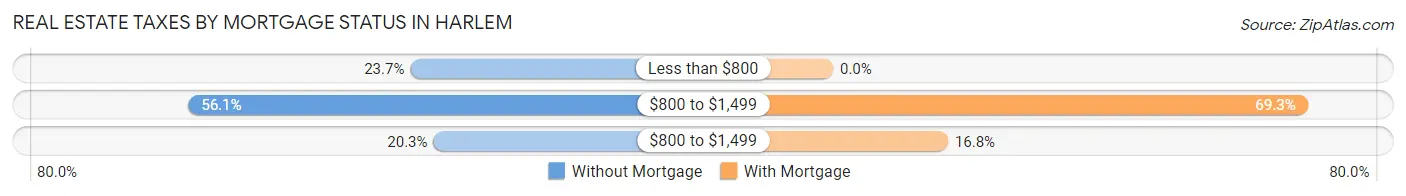
| Property Taxes | Without Mortgage | With Mortgage |
| Less than $800 | 70 (23.6%) | 0 (0.0%) |
| $800 to $1,499 | 166 (56.1%) | 95 (69.3%) |
| $800 to $1,499 | 60 (20.3%) | 23 (16.8%) |
| Total | 296 (100.0%) | 137 (100.0%) |
Health & Disability in Harlem
Health Insurance Coverage by Age in Harlem
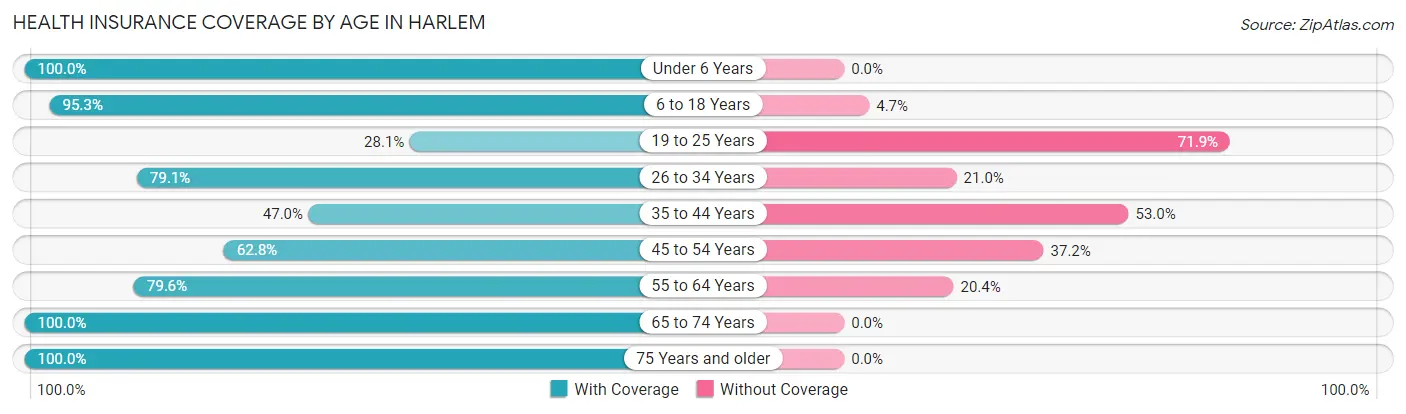
| Age Bracket | With Coverage | Without Coverage |
| Under 6 Years | 323 (100.0%) | 0 (0.0%) |
| 6 to 18 Years | 511 (95.3%) | 25 (4.7%) |
| 19 to 25 Years | 118 (28.1%) | 302 (71.9%) |
| 26 to 34 Years | 83 (79.0%) | 22 (20.9%) |
| 35 to 44 Years | 117 (47.0%) | 132 (53.0%) |
| 45 to 54 Years | 235 (62.8%) | 139 (37.2%) |
| 55 to 64 Years | 211 (79.6%) | 54 (20.4%) |
| 65 to 74 Years | 228 (100.0%) | 0 (0.0%) |
| 75 Years and older | 76 (100.0%) | 0 (0.0%) |
| Total | 1,902 (73.8%) | 674 (26.2%) |
Health Insurance Coverage by Citizenship Status in Harlem
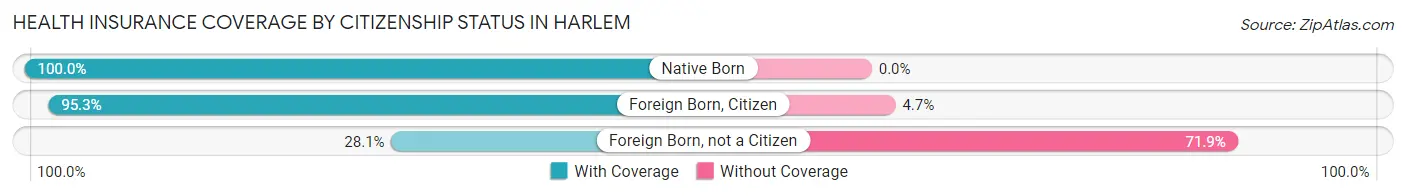
| Citizenship Status | With Coverage | Without Coverage |
| Native Born | 323 (100.0%) | 0 (0.0%) |
| Foreign Born, Citizen | 511 (95.3%) | 25 (4.7%) |
| Foreign Born, not a Citizen | 118 (28.1%) | 302 (71.9%) |
Health Insurance Coverage by Household Income in Harlem
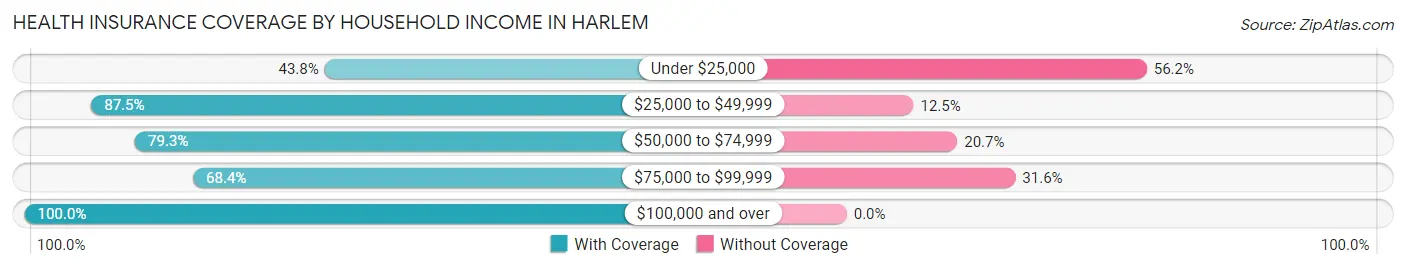
| Household Income | With Coverage | Without Coverage |
| Under $25,000 | 106 (43.8%) | 136 (56.2%) |
| $25,000 to $49,999 | 560 (87.5%) | 80 (12.5%) |
| $50,000 to $74,999 | 226 (79.3%) | 59 (20.7%) |
| $75,000 to $99,999 | 864 (68.4%) | 399 (31.6%) |
| $100,000 and over | 146 (100.0%) | 0 (0.0%) |
Public vs Private Health Insurance Coverage by Age in Harlem
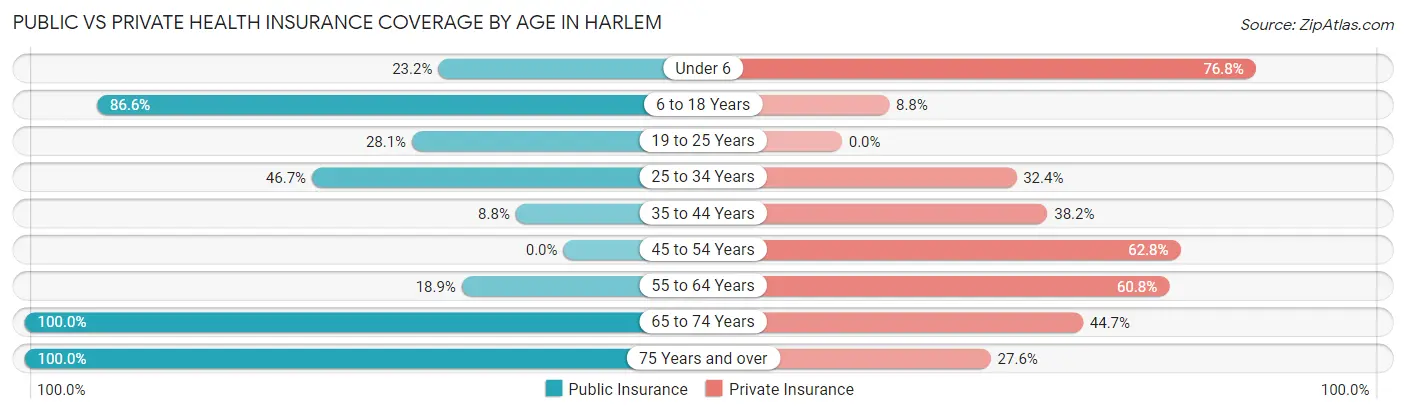
| Age Bracket | Public Insurance | Private Insurance |
| Under 6 | 75 (23.2%) | 248 (76.8%) |
| 6 to 18 Years | 464 (86.6%) | 47 (8.8%) |
| 19 to 25 Years | 118 (28.1%) | 0 (0.0%) |
| 25 to 34 Years | 49 (46.7%) | 34 (32.4%) |
| 35 to 44 Years | 22 (8.8%) | 95 (38.2%) |
| 45 to 54 Years | 0 (0.0%) | 235 (62.8%) |
| 55 to 64 Years | 50 (18.9%) | 161 (60.8%) |
| 65 to 74 Years | 228 (100.0%) | 102 (44.7%) |
| 75 Years and over | 76 (100.0%) | 21 (27.6%) |
| Total | 1,082 (42.0%) | 943 (36.6%) |
Disability Status by Sex by Age in Harlem
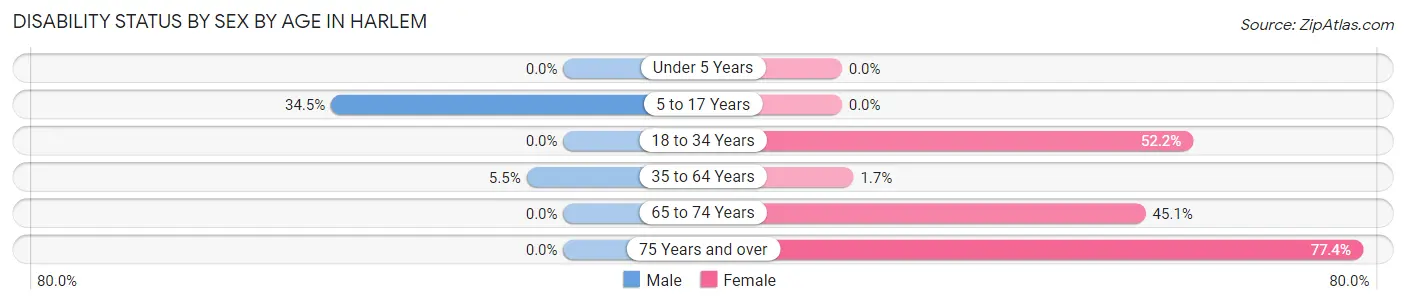
| Age Bracket | Male | Female |
| Under 5 Years | 0 (0.0%) | 0 (0.0%) |
| 5 to 17 Years | 59 (34.5%) | 0 (0.0%) |
| 18 to 34 Years | 0 (0.0%) | 157 (52.2%) |
| 35 to 64 Years | 17 (5.5%) | 10 (1.7%) |
| 65 to 74 Years | 0 (0.0%) | 74 (45.1%) |
| 75 Years and over | 0 (0.0%) | 41 (77.4%) |
Disability Class by Sex by Age in Harlem
Disability Class: Hearing Difficulty
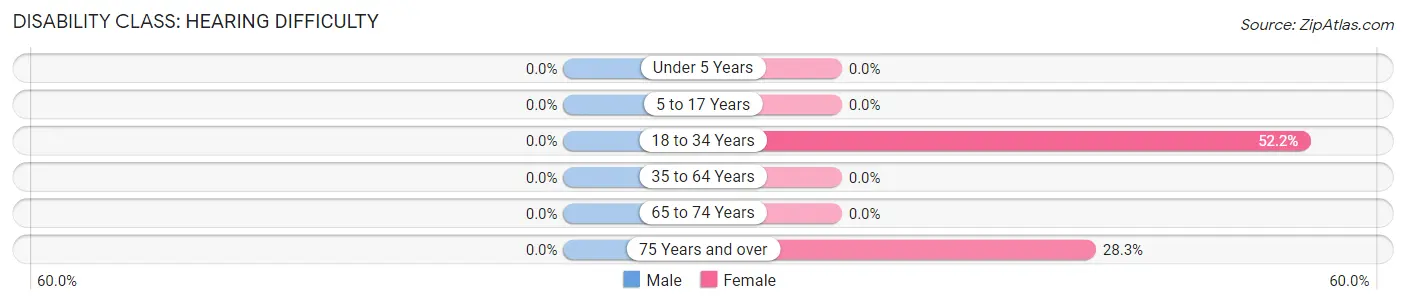
| Age Bracket | Male | Female |
| Under 5 Years | 0 (0.0%) | 0 (0.0%) |
| 5 to 17 Years | 0 (0.0%) | 0 (0.0%) |
| 18 to 34 Years | 0 (0.0%) | 157 (52.2%) |
| 35 to 64 Years | 0 (0.0%) | 0 (0.0%) |
| 65 to 74 Years | 0 (0.0%) | 0 (0.0%) |
| 75 Years and over | 0 (0.0%) | 15 (28.3%) |
Disability Class: Vision Difficulty
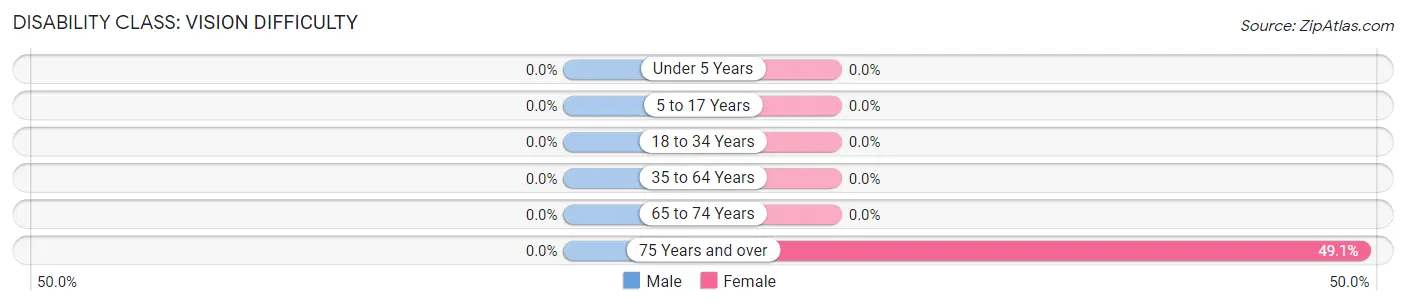
| Age Bracket | Male | Female |
| Under 5 Years | 0 (0.0%) | 0 (0.0%) |
| 5 to 17 Years | 0 (0.0%) | 0 (0.0%) |
| 18 to 34 Years | 0 (0.0%) | 0 (0.0%) |
| 35 to 64 Years | 0 (0.0%) | 0 (0.0%) |
| 65 to 74 Years | 0 (0.0%) | 0 (0.0%) |
| 75 Years and over | 0 (0.0%) | 26 (49.1%) |
Disability Class: Cognitive Difficulty
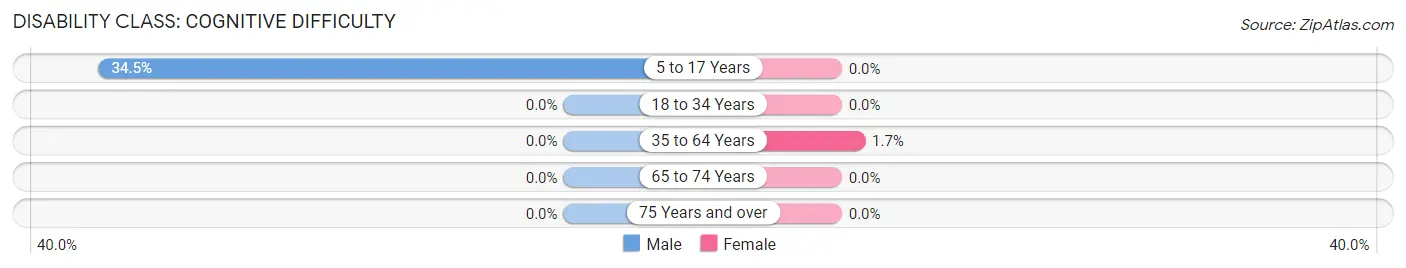
| Age Bracket | Male | Female |
| 5 to 17 Years | 59 (34.5%) | 0 (0.0%) |
| 18 to 34 Years | 0 (0.0%) | 0 (0.0%) |
| 35 to 64 Years | 0 (0.0%) | 10 (1.7%) |
| 65 to 74 Years | 0 (0.0%) | 0 (0.0%) |
| 75 Years and over | 0 (0.0%) | 0 (0.0%) |
Disability Class: Ambulatory Difficulty
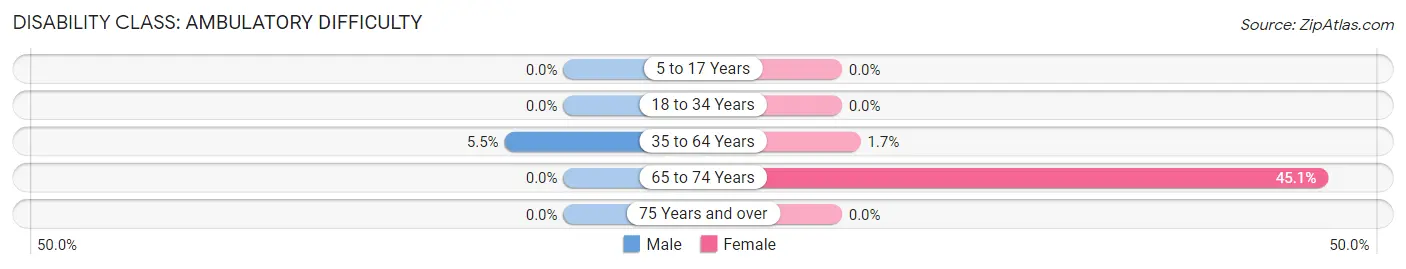
| Age Bracket | Male | Female |
| 5 to 17 Years | 0 (0.0%) | 0 (0.0%) |
| 18 to 34 Years | 0 (0.0%) | 0 (0.0%) |
| 35 to 64 Years | 17 (5.5%) | 10 (1.7%) |
| 65 to 74 Years | 0 (0.0%) | 74 (45.1%) |
| 75 Years and over | 0 (0.0%) | 0 (0.0%) |
Disability Class: Self-Care Difficulty
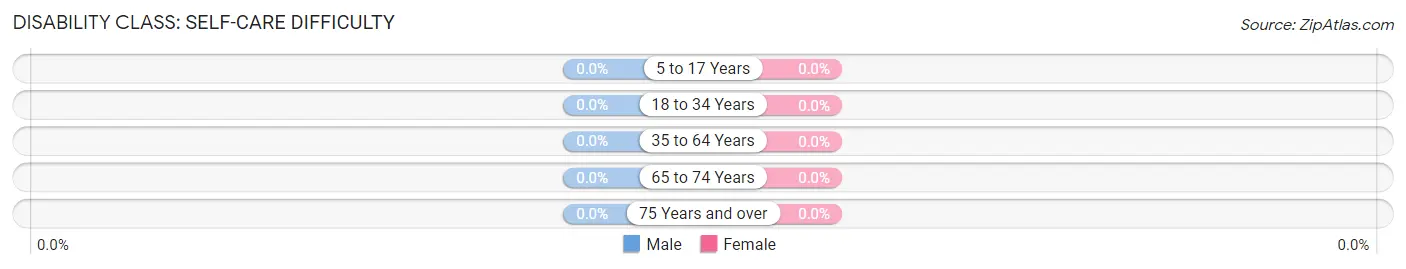
| Age Bracket | Male | Female |
| 5 to 17 Years | 0 (0.0%) | 0 (0.0%) |
| 18 to 34 Years | 0 (0.0%) | 0 (0.0%) |
| 35 to 64 Years | 0 (0.0%) | 0 (0.0%) |
| 65 to 74 Years | 0 (0.0%) | 0 (0.0%) |
| 75 Years and over | 0 (0.0%) | 0 (0.0%) |
Technology Access in Harlem
Computing Device Access in Harlem
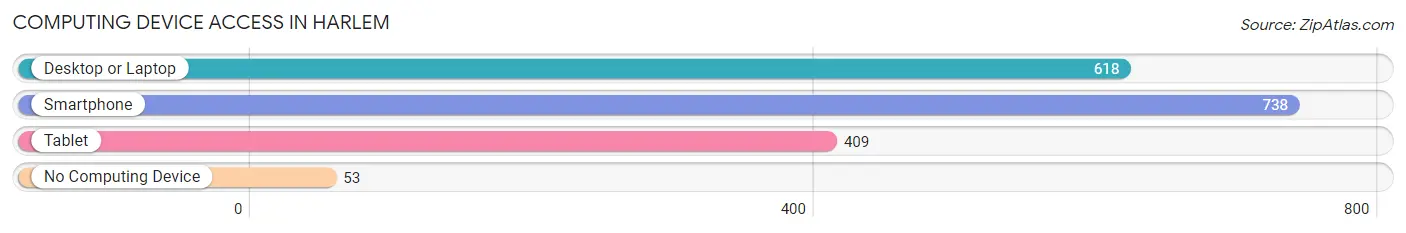
| Device Type | # Households | % Households |
| Desktop or Laptop | 618 | 70.6% |
| Smartphone | 738 | 84.3% |
| Tablet | 409 | 46.7% |
| No Computing Device | 53 | 6.1% |
| Total | 875 | 100.0% |
Internet Access in Harlem
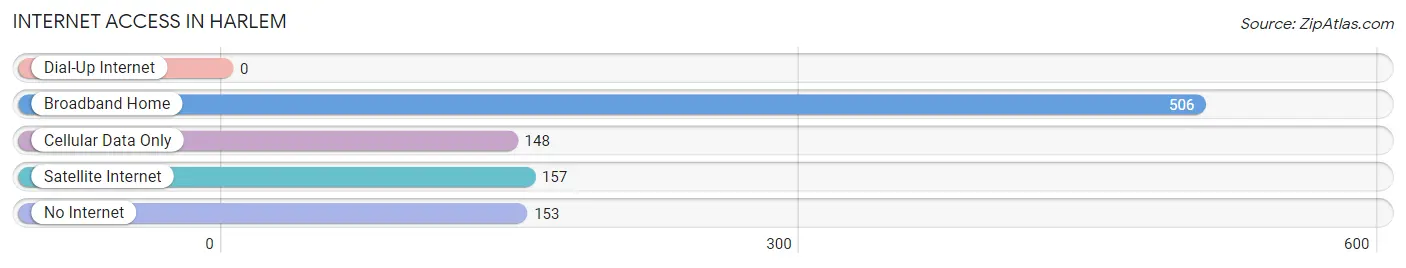
| Internet Type | # Households | % Households |
| Dial-Up Internet | 0 | 0.0% |
| Broadband Home | 506 | 57.8% |
| Cellular Data Only | 148 | 16.9% |
| Satellite Internet | 157 | 17.9% |
| No Internet | 153 | 17.5% |
| Total | 875 | 100.0% |
Harlem Summary
Harlem, Florida is a small town located in the northern part of the state, in Hamilton County. It is situated on the banks of the Suwannee River, and is home to a population of just over 500 people. The town was founded in 1884 by a group of settlers from the nearby town of White Springs. The town was named after the famous Harlem neighborhood in New York City.
Geography
Harlem is located in the northern part of Florida, in Hamilton County. It is situated on the banks of the Suwannee River, and is bordered by the towns of White Springs, Jasper, and Jennings. The town is located in a rural area, and is surrounded by forests and farmland. The town is located at an elevation of about 100 feet above sea level.
The climate in Harlem is humid subtropical, with hot summers and mild winters. The average temperature in the summer is around 90 degrees Fahrenheit, and the average temperature in the winter is around 60 degrees Fahrenheit. The town receives an average of 50 inches of rain per year.
Economy
The economy of Harlem is largely based on agriculture and forestry. The town is home to several farms, and the surrounding area is home to many timber companies. The town is also home to several small businesses, including a grocery store, a hardware store, and a restaurant.
The town is also home to a small manufacturing plant, which produces plastic products. The town is also home to a small airport, which serves the surrounding area.
Demographics
As of the 2010 census, the population of Harlem was 514 people. The racial makeup of the town was 94.3% White, 2.7% African American, 0.2% Native American, 0.4% Asian, 0.2% from other races, and 2.2% from two or more races. Hispanic or Latino of any race were 1.2% of the population.
The median income for a household in the town was $25,625, and the median income for a family was $31,250. The per capita income for the town was $14,945. About 17.2% of families and 20.2% of the population were below the poverty line, including 28.3% of those under age 18 and 11.1% of those age 65 or over.
Conclusion
Harlem, Florida is a small town located in the northern part of the state, in Hamilton County. It is situated on the banks of the Suwannee River, and is home to a population of just over 500 people. The town was founded in 1884 by a group of settlers from the nearby town of White Springs. The town is largely based on agriculture and forestry, and is home to several small businesses. The population of the town is mostly white, with a small percentage of African Americans, Native Americans, and Asians. The median income for a household in the town is $25,625, and the per capita income for the town is $14,945.
Common Questions
What is Per Capita Income in Harlem?
Per Capita income in Harlem is $17,966.
What is the Median Family Income in Harlem?
Median Family Income in Harlem is $81,630.
What is Inequality or Gini Index in Harlem?
Inequality or Gini Index in Harlem is 0.36.
What is the Total Population of Harlem?
Total Population of Harlem is 2,576.
What is the Total Male Population of Harlem?
Total Male Population of Harlem is 868.
What is the Total Female Population of Harlem?
Total Female Population of Harlem is 1,708.
What is the Ratio of Males per 100 Females in Harlem?
There are 50.82 Males per 100 Females in Harlem.
What is the Ratio of Females per 100 Males in Harlem?
There are 196.77 Females per 100 Males in Harlem.
What is the Median Population Age in Harlem?
Median Population Age in Harlem is 27.4 Years.
What is the Average Family Size in Harlem
Average Family Size in Harlem is 4.0 People.
What is the Average Household Size in Harlem
Average Household Size in Harlem is 2.9 People.
How Large is the Labor Force in Harlem?
There are 1,233 People in the Labor Forcein in Harlem.
What is the Percentage of People in the Labor Force in Harlem?
67.8% of People are in the Labor Force in Harlem.
What is the Unemployment Rate in Harlem?
Unemployment Rate in Harlem is 16.6%.