Bay Hill, FL Map & Demographics
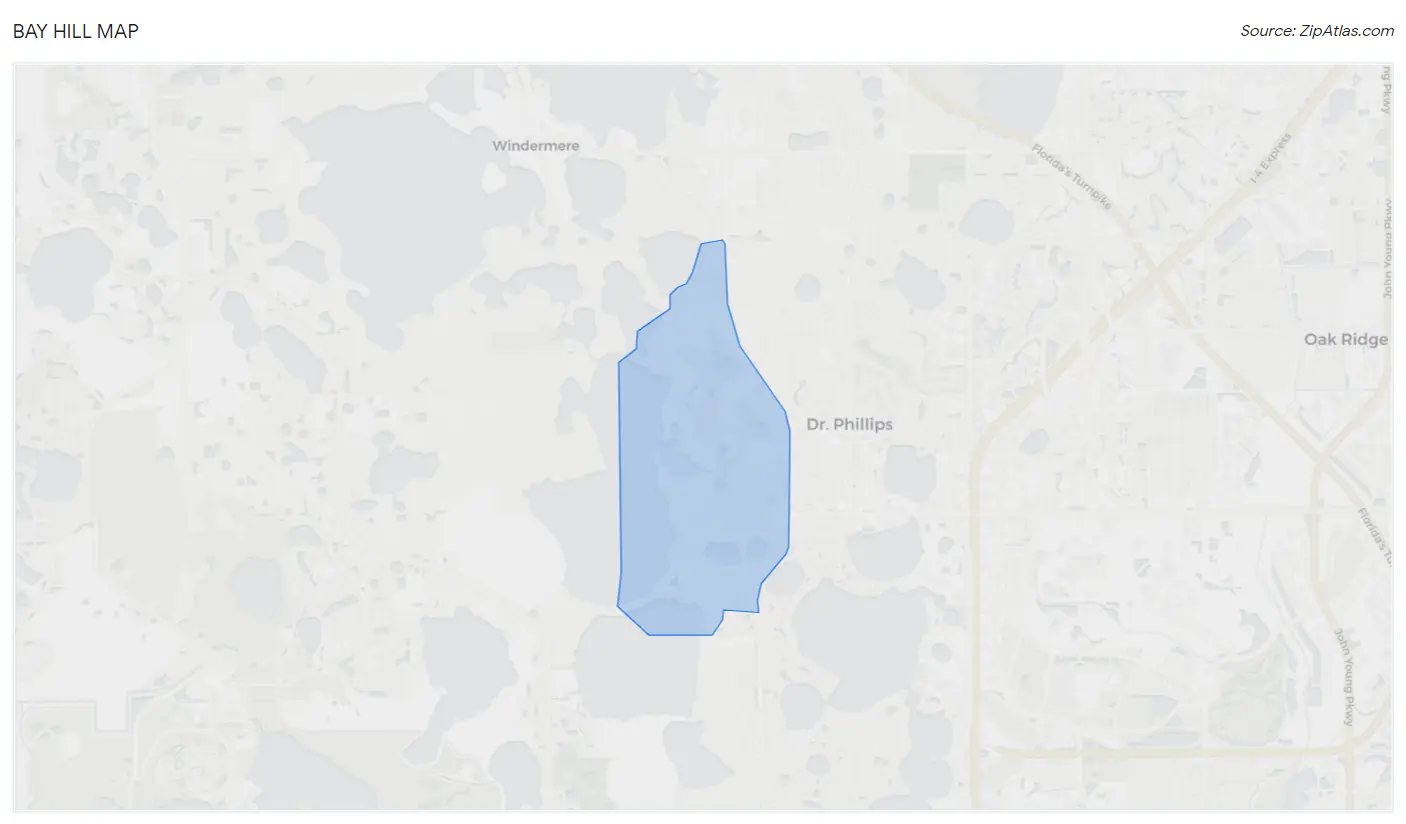
Bay Hill Map
Bay Hill Overview
$89,647
PER CAPITA INCOME
$136,867
AVG FAMILY INCOME
$135,063
AVG HOUSEHOLD INCOME
36.8%
WAGE / INCOME GAP [ % ]
63.2¢/ $1
WAGE / INCOME GAP [ $ ]
0.56
INEQUALITY / GINI INDEX
4,363
TOTAL POPULATION
2,139
MALE POPULATION
2,224
FEMALE POPULATION
96.18
MALES / 100 FEMALES
103.97
FEMALES / 100 MALES
52.3
MEDIAN AGE
2.7
AVG FAMILY SIZE
2.5
AVG HOUSEHOLD SIZE
2,514
LABOR FORCE [ PEOPLE ]
63.7%
PERCENT IN LABOR FORCE
2.0%
UNEMPLOYMENT RATE
Income in Bay Hill
Income Overview in Bay Hill
Per Capita Income in Bay Hill is $89,647, while median incomes of families and households are $136,867 and $135,063 respectively.
| Characteristic | Number | Measure |
| Per Capita Income | 4,363 | $89,647 |
| Median Family Income | 1,446 | $136,867 |
| Mean Family Income | 1,446 | $255,752 |
| Median Household Income | 1,714 | $135,063 |
| Mean Household Income | 1,714 | $229,392 |
| Income Deficit | 1,446 | $0 |
| Wage / Income Gap (%) | 4,363 | 36.79% |
| Wage / Income Gap ($) | 4,363 | 63.21¢ per $1 |
| Gini / Inequality Index | 4,363 | 0.56 |
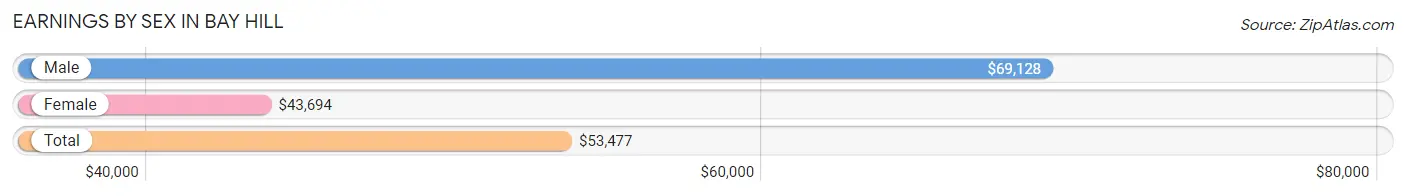
Earnings by Sex in Bay Hill
Average Earnings in Bay Hill are $53,477, $69,128 for men and $43,694 for women, a difference of 36.8%.
| Sex | Number | Average Earnings |
| Male | 1,348 (52.6%) | $69,128 |
| Female | 1,213 (47.4%) | $43,694 |
| Total | 2,561 (100.0%) | $53,477 |
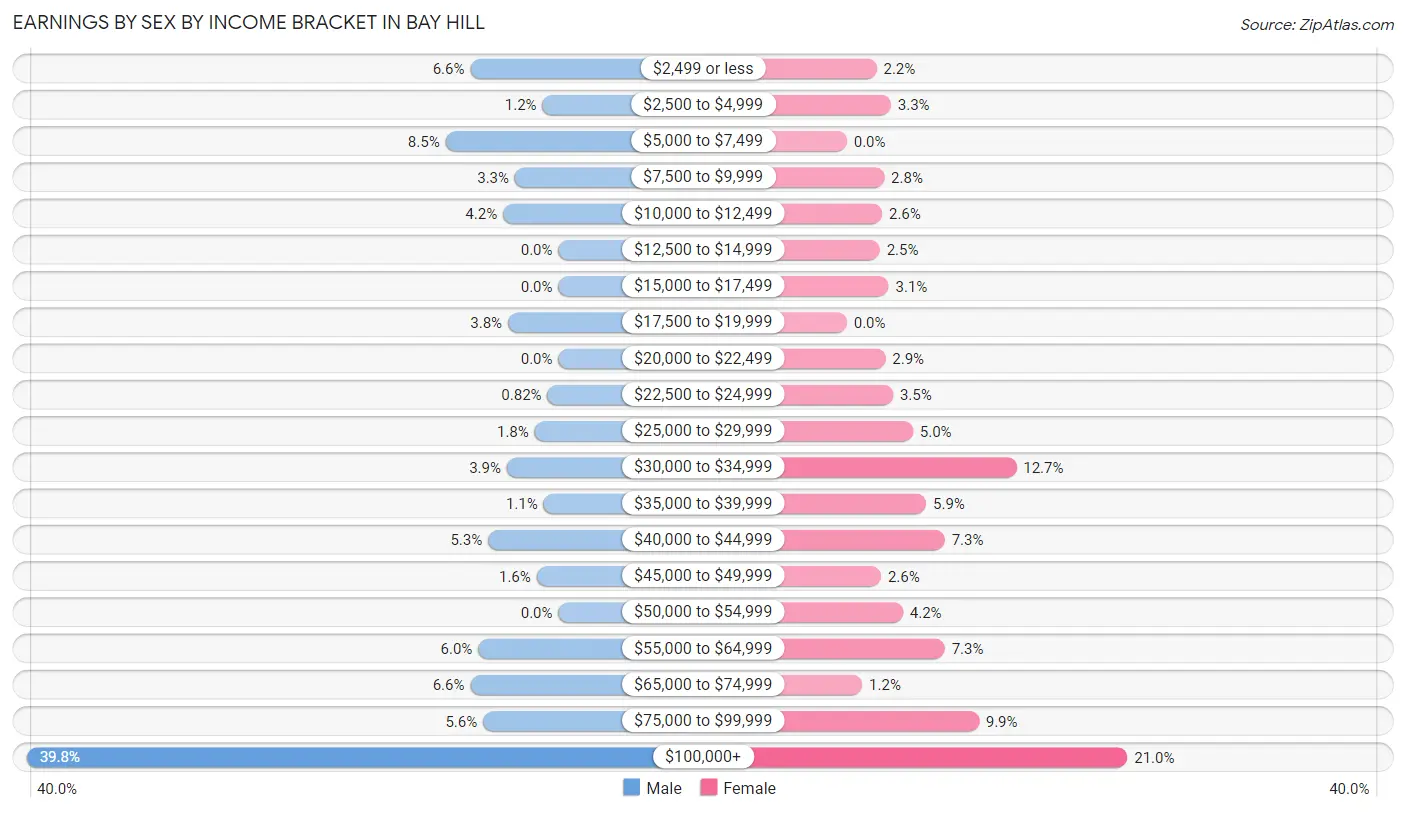
Earnings by Sex by Income Bracket in Bay Hill
The most common earnings brackets in Bay Hill are $100,000+ for men (537 | 39.8%) and $100,000+ for women (255 | 21.0%).
| Income | Male | Female |
| $2,499 or less | 89 (6.6%) | 27 (2.2%) |
| $2,500 to $4,999 | 16 (1.2%) | 40 (3.3%) |
| $5,000 to $7,499 | 114 (8.5%) | 0 (0.0%) |
| $7,500 to $9,999 | 44 (3.3%) | 34 (2.8%) |
| $10,000 to $12,499 | 56 (4.2%) | 32 (2.6%) |
| $12,500 to $14,999 | 0 (0.0%) | 30 (2.5%) |
| $15,000 to $17,499 | 0 (0.0%) | 38 (3.1%) |
| $17,500 to $19,999 | 51 (3.8%) | 0 (0.0%) |
| $20,000 to $22,499 | 0 (0.0%) | 35 (2.9%) |
| $22,500 to $24,999 | 11 (0.8%) | 42 (3.5%) |
| $25,000 to $29,999 | 24 (1.8%) | 60 (5.0%) |
| $30,000 to $34,999 | 52 (3.9%) | 154 (12.7%) |
| $35,000 to $39,999 | 15 (1.1%) | 72 (5.9%) |
| $40,000 to $44,999 | 71 (5.3%) | 89 (7.3%) |
| $45,000 to $49,999 | 22 (1.6%) | 31 (2.6%) |
| $50,000 to $54,999 | 0 (0.0%) | 51 (4.2%) |
| $55,000 to $64,999 | 81 (6.0%) | 89 (7.3%) |
| $65,000 to $74,999 | 89 (6.6%) | 14 (1.1%) |
| $75,000 to $99,999 | 76 (5.6%) | 120 (9.9%) |
| $100,000+ | 537 (39.8%) | 255 (21.0%) |
| Total | 1,348 (100.0%) | 1,213 (100.0%) |
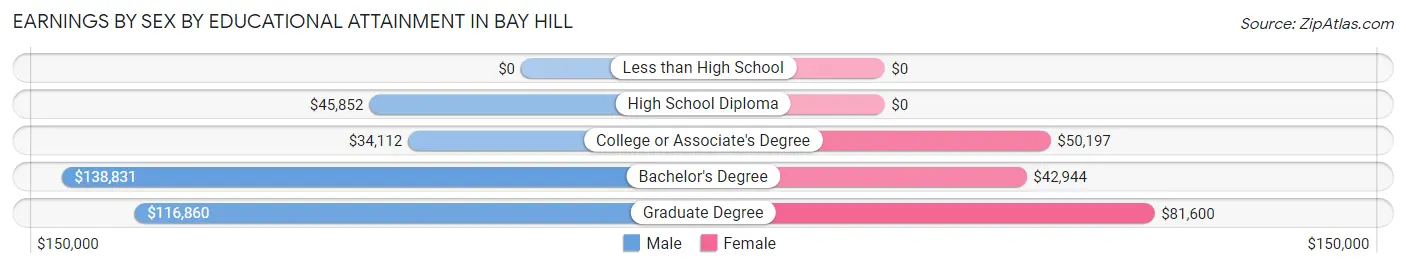
Earnings by Sex by Educational Attainment in Bay Hill
Average earnings in Bay Hill are $83,958 for men and $45,990 for women, a difference of 45.2%. Men with an educational attainment of bachelor's degree enjoy the highest average annual earnings of $138,831, while those with college or associate's degree education earn the least with $34,112. Women with an educational attainment of graduate degree earn the most with the average annual earnings of $81,600, while those with bachelor's degree education have the smallest earnings of $42,944.
| Educational Attainment | Male Income | Female Income |
| Less than High School | - | - |
| High School Diploma | $45,852 | $0 |
| College or Associate's Degree | $34,112 | $50,197 |
| Bachelor's Degree | $138,831 | $42,944 |
| Graduate Degree | $116,860 | $81,600 |
| Total | $83,958 | $45,990 |
Family Income in Bay Hill
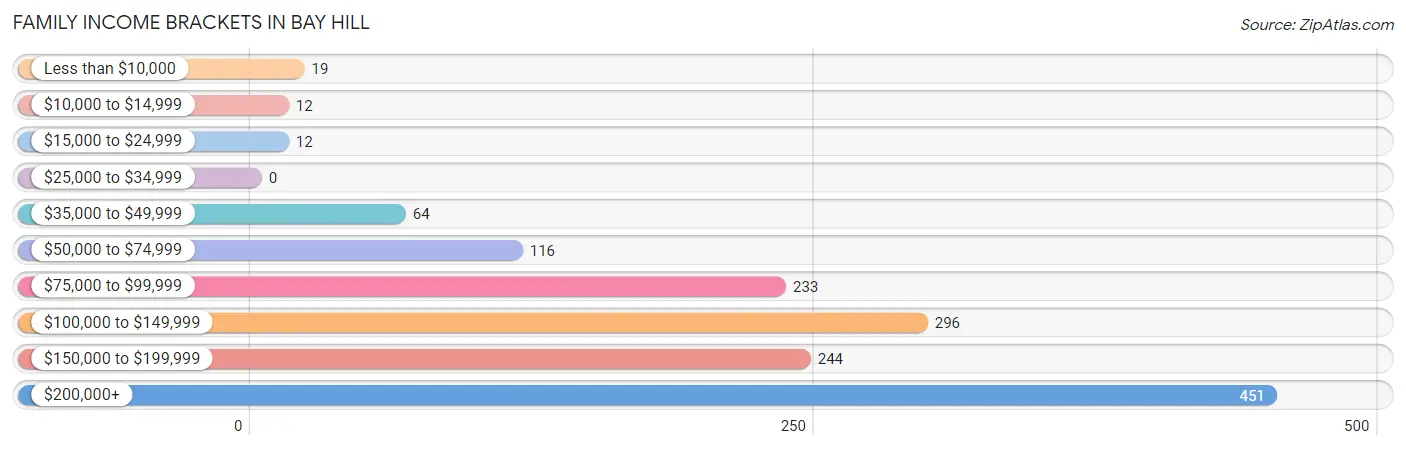
Family Income Brackets in Bay Hill
According to the Bay Hill family income data, there are 451 families falling into the $200,000+ income range, which is the most common income bracket and makes up 31.2% of all families.
| Income Bracket | # Families | % Families |
| Less than $10,000 | 19 | 1.3% |
| $10,000 to $14,999 | 12 | 0.8% |
| $15,000 to $24,999 | 12 | 0.8% |
| $25,000 to $34,999 | 0 | 0.0% |
| $35,000 to $49,999 | 64 | 4.4% |
| $50,000 to $74,999 | 116 | 8.0% |
| $75,000 to $99,999 | 233 | 16.1% |
| $100,000 to $149,999 | 296 | 20.5% |
| $150,000 to $199,999 | 244 | 16.9% |
| $200,000+ | 451 | 31.2% |
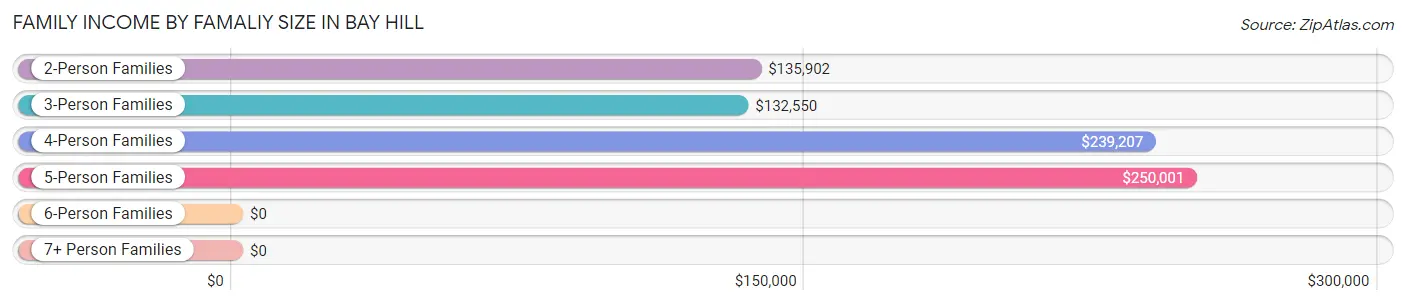
Family Income by Famaliy Size in Bay Hill
5-person families (51 | 3.5%) account for the highest median family income in Bay Hill with $250,001 per family, while 2-person families (911 | 63.0%) have the highest median income of $67,951 per family member.
| Income Bracket | # Families | Median Income |
| 2-Person Families | 911 (63.0%) | $135,902 |
| 3-Person Families | 257 (17.8%) | $132,550 |
| 4-Person Families | 214 (14.8%) | $239,207 |
| 5-Person Families | 51 (3.5%) | $250,001 |
| 6-Person Families | 13 (0.9%) | $0 |
| 7+ Person Families | 0 (0.0%) | $0 |
| Total | 1,446 (100.0%) | $136,867 |
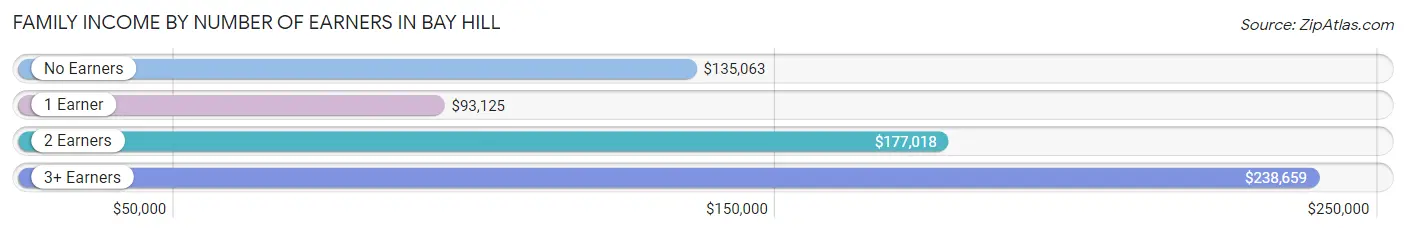
Family Income by Number of Earners in Bay Hill
The median family income in Bay Hill is $136,867, with families comprising 3+ earners (158) having the highest median family income of $238,659, while families with 1 earner (566) have the lowest median family income of $93,125, accounting for 10.9% and 39.1% of families, respectively.
| Number of Earners | # Families | Median Income |
| No Earners | 220 (15.2%) | $135,063 |
| 1 Earner | 566 (39.1%) | $93,125 |
| 2 Earners | 502 (34.7%) | $177,018 |
| 3+ Earners | 158 (10.9%) | $238,659 |
| Total | 1,446 (100.0%) | $136,867 |
Household Income in Bay Hill
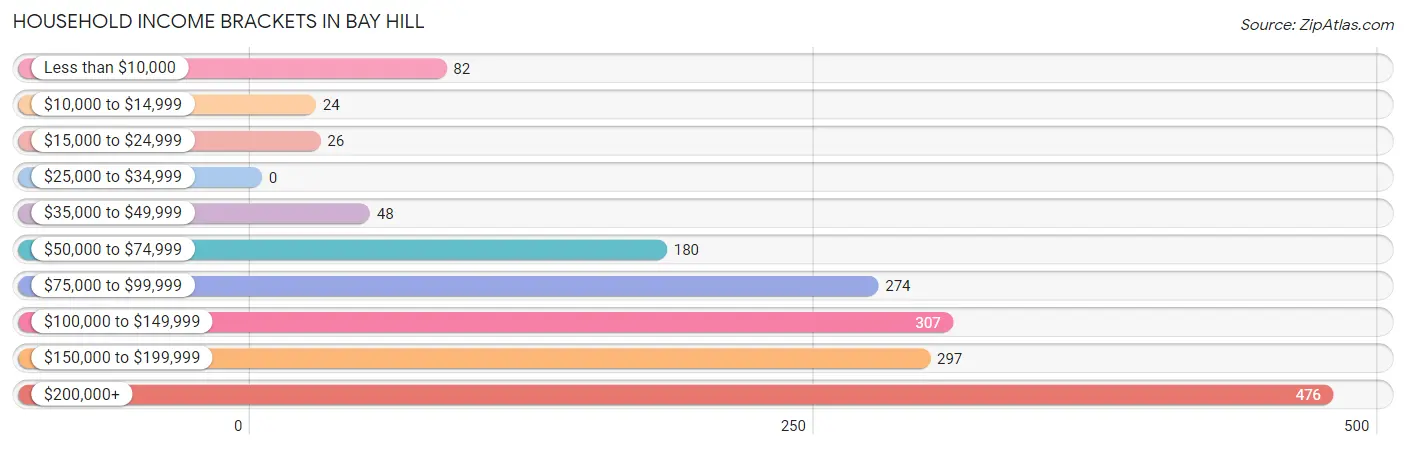
Household Income Brackets in Bay Hill
With 476 households falling in the category, the $200,000+ income range is the most frequent in Bay Hill, accounting for 27.8% of all households.
| Income Bracket | # Households | % Households |
| Less than $10,000 | 82 | 4.8% |
| $10,000 to $14,999 | 24 | 1.4% |
| $15,000 to $24,999 | 26 | 1.5% |
| $25,000 to $34,999 | 0 | 0.0% |
| $35,000 to $49,999 | 48 | 2.8% |
| $50,000 to $74,999 | 180 | 10.5% |
| $75,000 to $99,999 | 274 | 16.0% |
| $100,000 to $149,999 | 307 | 17.9% |
| $150,000 to $199,999 | 297 | 17.3% |
| $200,000+ | 476 | 27.8% |
Household Income by Householder Age in Bay Hill
The median household income in Bay Hill is $135,063, with the highest median household income of $175,329 found in the 45 to 64 years age bracket for the primary householder. A total of 817 households (47.7%) fall into this category.
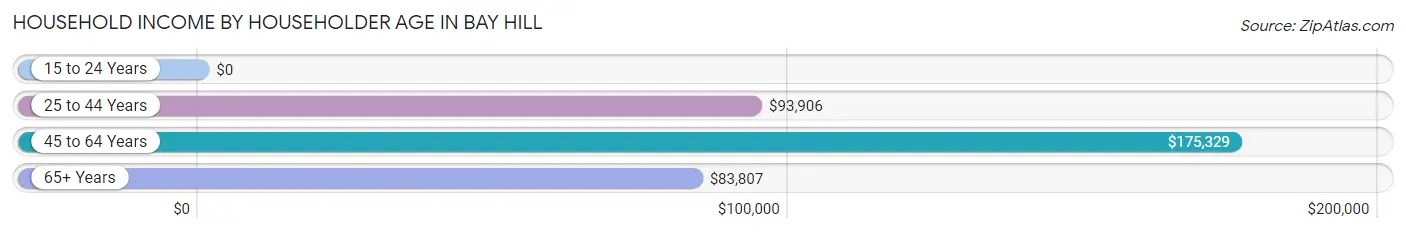
| Income Bracket | # Households | Median Income |
| 15 to 24 Years | 0 (0.0%) | $0 |
| 25 to 44 Years | 320 (18.7%) | $93,906 |
| 45 to 64 Years | 817 (47.7%) | $175,329 |
| 65+ Years | 577 (33.7%) | $83,807 |
| Total | 1,714 (100.0%) | $135,063 |
Poverty in Bay Hill
Income Below Poverty by Sex and Age in Bay Hill
With 3.9% poverty level for males and 2.4% for females among the residents of Bay Hill, 25 to 34 year old males and 75 year old and over females are the most vulnerable to poverty, with 53 males (21.7%) and 24 females (14.9%) in their respective age groups living below the poverty level.
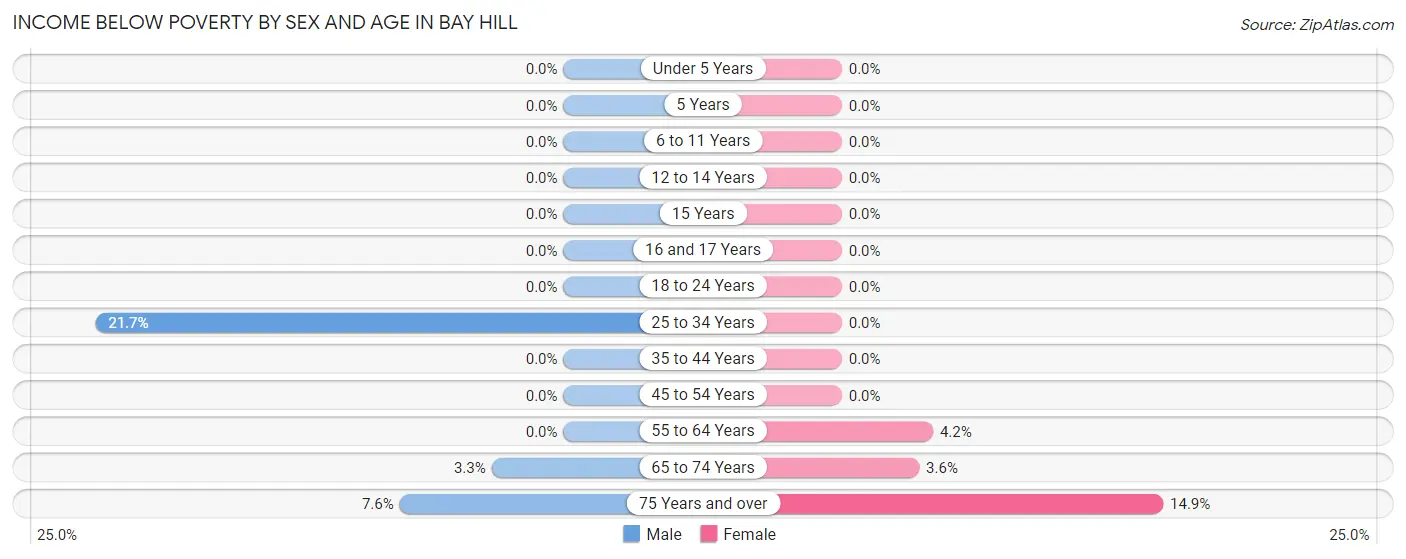
| Age Bracket | Male | Female |
| Under 5 Years | 0 (0.0%) | 0 (0.0%) |
| 5 Years | 0 (0.0%) | 0 (0.0%) |
| 6 to 11 Years | 0 (0.0%) | 0 (0.0%) |
| 12 to 14 Years | 0 (0.0%) | 0 (0.0%) |
| 15 Years | 0 (0.0%) | 0 (0.0%) |
| 16 and 17 Years | 0 (0.0%) | 0 (0.0%) |
| 18 to 24 Years | 0 (0.0%) | 0 (0.0%) |
| 25 to 34 Years | 53 (21.7%) | 0 (0.0%) |
| 35 to 44 Years | 0 (0.0%) | 0 (0.0%) |
| 45 to 54 Years | 0 (0.0%) | 0 (0.0%) |
| 55 to 64 Years | 0 (0.0%) | 18 (4.2%) |
| 65 to 74 Years | 11 (3.3%) | 11 (3.6%) |
| 75 Years and over | 19 (7.6%) | 24 (14.9%) |
| Total | 83 (3.9%) | 53 (2.4%) |
Income Above Poverty by Sex and Age in Bay Hill
According to the poverty statistics in Bay Hill, males aged under 5 years and females aged under 5 years are the age groups that are most secure financially, with 100.0% of males and 100.0% of females in these age groups living above the poverty line.
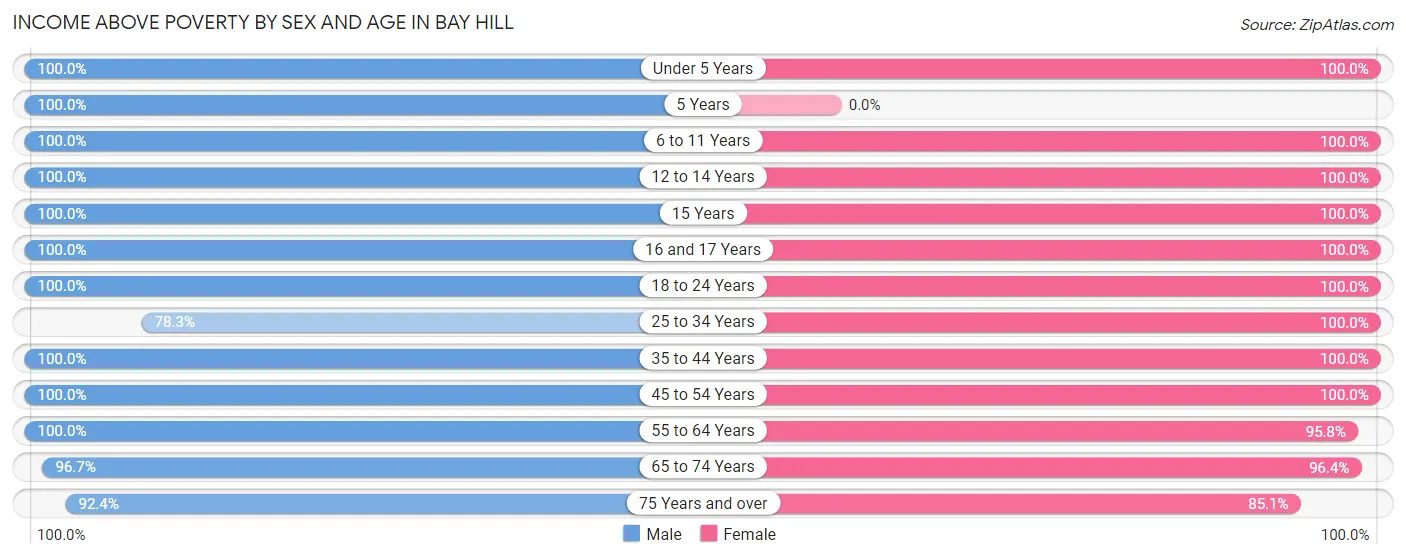
| Age Bracket | Male | Female |
| Under 5 Years | 17 (100.0%) | 60 (100.0%) |
| 5 Years | 4 (100.0%) | 0 (0.0%) |
| 6 to 11 Years | 60 (100.0%) | 136 (100.0%) |
| 12 to 14 Years | 39 (100.0%) | 44 (100.0%) |
| 15 Years | 48 (100.0%) | 9 (100.0%) |
| 16 and 17 Years | 123 (100.0%) | 46 (100.0%) |
| 18 to 24 Years | 134 (100.0%) | 136 (100.0%) |
| 25 to 34 Years | 191 (78.3%) | 257 (100.0%) |
| 35 to 44 Years | 117 (100.0%) | 204 (100.0%) |
| 45 to 54 Years | 272 (100.0%) | 439 (100.0%) |
| 55 to 64 Years | 501 (100.0%) | 408 (95.8%) |
| 65 to 74 Years | 319 (96.7%) | 295 (96.4%) |
| 75 Years and over | 231 (92.4%) | 137 (85.1%) |
| Total | 2,056 (96.1%) | 2,171 (97.6%) |
Income Below Poverty Among Married-Couple Families in Bay Hill
The poverty statistics for married-couple families in Bay Hill show that 2.4% or 30 of the total 1,237 families live below the poverty line. Families with no children have the highest poverty rate of 3.2%, comprising of 30 families. On the other hand, families with 1 or 2 children have the lowest poverty rate of 0.0%, which includes 0 families.
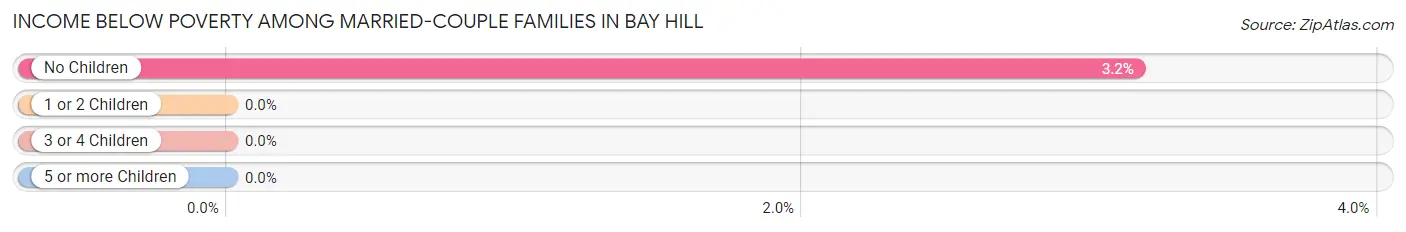
| Children | Above Poverty | Below Poverty |
| No Children | 919 (96.8%) | 30 (3.2%) |
| 1 or 2 Children | 246 (100.0%) | 0 (0.0%) |
| 3 or 4 Children | 42 (100.0%) | 0 (0.0%) |
| 5 or more Children | 0 (0.0%) | 0 (0.0%) |
| Total | 1,207 (97.6%) | 30 (2.4%) |
Income Below Poverty Among Single-Parent Households in Bay Hill
| Children | Single Father | Single Mother |
| No Children | 0 (0.0%) | 0 (0.0%) |
| 1 or 2 Children | 0 (0.0%) | 0 (0.0%) |
| 3 or 4 Children | 0 (0.0%) | 0 (0.0%) |
| 5 or more Children | 0 (0.0%) | 0 (0.0%) |
| Total | 0 (0.0%) | 0 (0.0%) |
Income Below Poverty Among Married-Couple vs Single-Parent Households in Bay Hill
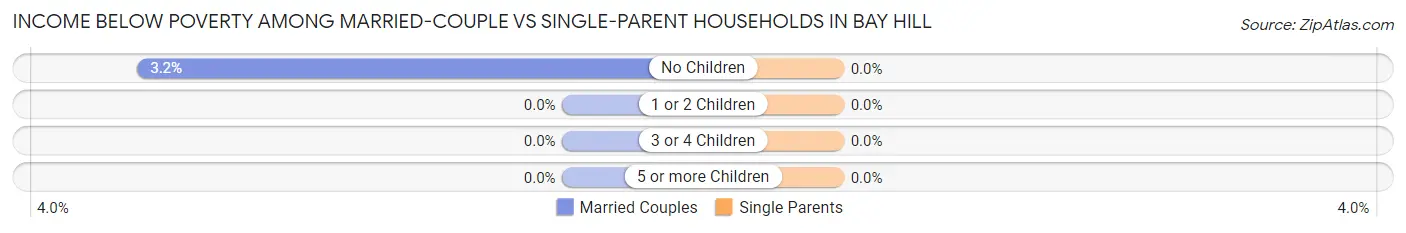
| Children | Married-Couple Families | Single-Parent Households |
| No Children | 30 (3.2%) | 0 (0.0%) |
| 1 or 2 Children | 0 (0.0%) | 0 (0.0%) |
| 3 or 4 Children | 0 (0.0%) | 0 (0.0%) |
| 5 or more Children | 0 (0.0%) | 0 (0.0%) |
| Total | 30 (2.4%) | 0 (0.0%) |
Race in Bay Hill
The most populous races in Bay Hill are White / Caucasian (3,386 | 77.6%), Hispanic or Latino (428 | 9.8%), and Asian (404 | 9.3%).
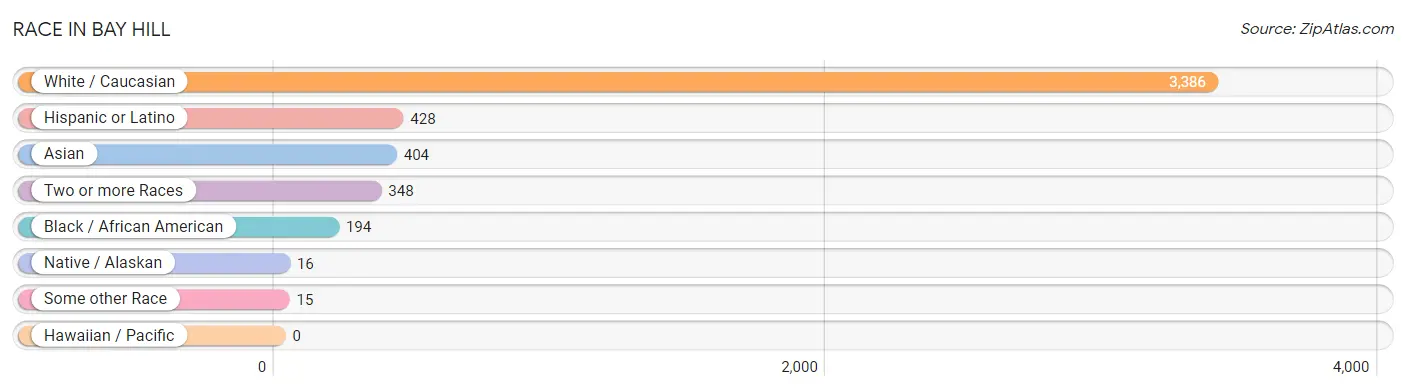
| Race | # Population | % Population |
| Asian | 404 | 9.3% |
| Black / African American | 194 | 4.4% |
| Hawaiian / Pacific | 0 | 0.0% |
| Hispanic or Latino | 428 | 9.8% |
| Native / Alaskan | 16 | 0.4% |
| White / Caucasian | 3,386 | 77.6% |
| Two or more Races | 348 | 8.0% |
| Some other Race | 15 | 0.3% |
| Total | 4,363 | 100.0% |
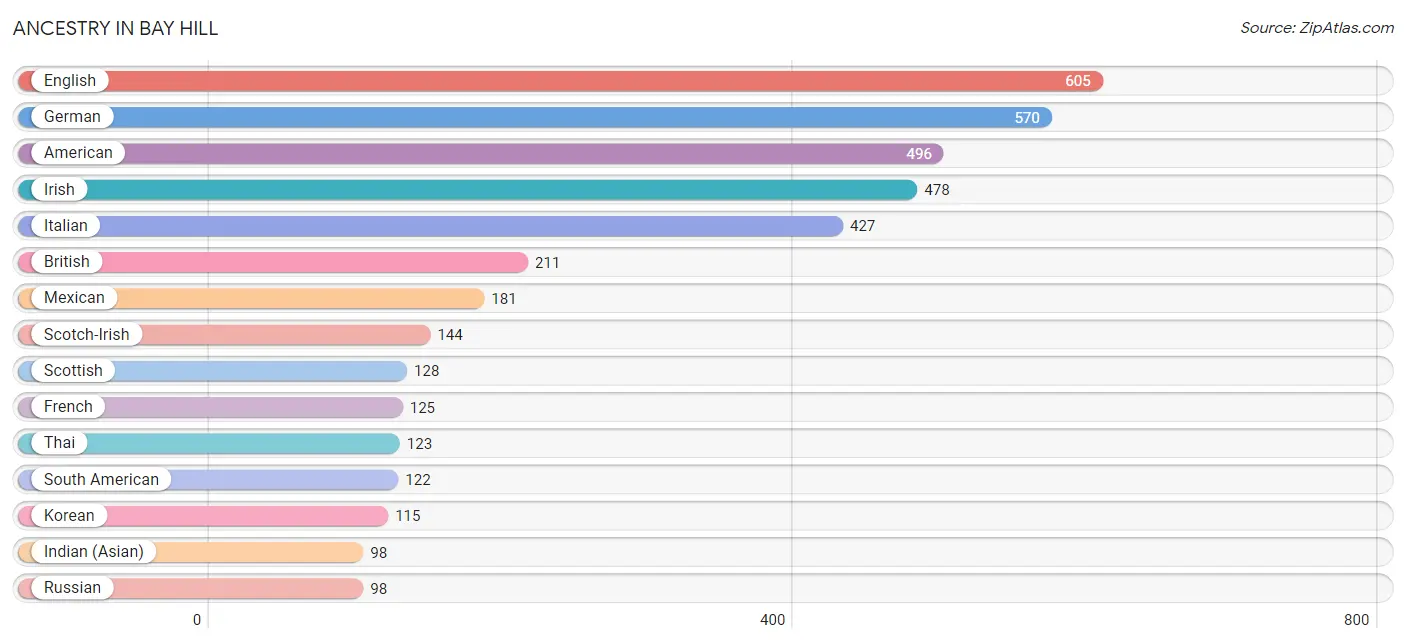
Ancestry in Bay Hill
The most populous ancestries reported in Bay Hill are English (605 | 13.9%), German (570 | 13.1%), American (496 | 11.4%), Irish (478 | 11.0%), and Italian (427 | 9.8%), together accounting for 59.1% of all Bay Hill residents.
| Ancestry | # Population | % Population |
| American | 496 | 11.4% |
| Arab | 44 | 1.0% |
| Austrian | 15 | 0.3% |
| Bahamian | 48 | 1.1% |
| Bhutanese | 31 | 0.7% |
| British | 211 | 4.8% |
| Burmese | 49 | 1.1% |
| Central American | 20 | 0.5% |
| Colombian | 79 | 1.8% |
| Costa Rican | 20 | 0.5% |
| Cuban | 85 | 1.9% |
| Czech | 11 | 0.3% |
| Danish | 15 | 0.3% |
| Dutch | 29 | 0.7% |
| Eastern European | 12 | 0.3% |
| English | 605 | 13.9% |
| European | 21 | 0.5% |
| Filipino | 17 | 0.4% |
| French | 125 | 2.9% |
| German | 570 | 13.1% |
| Greek | 71 | 1.6% |
| Hungarian | 17 | 0.4% |
| Icelander | 16 | 0.4% |
| Indian (Asian) | 98 | 2.2% |
| Iranian | 75 | 1.7% |
| Irish | 478 | 11.0% |
| Italian | 427 | 9.8% |
| Korean | 115 | 2.6% |
| Macedonian | 69 | 1.6% |
| Mexican | 181 | 4.2% |
| Norwegian | 36 | 0.8% |
| Palestinian | 12 | 0.3% |
| Polish | 48 | 1.1% |
| Portuguese | 18 | 0.4% |
| Puerto Rican | 20 | 0.5% |
| Russian | 98 | 2.2% |
| Scotch-Irish | 144 | 3.3% |
| Scottish | 128 | 2.9% |
| South American | 122 | 2.8% |
| Sri Lankan | 24 | 0.5% |
| Subsaharan African | 39 | 0.9% |
| Swedish | 33 | 0.8% |
| Swiss | 13 | 0.3% |
| Syrian | 32 | 0.7% |
| Thai | 123 | 2.8% |
| Venezuelan | 43 | 1.0% |
| Welsh | 57 | 1.3% | View All 47 Rows |
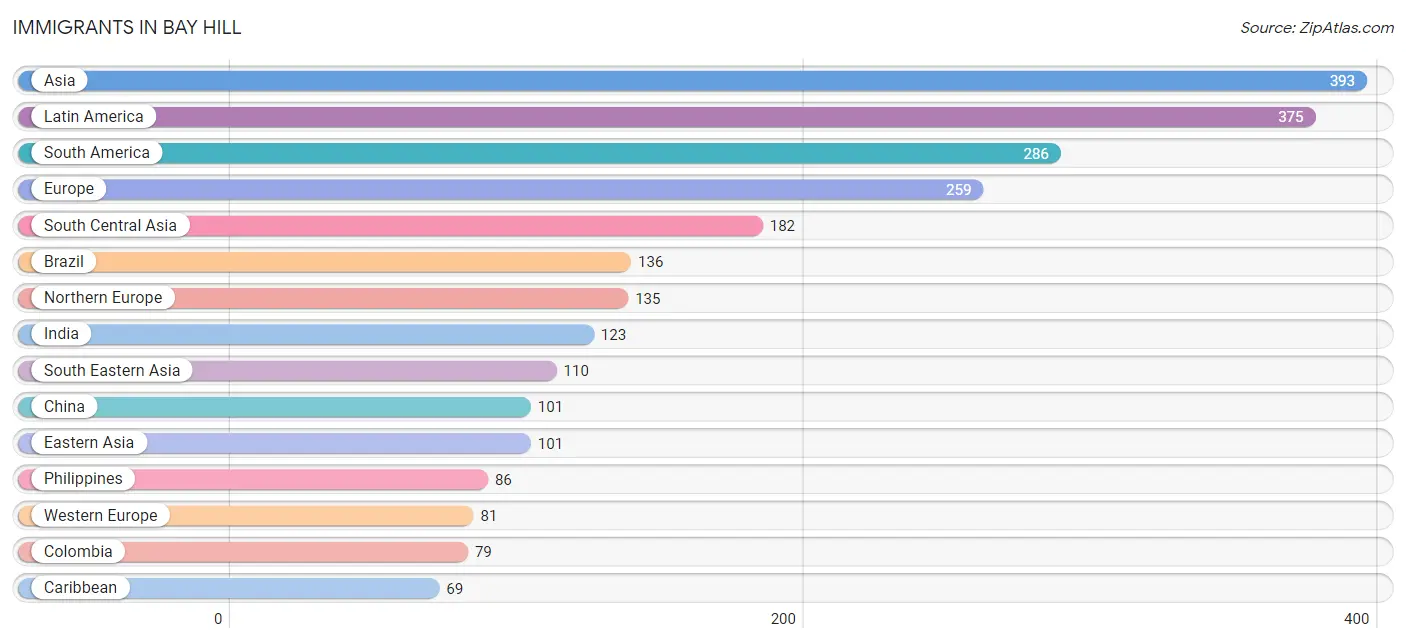
Immigrants in Bay Hill
The most numerous immigrant groups reported in Bay Hill came from Asia (393 | 9.0%), Latin America (375 | 8.6%), South America (286 | 6.6%), Europe (259 | 5.9%), and South Central Asia (182 | 4.2%), together accounting for 34.3% of all Bay Hill residents.
| Immigration Origin | # Population | % Population |
| Africa | 24 | 0.5% |
| Asia | 393 | 9.0% |
| Bahamas | 48 | 1.1% |
| Brazil | 136 | 3.1% |
| Canada | 26 | 0.6% |
| Caribbean | 69 | 1.6% |
| Central America | 20 | 0.5% |
| China | 101 | 2.3% |
| Colombia | 79 | 1.8% |
| Costa Rica | 20 | 0.5% |
| Eastern Africa | 2 | 0.1% |
| Eastern Asia | 101 | 2.3% |
| Eastern Europe | 14 | 0.3% |
| Ecuador | 12 | 0.3% |
| England | 29 | 0.7% |
| Europe | 259 | 5.9% |
| France | 59 | 1.3% |
| Germany | 22 | 0.5% |
| Greece | 18 | 0.4% |
| India | 123 | 2.8% |
| Iran | 39 | 0.9% |
| Italy | 11 | 0.3% |
| Jamaica | 21 | 0.5% |
| Latin America | 375 | 8.6% |
| Morocco | 22 | 0.5% |
| North Macedonia | 14 | 0.3% |
| Northern Africa | 22 | 0.5% |
| Northern Europe | 135 | 3.1% |
| Pakistan | 20 | 0.5% |
| Philippines | 86 | 2.0% |
| Scotland | 13 | 0.3% |
| South America | 286 | 6.6% |
| South Central Asia | 182 | 4.2% |
| South Eastern Asia | 110 | 2.5% |
| Southern Europe | 29 | 0.7% |
| Taiwan | 17 | 0.4% |
| Venezuela | 59 | 1.3% |
| Vietnam | 24 | 0.5% |
| Western Europe | 81 | 1.9% | View All 39 Rows |
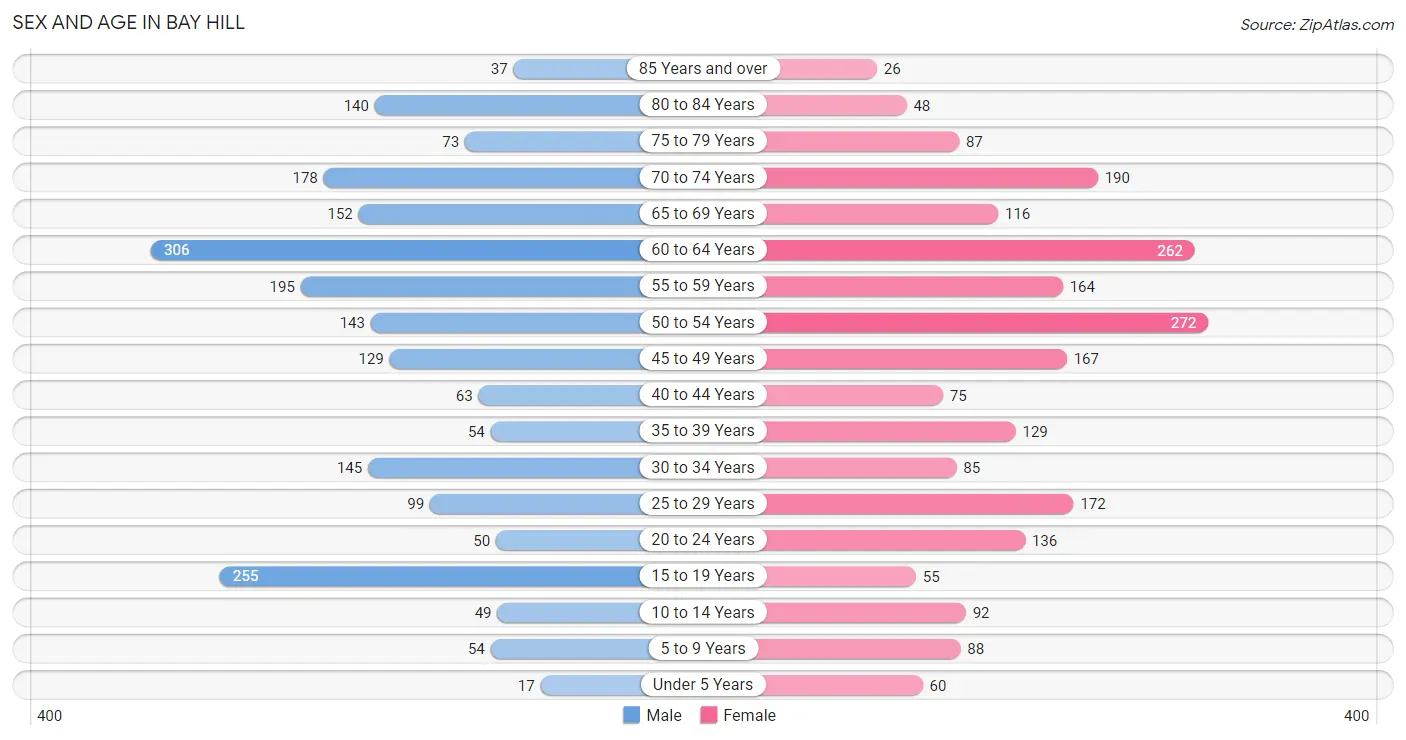
Sex and Age in Bay Hill
Sex and Age in Bay Hill
The most populous age groups in Bay Hill are 60 to 64 Years (306 | 14.3%) for men and 50 to 54 Years (272 | 12.2%) for women.
| Age Bracket | Male | Female |
| Under 5 Years | 17 (0.8%) | 60 (2.7%) |
| 5 to 9 Years | 54 (2.5%) | 88 (4.0%) |
| 10 to 14 Years | 49 (2.3%) | 92 (4.1%) |
| 15 to 19 Years | 255 (11.9%) | 55 (2.5%) |
| 20 to 24 Years | 50 (2.3%) | 136 (6.1%) |
| 25 to 29 Years | 99 (4.6%) | 172 (7.7%) |
| 30 to 34 Years | 145 (6.8%) | 85 (3.8%) |
| 35 to 39 Years | 54 (2.5%) | 129 (5.8%) |
| 40 to 44 Years | 63 (2.9%) | 75 (3.4%) |
| 45 to 49 Years | 129 (6.0%) | 167 (7.5%) |
| 50 to 54 Years | 143 (6.7%) | 272 (12.2%) |
| 55 to 59 Years | 195 (9.1%) | 164 (7.4%) |
| 60 to 64 Years | 306 (14.3%) | 262 (11.8%) |
| 65 to 69 Years | 152 (7.1%) | 116 (5.2%) |
| 70 to 74 Years | 178 (8.3%) | 190 (8.5%) |
| 75 to 79 Years | 73 (3.4%) | 87 (3.9%) |
| 80 to 84 Years | 140 (6.6%) | 48 (2.2%) |
| 85 Years and over | 37 (1.7%) | 26 (1.2%) |
| Total | 2,139 (100.0%) | 2,224 (100.0%) |
Families and Households in Bay Hill
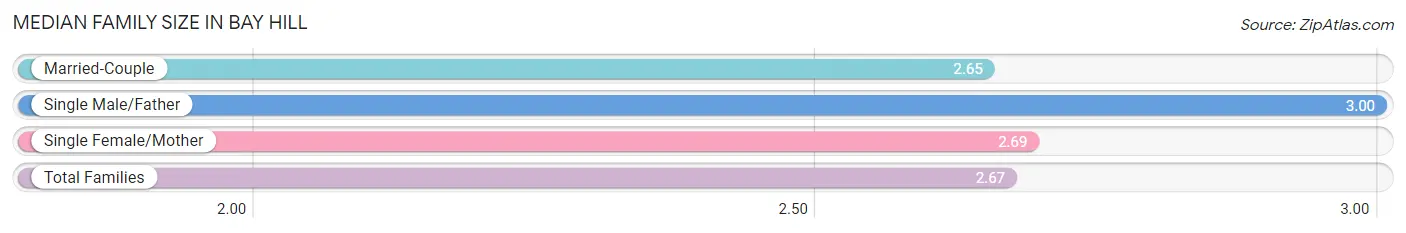
Median Family Size in Bay Hill
The median family size in Bay Hill is 2.67 persons per family, with single male/father families (55 | 3.8%) accounting for the largest median family size of 3 persons per family. On the other hand, married-couple families (1,237 | 85.6%) represent the smallest median family size with 2.65 persons per family.
| Family Type | # Families | Family Size |
| Married-Couple | 1,237 (85.6%) | 2.65 |
| Single Male/Father | 55 (3.8%) | 3.00 |
| Single Female/Mother | 154 (10.6%) | 2.69 |
| Total Families | 1,446 (100.0%) | 2.67 |
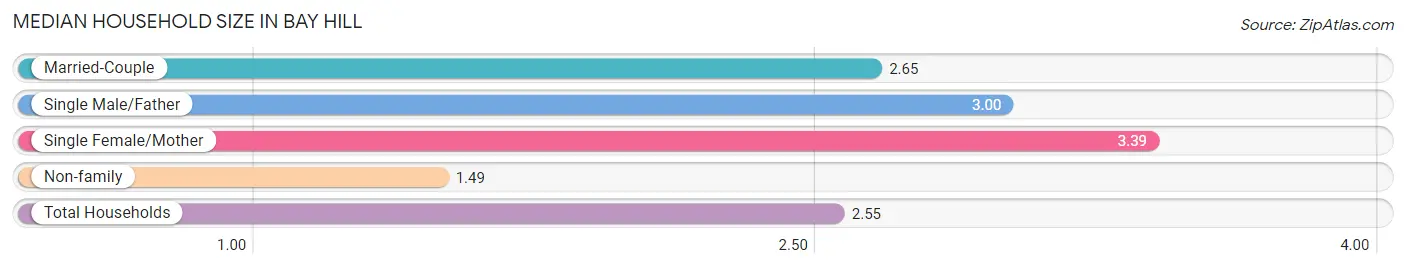
Median Household Size in Bay Hill
The median household size in Bay Hill is 2.55 persons per household, with single female/mother households (154 | 9.0%) accounting for the largest median household size of 3.39 persons per household. non-family households (268 | 15.6%) represent the smallest median household size with 1.49 persons per household.
| Household Type | # Households | Household Size |
| Married-Couple | 1,237 (72.2%) | 2.65 |
| Single Male/Father | 55 (3.2%) | 3.00 |
| Single Female/Mother | 154 (9.0%) | 3.39 |
| Non-family | 268 (15.6%) | 1.49 |
| Total Households | 1,714 (100.0%) | 2.55 |
Household Size by Marriage Status in Bay Hill
Out of a total of 1,714 households in Bay Hill, 1,446 (84.4%) are family households, while 268 (15.6%) are nonfamily households. The most numerous type of family households are 2-person households, comprising 868, and the most common type of nonfamily households are 1-person households, comprising 226.
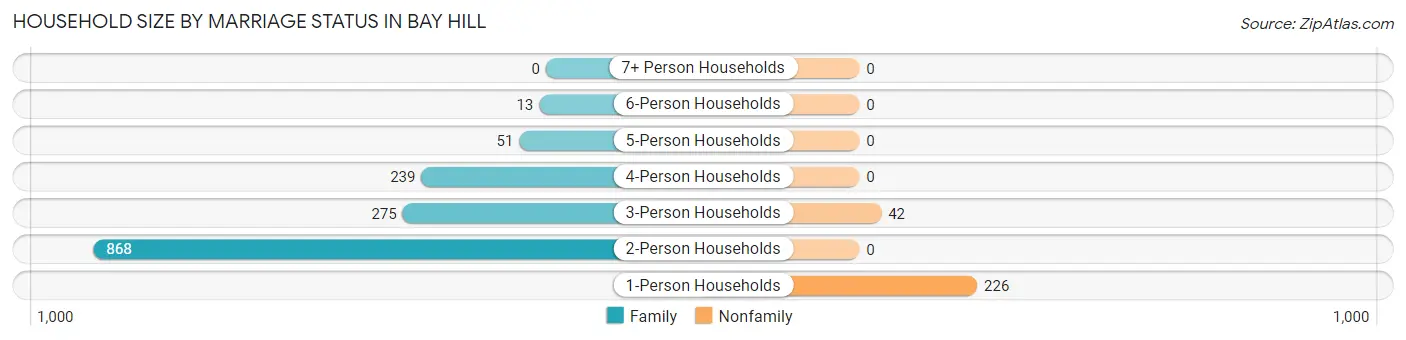
| Household Size | Family Households | Nonfamily Households |
| 1-Person Households | - | 226 (13.2%) |
| 2-Person Households | 868 (50.6%) | 0 (0.0%) |
| 3-Person Households | 275 (16.0%) | 42 (2.5%) |
| 4-Person Households | 239 (13.9%) | 0 (0.0%) |
| 5-Person Households | 51 (3.0%) | 0 (0.0%) |
| 6-Person Households | 13 (0.8%) | 0 (0.0%) |
| 7+ Person Households | 0 (0.0%) | 0 (0.0%) |
| Total | 1,446 (84.4%) | 268 (15.6%) |
Female Fertility in Bay Hill
Fertility by Age in Bay Hill
| Age Bracket | Women with Births | Births / 1,000 Women |
| 15 to 19 years | 0 (0.0%) | 0.0 |
| 20 to 34 years | 0 (0.0%) | 0.0 |
| 35 to 50 years | 0 (0.0%) | 0.0 |
| Total | 0 (0.0%) | 0.0 |
Fertility by Age by Marriage Status in Bay Hill
| Age Bracket | Married | Unmarried |
| 15 to 19 years | 0 (0.0%) | 0 (0.0%) |
| 20 to 34 years | 0 (0.0%) | 0 (0.0%) |
| 35 to 50 years | 0 (0.0%) | 0 (0.0%) |
| Total | 0 (0.0%) | 0 (0.0%) |
Fertility by Education in Bay Hill
| Educational Attainment | Women with Births | Births / 1,000 Women |
| Less than High School | 0 (0.0%) | 0.0 |
| High School Diploma | 0 (0.0%) | 0.0 |
| College or Associate's Degree | 0 (0.0%) | 0.0 |
| Bachelor's Degree | 0 (0.0%) | 0.0 |
| Graduate Degree | 0 (0.0%) | 0.0 |
| Total | 0 (0.0%) | 0.0 |
Fertility by Education by Marriage Status in Bay Hill
| Educational Attainment | Married | Unmarried |
| Less than High School | 0 (0.0%) | 0 (0.0%) |
| High School Diploma | 0 (0.0%) | 0 (0.0%) |
| College or Associate's Degree | 0 (0.0%) | 0 (0.0%) |
| Bachelor's Degree | 0 (0.0%) | 0 (0.0%) |
| Graduate Degree | 0 (0.0%) | 0 (0.0%) |
| Total | 0 (0.0%) | 0 (0.0%) |
Employment Characteristics in Bay Hill
Employment by Class of Employer in Bay Hill
Among the 2,420 employed individuals in Bay Hill, private company employees (1,503 | 62.1%), self-employed (incorporated) (444 | 18.3%), and not-for-profit organizations (176 | 7.3%) make up the most common classes of employment.
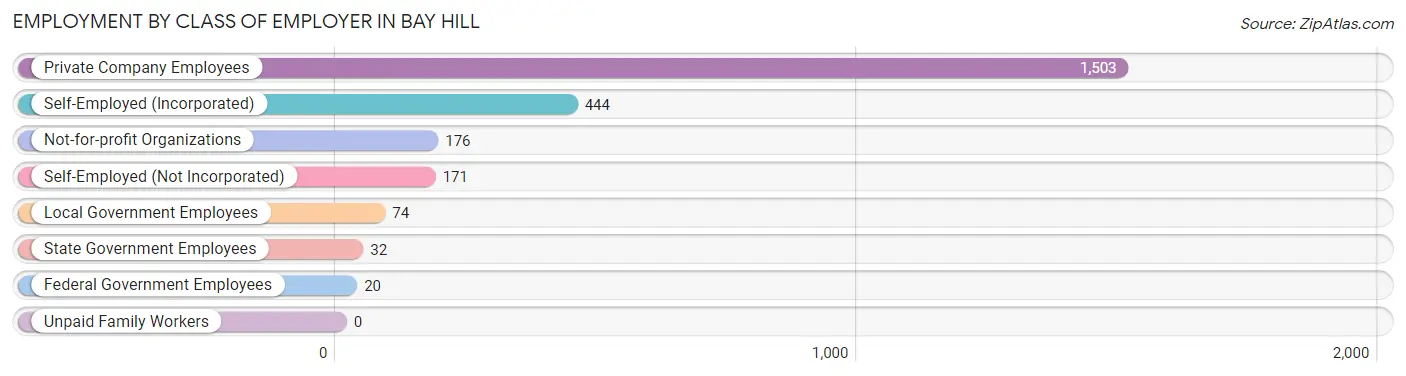
| Employer Class | # Employees | % Employees |
| Private Company Employees | 1,503 | 62.1% |
| Self-Employed (Incorporated) | 444 | 18.3% |
| Self-Employed (Not Incorporated) | 171 | 7.1% |
| Not-for-profit Organizations | 176 | 7.3% |
| Local Government Employees | 74 | 3.1% |
| State Government Employees | 32 | 1.3% |
| Federal Government Employees | 20 | 0.8% |
| Unpaid Family Workers | 0 | 0.0% |
| Total | 2,420 | 100.0% |
Employment Status by Age in Bay Hill
According to the labor force statistics for Bay Hill, out of the total population over 16 years of age (3,946), 63.7% or 2,514 individuals are in the labor force, with 2.0% or 50 of them unemployed. The age group with the highest labor force participation rate is 30 to 34 years, with 90.9% or 209 individuals in the labor force. Within the labor force, the 75 years and over age range has the highest percentage of unemployed individuals, with 15.9% or 18 of them being unemployed.
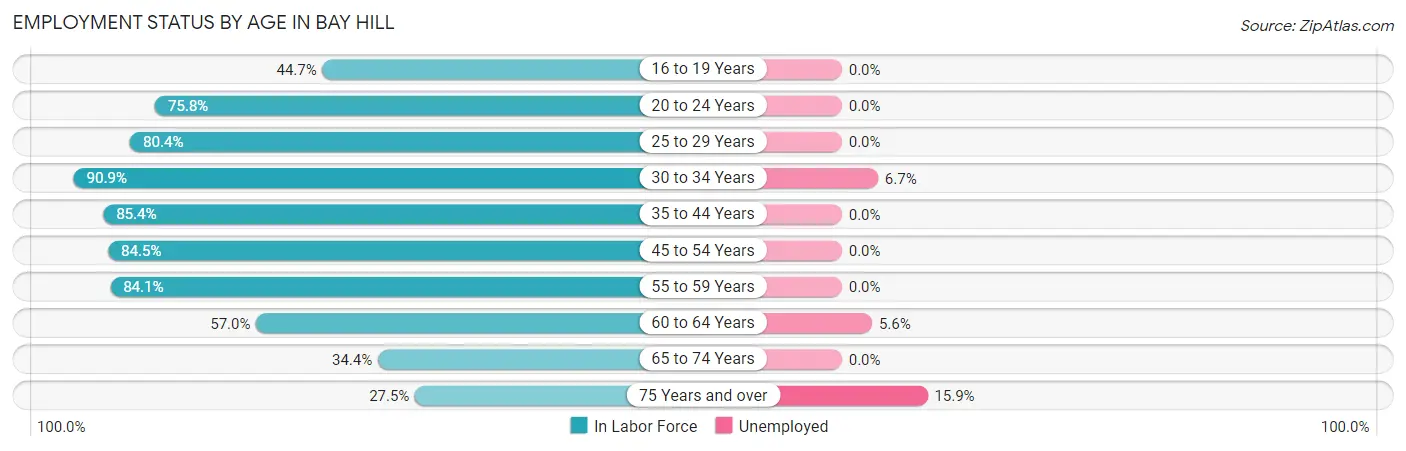
| Age Bracket | In Labor Force | Unemployed |
| 16 to 19 Years | 113 (44.7%) | 0 (0.0%) |
| 20 to 24 Years | 141 (75.8%) | 0 (0.0%) |
| 25 to 29 Years | 218 (80.4%) | 0 (0.0%) |
| 30 to 34 Years | 209 (90.9%) | 14 (6.7%) |
| 35 to 44 Years | 274 (85.4%) | 0 (0.0%) |
| 45 to 54 Years | 601 (84.5%) | 0 (0.0%) |
| 55 to 59 Years | 302 (84.1%) | 0 (0.0%) |
| 60 to 64 Years | 324 (57.0%) | 18 (5.6%) |
| 65 to 74 Years | 219 (34.4%) | 0 (0.0%) |
| 75 Years and over | 113 (27.5%) | 18 (15.9%) |
| Total | 2,514 (63.7%) | 50 (2.0%) |
Employment Status by Educational Attainment in Bay Hill
According to labor force statistics for Bay Hill, 78.4% of individuals (1,929) out of the total population between 25 and 64 years of age (2,460) are in the labor force, with 1.7% or 33 of them being unemployed. The group with the highest labor force participation rate are those with the educational attainment of high school diploma, with 99.4% or 163 individuals in the labor force. Within the labor force, individuals with college / associate degree education have the highest percentage of unemployment, with 7.7% or 30 of them being unemployed.
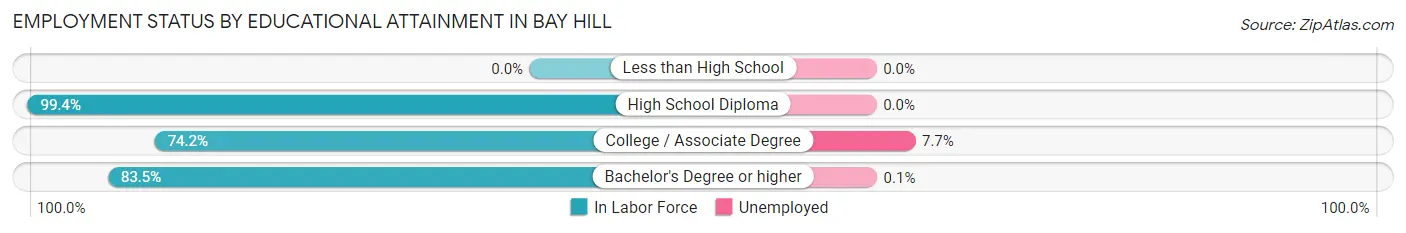
| Educational Attainment | In Labor Force | Unemployed |
| Less than High School | 0 (0.0%) | 0 (0.0%) |
| High School Diploma | 163 (99.4%) | 0 (0.0%) |
| College / Associate Degree | 388 (74.2%) | 40 (7.7%) |
| Bachelor's Degree or higher | 1,377 (83.5%) | 2 (0.1%) |
| Total | 1,929 (78.4%) | 42 (1.7%) |
Employment Occupations by Sex in Bay Hill
Management, Business, Science and Arts Occupations
The most common Management, Business, Science and Arts occupations in Bay Hill are Management (726 | 29.5%), Community & Social Service (268 | 10.9%), Health Diagnosing & Treating (240 | 9.7%), Health Technologists (221 | 9.0%), and Business & Financial (154 | 6.2%).
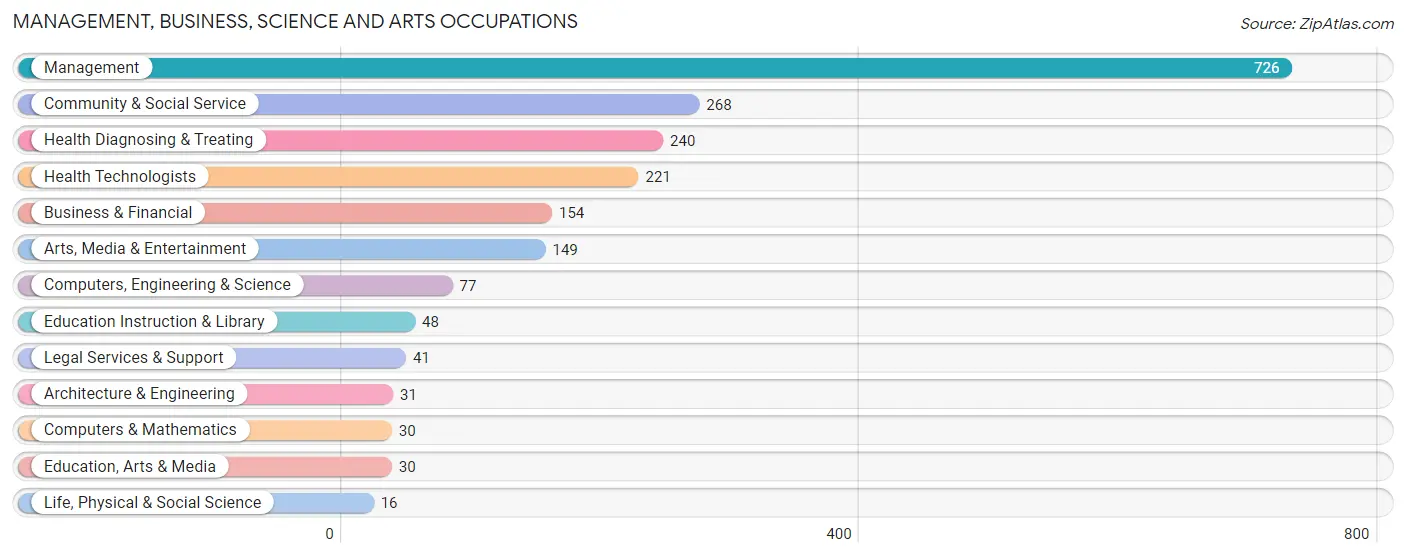
Management, Business, Science and Arts Occupations by Sex
Within the Management, Business, Science and Arts occupations in Bay Hill, the most male-oriented occupations are Computers, Engineering & Science (100.0%), Computers & Mathematics (100.0%), and Architecture & Engineering (100.0%), while the most female-oriented occupations are Arts, Media & Entertainment (95.3%), Education Instruction & Library (81.2%), and Community & Social Service (75.0%).

| Occupation | Male | Female |
| Management | 318 (43.8%) | 408 (56.2%) |
| Business & Financial | 106 (68.8%) | 48 (31.2%) |
| Computers, Engineering & Science | 77 (100.0%) | 0 (0.0%) |
| Computers & Mathematics | 30 (100.0%) | 0 (0.0%) |
| Architecture & Engineering | 31 (100.0%) | 0 (0.0%) |
| Life, Physical & Social Science | 16 (100.0%) | 0 (0.0%) |
| Community & Social Service | 67 (25.0%) | 201 (75.0%) |
| Education, Arts & Media | 30 (100.0%) | 0 (0.0%) |
| Legal Services & Support | 21 (51.2%) | 20 (48.8%) |
| Education Instruction & Library | 9 (18.8%) | 39 (81.2%) |
| Arts, Media & Entertainment | 7 (4.7%) | 142 (95.3%) |
| Health Diagnosing & Treating | 111 (46.3%) | 129 (53.7%) |
| Health Technologists | 111 (50.2%) | 110 (49.8%) |
| Total (Category) | 679 (46.4%) | 786 (53.6%) |
| Total (Overall) | 1,259 (51.1%) | 1,205 (48.9%) |
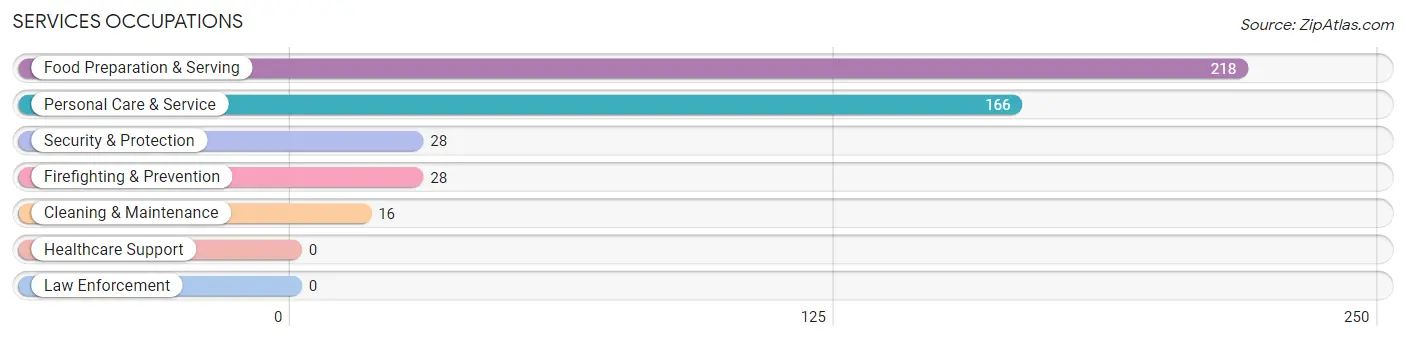
Services Occupations
The most common Services occupations in Bay Hill are Food Preparation & Serving (218 | 8.8%), Personal Care & Service (166 | 6.7%), Security & Protection (28 | 1.1%), Firefighting & Prevention (28 | 1.1%), and Cleaning & Maintenance (16 | 0.6%).
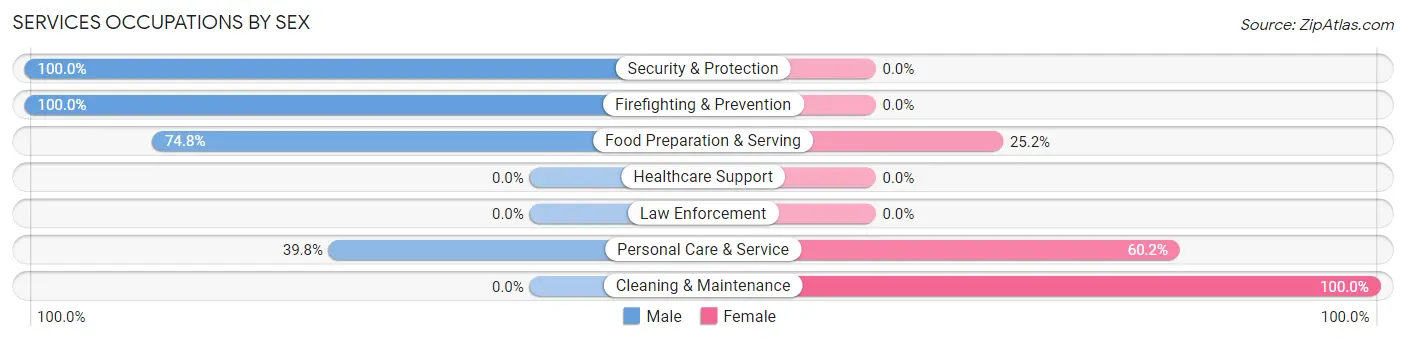
Services Occupations by Sex
Within the Services occupations in Bay Hill, the most male-oriented occupations are Security & Protection (100.0%), Firefighting & Prevention (100.0%), and Food Preparation & Serving (74.8%), while the most female-oriented occupations are Cleaning & Maintenance (100.0%), Personal Care & Service (60.2%), and Food Preparation & Serving (25.2%).
| Occupation | Male | Female |
| Healthcare Support | 0 (0.0%) | 0 (0.0%) |
| Security & Protection | 28 (100.0%) | 0 (0.0%) |
| Firefighting & Prevention | 28 (100.0%) | 0 (0.0%) |
| Law Enforcement | 0 (0.0%) | 0 (0.0%) |
| Food Preparation & Serving | 163 (74.8%) | 55 (25.2%) |
| Cleaning & Maintenance | 0 (0.0%) | 16 (100.0%) |
| Personal Care & Service | 66 (39.8%) | 100 (60.2%) |
| Total (Category) | 257 (60.1%) | 171 (40.0%) |
| Total (Overall) | 1,259 (51.1%) | 1,205 (48.9%) |
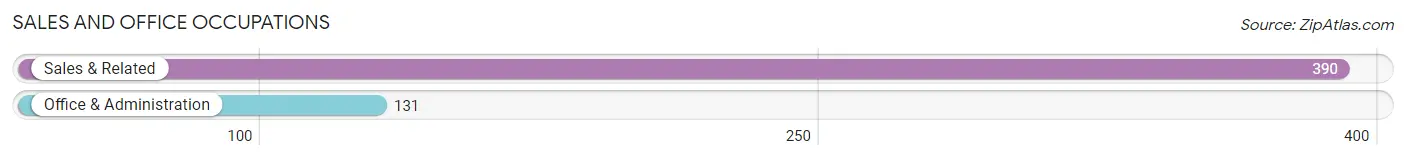
Sales and Office Occupations
The most common Sales and Office occupations in Bay Hill are Sales & Related (390 | 15.8%), and Office & Administration (131 | 5.3%).
Sales and Office Occupations by Sex
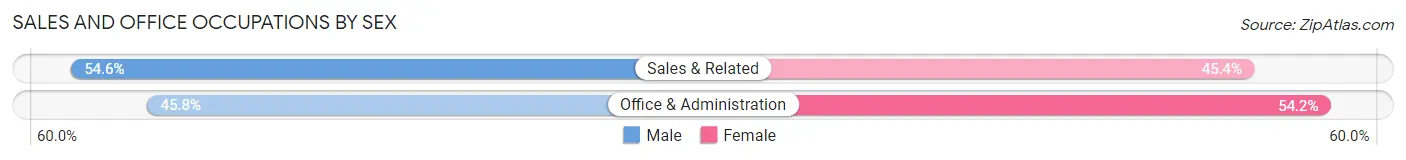
| Occupation | Male | Female |
| Sales & Related | 213 (54.6%) | 177 (45.4%) |
| Office & Administration | 60 (45.8%) | 71 (54.2%) |
| Total (Category) | 273 (52.4%) | 248 (47.6%) |
| Total (Overall) | 1,259 (51.1%) | 1,205 (48.9%) |
Natural Resources, Construction and Maintenance Occupations
Natural Resources, Construction and Maintenance Occupations by Sex
| Occupation | Male | Female |
| Farming, Fishing & Forestry | 0 (0.0%) | 0 (0.0%) |
| Construction & Extraction | 0 (0.0%) | 0 (0.0%) |
| Installation, Maintenance & Repair | 0 (0.0%) | 0 (0.0%) |
| Total (Category) | 0 (0.0%) | 0 (0.0%) |
| Total (Overall) | 1,259 (51.1%) | 1,205 (48.9%) |
Production, Transportation and Moving Occupations
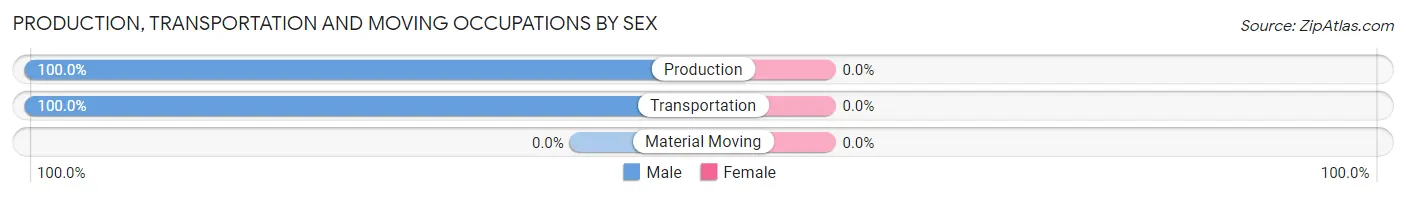
The most common Production, Transportation and Moving occupations in Bay Hill are Production (39 | 1.6%), and Transportation (11 | 0.4%).
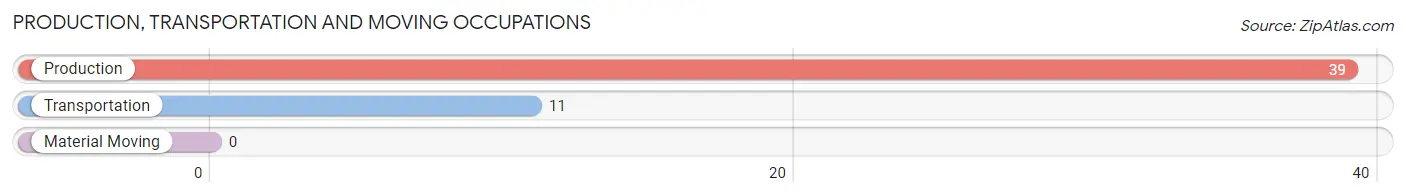
Production, Transportation and Moving Occupations by Sex
| Occupation | Male | Female |
| Production | 39 (100.0%) | 0 (0.0%) |
| Transportation | 11 (100.0%) | 0 (0.0%) |
| Material Moving | 0 (0.0%) | 0 (0.0%) |
| Total (Category) | 50 (100.0%) | 0 (0.0%) |
| Total (Overall) | 1,259 (51.1%) | 1,205 (48.9%) |
Employment Industries by Sex in Bay Hill
Employment Industries in Bay Hill
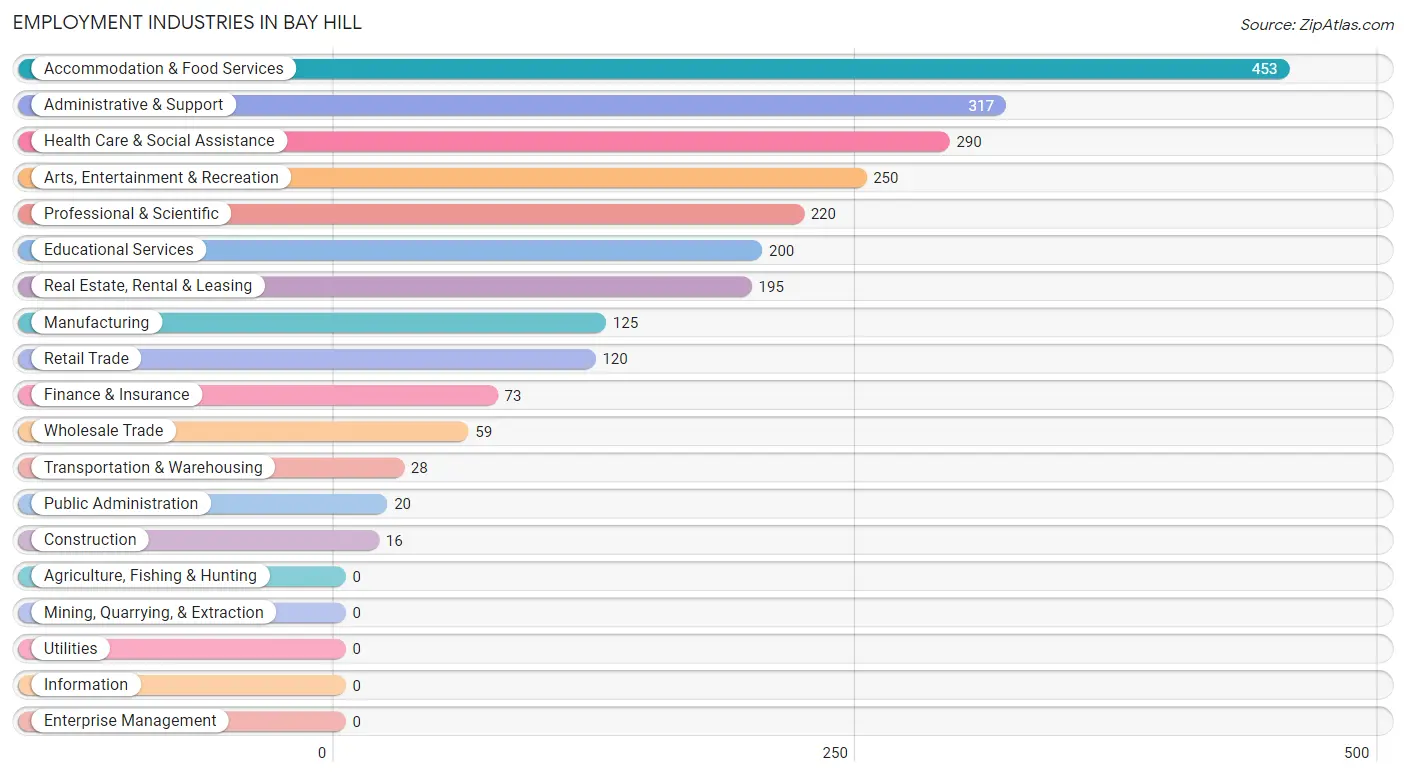
The major employment industries in Bay Hill include Accommodation & Food Services (453 | 18.4%), Administrative & Support (317 | 12.9%), Health Care & Social Assistance (290 | 11.8%), Arts, Entertainment & Recreation (250 | 10.2%), and Professional & Scientific (220 | 8.9%).
Employment Industries by Sex in Bay Hill
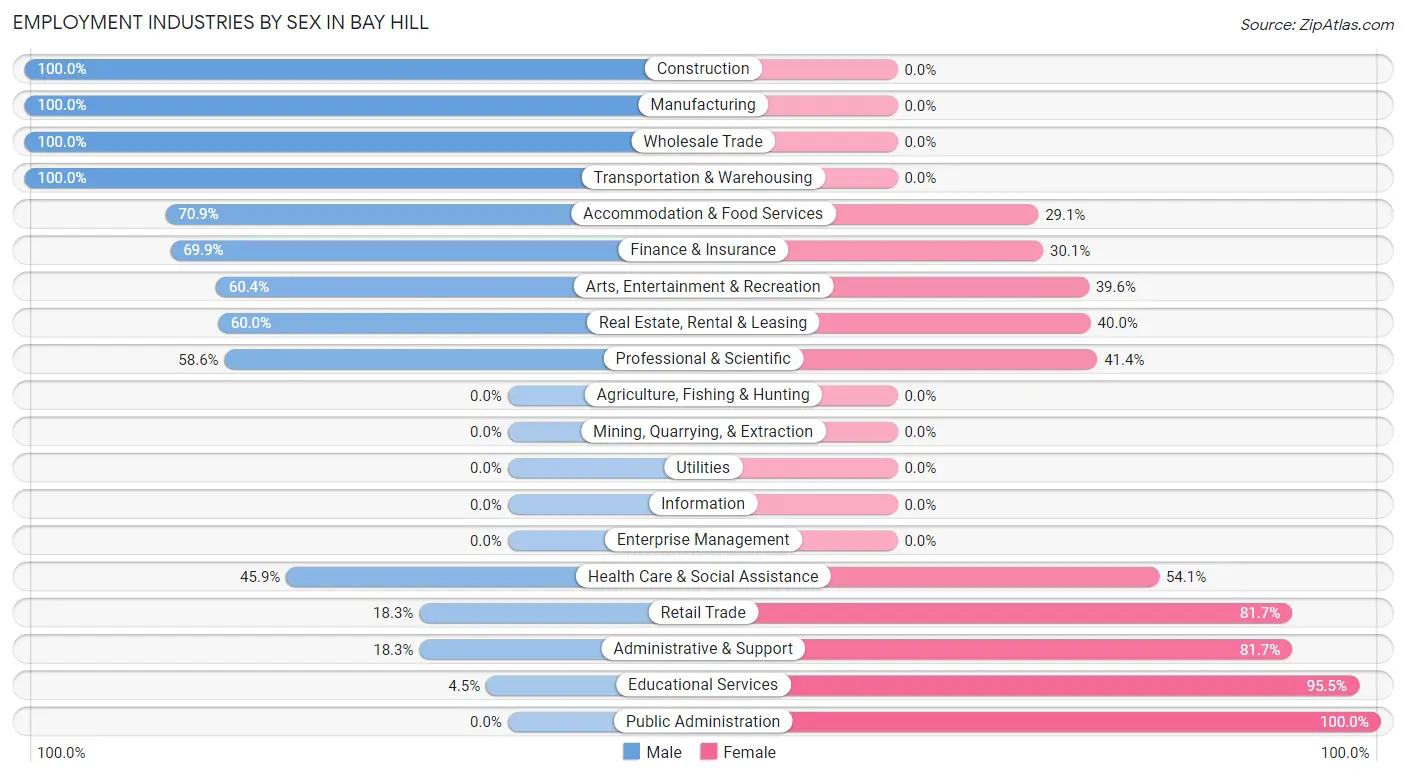
The Bay Hill industries that see more men than women are Construction (100.0%), Manufacturing (100.0%), and Wholesale Trade (100.0%), whereas the industries that tend to have a higher number of women are Public Administration (100.0%), Educational Services (95.5%), and Administrative & Support (81.7%).
| Industry | Male | Female |
| Agriculture, Fishing & Hunting | 0 (0.0%) | 0 (0.0%) |
| Mining, Quarrying, & Extraction | 0 (0.0%) | 0 (0.0%) |
| Construction | 16 (100.0%) | 0 (0.0%) |
| Manufacturing | 125 (100.0%) | 0 (0.0%) |
| Wholesale Trade | 59 (100.0%) | 0 (0.0%) |
| Retail Trade | 22 (18.3%) | 98 (81.7%) |
| Transportation & Warehousing | 28 (100.0%) | 0 (0.0%) |
| Utilities | 0 (0.0%) | 0 (0.0%) |
| Information | 0 (0.0%) | 0 (0.0%) |
| Finance & Insurance | 51 (69.9%) | 22 (30.1%) |
| Real Estate, Rental & Leasing | 117 (60.0%) | 78 (40.0%) |
| Professional & Scientific | 129 (58.6%) | 91 (41.4%) |
| Enterprise Management | 0 (0.0%) | 0 (0.0%) |
| Administrative & Support | 58 (18.3%) | 259 (81.7%) |
| Educational Services | 9 (4.5%) | 191 (95.5%) |
| Health Care & Social Assistance | 133 (45.9%) | 157 (54.1%) |
| Arts, Entertainment & Recreation | 151 (60.4%) | 99 (39.6%) |
| Accommodation & Food Services | 321 (70.9%) | 132 (29.1%) |
| Public Administration | 0 (0.0%) | 20 (100.0%) |
| Total | 1,259 (51.1%) | 1,205 (48.9%) |
Education in Bay Hill
School Enrollment in Bay Hill
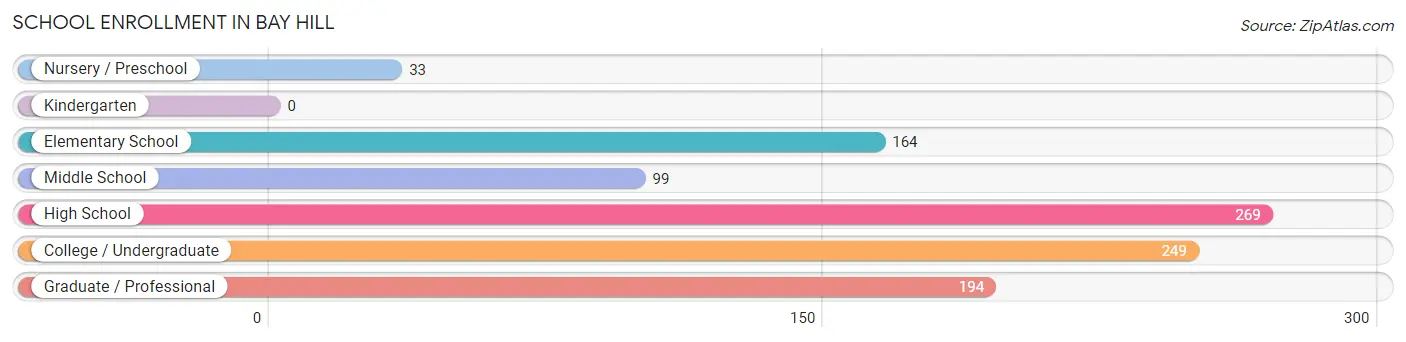
The most common levels of schooling among the 1,008 students in Bay Hill are high school (269 | 26.7%), college / undergraduate (249 | 24.7%), and graduate / professional (194 | 19.3%).
| School Level | # Students | % Students |
| Nursery / Preschool | 33 | 3.3% |
| Kindergarten | 0 | 0.0% |
| Elementary School | 164 | 16.3% |
| Middle School | 99 | 9.8% |
| High School | 269 | 26.7% |
| College / Undergraduate | 249 | 24.7% |
| Graduate / Professional | 194 | 19.3% |
| Total | 1,008 | 100.0% |
School Enrollment by Age by Funding Source in Bay Hill
Out of a total of 1,008 students who are enrolled in schools in Bay Hill, 199 (19.7%) attend a private institution, while the remaining 809 (80.3%) are enrolled in public schools. The age group of 3 to 4 year olds has the highest likelihood of being enrolled in private schools, with 29 (100.0% in the age bracket) enrolled. Conversely, the age group of 20 to 24 year olds has the lowest likelihood of being enrolled in a private school, with 171 (100.0% in the age bracket) attending a public institution.
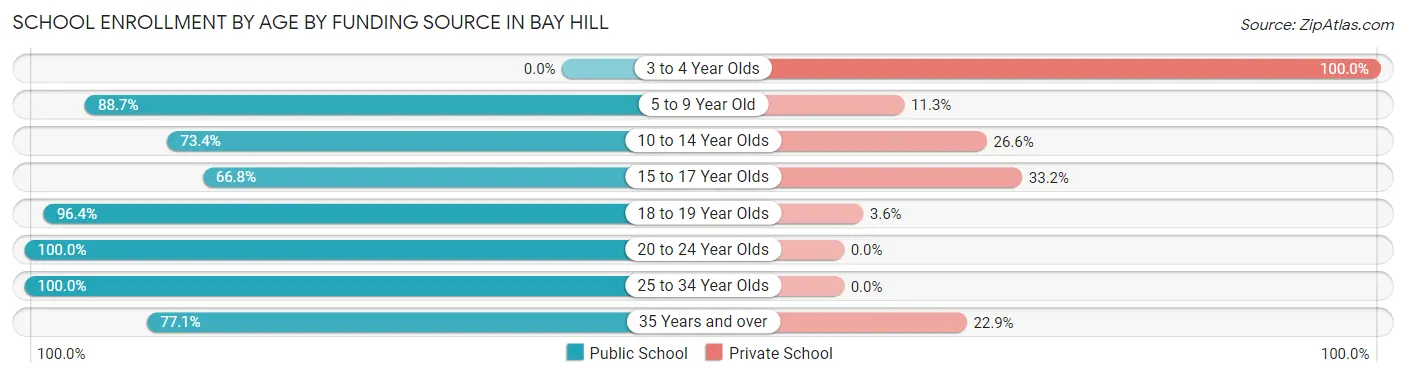
| Age Bracket | Public School | Private School |
| 3 to 4 Year Olds | 0 (0.0%) | 29 (100.0%) |
| 5 to 9 Year Old | 126 (88.7%) | 16 (11.3%) |
| 10 to 14 Year Olds | 91 (73.4%) | 33 (26.6%) |
| 15 to 17 Year Olds | 151 (66.8%) | 75 (33.2%) |
| 18 to 19 Year Olds | 81 (96.4%) | 3 (3.6%) |
| 20 to 24 Year Olds | 171 (100.0%) | 0 (0.0%) |
| 25 to 34 Year Olds | 44 (100.0%) | 0 (0.0%) |
| 35 Years and over | 145 (77.1%) | 43 (22.9%) |
| Total | 809 (80.3%) | 199 (19.7%) |
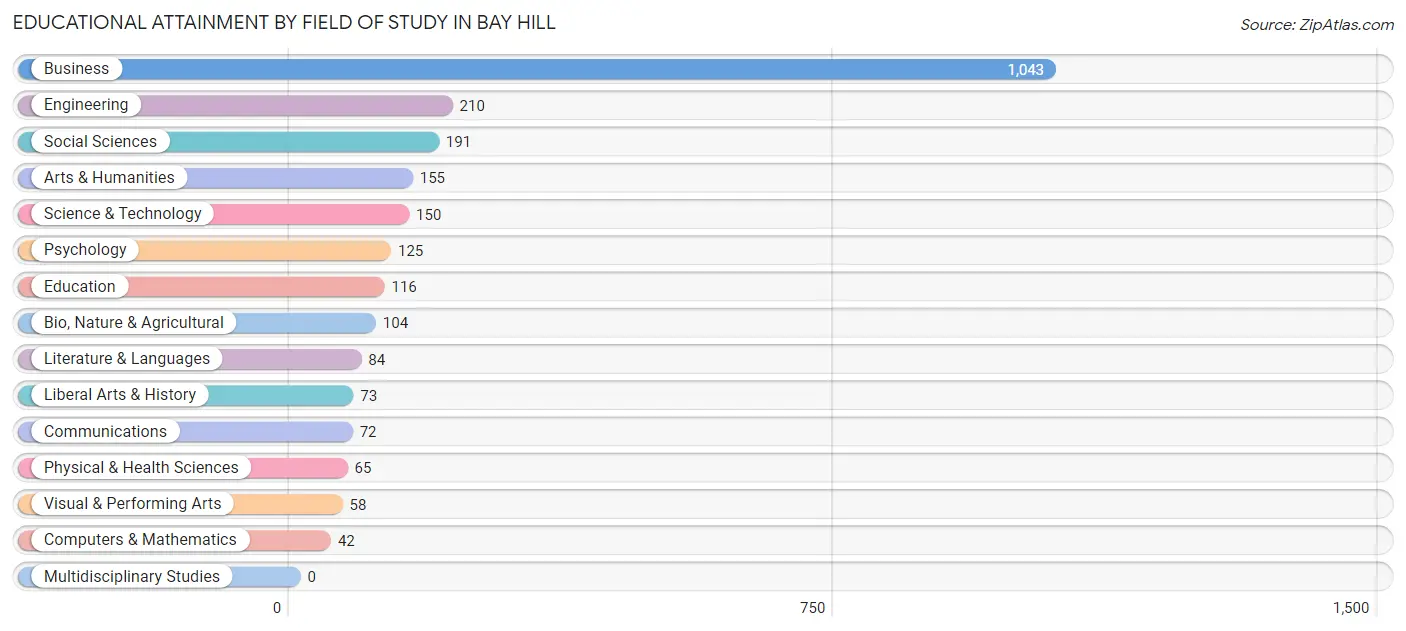
Educational Attainment by Field of Study in Bay Hill
Business (1,043 | 41.9%), engineering (210 | 8.4%), social sciences (191 | 7.7%), arts & humanities (155 | 6.2%), and science & technology (150 | 6.0%) are the most common fields of study among 2,488 individuals in Bay Hill who have obtained a bachelor's degree or higher.
| Field of Study | # Graduates | % Graduates |
| Computers & Mathematics | 42 | 1.7% |
| Bio, Nature & Agricultural | 104 | 4.2% |
| Physical & Health Sciences | 65 | 2.6% |
| Psychology | 125 | 5.0% |
| Social Sciences | 191 | 7.7% |
| Engineering | 210 | 8.4% |
| Multidisciplinary Studies | 0 | 0.0% |
| Science & Technology | 150 | 6.0% |
| Business | 1,043 | 41.9% |
| Education | 116 | 4.7% |
| Literature & Languages | 84 | 3.4% |
| Liberal Arts & History | 73 | 2.9% |
| Visual & Performing Arts | 58 | 2.3% |
| Communications | 72 | 2.9% |
| Arts & Humanities | 155 | 6.2% |
| Total | 2,488 | 100.0% |
Transportation & Commute in Bay Hill
Vehicle Availability by Sex in Bay Hill
The most prevalent vehicle ownership categories in Bay Hill are males with 2 vehicles (503, accounting for 41.0%) and females with 2 vehicles (409, making up 42.1%).
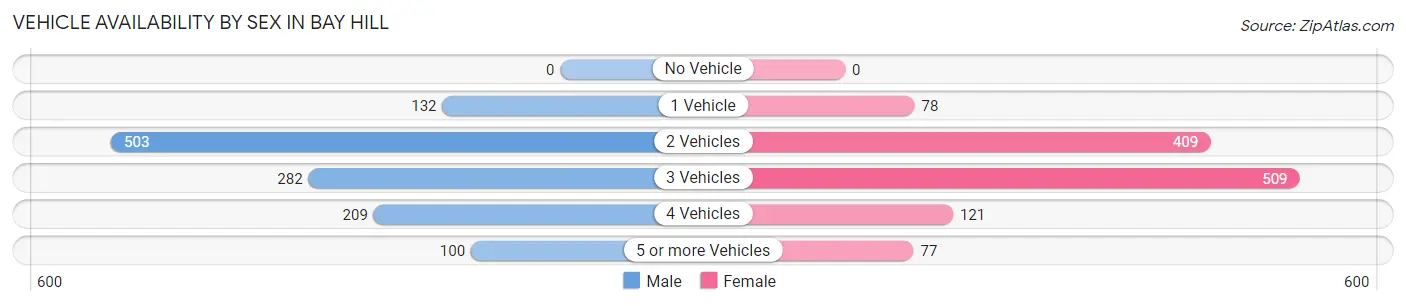
| Vehicles Available | Male | Female |
| No Vehicle | 0 (0.0%) | 0 (0.0%) |
| 1 Vehicle | 132 (10.8%) | 78 (6.5%) |
| 2 Vehicles | 503 (41.0%) | 409 (34.3%) |
| 3 Vehicles | 282 (23.0%) | 509 (42.6%) |
| 4 Vehicles | 209 (17.1%) | 121 (10.1%) |
| 5 or more Vehicles | 100 (8.2%) | 77 (6.5%) |
| Total | 1,226 (100.0%) | 1,194 (100.0%) |
Commute Time in Bay Hill
The most frequently occuring commute durations in Bay Hill are 30 to 34 minutes (468 commuters, 24.1%), 15 to 19 minutes (447 commuters, 23.0%), and 20 to 24 minutes (270 commuters, 13.9%).
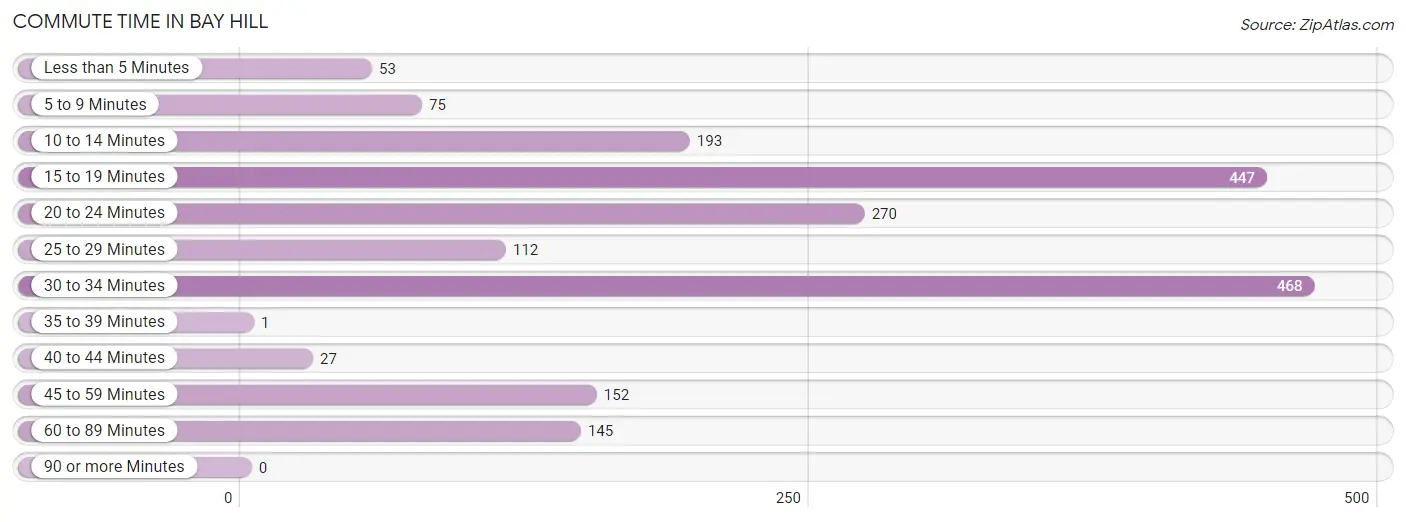
| Commute Time | # Commuters | % Commuters |
| Less than 5 Minutes | 53 | 2.7% |
| 5 to 9 Minutes | 75 | 3.9% |
| 10 to 14 Minutes | 193 | 9.9% |
| 15 to 19 Minutes | 447 | 23.0% |
| 20 to 24 Minutes | 270 | 13.9% |
| 25 to 29 Minutes | 112 | 5.8% |
| 30 to 34 Minutes | 468 | 24.1% |
| 35 to 39 Minutes | 1 | 0.1% |
| 40 to 44 Minutes | 27 | 1.4% |
| 45 to 59 Minutes | 152 | 7.8% |
| 60 to 89 Minutes | 145 | 7.5% |
| 90 or more Minutes | 0 | 0.0% |
Commute Time by Sex in Bay Hill
The most common commute times in Bay Hill are 30 to 34 minutes (273 commuters, 29.4%) for males and 15 to 19 minutes (286 commuters, 28.2%) for females.
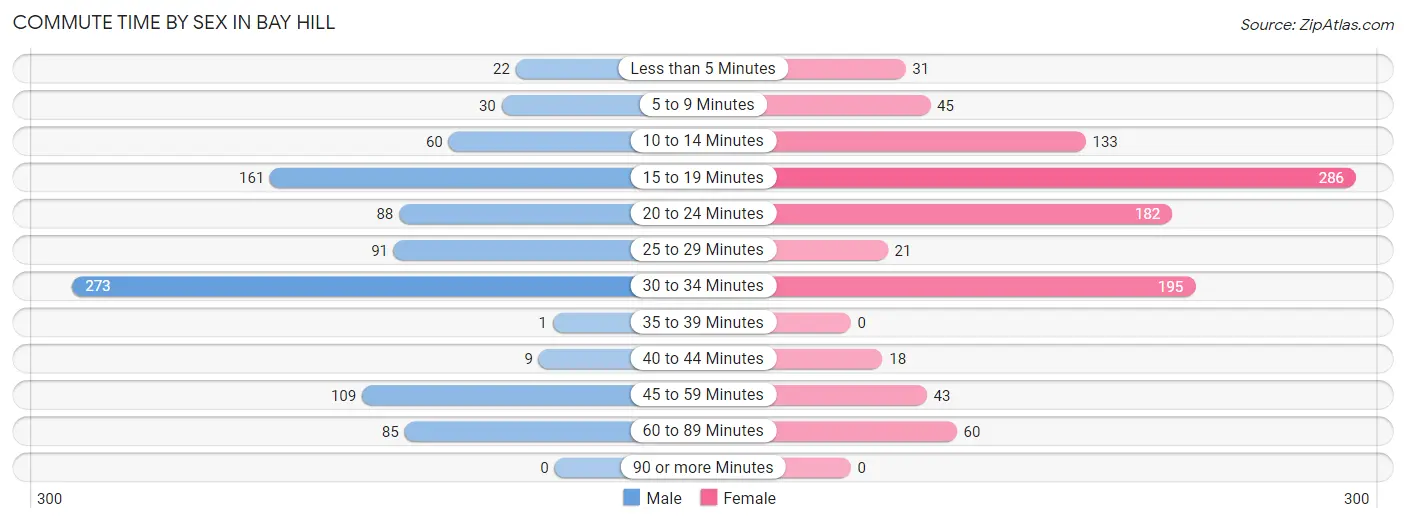
| Commute Time | Male | Female |
| Less than 5 Minutes | 22 (2.4%) | 31 (3.1%) |
| 5 to 9 Minutes | 30 (3.2%) | 45 (4.4%) |
| 10 to 14 Minutes | 60 (6.5%) | 133 (13.1%) |
| 15 to 19 Minutes | 161 (17.3%) | 286 (28.2%) |
| 20 to 24 Minutes | 88 (9.5%) | 182 (17.9%) |
| 25 to 29 Minutes | 91 (9.8%) | 21 (2.1%) |
| 30 to 34 Minutes | 273 (29.4%) | 195 (19.2%) |
| 35 to 39 Minutes | 1 (0.1%) | 0 (0.0%) |
| 40 to 44 Minutes | 9 (1.0%) | 18 (1.8%) |
| 45 to 59 Minutes | 109 (11.7%) | 43 (4.2%) |
| 60 to 89 Minutes | 85 (9.1%) | 60 (5.9%) |
| 90 or more Minutes | 0 (0.0%) | 0 (0.0%) |
Time of Departure to Work by Sex in Bay Hill
The most frequent times of departure to work in Bay Hill are 4:00 PM to 11:59 PM (121, 13.0%) for males and 9:00 AM to 9:59 AM (196, 19.3%) for females.
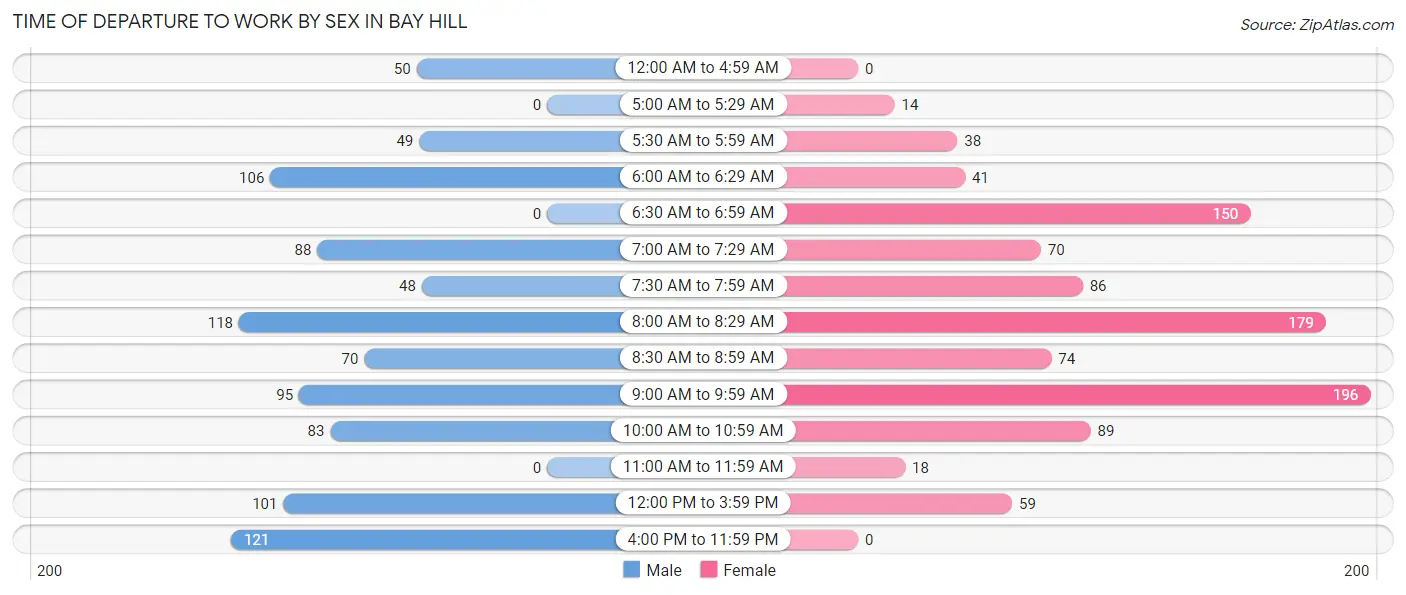
| Time of Departure | Male | Female |
| 12:00 AM to 4:59 AM | 50 (5.4%) | 0 (0.0%) |
| 5:00 AM to 5:29 AM | 0 (0.0%) | 14 (1.4%) |
| 5:30 AM to 5:59 AM | 49 (5.3%) | 38 (3.7%) |
| 6:00 AM to 6:29 AM | 106 (11.4%) | 41 (4.0%) |
| 6:30 AM to 6:59 AM | 0 (0.0%) | 150 (14.8%) |
| 7:00 AM to 7:29 AM | 88 (9.5%) | 70 (6.9%) |
| 7:30 AM to 7:59 AM | 48 (5.2%) | 86 (8.5%) |
| 8:00 AM to 8:29 AM | 118 (12.7%) | 179 (17.6%) |
| 8:30 AM to 8:59 AM | 70 (7.5%) | 74 (7.3%) |
| 9:00 AM to 9:59 AM | 95 (10.2%) | 196 (19.3%) |
| 10:00 AM to 10:59 AM | 83 (8.9%) | 89 (8.8%) |
| 11:00 AM to 11:59 AM | 0 (0.0%) | 18 (1.8%) |
| 12:00 PM to 3:59 PM | 101 (10.9%) | 59 (5.8%) |
| 4:00 PM to 11:59 PM | 121 (13.0%) | 0 (0.0%) |
| Total | 929 (100.0%) | 1,014 (100.0%) |
Housing Occupancy in Bay Hill
Occupancy by Ownership in Bay Hill
Of the total 1,714 dwellings in Bay Hill, owner-occupied units account for 1,470 (85.8%), while renter-occupied units make up 244 (14.2%).
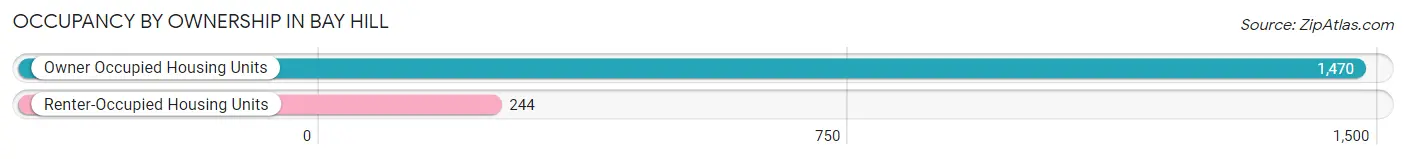
| Occupancy | # Housing Units | % Housing Units |
| Owner Occupied Housing Units | 1,470 | 85.8% |
| Renter-Occupied Housing Units | 244 | 14.2% |
| Total Occupied Housing Units | 1,714 | 100.0% |
Occupancy by Household Size in Bay Hill
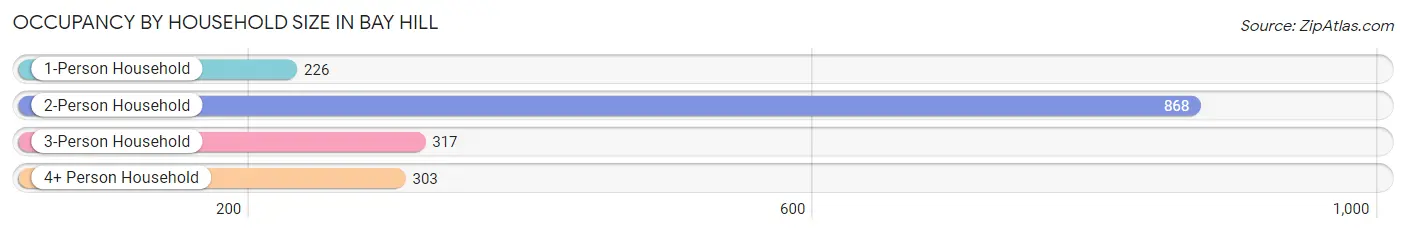
| Household Size | # Housing Units | % Housing Units |
| 1-Person Household | 226 | 13.2% |
| 2-Person Household | 868 | 50.6% |
| 3-Person Household | 317 | 18.5% |
| 4+ Person Household | 303 | 17.7% |
| Total Housing Units | 1,714 | 100.0% |
Occupancy by Ownership by Household Size in Bay Hill
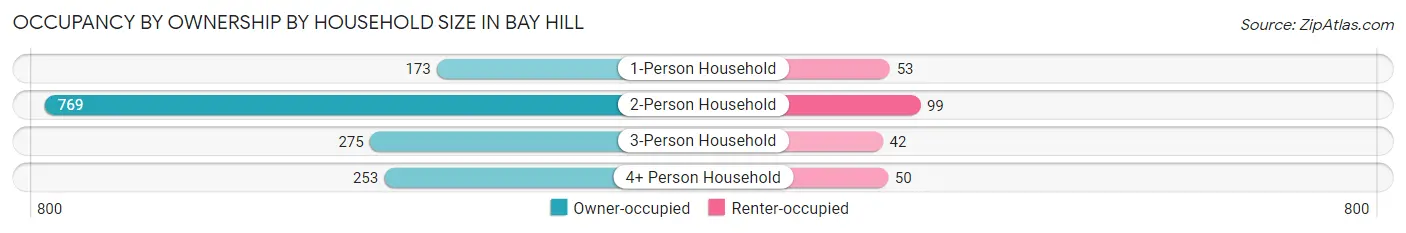
| Household Size | Owner-occupied | Renter-occupied |
| 1-Person Household | 173 (76.5%) | 53 (23.4%) |
| 2-Person Household | 769 (88.6%) | 99 (11.4%) |
| 3-Person Household | 275 (86.8%) | 42 (13.3%) |
| 4+ Person Household | 253 (83.5%) | 50 (16.5%) |
| Total Housing Units | 1,470 (85.8%) | 244 (14.2%) |
Occupancy by Educational Attainment in Bay Hill
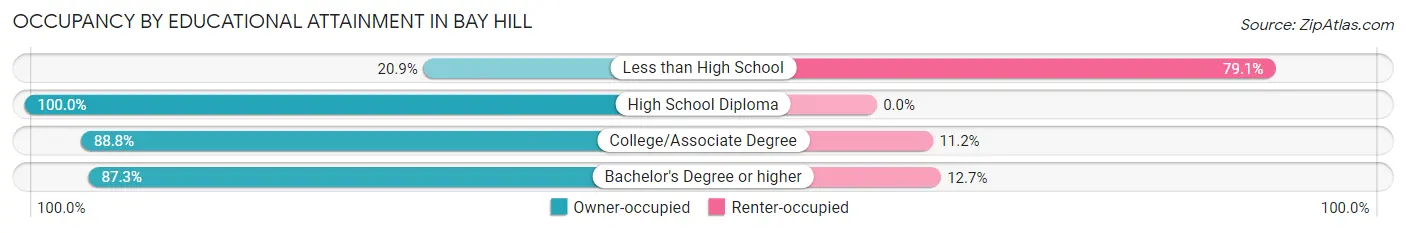
| Household Size | Owner-occupied | Renter-occupied |
| Less than High School | 14 (20.9%) | 53 (79.1%) |
| High School Diploma | 116 (100.0%) | 0 (0.0%) |
| College/Associate Degree | 199 (88.8%) | 25 (11.2%) |
| Bachelor's Degree or higher | 1,141 (87.3%) | 166 (12.7%) |
Occupancy by Age of Householder in Bay Hill
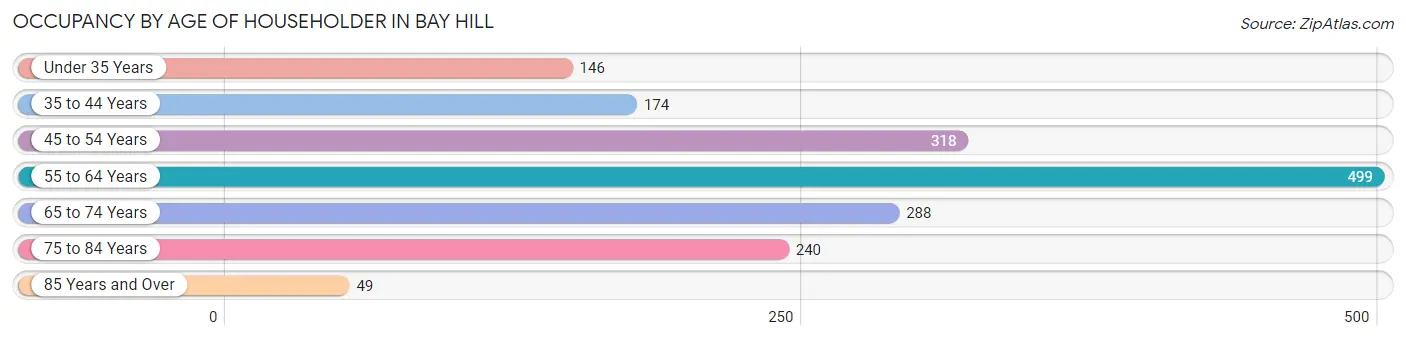
| Age Bracket | # Households | % Households |
| Under 35 Years | 146 | 8.5% |
| 35 to 44 Years | 174 | 10.2% |
| 45 to 54 Years | 318 | 18.5% |
| 55 to 64 Years | 499 | 29.1% |
| 65 to 74 Years | 288 | 16.8% |
| 75 to 84 Years | 240 | 14.0% |
| 85 Years and Over | 49 | 2.9% |
| Total | 1,714 | 100.0% |
Housing Finances in Bay Hill
Median Income by Occupancy in Bay Hill
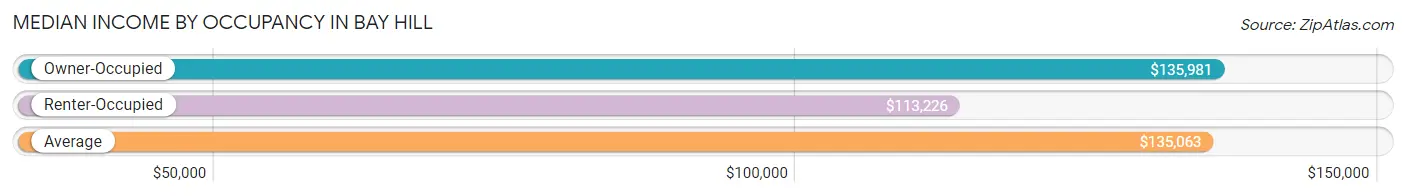
| Occupancy Type | # Households | Median Income |
| Owner-Occupied | 1,470 (85.8%) | $135,981 |
| Renter-Occupied | 244 (14.2%) | $113,226 |
| Average | 1,714 (100.0%) | $135,063 |
Occupancy by Householder Income Bracket in Bay Hill
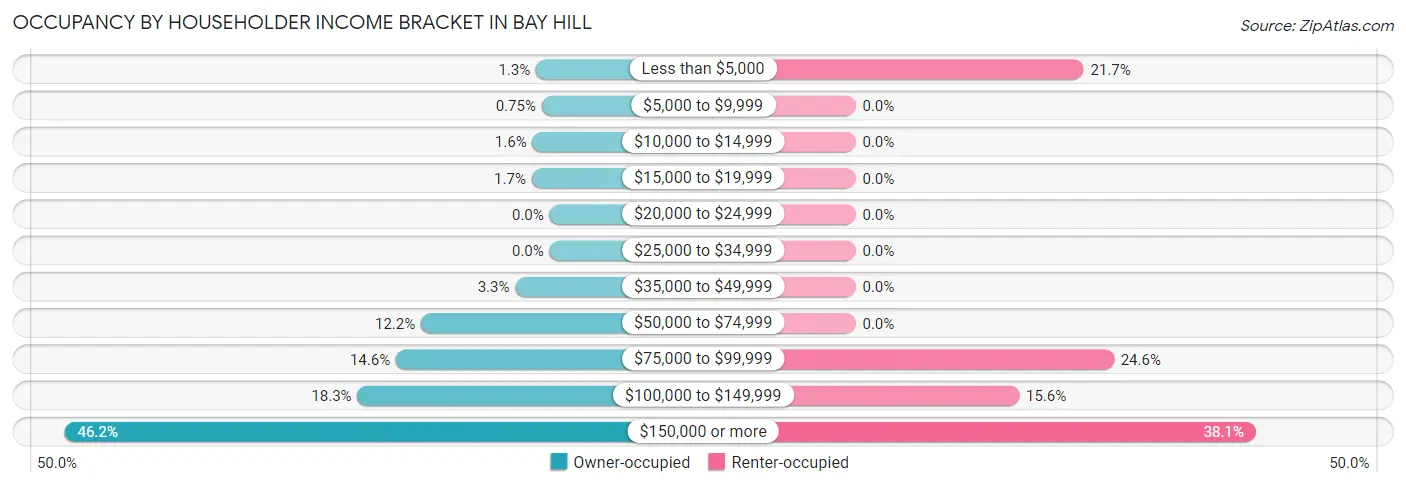
| Income Bracket | Owner-occupied | Renter-occupied |
| Less than $5,000 | 19 (1.3%) | 53 (21.7%) |
| $5,000 to $9,999 | 11 (0.7%) | 0 (0.0%) |
| $10,000 to $14,999 | 24 (1.6%) | 0 (0.0%) |
| $15,000 to $19,999 | 25 (1.7%) | 0 (0.0%) |
| $20,000 to $24,999 | 0 (0.0%) | 0 (0.0%) |
| $25,000 to $34,999 | 0 (0.0%) | 0 (0.0%) |
| $35,000 to $49,999 | 48 (3.3%) | 0 (0.0%) |
| $50,000 to $74,999 | 180 (12.2%) | 0 (0.0%) |
| $75,000 to $99,999 | 215 (14.6%) | 60 (24.6%) |
| $100,000 to $149,999 | 269 (18.3%) | 38 (15.6%) |
| $150,000 or more | 679 (46.2%) | 93 (38.1%) |
| Total | 1,470 (100.0%) | 244 (100.0%) |
Monthly Housing Cost Tiers in Bay Hill
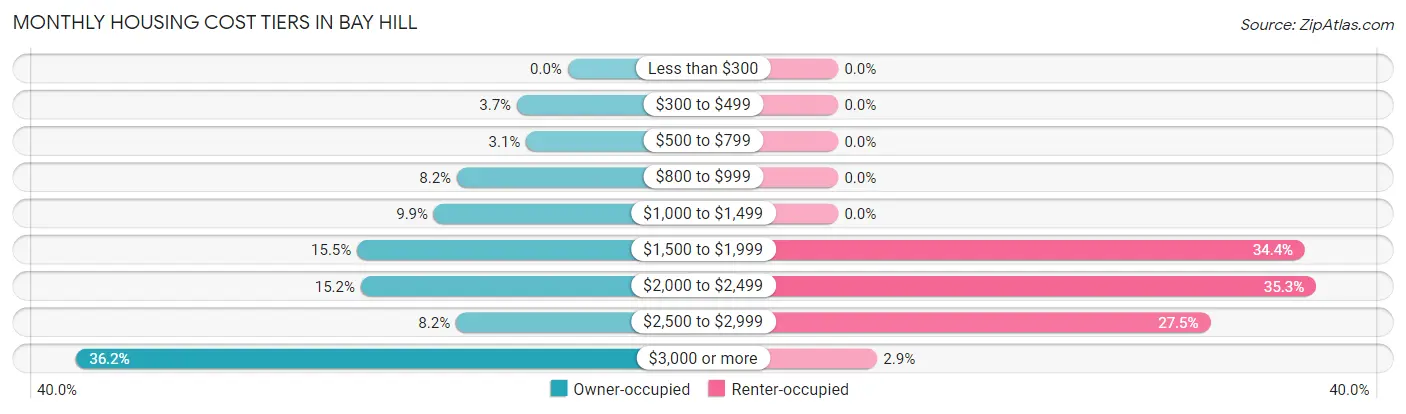
| Monthly Cost | Owner-occupied | Renter-occupied |
| Less than $300 | 0 (0.0%) | 0 (0.0%) |
| $300 to $499 | 55 (3.7%) | 0 (0.0%) |
| $500 to $799 | 45 (3.1%) | 0 (0.0%) |
| $800 to $999 | 120 (8.2%) | 0 (0.0%) |
| $1,000 to $1,499 | 145 (9.9%) | 0 (0.0%) |
| $1,500 to $1,999 | 228 (15.5%) | 84 (34.4%) |
| $2,000 to $2,499 | 224 (15.2%) | 86 (35.2%) |
| $2,500 to $2,999 | 121 (8.2%) | 67 (27.5%) |
| $3,000 or more | 532 (36.2%) | 7 (2.9%) |
| Total | 1,470 (100.0%) | 244 (100.0%) |
Physical Housing Characteristics in Bay Hill
Housing Structures in Bay Hill
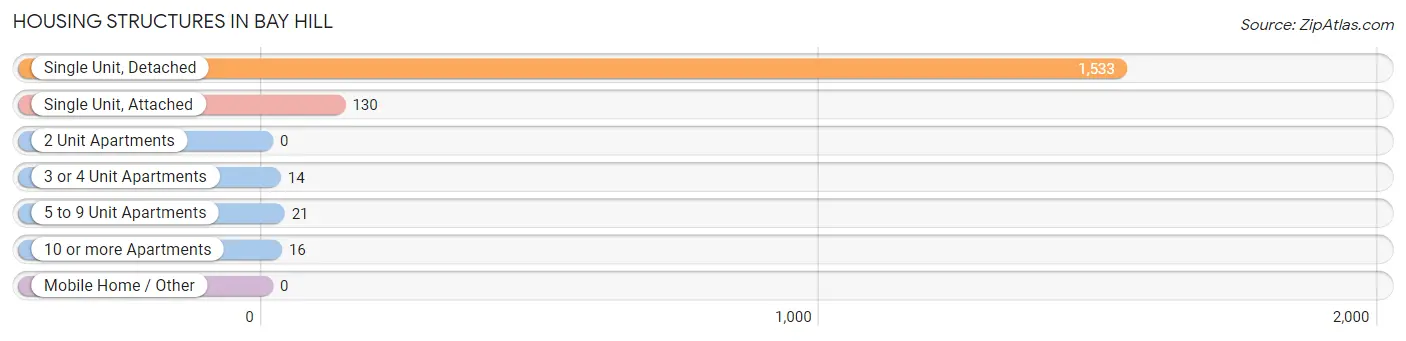
| Structure Type | # Housing Units | % Housing Units |
| Single Unit, Detached | 1,533 | 89.4% |
| Single Unit, Attached | 130 | 7.6% |
| 2 Unit Apartments | 0 | 0.0% |
| 3 or 4 Unit Apartments | 14 | 0.8% |
| 5 to 9 Unit Apartments | 21 | 1.2% |
| 10 or more Apartments | 16 | 0.9% |
| Mobile Home / Other | 0 | 0.0% |
| Total | 1,714 | 100.0% |
Housing Structures by Occupancy in Bay Hill
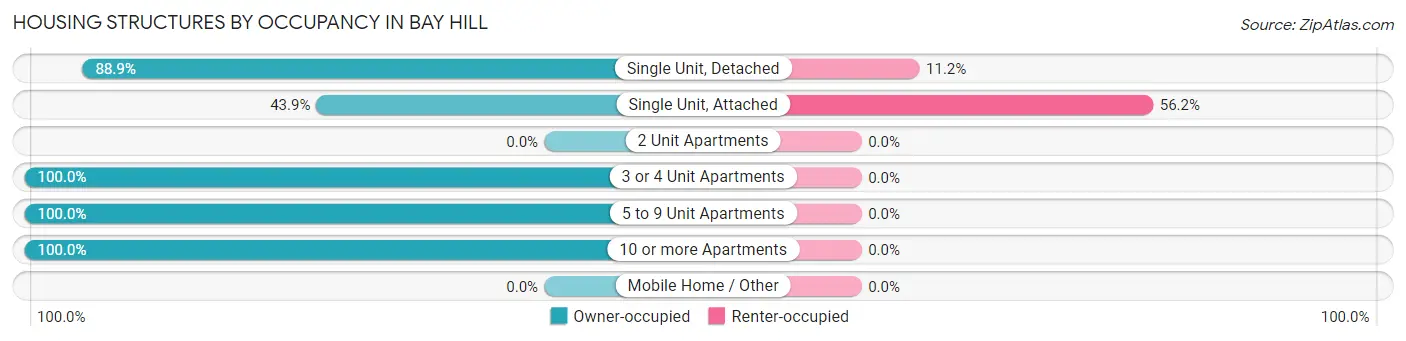
| Structure Type | Owner-occupied | Renter-occupied |
| Single Unit, Detached | 1,362 (88.8%) | 171 (11.2%) |
| Single Unit, Attached | 57 (43.9%) | 73 (56.1%) |
| 2 Unit Apartments | 0 (0.0%) | 0 (0.0%) |
| 3 or 4 Unit Apartments | 14 (100.0%) | 0 (0.0%) |
| 5 to 9 Unit Apartments | 21 (100.0%) | 0 (0.0%) |
| 10 or more Apartments | 16 (100.0%) | 0 (0.0%) |
| Mobile Home / Other | 0 (0.0%) | 0 (0.0%) |
| Total | 1,470 (85.8%) | 244 (14.2%) |
Housing Structures by Number of Rooms in Bay Hill
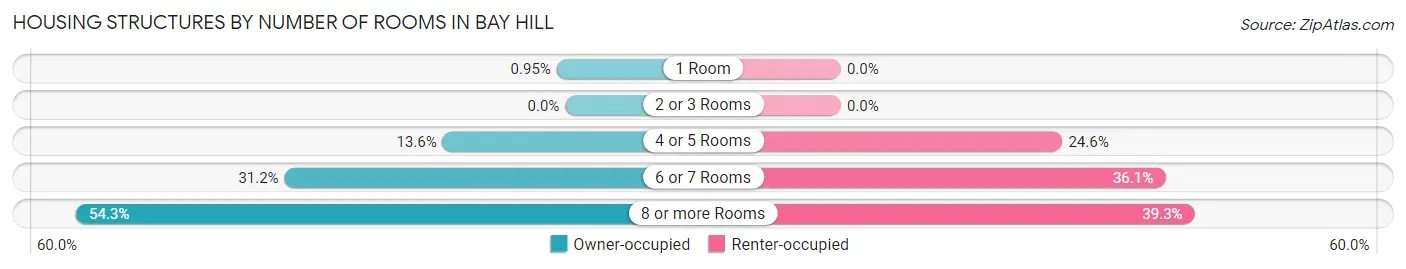
| Number of Rooms | Owner-occupied | Renter-occupied |
| 1 Room | 14 (0.9%) | 0 (0.0%) |
| 2 or 3 Rooms | 0 (0.0%) | 0 (0.0%) |
| 4 or 5 Rooms | 200 (13.6%) | 60 (24.6%) |
| 6 or 7 Rooms | 458 (31.2%) | 88 (36.1%) |
| 8 or more Rooms | 798 (54.3%) | 96 (39.3%) |
| Total | 1,470 (100.0%) | 244 (100.0%) |
Housing Structure by Heating Type in Bay Hill
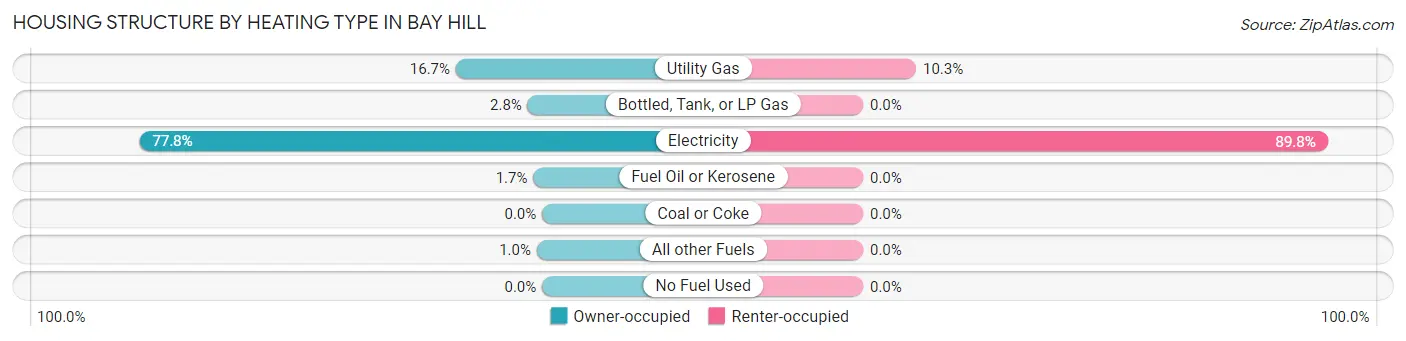
| Heating Type | Owner-occupied | Renter-occupied |
| Utility Gas | 245 (16.7%) | 25 (10.2%) |
| Bottled, Tank, or LP Gas | 41 (2.8%) | 0 (0.0%) |
| Electricity | 1,144 (77.8%) | 219 (89.7%) |
| Fuel Oil or Kerosene | 25 (1.7%) | 0 (0.0%) |
| Coal or Coke | 0 (0.0%) | 0 (0.0%) |
| All other Fuels | 15 (1.0%) | 0 (0.0%) |
| No Fuel Used | 0 (0.0%) | 0 (0.0%) |
| Total | 1,470 (100.0%) | 244 (100.0%) |
Household Vehicle Usage in Bay Hill
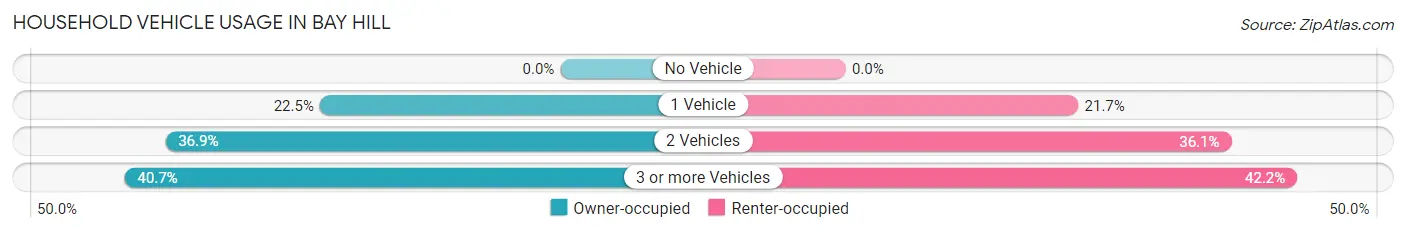
| Vehicles per Household | Owner-occupied | Renter-occupied |
| No Vehicle | 0 (0.0%) | 0 (0.0%) |
| 1 Vehicle | 330 (22.5%) | 53 (21.7%) |
| 2 Vehicles | 542 (36.9%) | 88 (36.1%) |
| 3 or more Vehicles | 598 (40.7%) | 103 (42.2%) |
| Total | 1,470 (100.0%) | 244 (100.0%) |
Real Estate & Mortgages in Bay Hill
Real Estate and Mortgage Overview in Bay Hill
| Characteristic | Without Mortgage | With Mortgage |
| Housing Units | 454 | 1,016 |
| Median Property Value | $643,400 | $655,900 |
| Median Household Income | $86,923 | $538 |
| Monthly Housing Costs | $1,400 | $474 |
| Real Estate Taxes | $7,564 | $21 |
Property Value by Mortgage Status in Bay Hill
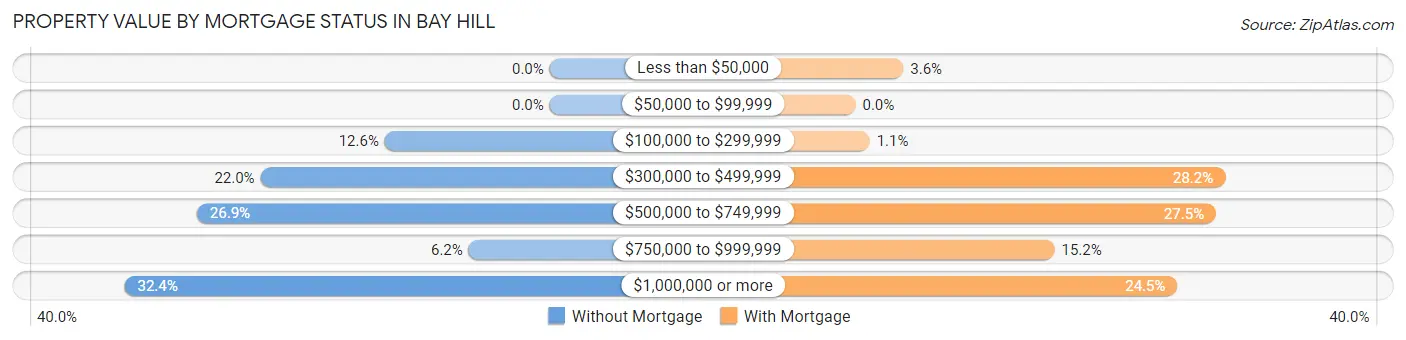
| Property Value | Without Mortgage | With Mortgage |
| Less than $50,000 | 0 (0.0%) | 37 (3.6%) |
| $50,000 to $99,999 | 0 (0.0%) | 0 (0.0%) |
| $100,000 to $299,999 | 57 (12.6%) | 11 (1.1%) |
| $300,000 to $499,999 | 100 (22.0%) | 286 (28.1%) |
| $500,000 to $749,999 | 122 (26.9%) | 279 (27.5%) |
| $750,000 to $999,999 | 28 (6.2%) | 154 (15.2%) |
| $1,000,000 or more | 147 (32.4%) | 249 (24.5%) |
| Total | 454 (100.0%) | 1,016 (100.0%) |
Household Income by Mortgage Status in Bay Hill
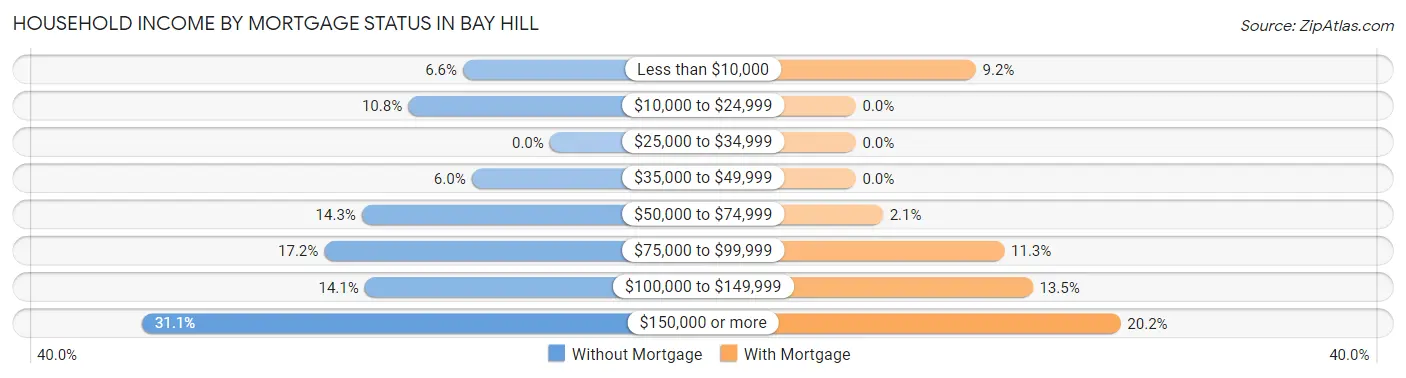
| Household Income | Without Mortgage | With Mortgage |
| Less than $10,000 | 30 (6.6%) | 93 (9.1%) |
| $10,000 to $24,999 | 49 (10.8%) | 0 (0.0%) |
| $25,000 to $34,999 | 0 (0.0%) | 0 (0.0%) |
| $35,000 to $49,999 | 27 (5.9%) | 0 (0.0%) |
| $50,000 to $74,999 | 65 (14.3%) | 21 (2.1%) |
| $75,000 to $99,999 | 78 (17.2%) | 115 (11.3%) |
| $100,000 to $149,999 | 64 (14.1%) | 137 (13.5%) |
| $150,000 or more | 141 (31.1%) | 205 (20.2%) |
| Total | 454 (100.0%) | 1,016 (100.0%) |
Property Value to Household Income Ratio in Bay Hill
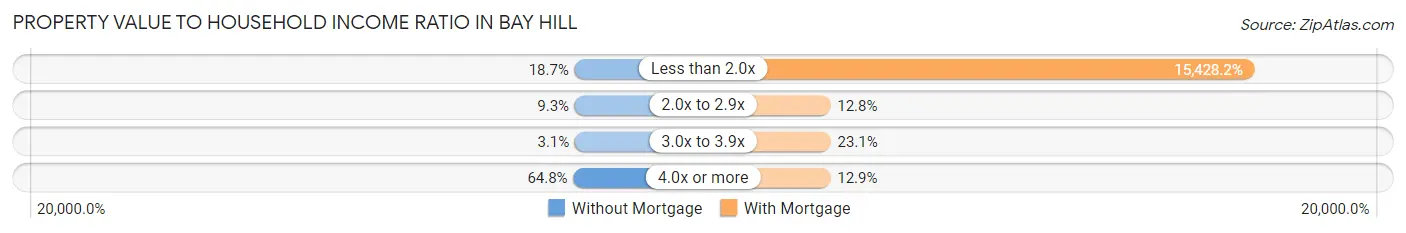
| Value-to-Income Ratio | Without Mortgage | With Mortgage |
| Less than 2.0x | 85 (18.7%) | 156,750 (15,428.1%) |
| 2.0x to 2.9x | 42 (9.2%) | 130 (12.8%) |
| 3.0x to 3.9x | 14 (3.1%) | 235 (23.1%) |
| 4.0x or more | 294 (64.8%) | 131 (12.9%) |
| Total | 454 (100.0%) | 1,016 (100.0%) |
Real Estate Taxes by Mortgage Status in Bay Hill
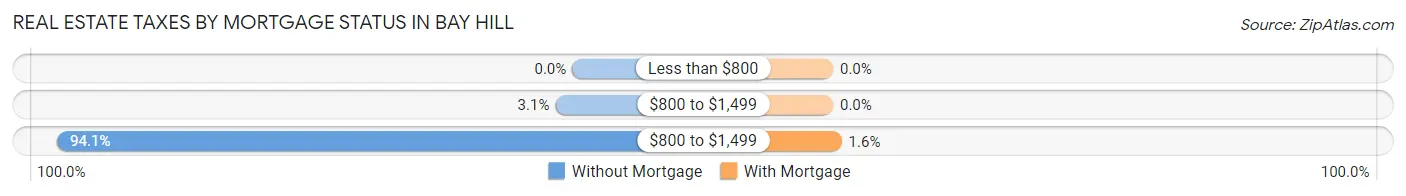
| Property Taxes | Without Mortgage | With Mortgage |
| Less than $800 | 0 (0.0%) | 0 (0.0%) |
| $800 to $1,499 | 14 (3.1%) | 0 (0.0%) |
| $800 to $1,499 | 427 (94.1%) | 16 (1.6%) |
| Total | 454 (100.0%) | 1,016 (100.0%) |
Health & Disability in Bay Hill
Health Insurance Coverage by Age in Bay Hill
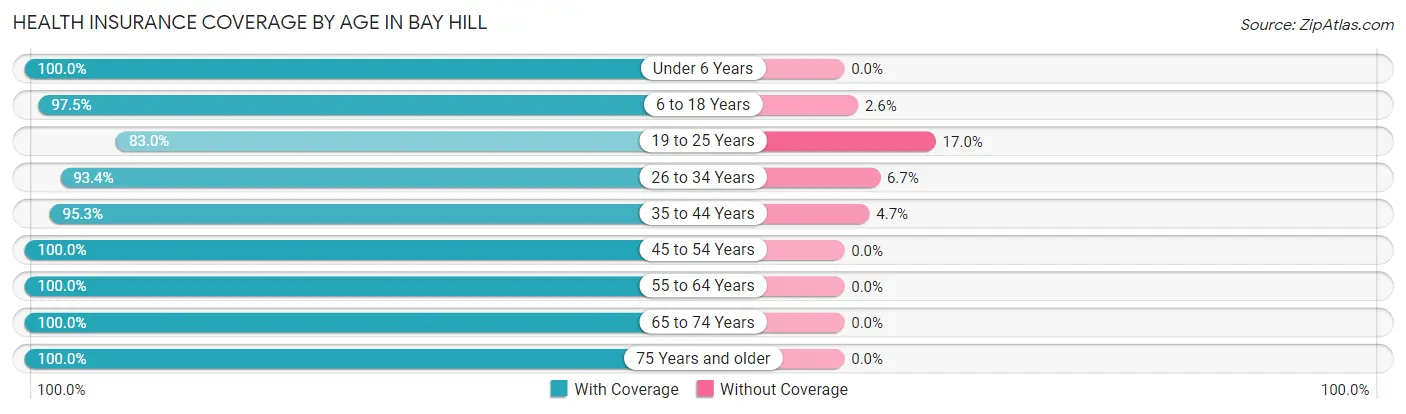
| Age Bracket | With Coverage | Without Coverage |
| Under 6 Years | 81 (100.0%) | 0 (0.0%) |
| 6 to 18 Years | 574 (97.5%) | 15 (2.5%) |
| 19 to 25 Years | 258 (83.0%) | 53 (17.0%) |
| 26 to 34 Years | 351 (93.3%) | 25 (6.7%) |
| 35 to 44 Years | 306 (95.3%) | 15 (4.7%) |
| 45 to 54 Years | 711 (100.0%) | 0 (0.0%) |
| 55 to 64 Years | 927 (100.0%) | 0 (0.0%) |
| 65 to 74 Years | 636 (100.0%) | 0 (0.0%) |
| 75 Years and older | 411 (100.0%) | 0 (0.0%) |
| Total | 4,255 (97.5%) | 108 (2.5%) |
Health Insurance Coverage by Citizenship Status in Bay Hill
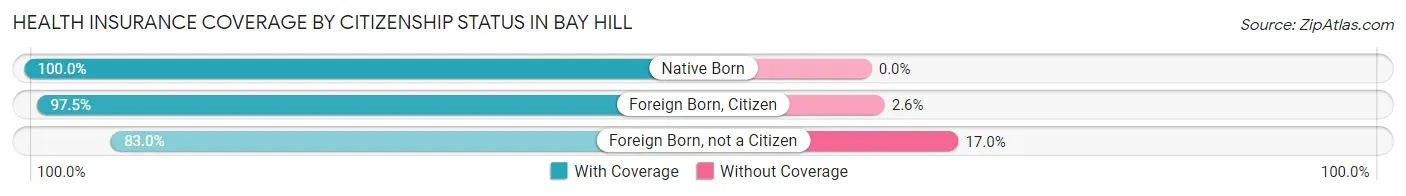
| Citizenship Status | With Coverage | Without Coverage |
| Native Born | 81 (100.0%) | 0 (0.0%) |
| Foreign Born, Citizen | 574 (97.5%) | 15 (2.5%) |
| Foreign Born, not a Citizen | 258 (83.0%) | 53 (17.0%) |
Health Insurance Coverage by Household Income in Bay Hill
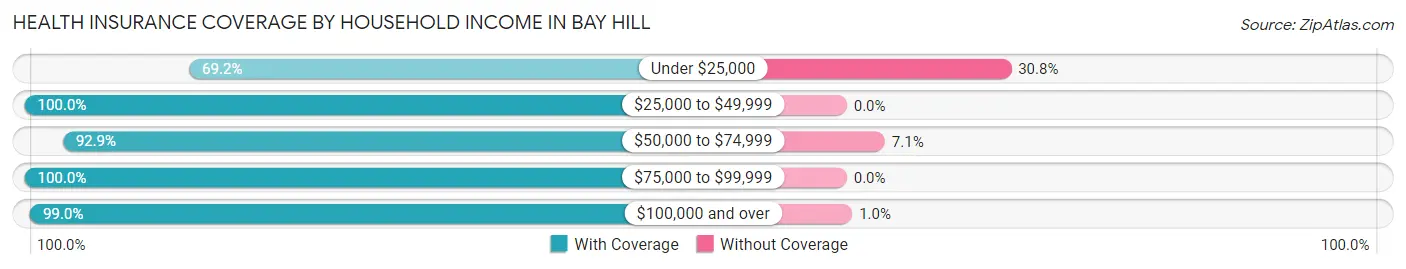
| Household Income | With Coverage | Without Coverage |
| Under $25,000 | 119 (69.2%) | 53 (30.8%) |
| $25,000 to $49,999 | 135 (100.0%) | 0 (0.0%) |
| $50,000 to $74,999 | 325 (92.9%) | 25 (7.1%) |
| $75,000 to $99,999 | 759 (100.0%) | 0 (0.0%) |
| $100,000 and over | 2,917 (99.0%) | 30 (1.0%) |
Public vs Private Health Insurance Coverage by Age in Bay Hill
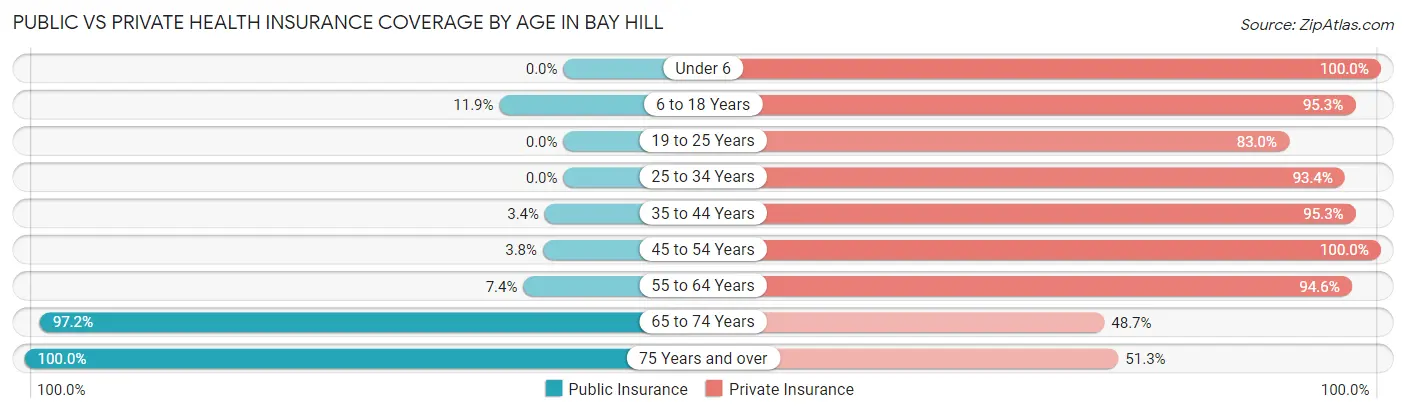
| Age Bracket | Public Insurance | Private Insurance |
| Under 6 | 0 (0.0%) | 81 (100.0%) |
| 6 to 18 Years | 70 (11.9%) | 561 (95.3%) |
| 19 to 25 Years | 0 (0.0%) | 258 (83.0%) |
| 25 to 34 Years | 0 (0.0%) | 351 (93.3%) |
| 35 to 44 Years | 11 (3.4%) | 306 (95.3%) |
| 45 to 54 Years | 27 (3.8%) | 711 (100.0%) |
| 55 to 64 Years | 69 (7.4%) | 877 (94.6%) |
| 65 to 74 Years | 618 (97.2%) | 310 (48.7%) |
| 75 Years and over | 411 (100.0%) | 211 (51.3%) |
| Total | 1,206 (27.6%) | 3,666 (84.0%) |
Disability Status by Sex by Age in Bay Hill
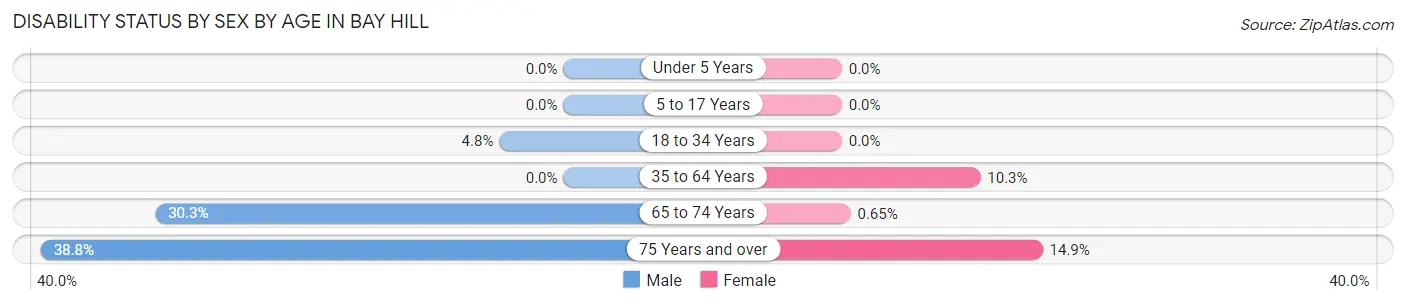
| Age Bracket | Male | Female |
| Under 5 Years | 0 (0.0%) | 0 (0.0%) |
| 5 to 17 Years | 0 (0.0%) | 0 (0.0%) |
| 18 to 34 Years | 18 (4.8%) | 0 (0.0%) |
| 35 to 64 Years | 0 (0.0%) | 110 (10.3%) |
| 65 to 74 Years | 100 (30.3%) | 2 (0.6%) |
| 75 Years and over | 97 (38.8%) | 24 (14.9%) |
Disability Class by Sex by Age in Bay Hill
Disability Class: Hearing Difficulty
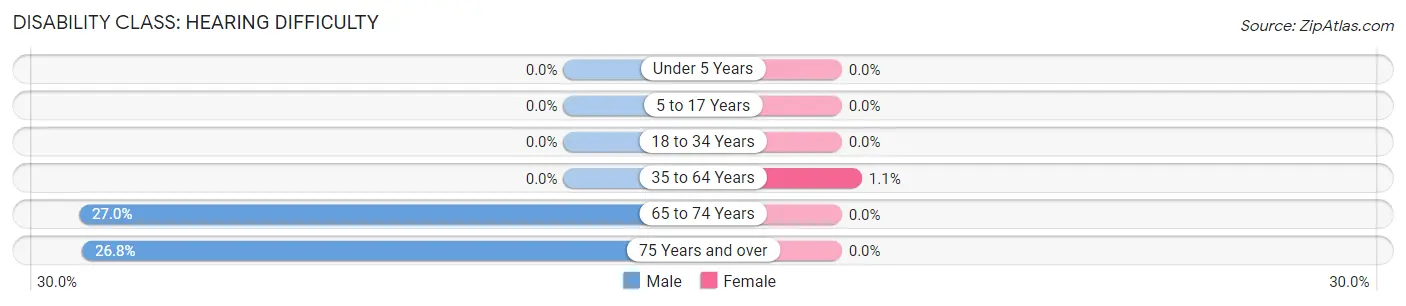
| Age Bracket | Male | Female |
| Under 5 Years | 0 (0.0%) | 0 (0.0%) |
| 5 to 17 Years | 0 (0.0%) | 0 (0.0%) |
| 18 to 34 Years | 0 (0.0%) | 0 (0.0%) |
| 35 to 64 Years | 0 (0.0%) | 12 (1.1%) |
| 65 to 74 Years | 89 (27.0%) | 0 (0.0%) |
| 75 Years and over | 67 (26.8%) | 0 (0.0%) |
Disability Class: Vision Difficulty
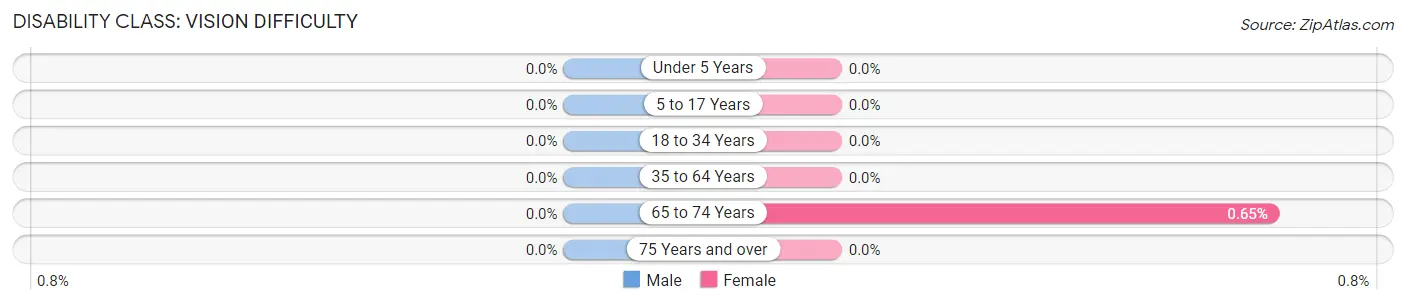
| Age Bracket | Male | Female |
| Under 5 Years | 0 (0.0%) | 0 (0.0%) |
| 5 to 17 Years | 0 (0.0%) | 0 (0.0%) |
| 18 to 34 Years | 0 (0.0%) | 0 (0.0%) |
| 35 to 64 Years | 0 (0.0%) | 0 (0.0%) |
| 65 to 74 Years | 0 (0.0%) | 2 (0.6%) |
| 75 Years and over | 0 (0.0%) | 0 (0.0%) |
Disability Class: Cognitive Difficulty
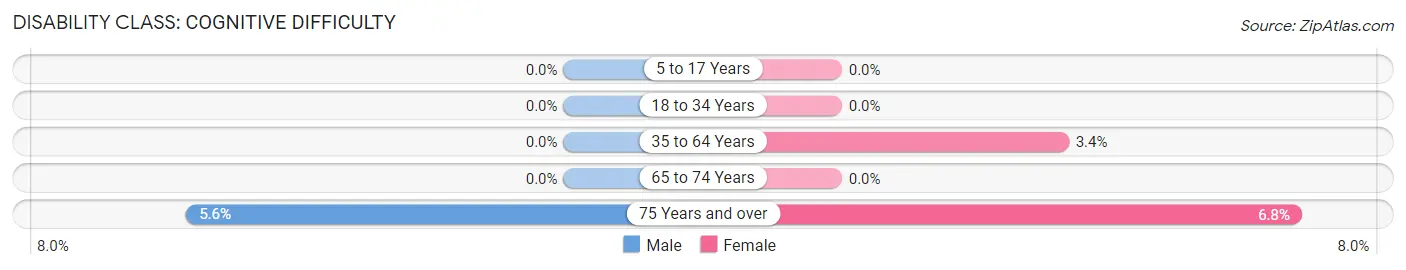
| Age Bracket | Male | Female |
| 5 to 17 Years | 0 (0.0%) | 0 (0.0%) |
| 18 to 34 Years | 0 (0.0%) | 0 (0.0%) |
| 35 to 64 Years | 0 (0.0%) | 36 (3.4%) |
| 65 to 74 Years | 0 (0.0%) | 0 (0.0%) |
| 75 Years and over | 14 (5.6%) | 11 (6.8%) |
Disability Class: Ambulatory Difficulty
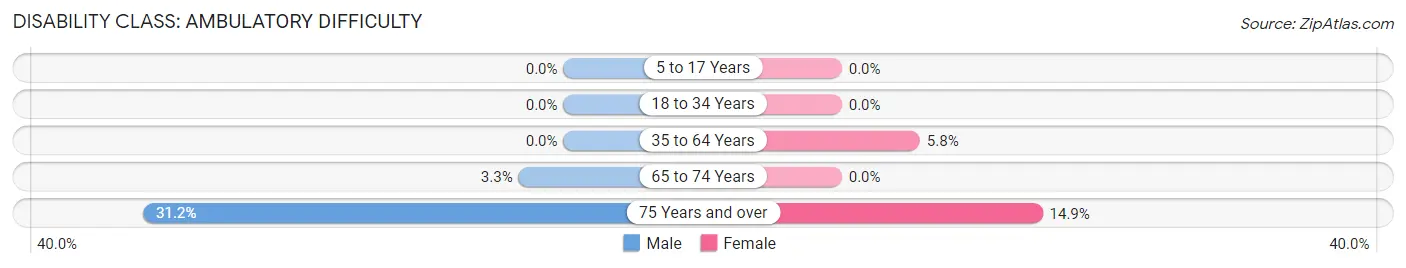
| Age Bracket | Male | Female |
| 5 to 17 Years | 0 (0.0%) | 0 (0.0%) |
| 18 to 34 Years | 0 (0.0%) | 0 (0.0%) |
| 35 to 64 Years | 0 (0.0%) | 62 (5.8%) |
| 65 to 74 Years | 11 (3.3%) | 0 (0.0%) |
| 75 Years and over | 78 (31.2%) | 24 (14.9%) |
Disability Class: Self-Care Difficulty
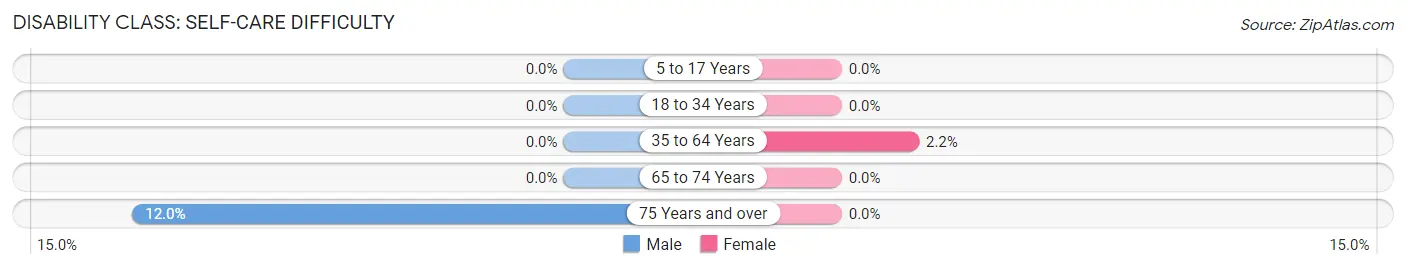
| Age Bracket | Male | Female |
| 5 to 17 Years | 0 (0.0%) | 0 (0.0%) |
| 18 to 34 Years | 0 (0.0%) | 0 (0.0%) |
| 35 to 64 Years | 0 (0.0%) | 23 (2.1%) |
| 65 to 74 Years | 0 (0.0%) | 0 (0.0%) |
| 75 Years and over | 30 (12.0%) | 0 (0.0%) |
Technology Access in Bay Hill
Computing Device Access in Bay Hill
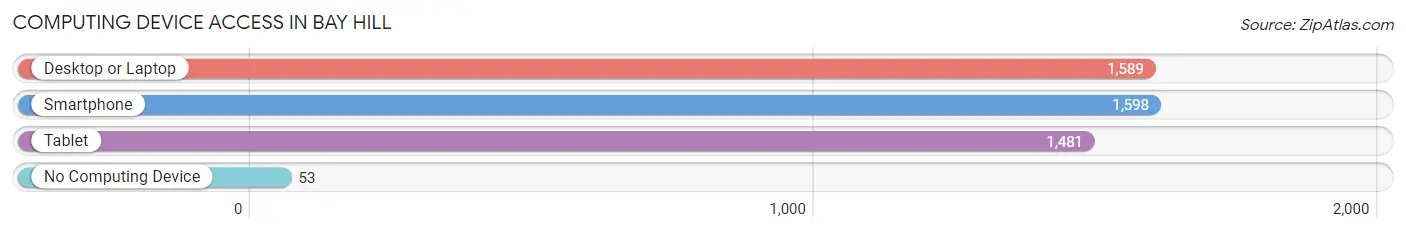
| Device Type | # Households | % Households |
| Desktop or Laptop | 1,589 | 92.7% |
| Smartphone | 1,598 | 93.2% |
| Tablet | 1,481 | 86.4% |
| No Computing Device | 53 | 3.1% |
| Total | 1,714 | 100.0% |
Internet Access in Bay Hill
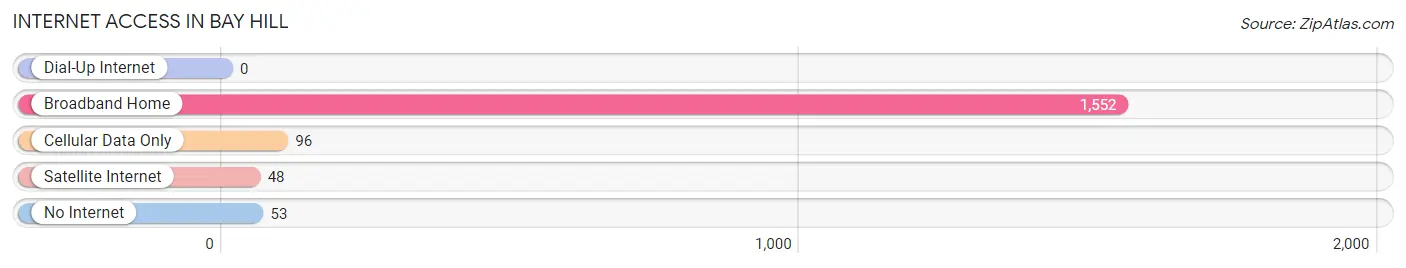
| Internet Type | # Households | % Households |
| Dial-Up Internet | 0 | 0.0% |
| Broadband Home | 1,552 | 90.5% |
| Cellular Data Only | 96 | 5.6% |
| Satellite Internet | 48 | 2.8% |
| No Internet | 53 | 3.1% |
| Total | 1,714 | 100.0% |
Bay Hill Summary
History
Bay Hill is a small, unincorporated community located in Orange County, Florida. It is situated on the west side of the city of Orlando, and is bordered by the Butler Chain of Lakes. The area was originally settled by the Seminole Indians, who used the area for hunting and fishing. The first recorded settler in the area was John F. Butler, who arrived in 1877 and established a homestead on the shores of Lake Tibet. Butler named the area Bay Hill after the bay he found on the lake.
In the early 1900s, the area began to attract more settlers, and the community of Bay Hill began to take shape. The first post office was established in 1912, and the first school was built in 1915. The area continued to grow, and by the 1950s, Bay Hill had become a popular destination for tourists and vacationers.
In the 1960s, Bay Hill began to attract more attention from developers, and the area began to experience rapid growth. In 1965, the Bay Hill Country Club was established, and the area began to attract more affluent residents. The area continued to grow, and by the 1980s, Bay Hill had become one of the most desirable neighborhoods in the Orlando area.
Geography
Bay Hill is located in Orange County, Florida, on the west side of the city of Orlando. It is bordered by the Butler Chain of Lakes to the north and west, and is situated between the cities of Winter Park and Windermere. The area is characterized by rolling hills, lush vegetation, and numerous lakes and ponds. The climate is subtropical, with hot, humid summers and mild winters.
Economy
The economy of Bay Hill is largely driven by tourism and real estate. The area is home to several resorts and golf courses, including the Bay Hill Country Club, which is one of the most prestigious golf courses in the United States. The area also has a number of restaurants, shops, and other businesses that cater to tourists and vacationers.
Demographics
As of the 2010 census, the population of Bay Hill was 2,845. The population is predominantly white (90.2%), with a small percentage of African Americans (4.2%) and Hispanics (3.3%). The median household income is $87,945, and the median home value is $521,000. The area is well-educated, with over half of the population having a bachelor's degree or higher.
Common Questions
What is Per Capita Income in Bay Hill?
Per Capita income in Bay Hill is $89,647.
What is the Median Family Income in Bay Hill?
Median Family Income in Bay Hill is $136,867.
What is the Median Household income in Bay Hill?
Median Household Income in Bay Hill is $135,063.
What is Income or Wage Gap in Bay Hill?
Income or Wage Gap in Bay Hill is 36.8%.
Women in Bay Hill earn 63.2 cents for every dollar earned by a man.
What is Inequality or Gini Index in Bay Hill?
Inequality or Gini Index in Bay Hill is 0.56.
What is the Total Population of Bay Hill?
Total Population of Bay Hill is 4,363.
What is the Total Male Population of Bay Hill?
Total Male Population of Bay Hill is 2,139.
What is the Total Female Population of Bay Hill?
Total Female Population of Bay Hill is 2,224.
What is the Ratio of Males per 100 Females in Bay Hill?
There are 96.18 Males per 100 Females in Bay Hill.
What is the Ratio of Females per 100 Males in Bay Hill?
There are 103.97 Females per 100 Males in Bay Hill.
What is the Median Population Age in Bay Hill?
Median Population Age in Bay Hill is 52.3 Years.
What is the Average Family Size in Bay Hill
Average Family Size in Bay Hill is 2.7 People.
What is the Average Household Size in Bay Hill
Average Household Size in Bay Hill is 2.5 People.
How Large is the Labor Force in Bay Hill?
There are 2,514 People in the Labor Forcein in Bay Hill.
What is the Percentage of People in the Labor Force in Bay Hill?
63.7% of People are in the Labor Force in Bay Hill.
What is the Unemployment Rate in Bay Hill?
Unemployment Rate in Bay Hill is 2.0%.