Belvedere Park, GA Map & Demographics
Belvedere Park Map
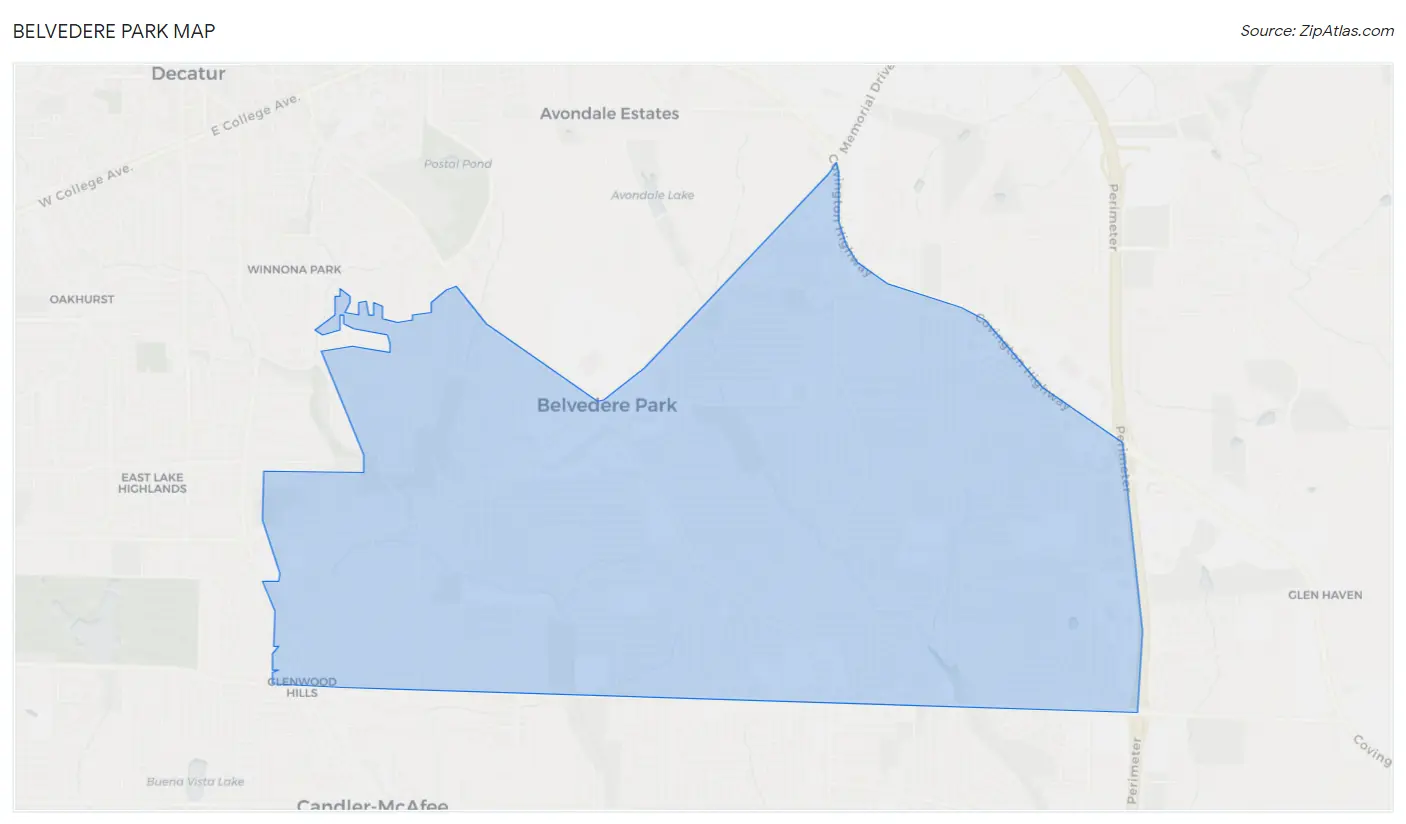
Belvedere Park Overview
$35,726
PER CAPITA INCOME
$75,920
AVG FAMILY INCOME
$66,881
AVG HOUSEHOLD INCOME
10.1%
WAGE / INCOME GAP [ % ]
89.9¢/ $1
WAGE / INCOME GAP [ $ ]
$8,677
FAMILY INCOME DEFICIT
0.46
INEQUALITY / GINI INDEX
14,558
TOTAL POPULATION
6,889
MALE POPULATION
7,669
FEMALE POPULATION
89.83
MALES / 100 FEMALES
111.32
FEMALES / 100 MALES
38.1
MEDIAN AGE
3.4
AVG FAMILY SIZE
2.6
AVG HOUSEHOLD SIZE
8,176
LABOR FORCE [ PEOPLE ]
69.0%
PERCENT IN LABOR FORCE
7.7%
UNEMPLOYMENT RATE
Income in Belvedere Park
Income Overview in Belvedere Park
Per Capita Income in Belvedere Park is $35,726, while median incomes of families and households are $75,920 and $66,881 respectively.
| Characteristic | Number | Measure |
| Per Capita Income | 14,558 | $35,726 |
| Median Family Income | 3,035 | $75,920 |
| Mean Family Income | 3,035 | $100,578 |
| Median Household Income | 5,524 | $66,881 |
| Mean Household Income | 5,524 | $87,141 |
| Income Deficit | 3,035 | $8,677 |
| Wage / Income Gap (%) | 14,558 | 10.07% |
| Wage / Income Gap ($) | 14,558 | 89.93¢ per $1 |
| Gini / Inequality Index | 14,558 | 0.46 |
Earnings by Sex in Belvedere Park
Average Earnings in Belvedere Park are $37,578, $39,963 for men and $35,940 for women, a difference of 10.1%.
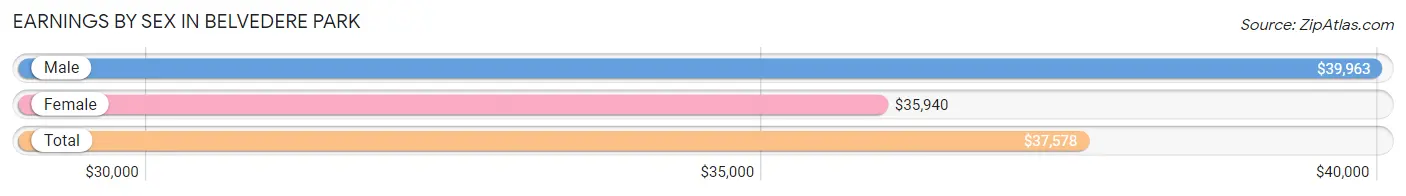
| Sex | Number | Average Earnings |
| Male | 3,889 (47.3%) | $39,963 |
| Female | 4,324 (52.6%) | $35,940 |
| Total | 8,213 (100.0%) | $37,578 |
Earnings by Sex by Income Bracket in Belvedere Park
The most common earnings brackets in Belvedere Park are $100,000+ for men (535 | 13.8%) and $100,000+ for women (436 | 10.1%).
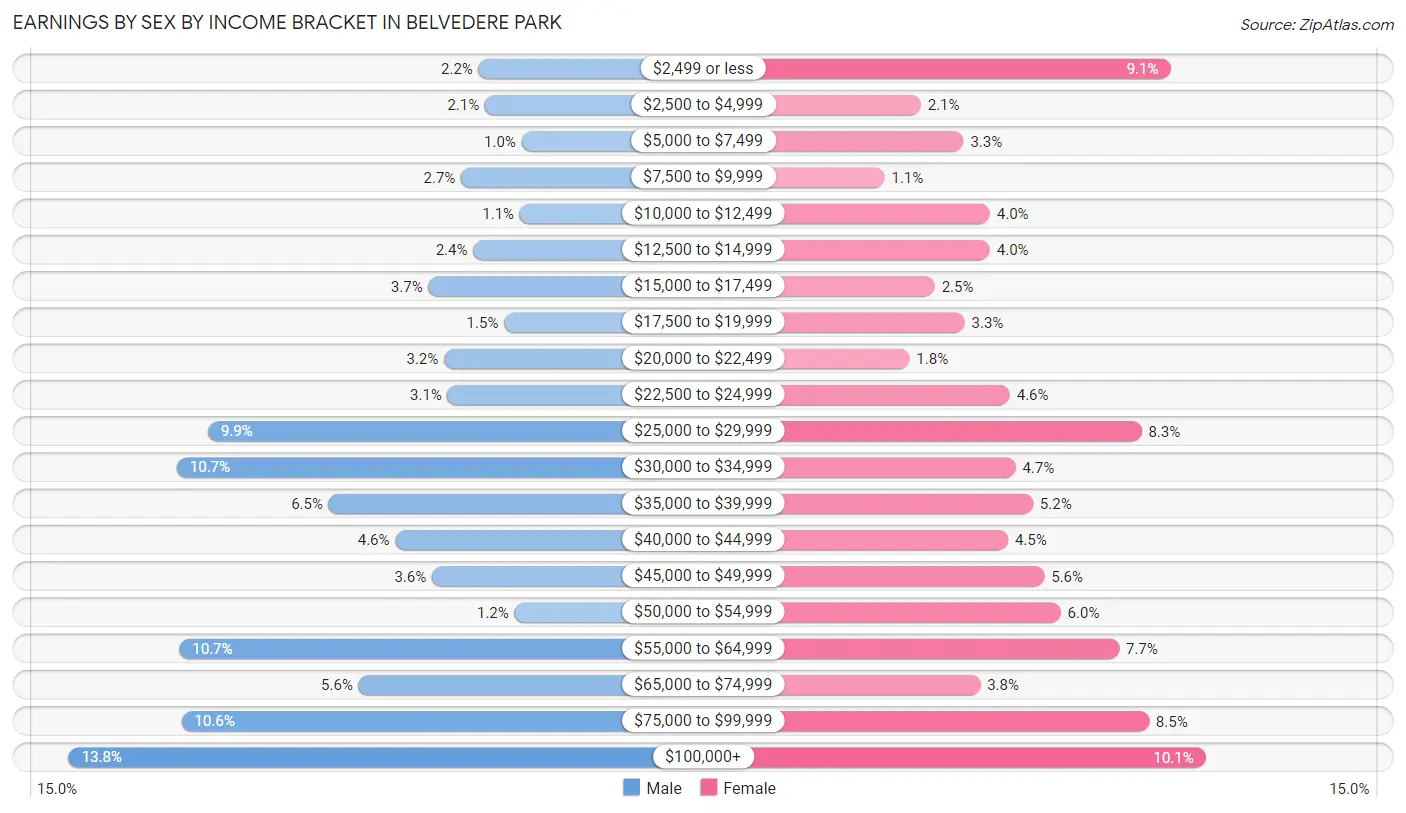
| Income | Male | Female |
| $2,499 or less | 87 (2.2%) | 393 (9.1%) |
| $2,500 to $4,999 | 80 (2.1%) | 90 (2.1%) |
| $5,000 to $7,499 | 40 (1.0%) | 142 (3.3%) |
| $7,500 to $9,999 | 106 (2.7%) | 46 (1.1%) |
| $10,000 to $12,499 | 42 (1.1%) | 174 (4.0%) |
| $12,500 to $14,999 | 93 (2.4%) | 174 (4.0%) |
| $15,000 to $17,499 | 142 (3.6%) | 107 (2.5%) |
| $17,500 to $19,999 | 59 (1.5%) | 143 (3.3%) |
| $20,000 to $22,499 | 125 (3.2%) | 76 (1.8%) |
| $22,500 to $24,999 | 121 (3.1%) | 198 (4.6%) |
| $25,000 to $29,999 | 383 (9.9%) | 358 (8.3%) |
| $30,000 to $34,999 | 417 (10.7%) | 205 (4.7%) |
| $35,000 to $39,999 | 251 (6.5%) | 226 (5.2%) |
| $40,000 to $44,999 | 178 (4.6%) | 196 (4.5%) |
| $45,000 to $49,999 | 138 (3.5%) | 240 (5.6%) |
| $50,000 to $54,999 | 48 (1.2%) | 260 (6.0%) |
| $55,000 to $64,999 | 414 (10.6%) | 331 (7.6%) |
| $65,000 to $74,999 | 218 (5.6%) | 162 (3.7%) |
| $75,000 to $99,999 | 412 (10.6%) | 367 (8.5%) |
| $100,000+ | 535 (13.8%) | 436 (10.1%) |
| Total | 3,889 (100.0%) | 4,324 (100.0%) |
Earnings by Sex by Educational Attainment in Belvedere Park
Average earnings in Belvedere Park are $41,823 for men and $40,117 for women, a difference of 4.1%. Men with an educational attainment of graduate degree enjoy the highest average annual earnings of $71,661, while those with less than high school education earn the least with $21,750. Women with an educational attainment of graduate degree earn the most with the average annual earnings of $57,346, while those with high school diploma education have the smallest earnings of $25,083.
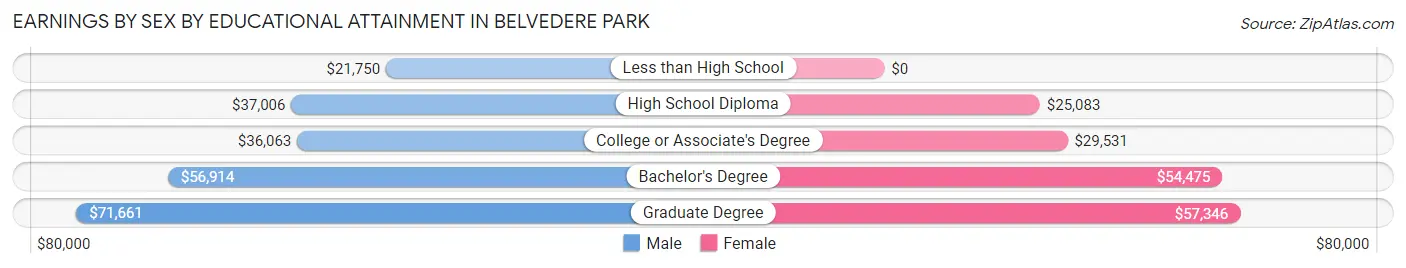
| Educational Attainment | Male Income | Female Income |
| Less than High School | $21,750 | $0 |
| High School Diploma | $37,006 | $25,083 |
| College or Associate's Degree | $36,063 | $29,531 |
| Bachelor's Degree | $56,914 | $54,475 |
| Graduate Degree | $71,661 | $57,346 |
| Total | $41,823 | $40,117 |
Family Income in Belvedere Park
Family Income Brackets in Belvedere Park
According to the Belvedere Park family income data, there are 725 families falling into the $100,000 to $149,999 income range, which is the most common income bracket and makes up 23.9% of all families. Conversely, the less than $10,000 income bracket is the least frequent group with only 46 families (1.5%) belonging to this category.
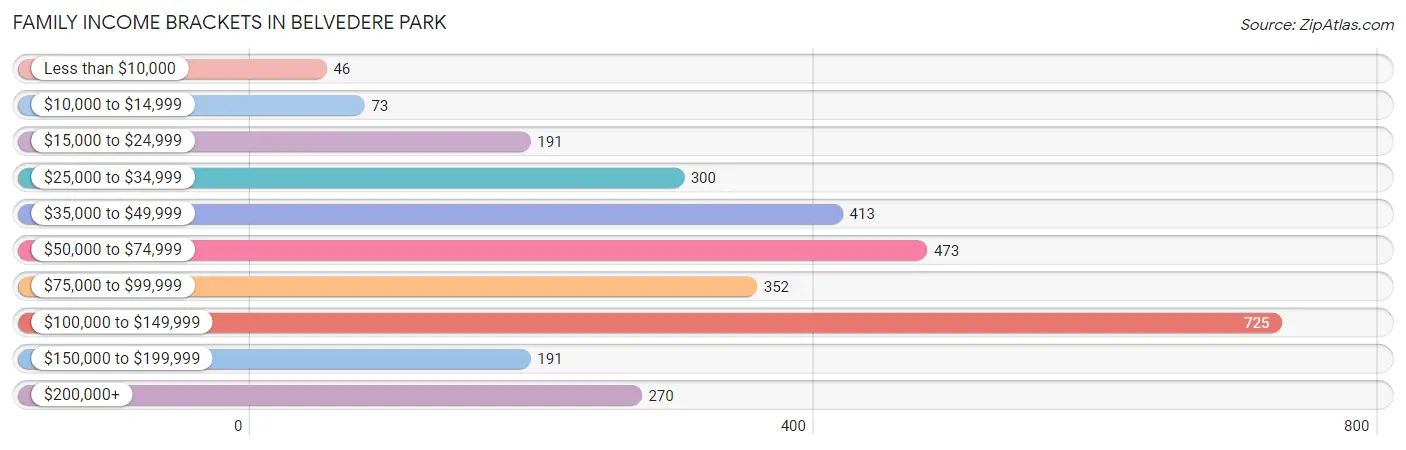
| Income Bracket | # Families | % Families |
| Less than $10,000 | 46 | 1.5% |
| $10,000 to $14,999 | 73 | 2.4% |
| $15,000 to $24,999 | 191 | 6.3% |
| $25,000 to $34,999 | 300 | 9.9% |
| $35,000 to $49,999 | 413 | 13.6% |
| $50,000 to $74,999 | 473 | 15.6% |
| $75,000 to $99,999 | 352 | 11.6% |
| $100,000 to $149,999 | 725 | 23.9% |
| $150,000 to $199,999 | 191 | 6.3% |
| $200,000+ | 270 | 8.9% |
Family Income by Famaliy Size in Belvedere Park
4-person families (566 | 18.6%) account for the highest median family income in Belvedere Park with $86,389 per family, while 2-person families (1,342 | 44.2%) have the highest median income of $35,784 per family member.
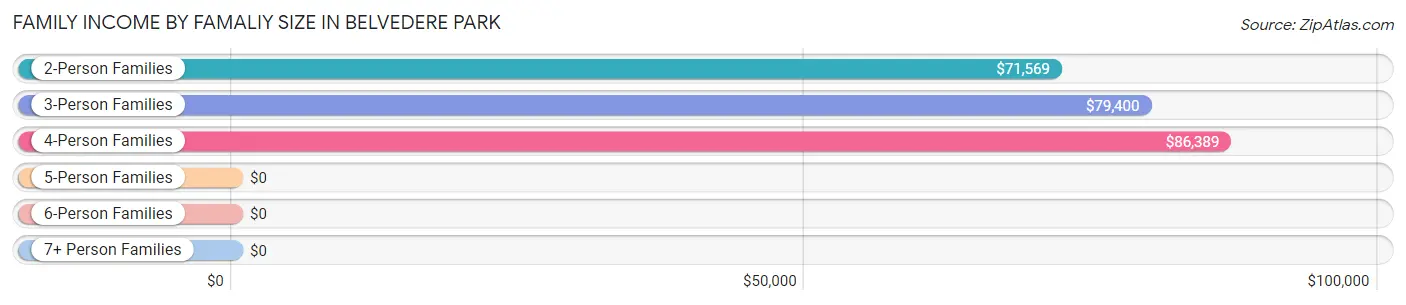
| Income Bracket | # Families | Median Income |
| 2-Person Families | 1,342 (44.2%) | $71,569 |
| 3-Person Families | 918 (30.2%) | $79,400 |
| 4-Person Families | 566 (18.6%) | $86,389 |
| 5-Person Families | 86 (2.8%) | $0 |
| 6-Person Families | 123 (4.1%) | $0 |
| 7+ Person Families | 0 (0.0%) | $0 |
| Total | 3,035 (100.0%) | $75,920 |
Family Income by Number of Earners in Belvedere Park
The median family income in Belvedere Park is $75,920, with families comprising 2 earners (1,493) having the highest median family income of $105,647, while families with no earners (391) have the lowest median family income of $31,580, accounting for 49.2% and 12.9% of families, respectively.
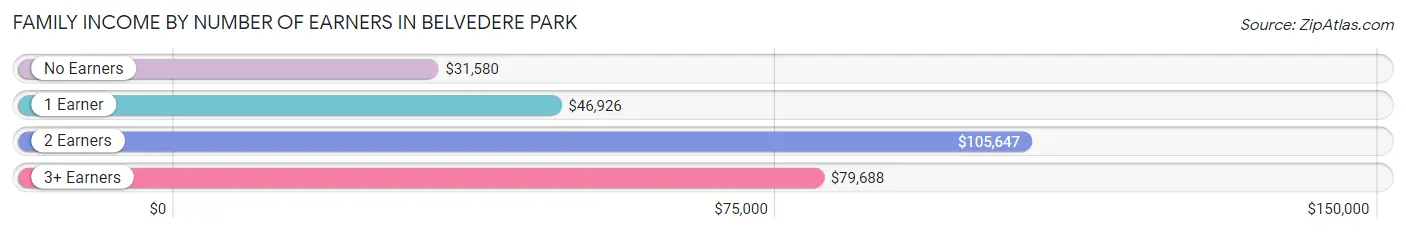
| Number of Earners | # Families | Median Income |
| No Earners | 391 (12.9%) | $31,580 |
| 1 Earner | 1,013 (33.4%) | $46,926 |
| 2 Earners | 1,493 (49.2%) | $105,647 |
| 3+ Earners | 138 (4.5%) | $79,688 |
| Total | 3,035 (100.0%) | $75,920 |
Household Income in Belvedere Park
Household Income Brackets in Belvedere Park
With 1,016 households falling in the category, the $100,000 to $149,999 income range is the most frequent in Belvedere Park, accounting for 18.4% of all households. In contrast, only 221 households (4.0%) fall into the $10,000 to $14,999 income bracket, making it the least populous group.
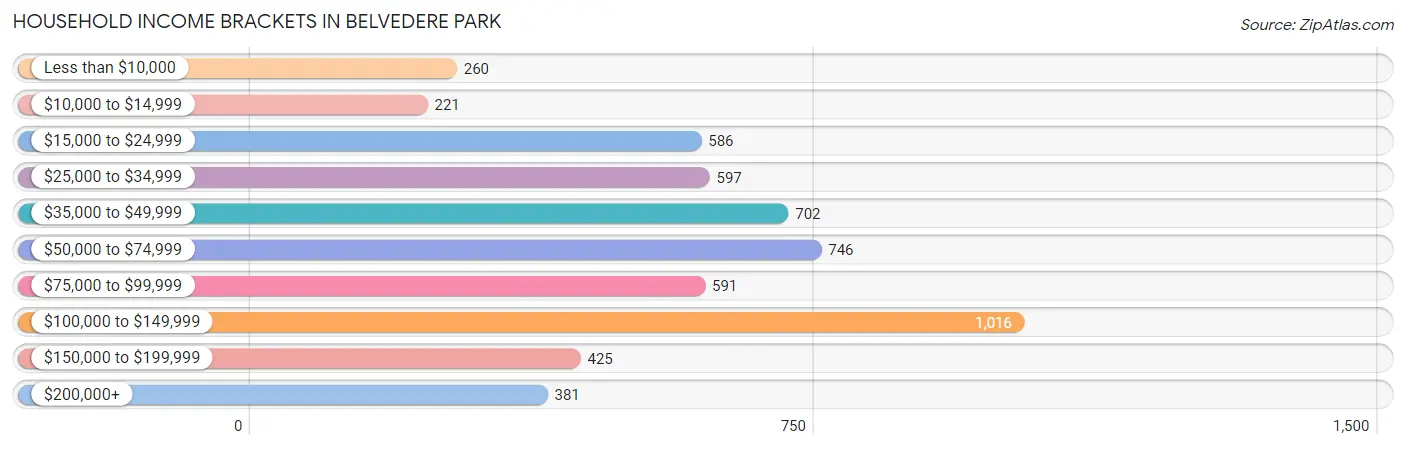
| Income Bracket | # Households | % Households |
| Less than $10,000 | 260 | 4.7% |
| $10,000 to $14,999 | 221 | 4.0% |
| $15,000 to $24,999 | 586 | 10.6% |
| $25,000 to $34,999 | 597 | 10.8% |
| $35,000 to $49,999 | 702 | 12.7% |
| $50,000 to $74,999 | 746 | 13.5% |
| $75,000 to $99,999 | 591 | 10.7% |
| $100,000 to $149,999 | 1,016 | 18.4% |
| $150,000 to $199,999 | 425 | 7.7% |
| $200,000+ | 381 | 6.9% |
Household Income by Householder Age in Belvedere Park
The median household income in Belvedere Park is $66,881, with the highest median household income of $100,492 found in the 25 to 44 years age bracket for the primary householder. A total of 2,206 households (39.9%) fall into this category. Meanwhile, the 65+ years age bracket for the primary householder has the lowest median household income of $43,801, with 1,416 households (25.6%) in this group.
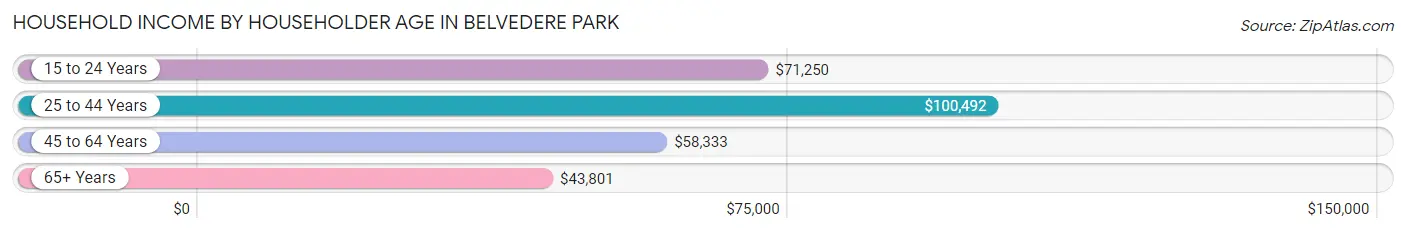
| Income Bracket | # Households | Median Income |
| 15 to 24 Years | 36 (0.6%) | $71,250 |
| 25 to 44 Years | 2,206 (39.9%) | $100,492 |
| 45 to 64 Years | 1,866 (33.8%) | $58,333 |
| 65+ Years | 1,416 (25.6%) | $43,801 |
| Total | 5,524 (100.0%) | $66,881 |
Poverty in Belvedere Park
Income Below Poverty by Sex and Age in Belvedere Park
With 11.8% poverty level for males and 17.3% for females among the residents of Belvedere Park, 12 to 14 year old males and 16 and 17 year old females are the most vulnerable to poverty, with 77 males (32.9%) and 45 females (57.0%) in their respective age groups living below the poverty level.
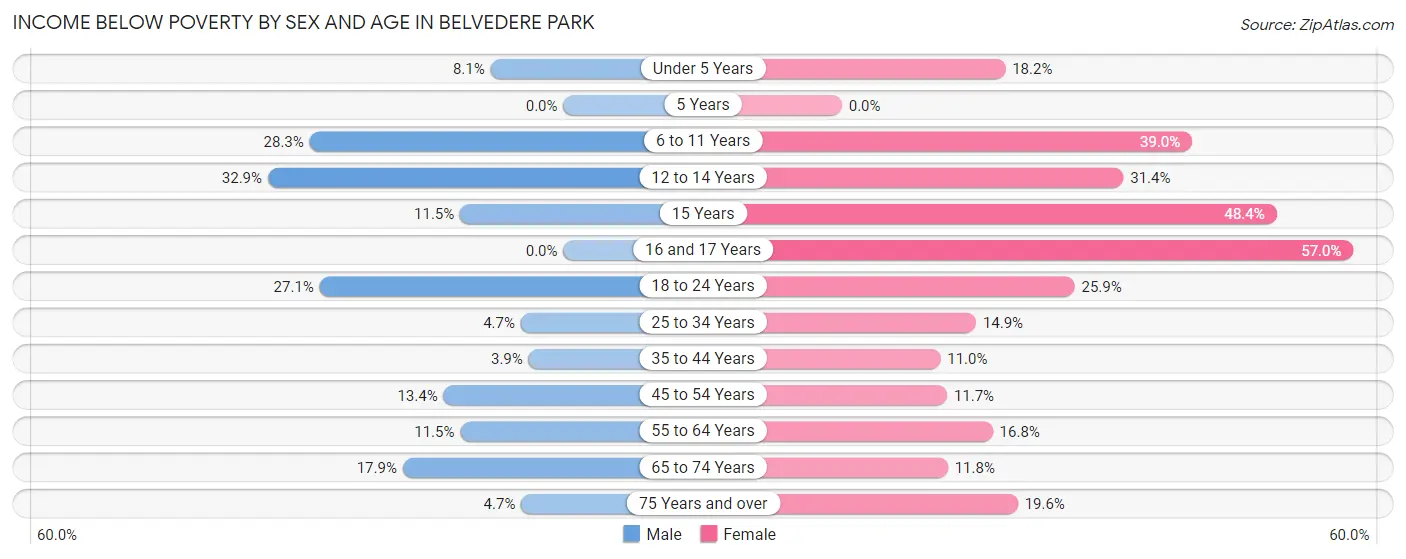
| Age Bracket | Male | Female |
| Under 5 Years | 45 (8.1%) | 97 (18.2%) |
| 5 Years | 0 (0.0%) | 0 (0.0%) |
| 6 to 11 Years | 154 (28.3%) | 126 (39.0%) |
| 12 to 14 Years | 77 (32.9%) | 58 (31.4%) |
| 15 Years | 13 (11.5%) | 61 (48.4%) |
| 16 and 17 Years | 0 (0.0%) | 45 (57.0%) |
| 18 to 24 Years | 92 (27.1%) | 92 (25.9%) |
| 25 to 34 Years | 75 (4.7%) | 223 (14.9%) |
| 35 to 44 Years | 34 (3.9%) | 119 (11.0%) |
| 45 to 54 Years | 142 (13.4%) | 119 (11.7%) |
| 55 to 64 Years | 86 (11.5%) | 162 (16.8%) |
| 65 to 74 Years | 85 (17.9%) | 101 (11.8%) |
| 75 Years and over | 10 (4.7%) | 123 (19.6%) |
| Total | 813 (11.8%) | 1,326 (17.3%) |
Income Above Poverty by Sex and Age in Belvedere Park
According to the poverty statistics in Belvedere Park, males aged 5 years and females aged 5 years are the age groups that are most secure financially, with 100.0% of males and 100.0% of females in these age groups living above the poverty line.
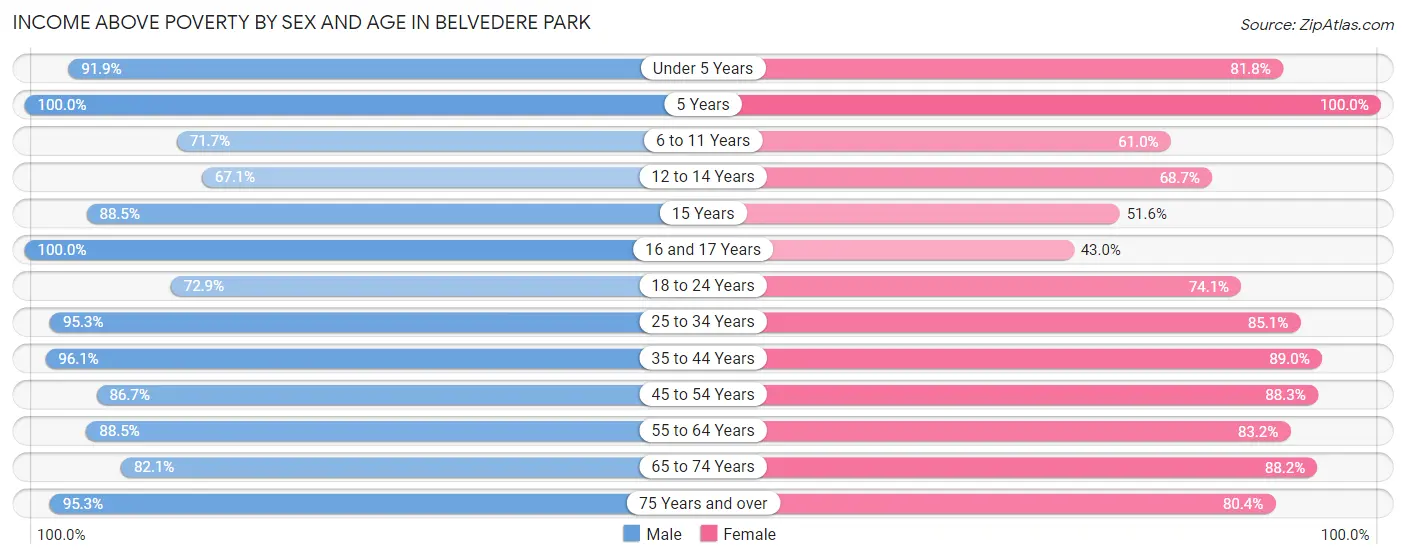
| Age Bracket | Male | Female |
| Under 5 Years | 510 (91.9%) | 436 (81.8%) |
| 5 Years | 62 (100.0%) | 8 (100.0%) |
| 6 to 11 Years | 391 (71.7%) | 197 (61.0%) |
| 12 to 14 Years | 157 (67.1%) | 127 (68.6%) |
| 15 Years | 100 (88.5%) | 65 (51.6%) |
| 16 and 17 Years | 67 (100.0%) | 34 (43.0%) |
| 18 to 24 Years | 247 (72.9%) | 263 (74.1%) |
| 25 to 34 Years | 1,507 (95.3%) | 1,270 (85.1%) |
| 35 to 44 Years | 844 (96.1%) | 966 (89.0%) |
| 45 to 54 Years | 922 (86.7%) | 897 (88.3%) |
| 55 to 64 Years | 663 (88.5%) | 802 (83.2%) |
| 65 to 74 Years | 390 (82.1%) | 755 (88.2%) |
| 75 Years and over | 203 (95.3%) | 505 (80.4%) |
| Total | 6,063 (88.2%) | 6,325 (82.7%) |
Income Below Poverty Among Married-Couple Families in Belvedere Park
The poverty statistics for married-couple families in Belvedere Park show that 3.8% or 64 of the total 1,667 families live below the poverty line. Families with 3 or 4 children have the highest poverty rate of 53.8%, comprising of 35 families. On the other hand, families with 1 or 2 children have the lowest poverty rate of 1.4%, which includes 8 families.
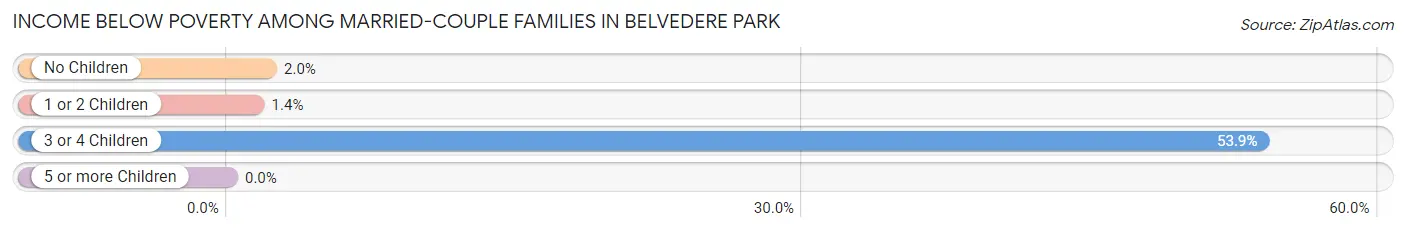
| Children | Above Poverty | Below Poverty |
| No Children | 1,007 (98.0%) | 21 (2.0%) |
| 1 or 2 Children | 566 (98.6%) | 8 (1.4%) |
| 3 or 4 Children | 30 (46.2%) | 35 (53.8%) |
| 5 or more Children | 0 (0.0%) | 0 (0.0%) |
| Total | 1,603 (96.2%) | 64 (3.8%) |
Income Below Poverty Among Single-Parent Households in Belvedere Park
According to the poverty data in Belvedere Park, 21.2% or 53 single-father households and 15.7% or 176 single-mother households are living below the poverty line. Among single-father households, those with 1 or 2 children have the highest poverty rate, with 23 households (30.7%) experiencing poverty. Likewise, among single-mother households, those with 3 or 4 children have the highest poverty rate, with 68 households (51.9%) falling below the poverty line.
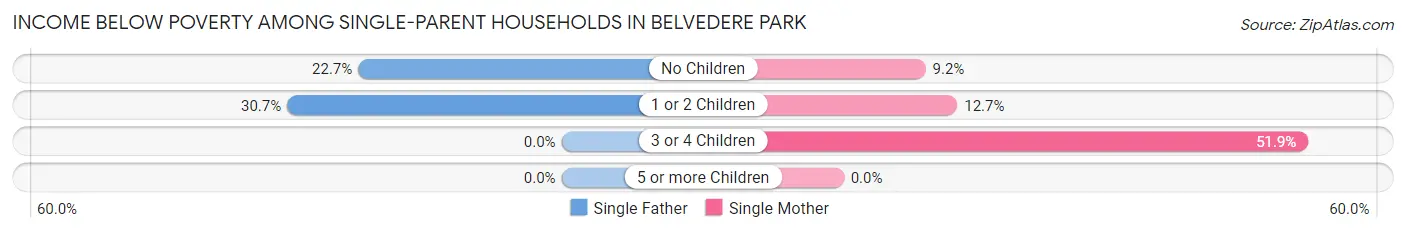
| Children | Single Father | Single Mother |
| No Children | 30 (22.7%) | 45 (9.2%) |
| 1 or 2 Children | 23 (30.7%) | 63 (12.7%) |
| 3 or 4 Children | 0 (0.0%) | 68 (51.9%) |
| 5 or more Children | 0 (0.0%) | 0 (0.0%) |
| Total | 53 (21.2%) | 176 (15.7%) |
Income Below Poverty Among Married-Couple vs Single-Parent Households in Belvedere Park
The poverty data for Belvedere Park shows that 64 of the married-couple family households (3.8%) and 229 of the single-parent households (16.7%) are living below the poverty level. Within the married-couple family households, those with 3 or 4 children have the highest poverty rate, with 35 households (53.8%) falling below the poverty line. Among the single-parent households, those with 3 or 4 children have the highest poverty rate, with 68 household (39.1%) living below poverty.
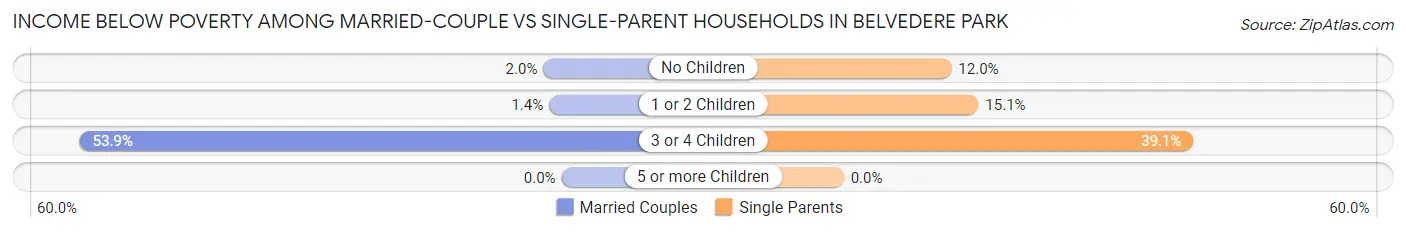
| Children | Married-Couple Families | Single-Parent Households |
| No Children | 21 (2.0%) | 75 (12.0%) |
| 1 or 2 Children | 8 (1.4%) | 86 (15.1%) |
| 3 or 4 Children | 35 (53.8%) | 68 (39.1%) |
| 5 or more Children | 0 (0.0%) | 0 (0.0%) |
| Total | 64 (3.8%) | 229 (16.7%) |
Race in Belvedere Park
The most populous races in Belvedere Park are Black / African American (9,347 | 64.2%), White / Caucasian (4,096 | 28.1%), and Two or more Races (561 | 3.8%).
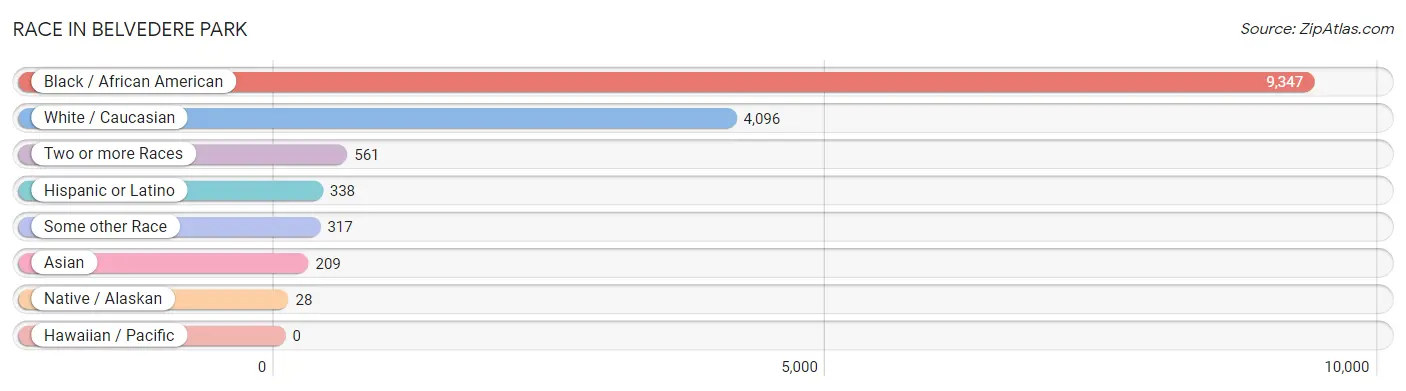
| Race | # Population | % Population |
| Asian | 209 | 1.4% |
| Black / African American | 9,347 | 64.2% |
| Hawaiian / Pacific | 0 | 0.0% |
| Hispanic or Latino | 338 | 2.3% |
| Native / Alaskan | 28 | 0.2% |
| White / Caucasian | 4,096 | 28.1% |
| Two or more Races | 561 | 3.8% |
| Some other Race | 317 | 2.2% |
| Total | 14,558 | 100.0% |
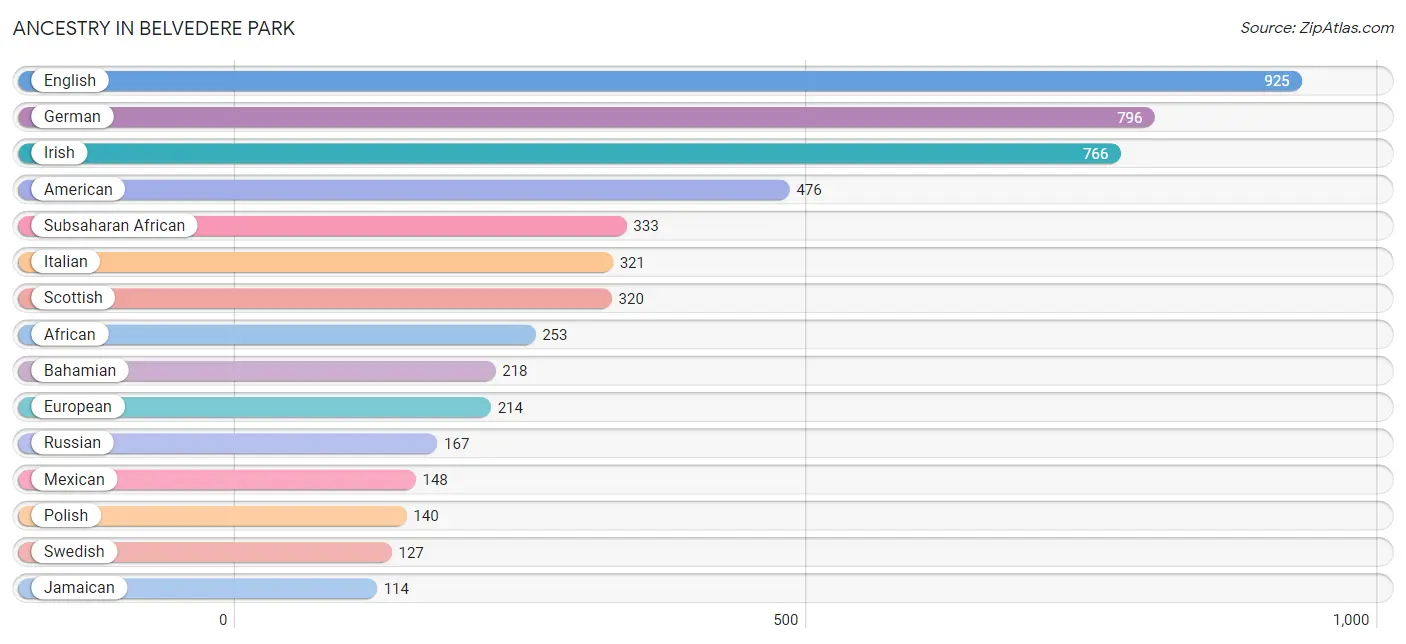
Ancestry in Belvedere Park
The most populous ancestries reported in Belvedere Park are English (925 | 6.4%), German (796 | 5.5%), Irish (766 | 5.3%), American (476 | 3.3%), and Subsaharan African (333 | 2.3%), together accounting for 22.6% of all Belvedere Park residents.
| Ancestry | # Population | % Population |
| African | 253 | 1.7% |
| American | 476 | 3.3% |
| Bahamian | 218 | 1.5% |
| Barbadian | 47 | 0.3% |
| Brazilian | 7 | 0.1% |
| British | 65 | 0.4% |
| British West Indian | 29 | 0.2% |
| Burmese | 64 | 0.4% |
| Central American | 45 | 0.3% |
| Cherokee | 24 | 0.2% |
| Colombian | 32 | 0.2% |
| Costa Rican | 29 | 0.2% |
| Croatian | 15 | 0.1% |
| Cuban | 32 | 0.2% |
| Dutch | 57 | 0.4% |
| Eastern European | 25 | 0.2% |
| English | 925 | 6.4% |
| Ethiopian | 24 | 0.2% |
| European | 214 | 1.5% |
| Finnish | 17 | 0.1% |
| French | 94 | 0.6% |
| French Canadian | 27 | 0.2% |
| German | 796 | 5.5% |
| Ghanaian | 11 | 0.1% |
| Greek | 5 | 0.0% |
| Guyanese | 19 | 0.1% |
| Haitian | 71 | 0.5% |
| Hungarian | 22 | 0.2% |
| Icelander | 3 | 0.0% |
| Indian (Asian) | 12 | 0.1% |
| Indonesian | 33 | 0.2% |
| Irish | 766 | 5.3% |
| Italian | 321 | 2.2% |
| Jamaican | 114 | 0.8% |
| Korean | 57 | 0.4% |
| Lithuanian | 8 | 0.1% |
| Mexican | 148 | 1.0% |
| Nicaraguan | 10 | 0.1% |
| Northern European | 9 | 0.1% |
| Norwegian | 42 | 0.3% |
| Peruvian | 14 | 0.1% |
| Polish | 140 | 1.0% |
| Portuguese | 29 | 0.2% |
| Puerto Rican | 49 | 0.3% |
| Romanian | 15 | 0.1% |
| Russian | 167 | 1.1% |
| Salvadoran | 6 | 0.0% |
| Scotch-Irish | 73 | 0.5% |
| Scottish | 320 | 2.2% |
| Sierra Leonean | 23 | 0.2% |
| South American | 59 | 0.4% |
| Subsaharan African | 333 | 2.3% |
| Swedish | 127 | 0.9% |
| Swiss | 40 | 0.3% |
| Thai | 107 | 0.7% |
| Trinidadian and Tobagonian | 17 | 0.1% |
| Turkish | 10 | 0.1% |
| Uruguayan | 13 | 0.1% |
| Welsh | 70 | 0.5% |
| West Indian | 44 | 0.3% | View All 60 Rows |
Immigrants in Belvedere Park
The most numerous immigrant groups reported in Belvedere Park came from Latin America (690 | 4.7%), Caribbean (428 | 2.9%), Bahamas (218 | 1.5%), Africa (137 | 0.9%), and South America (135 | 0.9%), together accounting for 11.1% of all Belvedere Park residents.
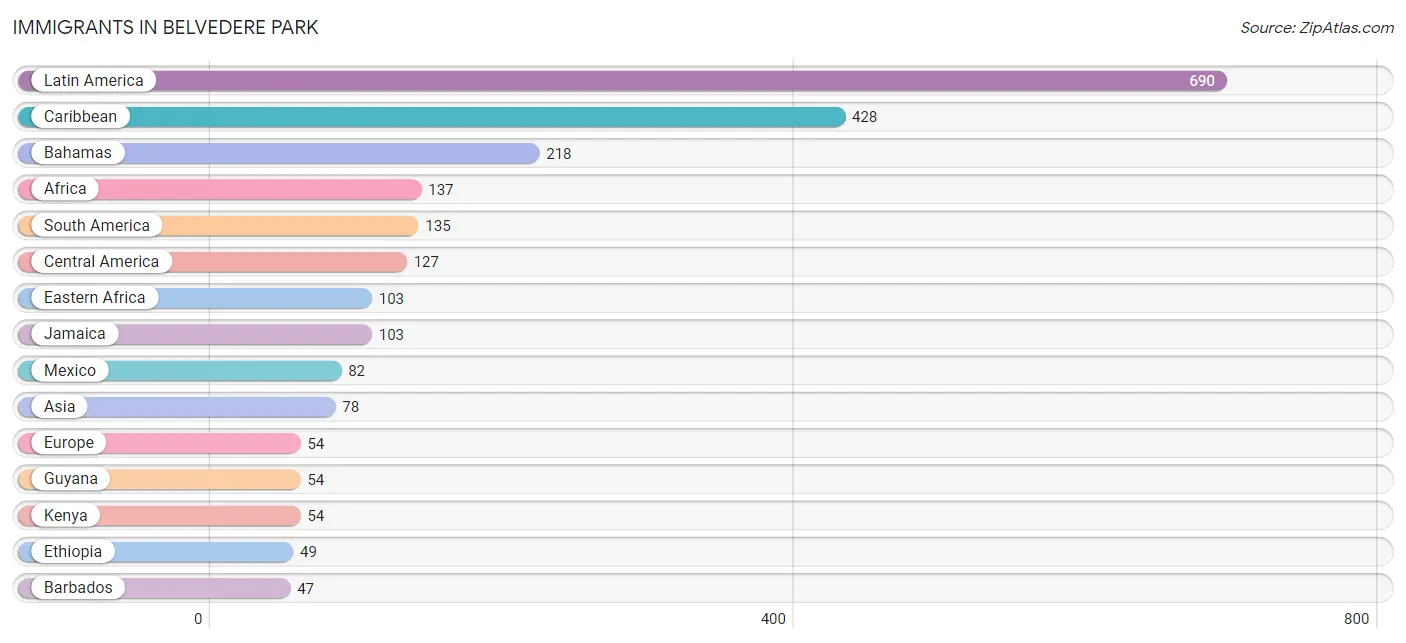
| Immigration Origin | # Population | % Population |
| Africa | 137 | 0.9% |
| Asia | 78 | 0.5% |
| Bahamas | 218 | 1.5% |
| Barbados | 47 | 0.3% |
| Brazil | 10 | 0.1% |
| Canada | 14 | 0.1% |
| Caribbean | 428 | 2.9% |
| Central America | 127 | 0.9% |
| China | 12 | 0.1% |
| Colombia | 32 | 0.2% |
| Costa Rica | 29 | 0.2% |
| Eastern Africa | 103 | 0.7% |
| Eastern Asia | 32 | 0.2% |
| Eastern Europe | 37 | 0.3% |
| El Salvador | 6 | 0.0% |
| Ethiopia | 49 | 0.3% |
| Europe | 54 | 0.4% |
| Germany | 7 | 0.1% |
| Ghana | 11 | 0.1% |
| Guyana | 54 | 0.4% |
| India | 24 | 0.2% |
| Italy | 10 | 0.1% |
| Jamaica | 103 | 0.7% |
| Kenya | 54 | 0.4% |
| Korea | 20 | 0.1% |
| Latin America | 690 | 4.7% |
| Mexico | 82 | 0.6% |
| Nicaragua | 10 | 0.1% |
| Peru | 14 | 0.1% |
| Poland | 27 | 0.2% |
| Russia | 10 | 0.1% |
| Sierra Leone | 23 | 0.2% |
| South America | 135 | 0.9% |
| South Central Asia | 24 | 0.2% |
| South Eastern Asia | 22 | 0.2% |
| Southern Europe | 10 | 0.1% |
| St. Vincent and the Grenadines | 29 | 0.2% |
| Trinidad and Tobago | 17 | 0.1% |
| Uruguay | 13 | 0.1% |
| West Indies | 14 | 0.1% |
| Western Africa | 34 | 0.2% |
| Western Europe | 7 | 0.1% | View All 42 Rows |
Sex and Age in Belvedere Park
Sex and Age in Belvedere Park
The most populous age groups in Belvedere Park are 30 to 34 Years (829 | 12.0%) for men and 30 to 34 Years (917 | 12.0%) for women.
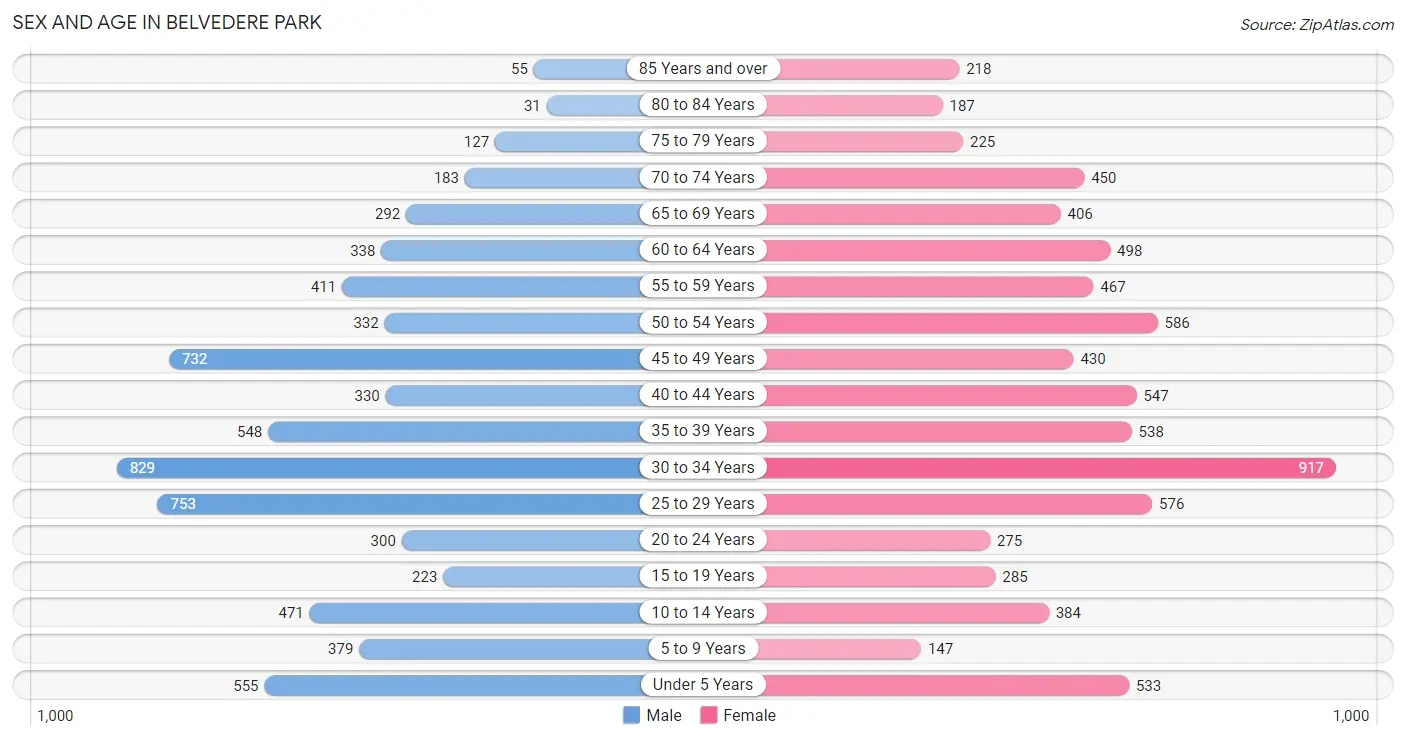
| Age Bracket | Male | Female |
| Under 5 Years | 555 (8.1%) | 533 (7.0%) |
| 5 to 9 Years | 379 (5.5%) | 147 (1.9%) |
| 10 to 14 Years | 471 (6.8%) | 384 (5.0%) |
| 15 to 19 Years | 223 (3.2%) | 285 (3.7%) |
| 20 to 24 Years | 300 (4.3%) | 275 (3.6%) |
| 25 to 29 Years | 753 (10.9%) | 576 (7.5%) |
| 30 to 34 Years | 829 (12.0%) | 917 (12.0%) |
| 35 to 39 Years | 548 (8.0%) | 538 (7.0%) |
| 40 to 44 Years | 330 (4.8%) | 547 (7.1%) |
| 45 to 49 Years | 732 (10.6%) | 430 (5.6%) |
| 50 to 54 Years | 332 (4.8%) | 586 (7.6%) |
| 55 to 59 Years | 411 (6.0%) | 467 (6.1%) |
| 60 to 64 Years | 338 (4.9%) | 498 (6.5%) |
| 65 to 69 Years | 292 (4.2%) | 406 (5.3%) |
| 70 to 74 Years | 183 (2.7%) | 450 (5.9%) |
| 75 to 79 Years | 127 (1.8%) | 225 (2.9%) |
| 80 to 84 Years | 31 (0.4%) | 187 (2.4%) |
| 85 Years and over | 55 (0.8%) | 218 (2.8%) |
| Total | 6,889 (100.0%) | 7,669 (100.0%) |
Families and Households in Belvedere Park
Median Family Size in Belvedere Park
The median family size in Belvedere Park is 3.43 persons per family, with single female/mother families (1,118 | 36.8%) accounting for the largest median family size of 3.98 persons per family. On the other hand, married-couple families (1,667 | 54.9%) represent the smallest median family size with 3.08 persons per family.
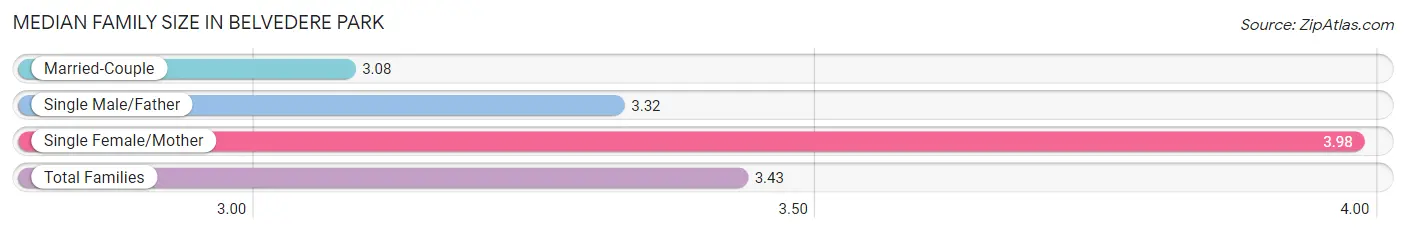
| Family Type | # Families | Family Size |
| Married-Couple | 1,667 (54.9%) | 3.08 |
| Single Male/Father | 250 (8.2%) | 3.32 |
| Single Female/Mother | 1,118 (36.8%) | 3.98 |
| Total Families | 3,035 (100.0%) | 3.43 |
Median Household Size in Belvedere Park
The median household size in Belvedere Park is 2.62 persons per household, with single female/mother households (1,118 | 20.2%) accounting for the largest median household size of 4.17 persons per household. non-family households (2,489 | 45.1%) represent the smallest median household size with 1.51 persons per household.
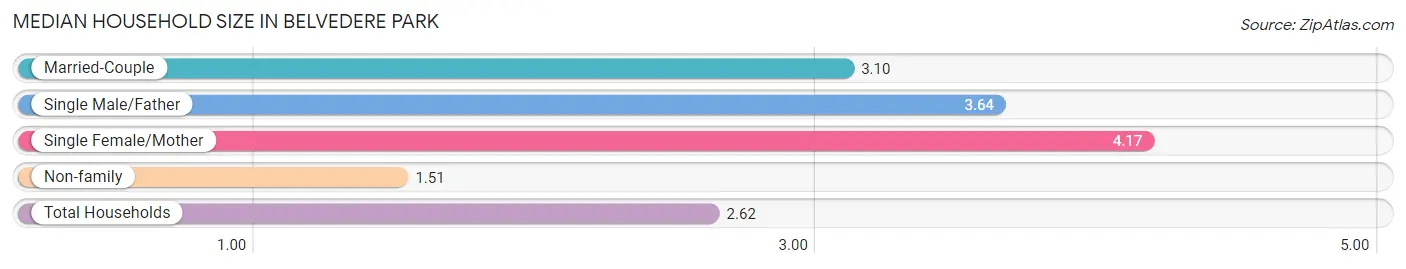
| Household Type | # Households | Household Size |
| Married-Couple | 1,667 (30.2%) | 3.10 |
| Single Male/Father | 250 (4.5%) | 3.64 |
| Single Female/Mother | 1,118 (20.2%) | 4.17 |
| Non-family | 2,489 (45.1%) | 1.51 |
| Total Households | 5,524 (100.0%) | 2.62 |
Household Size by Marriage Status in Belvedere Park
Out of a total of 5,524 households in Belvedere Park, 3,035 (54.9%) are family households, while 2,489 (45.1%) are nonfamily households. The most numerous type of family households are 2-person households, comprising 1,206, and the most common type of nonfamily households are 1-person households, comprising 1,741.
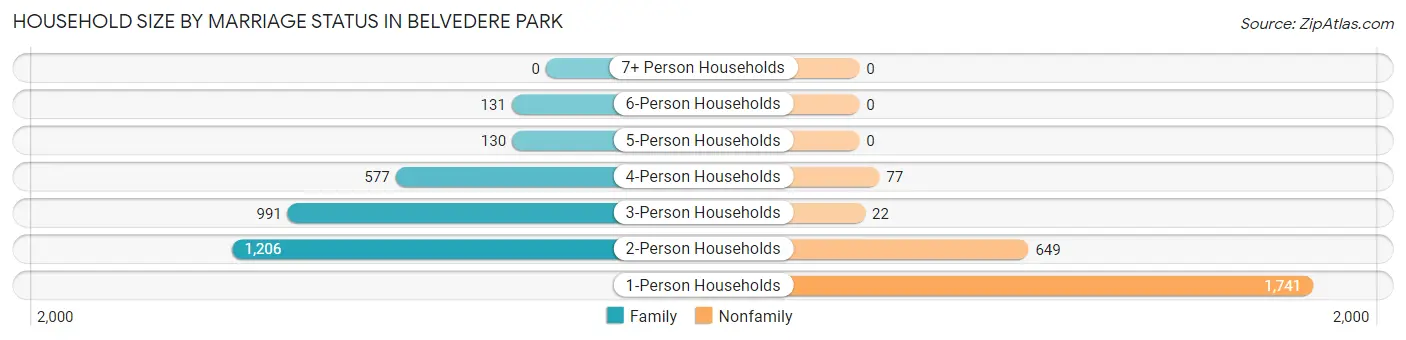
| Household Size | Family Households | Nonfamily Households |
| 1-Person Households | - | 1,741 (31.5%) |
| 2-Person Households | 1,206 (21.8%) | 649 (11.7%) |
| 3-Person Households | 991 (17.9%) | 22 (0.4%) |
| 4-Person Households | 577 (10.4%) | 77 (1.4%) |
| 5-Person Households | 130 (2.4%) | 0 (0.0%) |
| 6-Person Households | 131 (2.4%) | 0 (0.0%) |
| 7+ Person Households | 0 (0.0%) | 0 (0.0%) |
| Total | 3,035 (54.9%) | 2,489 (45.1%) |
Female Fertility in Belvedere Park
Fertility by Age in Belvedere Park
Average fertility rate in Belvedere Park is 70.0 births per 1,000 women. Women in the age bracket of 20 to 34 years have the highest fertility rate with 120.0 births per 1,000 women. Women in the age bracket of 20 to 34 years acount for 80.9% of all women with births.
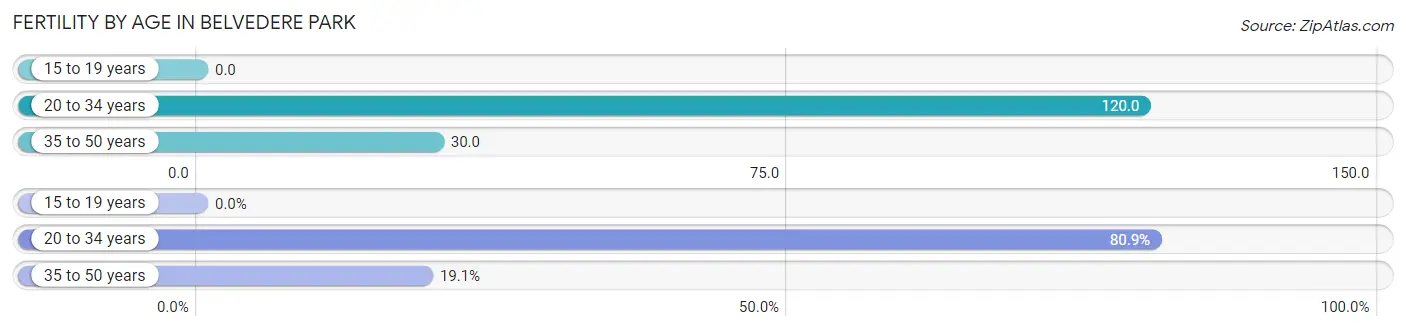
| Age Bracket | Women with Births | Births / 1,000 Women |
| 15 to 19 years | 0 (0.0%) | 0.0 |
| 20 to 34 years | 212 (80.9%) | 120.0 |
| 35 to 50 years | 50 (19.1%) | 30.0 |
| Total | 262 (100.0%) | 70.0 |
Fertility by Age by Marriage Status in Belvedere Park
52.7% of women with births (262) in Belvedere Park are married. The highest percentage of unmarried women with births falls into 20 to 34 years age bracket with 52.8% of them unmarried at the time of birth, while the lowest percentage of unmarried women with births belong to 35 to 50 years age bracket with 24.0% of them unmarried.
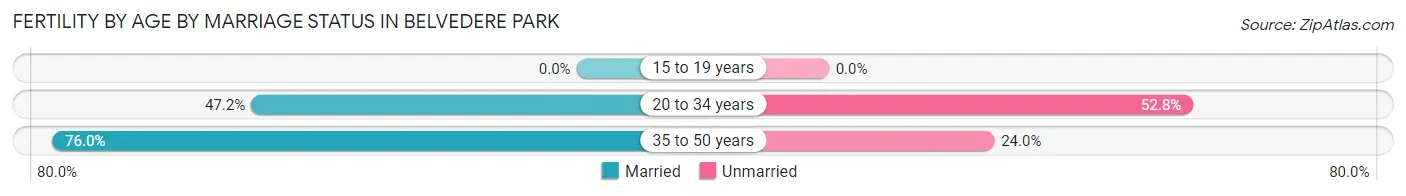
| Age Bracket | Married | Unmarried |
| 15 to 19 years | 0 (0.0%) | 0 (0.0%) |
| 20 to 34 years | 100 (47.2%) | 112 (52.8%) |
| 35 to 50 years | 38 (76.0%) | 12 (24.0%) |
| Total | 138 (52.7%) | 124 (47.3%) |
Fertility by Education in Belvedere Park
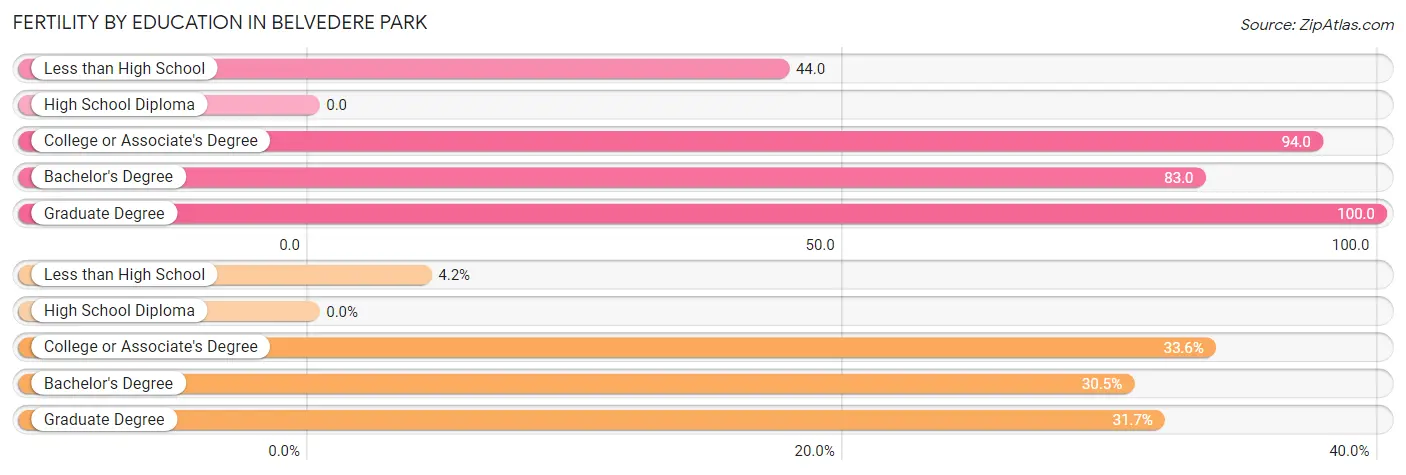
| Educational Attainment | Women with Births | Births / 1,000 Women |
| Less than High School | 11 (4.2%) | 44.0 |
| High School Diploma | 0 (0.0%) | 0.0 |
| College or Associate's Degree | 88 (33.6%) | 94.0 |
| Bachelor's Degree | 80 (30.5%) | 83.0 |
| Graduate Degree | 83 (31.7%) | 100.0 |
| Total | 262 (100.0%) | 70.0 |
Fertility by Education by Marriage Status in Belvedere Park
47.3% of women with births in Belvedere Park are unmarried. Women with the educational attainment of less than high school are most likely to be married with 100.0% of them married at childbirth, while women with the educational attainment of college or associate's degree are least likely to be married with 92.0% of them unmarried at childbirth.
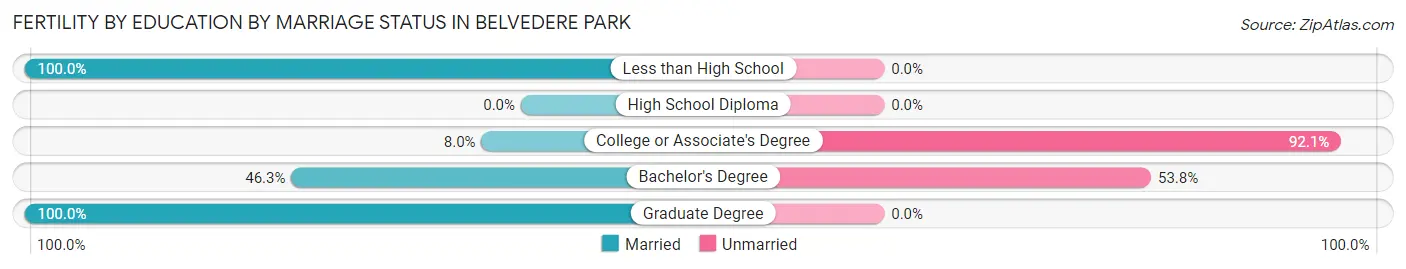
| Educational Attainment | Married | Unmarried |
| Less than High School | 11 (100.0%) | 0 (0.0%) |
| High School Diploma | 0 (0.0%) | 0 (0.0%) |
| College or Associate's Degree | 7 (8.0%) | 81 (92.0%) |
| Bachelor's Degree | 37 (46.3%) | 43 (53.7%) |
| Graduate Degree | 83 (100.0%) | 0 (0.0%) |
| Total | 138 (52.7%) | 124 (47.3%) |
Employment Characteristics in Belvedere Park
Employment by Class of Employer in Belvedere Park
Among the 7,324 employed individuals in Belvedere Park, private company employees (4,853 | 66.3%), not-for-profit organizations (692 | 9.5%), and self-employed (not incorporated) (521 | 7.1%) make up the most common classes of employment.
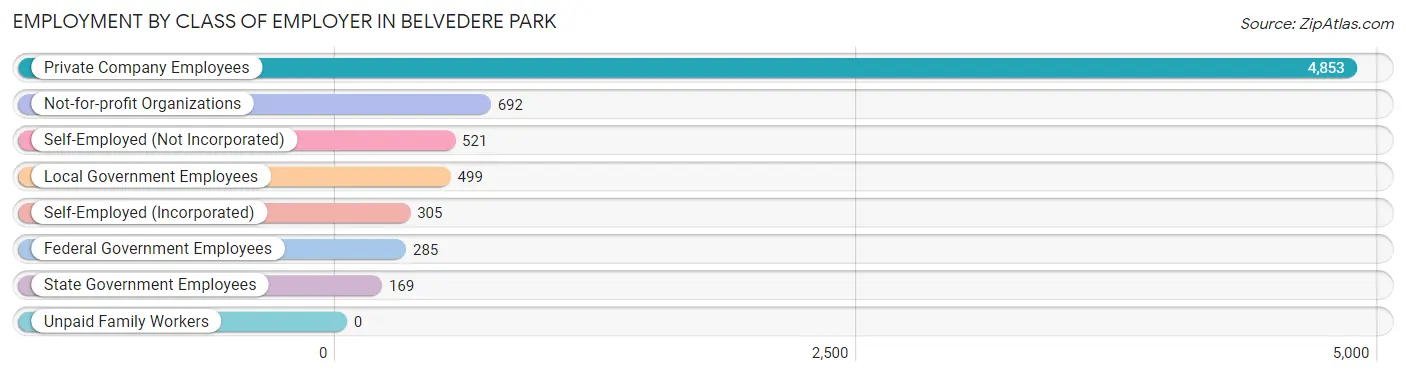
| Employer Class | # Employees | % Employees |
| Private Company Employees | 4,853 | 66.3% |
| Self-Employed (Incorporated) | 305 | 4.2% |
| Self-Employed (Not Incorporated) | 521 | 7.1% |
| Not-for-profit Organizations | 692 | 9.5% |
| Local Government Employees | 499 | 6.8% |
| State Government Employees | 169 | 2.3% |
| Federal Government Employees | 285 | 3.9% |
| Unpaid Family Workers | 0 | 0.0% |
| Total | 7,324 | 100.0% |
Employment Status by Age in Belvedere Park
According to the labor force statistics for Belvedere Park, out of the total population over 16 years of age (11,850), 69.0% or 8,176 individuals are in the labor force, with 7.7% or 630 of them unemployed. The age group with the highest labor force participation rate is 35 to 44 years, with 92.2% or 1,810 individuals in the labor force. Within the labor force, the 16 to 19 years age range has the highest percentage of unemployed individuals, with 37.1% or 39 of them being unemployed.
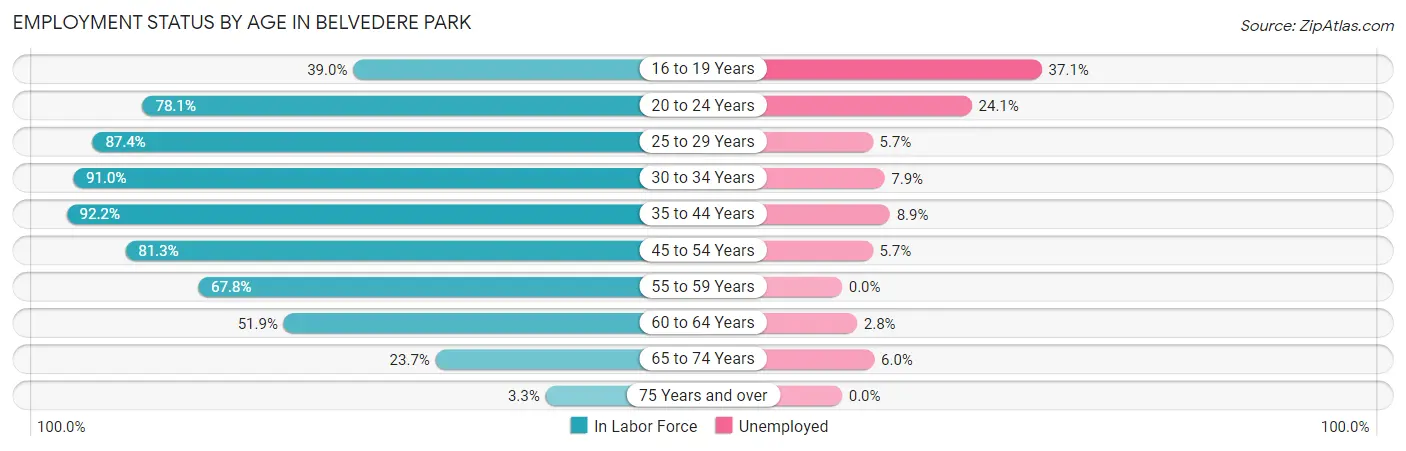
| Age Bracket | In Labor Force | Unemployed |
| 16 to 19 Years | 105 (39.0%) | 39 (37.1%) |
| 20 to 24 Years | 449 (78.1%) | 108 (24.1%) |
| 25 to 29 Years | 1,162 (87.4%) | 66 (5.7%) |
| 30 to 34 Years | 1,589 (91.0%) | 126 (7.9%) |
| 35 to 44 Years | 1,810 (92.2%) | 161 (8.9%) |
| 45 to 54 Years | 1,691 (81.3%) | 96 (5.7%) |
| 55 to 59 Years | 595 (67.8%) | 0 (0.0%) |
| 60 to 64 Years | 434 (51.9%) | 12 (2.8%) |
| 65 to 74 Years | 315 (23.7%) | 19 (6.0%) |
| 75 Years and over | 28 (3.3%) | 0 (0.0%) |
| Total | 8,176 (69.0%) | 630 (7.7%) |
Employment Status by Educational Attainment in Belvedere Park
According to labor force statistics for Belvedere Park, 82.4% of individuals (7,278) out of the total population between 25 and 64 years of age (8,832) are in the labor force, with 6.3% or 459 of them being unemployed. The group with the highest labor force participation rate are those with the educational attainment of bachelor's degree or higher, with 91.8% or 3,402 individuals in the labor force. Within the labor force, individuals with less than high school education have the highest percentage of unemployment, with 10.1% or 14 of them being unemployed.
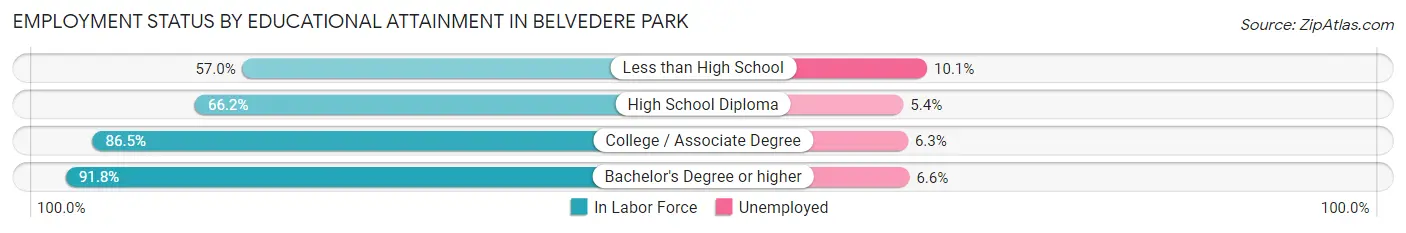
| Educational Attainment | In Labor Force | Unemployed |
| Less than High School | 139 (57.0%) | 25 (10.1%) |
| High School Diploma | 1,580 (66.2%) | 129 (5.4%) |
| College / Associate Degree | 2,158 (86.5%) | 157 (6.3%) |
| Bachelor's Degree or higher | 3,402 (91.8%) | 245 (6.6%) |
| Total | 7,278 (82.4%) | 556 (6.3%) |
Employment Occupations by Sex in Belvedere Park
Management, Business, Science and Arts Occupations
The most common Management, Business, Science and Arts occupations in Belvedere Park are Community & Social Service (1,210 | 16.1%), Business & Financial (647 | 8.6%), Computers, Engineering & Science (618 | 8.2%), Arts, Media & Entertainment (529 | 7.0%), and Management (520 | 6.9%).
Management, Business, Science and Arts Occupations by Sex
Within the Management, Business, Science and Arts occupations in Belvedere Park, the most male-oriented occupations are Architecture & Engineering (90.7%), Computers & Mathematics (85.5%), and Computers, Engineering & Science (74.3%), while the most female-oriented occupations are Education, Arts & Media (91.7%), Education Instruction & Library (75.1%), and Health Diagnosing & Treating (73.1%).
| Occupation | Male | Female |
| Management | 199 (38.3%) | 321 (61.7%) |
| Business & Financial | 290 (44.8%) | 357 (55.2%) |
| Computers, Engineering & Science | 459 (74.3%) | 159 (25.7%) |
| Computers & Mathematics | 329 (85.5%) | 56 (14.5%) |
| Architecture & Engineering | 68 (90.7%) | 7 (9.3%) |
| Life, Physical & Social Science | 62 (39.2%) | 96 (60.8%) |
| Community & Social Service | 487 (40.3%) | 723 (59.8%) |
| Education, Arts & Media | 10 (8.3%) | 111 (91.7%) |
| Legal Services & Support | 25 (38.5%) | 40 (61.5%) |
| Education Instruction & Library | 123 (24.8%) | 372 (75.1%) |
| Arts, Media & Entertainment | 329 (62.2%) | 200 (37.8%) |
| Health Diagnosing & Treating | 89 (26.9%) | 242 (73.1%) |
| Health Technologists | 79 (29.6%) | 188 (70.4%) |
| Total (Category) | 1,524 (45.8%) | 1,802 (54.2%) |
| Total (Overall) | 3,563 (47.3%) | 3,975 (52.7%) |
Services Occupations
The most common Services occupations in Belvedere Park are Food Preparation & Serving (407 | 5.4%), Healthcare Support (305 | 4.1%), Personal Care & Service (305 | 4.1%), Cleaning & Maintenance (297 | 3.9%), and Security & Protection (172 | 2.3%).
Services Occupations by Sex
Within the Services occupations in Belvedere Park, the most male-oriented occupations are Cleaning & Maintenance (79.1%), Food Preparation & Serving (61.4%), and Security & Protection (47.7%), while the most female-oriented occupations are Healthcare Support (88.2%), Personal Care & Service (84.3%), and Security & Protection (52.3%).
| Occupation | Male | Female |
| Healthcare Support | 36 (11.8%) | 269 (88.2%) |
| Security & Protection | 82 (47.7%) | 90 (52.3%) |
| Firefighting & Prevention | 82 (47.7%) | 90 (52.3%) |
| Law Enforcement | 0 (0.0%) | 0 (0.0%) |
| Food Preparation & Serving | 250 (61.4%) | 157 (38.6%) |
| Cleaning & Maintenance | 235 (79.1%) | 62 (20.9%) |
| Personal Care & Service | 48 (15.7%) | 257 (84.3%) |
| Total (Category) | 651 (43.8%) | 835 (56.2%) |
| Total (Overall) | 3,563 (47.3%) | 3,975 (52.7%) |
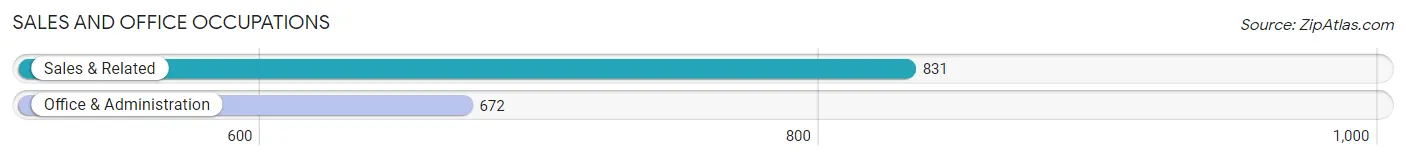
Sales and Office Occupations
The most common Sales and Office occupations in Belvedere Park are Sales & Related (831 | 11.0%), and Office & Administration (672 | 8.9%).
Sales and Office Occupations by Sex
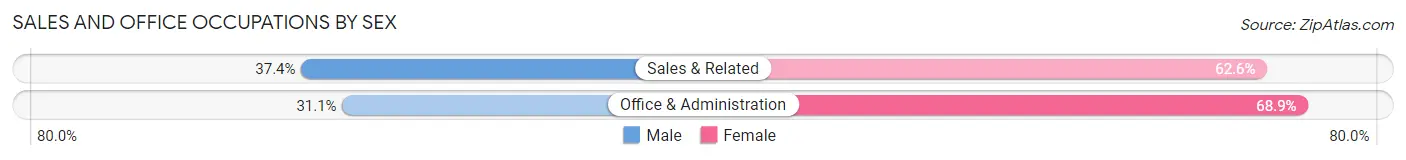
| Occupation | Male | Female |
| Sales & Related | 311 (37.4%) | 520 (62.6%) |
| Office & Administration | 209 (31.1%) | 463 (68.9%) |
| Total (Category) | 520 (34.6%) | 983 (65.4%) |
| Total (Overall) | 3,563 (47.3%) | 3,975 (52.7%) |
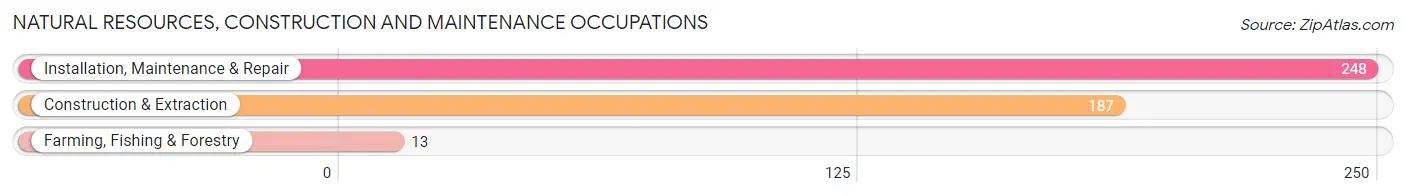
Natural Resources, Construction and Maintenance Occupations
The most common Natural Resources, Construction and Maintenance occupations in Belvedere Park are Installation, Maintenance & Repair (248 | 3.3%), Construction & Extraction (187 | 2.5%), and Farming, Fishing & Forestry (13 | 0.2%).
Natural Resources, Construction and Maintenance Occupations by Sex
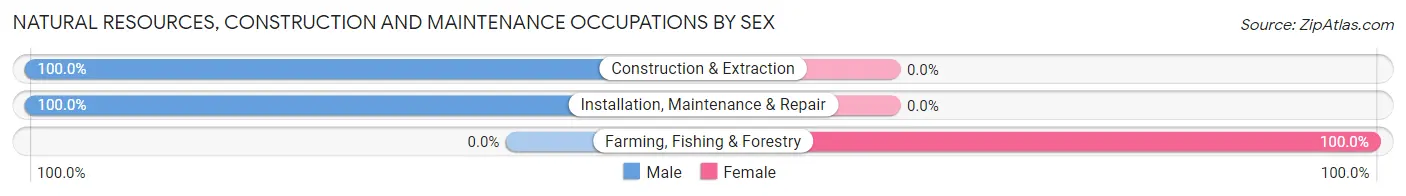
| Occupation | Male | Female |
| Farming, Fishing & Forestry | 0 (0.0%) | 13 (100.0%) |
| Construction & Extraction | 187 (100.0%) | 0 (0.0%) |
| Installation, Maintenance & Repair | 248 (100.0%) | 0 (0.0%) |
| Total (Category) | 435 (97.1%) | 13 (2.9%) |
| Total (Overall) | 3,563 (47.3%) | 3,975 (52.7%) |
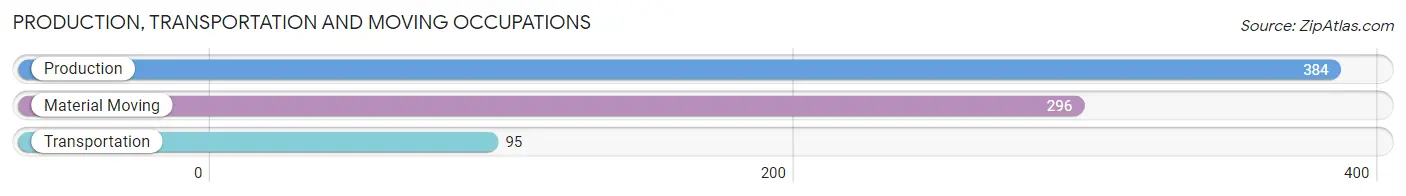
Production, Transportation and Moving Occupations
The most common Production, Transportation and Moving occupations in Belvedere Park are Production (384 | 5.1%), Material Moving (296 | 3.9%), and Transportation (95 | 1.3%).
Production, Transportation and Moving Occupations by Sex
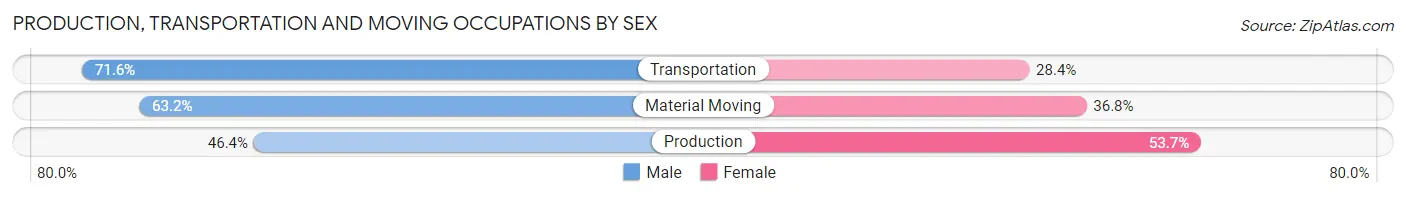
| Occupation | Male | Female |
| Production | 178 (46.4%) | 206 (53.6%) |
| Transportation | 68 (71.6%) | 27 (28.4%) |
| Material Moving | 187 (63.2%) | 109 (36.8%) |
| Total (Category) | 433 (55.9%) | 342 (44.1%) |
| Total (Overall) | 3,563 (47.3%) | 3,975 (52.7%) |
Employment Industries by Sex in Belvedere Park
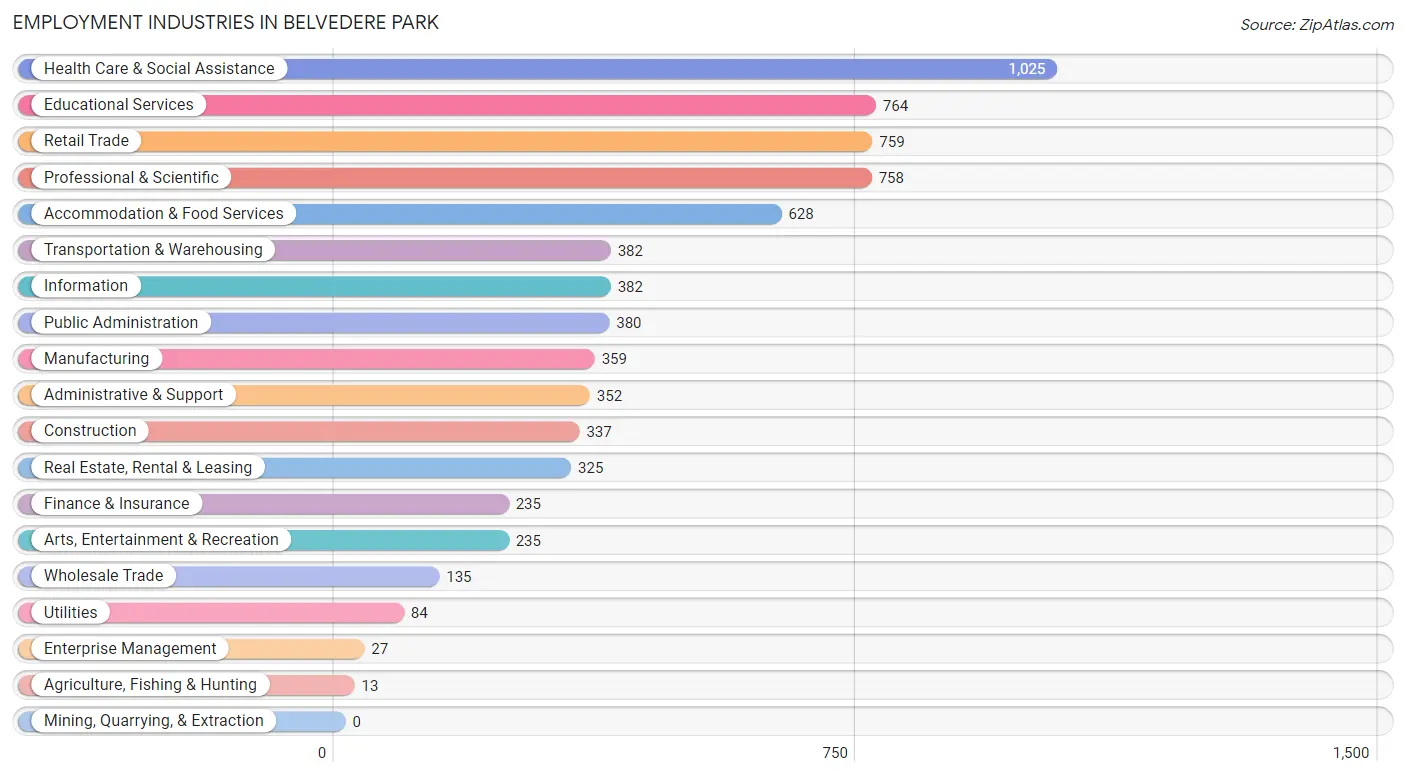
Employment Industries in Belvedere Park
The major employment industries in Belvedere Park include Health Care & Social Assistance (1,025 | 13.6%), Educational Services (764 | 10.1%), Retail Trade (759 | 10.1%), Professional & Scientific (758 | 10.1%), and Accommodation & Food Services (628 | 8.3%).
Employment Industries by Sex in Belvedere Park
The Belvedere Park industries that see more men than women are Utilities (100.0%), Construction (92.3%), and Wholesale Trade (78.5%), whereas the industries that tend to have a higher number of women are Agriculture, Fishing & Hunting (100.0%), Arts, Entertainment & Recreation (73.2%), and Health Care & Social Assistance (69.9%).
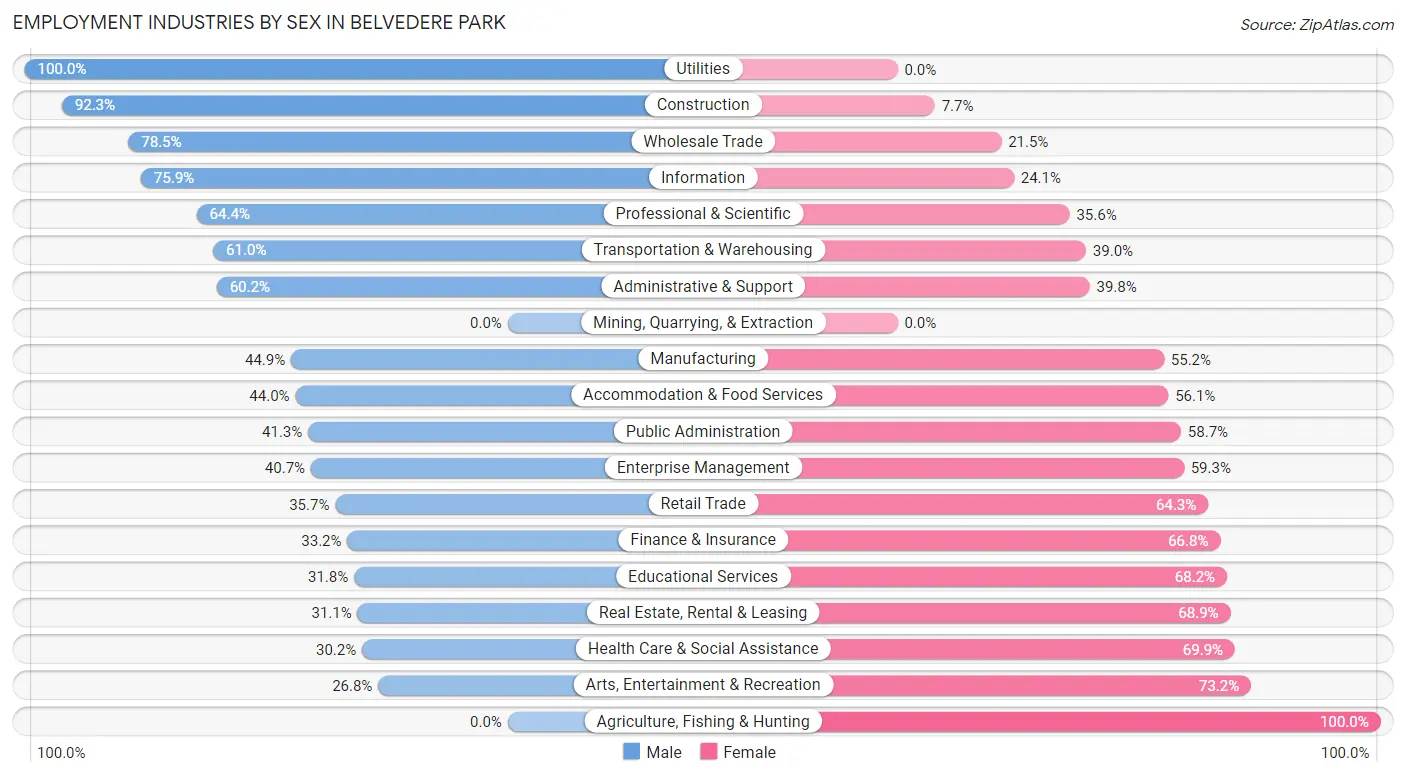
| Industry | Male | Female |
| Agriculture, Fishing & Hunting | 0 (0.0%) | 13 (100.0%) |
| Mining, Quarrying, & Extraction | 0 (0.0%) | 0 (0.0%) |
| Construction | 311 (92.3%) | 26 (7.7%) |
| Manufacturing | 161 (44.9%) | 198 (55.1%) |
| Wholesale Trade | 106 (78.5%) | 29 (21.5%) |
| Retail Trade | 271 (35.7%) | 488 (64.3%) |
| Transportation & Warehousing | 233 (61.0%) | 149 (39.0%) |
| Utilities | 84 (100.0%) | 0 (0.0%) |
| Information | 290 (75.9%) | 92 (24.1%) |
| Finance & Insurance | 78 (33.2%) | 157 (66.8%) |
| Real Estate, Rental & Leasing | 101 (31.1%) | 224 (68.9%) |
| Professional & Scientific | 488 (64.4%) | 270 (35.6%) |
| Enterprise Management | 11 (40.7%) | 16 (59.3%) |
| Administrative & Support | 212 (60.2%) | 140 (39.8%) |
| Educational Services | 243 (31.8%) | 521 (68.2%) |
| Health Care & Social Assistance | 309 (30.1%) | 716 (69.9%) |
| Arts, Entertainment & Recreation | 63 (26.8%) | 172 (73.2%) |
| Accommodation & Food Services | 276 (44.0%) | 352 (56.0%) |
| Public Administration | 157 (41.3%) | 223 (58.7%) |
| Total | 3,563 (47.3%) | 3,975 (52.7%) |
Education in Belvedere Park
School Enrollment in Belvedere Park
The most common levels of schooling among the 2,588 students in Belvedere Park are elementary school (598 | 23.1%), high school (478 | 18.5%), and college / undergraduate (467 | 18.0%).
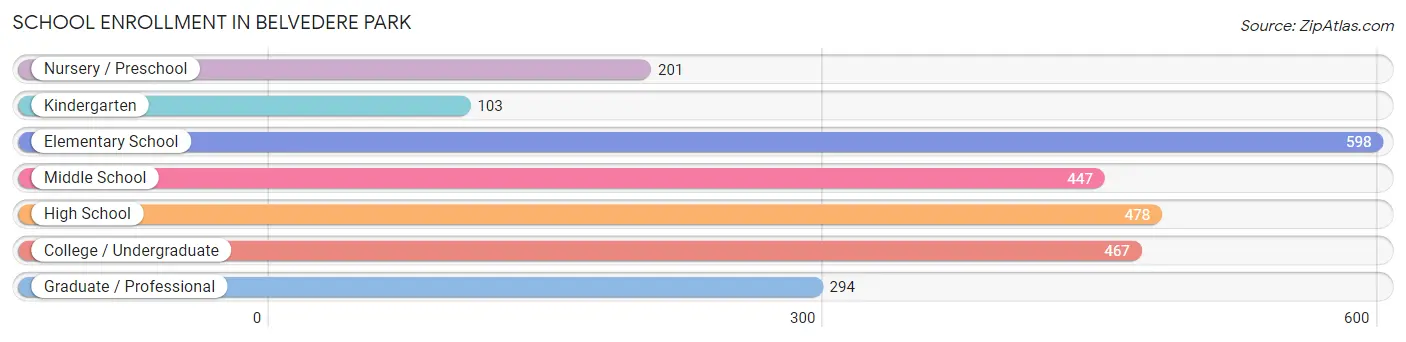
| School Level | # Students | % Students |
| Nursery / Preschool | 201 | 7.8% |
| Kindergarten | 103 | 4.0% |
| Elementary School | 598 | 23.1% |
| Middle School | 447 | 17.3% |
| High School | 478 | 18.5% |
| College / Undergraduate | 467 | 18.0% |
| Graduate / Professional | 294 | 11.4% |
| Total | 2,588 | 100.0% |
School Enrollment by Age by Funding Source in Belvedere Park
Out of a total of 2,588 students who are enrolled in schools in Belvedere Park, 347 (13.4%) attend a private institution, while the remaining 2,241 (86.6%) are enrolled in public schools. The age group of 3 to 4 year olds has the highest likelihood of being enrolled in private schools, with 66 (34.2% in the age bracket) enrolled. Conversely, the age group of 18 to 19 year olds has the lowest likelihood of being enrolled in a private school, with 51 (98.1% in the age bracket) attending a public institution.
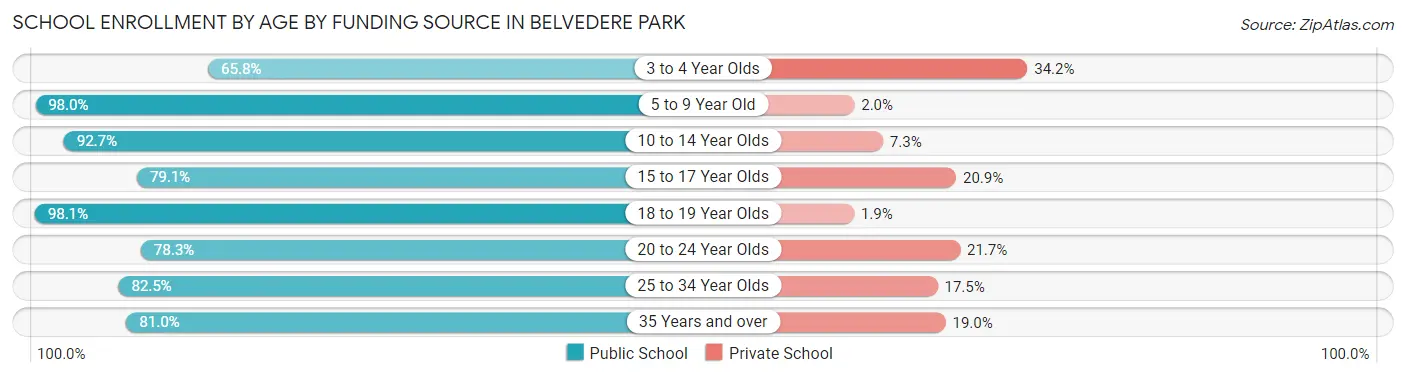
| Age Bracket | Public School | Private School |
| 3 to 4 Year Olds | 127 (65.8%) | 66 (34.2%) |
| 5 to 9 Year Old | 446 (98.0%) | 9 (2.0%) |
| 10 to 14 Year Olds | 723 (92.7%) | 57 (7.3%) |
| 15 to 17 Year Olds | 306 (79.1%) | 81 (20.9%) |
| 18 to 19 Year Olds | 51 (98.1%) | 1 (1.9%) |
| 20 to 24 Year Olds | 94 (78.3%) | 26 (21.7%) |
| 25 to 34 Year Olds | 335 (82.5%) | 71 (17.5%) |
| 35 Years and over | 158 (81.0%) | 37 (19.0%) |
| Total | 2,241 (86.6%) | 347 (13.4%) |
Educational Attainment by Field of Study in Belvedere Park
Business (594 | 13.6%), visual & performing arts (469 | 10.7%), social sciences (413 | 9.5%), bio, nature & agricultural (363 | 8.3%), and psychology (350 | 8.0%) are the most common fields of study among 4,369 individuals in Belvedere Park who have obtained a bachelor's degree or higher.
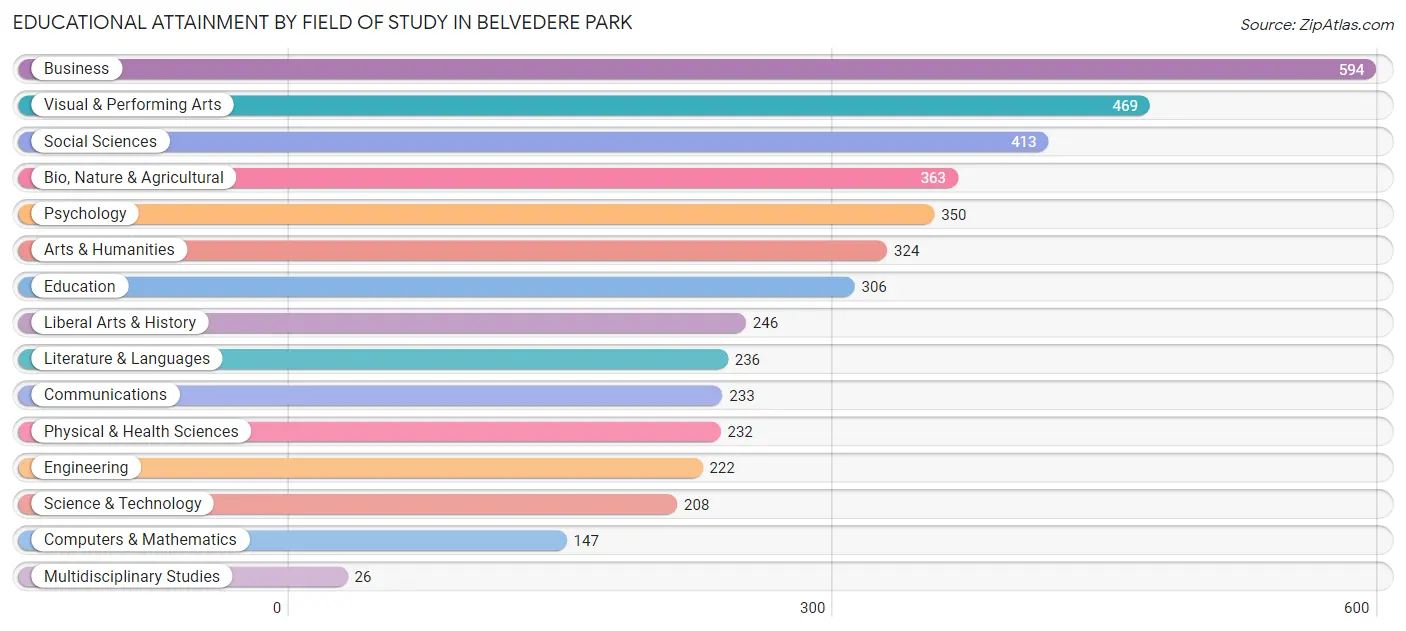
| Field of Study | # Graduates | % Graduates |
| Computers & Mathematics | 147 | 3.4% |
| Bio, Nature & Agricultural | 363 | 8.3% |
| Physical & Health Sciences | 232 | 5.3% |
| Psychology | 350 | 8.0% |
| Social Sciences | 413 | 9.5% |
| Engineering | 222 | 5.1% |
| Multidisciplinary Studies | 26 | 0.6% |
| Science & Technology | 208 | 4.8% |
| Business | 594 | 13.6% |
| Education | 306 | 7.0% |
| Literature & Languages | 236 | 5.4% |
| Liberal Arts & History | 246 | 5.6% |
| Visual & Performing Arts | 469 | 10.7% |
| Communications | 233 | 5.3% |
| Arts & Humanities | 324 | 7.4% |
| Total | 4,369 | 100.0% |
Transportation & Commute in Belvedere Park
Vehicle Availability by Sex in Belvedere Park
The most prevalent vehicle ownership categories in Belvedere Park are males with 2 vehicles (1,721, accounting for 49.0%) and females with 2 vehicles (1,760, making up 45.3%).
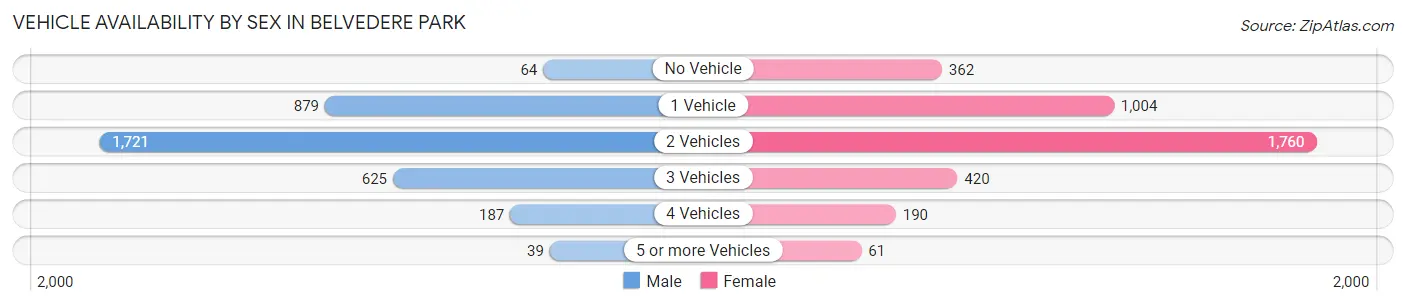
| Vehicles Available | Male | Female |
| No Vehicle | 64 (1.8%) | 362 (9.5%) |
| 1 Vehicle | 879 (25.0%) | 1,004 (26.4%) |
| 2 Vehicles | 1,721 (49.0%) | 1,760 (46.4%) |
| 3 Vehicles | 625 (17.8%) | 420 (11.1%) |
| 4 Vehicles | 187 (5.3%) | 190 (5.0%) |
| 5 or more Vehicles | 39 (1.1%) | 61 (1.6%) |
| Total | 3,515 (100.0%) | 3,797 (100.0%) |
Commute Time in Belvedere Park
The most frequently occuring commute durations in Belvedere Park are 30 to 34 minutes (1,321 commuters, 21.2%), 45 to 59 minutes (1,056 commuters, 16.9%), and 20 to 24 minutes (768 commuters, 12.3%).
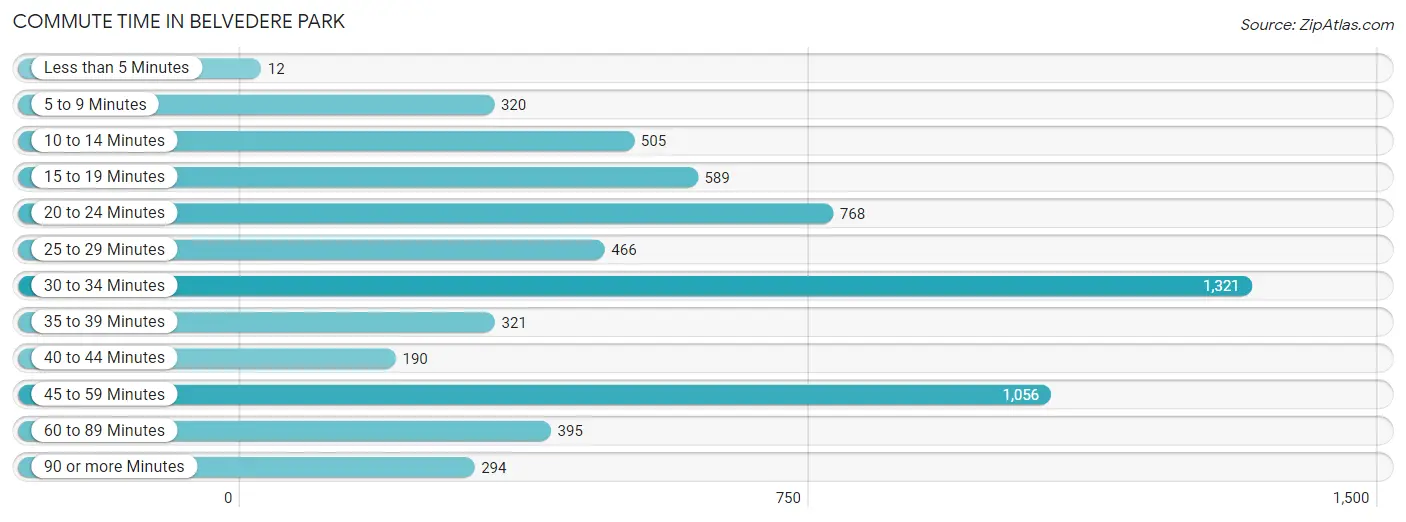
| Commute Time | # Commuters | % Commuters |
| Less than 5 Minutes | 12 | 0.2% |
| 5 to 9 Minutes | 320 | 5.1% |
| 10 to 14 Minutes | 505 | 8.1% |
| 15 to 19 Minutes | 589 | 9.4% |
| 20 to 24 Minutes | 768 | 12.3% |
| 25 to 29 Minutes | 466 | 7.5% |
| 30 to 34 Minutes | 1,321 | 21.2% |
| 35 to 39 Minutes | 321 | 5.1% |
| 40 to 44 Minutes | 190 | 3.0% |
| 45 to 59 Minutes | 1,056 | 16.9% |
| 60 to 89 Minutes | 395 | 6.3% |
| 90 or more Minutes | 294 | 4.7% |
Commute Time by Sex in Belvedere Park
The most common commute times in Belvedere Park are 30 to 34 minutes (684 commuters, 22.1%) for males and 30 to 34 minutes (637 commuters, 20.3%) for females.
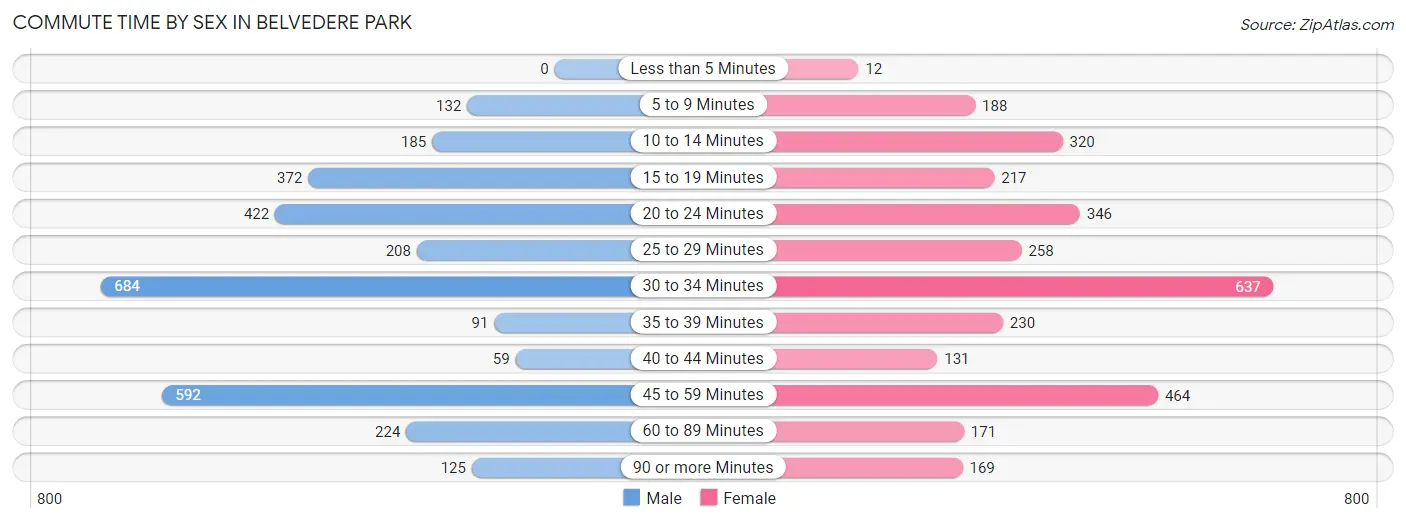
| Commute Time | Male | Female |
| Less than 5 Minutes | 0 (0.0%) | 12 (0.4%) |
| 5 to 9 Minutes | 132 (4.3%) | 188 (6.0%) |
| 10 to 14 Minutes | 185 (6.0%) | 320 (10.2%) |
| 15 to 19 Minutes | 372 (12.0%) | 217 (6.9%) |
| 20 to 24 Minutes | 422 (13.6%) | 346 (11.0%) |
| 25 to 29 Minutes | 208 (6.7%) | 258 (8.2%) |
| 30 to 34 Minutes | 684 (22.1%) | 637 (20.3%) |
| 35 to 39 Minutes | 91 (2.9%) | 230 (7.3%) |
| 40 to 44 Minutes | 59 (1.9%) | 131 (4.2%) |
| 45 to 59 Minutes | 592 (19.1%) | 464 (14.8%) |
| 60 to 89 Minutes | 224 (7.2%) | 171 (5.4%) |
| 90 or more Minutes | 125 (4.0%) | 169 (5.4%) |
Time of Departure to Work by Sex in Belvedere Park
The most frequent times of departure to work in Belvedere Park are 9:00 AM to 9:59 AM (462, 14.9%) for males and 7:30 AM to 7:59 AM (402, 12.8%) for females.
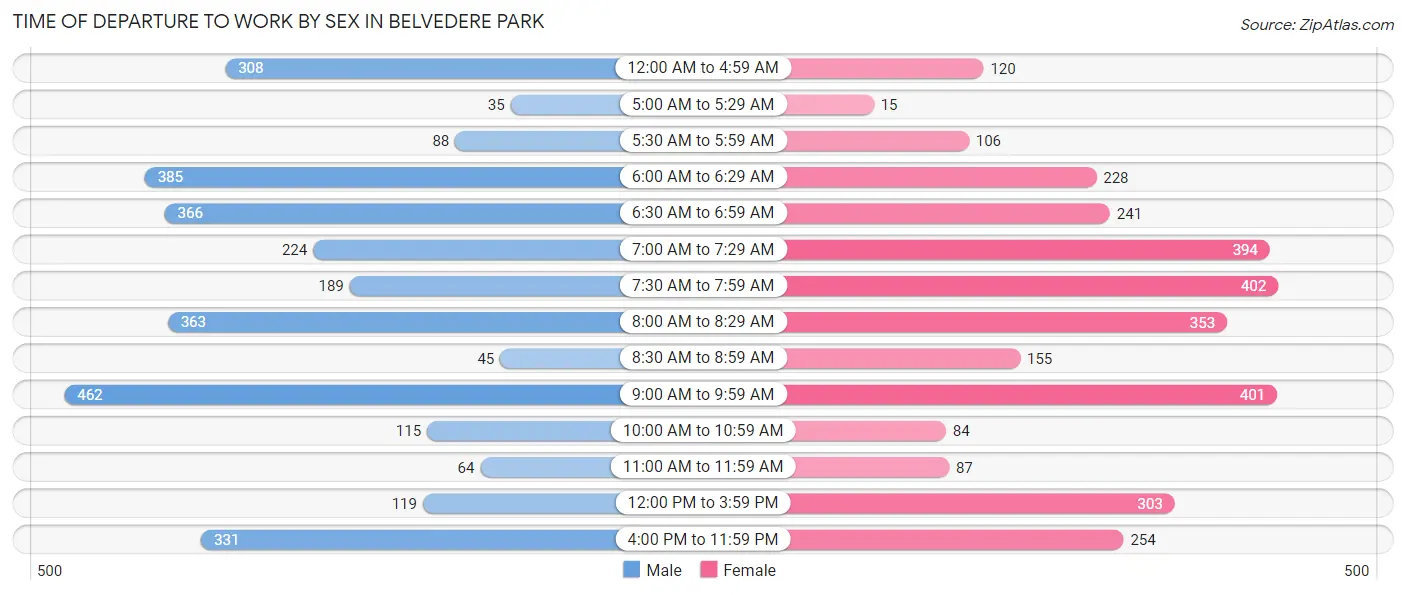
| Time of Departure | Male | Female |
| 12:00 AM to 4:59 AM | 308 (10.0%) | 120 (3.8%) |
| 5:00 AM to 5:29 AM | 35 (1.1%) | 15 (0.5%) |
| 5:30 AM to 5:59 AM | 88 (2.8%) | 106 (3.4%) |
| 6:00 AM to 6:29 AM | 385 (12.4%) | 228 (7.2%) |
| 6:30 AM to 6:59 AM | 366 (11.8%) | 241 (7.7%) |
| 7:00 AM to 7:29 AM | 224 (7.2%) | 394 (12.5%) |
| 7:30 AM to 7:59 AM | 189 (6.1%) | 402 (12.8%) |
| 8:00 AM to 8:29 AM | 363 (11.7%) | 353 (11.2%) |
| 8:30 AM to 8:59 AM | 45 (1.5%) | 155 (4.9%) |
| 9:00 AM to 9:59 AM | 462 (14.9%) | 401 (12.8%) |
| 10:00 AM to 10:59 AM | 115 (3.7%) | 84 (2.7%) |
| 11:00 AM to 11:59 AM | 64 (2.1%) | 87 (2.8%) |
| 12:00 PM to 3:59 PM | 119 (3.8%) | 303 (9.6%) |
| 4:00 PM to 11:59 PM | 331 (10.7%) | 254 (8.1%) |
| Total | 3,094 (100.0%) | 3,143 (100.0%) |
Housing Occupancy in Belvedere Park
Occupancy by Ownership in Belvedere Park
Of the total 5,524 dwellings in Belvedere Park, owner-occupied units account for 3,468 (62.8%), while renter-occupied units make up 2,056 (37.2%).
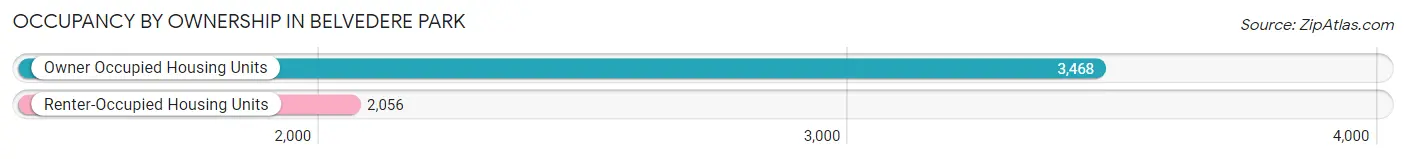
| Occupancy | # Housing Units | % Housing Units |
| Owner Occupied Housing Units | 3,468 | 62.8% |
| Renter-Occupied Housing Units | 2,056 | 37.2% |
| Total Occupied Housing Units | 5,524 | 100.0% |
Occupancy by Household Size in Belvedere Park
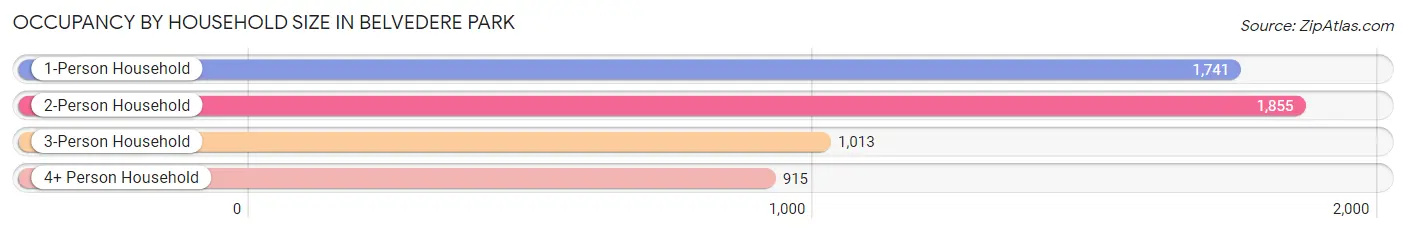
| Household Size | # Housing Units | % Housing Units |
| 1-Person Household | 1,741 | 31.5% |
| 2-Person Household | 1,855 | 33.6% |
| 3-Person Household | 1,013 | 18.3% |
| 4+ Person Household | 915 | 16.6% |
| Total Housing Units | 5,524 | 100.0% |
Occupancy by Ownership by Household Size in Belvedere Park
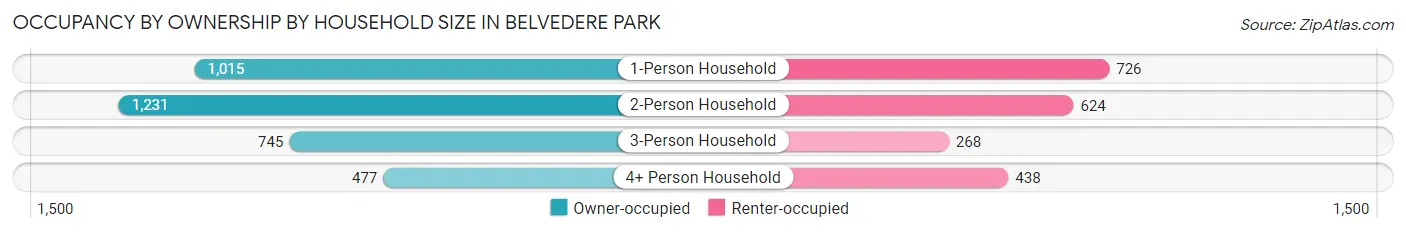
| Household Size | Owner-occupied | Renter-occupied |
| 1-Person Household | 1,015 (58.3%) | 726 (41.7%) |
| 2-Person Household | 1,231 (66.4%) | 624 (33.6%) |
| 3-Person Household | 745 (73.5%) | 268 (26.5%) |
| 4+ Person Household | 477 (52.1%) | 438 (47.9%) |
| Total Housing Units | 3,468 (62.8%) | 2,056 (37.2%) |
Occupancy by Educational Attainment in Belvedere Park
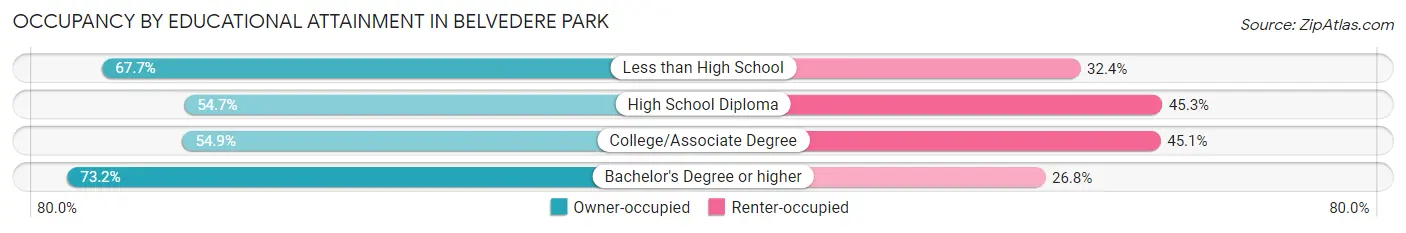
| Household Size | Owner-occupied | Renter-occupied |
| Less than High School | 253 (67.6%) | 121 (32.4%) |
| High School Diploma | 777 (54.7%) | 644 (45.3%) |
| College/Associate Degree | 878 (54.9%) | 720 (45.1%) |
| Bachelor's Degree or higher | 1,560 (73.2%) | 571 (26.8%) |
Occupancy by Age of Householder in Belvedere Park
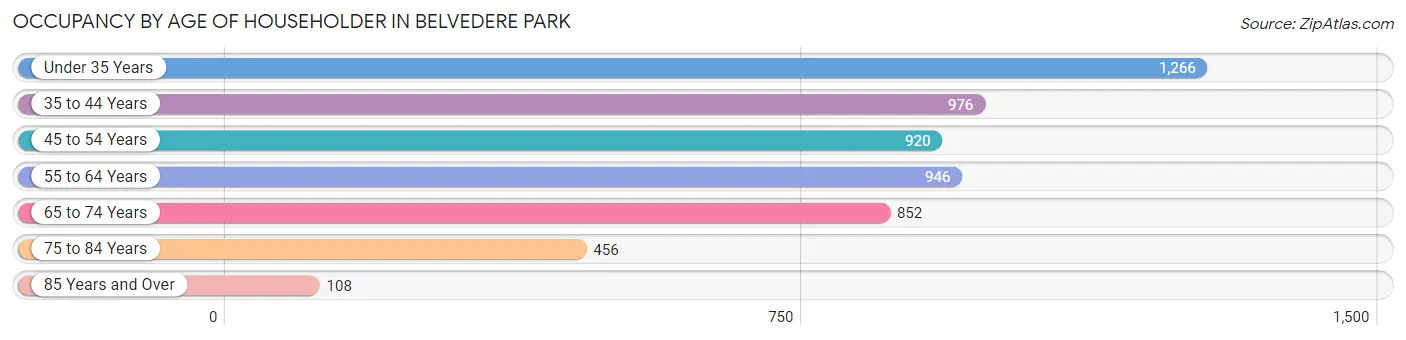
| Age Bracket | # Households | % Households |
| Under 35 Years | 1,266 | 22.9% |
| 35 to 44 Years | 976 | 17.7% |
| 45 to 54 Years | 920 | 16.7% |
| 55 to 64 Years | 946 | 17.1% |
| 65 to 74 Years | 852 | 15.4% |
| 75 to 84 Years | 456 | 8.3% |
| 85 Years and Over | 108 | 2.0% |
| Total | 5,524 | 100.0% |
Housing Finances in Belvedere Park
Median Income by Occupancy in Belvedere Park
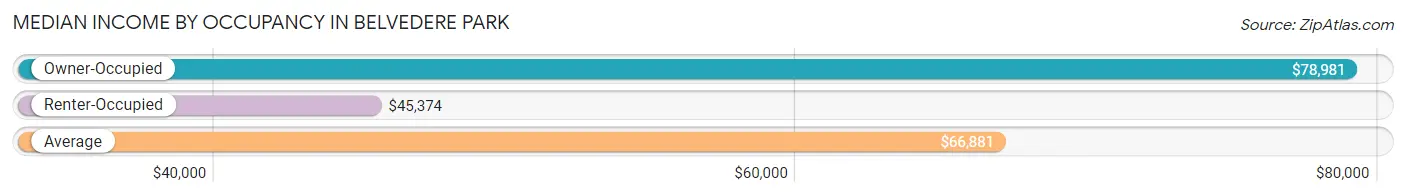
| Occupancy Type | # Households | Median Income |
| Owner-Occupied | 3,468 (62.8%) | $78,981 |
| Renter-Occupied | 2,056 (37.2%) | $45,374 |
| Average | 5,524 (100.0%) | $66,881 |
Occupancy by Householder Income Bracket in Belvedere Park
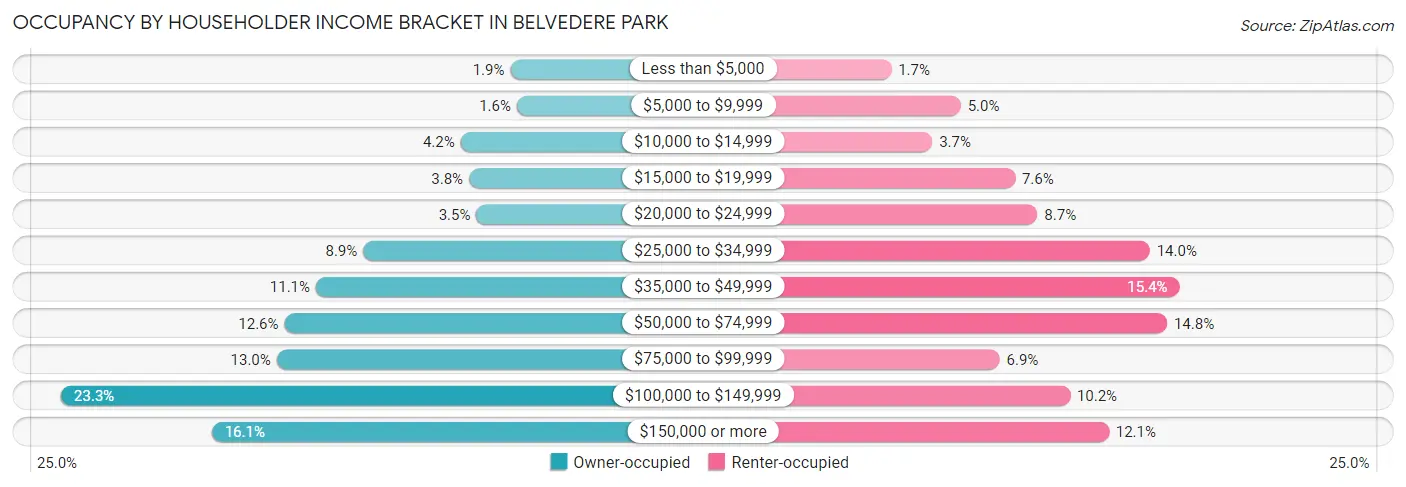
| Income Bracket | Owner-occupied | Renter-occupied |
| Less than $5,000 | 65 (1.9%) | 35 (1.7%) |
| $5,000 to $9,999 | 54 (1.6%) | 103 (5.0%) |
| $10,000 to $14,999 | 147 (4.2%) | 75 (3.6%) |
| $15,000 to $19,999 | 133 (3.8%) | 156 (7.6%) |
| $20,000 to $24,999 | 121 (3.5%) | 178 (8.7%) |
| $25,000 to $34,999 | 308 (8.9%) | 288 (14.0%) |
| $35,000 to $49,999 | 386 (11.1%) | 317 (15.4%) |
| $50,000 to $74,999 | 438 (12.6%) | 305 (14.8%) |
| $75,000 to $99,999 | 451 (13.0%) | 141 (6.9%) |
| $100,000 to $149,999 | 807 (23.3%) | 210 (10.2%) |
| $150,000 or more | 558 (16.1%) | 248 (12.1%) |
| Total | 3,468 (100.0%) | 2,056 (100.0%) |
Monthly Housing Cost Tiers in Belvedere Park
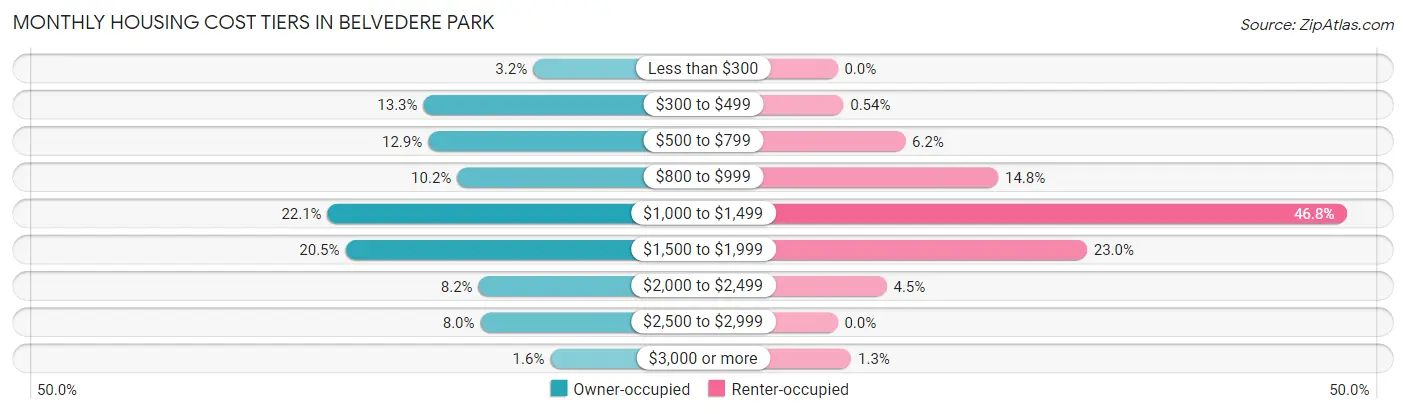
| Monthly Cost | Owner-occupied | Renter-occupied |
| Less than $300 | 111 (3.2%) | 0 (0.0%) |
| $300 to $499 | 461 (13.3%) | 11 (0.5%) |
| $500 to $799 | 446 (12.9%) | 128 (6.2%) |
| $800 to $999 | 353 (10.2%) | 304 (14.8%) |
| $1,000 to $1,499 | 767 (22.1%) | 963 (46.8%) |
| $1,500 to $1,999 | 710 (20.5%) | 472 (23.0%) |
| $2,000 to $2,499 | 285 (8.2%) | 93 (4.5%) |
| $2,500 to $2,999 | 279 (8.0%) | 0 (0.0%) |
| $3,000 or more | 56 (1.6%) | 26 (1.3%) |
| Total | 3,468 (100.0%) | 2,056 (100.0%) |
Physical Housing Characteristics in Belvedere Park
Housing Structures in Belvedere Park
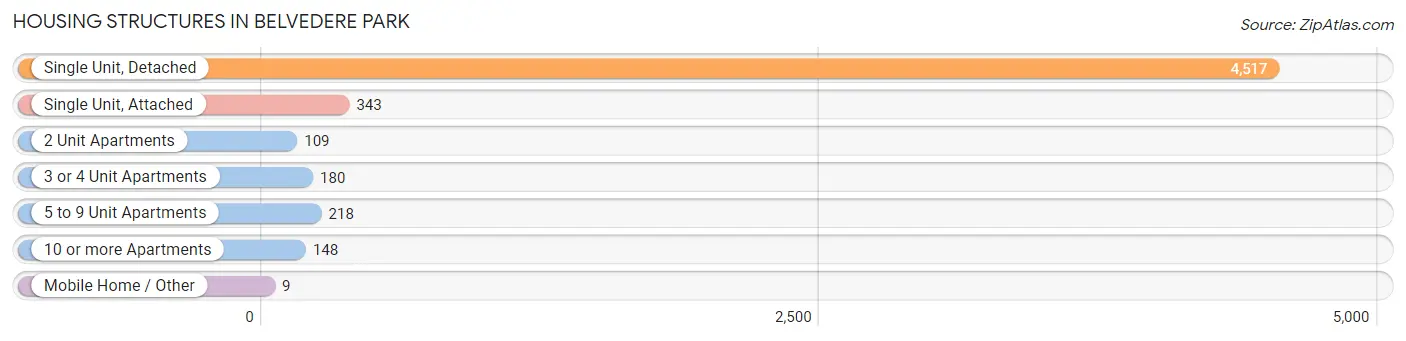
| Structure Type | # Housing Units | % Housing Units |
| Single Unit, Detached | 4,517 | 81.8% |
| Single Unit, Attached | 343 | 6.2% |
| 2 Unit Apartments | 109 | 2.0% |
| 3 or 4 Unit Apartments | 180 | 3.3% |
| 5 to 9 Unit Apartments | 218 | 4.0% |
| 10 or more Apartments | 148 | 2.7% |
| Mobile Home / Other | 9 | 0.2% |
| Total | 5,524 | 100.0% |
Housing Structures by Occupancy in Belvedere Park
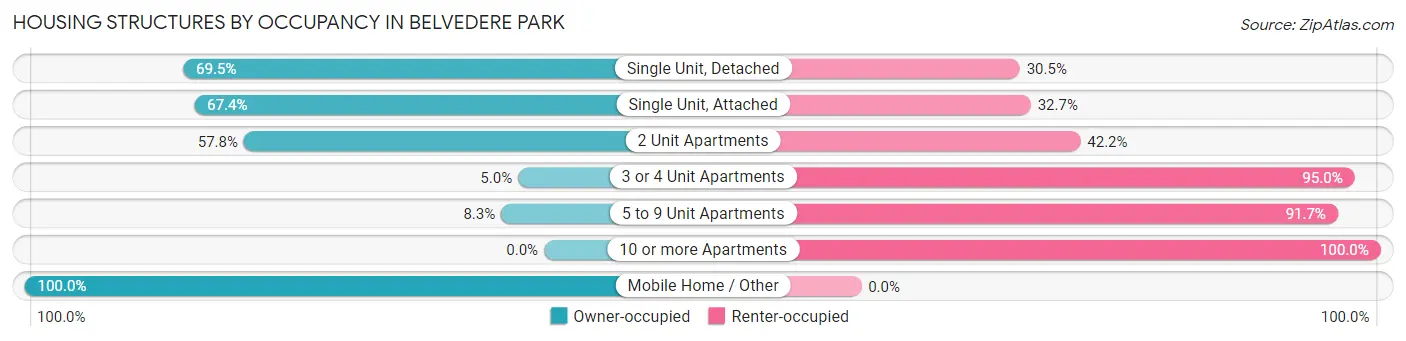
| Structure Type | Owner-occupied | Renter-occupied |
| Single Unit, Detached | 3,138 (69.5%) | 1,379 (30.5%) |
| Single Unit, Attached | 231 (67.3%) | 112 (32.7%) |
| 2 Unit Apartments | 63 (57.8%) | 46 (42.2%) |
| 3 or 4 Unit Apartments | 9 (5.0%) | 171 (95.0%) |
| 5 to 9 Unit Apartments | 18 (8.3%) | 200 (91.7%) |
| 10 or more Apartments | 0 (0.0%) | 148 (100.0%) |
| Mobile Home / Other | 9 (100.0%) | 0 (0.0%) |
| Total | 3,468 (62.8%) | 2,056 (37.2%) |
Housing Structures by Number of Rooms in Belvedere Park
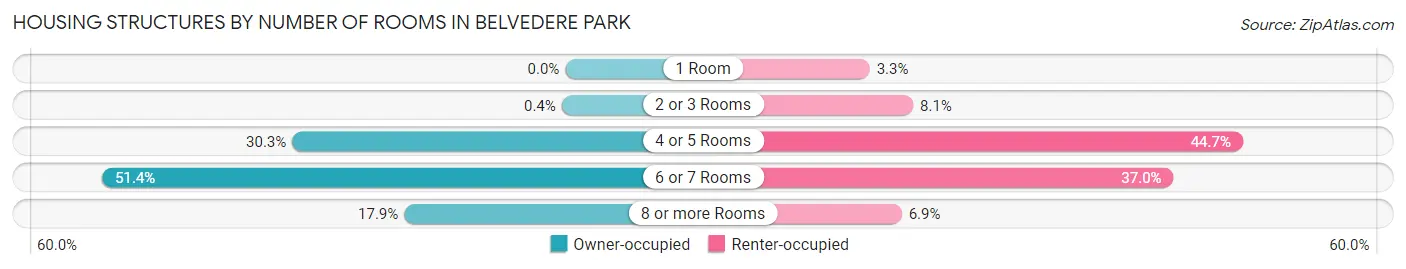
| Number of Rooms | Owner-occupied | Renter-occupied |
| 1 Room | 0 (0.0%) | 68 (3.3%) |
| 2 or 3 Rooms | 14 (0.4%) | 167 (8.1%) |
| 4 or 5 Rooms | 1,051 (30.3%) | 919 (44.7%) |
| 6 or 7 Rooms | 1,783 (51.4%) | 761 (37.0%) |
| 8 or more Rooms | 620 (17.9%) | 141 (6.9%) |
| Total | 3,468 (100.0%) | 2,056 (100.0%) |
Housing Structure by Heating Type in Belvedere Park
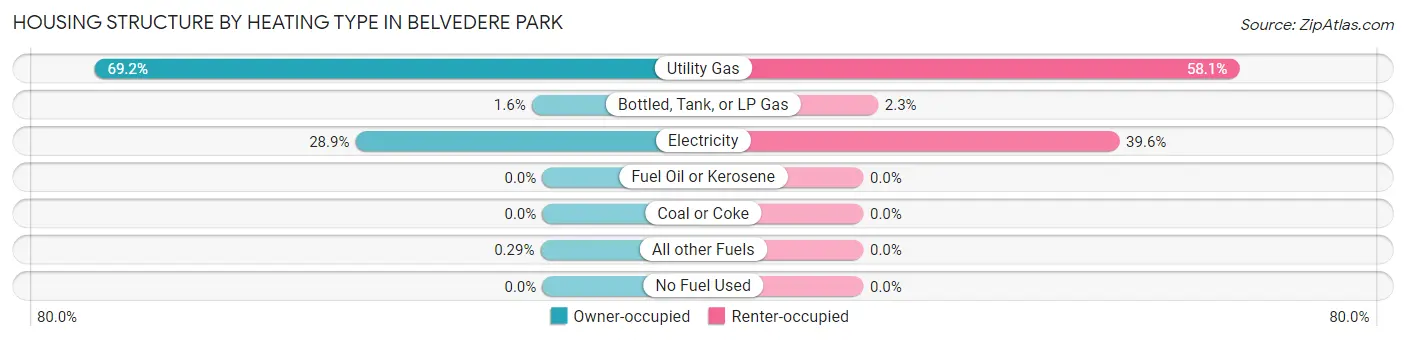
| Heating Type | Owner-occupied | Renter-occupied |
| Utility Gas | 2,399 (69.2%) | 1,195 (58.1%) |
| Bottled, Tank, or LP Gas | 57 (1.6%) | 47 (2.3%) |
| Electricity | 1,002 (28.9%) | 814 (39.6%) |
| Fuel Oil or Kerosene | 0 (0.0%) | 0 (0.0%) |
| Coal or Coke | 0 (0.0%) | 0 (0.0%) |
| All other Fuels | 10 (0.3%) | 0 (0.0%) |
| No Fuel Used | 0 (0.0%) | 0 (0.0%) |
| Total | 3,468 (100.0%) | 2,056 (100.0%) |
Household Vehicle Usage in Belvedere Park
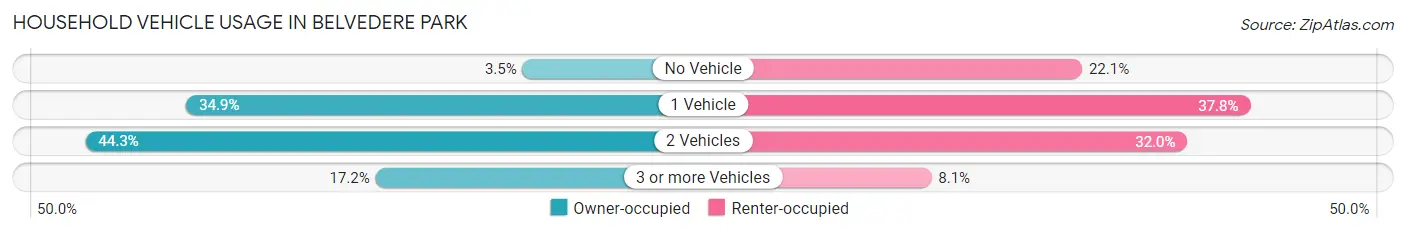
| Vehicles per Household | Owner-occupied | Renter-occupied |
| No Vehicle | 122 (3.5%) | 455 (22.1%) |
| 1 Vehicle | 1,211 (34.9%) | 778 (37.8%) |
| 2 Vehicles | 1,537 (44.3%) | 657 (32.0%) |
| 3 or more Vehicles | 598 (17.2%) | 166 (8.1%) |
| Total | 3,468 (100.0%) | 2,056 (100.0%) |
Real Estate & Mortgages in Belvedere Park
Real Estate and Mortgage Overview in Belvedere Park
| Characteristic | Without Mortgage | With Mortgage |
| Housing Units | 1,011 | 2,457 |
| Median Property Value | $196,800 | $256,800 |
| Median Household Income | $42,792 | $491 |
| Monthly Housing Costs | $463 | $56 |
| Real Estate Taxes | $1,255 | $35 |
Property Value by Mortgage Status in Belvedere Park
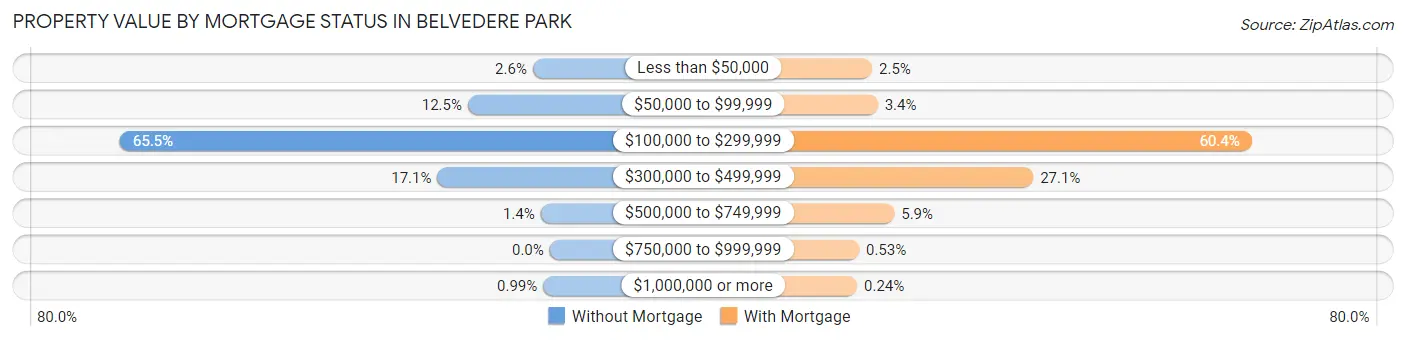
| Property Value | Without Mortgage | With Mortgage |
| Less than $50,000 | 26 (2.6%) | 62 (2.5%) |
| $50,000 to $99,999 | 126 (12.5%) | 83 (3.4%) |
| $100,000 to $299,999 | 662 (65.5%) | 1,483 (60.4%) |
| $300,000 to $499,999 | 173 (17.1%) | 665 (27.1%) |
| $500,000 to $749,999 | 14 (1.4%) | 145 (5.9%) |
| $750,000 to $999,999 | 0 (0.0%) | 13 (0.5%) |
| $1,000,000 or more | 10 (1.0%) | 6 (0.2%) |
| Total | 1,011 (100.0%) | 2,457 (100.0%) |
Household Income by Mortgage Status in Belvedere Park
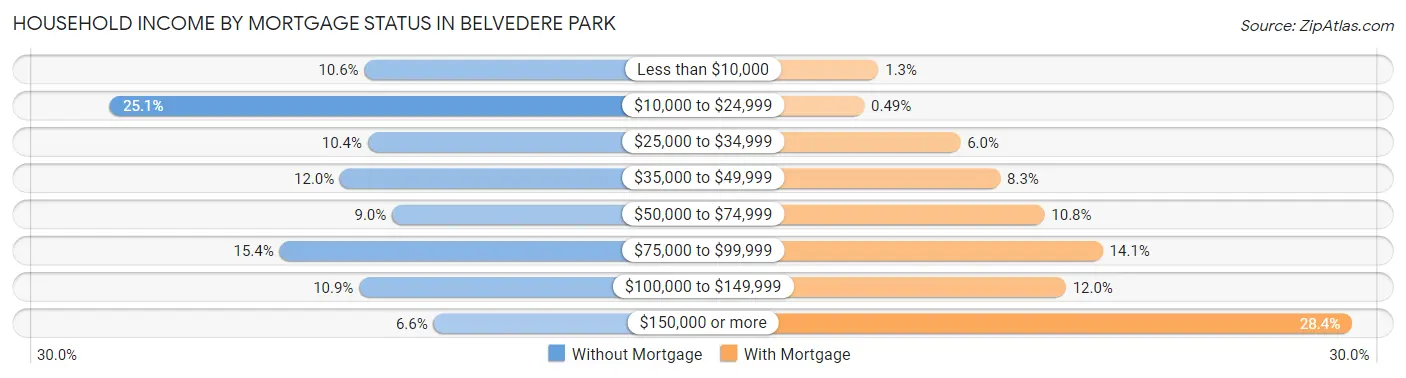
| Household Income | Without Mortgage | With Mortgage |
| Less than $10,000 | 107 (10.6%) | 32 (1.3%) |
| $10,000 to $24,999 | 254 (25.1%) | 12 (0.5%) |
| $25,000 to $34,999 | 105 (10.4%) | 147 (6.0%) |
| $35,000 to $49,999 | 121 (12.0%) | 203 (8.3%) |
| $50,000 to $74,999 | 91 (9.0%) | 265 (10.8%) |
| $75,000 to $99,999 | 156 (15.4%) | 347 (14.1%) |
| $100,000 to $149,999 | 110 (10.9%) | 295 (12.0%) |
| $150,000 or more | 67 (6.6%) | 697 (28.4%) |
| Total | 1,011 (100.0%) | 2,457 (100.0%) |
Property Value to Household Income Ratio in Belvedere Park
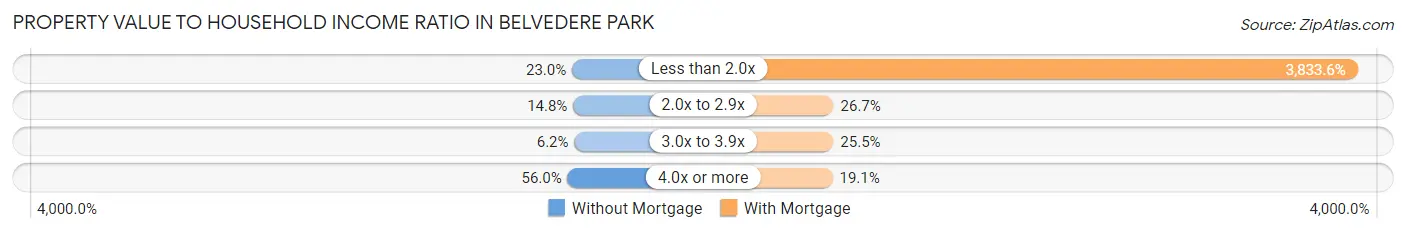
| Value-to-Income Ratio | Without Mortgage | With Mortgage |
| Less than 2.0x | 232 (23.0%) | 94,191 (3,833.6%) |
| 2.0x to 2.9x | 150 (14.8%) | 656 (26.7%) |
| 3.0x to 3.9x | 63 (6.2%) | 627 (25.5%) |
| 4.0x or more | 566 (56.0%) | 470 (19.1%) |
| Total | 1,011 (100.0%) | 2,457 (100.0%) |
Real Estate Taxes by Mortgage Status in Belvedere Park
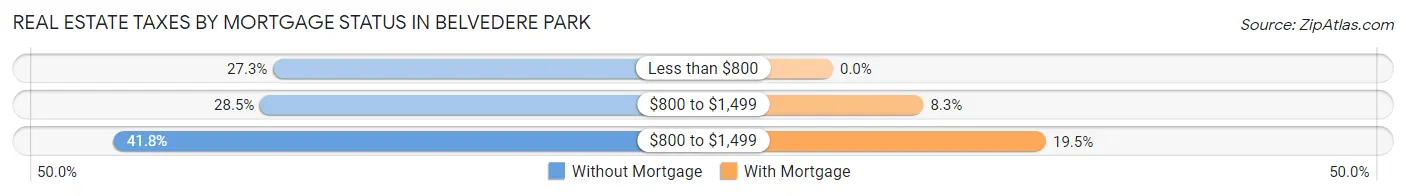
| Property Taxes | Without Mortgage | With Mortgage |
| Less than $800 | 276 (27.3%) | 0 (0.0%) |
| $800 to $1,499 | 288 (28.5%) | 203 (8.3%) |
| $800 to $1,499 | 423 (41.8%) | 478 (19.5%) |
| Total | 1,011 (100.0%) | 2,457 (100.0%) |
Health & Disability in Belvedere Park
Health Insurance Coverage by Age in Belvedere Park
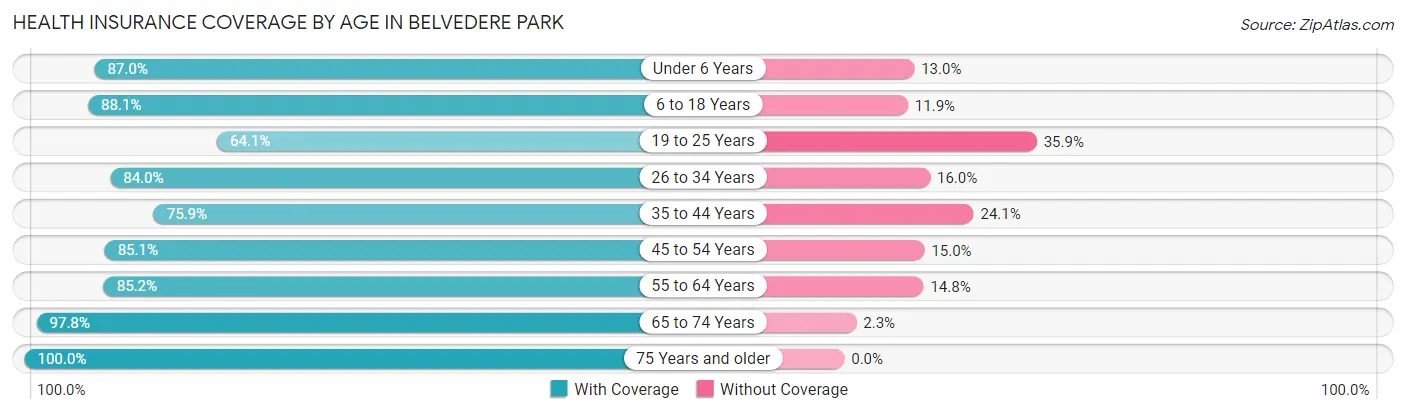
| Age Bracket | With Coverage | Without Coverage |
| Under 6 Years | 1,014 (87.0%) | 152 (13.0%) |
| 6 to 18 Years | 1,487 (88.1%) | 200 (11.9%) |
| 19 to 25 Years | 568 (64.1%) | 318 (35.9%) |
| 26 to 34 Years | 2,411 (84.0%) | 459 (16.0%) |
| 35 to 44 Years | 1,490 (75.9%) | 473 (24.1%) |
| 45 to 54 Years | 1,769 (85.1%) | 311 (14.9%) |
| 55 to 64 Years | 1,460 (85.2%) | 253 (14.8%) |
| 65 to 74 Years | 1,301 (97.8%) | 30 (2.2%) |
| 75 Years and older | 841 (100.0%) | 0 (0.0%) |
| Total | 12,341 (84.9%) | 2,196 (15.1%) |
Health Insurance Coverage by Citizenship Status in Belvedere Park
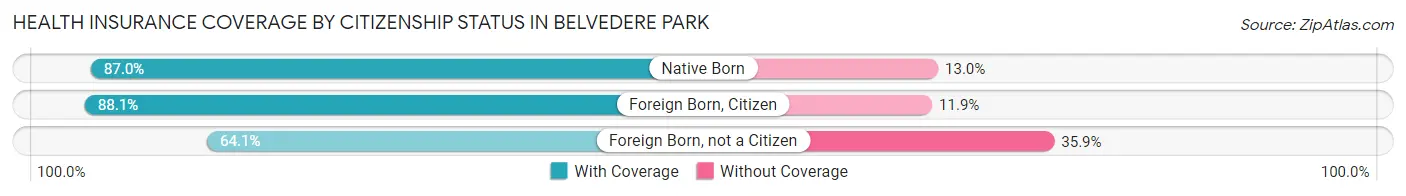
| Citizenship Status | With Coverage | Without Coverage |
| Native Born | 1,014 (87.0%) | 152 (13.0%) |
| Foreign Born, Citizen | 1,487 (88.1%) | 200 (11.9%) |
| Foreign Born, not a Citizen | 568 (64.1%) | 318 (35.9%) |
Health Insurance Coverage by Household Income in Belvedere Park
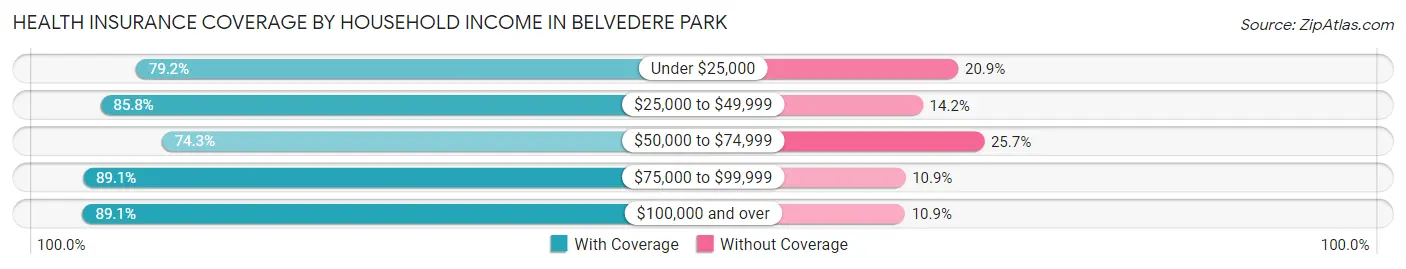
| Household Income | With Coverage | Without Coverage |
| Under $25,000 | 1,454 (79.1%) | 383 (20.8%) |
| $25,000 to $49,999 | 2,893 (85.8%) | 479 (14.2%) |
| $50,000 to $74,999 | 1,613 (74.3%) | 558 (25.7%) |
| $75,000 to $99,999 | 1,400 (89.1%) | 172 (10.9%) |
| $100,000 and over | 4,934 (89.1%) | 601 (10.9%) |
Public vs Private Health Insurance Coverage by Age in Belvedere Park
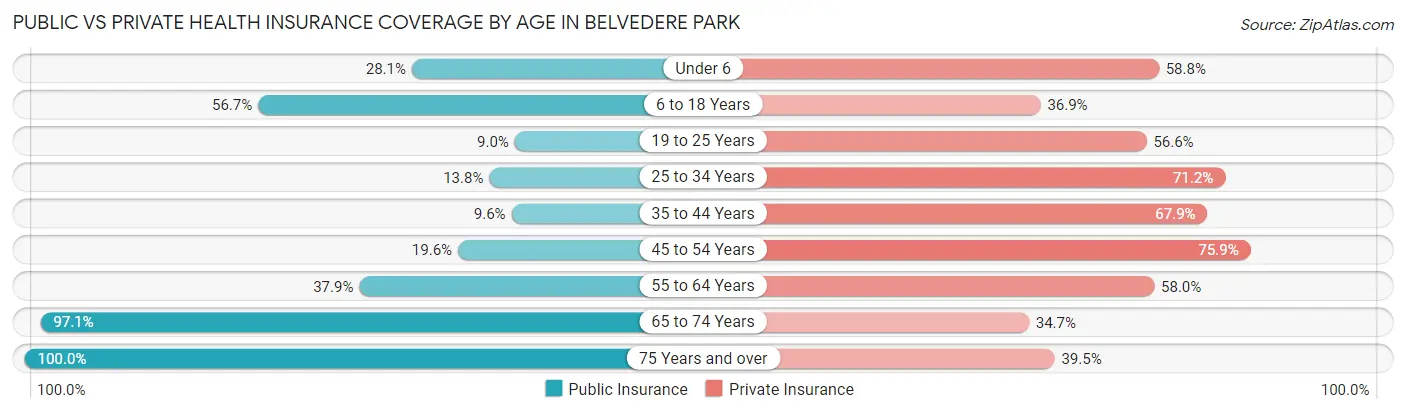
| Age Bracket | Public Insurance | Private Insurance |
| Under 6 | 328 (28.1%) | 686 (58.8%) |
| 6 to 18 Years | 956 (56.7%) | 622 (36.9%) |
| 19 to 25 Years | 80 (9.0%) | 501 (56.6%) |
| 25 to 34 Years | 395 (13.8%) | 2,042 (71.2%) |
| 35 to 44 Years | 189 (9.6%) | 1,332 (67.9%) |
| 45 to 54 Years | 407 (19.6%) | 1,578 (75.9%) |
| 55 to 64 Years | 649 (37.9%) | 993 (58.0%) |
| 65 to 74 Years | 1,292 (97.1%) | 462 (34.7%) |
| 75 Years and over | 841 (100.0%) | 332 (39.5%) |
| Total | 5,137 (35.3%) | 8,548 (58.8%) |
Disability Status by Sex by Age in Belvedere Park
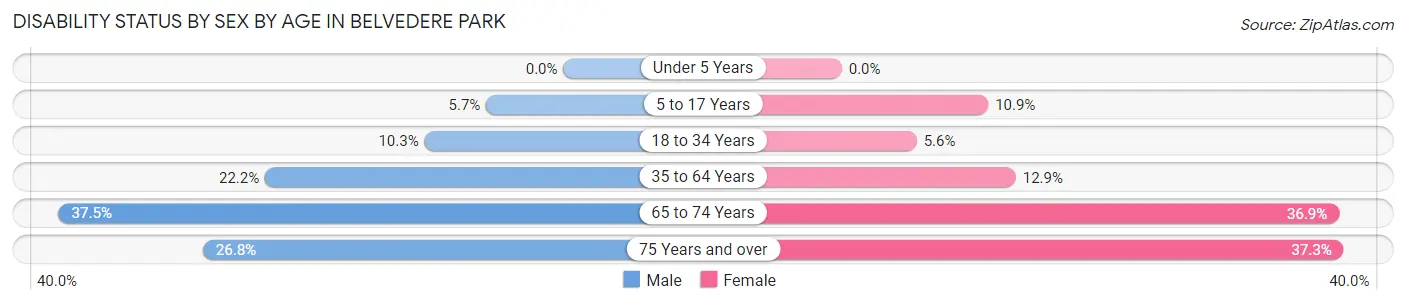
| Age Bracket | Male | Female |
| Under 5 Years | 0 (0.0%) | 0 (0.0%) |
| 5 to 17 Years | 59 (5.7%) | 80 (10.9%) |
| 18 to 34 Years | 198 (10.3%) | 102 (5.6%) |
| 35 to 64 Years | 596 (22.2%) | 396 (12.9%) |
| 65 to 74 Years | 178 (37.5%) | 316 (36.9%) |
| 75 Years and over | 57 (26.8%) | 234 (37.3%) |
Disability Class by Sex by Age in Belvedere Park
Disability Class: Hearing Difficulty
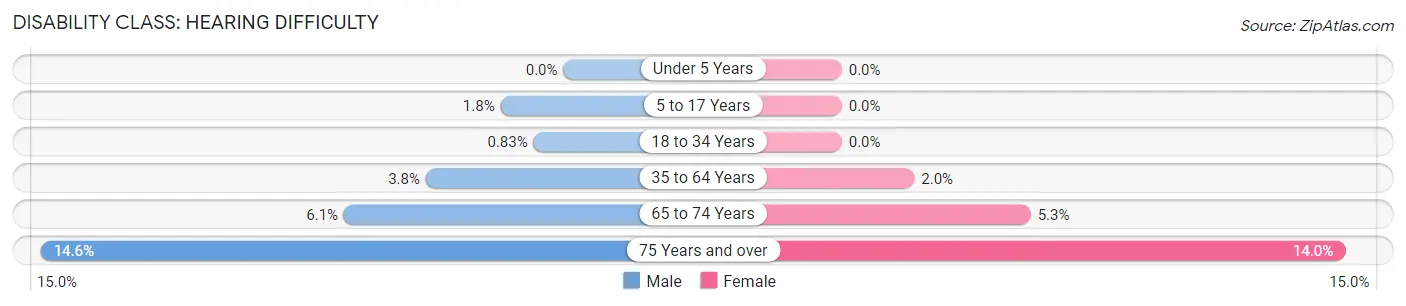
| Age Bracket | Male | Female |
| Under 5 Years | 0 (0.0%) | 0 (0.0%) |
| 5 to 17 Years | 18 (1.8%) | 0 (0.0%) |
| 18 to 34 Years | 16 (0.8%) | 0 (0.0%) |
| 35 to 64 Years | 103 (3.8%) | 62 (2.0%) |
| 65 to 74 Years | 29 (6.1%) | 45 (5.3%) |
| 75 Years and over | 31 (14.5%) | 88 (14.0%) |
Disability Class: Vision Difficulty
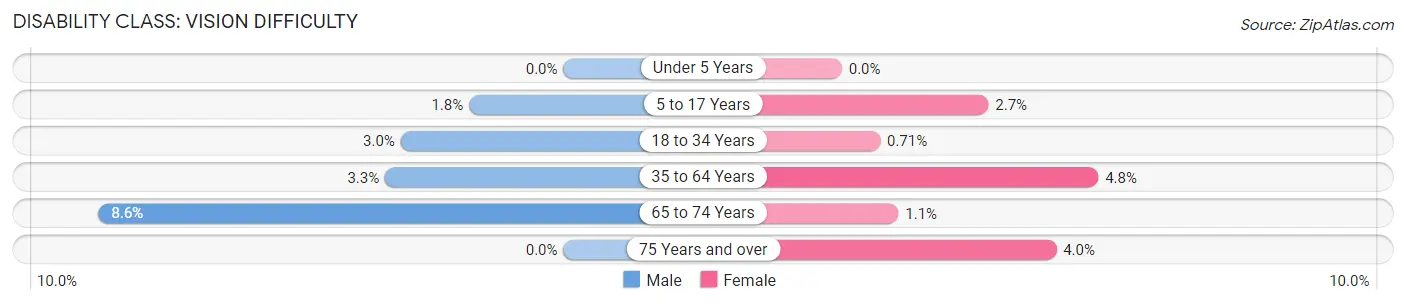
| Age Bracket | Male | Female |
| Under 5 Years | 0 (0.0%) | 0 (0.0%) |
| 5 to 17 Years | 18 (1.8%) | 20 (2.7%) |
| 18 to 34 Years | 58 (3.0%) | 13 (0.7%) |
| 35 to 64 Years | 89 (3.3%) | 146 (4.8%) |
| 65 to 74 Years | 41 (8.6%) | 9 (1.1%) |
| 75 Years and over | 0 (0.0%) | 25 (4.0%) |
Disability Class: Cognitive Difficulty
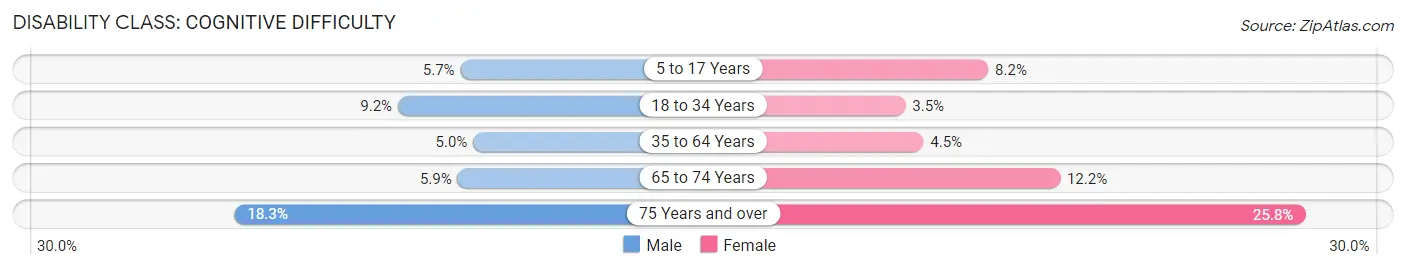
| Age Bracket | Male | Female |
| 5 to 17 Years | 59 (5.7%) | 60 (8.2%) |
| 18 to 34 Years | 177 (9.2%) | 65 (3.5%) |
| 35 to 64 Years | 135 (5.0%) | 139 (4.5%) |
| 65 to 74 Years | 28 (5.9%) | 104 (12.1%) |
| 75 Years and over | 39 (18.3%) | 162 (25.8%) |
Disability Class: Ambulatory Difficulty
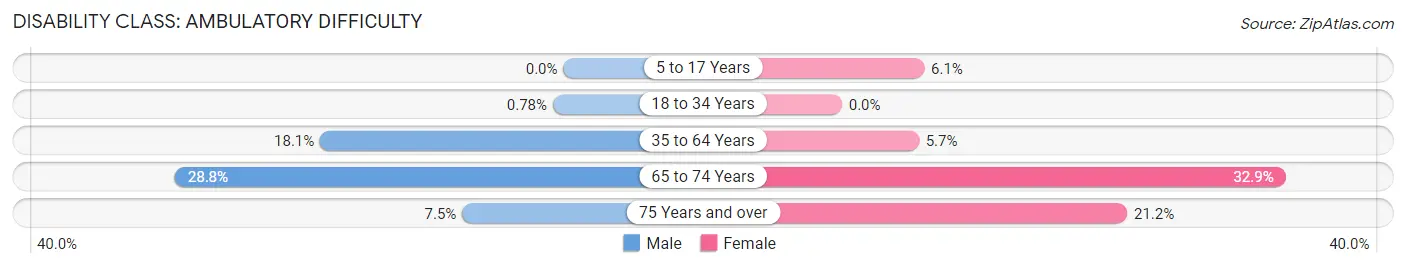
| Age Bracket | Male | Female |
| 5 to 17 Years | 0 (0.0%) | 45 (6.1%) |
| 18 to 34 Years | 15 (0.8%) | 0 (0.0%) |
| 35 to 64 Years | 486 (18.1%) | 175 (5.7%) |
| 65 to 74 Years | 137 (28.8%) | 282 (32.9%) |
| 75 Years and over | 16 (7.5%) | 133 (21.2%) |
Disability Class: Self-Care Difficulty
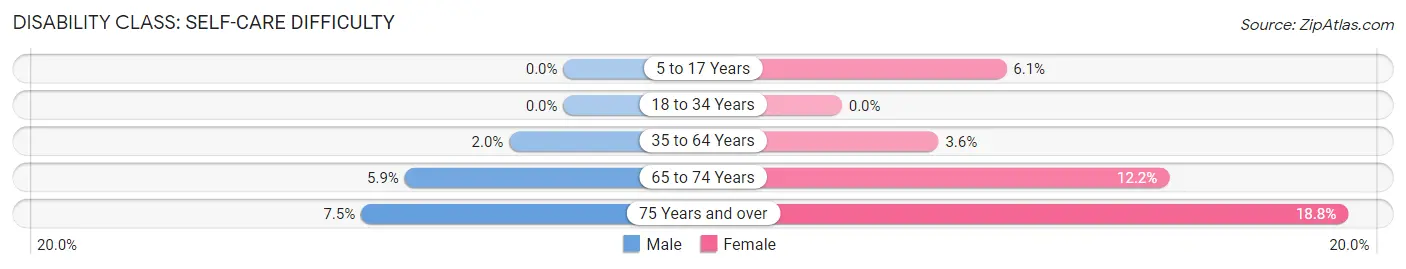
| Age Bracket | Male | Female |
| 5 to 17 Years | 0 (0.0%) | 45 (6.1%) |
| 18 to 34 Years | 0 (0.0%) | 0 (0.0%) |
| 35 to 64 Years | 54 (2.0%) | 110 (3.6%) |
| 65 to 74 Years | 28 (5.9%) | 104 (12.1%) |
| 75 Years and over | 16 (7.5%) | 118 (18.8%) |
Technology Access in Belvedere Park
Computing Device Access in Belvedere Park
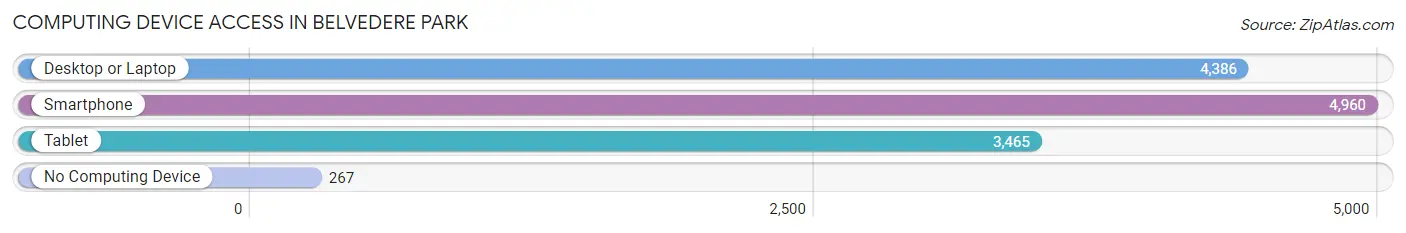
| Device Type | # Households | % Households |
| Desktop or Laptop | 4,386 | 79.4% |
| Smartphone | 4,960 | 89.8% |
| Tablet | 3,465 | 62.7% |
| No Computing Device | 267 | 4.8% |
| Total | 5,524 | 100.0% |
Internet Access in Belvedere Park
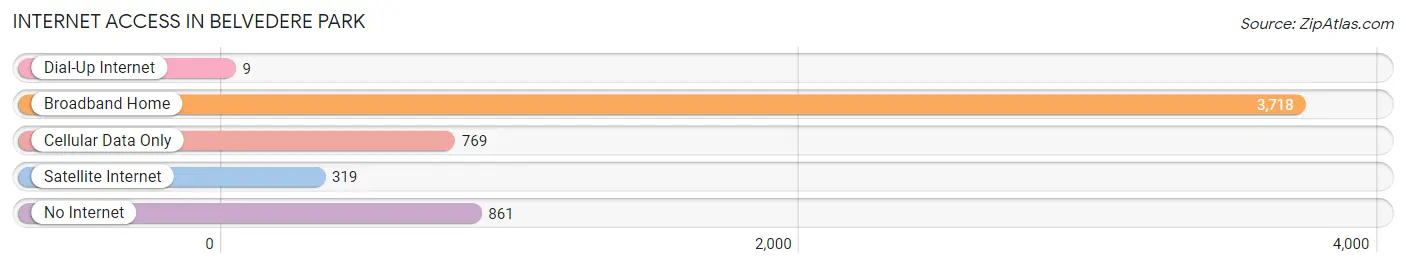
| Internet Type | # Households | % Households |
| Dial-Up Internet | 9 | 0.2% |
| Broadband Home | 3,718 | 67.3% |
| Cellular Data Only | 769 | 13.9% |
| Satellite Internet | 319 | 5.8% |
| No Internet | 861 | 15.6% |
| Total | 5,524 | 100.0% |
Belvedere Park Summary
Belvedere Park is a small city located in DeKalb County, Georgia, United States. It is situated just east of Atlanta and is part of the Atlanta metropolitan area. The population of Belvedere Park was 4,845 at the 2010 census.
History
Belvedere Park was founded in the early 1950s as a planned community. It was developed by the Belvedere Park Corporation, which was owned by the family of the late Atlanta real estate developer, William B. Hartsfield. The community was designed to be a suburban neighborhood with a mix of single-family homes, apartments, and commercial businesses.
The city was incorporated in 1956 and was named after the Belvedere Hotel, which was located in downtown Atlanta. The hotel was demolished in the late 1950s to make way for the construction of the Georgia World Congress Center.
Geography
Belvedere Park is located at 33°45'25" North, 84°19'45" West (33.756944, -84.329167). It is situated in the eastern part of DeKalb County, just east of Atlanta. The city has a total area of 1.2 square miles, all of which is land.
Economy
The economy of Belvedere Park is largely based on the service industry. The city is home to a variety of restaurants, retail stores, and other businesses. The city also has a number of industrial and manufacturing businesses.
Demographics
As of the 2010 census, there were 4,845 people, 1,945 households, and 1,269 families residing in the city. The population density was 4,037.3 people per square mile. The racial makeup of the city was 57.2% African American, 33.3% White, 0.3% Native American, 1.2% Asian, 0.1% Pacific Islander, 5.7% from other races, and 2.4% from two or more races. Hispanic or Latino of any race were 10.2% of the population.
The median income for a household in the city was $37,917, and the median income for a family was $45,938. Males had a median income of $31,964 versus $27,917 for females. The per capita income for the city was $18,945. About 11.2% of families and 13.3% of the population were below the poverty line, including 18.2% of those under age 18 and 8.2% of those age 65 or over.
Common Questions
What is Per Capita Income in Belvedere Park?
Per Capita income in Belvedere Park is $35,726.
What is the Median Family Income in Belvedere Park?
Median Family Income in Belvedere Park is $75,920.
What is the Median Household income in Belvedere Park?
Median Household Income in Belvedere Park is $66,881.
What is Income or Wage Gap in Belvedere Park?
Income or Wage Gap in Belvedere Park is 10.1%.
Women in Belvedere Park earn 89.9 cents for every dollar earned by a man.
What is Family Income Deficit in Belvedere Park?
Family Income Deficit in Belvedere Park is $8,677.
Families that are below poverty line in Belvedere Park earn $8,677 less on average than the poverty threshold level.
What is Inequality or Gini Index in Belvedere Park?
Inequality or Gini Index in Belvedere Park is 0.46.
What is the Total Population of Belvedere Park?
Total Population of Belvedere Park is 14,558.
What is the Total Male Population of Belvedere Park?
Total Male Population of Belvedere Park is 6,889.
What is the Total Female Population of Belvedere Park?
Total Female Population of Belvedere Park is 7,669.
What is the Ratio of Males per 100 Females in Belvedere Park?
There are 89.83 Males per 100 Females in Belvedere Park.
What is the Ratio of Females per 100 Males in Belvedere Park?
There are 111.32 Females per 100 Males in Belvedere Park.
What is the Median Population Age in Belvedere Park?
Median Population Age in Belvedere Park is 38.1 Years.
What is the Average Family Size in Belvedere Park
Average Family Size in Belvedere Park is 3.4 People.
What is the Average Household Size in Belvedere Park
Average Household Size in Belvedere Park is 2.6 People.
How Large is the Labor Force in Belvedere Park?
There are 8,176 People in the Labor Forcein in Belvedere Park.
What is the Percentage of People in the Labor Force in Belvedere Park?
69.0% of People are in the Labor Force in Belvedere Park.
What is the Unemployment Rate in Belvedere Park?
Unemployment Rate in Belvedere Park is 7.7%.