Brownsville, FL Map & Demographics
Brownsville Map
Brownsville Overview
$18,744
PER CAPITA INCOME
$43,590
AVG FAMILY INCOME
$34,779
AVG HOUSEHOLD INCOME
29.7%
WAGE / INCOME GAP [ % ]
70.3¢/ $1
WAGE / INCOME GAP [ $ ]
$11,118
FAMILY INCOME DEFICIT
0.46
INEQUALITY / GINI INDEX
17,817
TOTAL POPULATION
9,008
MALE POPULATION
8,809
FEMALE POPULATION
102.26
MALES / 100 FEMALES
97.79
FEMALES / 100 MALES
38.2
MEDIAN AGE
3.7
AVG FAMILY SIZE
2.7
AVG HOUSEHOLD SIZE
8,281
LABOR FORCE [ PEOPLE ]
59.1%
PERCENT IN LABOR FORCE
7.5%
UNEMPLOYMENT RATE
Income in Brownsville
Income Overview in Brownsville
Per Capita Income in Brownsville is $18,744, while median incomes of families and households are $43,590 and $34,779 respectively.
| Characteristic | Number | Measure |
| Per Capita Income | 17,817 | $18,744 |
| Median Family Income | 3,882 | $43,590 |
| Mean Family Income | 3,882 | $56,989 |
| Median Household Income | 6,501 | $34,779 |
| Mean Household Income | 6,501 | $47,492 |
| Income Deficit | 3,882 | $11,118 |
| Wage / Income Gap (%) | 17,817 | 29.68% |
| Wage / Income Gap ($) | 17,817 | 70.32¢ per $1 |
| Gini / Inequality Index | 17,817 | 0.46 |
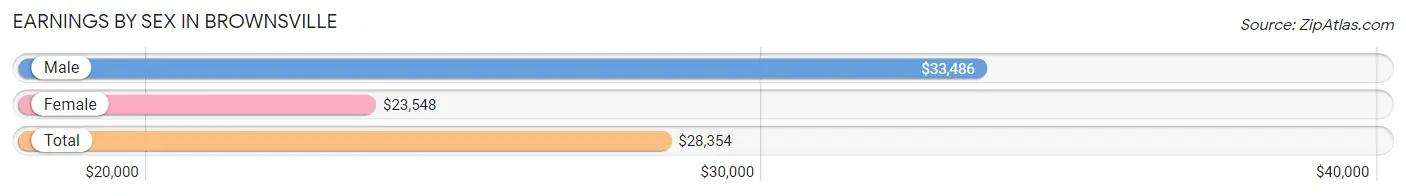
Earnings by Sex in Brownsville
Average Earnings in Brownsville are $28,354, $33,486 for men and $23,548 for women, a difference of 29.7%.
| Sex | Number | Average Earnings |
| Male | 3,799 (46.5%) | $33,486 |
| Female | 4,370 (53.5%) | $23,548 |
| Total | 8,169 (100.0%) | $28,354 |
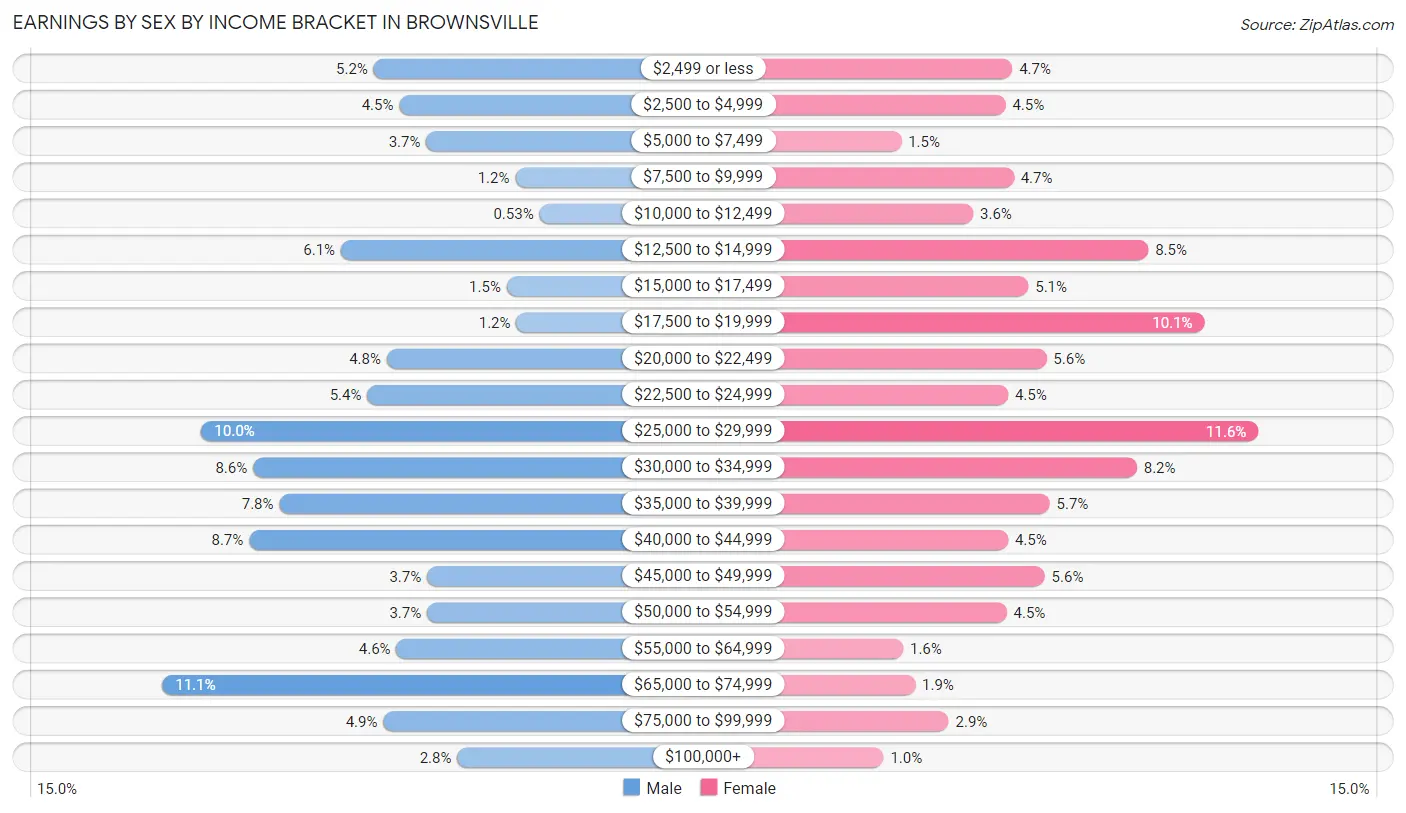
Earnings by Sex by Income Bracket in Brownsville
The most common earnings brackets in Brownsville are $65,000 to $74,999 for men (423 | 11.1%) and $25,000 to $29,999 for women (505 | 11.6%).
| Income | Male | Female |
| $2,499 or less | 197 (5.2%) | 203 (4.6%) |
| $2,500 to $4,999 | 170 (4.5%) | 195 (4.5%) |
| $5,000 to $7,499 | 141 (3.7%) | 67 (1.5%) |
| $7,500 to $9,999 | 46 (1.2%) | 205 (4.7%) |
| $10,000 to $12,499 | 20 (0.5%) | 155 (3.5%) |
| $12,500 to $14,999 | 232 (6.1%) | 370 (8.5%) |
| $15,000 to $17,499 | 55 (1.5%) | 223 (5.1%) |
| $17,500 to $19,999 | 45 (1.2%) | 439 (10.1%) |
| $20,000 to $22,499 | 183 (4.8%) | 245 (5.6%) |
| $22,500 to $24,999 | 204 (5.4%) | 198 (4.5%) |
| $25,000 to $29,999 | 381 (10.0%) | 505 (11.6%) |
| $30,000 to $34,999 | 326 (8.6%) | 356 (8.2%) |
| $35,000 to $39,999 | 298 (7.8%) | 249 (5.7%) |
| $40,000 to $44,999 | 330 (8.7%) | 198 (4.5%) |
| $45,000 to $49,999 | 140 (3.7%) | 243 (5.6%) |
| $50,000 to $54,999 | 140 (3.7%) | 196 (4.5%) |
| $55,000 to $64,999 | 173 (4.5%) | 69 (1.6%) |
| $65,000 to $74,999 | 423 (11.1%) | 84 (1.9%) |
| $75,000 to $99,999 | 187 (4.9%) | 125 (2.9%) |
| $100,000+ | 108 (2.8%) | 45 (1.0%) |
| Total | 3,799 (100.0%) | 4,370 (100.0%) |
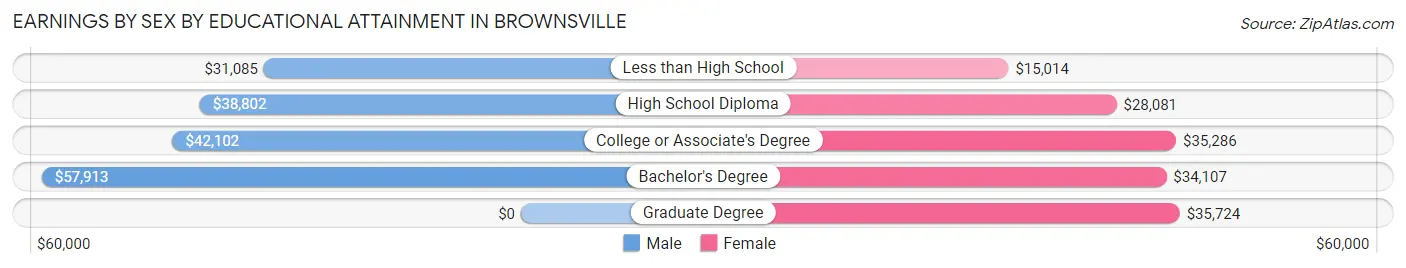
Earnings by Sex by Educational Attainment in Brownsville
Average earnings in Brownsville are $35,850 for men and $26,955 for women, a difference of 24.8%. Men with an educational attainment of bachelor's degree enjoy the highest average annual earnings of $57,913, while those with less than high school education earn the least with $31,085. Women with an educational attainment of graduate degree earn the most with the average annual earnings of $35,724, while those with less than high school education have the smallest earnings of $15,014.
| Educational Attainment | Male Income | Female Income |
| Less than High School | $31,085 | $15,014 |
| High School Diploma | $38,802 | $28,081 |
| College or Associate's Degree | $42,102 | $35,286 |
| Bachelor's Degree | $57,913 | $34,107 |
| Graduate Degree | - | - |
| Total | $35,850 | $26,955 |
Family Income in Brownsville
Family Income Brackets in Brownsville
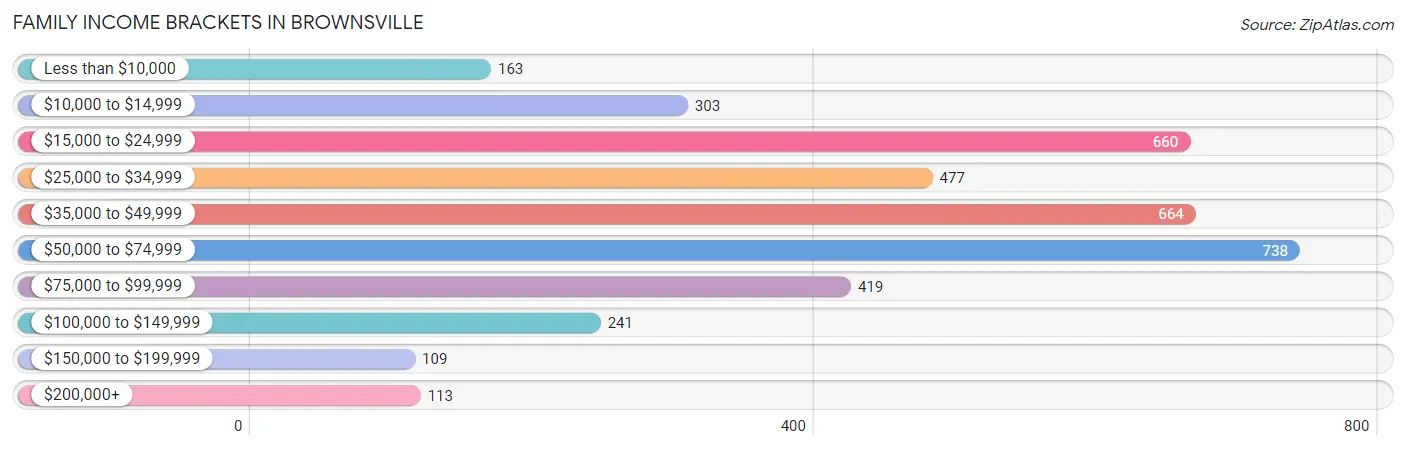
According to the Brownsville family income data, there are 738 families falling into the $50,000 to $74,999 income range, which is the most common income bracket and makes up 19.0% of all families. Conversely, the $150,000 to $199,999 income bracket is the least frequent group with only 109 families (2.8%) belonging to this category.
| Income Bracket | # Families | % Families |
| Less than $10,000 | 163 | 4.2% |
| $10,000 to $14,999 | 303 | 7.8% |
| $15,000 to $24,999 | 660 | 17.0% |
| $25,000 to $34,999 | 477 | 12.3% |
| $35,000 to $49,999 | 664 | 17.1% |
| $50,000 to $74,999 | 738 | 19.0% |
| $75,000 to $99,999 | 419 | 10.8% |
| $100,000 to $149,999 | 241 | 6.2% |
| $150,000 to $199,999 | 109 | 2.8% |
| $200,000+ | 113 | 2.9% |
Family Income by Famaliy Size in Brownsville
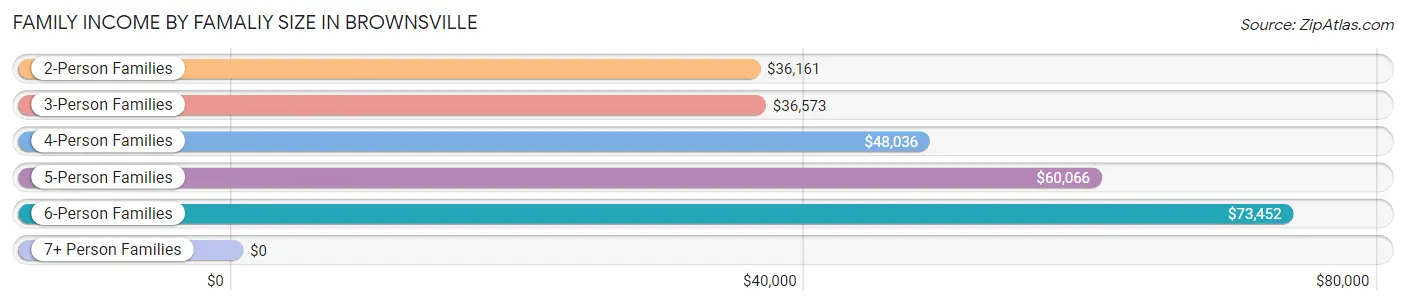
6-person families (206 | 5.3%) account for the highest median family income in Brownsville with $73,452 per family, while 2-person families (1,473 | 37.9%) have the highest median income of $18,080 per family member.
| Income Bracket | # Families | Median Income |
| 2-Person Families | 1,473 (37.9%) | $36,161 |
| 3-Person Families | 985 (25.4%) | $36,573 |
| 4-Person Families | 488 (12.6%) | $48,036 |
| 5-Person Families | 637 (16.4%) | $60,066 |
| 6-Person Families | 206 (5.3%) | $73,452 |
| 7+ Person Families | 93 (2.4%) | $0 |
| Total | 3,882 (100.0%) | $43,590 |
Family Income by Number of Earners in Brownsville
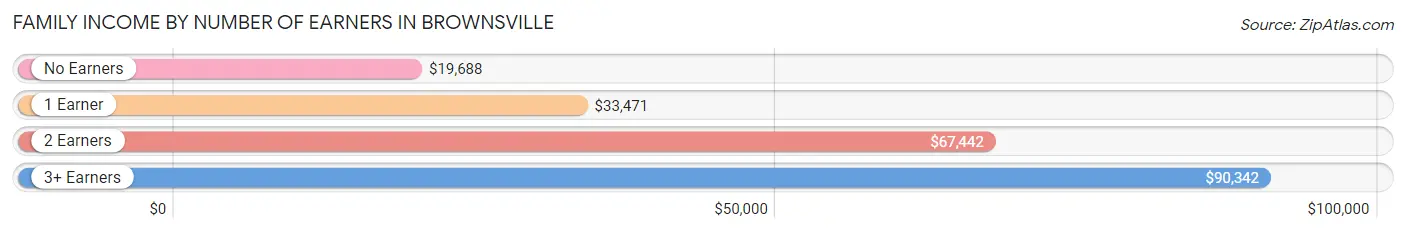
The median family income in Brownsville is $43,590, with families comprising 3+ earners (582) having the highest median family income of $90,342, while families with no earners (746) have the lowest median family income of $19,688, accounting for 15.0% and 19.2% of families, respectively.
| Number of Earners | # Families | Median Income |
| No Earners | 746 (19.2%) | $19,688 |
| 1 Earner | 1,238 (31.9%) | $33,471 |
| 2 Earners | 1,316 (33.9%) | $67,442 |
| 3+ Earners | 582 (15.0%) | $90,342 |
| Total | 3,882 (100.0%) | $43,590 |
Household Income in Brownsville
Household Income Brackets in Brownsville
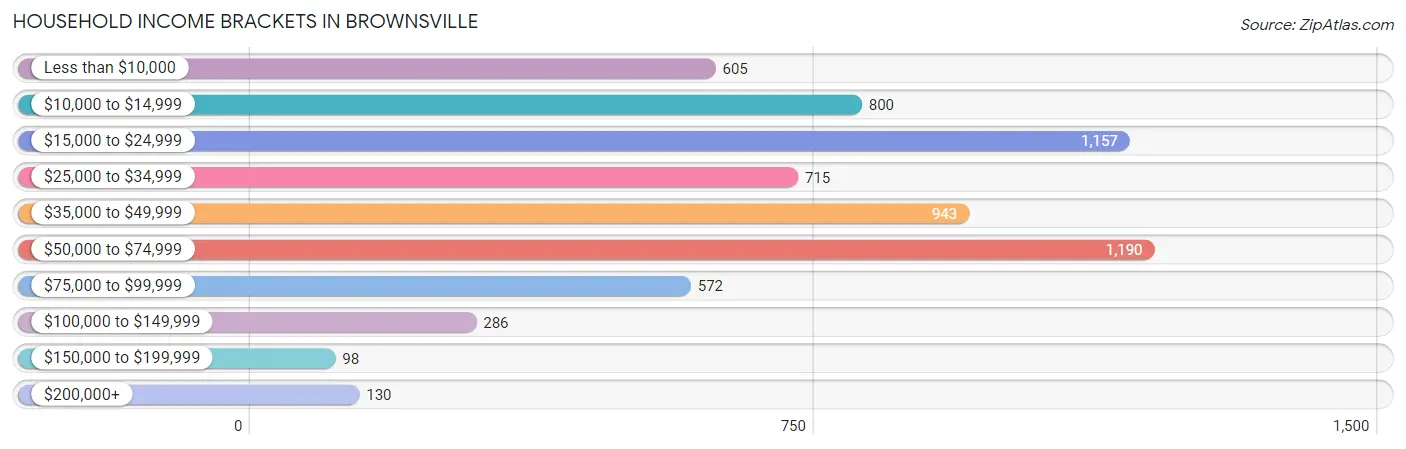
With 1,190 households falling in the category, the $50,000 to $74,999 income range is the most frequent in Brownsville, accounting for 18.3% of all households. In contrast, only 98 households (1.5%) fall into the $150,000 to $199,999 income bracket, making it the least populous group.
| Income Bracket | # Households | % Households |
| Less than $10,000 | 605 | 9.3% |
| $10,000 to $14,999 | 800 | 12.3% |
| $15,000 to $24,999 | 1,157 | 17.8% |
| $25,000 to $34,999 | 715 | 11.0% |
| $35,000 to $49,999 | 943 | 14.5% |
| $50,000 to $74,999 | 1,190 | 18.3% |
| $75,000 to $99,999 | 572 | 8.8% |
| $100,000 to $149,999 | 286 | 4.4% |
| $150,000 to $199,999 | 98 | 1.5% |
| $200,000+ | 130 | 2.0% |
Household Income by Householder Age in Brownsville
The median household income in Brownsville is $34,779, with the highest median household income of $47,912 found in the 45 to 64 years age bracket for the primary householder. A total of 3,086 households (47.5%) fall into this category. Meanwhile, the 65+ years age bracket for the primary householder has the lowest median household income of $16,112, with 1,756 households (27.0%) in this group.
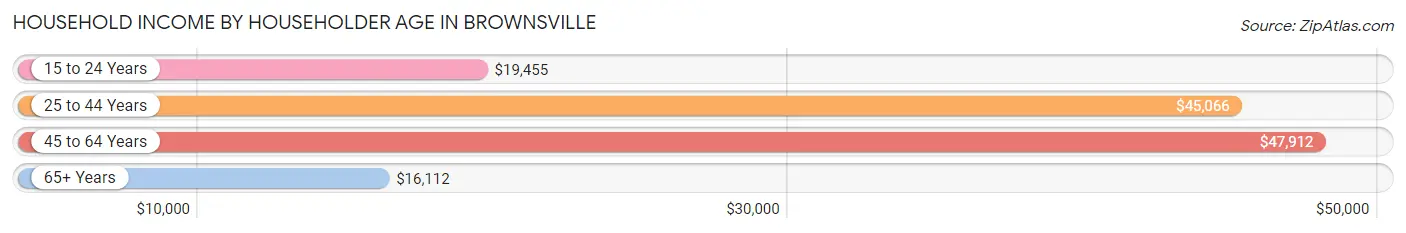
| Income Bracket | # Households | Median Income |
| 15 to 24 Years | 269 (4.1%) | $19,455 |
| 25 to 44 Years | 1,390 (21.4%) | $45,066 |
| 45 to 64 Years | 3,086 (47.5%) | $47,912 |
| 65+ Years | 1,756 (27.0%) | $16,112 |
| Total | 6,501 (100.0%) | $34,779 |
Poverty in Brownsville
Income Below Poverty by Sex and Age in Brownsville
With 30.1% poverty level for males and 29.3% for females among the residents of Brownsville, 15 year old males and 5 year old females are the most vulnerable to poverty, with 9 males (75.0%) and 53 females (91.4%) in their respective age groups living below the poverty level.
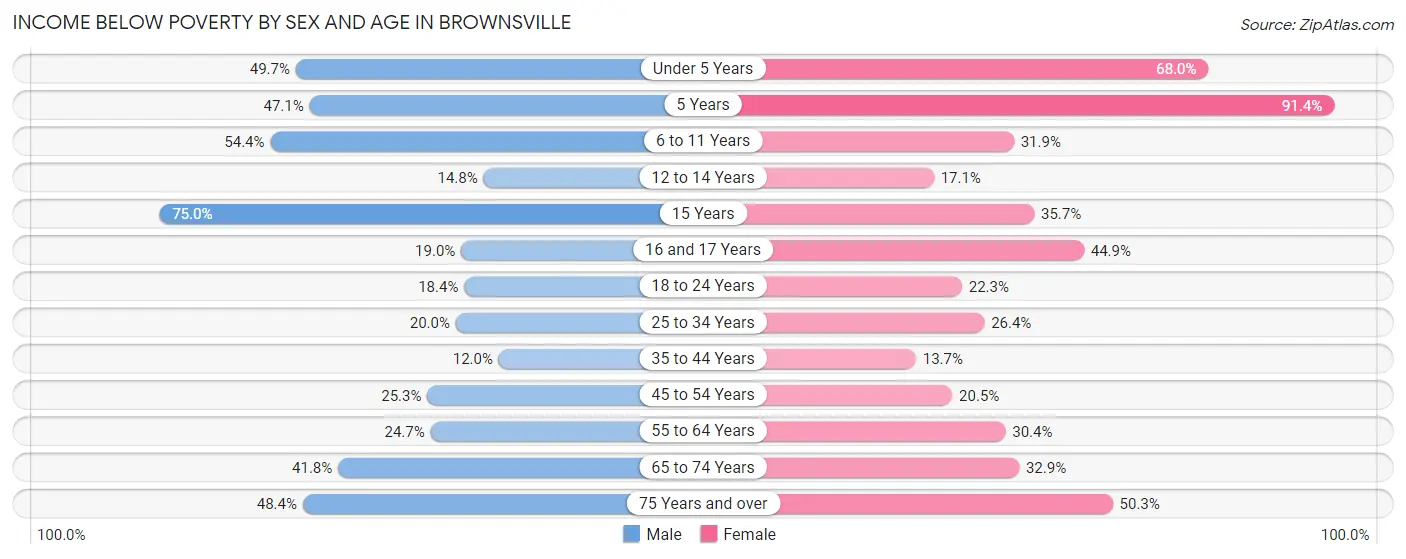
| Age Bracket | Male | Female |
| Under 5 Years | 218 (49.7%) | 315 (68.0%) |
| 5 Years | 57 (47.1%) | 53 (91.4%) |
| 6 to 11 Years | 677 (54.4%) | 195 (31.9%) |
| 12 to 14 Years | 60 (14.8%) | 43 (17.1%) |
| 15 Years | 9 (75.0%) | 66 (35.7%) |
| 16 and 17 Years | 44 (19.0%) | 106 (44.9%) |
| 18 to 24 Years | 145 (18.4%) | 233 (22.3%) |
| 25 to 34 Years | 186 (20.0%) | 295 (26.4%) |
| 35 to 44 Years | 118 (12.0%) | 166 (13.7%) |
| 45 to 54 Years | 319 (25.3%) | 257 (20.5%) |
| 55 to 64 Years | 332 (24.6%) | 322 (30.3%) |
| 65 to 74 Years | 319 (41.8%) | 249 (32.9%) |
| 75 Years and over | 221 (48.4%) | 281 (50.3%) |
| Total | 2,705 (30.1%) | 2,581 (29.3%) |
Income Above Poverty by Sex and Age in Brownsville
According to the poverty statistics in Brownsville, males aged 35 to 44 years and females aged 35 to 44 years are the age groups that are most secure financially, with 88.0% of males and 86.3% of females in these age groups living above the poverty line.
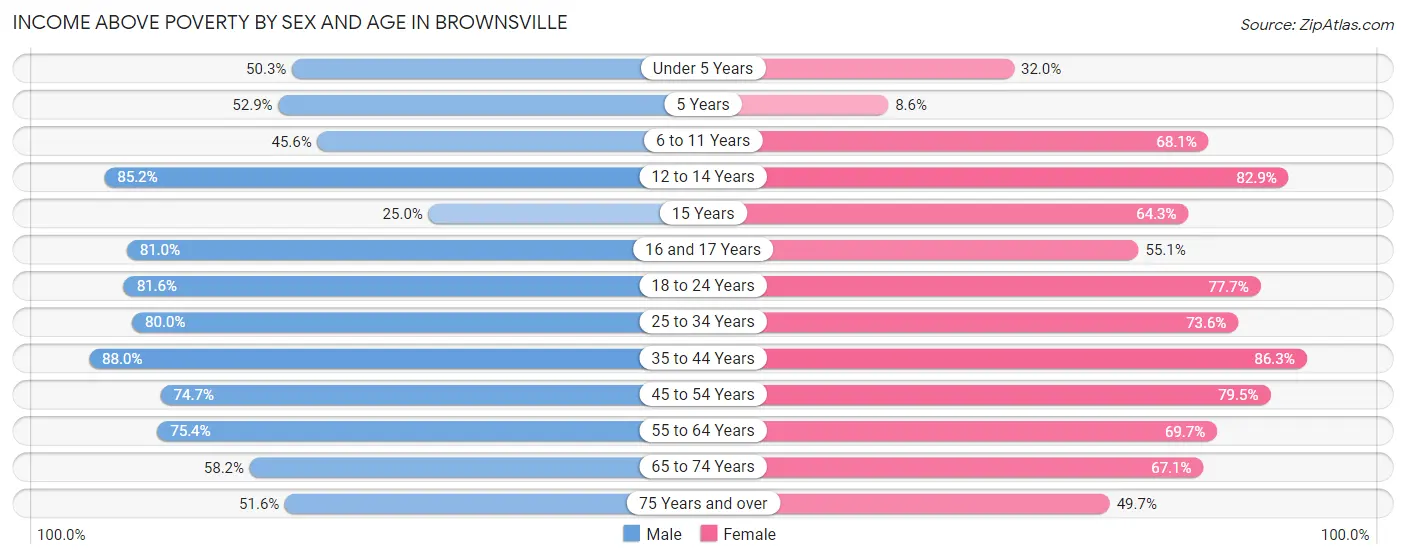
| Age Bracket | Male | Female |
| Under 5 Years | 221 (50.3%) | 148 (32.0%) |
| 5 Years | 64 (52.9%) | 5 (8.6%) |
| 6 to 11 Years | 568 (45.6%) | 416 (68.1%) |
| 12 to 14 Years | 345 (85.2%) | 209 (82.9%) |
| 15 Years | 3 (25.0%) | 119 (64.3%) |
| 16 and 17 Years | 188 (81.0%) | 130 (55.1%) |
| 18 to 24 Years | 643 (81.6%) | 813 (77.7%) |
| 25 to 34 Years | 746 (80.0%) | 821 (73.6%) |
| 35 to 44 Years | 867 (88.0%) | 1,042 (86.3%) |
| 45 to 54 Years | 944 (74.7%) | 998 (79.5%) |
| 55 to 64 Years | 1,015 (75.3%) | 739 (69.7%) |
| 65 to 74 Years | 444 (58.2%) | 508 (67.1%) |
| 75 Years and over | 236 (51.6%) | 278 (49.7%) |
| Total | 6,284 (69.9%) | 6,226 (70.7%) |
Income Below Poverty Among Married-Couple Families in Brownsville
The poverty statistics for married-couple families in Brownsville show that 14.5% or 217 of the total 1,493 families live below the poverty line. Families with 5 or more children have the highest poverty rate of 100.0%, comprising of 6 families. On the other hand, families with 1 or 2 children have the lowest poverty rate of 6.3%, which includes 31 families.
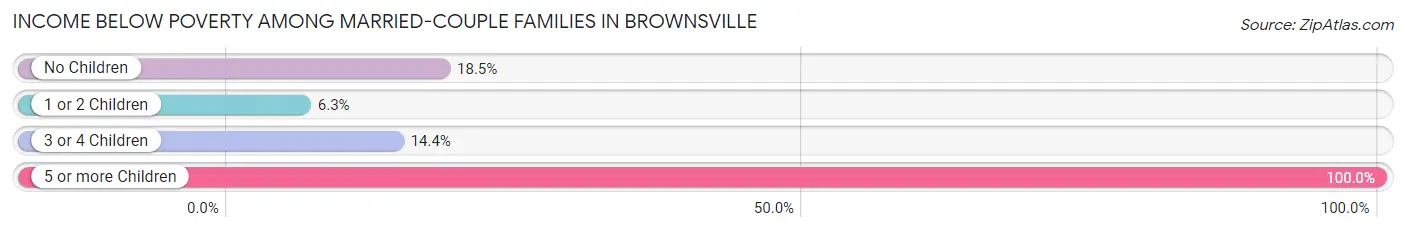
| Children | Above Poverty | Below Poverty |
| No Children | 729 (81.5%) | 165 (18.5%) |
| 1 or 2 Children | 458 (93.7%) | 31 (6.3%) |
| 3 or 4 Children | 89 (85.6%) | 15 (14.4%) |
| 5 or more Children | 0 (0.0%) | 6 (100.0%) |
| Total | 1,276 (85.5%) | 217 (14.5%) |
Income Below Poverty Among Single-Parent Households in Brownsville
According to the poverty data in Brownsville, 30.1% or 206 single-father households and 33.2% or 565 single-mother households are living below the poverty line. Among single-father households, those with 1 or 2 children have the highest poverty rate, with 155 households (40.4%) experiencing poverty. Likewise, among single-mother households, those with 5 or more children have the highest poverty rate, with 116 households (99.2%) falling below the poverty line.
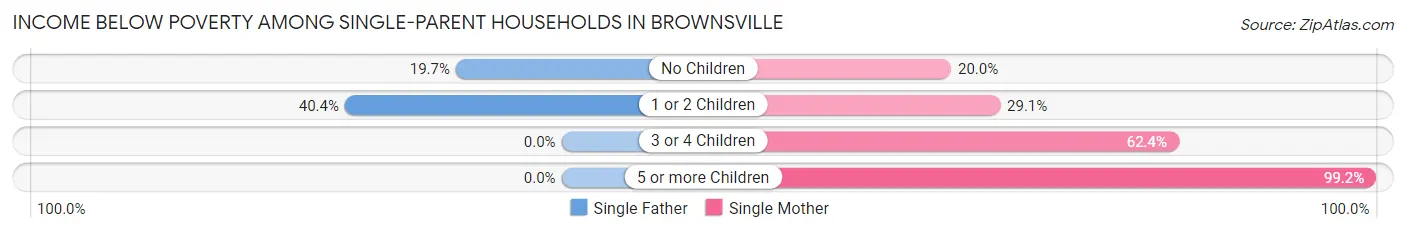
| Children | Single Father | Single Mother |
| No Children | 51 (19.7%) | 138 (20.0%) |
| 1 or 2 Children | 155 (40.4%) | 218 (29.1%) |
| 3 or 4 Children | 0 (0.0%) | 93 (62.4%) |
| 5 or more Children | 0 (0.0%) | 116 (99.2%) |
| Total | 206 (30.1%) | 565 (33.2%) |
Income Below Poverty Among Married-Couple vs Single-Parent Households in Brownsville
The poverty data for Brownsville shows that 217 of the married-couple family households (14.5%) and 771 of the single-parent households (32.3%) are living below the poverty level. Within the married-couple family households, those with 5 or more children have the highest poverty rate, with 6 households (100.0%) falling below the poverty line. Among the single-parent households, those with 5 or more children have the highest poverty rate, with 116 household (99.2%) living below poverty.
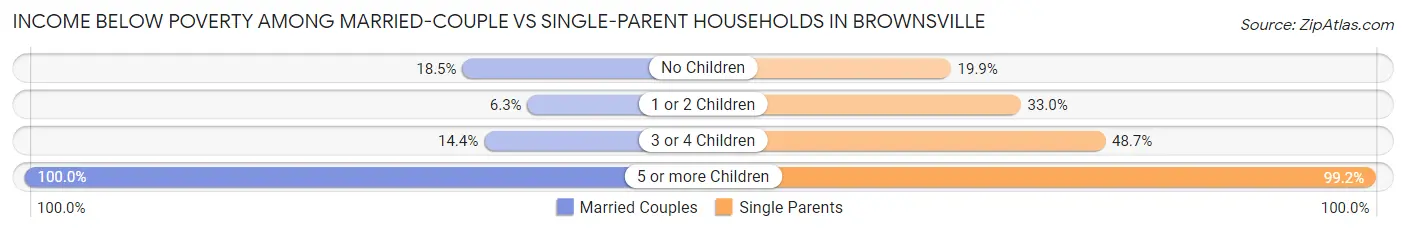
| Children | Married-Couple Families | Single-Parent Households |
| No Children | 165 (18.5%) | 189 (19.9%) |
| 1 or 2 Children | 31 (6.3%) | 373 (33.0%) |
| 3 or 4 Children | 15 (14.4%) | 93 (48.7%) |
| 5 or more Children | 6 (100.0%) | 116 (99.2%) |
| Total | 217 (14.5%) | 771 (32.3%) |
Race in Brownsville
The most populous races in Brownsville are Black / African American (8,919 | 50.1%), Hispanic or Latino (8,769 | 49.2%), and White / Caucasian (3,655 | 20.5%).
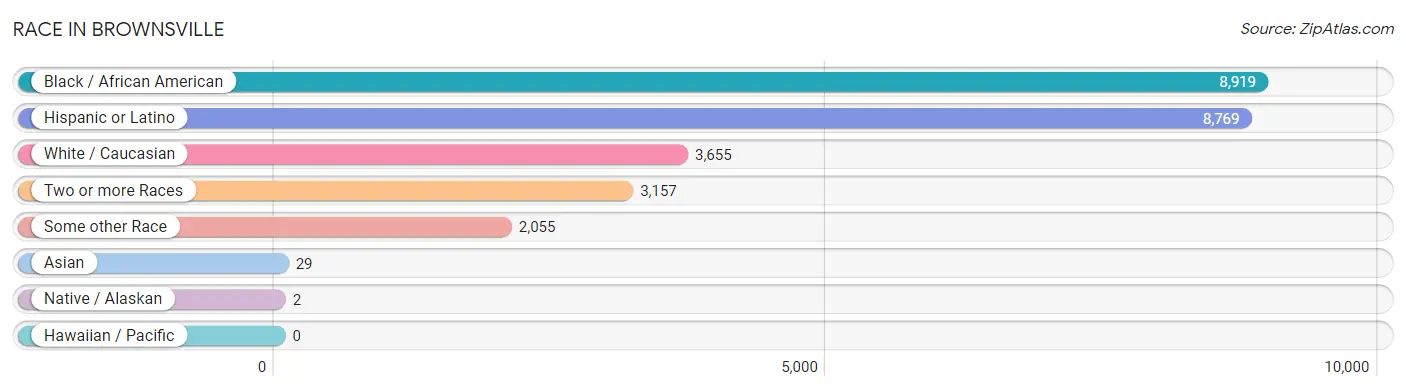
| Race | # Population | % Population |
| Asian | 29 | 0.2% |
| Black / African American | 8,919 | 50.1% |
| Hawaiian / Pacific | 0 | 0.0% |
| Hispanic or Latino | 8,769 | 49.2% |
| Native / Alaskan | 2 | 0.0% |
| White / Caucasian | 3,655 | 20.5% |
| Two or more Races | 3,157 | 17.7% |
| Some other Race | 2,055 | 11.5% |
| Total | 17,817 | 100.0% |
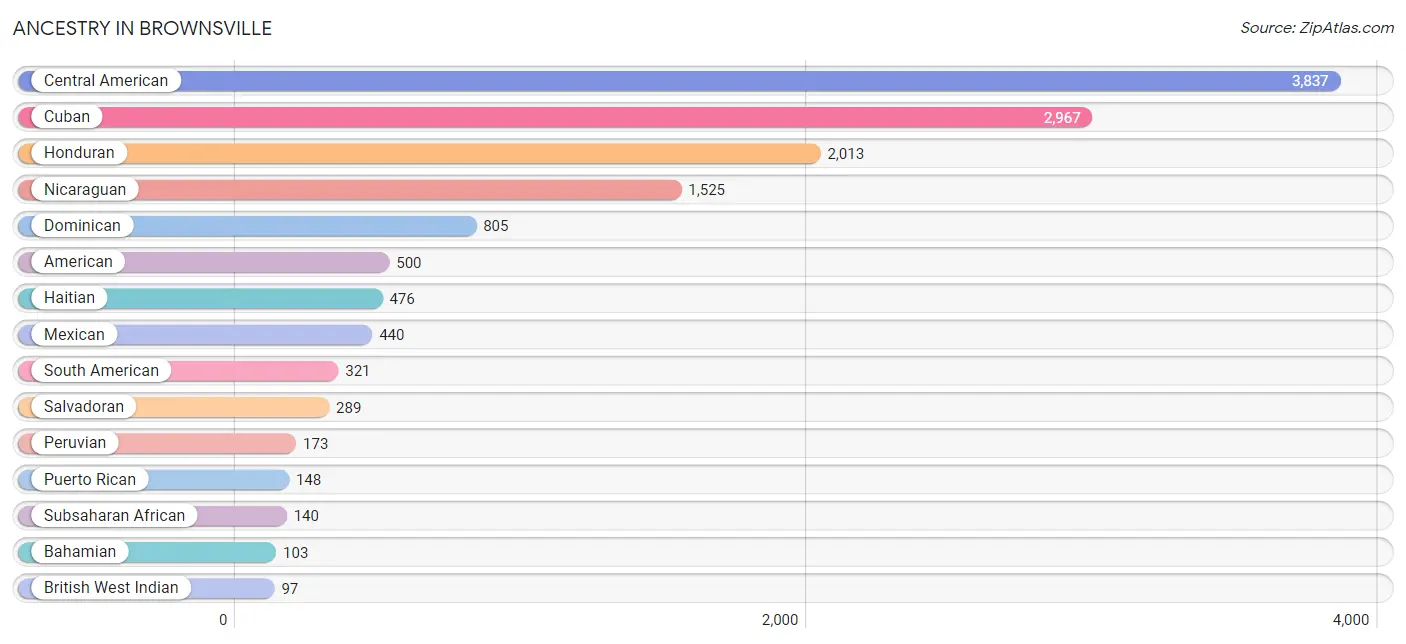
Ancestry in Brownsville
The most populous ancestries reported in Brownsville are Central American (3,837 | 21.5%), Cuban (2,967 | 16.7%), Honduran (2,013 | 11.3%), Nicaraguan (1,525 | 8.6%), and Dominican (805 | 4.5%), together accounting for 62.6% of all Brownsville residents.
| Ancestry | # Population | % Population |
| African | 87 | 0.5% |
| American | 500 | 2.8% |
| Bahamian | 103 | 0.6% |
| Brazilian | 23 | 0.1% |
| British West Indian | 97 | 0.5% |
| Burmese | 12 | 0.1% |
| Central American | 3,837 | 21.5% |
| Central American Indian | 11 | 0.1% |
| Cherokee | 3 | 0.0% |
| Colombian | 57 | 0.3% |
| Cuban | 2,967 | 16.7% |
| Dominican | 805 | 4.5% |
| Ecuadorian | 7 | 0.0% |
| English | 14 | 0.1% |
| Filipino | 4 | 0.0% |
| French | 19 | 0.1% |
| German | 31 | 0.2% |
| Guatemalan | 10 | 0.1% |
| Haitian | 476 | 2.7% |
| Honduran | 2,013 | 11.3% |
| Indonesian | 13 | 0.1% |
| Irish | 11 | 0.1% |
| Italian | 57 | 0.3% |
| Jamaican | 73 | 0.4% |
| Mexican | 440 | 2.5% |
| Nicaraguan | 1,525 | 8.6% |
| Nigerian | 11 | 0.1% |
| Pennsylvania German | 17 | 0.1% |
| Peruvian | 173 | 1.0% |
| Polish | 24 | 0.1% |
| Portuguese | 13 | 0.1% |
| Puerto Rican | 148 | 0.8% |
| Russian | 7 | 0.0% |
| Salvadoran | 289 | 1.6% |
| Senegalese | 26 | 0.2% |
| South American | 321 | 1.8% |
| Spaniard | 16 | 0.1% |
| Subsaharan African | 140 | 0.8% |
| U.S. Virgin Islander | 55 | 0.3% |
| Uruguayan | 56 | 0.3% |
| Venezuelan | 28 | 0.2% | View All 41 Rows |
Immigrants in Brownsville
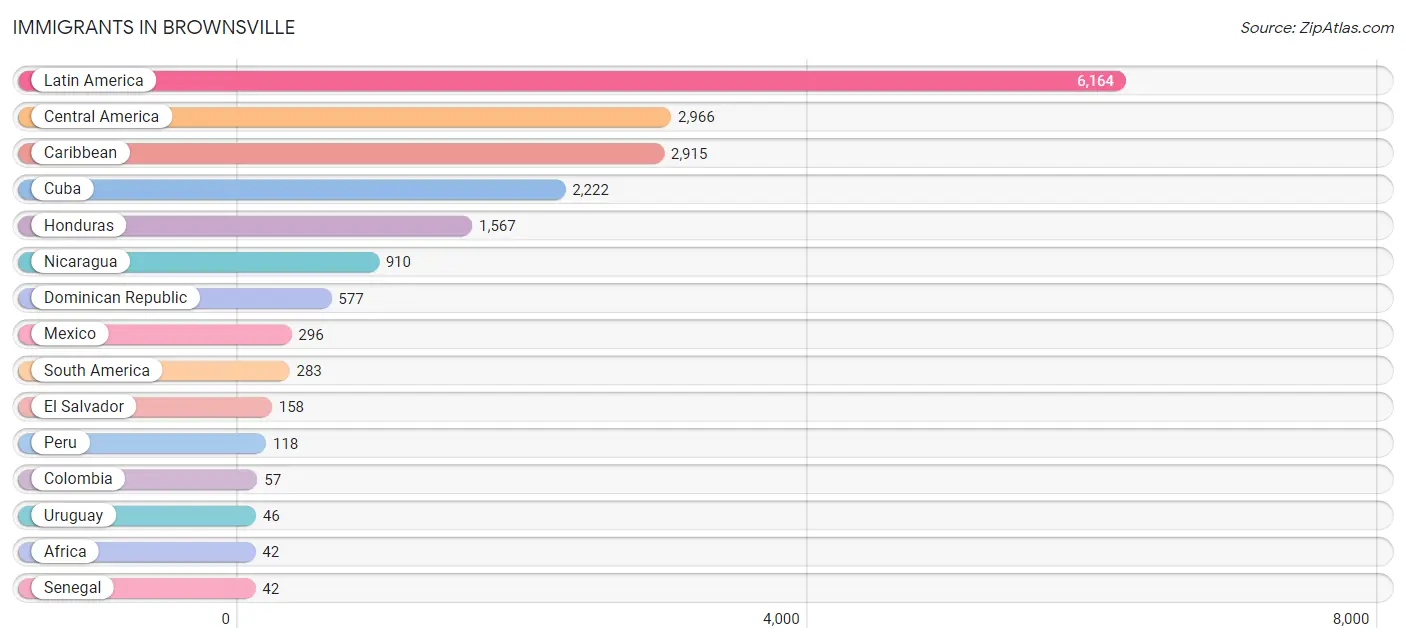
The most numerous immigrant groups reported in Brownsville came from Latin America (6,164 | 34.6%), Central America (2,966 | 16.7%), Caribbean (2,915 | 16.4%), Cuba (2,222 | 12.5%), and Honduras (1,567 | 8.8%), together accounting for 88.9% of all Brownsville residents.
| Immigration Origin | # Population | % Population |
| Africa | 42 | 0.2% |
| Asia | 33 | 0.2% |
| Bahamas | 22 | 0.1% |
| Brazil | 27 | 0.2% |
| Caribbean | 2,915 | 16.4% |
| Central America | 2,966 | 16.7% |
| Colombia | 57 | 0.3% |
| Cuba | 2,222 | 12.5% |
| Dominican Republic | 577 | 3.2% |
| Eastern Asia | 12 | 0.1% |
| Eastern Europe | 11 | 0.1% |
| Ecuador | 7 | 0.0% |
| El Salvador | 158 | 0.9% |
| Europe | 11 | 0.1% |
| Guatemala | 10 | 0.1% |
| Haiti | 32 | 0.2% |
| Honduras | 1,567 | 8.8% |
| Korea | 12 | 0.1% |
| Latin America | 6,164 | 34.6% |
| Mexico | 296 | 1.7% |
| Nicaragua | 910 | 5.1% |
| Peru | 118 | 0.7% |
| Russia | 11 | 0.1% |
| Senegal | 42 | 0.2% |
| Singapore | 8 | 0.0% |
| South America | 283 | 1.6% |
| South Eastern Asia | 21 | 0.1% |
| Uruguay | 46 | 0.3% |
| Venezuela | 28 | 0.2% |
| Western Africa | 42 | 0.2% | View All 30 Rows |
Sex and Age in Brownsville
Sex and Age in Brownsville
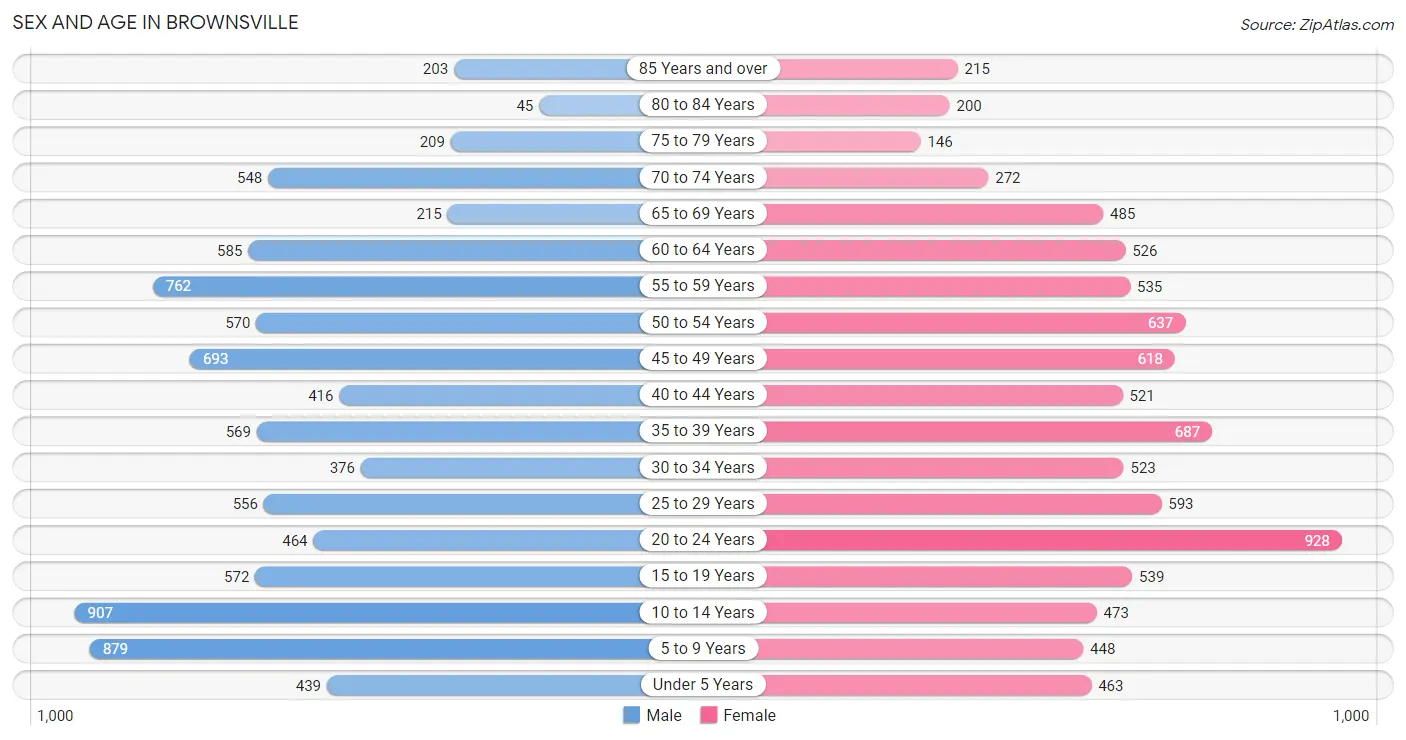
The most populous age groups in Brownsville are 10 to 14 Years (907 | 10.1%) for men and 20 to 24 Years (928 | 10.5%) for women.
| Age Bracket | Male | Female |
| Under 5 Years | 439 (4.9%) | 463 (5.3%) |
| 5 to 9 Years | 879 (9.8%) | 448 (5.1%) |
| 10 to 14 Years | 907 (10.1%) | 473 (5.4%) |
| 15 to 19 Years | 572 (6.4%) | 539 (6.1%) |
| 20 to 24 Years | 464 (5.1%) | 928 (10.5%) |
| 25 to 29 Years | 556 (6.2%) | 593 (6.7%) |
| 30 to 34 Years | 376 (4.2%) | 523 (5.9%) |
| 35 to 39 Years | 569 (6.3%) | 687 (7.8%) |
| 40 to 44 Years | 416 (4.6%) | 521 (5.9%) |
| 45 to 49 Years | 693 (7.7%) | 618 (7.0%) |
| 50 to 54 Years | 570 (6.3%) | 637 (7.2%) |
| 55 to 59 Years | 762 (8.5%) | 535 (6.1%) |
| 60 to 64 Years | 585 (6.5%) | 526 (6.0%) |
| 65 to 69 Years | 215 (2.4%) | 485 (5.5%) |
| 70 to 74 Years | 548 (6.1%) | 272 (3.1%) |
| 75 to 79 Years | 209 (2.3%) | 146 (1.7%) |
| 80 to 84 Years | 45 (0.5%) | 200 (2.3%) |
| 85 Years and over | 203 (2.2%) | 215 (2.4%) |
| Total | 9,008 (100.0%) | 8,809 (100.0%) |
Families and Households in Brownsville
Median Family Size in Brownsville
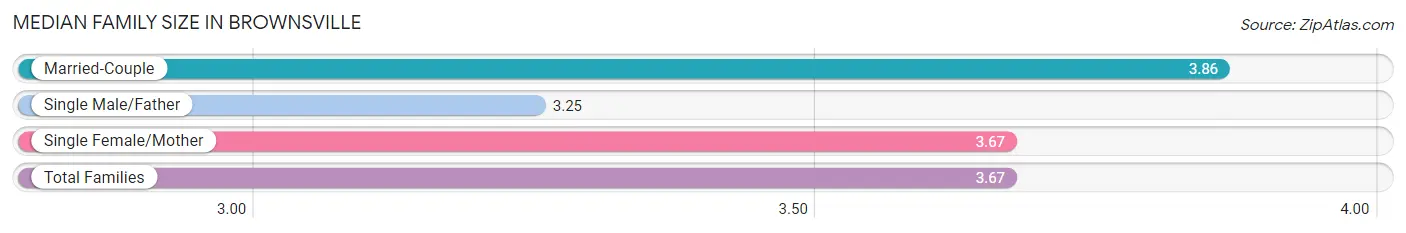
The median family size in Brownsville is 3.67 persons per family, with married-couple families (1,493 | 38.5%) accounting for the largest median family size of 3.86 persons per family. On the other hand, single male/father families (685 | 17.6%) represent the smallest median family size with 3.25 persons per family.
| Family Type | # Families | Family Size |
| Married-Couple | 1,493 (38.5%) | 3.86 |
| Single Male/Father | 685 (17.6%) | 3.25 |
| Single Female/Mother | 1,704 (43.9%) | 3.67 |
| Total Families | 3,882 (100.0%) | 3.67 |
Median Household Size in Brownsville
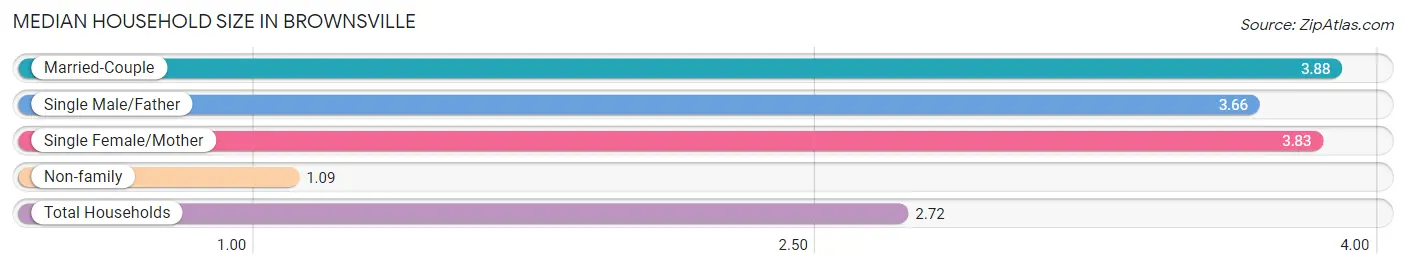
The median household size in Brownsville is 2.72 persons per household, with married-couple households (1,493 | 23.0%) accounting for the largest median household size of 3.88 persons per household. non-family households (2,619 | 40.3%) represent the smallest median household size with 1.09 persons per household.
| Household Type | # Households | Household Size |
| Married-Couple | 1,493 (23.0%) | 3.88 |
| Single Male/Father | 685 (10.5%) | 3.66 |
| Single Female/Mother | 1,704 (26.2%) | 3.83 |
| Non-family | 2,619 (40.3%) | 1.09 |
| Total Households | 6,501 (100.0%) | 2.72 |
Household Size by Marriage Status in Brownsville
Out of a total of 6,501 households in Brownsville, 3,882 (59.7%) are family households, while 2,619 (40.3%) are nonfamily households. The most numerous type of family households are 2-person households, comprising 1,323, and the most common type of nonfamily households are 1-person households, comprising 2,449.
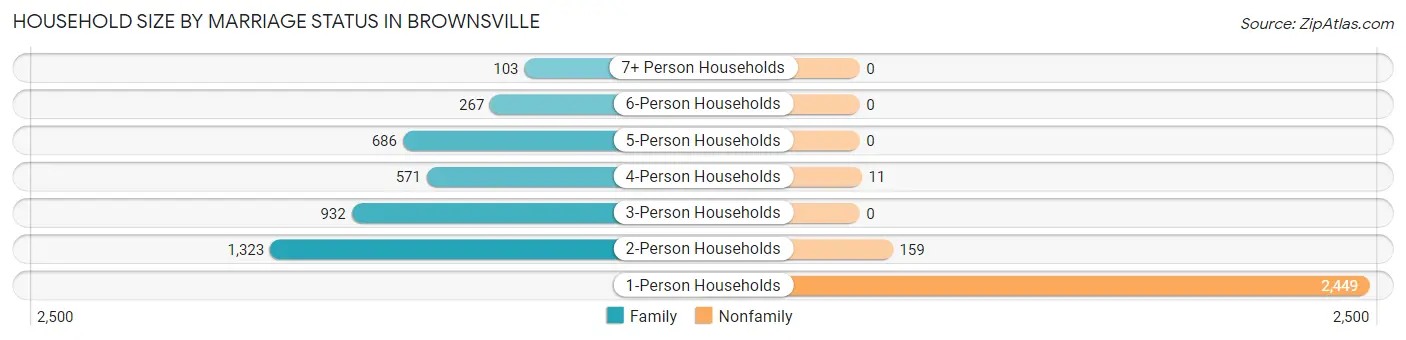
| Household Size | Family Households | Nonfamily Households |
| 1-Person Households | - | 2,449 (37.7%) |
| 2-Person Households | 1,323 (20.3%) | 159 (2.5%) |
| 3-Person Households | 932 (14.3%) | 0 (0.0%) |
| 4-Person Households | 571 (8.8%) | 11 (0.2%) |
| 5-Person Households | 686 (10.5%) | 0 (0.0%) |
| 6-Person Households | 267 (4.1%) | 0 (0.0%) |
| 7+ Person Households | 103 (1.6%) | 0 (0.0%) |
| Total | 3,882 (59.7%) | 2,619 (40.3%) |
Female Fertility in Brownsville
Fertility by Age in Brownsville
Average fertility rate in Brownsville is 33.0 births per 1,000 women. Women in the age bracket of 20 to 34 years have the highest fertility rate with 53.0 births per 1,000 women. Women in the age bracket of 20 to 34 years acount for 71.1% of all women with births.
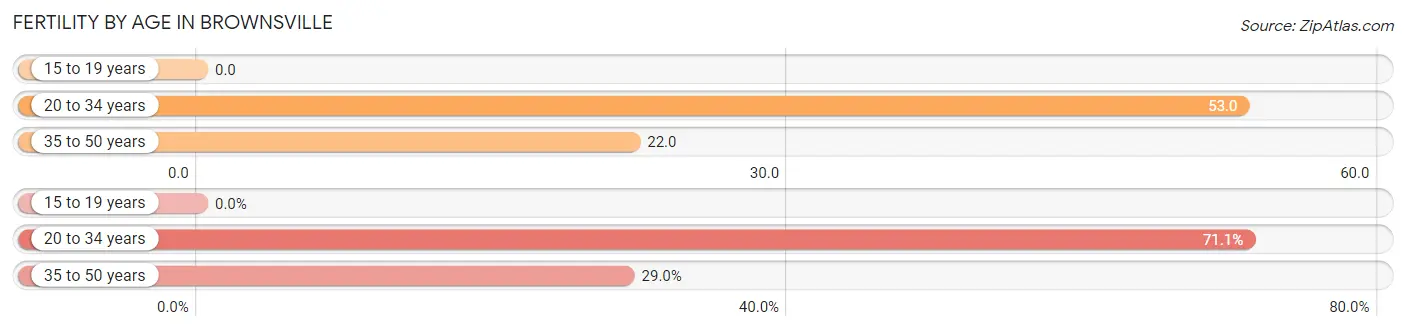
| Age Bracket | Women with Births | Births / 1,000 Women |
| 15 to 19 years | 0 (0.0%) | 0.0 |
| 20 to 34 years | 108 (71.1%) | 53.0 |
| 35 to 50 years | 44 (28.9%) | 22.0 |
| Total | 152 (100.0%) | 33.0 |
Fertility by Age by Marriage Status in Brownsville
13.8% of women with births (152) in Brownsville are married. The highest percentage of unmarried women with births falls into 20 to 34 years age bracket with 100.0% of them unmarried at the time of birth, while the lowest percentage of unmarried women with births belong to 35 to 50 years age bracket with 52.3% of them unmarried.
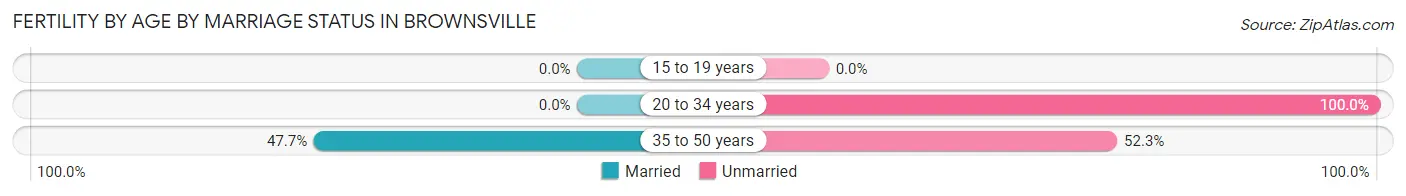
| Age Bracket | Married | Unmarried |
| 15 to 19 years | 0 (0.0%) | 0 (0.0%) |
| 20 to 34 years | 0 (0.0%) | 108 (100.0%) |
| 35 to 50 years | 21 (47.7%) | 23 (52.3%) |
| Total | 21 (13.8%) | 131 (86.2%) |
Fertility by Education in Brownsville
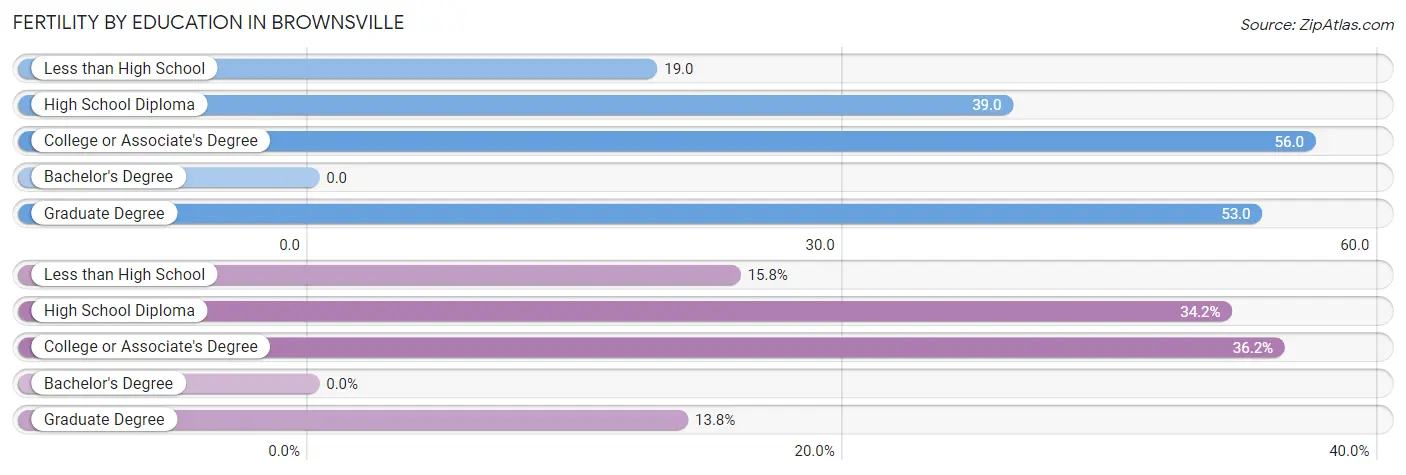
| Educational Attainment | Women with Births | Births / 1,000 Women |
| Less than High School | 24 (15.8%) | 19.0 |
| High School Diploma | 52 (34.2%) | 39.0 |
| College or Associate's Degree | 55 (36.2%) | 56.0 |
| Bachelor's Degree | 0 (0.0%) | 0.0 |
| Graduate Degree | 21 (13.8%) | 53.0 |
| Total | 152 (100.0%) | 33.0 |
Fertility by Education by Marriage Status in Brownsville
86.2% of women with births in Brownsville are unmarried. Women with the educational attainment of graduate degree are most likely to be married with 100.0% of them married at childbirth, while women with the educational attainment of less than high school are least likely to be married with 100.0% of them unmarried at childbirth.
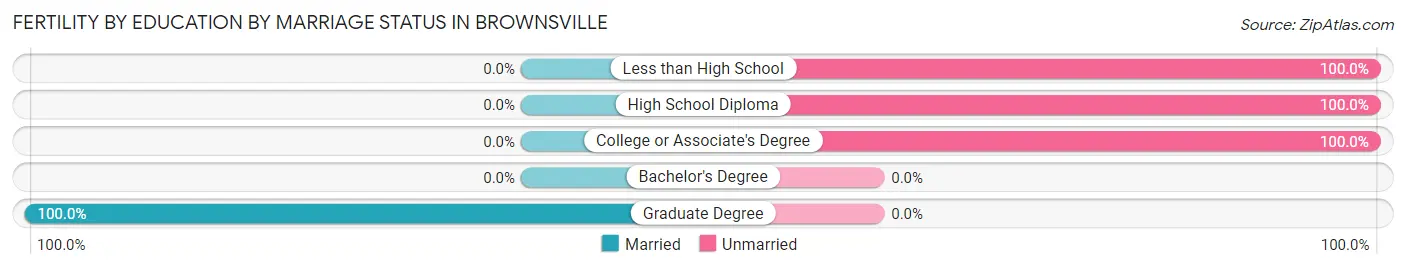
| Educational Attainment | Married | Unmarried |
| Less than High School | 0 (0.0%) | 24 (100.0%) |
| High School Diploma | 0 (0.0%) | 52 (100.0%) |
| College or Associate's Degree | 0 (0.0%) | 55 (100.0%) |
| Bachelor's Degree | 0 (0.0%) | 0 (0.0%) |
| Graduate Degree | 21 (100.0%) | 0 (0.0%) |
| Total | 21 (13.8%) | 131 (86.2%) |
Employment Characteristics in Brownsville
Employment by Class of Employer in Brownsville
Among the 7,595 employed individuals in Brownsville, private company employees (5,363 | 70.6%), local government employees (604 | 8.0%), and self-employed (incorporated) (429 | 5.7%) make up the most common classes of employment.
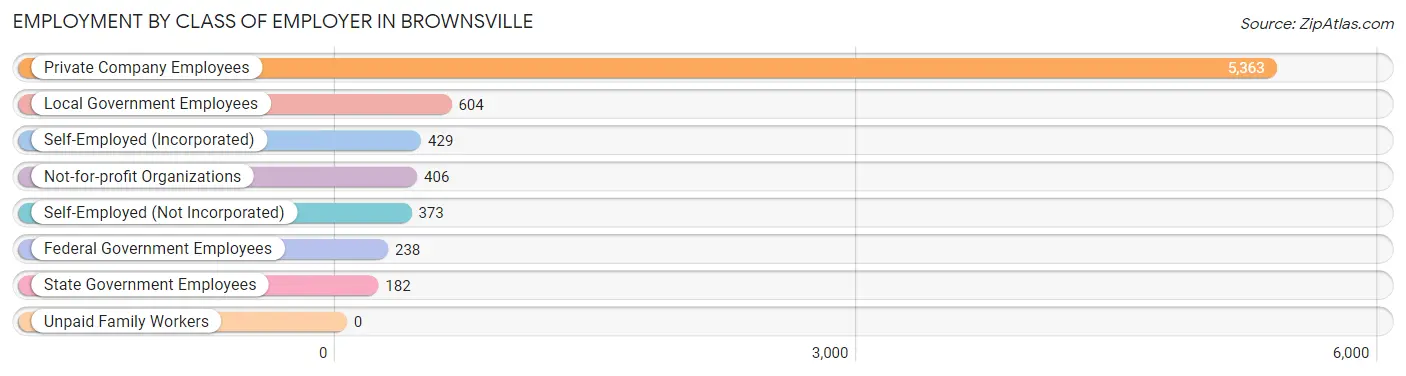
| Employer Class | # Employees | % Employees |
| Private Company Employees | 5,363 | 70.6% |
| Self-Employed (Incorporated) | 429 | 5.7% |
| Self-Employed (Not Incorporated) | 373 | 4.9% |
| Not-for-profit Organizations | 406 | 5.3% |
| Local Government Employees | 604 | 8.0% |
| State Government Employees | 182 | 2.4% |
| Federal Government Employees | 238 | 3.1% |
| Unpaid Family Workers | 0 | 0.0% |
| Total | 7,595 | 100.0% |
Employment Status by Age in Brownsville
According to the labor force statistics for Brownsville, out of the total population over 16 years of age (14,011), 59.1% or 8,281 individuals are in the labor force, with 7.5% or 621 of them unemployed. The age group with the highest labor force participation rate is 30 to 34 years, with 85.4% or 768 individuals in the labor force. Within the labor force, the 16 to 19 years age range has the highest percentage of unemployed individuals, with 50.4% or 58 of them being unemployed.
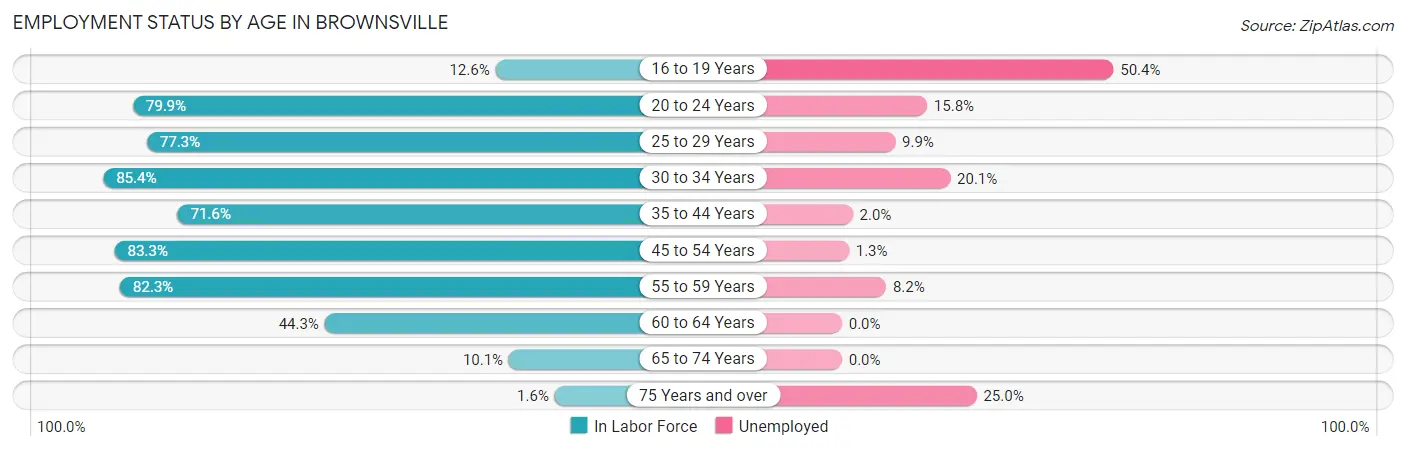
| Age Bracket | In Labor Force | Unemployed |
| 16 to 19 Years | 115 (12.6%) | 58 (50.4%) |
| 20 to 24 Years | 1,112 (79.9%) | 176 (15.8%) |
| 25 to 29 Years | 888 (77.3%) | 88 (9.9%) |
| 30 to 34 Years | 768 (85.4%) | 154 (20.1%) |
| 35 to 44 Years | 1,570 (71.6%) | 31 (2.0%) |
| 45 to 54 Years | 2,097 (83.3%) | 27 (1.3%) |
| 55 to 59 Years | 1,067 (82.3%) | 87 (8.2%) |
| 60 to 64 Years | 492 (44.3%) | 0 (0.0%) |
| 65 to 74 Years | 154 (10.1%) | 0 (0.0%) |
| 75 Years and over | 16 (1.6%) | 4 (25.0%) |
| Total | 8,281 (59.1%) | 621 (7.5%) |
Employment Status by Educational Attainment in Brownsville
According to labor force statistics for Brownsville, 75.1% of individuals (6,884) out of the total population between 25 and 64 years of age (9,167) are in the labor force, with 5.6% or 386 of them being unemployed. The group with the highest labor force participation rate are those with the educational attainment of bachelor's degree or higher, with 88.9% or 1,229 individuals in the labor force. Within the labor force, individuals with high school diploma education have the highest percentage of unemployment, with 7.9% or 171 of them being unemployed.
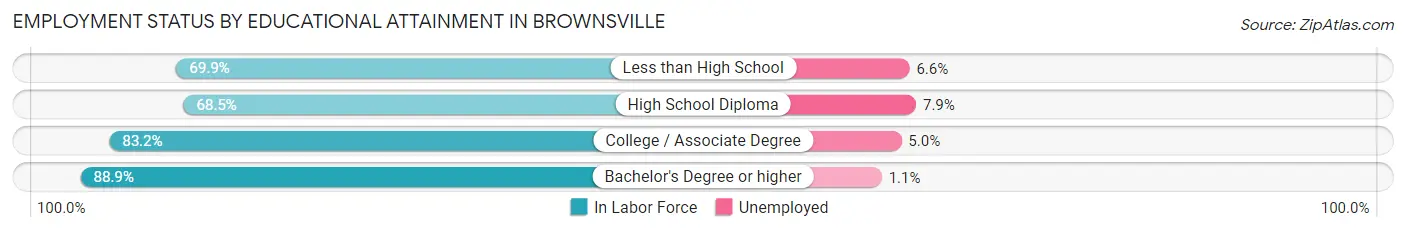
| Educational Attainment | In Labor Force | Unemployed |
| Less than High School | 1,877 (69.9%) | 177 (6.6%) |
| High School Diploma | 2,168 (68.5%) | 250 (7.9%) |
| College / Associate Degree | 1,609 (83.2%) | 97 (5.0%) |
| Bachelor's Degree or higher | 1,229 (88.9%) | 15 (1.1%) |
| Total | 6,884 (75.1%) | 513 (5.6%) |
Employment Occupations by Sex in Brownsville
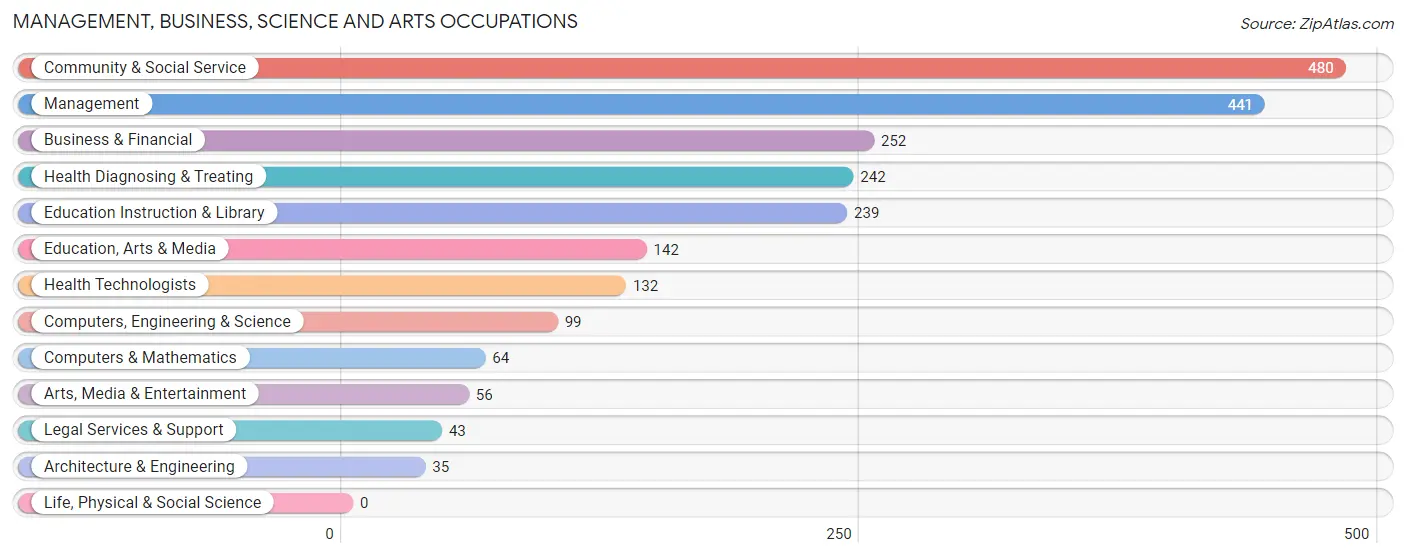
Management, Business, Science and Arts Occupations
The most common Management, Business, Science and Arts occupations in Brownsville are Community & Social Service (480 | 6.3%), Management (441 | 5.8%), Business & Financial (252 | 3.3%), Health Diagnosing & Treating (242 | 3.2%), and Education Instruction & Library (239 | 3.1%).
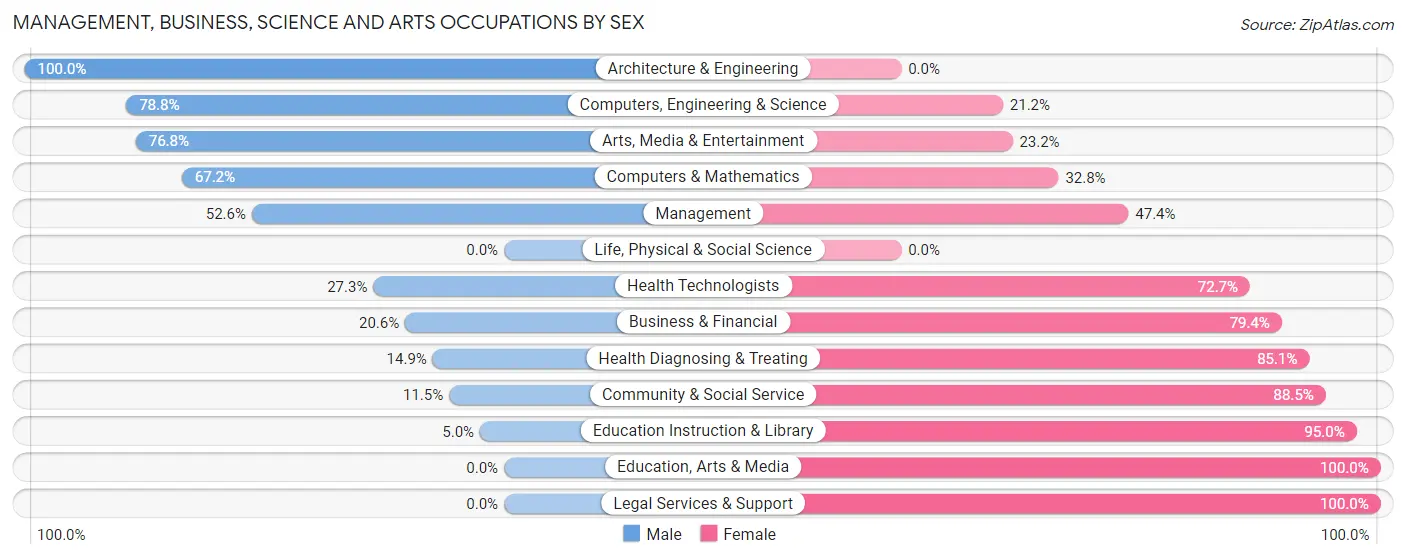
Management, Business, Science and Arts Occupations by Sex
Within the Management, Business, Science and Arts occupations in Brownsville, the most male-oriented occupations are Architecture & Engineering (100.0%), Computers, Engineering & Science (78.8%), and Arts, Media & Entertainment (76.8%), while the most female-oriented occupations are Education, Arts & Media (100.0%), Legal Services & Support (100.0%), and Education Instruction & Library (95.0%).
| Occupation | Male | Female |
| Management | 232 (52.6%) | 209 (47.4%) |
| Business & Financial | 52 (20.6%) | 200 (79.4%) |
| Computers, Engineering & Science | 78 (78.8%) | 21 (21.2%) |
| Computers & Mathematics | 43 (67.2%) | 21 (32.8%) |
| Architecture & Engineering | 35 (100.0%) | 0 (0.0%) |
| Life, Physical & Social Science | 0 (0.0%) | 0 (0.0%) |
| Community & Social Service | 55 (11.5%) | 425 (88.5%) |
| Education, Arts & Media | 0 (0.0%) | 142 (100.0%) |
| Legal Services & Support | 0 (0.0%) | 43 (100.0%) |
| Education Instruction & Library | 12 (5.0%) | 227 (95.0%) |
| Arts, Media & Entertainment | 43 (76.8%) | 13 (23.2%) |
| Health Diagnosing & Treating | 36 (14.9%) | 206 (85.1%) |
| Health Technologists | 36 (27.3%) | 96 (72.7%) |
| Total (Category) | 453 (29.9%) | 1,061 (70.1%) |
| Total (Overall) | 3,503 (45.9%) | 4,122 (54.1%) |
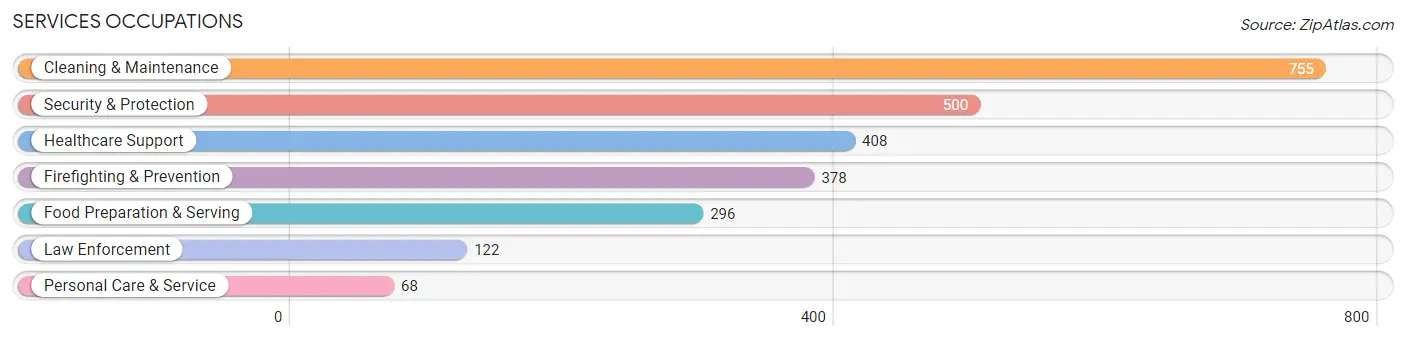
Services Occupations
The most common Services occupations in Brownsville are Cleaning & Maintenance (755 | 9.9%), Security & Protection (500 | 6.6%), Healthcare Support (408 | 5.3%), Firefighting & Prevention (378 | 5.0%), and Food Preparation & Serving (296 | 3.9%).
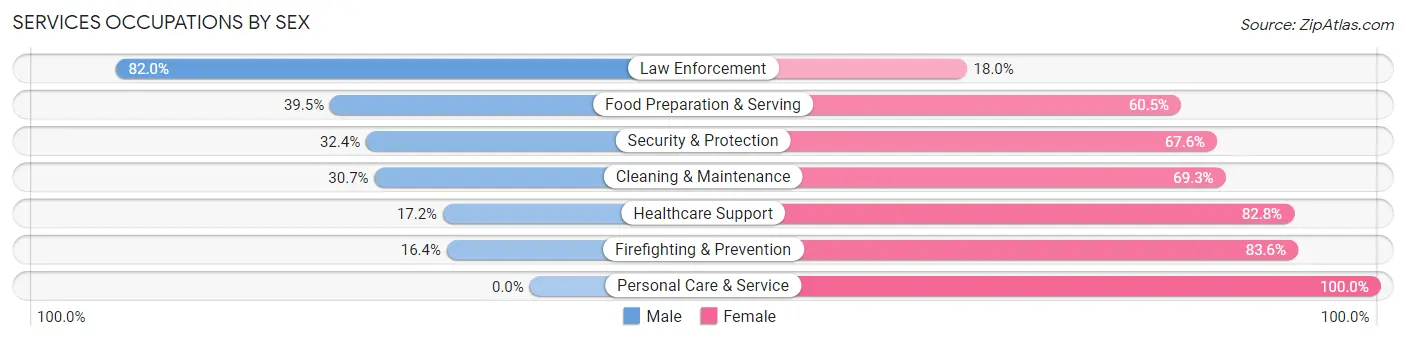
Services Occupations by Sex
Within the Services occupations in Brownsville, the most male-oriented occupations are Law Enforcement (82.0%), Food Preparation & Serving (39.5%), and Security & Protection (32.4%), while the most female-oriented occupations are Personal Care & Service (100.0%), Firefighting & Prevention (83.6%), and Healthcare Support (82.8%).
| Occupation | Male | Female |
| Healthcare Support | 70 (17.2%) | 338 (82.8%) |
| Security & Protection | 162 (32.4%) | 338 (67.6%) |
| Firefighting & Prevention | 62 (16.4%) | 316 (83.6%) |
| Law Enforcement | 100 (82.0%) | 22 (18.0%) |
| Food Preparation & Serving | 117 (39.5%) | 179 (60.5%) |
| Cleaning & Maintenance | 232 (30.7%) | 523 (69.3%) |
| Personal Care & Service | 0 (0.0%) | 68 (100.0%) |
| Total (Category) | 581 (28.7%) | 1,446 (71.3%) |
| Total (Overall) | 3,503 (45.9%) | 4,122 (54.1%) |
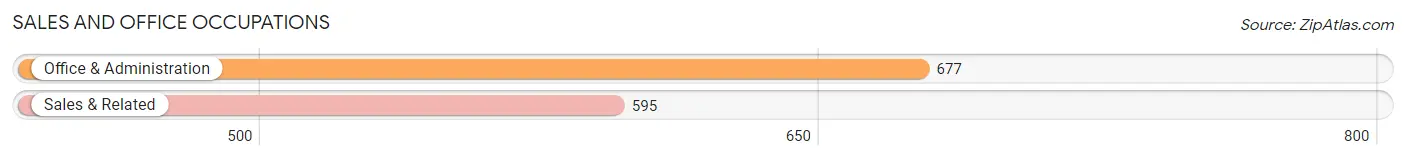
Sales and Office Occupations
The most common Sales and Office occupations in Brownsville are Office & Administration (677 | 8.9%), and Sales & Related (595 | 7.8%).
Sales and Office Occupations by Sex
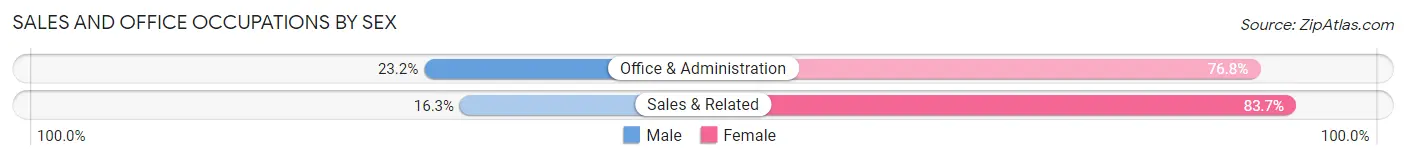
| Occupation | Male | Female |
| Sales & Related | 97 (16.3%) | 498 (83.7%) |
| Office & Administration | 157 (23.2%) | 520 (76.8%) |
| Total (Category) | 254 (20.0%) | 1,018 (80.0%) |
| Total (Overall) | 3,503 (45.9%) | 4,122 (54.1%) |
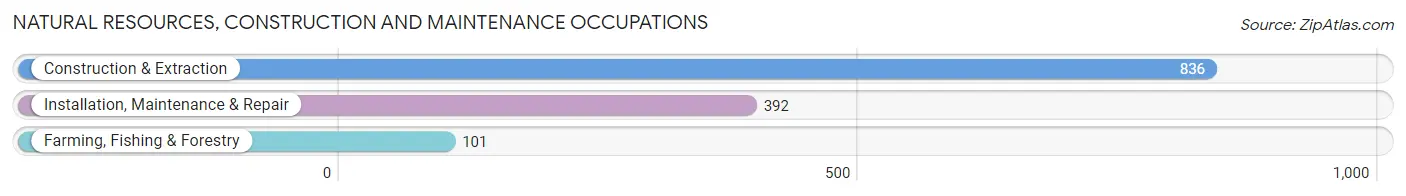
Natural Resources, Construction and Maintenance Occupations
The most common Natural Resources, Construction and Maintenance occupations in Brownsville are Construction & Extraction (836 | 11.0%), Installation, Maintenance & Repair (392 | 5.1%), and Farming, Fishing & Forestry (101 | 1.3%).
Natural Resources, Construction and Maintenance Occupations by Sex
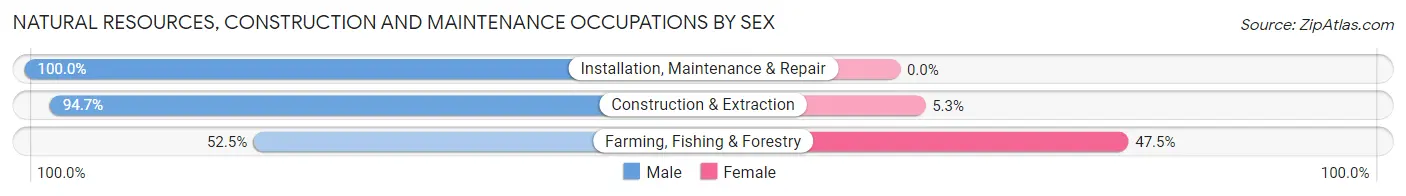
| Occupation | Male | Female |
| Farming, Fishing & Forestry | 53 (52.5%) | 48 (47.5%) |
| Construction & Extraction | 792 (94.7%) | 44 (5.3%) |
| Installation, Maintenance & Repair | 392 (100.0%) | 0 (0.0%) |
| Total (Category) | 1,237 (93.1%) | 92 (6.9%) |
| Total (Overall) | 3,503 (45.9%) | 4,122 (54.1%) |
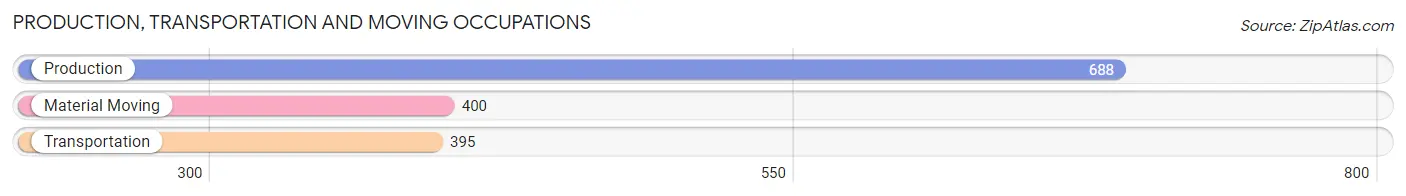
Production, Transportation and Moving Occupations
The most common Production, Transportation and Moving occupations in Brownsville are Production (688 | 9.0%), Material Moving (400 | 5.2%), and Transportation (395 | 5.2%).
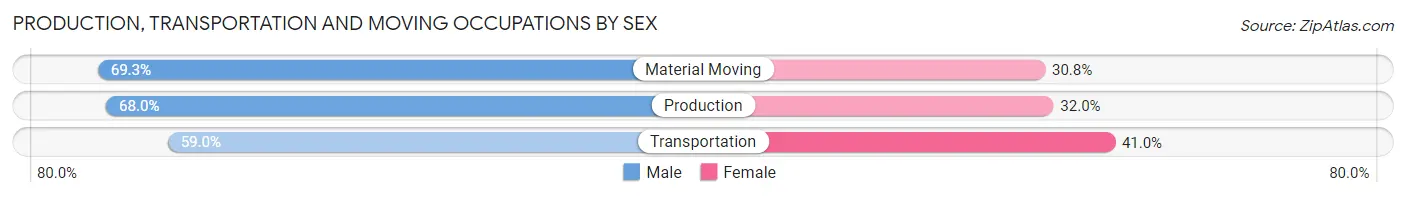
Production, Transportation and Moving Occupations by Sex
| Occupation | Male | Female |
| Production | 468 (68.0%) | 220 (32.0%) |
| Transportation | 233 (59.0%) | 162 (41.0%) |
| Material Moving | 277 (69.3%) | 123 (30.7%) |
| Total (Category) | 978 (65.9%) | 505 (34.1%) |
| Total (Overall) | 3,503 (45.9%) | 4,122 (54.1%) |
Employment Industries by Sex in Brownsville
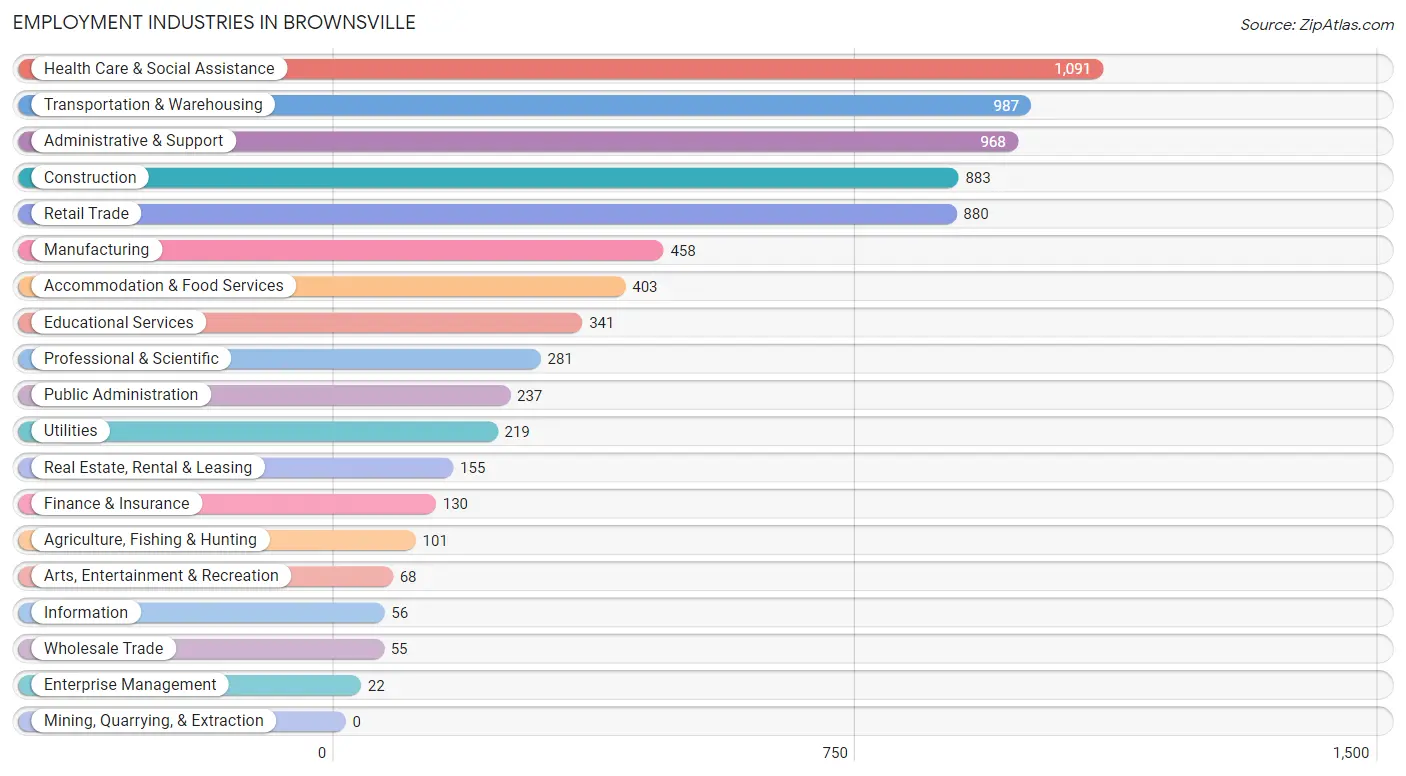
Employment Industries in Brownsville
The major employment industries in Brownsville include Health Care & Social Assistance (1,091 | 14.3%), Transportation & Warehousing (987 | 12.9%), Administrative & Support (968 | 12.7%), Construction (883 | 11.6%), and Retail Trade (880 | 11.5%).
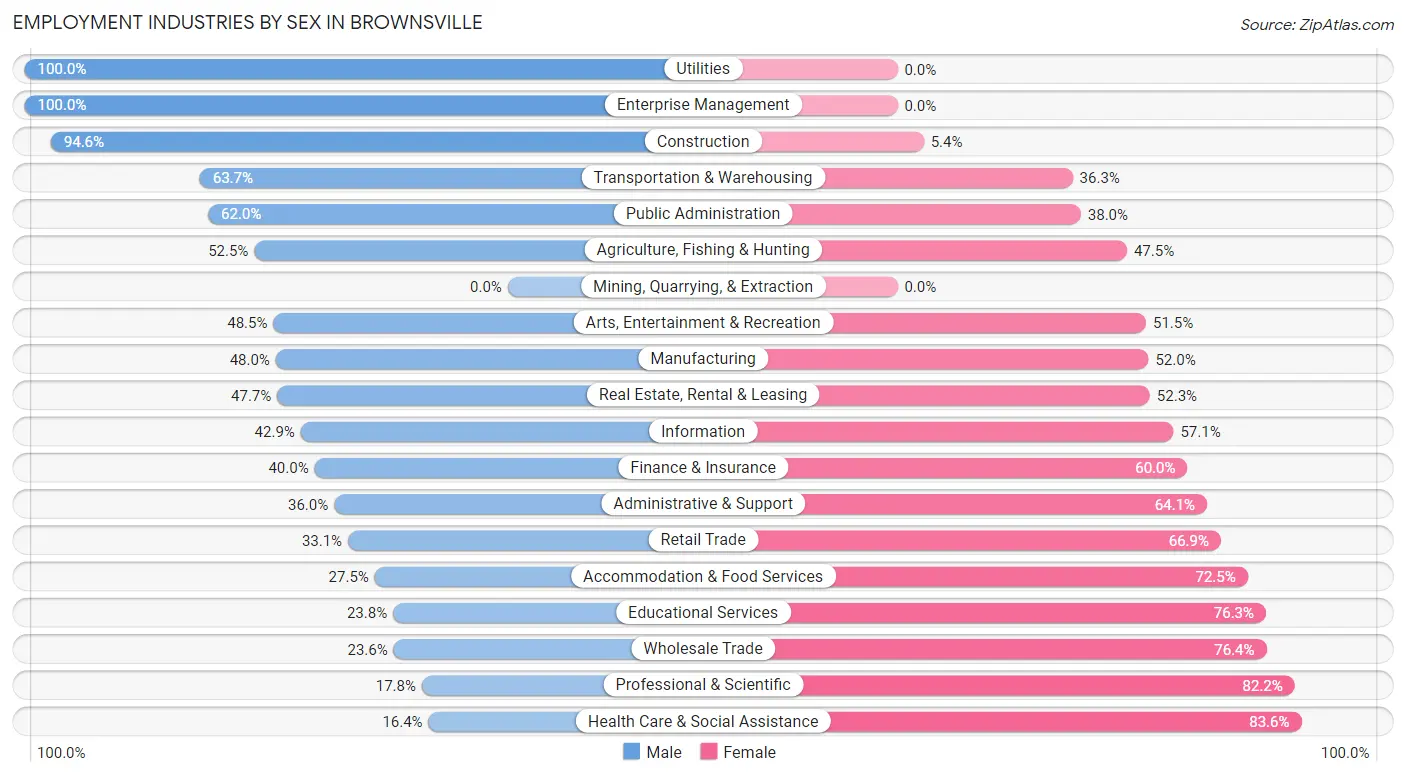
Employment Industries by Sex in Brownsville
The Brownsville industries that see more men than women are Utilities (100.0%), Enterprise Management (100.0%), and Construction (94.6%), whereas the industries that tend to have a higher number of women are Health Care & Social Assistance (83.6%), Professional & Scientific (82.2%), and Wholesale Trade (76.4%).
| Industry | Male | Female |
| Agriculture, Fishing & Hunting | 53 (52.5%) | 48 (47.5%) |
| Mining, Quarrying, & Extraction | 0 (0.0%) | 0 (0.0%) |
| Construction | 835 (94.6%) | 48 (5.4%) |
| Manufacturing | 220 (48.0%) | 238 (52.0%) |
| Wholesale Trade | 13 (23.6%) | 42 (76.4%) |
| Retail Trade | 291 (33.1%) | 589 (66.9%) |
| Transportation & Warehousing | 629 (63.7%) | 358 (36.3%) |
| Utilities | 219 (100.0%) | 0 (0.0%) |
| Information | 24 (42.9%) | 32 (57.1%) |
| Finance & Insurance | 52 (40.0%) | 78 (60.0%) |
| Real Estate, Rental & Leasing | 74 (47.7%) | 81 (52.3%) |
| Professional & Scientific | 50 (17.8%) | 231 (82.2%) |
| Enterprise Management | 22 (100.0%) | 0 (0.0%) |
| Administrative & Support | 348 (35.9%) | 620 (64.0%) |
| Educational Services | 81 (23.7%) | 260 (76.2%) |
| Health Care & Social Assistance | 179 (16.4%) | 912 (83.6%) |
| Arts, Entertainment & Recreation | 33 (48.5%) | 35 (51.5%) |
| Accommodation & Food Services | 111 (27.5%) | 292 (72.5%) |
| Public Administration | 147 (62.0%) | 90 (38.0%) |
| Total | 3,503 (45.9%) | 4,122 (54.1%) |
Education in Brownsville
School Enrollment in Brownsville
The most common levels of schooling among the 5,519 students in Brownsville are college / undergraduate (1,255 | 22.7%), elementary school (1,223 | 22.2%), and high school (1,147 | 20.8%).
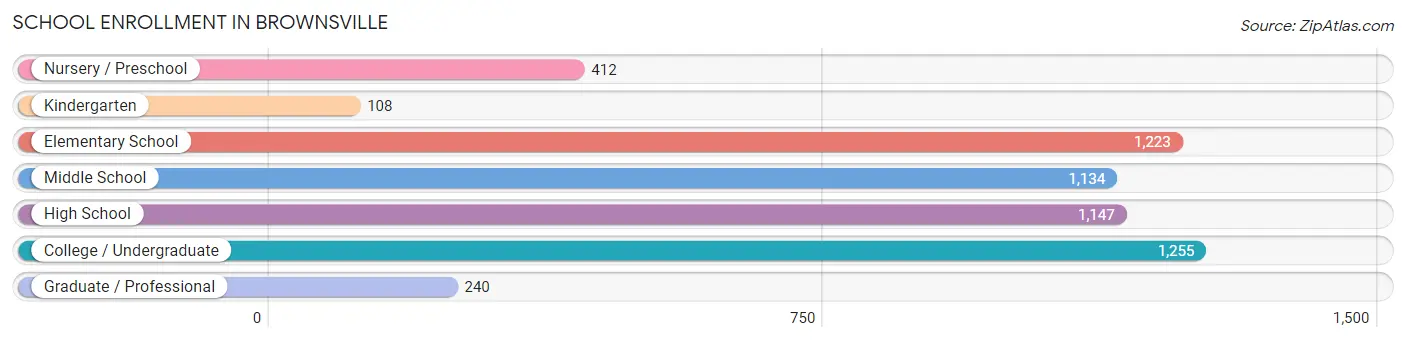
| School Level | # Students | % Students |
| Nursery / Preschool | 412 | 7.5% |
| Kindergarten | 108 | 2.0% |
| Elementary School | 1,223 | 22.2% |
| Middle School | 1,134 | 20.5% |
| High School | 1,147 | 20.8% |
| College / Undergraduate | 1,255 | 22.7% |
| Graduate / Professional | 240 | 4.3% |
| Total | 5,519 | 100.0% |
School Enrollment by Age by Funding Source in Brownsville
Out of a total of 5,519 students who are enrolled in schools in Brownsville, 844 (15.3%) attend a private institution, while the remaining 4,675 (84.7%) are enrolled in public schools. The age group of 20 to 24 year olds has the highest likelihood of being enrolled in private schools, with 151 (29.7% in the age bracket) enrolled. Conversely, the age group of 18 to 19 year olds has the lowest likelihood of being enrolled in a private school, with 410 (98.3% in the age bracket) attending a public institution.
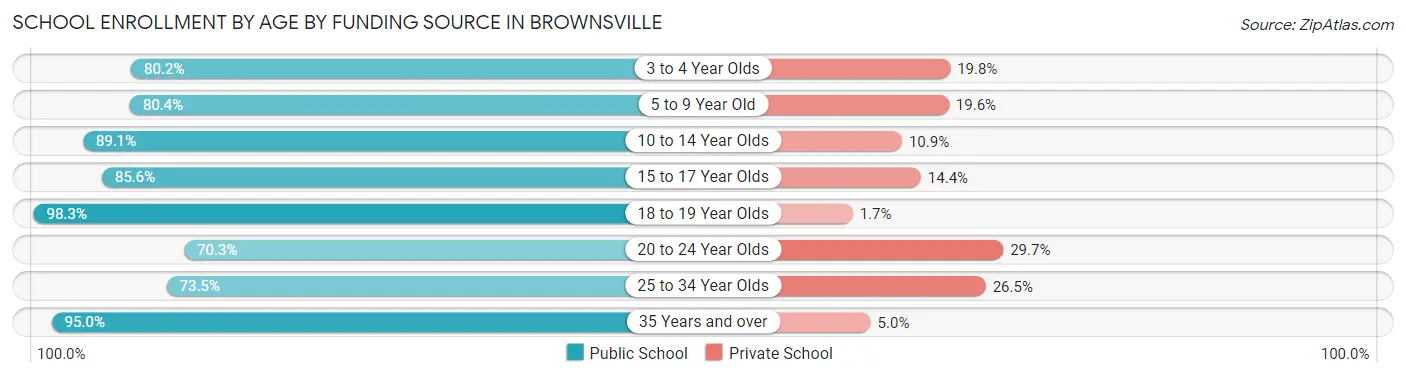
| Age Bracket | Public School | Private School |
| 3 to 4 Year Olds | 206 (80.2%) | 51 (19.8%) |
| 5 to 9 Year Old | 1,042 (80.4%) | 254 (19.6%) |
| 10 to 14 Year Olds | 1,207 (89.1%) | 147 (10.9%) |
| 15 to 17 Year Olds | 488 (85.6%) | 82 (14.4%) |
| 18 to 19 Year Olds | 410 (98.3%) | 7 (1.7%) |
| 20 to 24 Year Olds | 357 (70.3%) | 151 (29.7%) |
| 25 to 34 Year Olds | 339 (73.5%) | 122 (26.5%) |
| 35 Years and over | 623 (95.0%) | 33 (5.0%) |
| Total | 4,675 (84.7%) | 844 (15.3%) |
Educational Attainment by Field of Study in Brownsville
Business (552 | 31.8%), education (222 | 12.8%), psychology (208 | 12.0%), engineering (146 | 8.4%), and science & technology (136 | 7.8%) are the most common fields of study among 1,738 individuals in Brownsville who have obtained a bachelor's degree or higher.
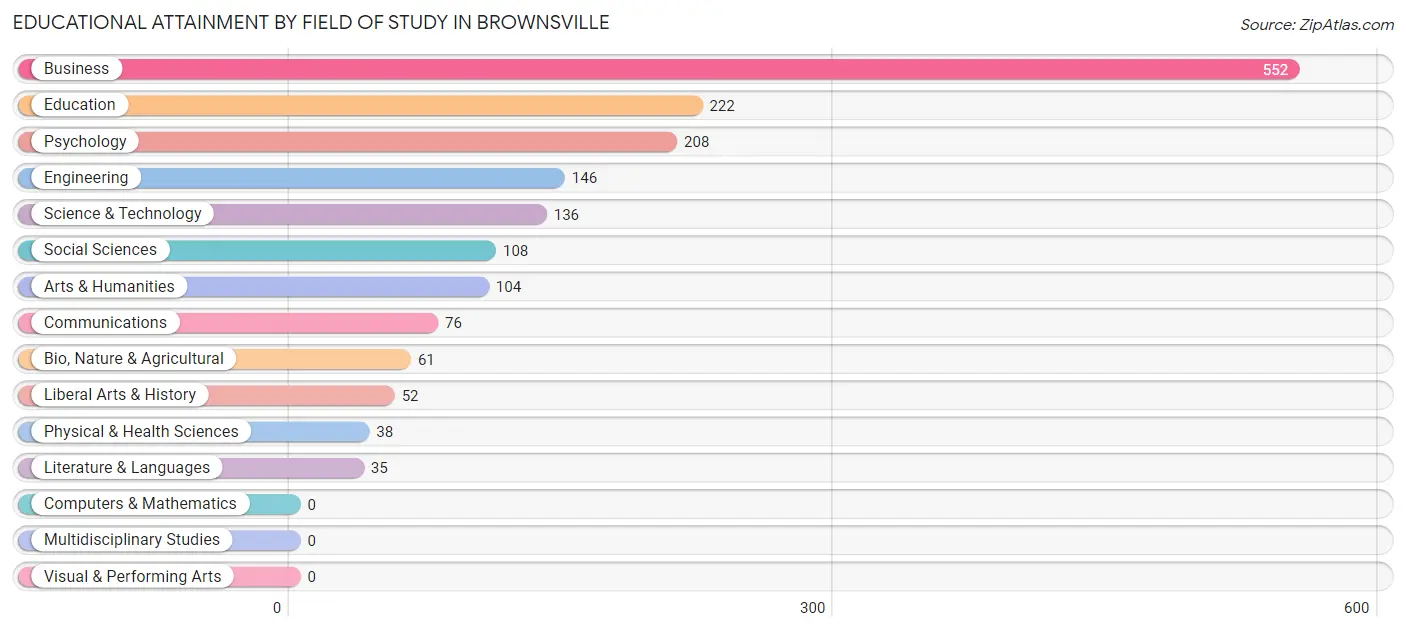
| Field of Study | # Graduates | % Graduates |
| Computers & Mathematics | 0 | 0.0% |
| Bio, Nature & Agricultural | 61 | 3.5% |
| Physical & Health Sciences | 38 | 2.2% |
| Psychology | 208 | 12.0% |
| Social Sciences | 108 | 6.2% |
| Engineering | 146 | 8.4% |
| Multidisciplinary Studies | 0 | 0.0% |
| Science & Technology | 136 | 7.8% |
| Business | 552 | 31.8% |
| Education | 222 | 12.8% |
| Literature & Languages | 35 | 2.0% |
| Liberal Arts & History | 52 | 3.0% |
| Visual & Performing Arts | 0 | 0.0% |
| Communications | 76 | 4.4% |
| Arts & Humanities | 104 | 6.0% |
| Total | 1,738 | 100.0% |
Transportation & Commute in Brownsville
Vehicle Availability by Sex in Brownsville
The most prevalent vehicle ownership categories in Brownsville are males with 2 vehicles (1,221, accounting for 34.6%) and females with 2 vehicles (1,131, making up 30.1%).
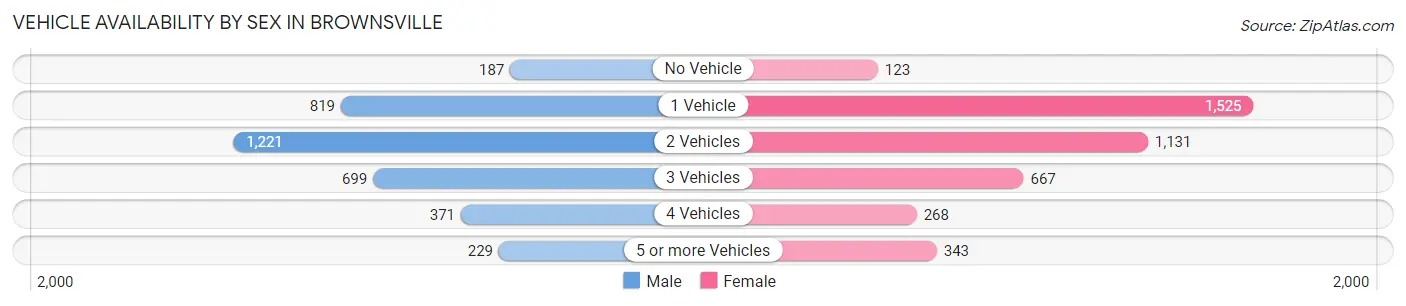
| Vehicles Available | Male | Female |
| No Vehicle | 187 (5.3%) | 123 (3.0%) |
| 1 Vehicle | 819 (23.2%) | 1,525 (37.6%) |
| 2 Vehicles | 1,221 (34.6%) | 1,131 (27.9%) |
| 3 Vehicles | 699 (19.8%) | 667 (16.4%) |
| 4 Vehicles | 371 (10.5%) | 268 (6.6%) |
| 5 or more Vehicles | 229 (6.5%) | 343 (8.5%) |
| Total | 3,526 (100.0%) | 4,057 (100.0%) |
Commute Time in Brownsville
The most frequently occuring commute durations in Brownsville are 30 to 34 minutes (1,707 commuters, 24.1%), 20 to 24 minutes (1,045 commuters, 14.8%), and 45 to 59 minutes (801 commuters, 11.3%).
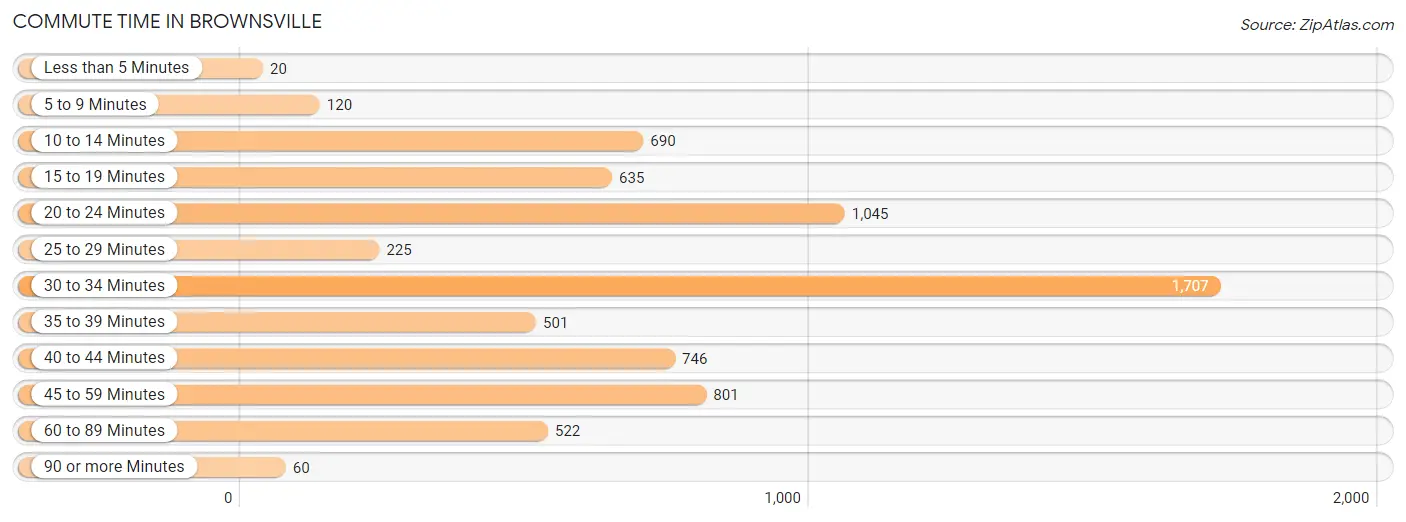
| Commute Time | # Commuters | % Commuters |
| Less than 5 Minutes | 20 | 0.3% |
| 5 to 9 Minutes | 120 | 1.7% |
| 10 to 14 Minutes | 690 | 9.8% |
| 15 to 19 Minutes | 635 | 9.0% |
| 20 to 24 Minutes | 1,045 | 14.8% |
| 25 to 29 Minutes | 225 | 3.2% |
| 30 to 34 Minutes | 1,707 | 24.1% |
| 35 to 39 Minutes | 501 | 7.1% |
| 40 to 44 Minutes | 746 | 10.5% |
| 45 to 59 Minutes | 801 | 11.3% |
| 60 to 89 Minutes | 522 | 7.4% |
| 90 or more Minutes | 60 | 0.9% |
Commute Time by Sex in Brownsville
The most common commute times in Brownsville are 30 to 34 minutes (629 commuters, 18.5%) for males and 30 to 34 minutes (1,078 commuters, 29.3%) for females.
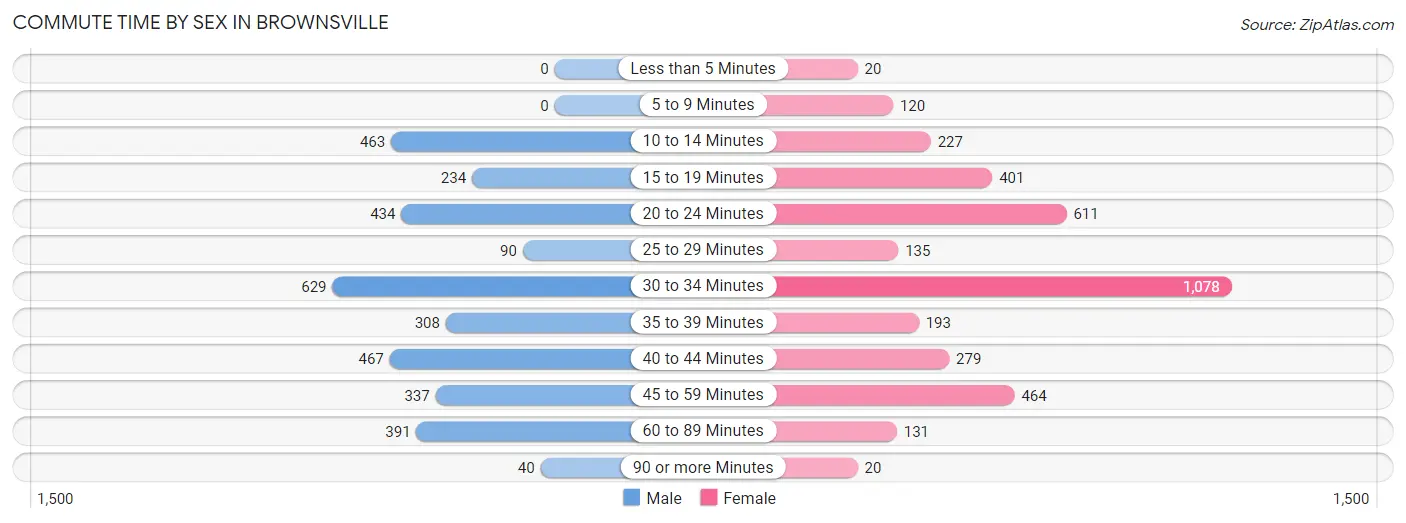
| Commute Time | Male | Female |
| Less than 5 Minutes | 0 (0.0%) | 20 (0.5%) |
| 5 to 9 Minutes | 0 (0.0%) | 120 (3.3%) |
| 10 to 14 Minutes | 463 (13.7%) | 227 (6.2%) |
| 15 to 19 Minutes | 234 (6.9%) | 401 (10.9%) |
| 20 to 24 Minutes | 434 (12.8%) | 611 (16.6%) |
| 25 to 29 Minutes | 90 (2.6%) | 135 (3.7%) |
| 30 to 34 Minutes | 629 (18.5%) | 1,078 (29.3%) |
| 35 to 39 Minutes | 308 (9.1%) | 193 (5.2%) |
| 40 to 44 Minutes | 467 (13.8%) | 279 (7.6%) |
| 45 to 59 Minutes | 337 (9.9%) | 464 (12.6%) |
| 60 to 89 Minutes | 391 (11.5%) | 131 (3.6%) |
| 90 or more Minutes | 40 (1.2%) | 20 (0.5%) |
Time of Departure to Work by Sex in Brownsville
The most frequent times of departure to work in Brownsville are 7:00 AM to 7:29 AM (905, 26.7%) for males and 7:00 AM to 7:29 AM (978, 26.6%) for females.
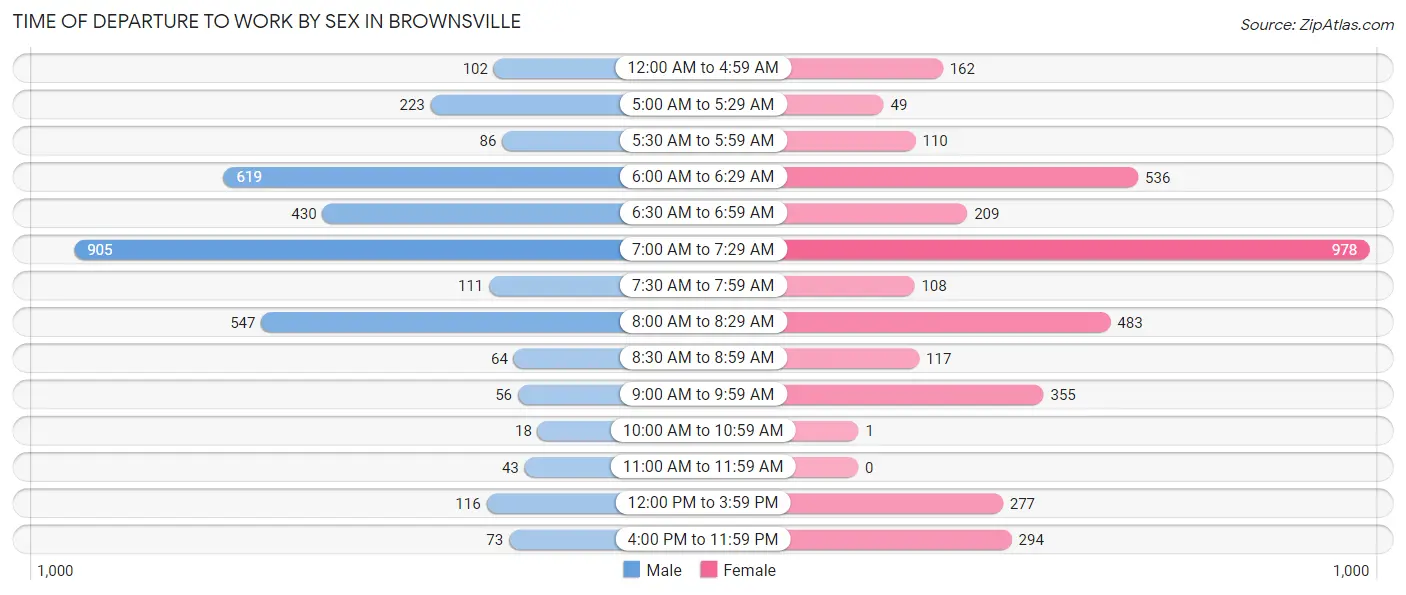
| Time of Departure | Male | Female |
| 12:00 AM to 4:59 AM | 102 (3.0%) | 162 (4.4%) |
| 5:00 AM to 5:29 AM | 223 (6.6%) | 49 (1.3%) |
| 5:30 AM to 5:59 AM | 86 (2.5%) | 110 (3.0%) |
| 6:00 AM to 6:29 AM | 619 (18.2%) | 536 (14.6%) |
| 6:30 AM to 6:59 AM | 430 (12.7%) | 209 (5.7%) |
| 7:00 AM to 7:29 AM | 905 (26.7%) | 978 (26.6%) |
| 7:30 AM to 7:59 AM | 111 (3.3%) | 108 (2.9%) |
| 8:00 AM to 8:29 AM | 547 (16.1%) | 483 (13.1%) |
| 8:30 AM to 8:59 AM | 64 (1.9%) | 117 (3.2%) |
| 9:00 AM to 9:59 AM | 56 (1.7%) | 355 (9.7%) |
| 10:00 AM to 10:59 AM | 18 (0.5%) | 1 (0.0%) |
| 11:00 AM to 11:59 AM | 43 (1.3%) | 0 (0.0%) |
| 12:00 PM to 3:59 PM | 116 (3.4%) | 277 (7.5%) |
| 4:00 PM to 11:59 PM | 73 (2.1%) | 294 (8.0%) |
| Total | 3,393 (100.0%) | 3,679 (100.0%) |
Housing Occupancy in Brownsville
Occupancy by Ownership in Brownsville
Of the total 6,501 dwellings in Brownsville, owner-occupied units account for 2,244 (34.5%), while renter-occupied units make up 4,257 (65.5%).
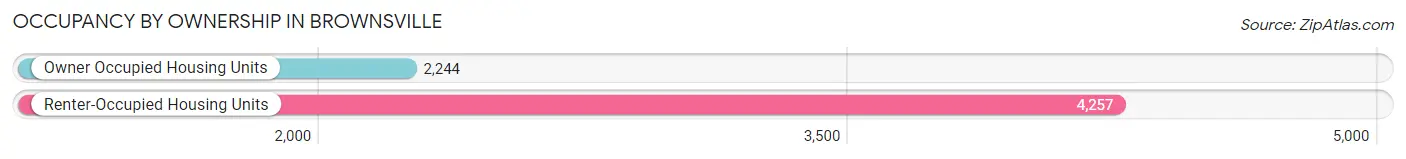
| Occupancy | # Housing Units | % Housing Units |
| Owner Occupied Housing Units | 2,244 | 34.5% |
| Renter-Occupied Housing Units | 4,257 | 65.5% |
| Total Occupied Housing Units | 6,501 | 100.0% |
Occupancy by Household Size in Brownsville
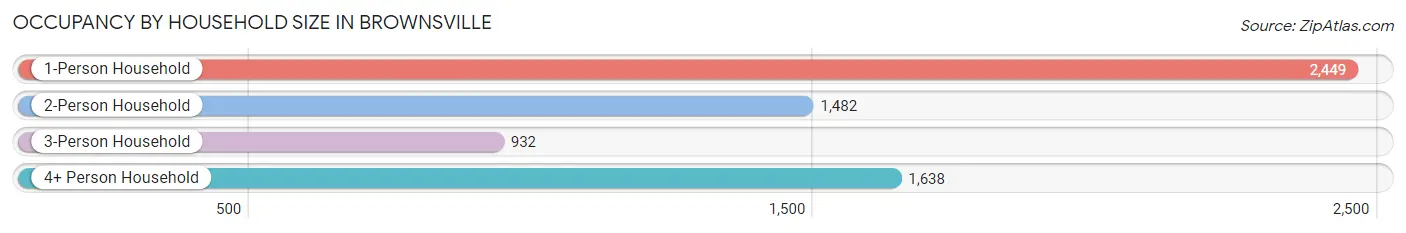
| Household Size | # Housing Units | % Housing Units |
| 1-Person Household | 2,449 | 37.7% |
| 2-Person Household | 1,482 | 22.8% |
| 3-Person Household | 932 | 14.3% |
| 4+ Person Household | 1,638 | 25.2% |
| Total Housing Units | 6,501 | 100.0% |
Occupancy by Ownership by Household Size in Brownsville
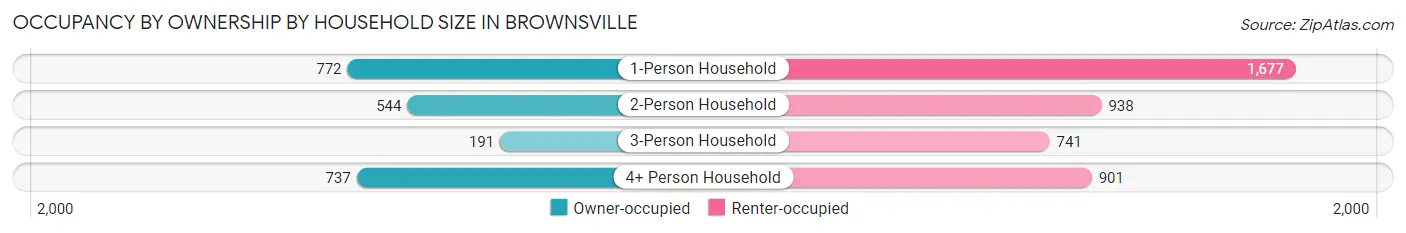
| Household Size | Owner-occupied | Renter-occupied |
| 1-Person Household | 772 (31.5%) | 1,677 (68.5%) |
| 2-Person Household | 544 (36.7%) | 938 (63.3%) |
| 3-Person Household | 191 (20.5%) | 741 (79.5%) |
| 4+ Person Household | 737 (45.0%) | 901 (55.0%) |
| Total Housing Units | 2,244 (34.5%) | 4,257 (65.5%) |
Occupancy by Educational Attainment in Brownsville
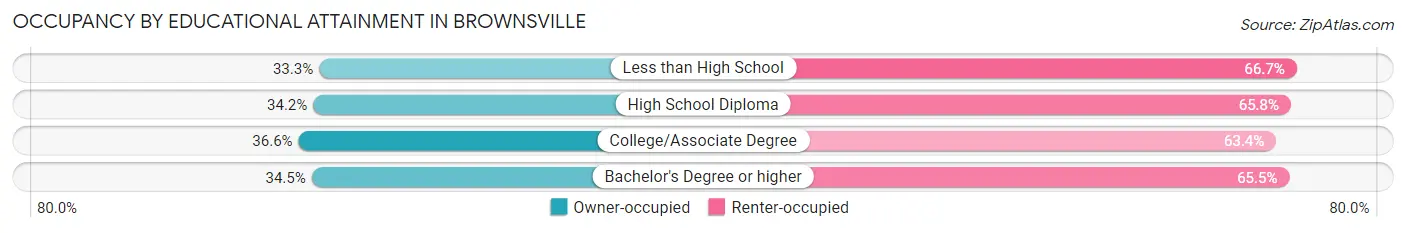
| Household Size | Owner-occupied | Renter-occupied |
| Less than High School | 590 (33.3%) | 1,181 (66.7%) |
| High School Diploma | 821 (34.2%) | 1,577 (65.8%) |
| College/Associate Degree | 504 (36.6%) | 874 (63.4%) |
| Bachelor's Degree or higher | 329 (34.5%) | 625 (65.5%) |
Occupancy by Age of Householder in Brownsville
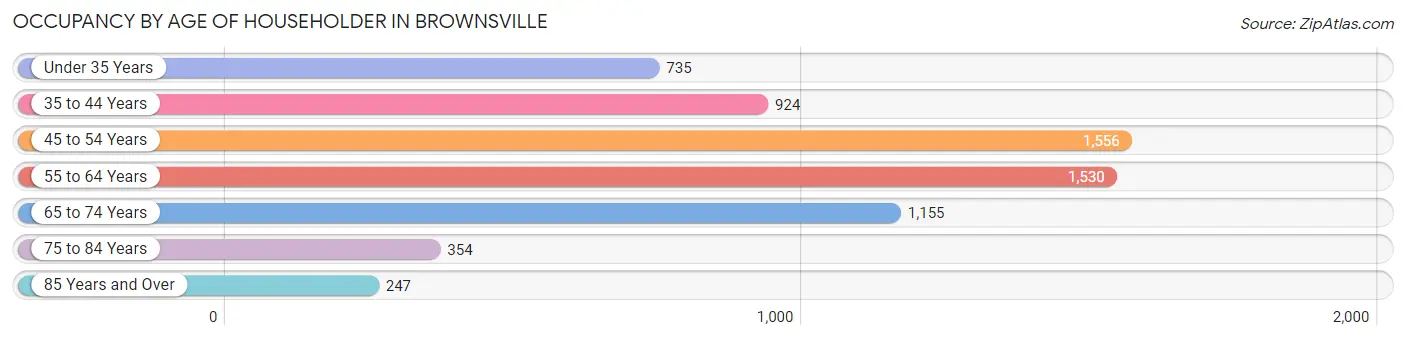
| Age Bracket | # Households | % Households |
| Under 35 Years | 735 | 11.3% |
| 35 to 44 Years | 924 | 14.2% |
| 45 to 54 Years | 1,556 | 23.9% |
| 55 to 64 Years | 1,530 | 23.5% |
| 65 to 74 Years | 1,155 | 17.8% |
| 75 to 84 Years | 354 | 5.4% |
| 85 Years and Over | 247 | 3.8% |
| Total | 6,501 | 100.0% |
Housing Finances in Brownsville
Median Income by Occupancy in Brownsville
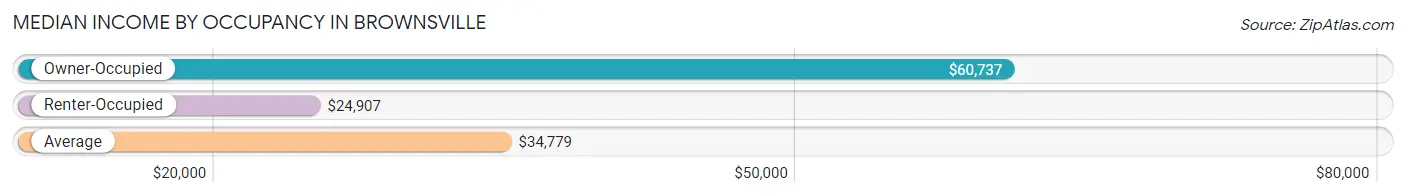
| Occupancy Type | # Households | Median Income |
| Owner-Occupied | 2,244 (34.5%) | $60,737 |
| Renter-Occupied | 4,257 (65.5%) | $24,907 |
| Average | 6,501 (100.0%) | $34,779 |
Occupancy by Householder Income Bracket in Brownsville
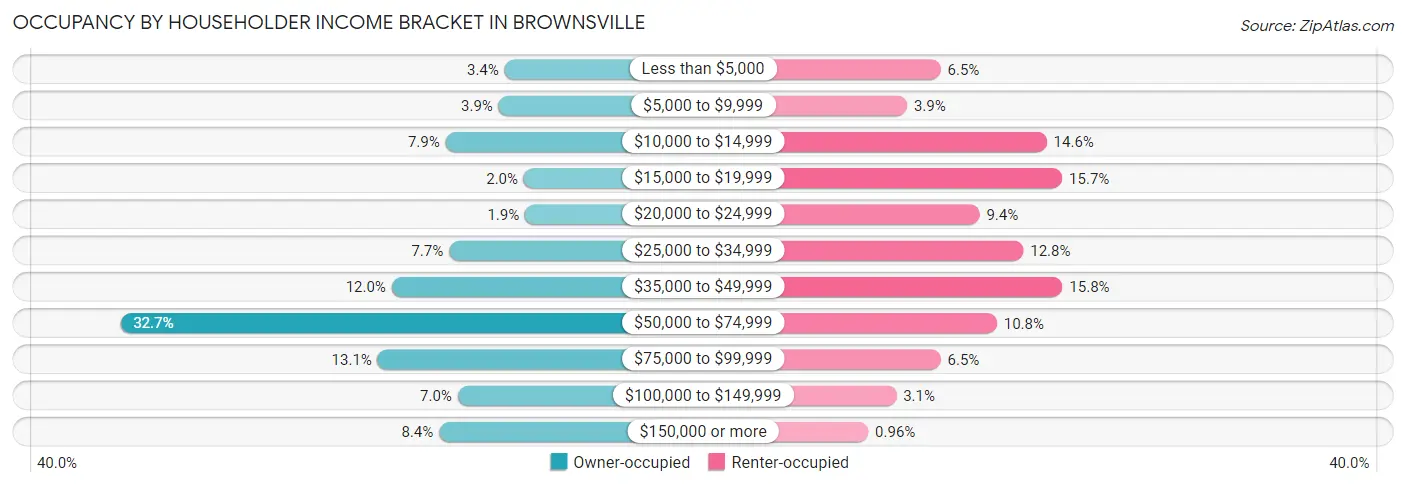
| Income Bracket | Owner-occupied | Renter-occupied |
| Less than $5,000 | 77 (3.4%) | 276 (6.5%) |
| $5,000 to $9,999 | 87 (3.9%) | 167 (3.9%) |
| $10,000 to $14,999 | 178 (7.9%) | 620 (14.6%) |
| $15,000 to $19,999 | 44 (2.0%) | 670 (15.7%) |
| $20,000 to $24,999 | 42 (1.9%) | 402 (9.4%) |
| $25,000 to $34,999 | 172 (7.7%) | 544 (12.8%) |
| $35,000 to $49,999 | 270 (12.0%) | 671 (15.8%) |
| $50,000 to $74,999 | 734 (32.7%) | 458 (10.8%) |
| $75,000 to $99,999 | 294 (13.1%) | 276 (6.5%) |
| $100,000 to $149,999 | 157 (7.0%) | 132 (3.1%) |
| $150,000 or more | 189 (8.4%) | 41 (1.0%) |
| Total | 2,244 (100.0%) | 4,257 (100.0%) |
Monthly Housing Cost Tiers in Brownsville
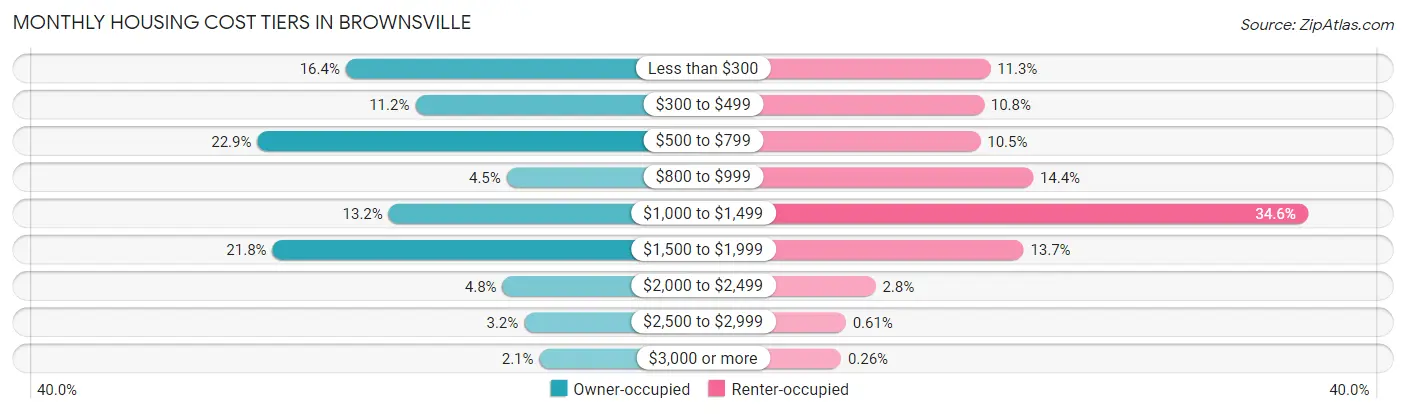
| Monthly Cost | Owner-occupied | Renter-occupied |
| Less than $300 | 367 (16.4%) | 479 (11.3%) |
| $300 to $499 | 252 (11.2%) | 459 (10.8%) |
| $500 to $799 | 513 (22.9%) | 448 (10.5%) |
| $800 to $999 | 101 (4.5%) | 613 (14.4%) |
| $1,000 to $1,499 | 296 (13.2%) | 1,474 (34.6%) |
| $1,500 to $1,999 | 488 (21.7%) | 583 (13.7%) |
| $2,000 to $2,499 | 108 (4.8%) | 119 (2.8%) |
| $2,500 to $2,999 | 72 (3.2%) | 26 (0.6%) |
| $3,000 or more | 47 (2.1%) | 11 (0.3%) |
| Total | 2,244 (100.0%) | 4,257 (100.0%) |
Physical Housing Characteristics in Brownsville
Housing Structures in Brownsville
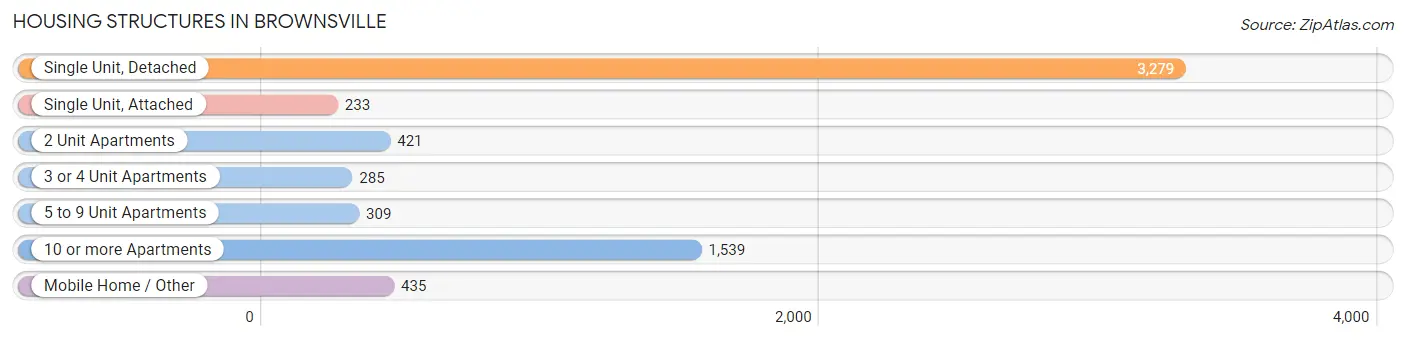
| Structure Type | # Housing Units | % Housing Units |
| Single Unit, Detached | 3,279 | 50.4% |
| Single Unit, Attached | 233 | 3.6% |
| 2 Unit Apartments | 421 | 6.5% |
| 3 or 4 Unit Apartments | 285 | 4.4% |
| 5 to 9 Unit Apartments | 309 | 4.8% |
| 10 or more Apartments | 1,539 | 23.7% |
| Mobile Home / Other | 435 | 6.7% |
| Total | 6,501 | 100.0% |
Housing Structures by Occupancy in Brownsville
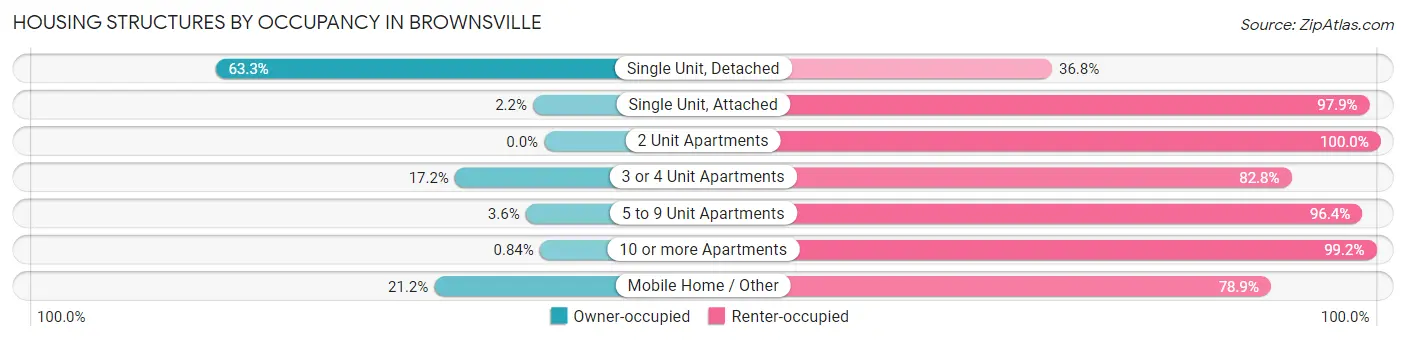
| Structure Type | Owner-occupied | Renter-occupied |
| Single Unit, Detached | 2,074 (63.2%) | 1,205 (36.7%) |
| Single Unit, Attached | 5 (2.1%) | 228 (97.9%) |
| 2 Unit Apartments | 0 (0.0%) | 421 (100.0%) |
| 3 or 4 Unit Apartments | 49 (17.2%) | 236 (82.8%) |
| 5 to 9 Unit Apartments | 11 (3.6%) | 298 (96.4%) |
| 10 or more Apartments | 13 (0.8%) | 1,526 (99.2%) |
| Mobile Home / Other | 92 (21.1%) | 343 (78.8%) |
| Total | 2,244 (34.5%) | 4,257 (65.5%) |
Housing Structures by Number of Rooms in Brownsville
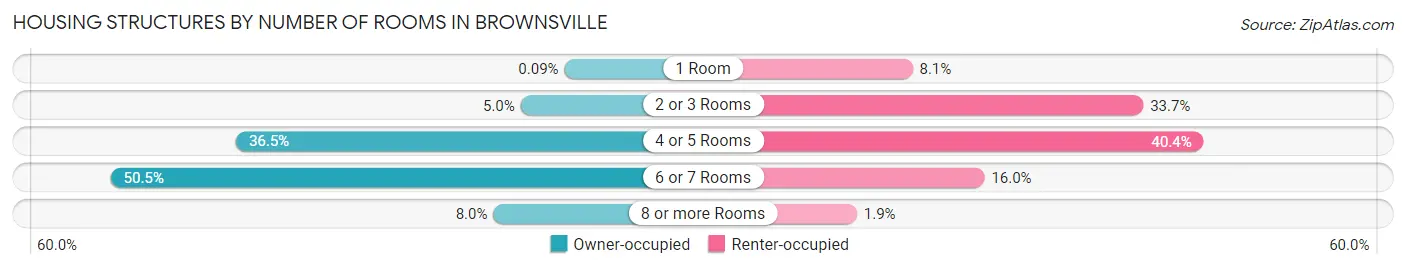
| Number of Rooms | Owner-occupied | Renter-occupied |
| 1 Room | 2 (0.1%) | 343 (8.1%) |
| 2 or 3 Rooms | 111 (5.0%) | 1,433 (33.7%) |
| 4 or 5 Rooms | 820 (36.5%) | 1,718 (40.4%) |
| 6 or 7 Rooms | 1,132 (50.4%) | 683 (16.0%) |
| 8 or more Rooms | 179 (8.0%) | 80 (1.9%) |
| Total | 2,244 (100.0%) | 4,257 (100.0%) |
Housing Structure by Heating Type in Brownsville
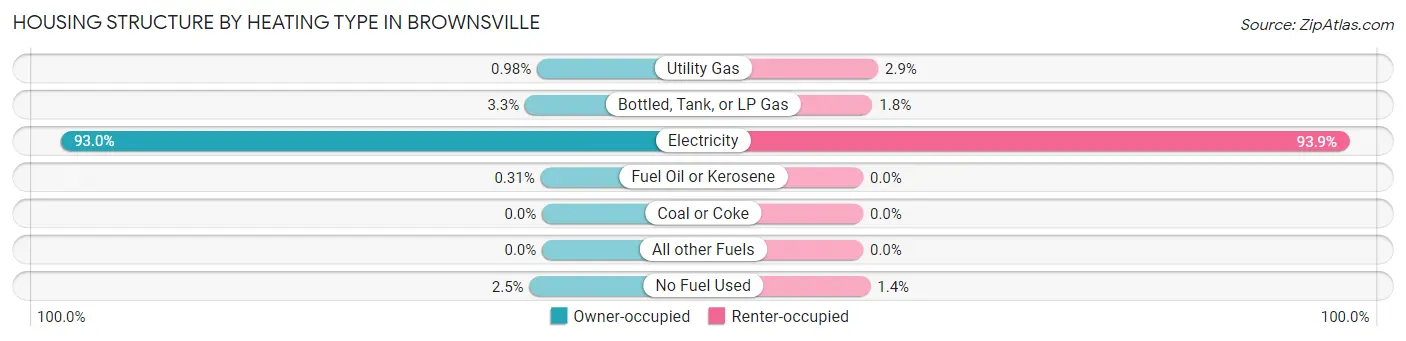
| Heating Type | Owner-occupied | Renter-occupied |
| Utility Gas | 22 (1.0%) | 124 (2.9%) |
| Bottled, Tank, or LP Gas | 74 (3.3%) | 77 (1.8%) |
| Electricity | 2,086 (93.0%) | 3,996 (93.9%) |
| Fuel Oil or Kerosene | 7 (0.3%) | 0 (0.0%) |
| Coal or Coke | 0 (0.0%) | 0 (0.0%) |
| All other Fuels | 0 (0.0%) | 0 (0.0%) |
| No Fuel Used | 55 (2.5%) | 60 (1.4%) |
| Total | 2,244 (100.0%) | 4,257 (100.0%) |
Household Vehicle Usage in Brownsville
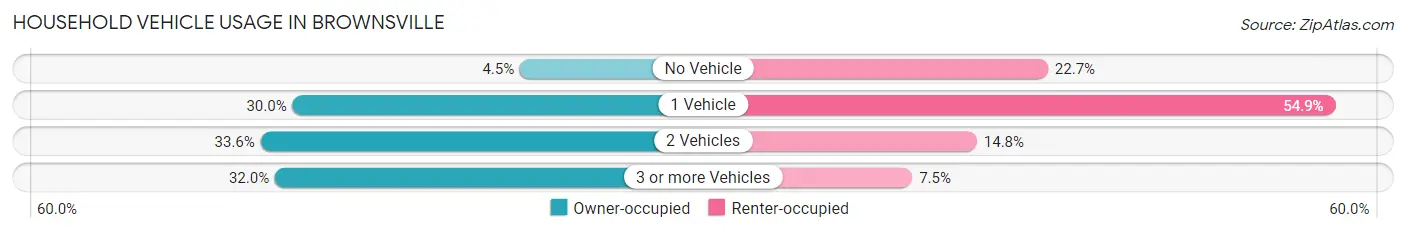
| Vehicles per Household | Owner-occupied | Renter-occupied |
| No Vehicle | 101 (4.5%) | 968 (22.7%) |
| 1 Vehicle | 673 (30.0%) | 2,339 (54.9%) |
| 2 Vehicles | 753 (33.6%) | 629 (14.8%) |
| 3 or more Vehicles | 717 (32.0%) | 321 (7.5%) |
| Total | 2,244 (100.0%) | 4,257 (100.0%) |
Real Estate & Mortgages in Brownsville
Real Estate and Mortgage Overview in Brownsville
| Characteristic | Without Mortgage | With Mortgage |
| Housing Units | 989 | 1,255 |
| Median Property Value | $222,700 | $276,200 |
| Median Household Income | $42,044 | $157 |
| Monthly Housing Costs | $377 | $47 |
| Real Estate Taxes | $1,152 | $145 |
Property Value by Mortgage Status in Brownsville
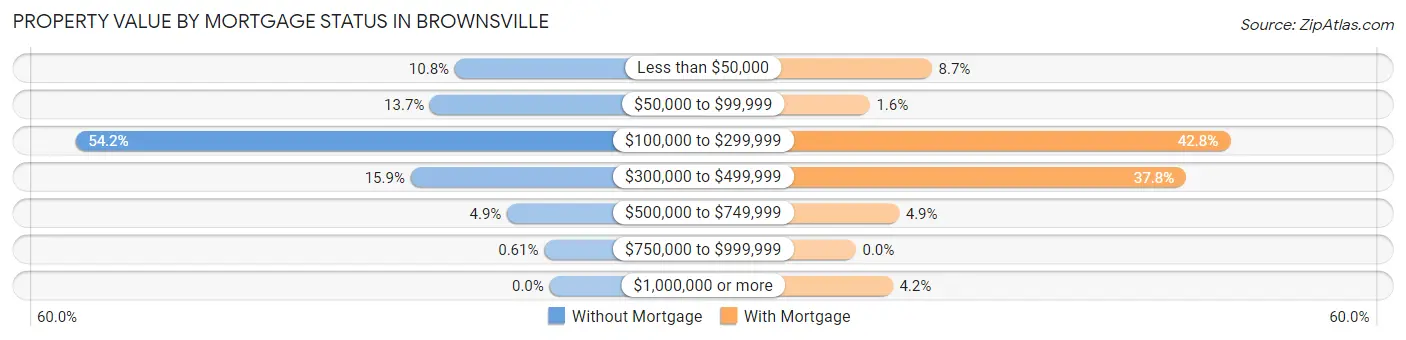
| Property Value | Without Mortgage | With Mortgage |
| Less than $50,000 | 107 (10.8%) | 109 (8.7%) |
| $50,000 to $99,999 | 135 (13.7%) | 20 (1.6%) |
| $100,000 to $299,999 | 536 (54.2%) | 537 (42.8%) |
| $300,000 to $499,999 | 157 (15.9%) | 474 (37.8%) |
| $500,000 to $749,999 | 48 (4.9%) | 62 (4.9%) |
| $750,000 to $999,999 | 6 (0.6%) | 0 (0.0%) |
| $1,000,000 or more | 0 (0.0%) | 53 (4.2%) |
| Total | 989 (100.0%) | 1,255 (100.0%) |
Household Income by Mortgage Status in Brownsville
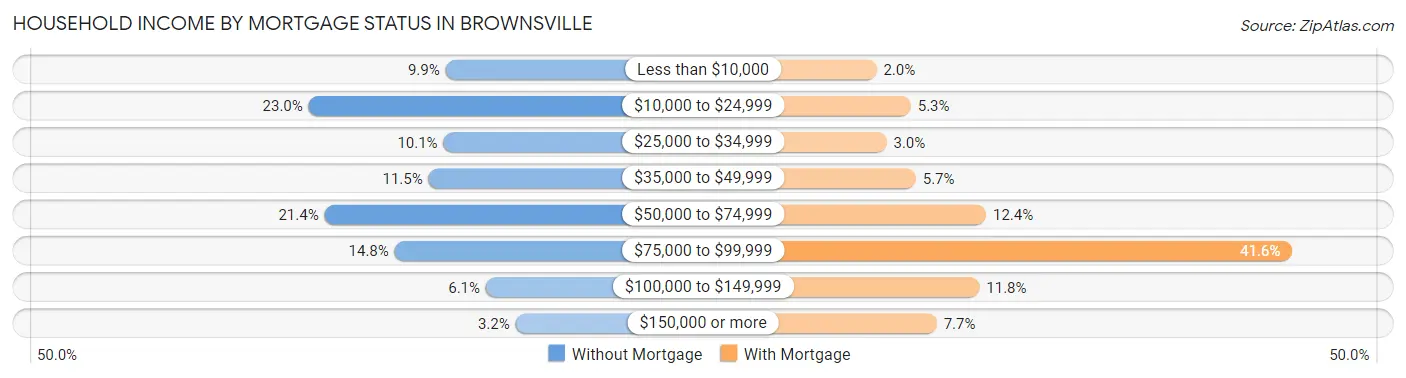
| Household Income | Without Mortgage | With Mortgage |
| Less than $10,000 | 98 (9.9%) | 25 (2.0%) |
| $10,000 to $24,999 | 227 (23.0%) | 66 (5.3%) |
| $25,000 to $34,999 | 100 (10.1%) | 37 (2.9%) |
| $35,000 to $49,999 | 114 (11.5%) | 72 (5.7%) |
| $50,000 to $74,999 | 212 (21.4%) | 156 (12.4%) |
| $75,000 to $99,999 | 146 (14.8%) | 522 (41.6%) |
| $100,000 to $149,999 | 60 (6.1%) | 148 (11.8%) |
| $150,000 or more | 32 (3.2%) | 97 (7.7%) |
| Total | 989 (100.0%) | 1,255 (100.0%) |
Property Value to Household Income Ratio in Brownsville
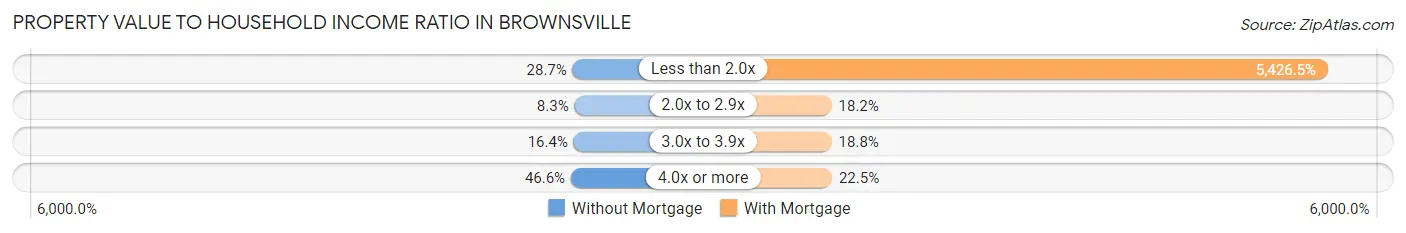
| Value-to-Income Ratio | Without Mortgage | With Mortgage |
| Less than 2.0x | 284 (28.7%) | 68,102 (5,426.4%) |
| 2.0x to 2.9x | 82 (8.3%) | 228 (18.2%) |
| 3.0x to 3.9x | 162 (16.4%) | 236 (18.8%) |
| 4.0x or more | 461 (46.6%) | 282 (22.5%) |
| Total | 989 (100.0%) | 1,255 (100.0%) |
Real Estate Taxes by Mortgage Status in Brownsville
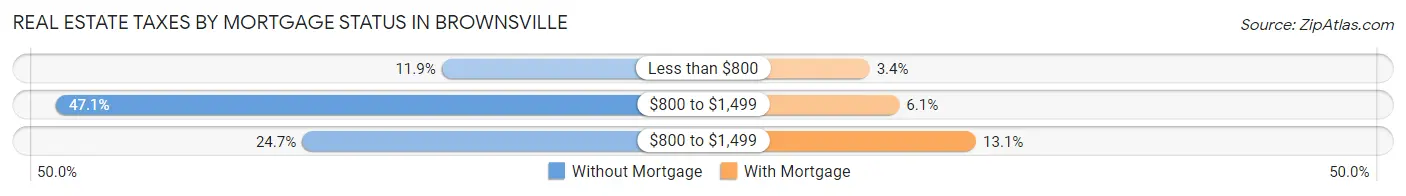
| Property Taxes | Without Mortgage | With Mortgage |
| Less than $800 | 118 (11.9%) | 42 (3.4%) |
| $800 to $1,499 | 466 (47.1%) | 76 (6.1%) |
| $800 to $1,499 | 244 (24.7%) | 164 (13.1%) |
| Total | 989 (100.0%) | 1,255 (100.0%) |
Health & Disability in Brownsville
Health Insurance Coverage by Age in Brownsville
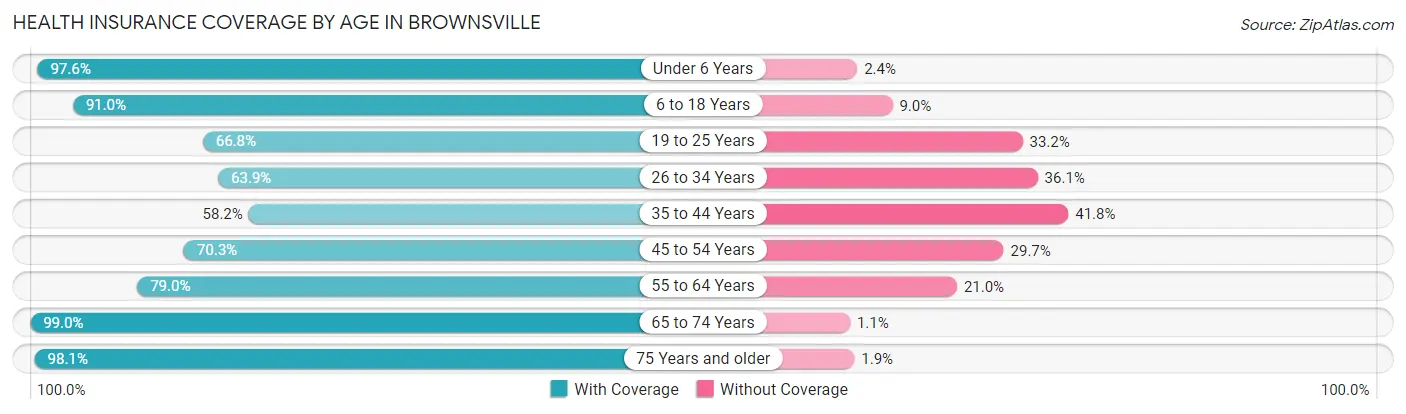
| Age Bracket | With Coverage | Without Coverage |
| Under 6 Years | 1,055 (97.6%) | 26 (2.4%) |
| 6 to 18 Years | 3,203 (91.0%) | 316 (9.0%) |
| 19 to 25 Years | 1,191 (66.8%) | 593 (33.2%) |
| 26 to 34 Years | 1,110 (63.9%) | 626 (36.1%) |
| 35 to 44 Years | 1,277 (58.2%) | 916 (41.8%) |
| 45 to 54 Years | 1,770 (70.3%) | 748 (29.7%) |
| 55 to 64 Years | 1,902 (79.0%) | 506 (21.0%) |
| 65 to 74 Years | 1,504 (99.0%) | 16 (1.1%) |
| 75 Years and older | 997 (98.1%) | 19 (1.9%) |
| Total | 14,009 (78.8%) | 3,766 (21.2%) |
Health Insurance Coverage by Citizenship Status in Brownsville
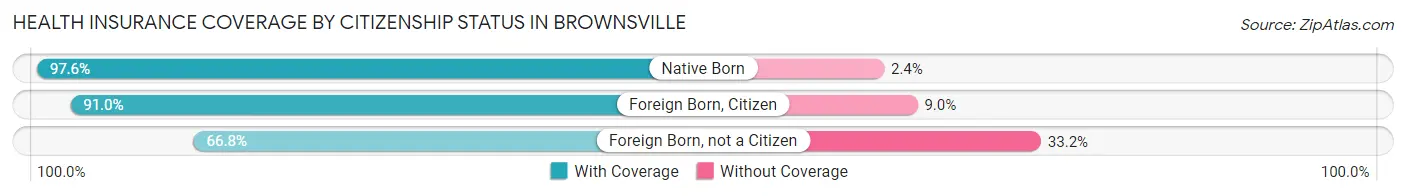
| Citizenship Status | With Coverage | Without Coverage |
| Native Born | 1,055 (97.6%) | 26 (2.4%) |
| Foreign Born, Citizen | 3,203 (91.0%) | 316 (9.0%) |
| Foreign Born, not a Citizen | 1,191 (66.8%) | 593 (33.2%) |
Health Insurance Coverage by Household Income in Brownsville
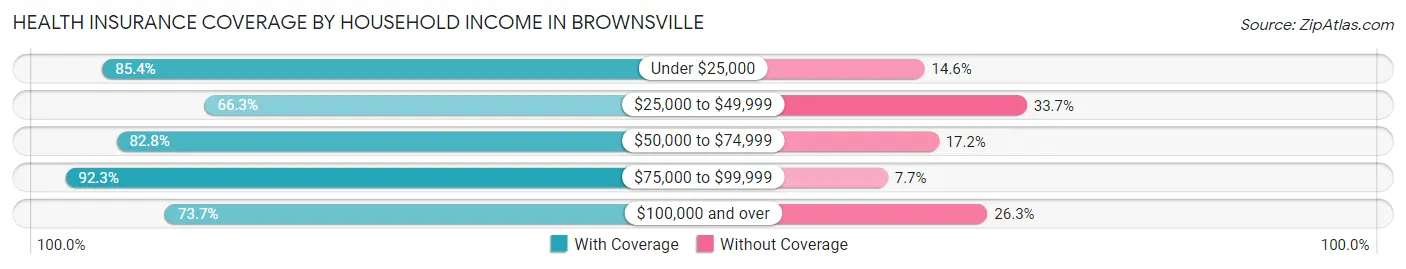
| Household Income | With Coverage | Without Coverage |
| Under $25,000 | 4,511 (85.4%) | 770 (14.6%) |
| $25,000 to $49,999 | 3,145 (66.3%) | 1,601 (33.7%) |
| $50,000 to $74,999 | 2,658 (82.8%) | 553 (17.2%) |
| $75,000 to $99,999 | 1,911 (92.3%) | 159 (7.7%) |
| $100,000 and over | 1,720 (73.7%) | 615 (26.3%) |
Public vs Private Health Insurance Coverage by Age in Brownsville
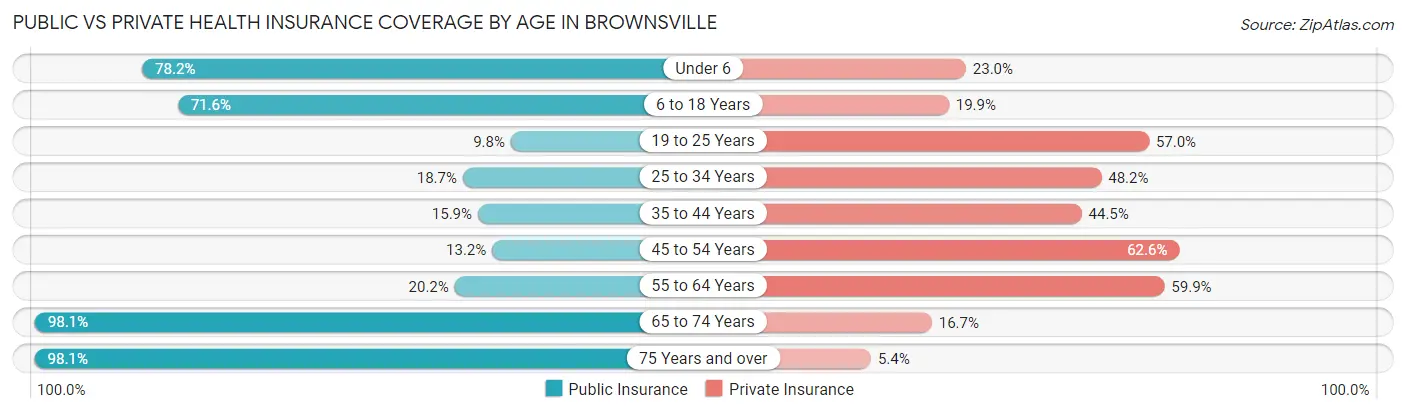
| Age Bracket | Public Insurance | Private Insurance |
| Under 6 | 845 (78.2%) | 249 (23.0%) |
| 6 to 18 Years | 2,519 (71.6%) | 699 (19.9%) |
| 19 to 25 Years | 174 (9.8%) | 1,017 (57.0%) |
| 25 to 34 Years | 324 (18.7%) | 836 (48.2%) |
| 35 to 44 Years | 348 (15.9%) | 976 (44.5%) |
| 45 to 54 Years | 333 (13.2%) | 1,577 (62.6%) |
| 55 to 64 Years | 486 (20.2%) | 1,442 (59.9%) |
| 65 to 74 Years | 1,491 (98.1%) | 254 (16.7%) |
| 75 Years and over | 997 (98.1%) | 55 (5.4%) |
| Total | 7,517 (42.3%) | 7,105 (40.0%) |
Disability Status by Sex by Age in Brownsville
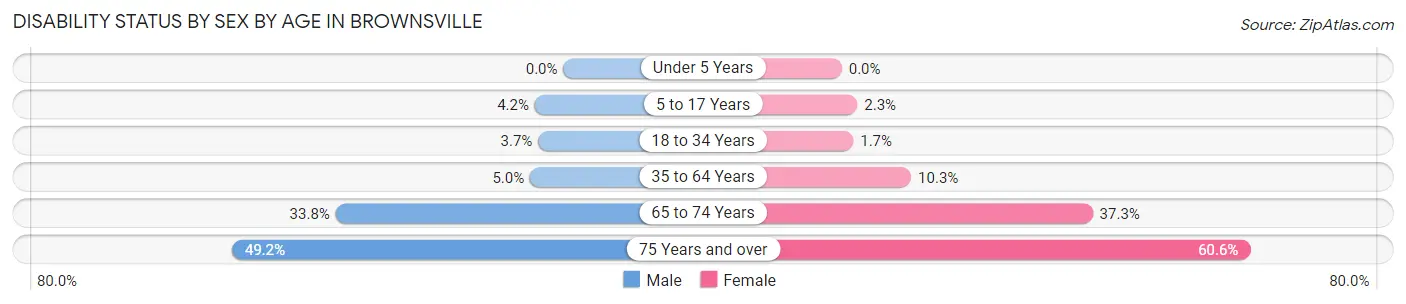
| Age Bracket | Male | Female |
| Under 5 Years | 0 (0.0%) | 0 (0.0%) |
| 5 to 17 Years | 86 (4.2%) | 31 (2.3%) |
| 18 to 34 Years | 63 (3.7%) | 37 (1.7%) |
| 35 to 64 Years | 178 (5.0%) | 363 (10.3%) |
| 65 to 74 Years | 258 (33.8%) | 282 (37.2%) |
| 75 Years and over | 225 (49.2%) | 339 (60.6%) |
Disability Class by Sex by Age in Brownsville
Disability Class: Hearing Difficulty
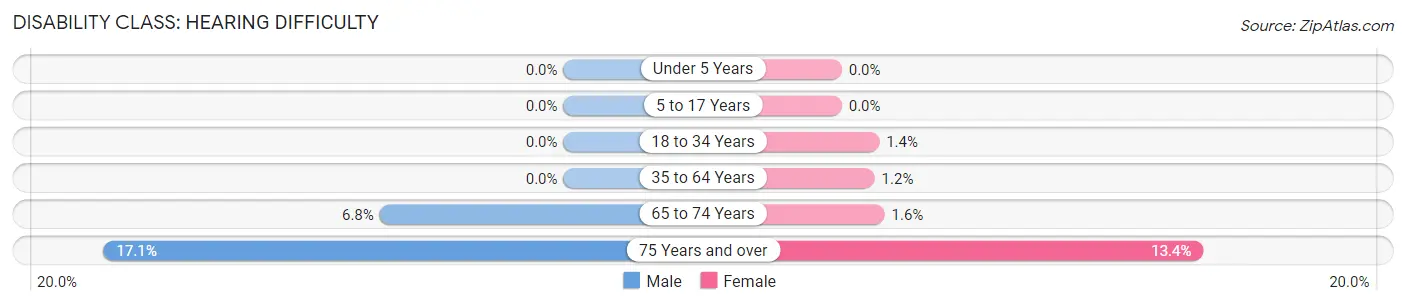
| Age Bracket | Male | Female |
| Under 5 Years | 0 (0.0%) | 0 (0.0%) |
| 5 to 17 Years | 0 (0.0%) | 0 (0.0%) |
| 18 to 34 Years | 0 (0.0%) | 30 (1.4%) |
| 35 to 64 Years | 0 (0.0%) | 43 (1.2%) |
| 65 to 74 Years | 52 (6.8%) | 12 (1.6%) |
| 75 Years and over | 78 (17.1%) | 75 (13.4%) |
Disability Class: Vision Difficulty
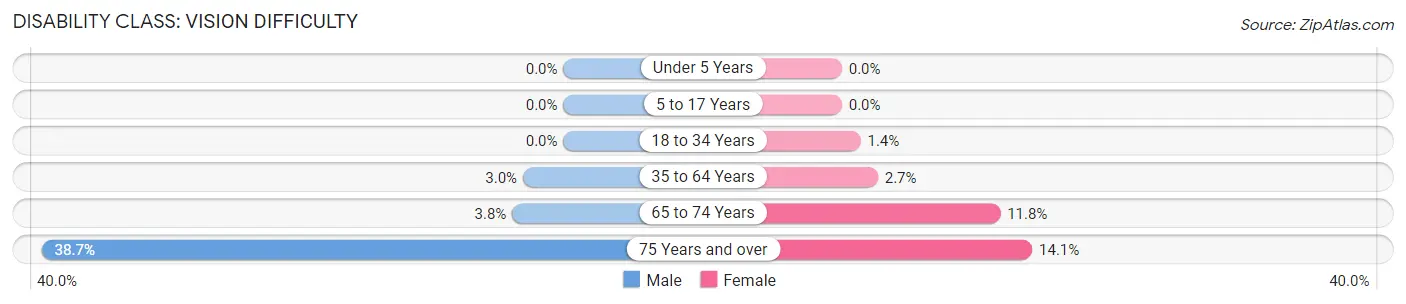
| Age Bracket | Male | Female |
| Under 5 Years | 0 (0.0%) | 0 (0.0%) |
| 5 to 17 Years | 0 (0.0%) | 0 (0.0%) |
| 18 to 34 Years | 0 (0.0%) | 30 (1.4%) |
| 35 to 64 Years | 108 (3.0%) | 94 (2.7%) |
| 65 to 74 Years | 29 (3.8%) | 89 (11.8%) |
| 75 Years and over | 177 (38.7%) | 79 (14.1%) |
Disability Class: Cognitive Difficulty
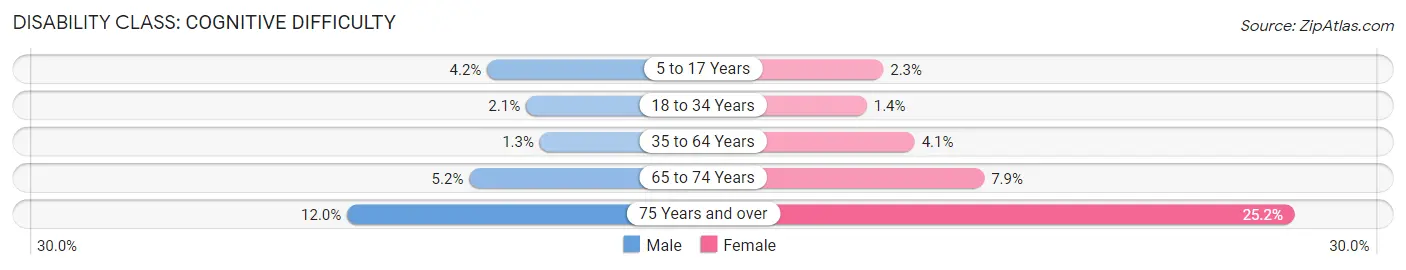
| Age Bracket | Male | Female |
| 5 to 17 Years | 86 (4.2%) | 31 (2.3%) |
| 18 to 34 Years | 35 (2.1%) | 30 (1.4%) |
| 35 to 64 Years | 47 (1.3%) | 143 (4.1%) |
| 65 to 74 Years | 40 (5.2%) | 60 (7.9%) |
| 75 Years and over | 55 (12.0%) | 141 (25.2%) |
Disability Class: Ambulatory Difficulty
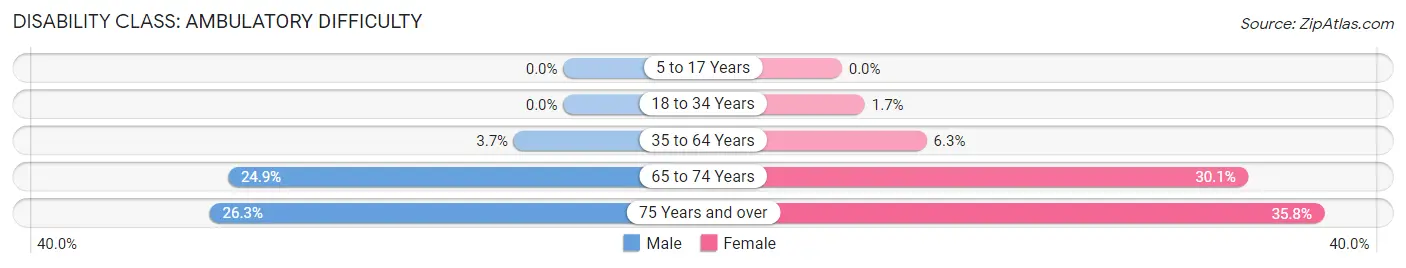
| Age Bracket | Male | Female |
| 5 to 17 Years | 0 (0.0%) | 0 (0.0%) |
| 18 to 34 Years | 0 (0.0%) | 37 (1.7%) |
| 35 to 64 Years | 132 (3.7%) | 222 (6.3%) |
| 65 to 74 Years | 190 (24.9%) | 228 (30.1%) |
| 75 Years and over | 120 (26.3%) | 200 (35.8%) |
Disability Class: Self-Care Difficulty
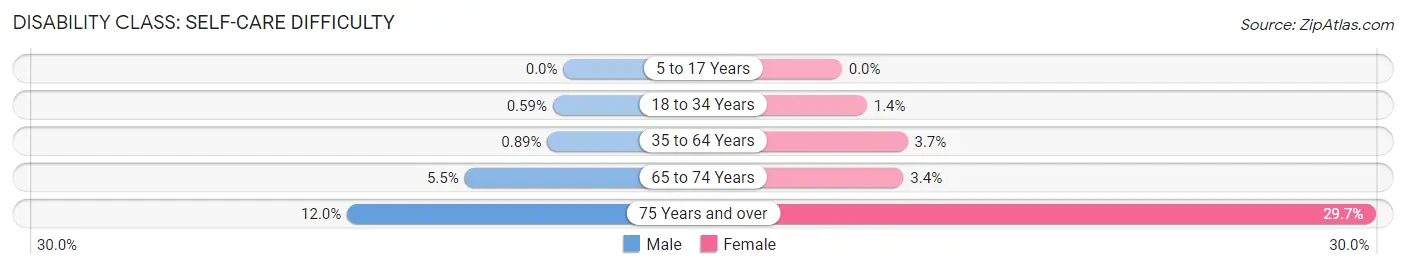
| Age Bracket | Male | Female |
| 5 to 17 Years | 0 (0.0%) | 0 (0.0%) |
| 18 to 34 Years | 10 (0.6%) | 30 (1.4%) |
| 35 to 64 Years | 32 (0.9%) | 129 (3.7%) |
| 65 to 74 Years | 42 (5.5%) | 26 (3.4%) |
| 75 Years and over | 55 (12.0%) | 166 (29.7%) |
Technology Access in Brownsville
Computing Device Access in Brownsville
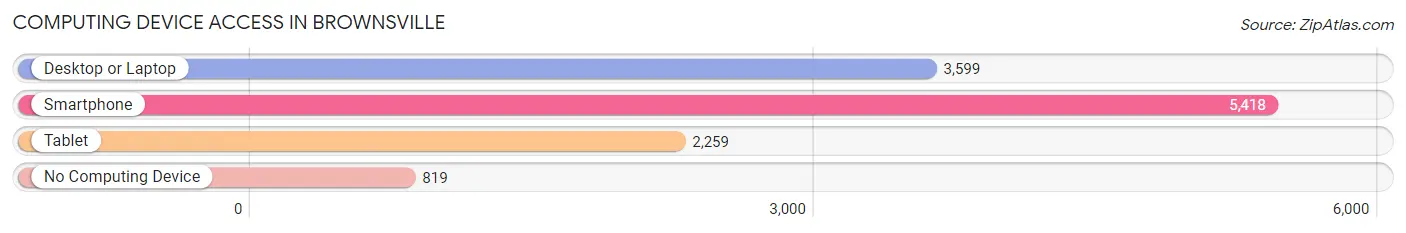
| Device Type | # Households | % Households |
| Desktop or Laptop | 3,599 | 55.4% |
| Smartphone | 5,418 | 83.3% |
| Tablet | 2,259 | 34.7% |
| No Computing Device | 819 | 12.6% |
| Total | 6,501 | 100.0% |
Internet Access in Brownsville
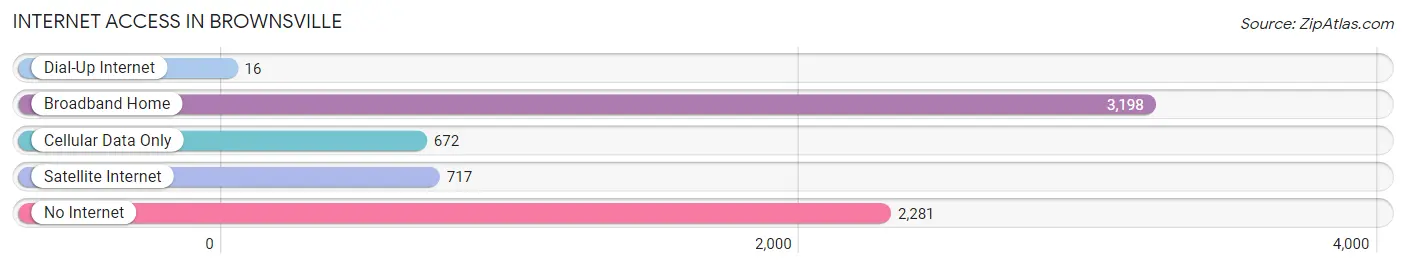
| Internet Type | # Households | % Households |
| Dial-Up Internet | 16 | 0.3% |
| Broadband Home | 3,198 | 49.2% |
| Cellular Data Only | 672 | 10.3% |
| Satellite Internet | 717 | 11.0% |
| No Internet | 2,281 | 35.1% |
| Total | 6,501 | 100.0% |
Brownsville Summary
Brownsville is a small unincorporated community located in the western part of Hernando County, Florida. It is situated on the banks of the Withlacoochee River, approximately 20 miles east of Brooksville and 40 miles north of Tampa. The population of Brownsville was estimated to be around 1,000 in 2020.
History
The area that is now Brownsville was first settled in the early 1800s by settlers from Georgia and Alabama. The settlement was originally known as “Brown’s Settlement” after the first settler, William Brown. The settlement was later renamed Brownsville in 1856.
In the late 1800s, the area was a popular destination for hunters and fishermen. The Withlacoochee River was a popular spot for fishing and hunting, and the area was known for its abundance of wild game.
In the early 1900s, the area began to develop as a farming community. The area was known for its citrus groves and vegetable farms. The area also became known for its phosphate mining operations.
In the 1950s, the area began to experience a population boom as people moved to the area from other parts of Florida and the United States. The population of Brownsville grew to over 1,000 by the early 1960s.
Geography
Brownsville is located in the western part of Hernando County, Florida. It is situated on the banks of the Withlacoochee River, approximately 20 miles east of Brooksville and 40 miles north of Tampa. The area is mostly flat and is covered in pine forests and wetlands.
The climate in Brownsville is subtropical, with hot, humid summers and mild winters. The average temperature in the summer is around 90 degrees Fahrenheit, and the average temperature in the winter is around 60 degrees Fahrenheit.
Economy
The economy of Brownsville is largely based on agriculture and tourism. The area is known for its citrus groves and vegetable farms, and the Withlacoochee River is a popular spot for fishing and hunting.
The area is also home to several phosphate mining operations. The phosphate industry is a major employer in the area, and the mining operations provide jobs for many of the residents of Brownsville.
The area is also home to several small businesses, including restaurants, convenience stores, and gas stations.
Demographics
The population of Brownsville was estimated to be around 1,000 in 2020. The population is mostly white, with a small percentage of African Americans and Hispanics. The median household income in the area is around $40,000, and the median home value is around $150,000.
The area is served by the Hernando County School District, which includes two elementary schools, one middle school, and one high school. The area is also home to several churches, including the First Baptist Church of Brownsville.
Common Questions
What is Per Capita Income in Brownsville?
Per Capita income in Brownsville is $18,744.
What is the Median Family Income in Brownsville?
Median Family Income in Brownsville is $43,590.
What is the Median Household income in Brownsville?
Median Household Income in Brownsville is $34,779.
What is Income or Wage Gap in Brownsville?
Income or Wage Gap in Brownsville is 29.7%.
Women in Brownsville earn 70.3 cents for every dollar earned by a man.
What is Family Income Deficit in Brownsville?
Family Income Deficit in Brownsville is $11,118.
Families that are below poverty line in Brownsville earn $11,118 less on average than the poverty threshold level.
What is Inequality or Gini Index in Brownsville?
Inequality or Gini Index in Brownsville is 0.46.
What is the Total Population of Brownsville?
Total Population of Brownsville is 17,817.
What is the Total Male Population of Brownsville?
Total Male Population of Brownsville is 9,008.
What is the Total Female Population of Brownsville?
Total Female Population of Brownsville is 8,809.
What is the Ratio of Males per 100 Females in Brownsville?
There are 102.26 Males per 100 Females in Brownsville.
What is the Ratio of Females per 100 Males in Brownsville?
There are 97.79 Females per 100 Males in Brownsville.
What is the Median Population Age in Brownsville?
Median Population Age in Brownsville is 38.2 Years.
What is the Average Family Size in Brownsville
Average Family Size in Brownsville is 3.7 People.
What is the Average Household Size in Brownsville
Average Household Size in Brownsville is 2.7 People.
How Large is the Labor Force in Brownsville?
There are 8,281 People in the Labor Forcein in Brownsville.
What is the Percentage of People in the Labor Force in Brownsville?
59.1% of People are in the Labor Force in Brownsville.
What is the Unemployment Rate in Brownsville?
Unemployment Rate in Brownsville is 7.5%.