Plantation Mobile Home Park, FL Map & Demographics
Plantation Mobile Home Park Map
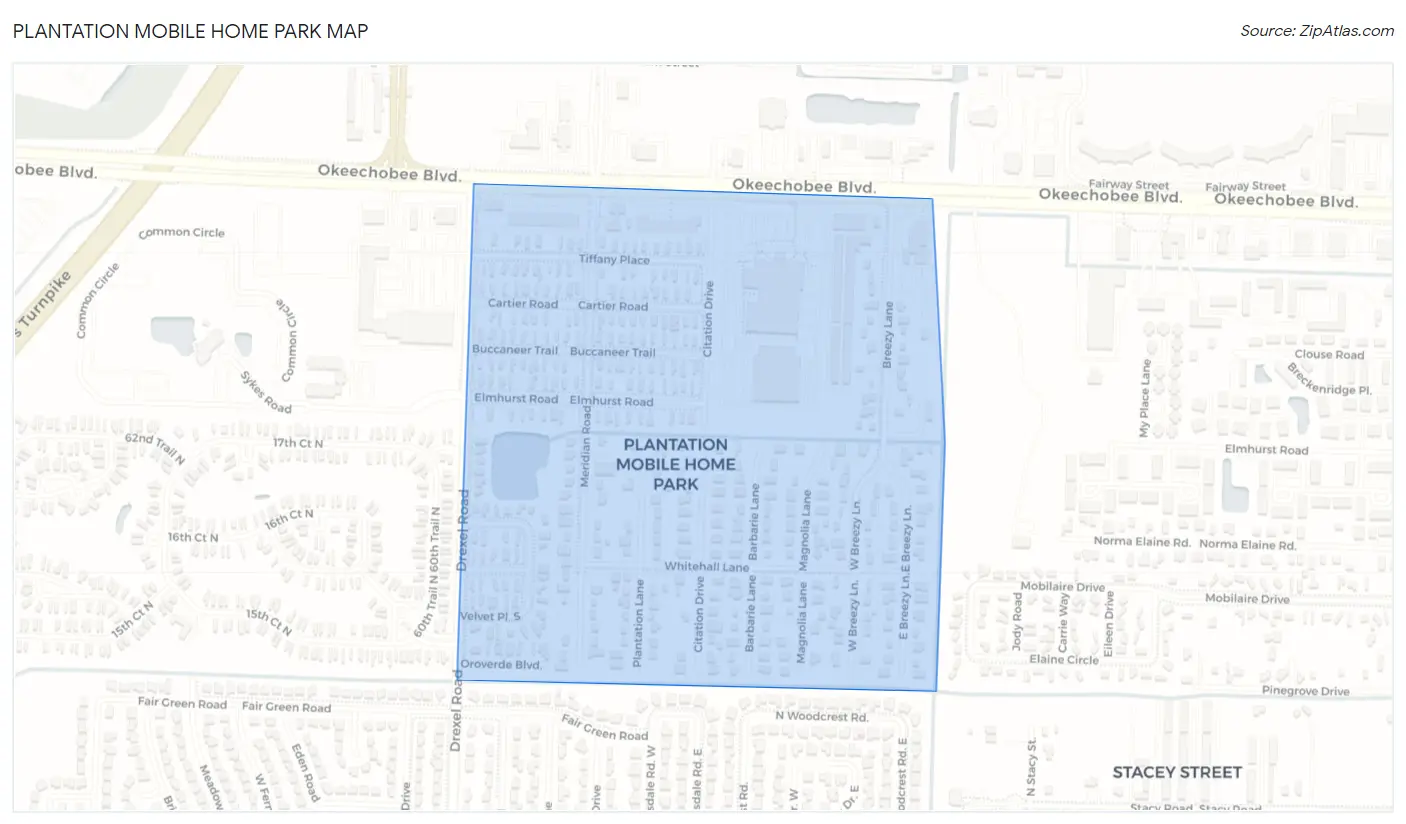
Plantation Mobile Home Park Overview
$23,848
PER CAPITA INCOME
$37,231
AVG FAMILY INCOME
$44,113
AVG HOUSEHOLD INCOME
14.7%
WAGE / INCOME GAP [ % ]
85.3¢/ $1
WAGE / INCOME GAP [ $ ]
0.40
INEQUALITY / GINI INDEX
1,540
TOTAL POPULATION
779
MALE POPULATION
761
FEMALE POPULATION
102.37
MALES / 100 FEMALES
97.69
FEMALES / 100 MALES
38.3
MEDIAN AGE
3.5
AVG FAMILY SIZE
3.5
AVG HOUSEHOLD SIZE
1,078
LABOR FORCE [ PEOPLE ]
77.3%
PERCENT IN LABOR FORCE
25.6%
UNEMPLOYMENT RATE
Income in Plantation Mobile Home Park
Income Overview in Plantation Mobile Home Park
Per Capita Income in Plantation Mobile Home Park is $23,848, while median incomes of families and households are $37,231 and $44,113 respectively.
| Characteristic | Number | Measure |
| Per Capita Income | 1,540 | $23,848 |
| Median Family Income | 380 | $37,231 |
| Mean Family Income | 380 | $68,269 |
| Median Household Income | 436 | $44,113 |
| Mean Household Income | 436 | $72,990 |
| Income Deficit | 380 | $0 |
| Wage / Income Gap (%) | 1,540 | 14.74% |
| Wage / Income Gap ($) | 1,540 | 85.26¢ per $1 |
| Gini / Inequality Index | 1,540 | 0.40 |
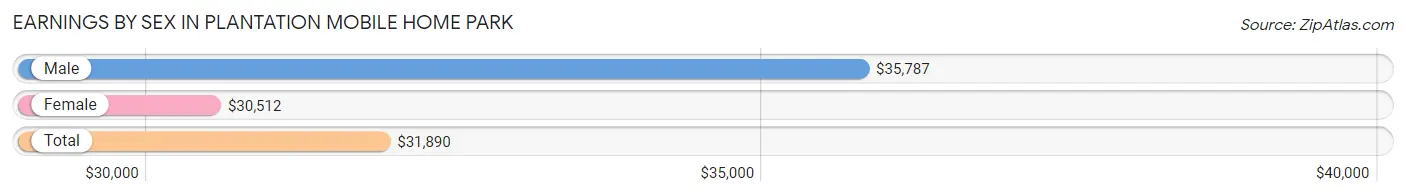
Earnings by Sex in Plantation Mobile Home Park
Average Earnings in Plantation Mobile Home Park are $31,890, $35,787 for men and $30,512 for women, a difference of 14.7%.
| Sex | Number | Average Earnings |
| Male | 432 (50.2%) | $35,787 |
| Female | 429 (49.8%) | $30,512 |
| Total | 861 (100.0%) | $31,890 |
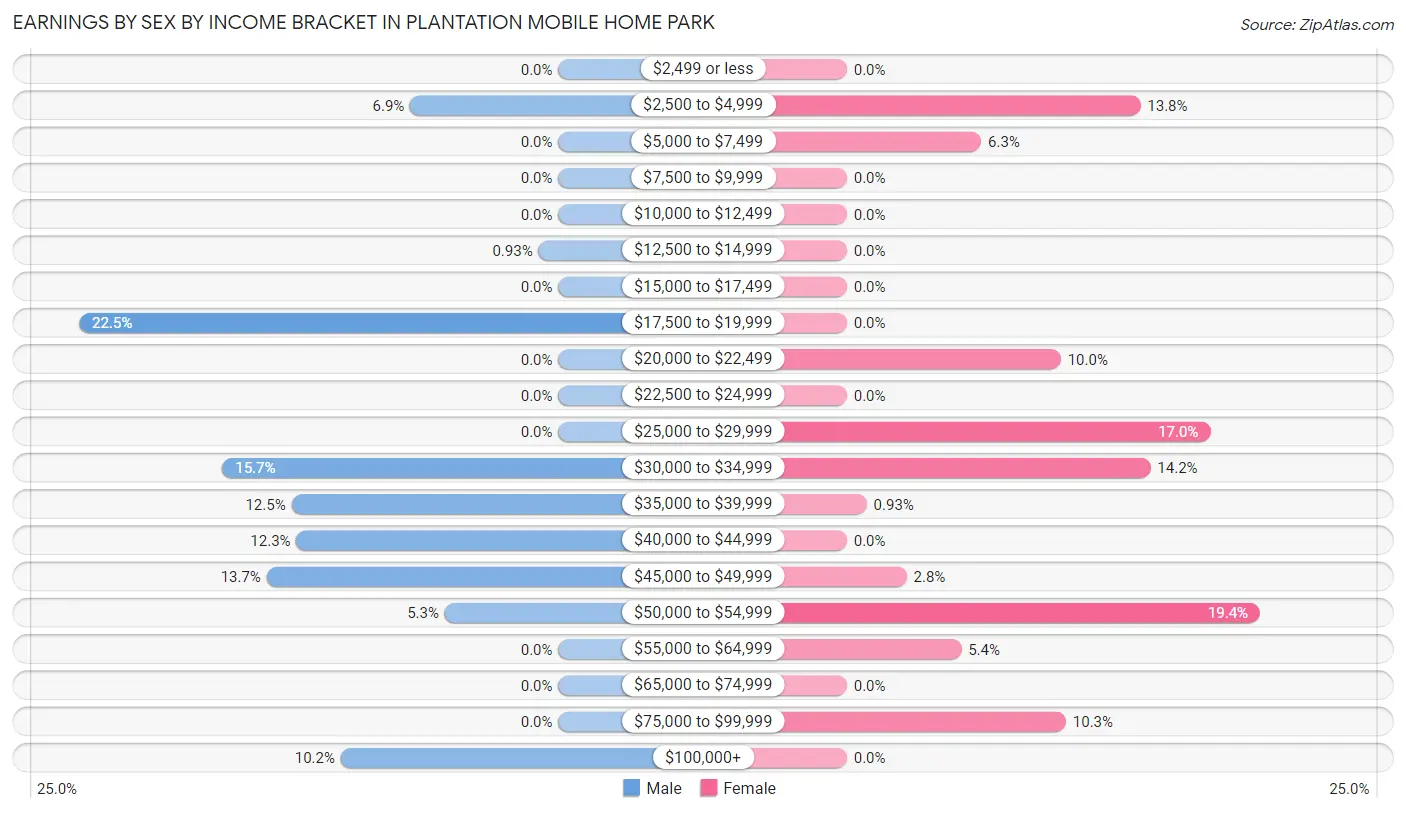
Earnings by Sex by Income Bracket in Plantation Mobile Home Park
The most common earnings brackets in Plantation Mobile Home Park are $17,500 to $19,999 for men (97 | 22.5%) and $50,000 to $54,999 for women (83 | 19.4%).
| Income | Male | Female |
| $2,499 or less | 0 (0.0%) | 0 (0.0%) |
| $2,500 to $4,999 | 30 (6.9%) | 59 (13.8%) |
| $5,000 to $7,499 | 0 (0.0%) | 27 (6.3%) |
| $7,500 to $9,999 | 0 (0.0%) | 0 (0.0%) |
| $10,000 to $12,499 | 0 (0.0%) | 0 (0.0%) |
| $12,500 to $14,999 | 4 (0.9%) | 0 (0.0%) |
| $15,000 to $17,499 | 0 (0.0%) | 0 (0.0%) |
| $17,500 to $19,999 | 97 (22.5%) | 0 (0.0%) |
| $20,000 to $22,499 | 0 (0.0%) | 43 (10.0%) |
| $22,500 to $24,999 | 0 (0.0%) | 0 (0.0%) |
| $25,000 to $29,999 | 0 (0.0%) | 73 (17.0%) |
| $30,000 to $34,999 | 68 (15.7%) | 61 (14.2%) |
| $35,000 to $39,999 | 54 (12.5%) | 4 (0.9%) |
| $40,000 to $44,999 | 53 (12.3%) | 0 (0.0%) |
| $45,000 to $49,999 | 59 (13.7%) | 12 (2.8%) |
| $50,000 to $54,999 | 23 (5.3%) | 83 (19.4%) |
| $55,000 to $64,999 | 0 (0.0%) | 23 (5.4%) |
| $65,000 to $74,999 | 0 (0.0%) | 0 (0.0%) |
| $75,000 to $99,999 | 0 (0.0%) | 44 (10.3%) |
| $100,000+ | 44 (10.2%) | 0 (0.0%) |
| Total | 432 (100.0%) | 429 (100.0%) |
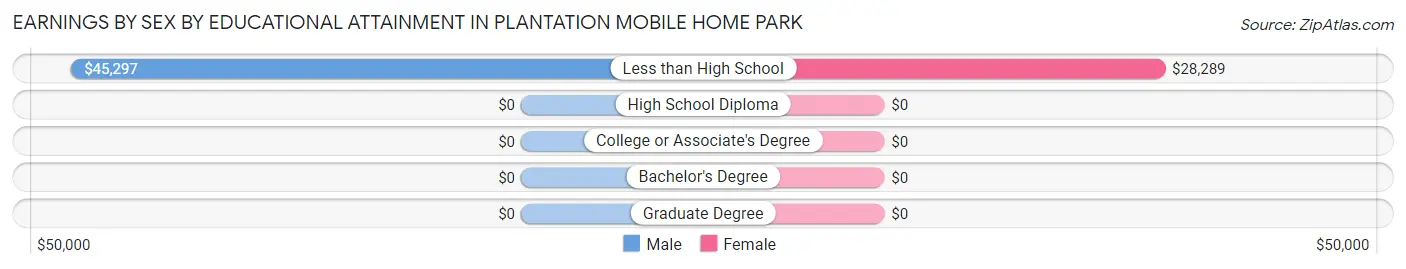
Earnings by Sex by Educational Attainment in Plantation Mobile Home Park
Average earnings in Plantation Mobile Home Park are $43,443 for men and $31,066 for women, a difference of 28.5%. Men with an educational attainment of less than high school enjoy the highest average annual earnings of $45,297, while those with less than high school education earn the least with $45,297. Women with an educational attainment of less than high school earn the most with the average annual earnings of $28,289, while those with less than high school education have the smallest earnings of $28,289.
| Educational Attainment | Male Income | Female Income |
| Less than High School | $45,297 | $28,289 |
| High School Diploma | - | - |
| College or Associate's Degree | - | - |
| Bachelor's Degree | - | - |
| Graduate Degree | - | - |
| Total | $43,443 | $31,066 |
Family Income in Plantation Mobile Home Park
Family Income Brackets in Plantation Mobile Home Park
According to the Plantation Mobile Home Park family income data, there are 158 families falling into the $35,000 to $49,999 income range, which is the most common income bracket and makes up 41.6% of all families.
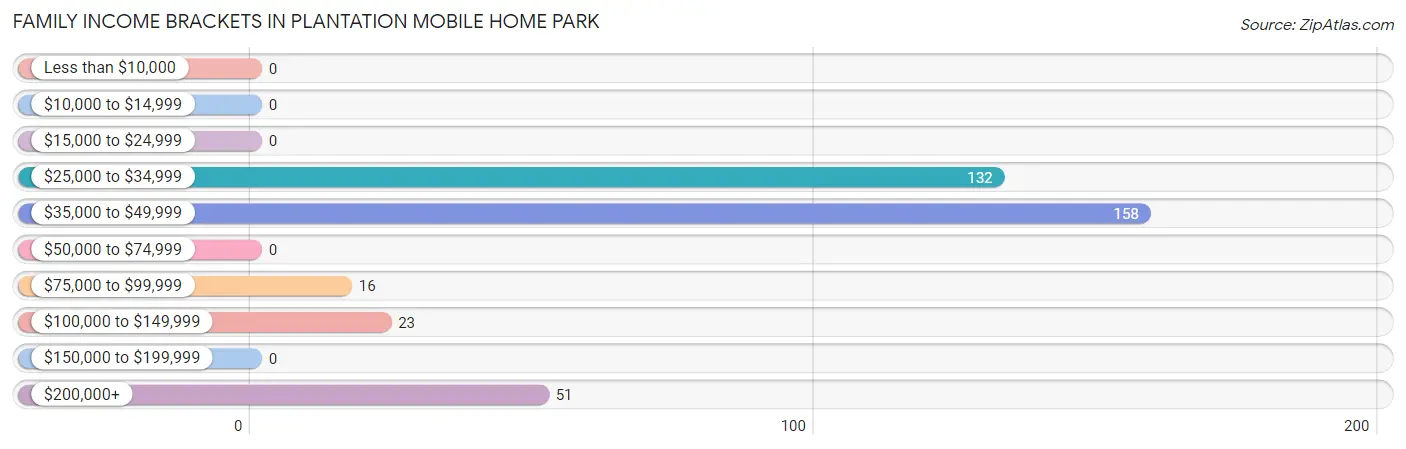
| Income Bracket | # Families | % Families |
| Less than $10,000 | 0 | 0.0% |
| $10,000 to $14,999 | 0 | 0.0% |
| $15,000 to $24,999 | 0 | 0.0% |
| $25,000 to $34,999 | 132 | 34.7% |
| $35,000 to $49,999 | 158 | 41.6% |
| $50,000 to $74,999 | 0 | 0.0% |
| $75,000 to $99,999 | 16 | 4.2% |
| $100,000 to $149,999 | 23 | 6.1% |
| $150,000 to $199,999 | 0 | 0.0% |
| $200,000+ | 51 | 13.4% |
Family Income by Famaliy Size in Plantation Mobile Home Park
2-person families (146 | 38.4%) account for the highest median family income in Plantation Mobile Home Park with $42,783 per family, while 2-person families (146 | 38.4%) have the highest median income of $21,392 per family member.
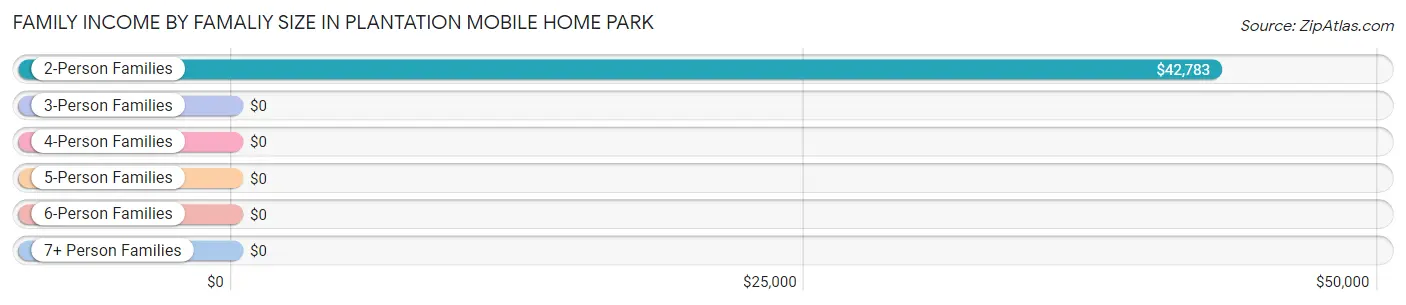
| Income Bracket | # Families | Median Income |
| 2-Person Families | 146 (38.4%) | $42,783 |
| 3-Person Families | 119 (31.3%) | $0 |
| 4-Person Families | 35 (9.2%) | $0 |
| 5-Person Families | 80 (21.0%) | $0 |
| 6-Person Families | 0 (0.0%) | $0 |
| 7+ Person Families | 0 (0.0%) | $0 |
| Total | 380 (100.0%) | $37,231 |
Family Income by Number of Earners in Plantation Mobile Home Park
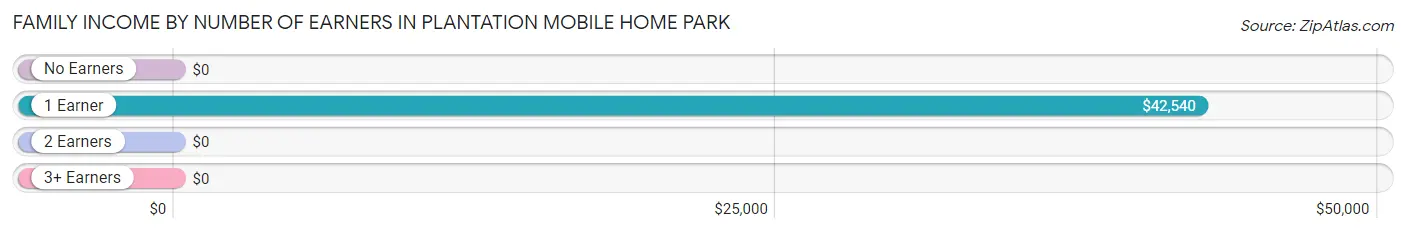
| Number of Earners | # Families | Median Income |
| No Earners | 0 (0.0%) | $0 |
| 1 Earner | 207 (54.5%) | $42,540 |
| 2 Earners | 117 (30.8%) | $0 |
| 3+ Earners | 56 (14.7%) | $0 |
| Total | 380 (100.0%) | $37,231 |
Household Income in Plantation Mobile Home Park
Household Income Brackets in Plantation Mobile Home Park
With 128 households falling in the category, the $35,000 to $49,999 income range is the most frequent in Plantation Mobile Home Park, accounting for 29.4% of all households.
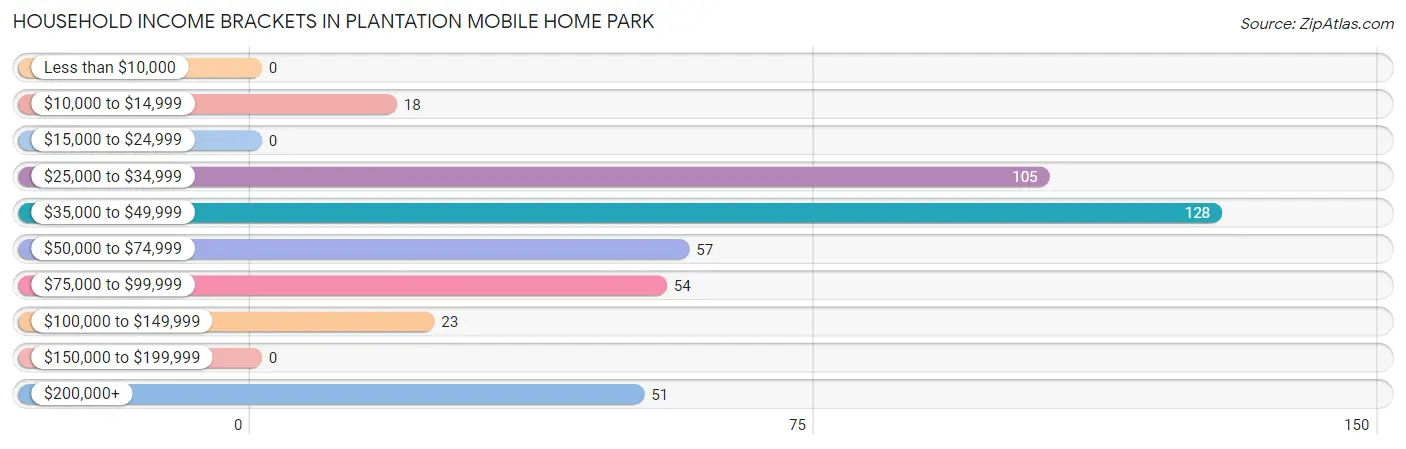
| Income Bracket | # Households | % Households |
| Less than $10,000 | 0 | 0.0% |
| $10,000 to $14,999 | 18 | 4.1% |
| $15,000 to $24,999 | 0 | 0.0% |
| $25,000 to $34,999 | 105 | 24.1% |
| $35,000 to $49,999 | 128 | 29.4% |
| $50,000 to $74,999 | 57 | 13.1% |
| $75,000 to $99,999 | 54 | 12.4% |
| $100,000 to $149,999 | 23 | 5.3% |
| $150,000 to $199,999 | 0 | 0.0% |
| $200,000+ | 51 | 11.7% |
Household Income by Householder Age in Plantation Mobile Home Park
The median household income in Plantation Mobile Home Park is $44,113, with the highest median household income of $43,514 found in the 25 to 44 years age bracket for the primary householder. A total of 249 households (57.1%) fall into this category. Meanwhile, the 15 to 24 years age bracket for the primary householder has the lowest median household income of $0, with 27 households (6.2%) in this group.
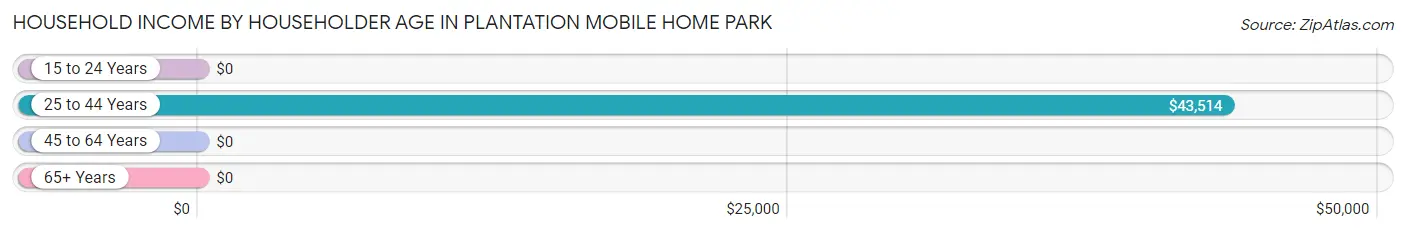
| Income Bracket | # Households | Median Income |
| 15 to 24 Years | 27 (6.2%) | $0 |
| 25 to 44 Years | 249 (57.1%) | $43,514 |
| 45 to 64 Years | 138 (31.7%) | $0 |
| 65+ Years | 22 (5.1%) | $0 |
| Total | 436 (100.0%) | $44,113 |
Poverty in Plantation Mobile Home Park
Income Below Poverty by Sex and Age in Plantation Mobile Home Park
With 21.6% poverty level for males and 26.7% for females among the residents of Plantation Mobile Home Park, 65 to 74 year old males and 12 to 14 year old females are the most vulnerable to poverty, with 18 males (43.9%) and 61 females (100.0%) in their respective age groups living below the poverty level.
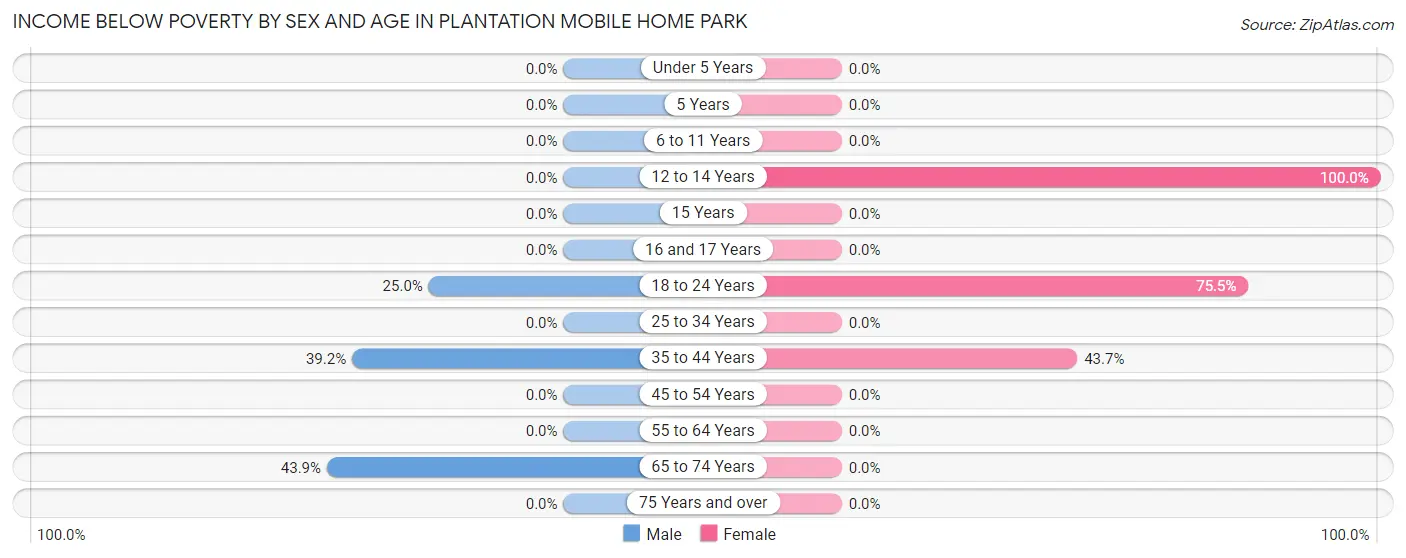
| Age Bracket | Male | Female |
| Under 5 Years | 0 (0.0%) | 0 (0.0%) |
| 5 Years | 0 (0.0%) | 0 (0.0%) |
| 6 to 11 Years | 0 (0.0%) | 0 (0.0%) |
| 12 to 14 Years | 0 (0.0%) | 61 (100.0%) |
| 15 Years | 0 (0.0%) | 0 (0.0%) |
| 16 and 17 Years | 0 (0.0%) | 0 (0.0%) |
| 18 to 24 Years | 68 (25.0%) | 83 (75.4%) |
| 25 to 34 Years | 0 (0.0%) | 0 (0.0%) |
| 35 to 44 Years | 82 (39.2%) | 59 (43.7%) |
| 45 to 54 Years | 0 (0.0%) | 0 (0.0%) |
| 55 to 64 Years | 0 (0.0%) | 0 (0.0%) |
| 65 to 74 Years | 18 (43.9%) | 0 (0.0%) |
| 75 Years and over | 0 (0.0%) | 0 (0.0%) |
| Total | 168 (21.6%) | 203 (26.7%) |
Income Above Poverty by Sex and Age in Plantation Mobile Home Park
According to the poverty statistics in Plantation Mobile Home Park, males aged 6 to 11 years and females aged 6 to 11 years are the age groups that are most secure financially, with 100.0% of males and 100.0% of females in these age groups living above the poverty line.
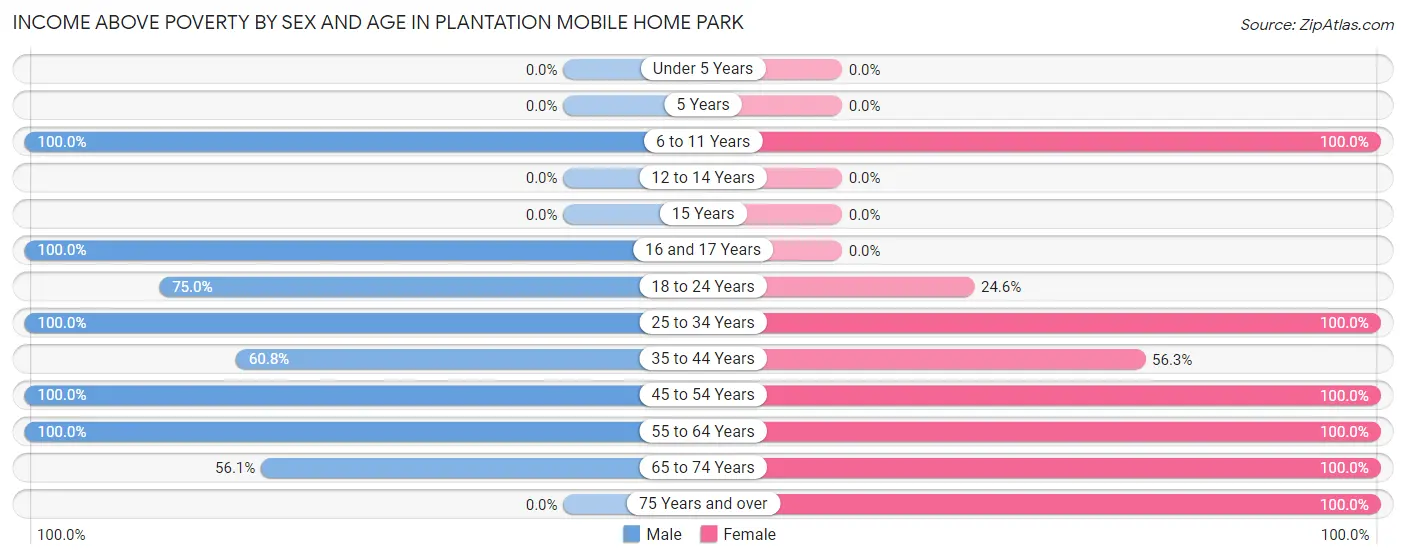
| Age Bracket | Male | Female |
| Under 5 Years | 0 (0.0%) | 0 (0.0%) |
| 5 Years | 0 (0.0%) | 0 (0.0%) |
| 6 to 11 Years | 41 (100.0%) | 44 (100.0%) |
| 12 to 14 Years | 0 (0.0%) | 0 (0.0%) |
| 15 Years | 0 (0.0%) | 0 (0.0%) |
| 16 and 17 Years | 21 (100.0%) | 0 (0.0%) |
| 18 to 24 Years | 204 (75.0%) | 27 (24.5%) |
| 25 to 34 Years | 34 (100.0%) | 115 (100.0%) |
| 35 to 44 Years | 127 (60.8%) | 76 (56.3%) |
| 45 to 54 Years | 82 (100.0%) | 104 (100.0%) |
| 55 to 64 Years | 79 (100.0%) | 88 (100.0%) |
| 65 to 74 Years | 23 (56.1%) | 85 (100.0%) |
| 75 Years and over | 0 (0.0%) | 19 (100.0%) |
| Total | 611 (78.4%) | 558 (73.3%) |
Income Below Poverty Among Married-Couple Families in Plantation Mobile Home Park
The poverty statistics for married-couple families in Plantation Mobile Home Park show that 43.3% or 68 of the total 157 families live below the poverty line. Families with 1 or 2 children have the highest poverty rate of 100.0%, comprising of 68 families. On the other hand, families with no children have the lowest poverty rate of 0.0%, which includes 0 families.
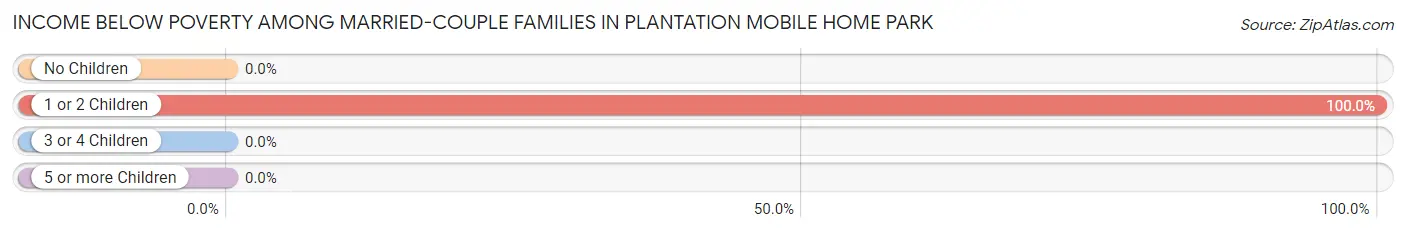
| Children | Above Poverty | Below Poverty |
| No Children | 89 (100.0%) | 0 (0.0%) |
| 1 or 2 Children | 0 (0.0%) | 68 (100.0%) |
| 3 or 4 Children | 0 (0.0%) | 0 (0.0%) |
| 5 or more Children | 0 (0.0%) | 0 (0.0%) |
| Total | 89 (56.7%) | 68 (43.3%) |
Income Below Poverty Among Single-Parent Households in Plantation Mobile Home Park
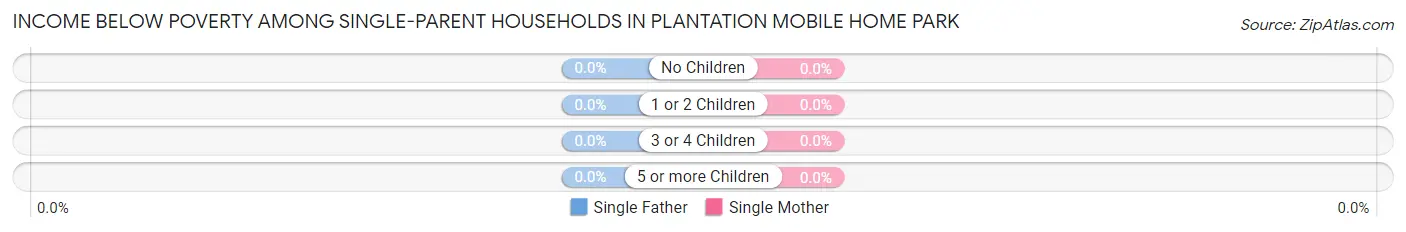
| Children | Single Father | Single Mother |
| No Children | 0 (0.0%) | 0 (0.0%) |
| 1 or 2 Children | 0 (0.0%) | 0 (0.0%) |
| 3 or 4 Children | 0 (0.0%) | 0 (0.0%) |
| 5 or more Children | 0 (0.0%) | 0 (0.0%) |
| Total | 0 (0.0%) | 0 (0.0%) |
Income Below Poverty Among Married-Couple vs Single-Parent Households in Plantation Mobile Home Park
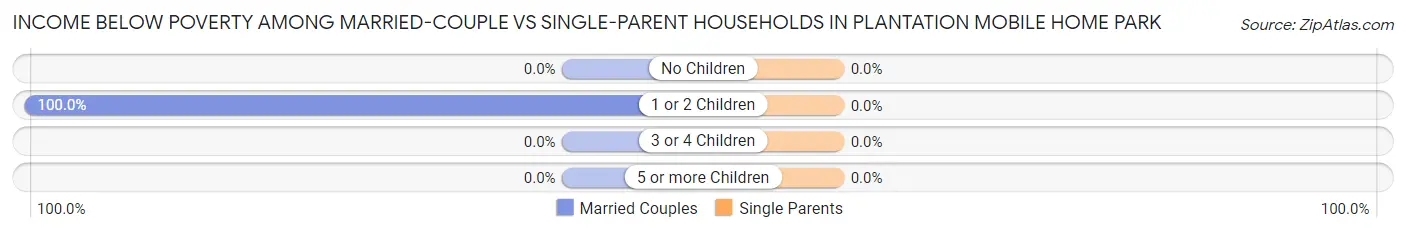
| Children | Married-Couple Families | Single-Parent Households |
| No Children | 0 (0.0%) | 0 (0.0%) |
| 1 or 2 Children | 68 (100.0%) | 0 (0.0%) |
| 3 or 4 Children | 0 (0.0%) | 0 (0.0%) |
| 5 or more Children | 0 (0.0%) | 0 (0.0%) |
| Total | 68 (43.3%) | 0 (0.0%) |
Race in Plantation Mobile Home Park
The most populous races in Plantation Mobile Home Park are White / Caucasian (1,026 | 66.6%), Hispanic or Latino (835 | 54.2%), and Two or more Races (253 | 16.4%).
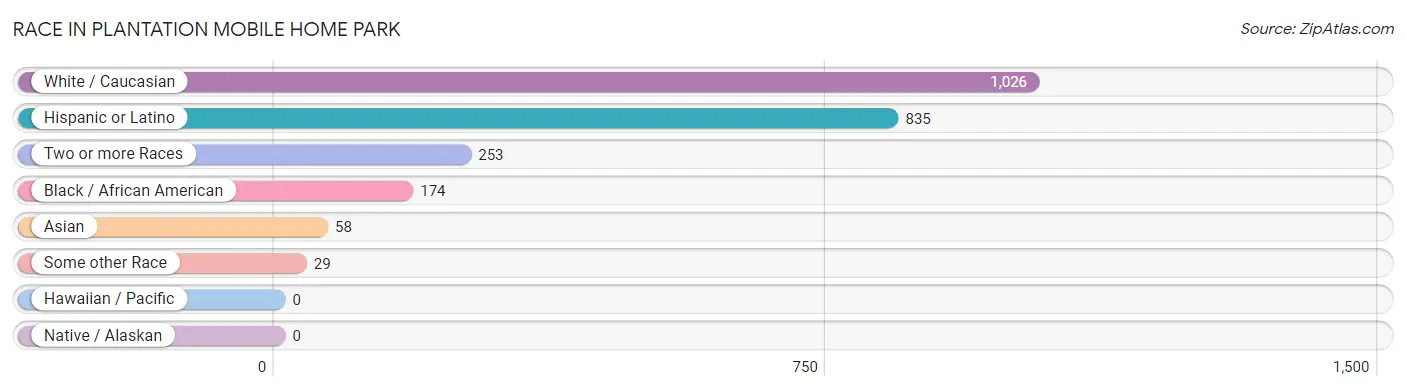
| Race | # Population | % Population |
| Asian | 58 | 3.8% |
| Black / African American | 174 | 11.3% |
| Hawaiian / Pacific | 0 | 0.0% |
| Hispanic or Latino | 835 | 54.2% |
| Native / Alaskan | 0 | 0.0% |
| White / Caucasian | 1,026 | 66.6% |
| Two or more Races | 253 | 16.4% |
| Some other Race | 29 | 1.9% |
| Total | 1,540 | 100.0% |
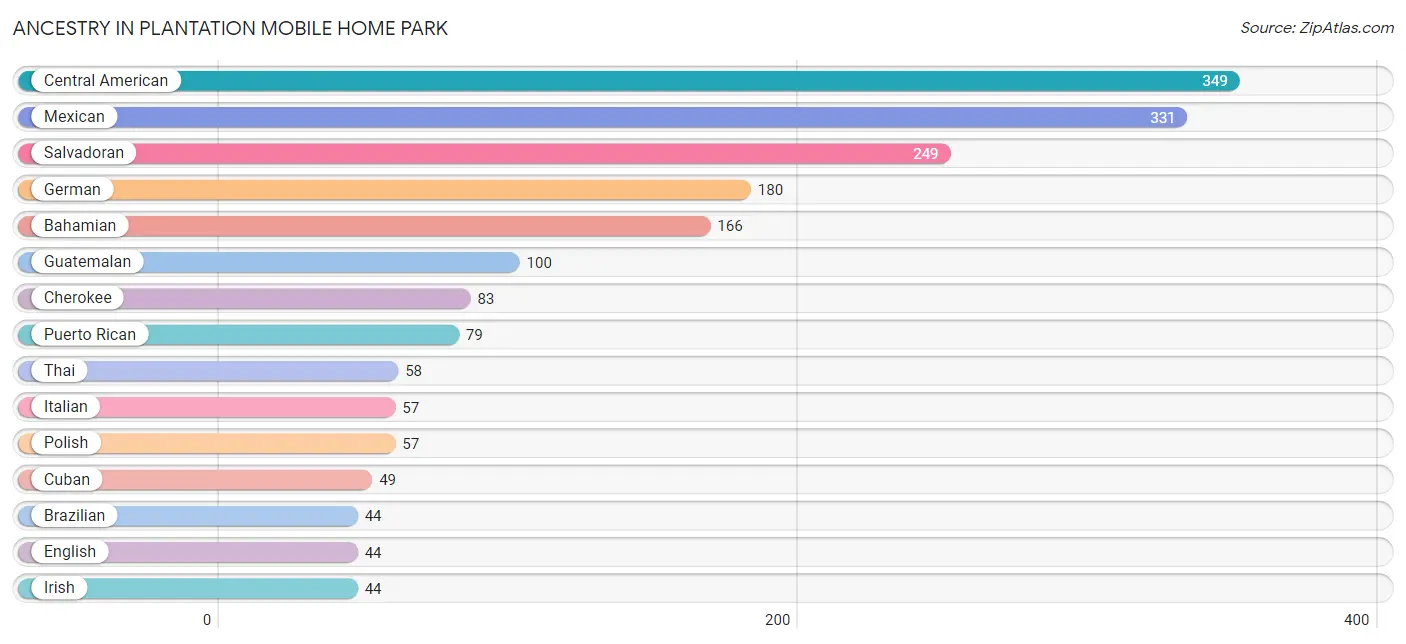
Ancestry in Plantation Mobile Home Park
The most populous ancestries reported in Plantation Mobile Home Park are Central American (349 | 22.7%), Mexican (331 | 21.5%), Salvadoran (249 | 16.2%), German (180 | 11.7%), and Bahamian (166 | 10.8%), together accounting for 82.8% of all Plantation Mobile Home Park residents.
| Ancestry | # Population | % Population |
| American | 41 | 2.7% |
| Bahamian | 166 | 10.8% |
| Brazilian | 44 | 2.9% |
| Central American | 349 | 22.7% |
| Cherokee | 83 | 5.4% |
| Cuban | 49 | 3.2% |
| Dominican | 27 | 1.8% |
| English | 44 | 2.9% |
| German | 180 | 11.7% |
| Guatemalan | 100 | 6.5% |
| Irish | 44 | 2.9% |
| Italian | 57 | 3.7% |
| Mexican | 331 | 21.5% |
| Polish | 57 | 3.7% |
| Puerto Rican | 79 | 5.1% |
| Russian | 30 | 1.9% |
| Salvadoran | 249 | 16.2% |
| Thai | 58 | 3.8% | View All 18 Rows |
Immigrants in Plantation Mobile Home Park
The most numerous immigrant groups reported in Plantation Mobile Home Park came from Latin America (548 | 35.6%), Central America (387 | 25.1%), El Salvador (188 | 12.2%), Mexico (156 | 10.1%), and Caribbean (117 | 7.6%), together accounting for 90.6% of all Plantation Mobile Home Park residents.
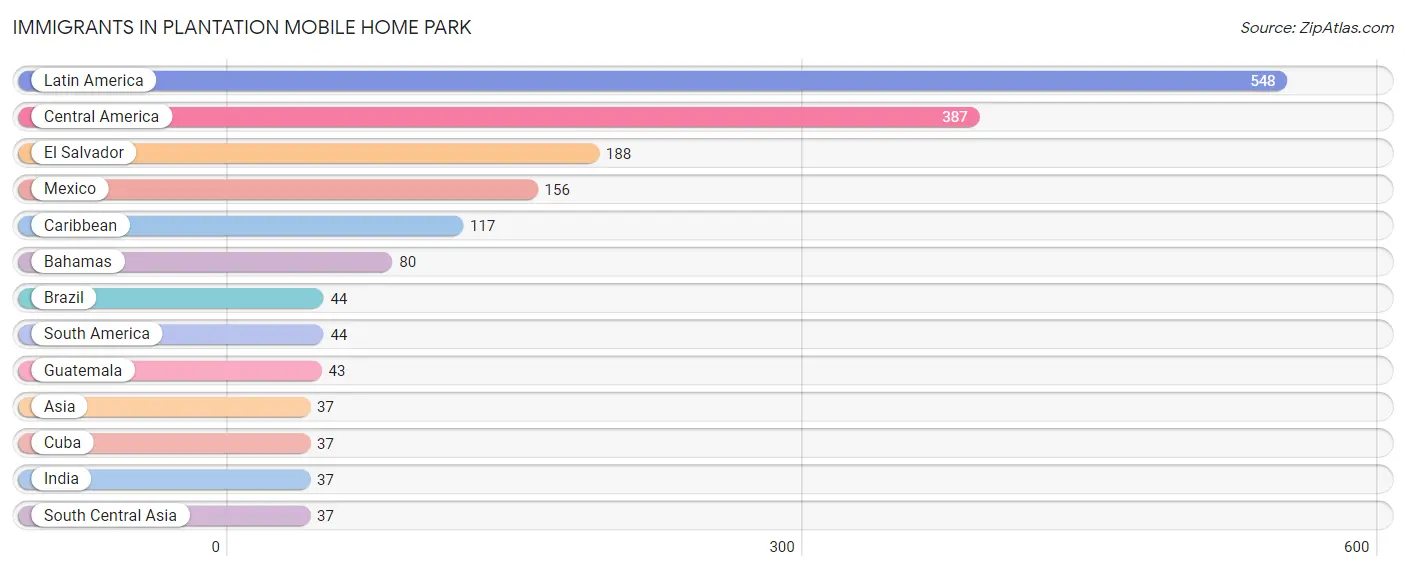
| Immigration Origin | # Population | % Population |
| Asia | 37 | 2.4% |
| Bahamas | 80 | 5.2% |
| Brazil | 44 | 2.9% |
| Caribbean | 117 | 7.6% |
| Central America | 387 | 25.1% |
| Cuba | 37 | 2.4% |
| El Salvador | 188 | 12.2% |
| Guatemala | 43 | 2.8% |
| India | 37 | 2.4% |
| Latin America | 548 | 35.6% |
| Mexico | 156 | 10.1% |
| South America | 44 | 2.9% |
| South Central Asia | 37 | 2.4% | View All 13 Rows |
Sex and Age in Plantation Mobile Home Park
Sex and Age in Plantation Mobile Home Park
The most populous age groups in Plantation Mobile Home Park are 15 to 19 Years (209 | 26.8%) for men and 20 to 24 Years (110 | 14.4%) for women.
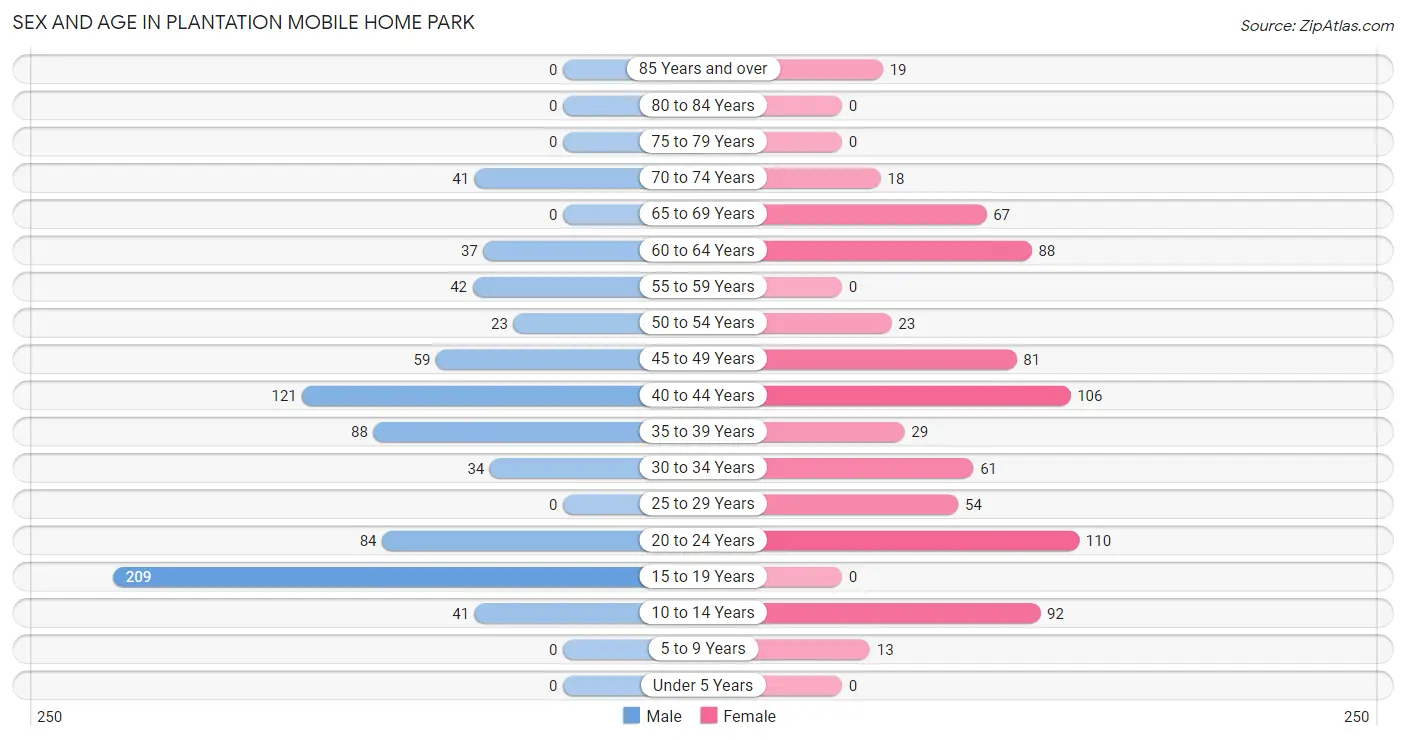
| Age Bracket | Male | Female |
| Under 5 Years | 0 (0.0%) | 0 (0.0%) |
| 5 to 9 Years | 0 (0.0%) | 13 (1.7%) |
| 10 to 14 Years | 41 (5.3%) | 92 (12.1%) |
| 15 to 19 Years | 209 (26.8%) | 0 (0.0%) |
| 20 to 24 Years | 84 (10.8%) | 110 (14.4%) |
| 25 to 29 Years | 0 (0.0%) | 54 (7.1%) |
| 30 to 34 Years | 34 (4.4%) | 61 (8.0%) |
| 35 to 39 Years | 88 (11.3%) | 29 (3.8%) |
| 40 to 44 Years | 121 (15.5%) | 106 (13.9%) |
| 45 to 49 Years | 59 (7.6%) | 81 (10.6%) |
| 50 to 54 Years | 23 (2.9%) | 23 (3.0%) |
| 55 to 59 Years | 42 (5.4%) | 0 (0.0%) |
| 60 to 64 Years | 37 (4.8%) | 88 (11.6%) |
| 65 to 69 Years | 0 (0.0%) | 67 (8.8%) |
| 70 to 74 Years | 41 (5.3%) | 18 (2.4%) |
| 75 to 79 Years | 0 (0.0%) | 0 (0.0%) |
| 80 to 84 Years | 0 (0.0%) | 0 (0.0%) |
| 85 Years and over | 0 (0.0%) | 19 (2.5%) |
| Total | 779 (100.0%) | 761 (100.0%) |
Families and Households in Plantation Mobile Home Park
Median Family Size in Plantation Mobile Home Park
The median family size in Plantation Mobile Home Park is 3.49 persons per family, with single female/mother families (103 | 27.1%) accounting for the largest median family size of 4.6 persons per family. On the other hand, single male/father families (120 | 31.6%) represent the smallest median family size with 1.99 persons per family.
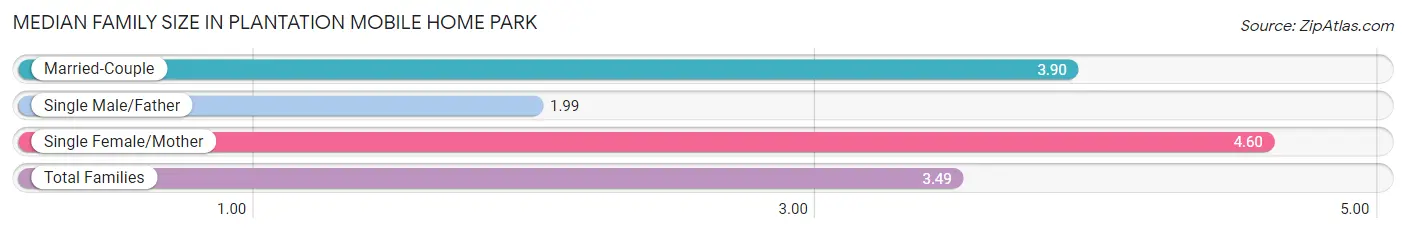
| Family Type | # Families | Family Size |
| Married-Couple | 157 (41.3%) | 3.90 |
| Single Male/Father | 120 (31.6%) | 1.99 |
| Single Female/Mother | 103 (27.1%) | 4.60 |
| Total Families | 380 (100.0%) | 3.49 |
Median Household Size in Plantation Mobile Home Park
The median household size in Plantation Mobile Home Park is 3.53 persons per household, with single female/mother households (103 | 23.6%) accounting for the largest median household size of 4.97 persons per household. non-family households (56 | 12.8%) represent the smallest median household size with 2.05 persons per household.
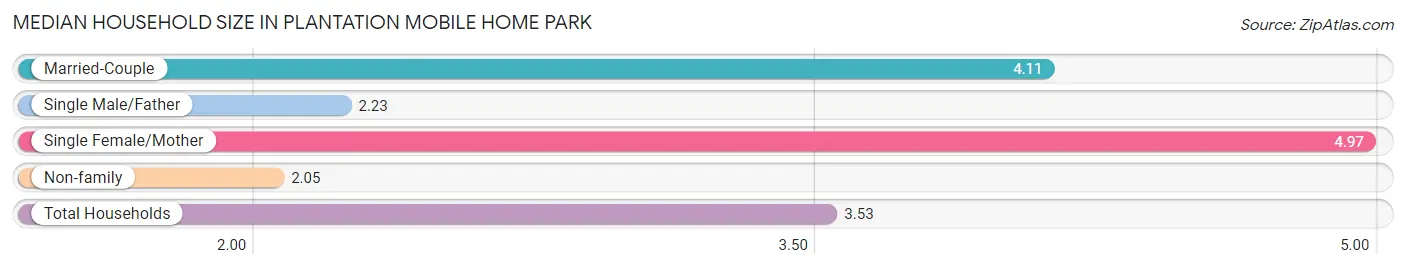
| Household Type | # Households | Household Size |
| Married-Couple | 157 (36.0%) | 4.11 |
| Single Male/Father | 120 (27.5%) | 2.23 |
| Single Female/Mother | 103 (23.6%) | 4.97 |
| Non-family | 56 (12.8%) | 2.05 |
| Total Households | 436 (100.0%) | 3.53 |
Household Size by Marriage Status in Plantation Mobile Home Park
Out of a total of 436 households in Plantation Mobile Home Park, 380 (87.2%) are family households, while 56 (12.8%) are nonfamily households. The most numerous type of family households are 2-person households, comprising 116, and the most common type of nonfamily households are 2-person households, comprising 38.
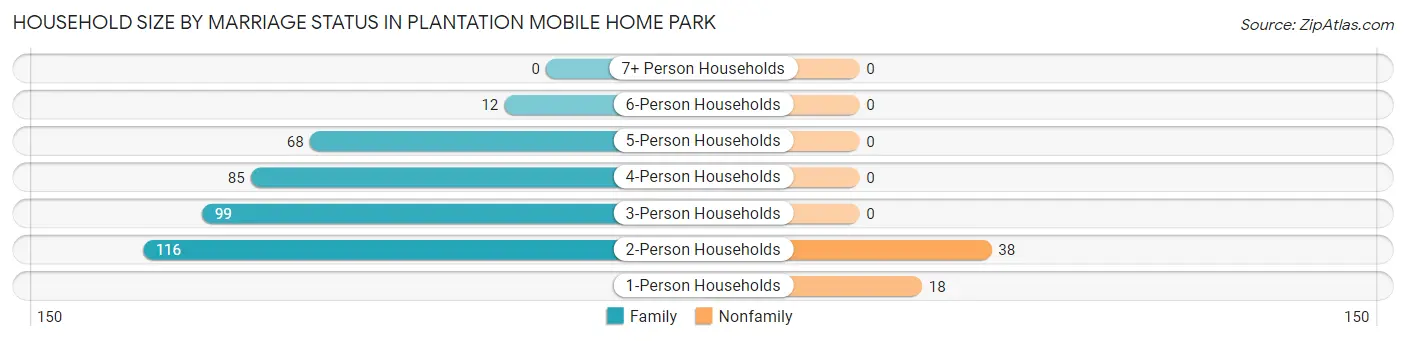
| Household Size | Family Households | Nonfamily Households |
| 1-Person Households | - | 18 (4.1%) |
| 2-Person Households | 116 (26.6%) | 38 (8.7%) |
| 3-Person Households | 99 (22.7%) | 0 (0.0%) |
| 4-Person Households | 85 (19.5%) | 0 (0.0%) |
| 5-Person Households | 68 (15.6%) | 0 (0.0%) |
| 6-Person Households | 12 (2.8%) | 0 (0.0%) |
| 7+ Person Households | 0 (0.0%) | 0 (0.0%) |
| Total | 380 (87.2%) | 56 (12.8%) |
Female Fertility in Plantation Mobile Home Park
Fertility by Age in Plantation Mobile Home Park
| Age Bracket | Women with Births | Births / 1,000 Women |
| 15 to 19 years | 0 (0.0%) | 0.0 |
| 20 to 34 years | 0 (0.0%) | 0.0 |
| 35 to 50 years | 0 (0.0%) | 0.0 |
| Total | 0 (0.0%) | 0.0 |
Fertility by Age by Marriage Status in Plantation Mobile Home Park
| Age Bracket | Married | Unmarried |
| 15 to 19 years | 0 (0.0%) | 0 (0.0%) |
| 20 to 34 years | 0 (0.0%) | 0 (0.0%) |
| 35 to 50 years | 0 (0.0%) | 0 (0.0%) |
| Total | 0 (0.0%) | 0 (0.0%) |
Fertility by Education in Plantation Mobile Home Park
| Educational Attainment | Women with Births | Births / 1,000 Women |
| Less than High School | 0 (0.0%) | 0.0 |
| High School Diploma | 0 (0.0%) | 0.0 |
| College or Associate's Degree | 0 (0.0%) | 0.0 |
| Bachelor's Degree | 0 (0.0%) | 0.0 |
| Graduate Degree | 0 (0.0%) | 0.0 |
| Total | 0 (0.0%) | 0.0 |
Fertility by Education by Marriage Status in Plantation Mobile Home Park
| Educational Attainment | Married | Unmarried |
| Less than High School | 0 (0.0%) | 0 (0.0%) |
| High School Diploma | 0 (0.0%) | 0 (0.0%) |
| College or Associate's Degree | 0 (0.0%) | 0 (0.0%) |
| Bachelor's Degree | 0 (0.0%) | 0 (0.0%) |
| Graduate Degree | 0 (0.0%) | 0 (0.0%) |
| Total | 0 (0.0%) | 0 (0.0%) |
Employment Characteristics in Plantation Mobile Home Park
Employment by Class of Employer in Plantation Mobile Home Park
Among the 802 employed individuals in Plantation Mobile Home Park, private company employees (725 | 90.4%), self-employed (not incorporated) (38 | 4.7%), and state government employees (23 | 2.9%) make up the most common classes of employment.
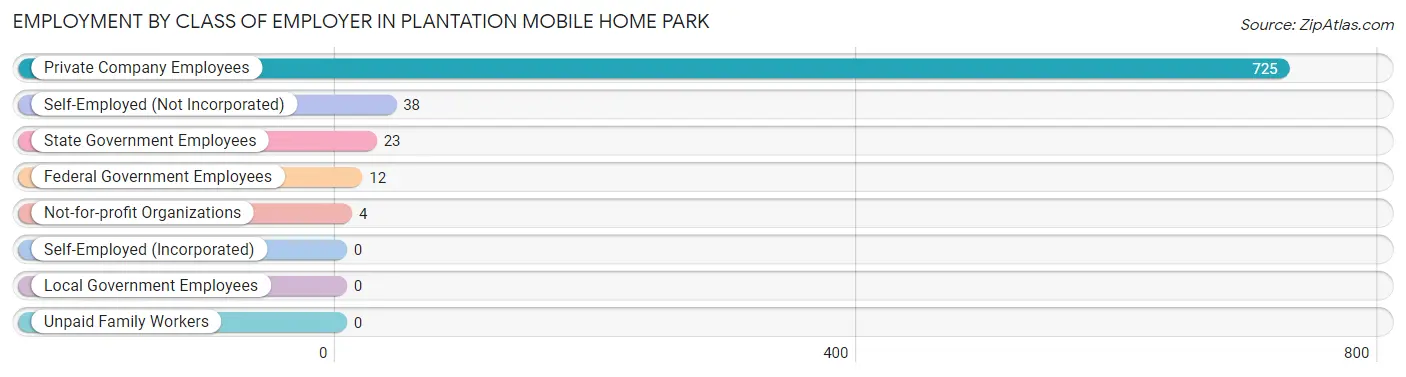
| Employer Class | # Employees | % Employees |
| Private Company Employees | 725 | 90.4% |
| Self-Employed (Incorporated) | 0 | 0.0% |
| Self-Employed (Not Incorporated) | 38 | 4.7% |
| Not-for-profit Organizations | 4 | 0.5% |
| Local Government Employees | 0 | 0.0% |
| State Government Employees | 23 | 2.9% |
| Federal Government Employees | 12 | 1.5% |
| Unpaid Family Workers | 0 | 0.0% |
| Total | 802 | 100.0% |
Employment Status by Age in Plantation Mobile Home Park
According to the labor force statistics for Plantation Mobile Home Park, out of the total population over 16 years of age (1,394), 77.3% or 1,078 individuals are in the labor force, with 25.6% or 276 of them unemployed. The age group with the highest labor force participation rate is 20 to 24 years, with 100.0% or 194 individuals in the labor force. Within the labor force, the 16 to 19 years age range has the highest percentage of unemployed individuals, with 81.7% or 134 of them being unemployed.
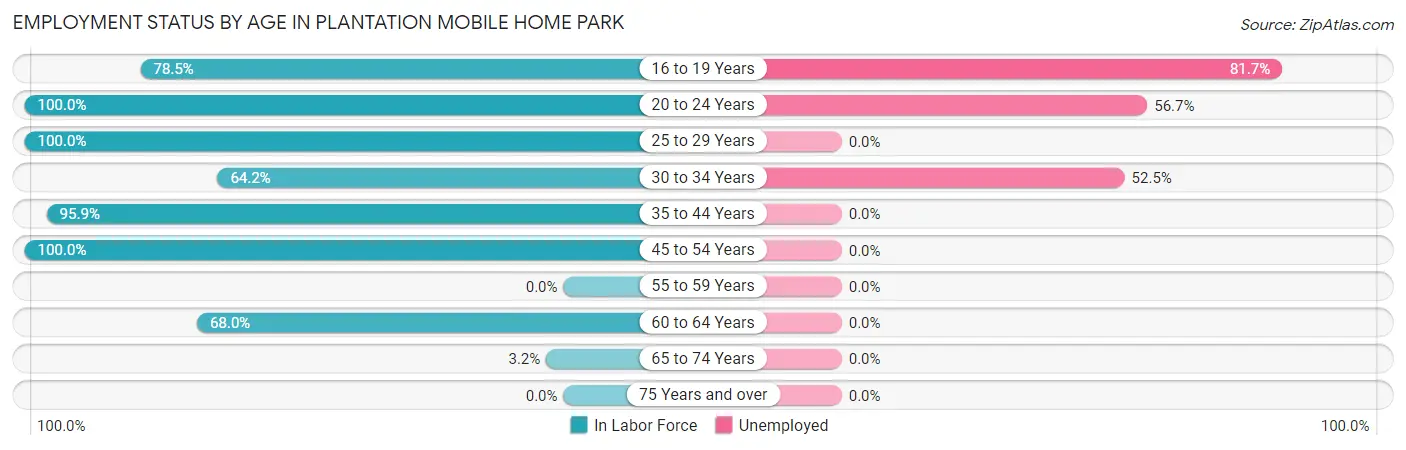
| Age Bracket | In Labor Force | Unemployed |
| 16 to 19 Years | 164 (78.5%) | 134 (81.7%) |
| 20 to 24 Years | 194 (100.0%) | 110 (56.7%) |
| 25 to 29 Years | 54 (100.0%) | 0 (0.0%) |
| 30 to 34 Years | 61 (64.2%) | 32 (52.5%) |
| 35 to 44 Years | 330 (95.9%) | 0 (0.0%) |
| 45 to 54 Years | 186 (100.0%) | 0 (0.0%) |
| 55 to 59 Years | 0 (0.0%) | 0 (0.0%) |
| 60 to 64 Years | 85 (68.0%) | 0 (0.0%) |
| 65 to 74 Years | 4 (3.2%) | 0 (0.0%) |
| 75 Years and over | 0 (0.0%) | 0 (0.0%) |
| Total | 1,078 (77.3%) | 276 (25.6%) |
Employment Status by Educational Attainment in Plantation Mobile Home Park
According to labor force statistics for Plantation Mobile Home Park, 84.6% of individuals (716) out of the total population between 25 and 64 years of age (846) are in the labor force, with 4.5% or 32 of them being unemployed. The group with the highest labor force participation rate are those with the educational attainment of college / associate degree, with 100.0% or 52 individuals in the labor force. Within the labor force, individuals with bachelor's degree or higher education have the highest percentage of unemployment, with 28.3% or 32 of them being unemployed.
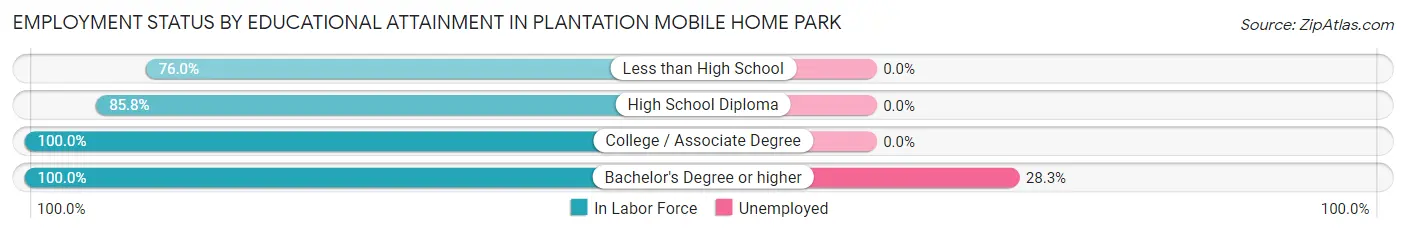
| Educational Attainment | In Labor Force | Unemployed |
| Less than High School | 260 (76.0%) | 0 (0.0%) |
| High School Diploma | 291 (85.8%) | 0 (0.0%) |
| College / Associate Degree | 52 (100.0%) | 0 (0.0%) |
| Bachelor's Degree or higher | 113 (100.0%) | 32 (28.3%) |
| Total | 716 (84.6%) | 38 (4.5%) |
Employment Occupations by Sex in Plantation Mobile Home Park
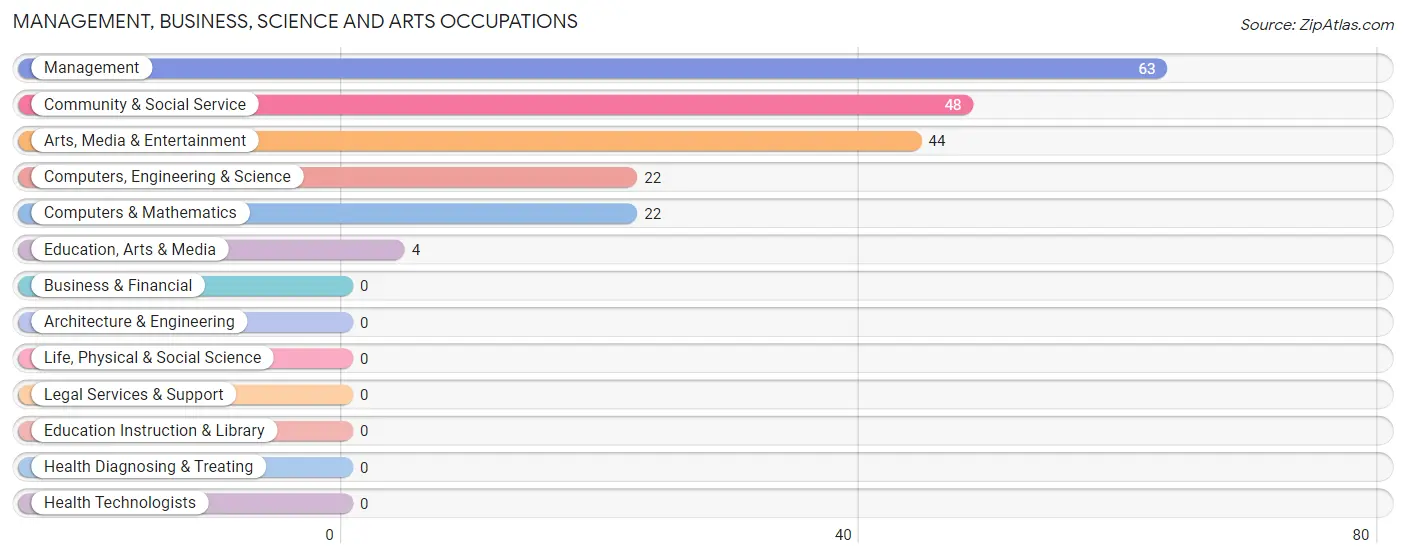
Management, Business, Science and Arts Occupations
The most common Management, Business, Science and Arts occupations in Plantation Mobile Home Park are Management (63 | 7.9%), Community & Social Service (48 | 6.0%), Arts, Media & Entertainment (44 | 5.5%), Computers, Engineering & Science (22 | 2.7%), and Computers & Mathematics (22 | 2.7%).
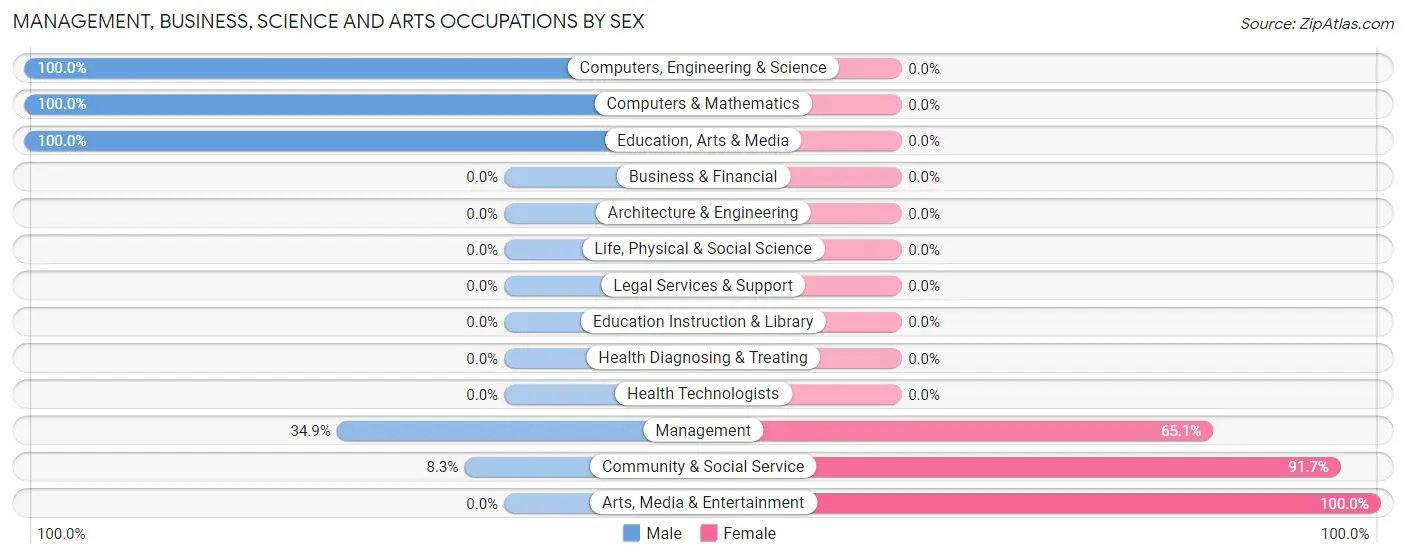
Management, Business, Science and Arts Occupations by Sex
Within the Management, Business, Science and Arts occupations in Plantation Mobile Home Park, the most male-oriented occupations are Computers, Engineering & Science (100.0%), Computers & Mathematics (100.0%), and Education, Arts & Media (100.0%), while the most female-oriented occupations are Arts, Media & Entertainment (100.0%), Community & Social Service (91.7%), and Management (65.1%).
| Occupation | Male | Female |
| Management | 22 (34.9%) | 41 (65.1%) |
| Business & Financial | 0 (0.0%) | 0 (0.0%) |
| Computers, Engineering & Science | 22 (100.0%) | 0 (0.0%) |
| Computers & Mathematics | 22 (100.0%) | 0 (0.0%) |
| Architecture & Engineering | 0 (0.0%) | 0 (0.0%) |
| Life, Physical & Social Science | 0 (0.0%) | 0 (0.0%) |
| Community & Social Service | 4 (8.3%) | 44 (91.7%) |
| Education, Arts & Media | 4 (100.0%) | 0 (0.0%) |
| Legal Services & Support | 0 (0.0%) | 0 (0.0%) |
| Education Instruction & Library | 0 (0.0%) | 0 (0.0%) |
| Arts, Media & Entertainment | 0 (0.0%) | 44 (100.0%) |
| Health Diagnosing & Treating | 0 (0.0%) | 0 (0.0%) |
| Health Technologists | 0 (0.0%) | 0 (0.0%) |
| Total (Category) | 48 (36.1%) | 85 (63.9%) |
| Total (Overall) | 432 (53.9%) | 370 (46.1%) |
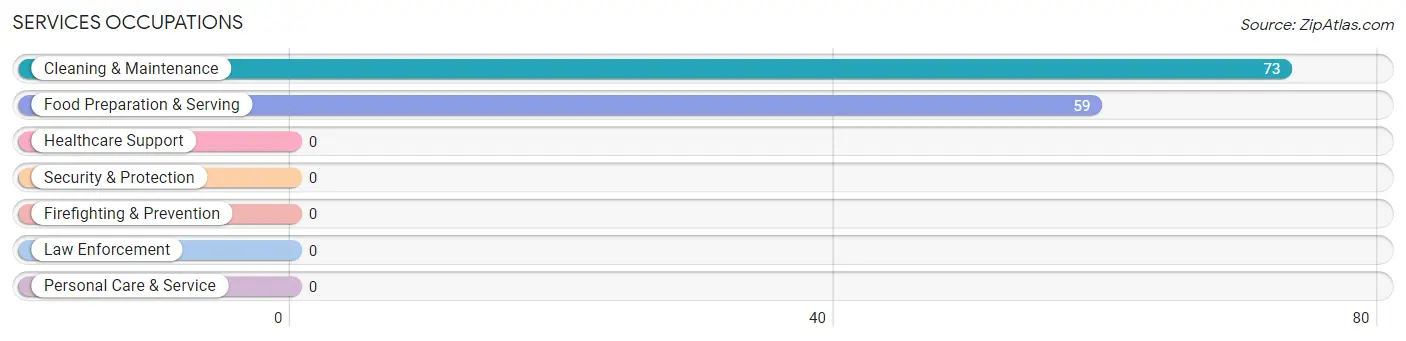
Services Occupations
The most common Services occupations in Plantation Mobile Home Park are Cleaning & Maintenance (73 | 9.1%), and Food Preparation & Serving (59 | 7.4%).
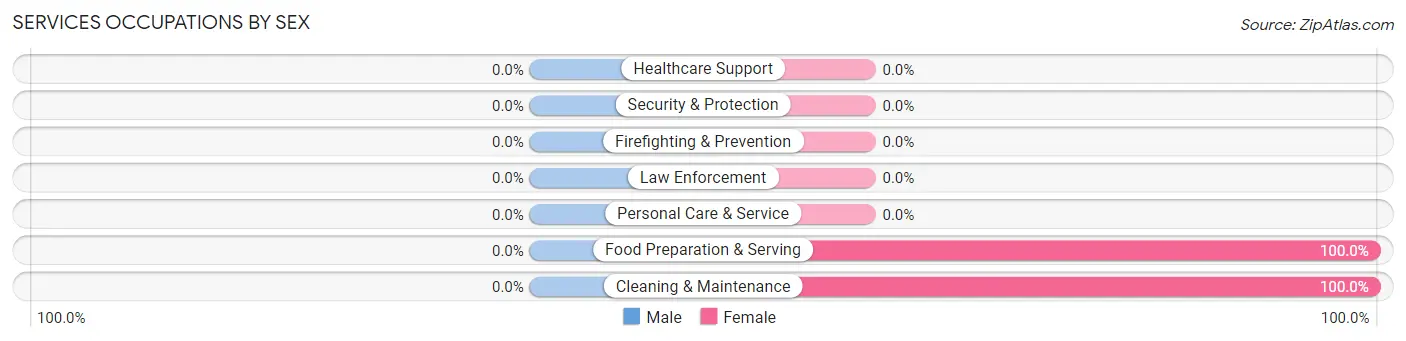
Services Occupations by Sex
| Occupation | Male | Female |
| Healthcare Support | 0 (0.0%) | 0 (0.0%) |
| Security & Protection | 0 (0.0%) | 0 (0.0%) |
| Firefighting & Prevention | 0 (0.0%) | 0 (0.0%) |
| Law Enforcement | 0 (0.0%) | 0 (0.0%) |
| Food Preparation & Serving | 0 (0.0%) | 59 (100.0%) |
| Cleaning & Maintenance | 0 (0.0%) | 73 (100.0%) |
| Personal Care & Service | 0 (0.0%) | 0 (0.0%) |
| Total (Category) | 0 (0.0%) | 132 (100.0%) |
| Total (Overall) | 432 (53.9%) | 370 (46.1%) |
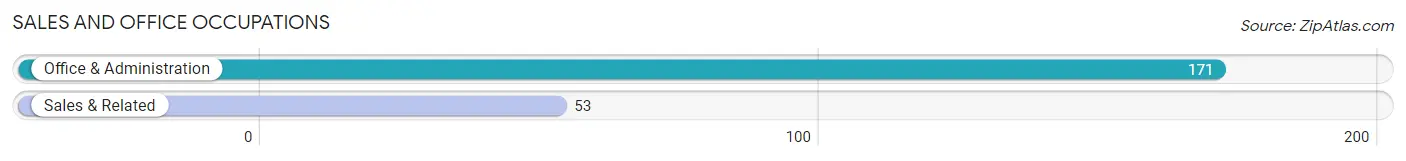
Sales and Office Occupations
The most common Sales and Office occupations in Plantation Mobile Home Park are Office & Administration (171 | 21.3%), and Sales & Related (53 | 6.6%).
Sales and Office Occupations by Sex

| Occupation | Male | Female |
| Sales & Related | 53 (100.0%) | 0 (0.0%) |
| Office & Administration | 61 (35.7%) | 110 (64.3%) |
| Total (Category) | 114 (50.9%) | 110 (49.1%) |
| Total (Overall) | 432 (53.9%) | 370 (46.1%) |
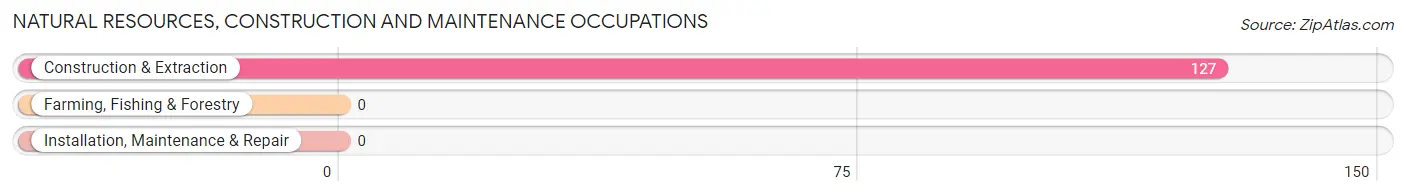
Natural Resources, Construction and Maintenance Occupations
The most common Natural Resources, Construction and Maintenance occupations in Plantation Mobile Home Park are , and Construction & Extraction (127 | 15.8%).
Natural Resources, Construction and Maintenance Occupations by Sex
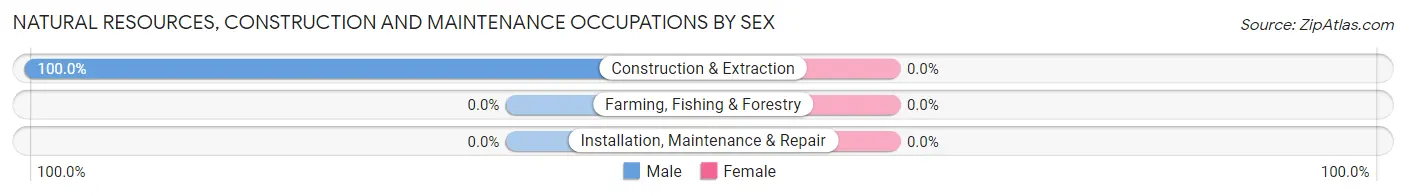
| Occupation | Male | Female |
| Farming, Fishing & Forestry | 0 (0.0%) | 0 (0.0%) |
| Construction & Extraction | 127 (100.0%) | 0 (0.0%) |
| Installation, Maintenance & Repair | 0 (0.0%) | 0 (0.0%) |
| Total (Category) | 127 (100.0%) | 0 (0.0%) |
| Total (Overall) | 432 (53.9%) | 370 (46.1%) |
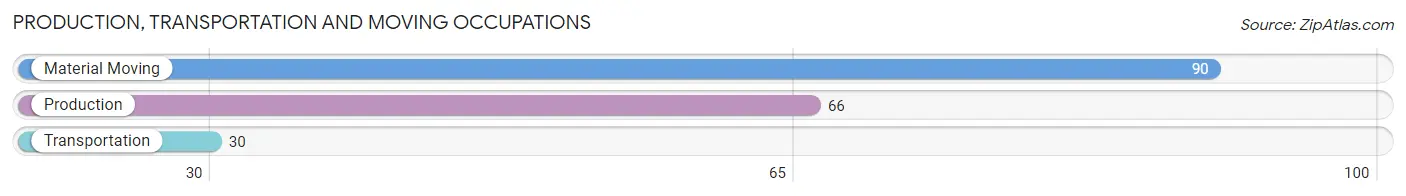
Production, Transportation and Moving Occupations
The most common Production, Transportation and Moving occupations in Plantation Mobile Home Park are Material Moving (90 | 11.2%), Production (66 | 8.2%), and Transportation (30 | 3.7%).
Production, Transportation and Moving Occupations by Sex
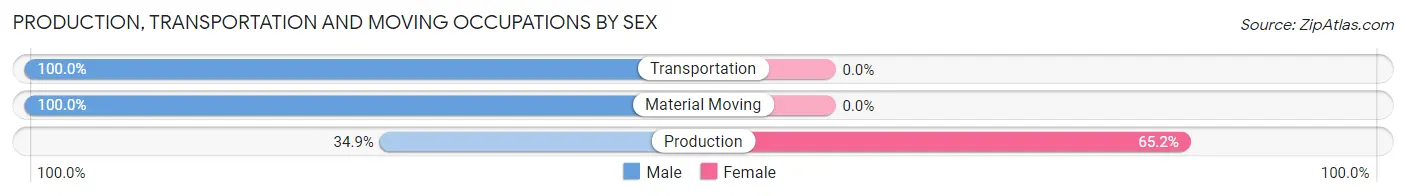
| Occupation | Male | Female |
| Production | 23 (34.8%) | 43 (65.1%) |
| Transportation | 30 (100.0%) | 0 (0.0%) |
| Material Moving | 90 (100.0%) | 0 (0.0%) |
| Total (Category) | 143 (76.9%) | 43 (23.1%) |
| Total (Overall) | 432 (53.9%) | 370 (46.1%) |
Employment Industries by Sex in Plantation Mobile Home Park
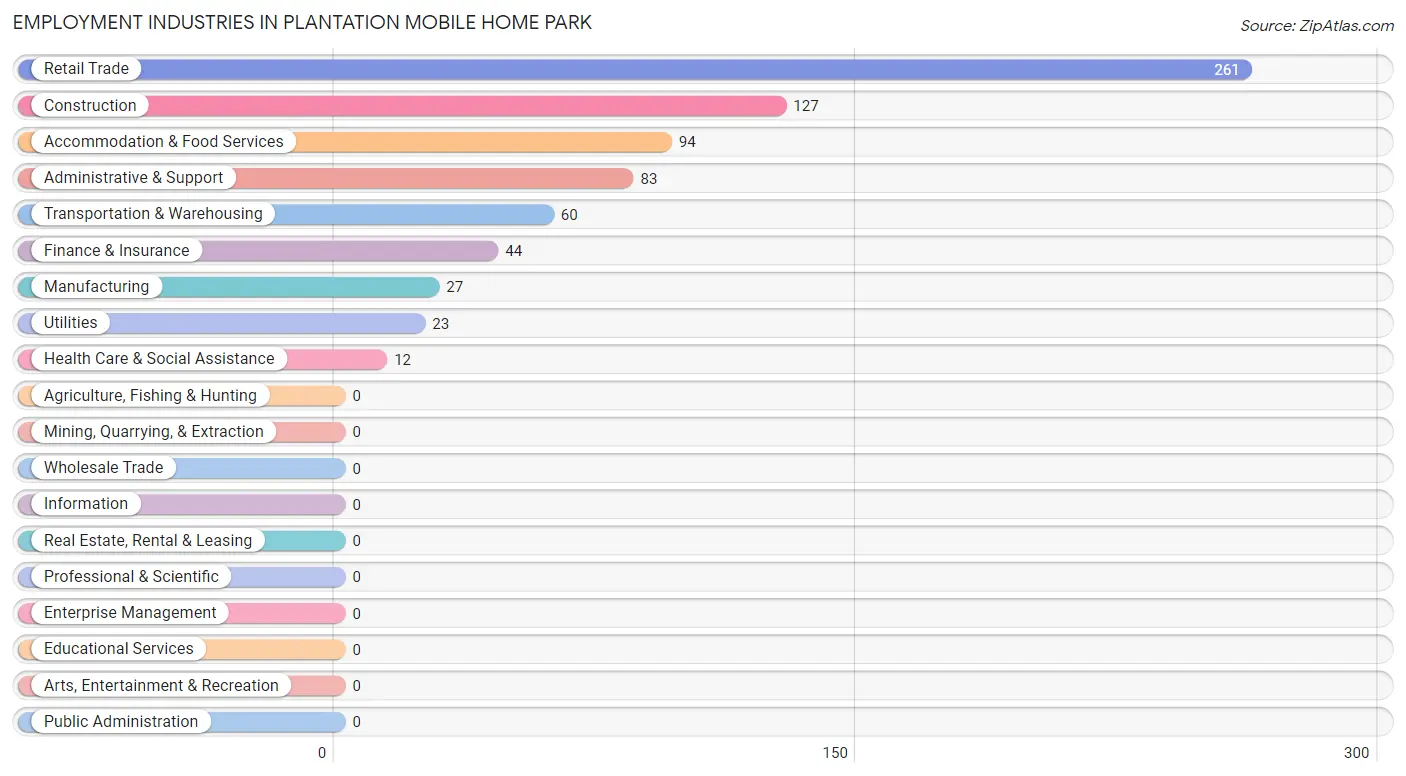
Employment Industries in Plantation Mobile Home Park
The major employment industries in Plantation Mobile Home Park include Retail Trade (261 | 32.5%), Construction (127 | 15.8%), Accommodation & Food Services (94 | 11.7%), Administrative & Support (83 | 10.3%), and Transportation & Warehousing (60 | 7.5%).
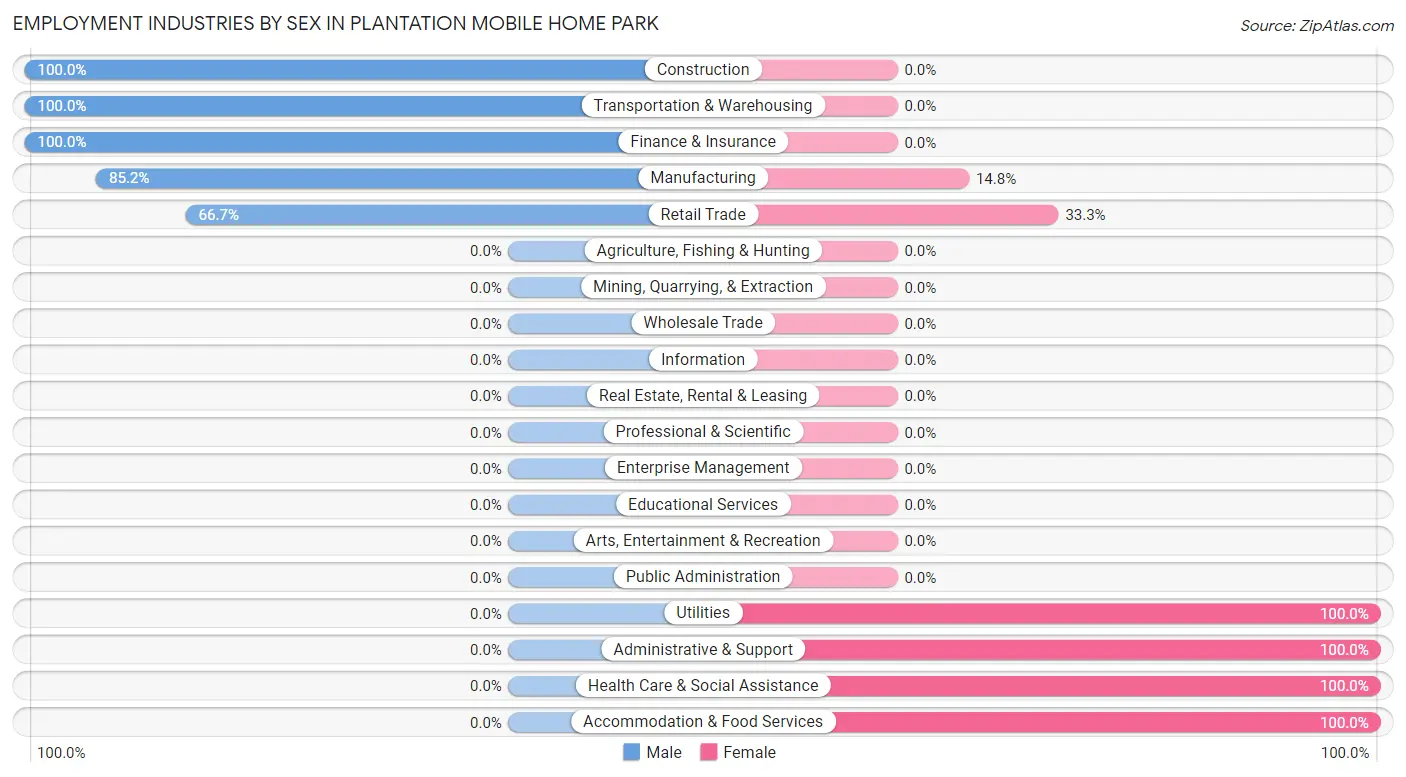
Employment Industries by Sex in Plantation Mobile Home Park
The Plantation Mobile Home Park industries that see more men than women are Construction (100.0%), Transportation & Warehousing (100.0%), and Finance & Insurance (100.0%), whereas the industries that tend to have a higher number of women are Utilities (100.0%), Administrative & Support (100.0%), and Health Care & Social Assistance (100.0%).
| Industry | Male | Female |
| Agriculture, Fishing & Hunting | 0 (0.0%) | 0 (0.0%) |
| Mining, Quarrying, & Extraction | 0 (0.0%) | 0 (0.0%) |
| Construction | 127 (100.0%) | 0 (0.0%) |
| Manufacturing | 23 (85.2%) | 4 (14.8%) |
| Wholesale Trade | 0 (0.0%) | 0 (0.0%) |
| Retail Trade | 174 (66.7%) | 87 (33.3%) |
| Transportation & Warehousing | 60 (100.0%) | 0 (0.0%) |
| Utilities | 0 (0.0%) | 23 (100.0%) |
| Information | 0 (0.0%) | 0 (0.0%) |
| Finance & Insurance | 44 (100.0%) | 0 (0.0%) |
| Real Estate, Rental & Leasing | 0 (0.0%) | 0 (0.0%) |
| Professional & Scientific | 0 (0.0%) | 0 (0.0%) |
| Enterprise Management | 0 (0.0%) | 0 (0.0%) |
| Administrative & Support | 0 (0.0%) | 83 (100.0%) |
| Educational Services | 0 (0.0%) | 0 (0.0%) |
| Health Care & Social Assistance | 0 (0.0%) | 12 (100.0%) |
| Arts, Entertainment & Recreation | 0 (0.0%) | 0 (0.0%) |
| Accommodation & Food Services | 0 (0.0%) | 94 (100.0%) |
| Public Administration | 0 (0.0%) | 0 (0.0%) |
| Total | 432 (53.9%) | 370 (46.1%) |
Education in Plantation Mobile Home Park
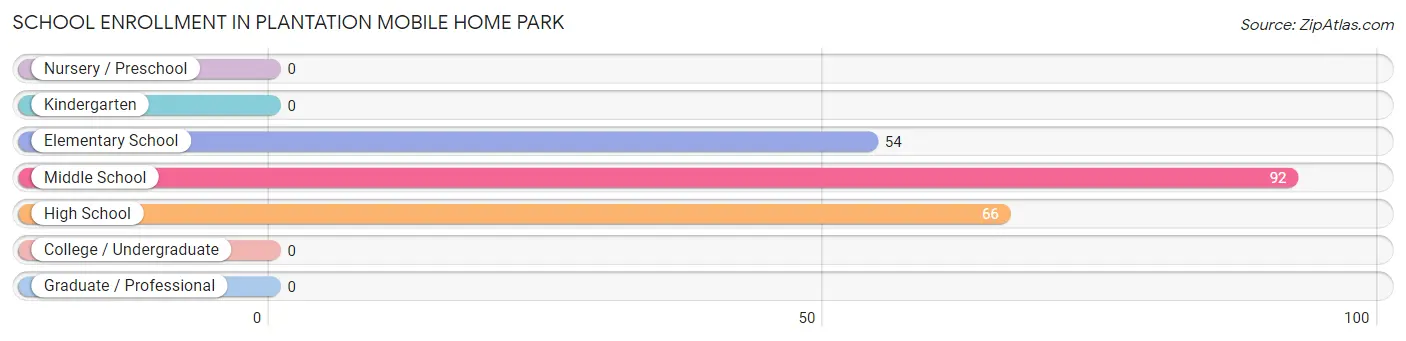
School Enrollment in Plantation Mobile Home Park
The most common levels of schooling among the 212 students in Plantation Mobile Home Park are middle school (92 | 43.4%), high school (66 | 31.1%), and elementary school (54 | 25.5%).
| School Level | # Students | % Students |
| Nursery / Preschool | 0 | 0.0% |
| Kindergarten | 0 | 0.0% |
| Elementary School | 54 | 25.5% |
| Middle School | 92 | 43.4% |
| High School | 66 | 31.1% |
| College / Undergraduate | 0 | 0.0% |
| Graduate / Professional | 0 | 0.0% |
| Total | 212 | 100.0% |
School Enrollment by Age by Funding Source in Plantation Mobile Home Park
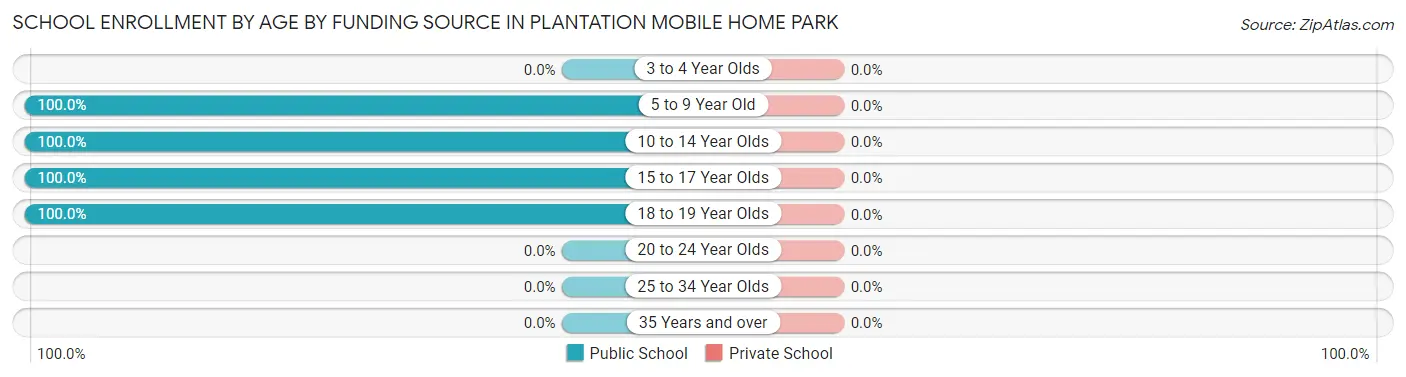
| Age Bracket | Public School | Private School |
| 3 to 4 Year Olds | 0 (0.0%) | 0 (0.0%) |
| 5 to 9 Year Old | 13 (100.0%) | 0 (0.0%) |
| 10 to 14 Year Olds | 133 (100.0%) | 0 (0.0%) |
| 15 to 17 Year Olds | 21 (100.0%) | 0 (0.0%) |
| 18 to 19 Year Olds | 45 (100.0%) | 0 (0.0%) |
| 20 to 24 Year Olds | 0 (0.0%) | 0 (0.0%) |
| 25 to 34 Year Olds | 0 (0.0%) | 0 (0.0%) |
| 35 Years and over | 0 (0.0%) | 0 (0.0%) |
| Total | 212 (100.0%) | 0 (0.0%) |
Educational Attainment by Field of Study in Plantation Mobile Home Park
Engineering (44 | 38.9%), physical & health sciences (37 | 32.7%), and communications (32 | 28.3%) are the most common fields of study among 113 individuals in Plantation Mobile Home Park who have obtained a bachelor's degree or higher.
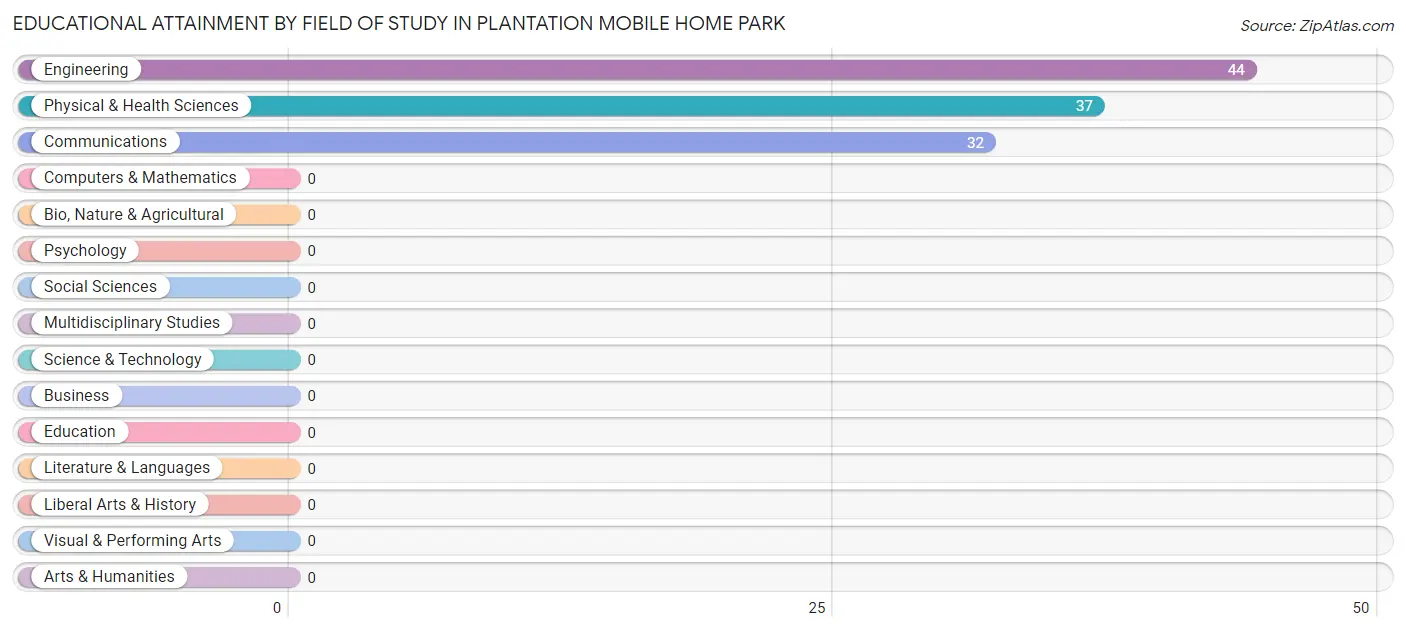
| Field of Study | # Graduates | % Graduates |
| Computers & Mathematics | 0 | 0.0% |
| Bio, Nature & Agricultural | 0 | 0.0% |
| Physical & Health Sciences | 37 | 32.7% |
| Psychology | 0 | 0.0% |
| Social Sciences | 0 | 0.0% |
| Engineering | 44 | 38.9% |
| Multidisciplinary Studies | 0 | 0.0% |
| Science & Technology | 0 | 0.0% |
| Business | 0 | 0.0% |
| Education | 0 | 0.0% |
| Literature & Languages | 0 | 0.0% |
| Liberal Arts & History | 0 | 0.0% |
| Visual & Performing Arts | 0 | 0.0% |
| Communications | 32 | 28.3% |
| Arts & Humanities | 0 | 0.0% |
| Total | 113 | 100.0% |
Transportation & Commute in Plantation Mobile Home Park
Vehicle Availability by Sex in Plantation Mobile Home Park
The most prevalent vehicle ownership categories in Plantation Mobile Home Park are males with 2 vehicles (171, accounting for 39.6%) and females with 2 vehicles (59, making up 46.2%).
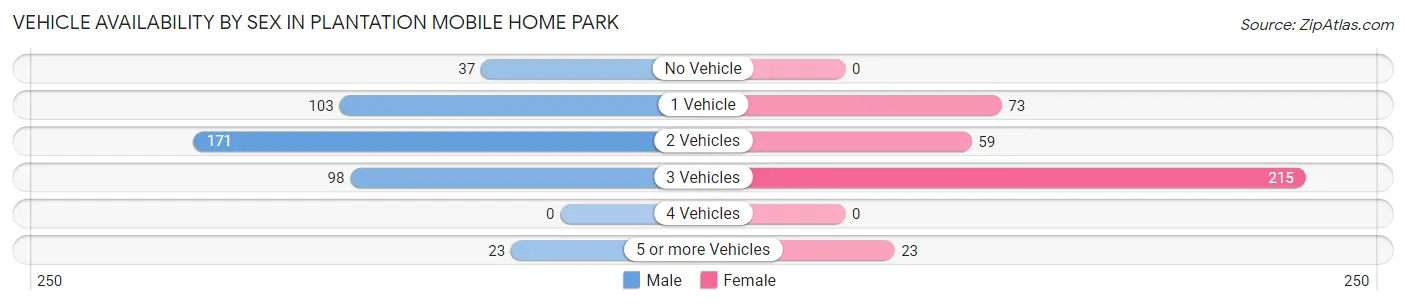
| Vehicles Available | Male | Female |
| No Vehicle | 37 (8.6%) | 0 (0.0%) |
| 1 Vehicle | 103 (23.8%) | 73 (19.7%) |
| 2 Vehicles | 171 (39.6%) | 59 (16.0%) |
| 3 Vehicles | 98 (22.7%) | 215 (58.1%) |
| 4 Vehicles | 0 (0.0%) | 0 (0.0%) |
| 5 or more Vehicles | 23 (5.3%) | 23 (6.2%) |
| Total | 432 (100.0%) | 370 (100.0%) |
Commute Time in Plantation Mobile Home Park
The most frequently occuring commute durations in Plantation Mobile Home Park are 30 to 34 minutes (226 commuters, 28.2%), 20 to 24 minutes (210 commuters, 26.2%), and 15 to 19 minutes (200 commuters, 24.9%).
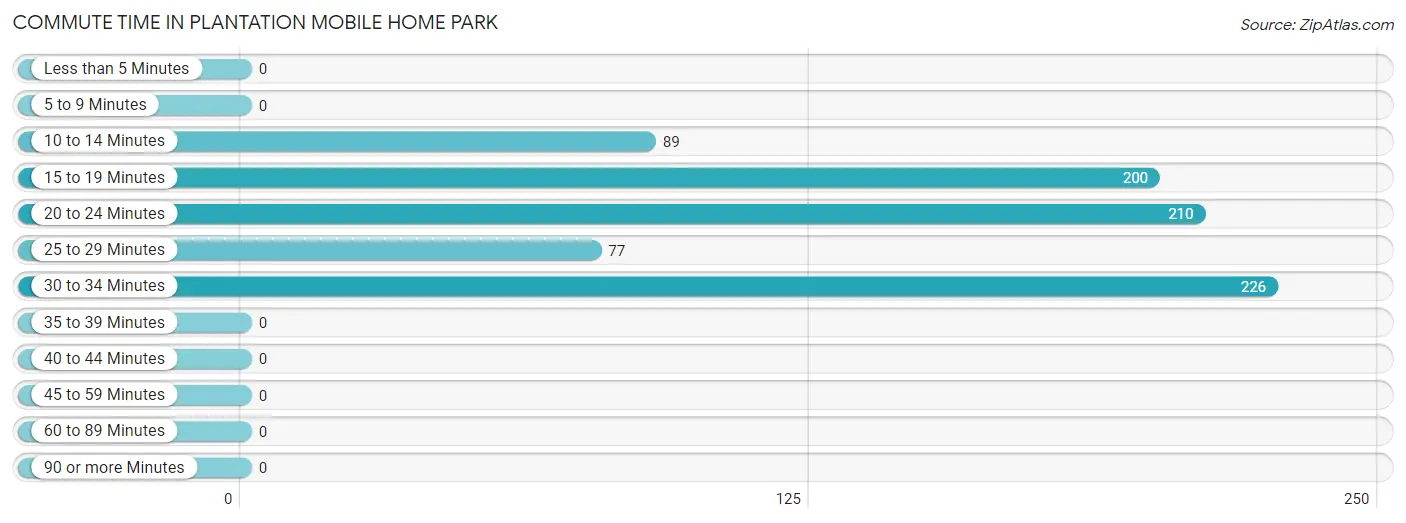
| Commute Time | # Commuters | % Commuters |
| Less than 5 Minutes | 0 | 0.0% |
| 5 to 9 Minutes | 0 | 0.0% |
| 10 to 14 Minutes | 89 | 11.1% |
| 15 to 19 Minutes | 200 | 24.9% |
| 20 to 24 Minutes | 210 | 26.2% |
| 25 to 29 Minutes | 77 | 9.6% |
| 30 to 34 Minutes | 226 | 28.2% |
| 35 to 39 Minutes | 0 | 0.0% |
| 40 to 44 Minutes | 0 | 0.0% |
| 45 to 59 Minutes | 0 | 0.0% |
| 60 to 89 Minutes | 0 | 0.0% |
| 90 or more Minutes | 0 | 0.0% |
Commute Time by Sex in Plantation Mobile Home Park
The most common commute times in Plantation Mobile Home Park are 20 to 24 minutes (131 commuters, 30.3%) for males and 30 to 34 minutes (122 commuters, 33.0%) for females.
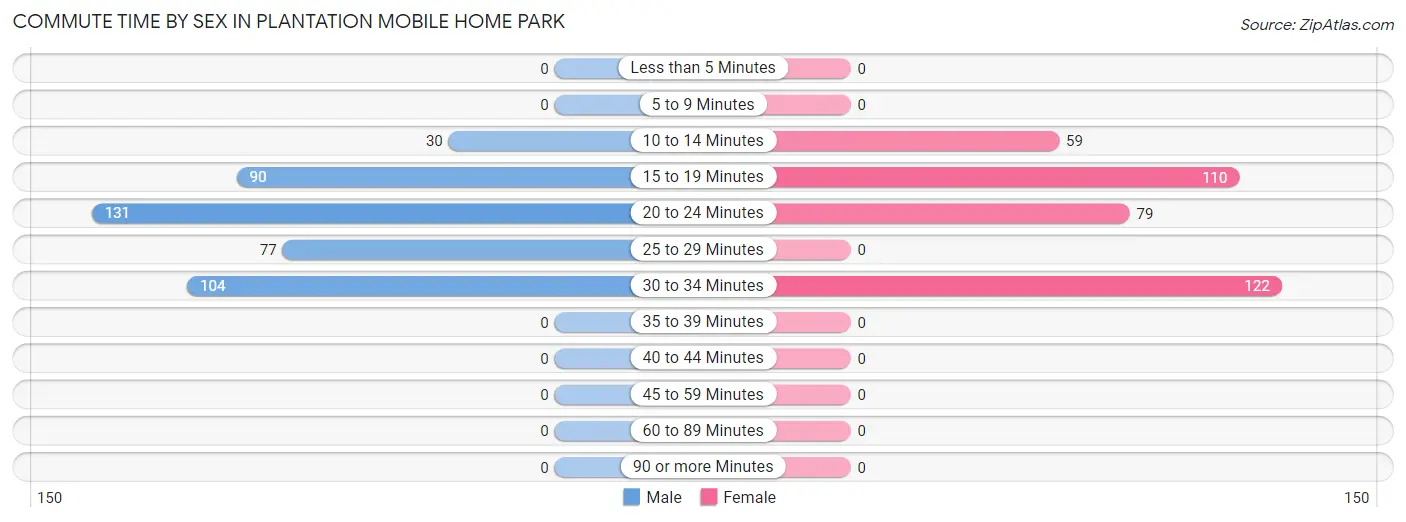
| Commute Time | Male | Female |
| Less than 5 Minutes | 0 (0.0%) | 0 (0.0%) |
| 5 to 9 Minutes | 0 (0.0%) | 0 (0.0%) |
| 10 to 14 Minutes | 30 (6.9%) | 59 (16.0%) |
| 15 to 19 Minutes | 90 (20.8%) | 110 (29.7%) |
| 20 to 24 Minutes | 131 (30.3%) | 79 (21.3%) |
| 25 to 29 Minutes | 77 (17.8%) | 0 (0.0%) |
| 30 to 34 Minutes | 104 (24.1%) | 122 (33.0%) |
| 35 to 39 Minutes | 0 (0.0%) | 0 (0.0%) |
| 40 to 44 Minutes | 0 (0.0%) | 0 (0.0%) |
| 45 to 59 Minutes | 0 (0.0%) | 0 (0.0%) |
| 60 to 89 Minutes | 0 (0.0%) | 0 (0.0%) |
| 90 or more Minutes | 0 (0.0%) | 0 (0.0%) |
Time of Departure to Work by Sex in Plantation Mobile Home Park
The most frequent times of departure to work in Plantation Mobile Home Park are 6:00 AM to 6:29 AM (127, 29.4%) for males and 9:00 AM to 9:59 AM (136, 36.8%) for females.
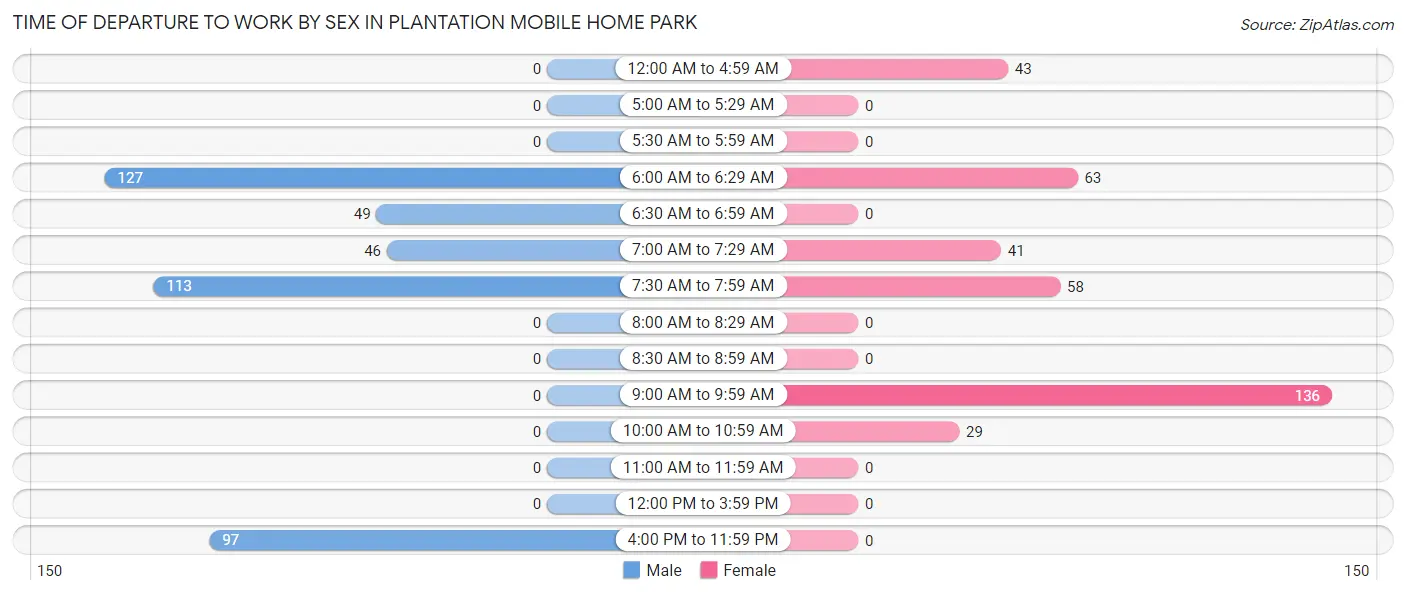
| Time of Departure | Male | Female |
| 12:00 AM to 4:59 AM | 0 (0.0%) | 43 (11.6%) |
| 5:00 AM to 5:29 AM | 0 (0.0%) | 0 (0.0%) |
| 5:30 AM to 5:59 AM | 0 (0.0%) | 0 (0.0%) |
| 6:00 AM to 6:29 AM | 127 (29.4%) | 63 (17.0%) |
| 6:30 AM to 6:59 AM | 49 (11.3%) | 0 (0.0%) |
| 7:00 AM to 7:29 AM | 46 (10.6%) | 41 (11.1%) |
| 7:30 AM to 7:59 AM | 113 (26.2%) | 58 (15.7%) |
| 8:00 AM to 8:29 AM | 0 (0.0%) | 0 (0.0%) |
| 8:30 AM to 8:59 AM | 0 (0.0%) | 0 (0.0%) |
| 9:00 AM to 9:59 AM | 0 (0.0%) | 136 (36.8%) |
| 10:00 AM to 10:59 AM | 0 (0.0%) | 29 (7.8%) |
| 11:00 AM to 11:59 AM | 0 (0.0%) | 0 (0.0%) |
| 12:00 PM to 3:59 PM | 0 (0.0%) | 0 (0.0%) |
| 4:00 PM to 11:59 PM | 97 (22.5%) | 0 (0.0%) |
| Total | 432 (100.0%) | 370 (100.0%) |
Housing Occupancy in Plantation Mobile Home Park
Occupancy by Ownership in Plantation Mobile Home Park
Of the total 436 dwellings in Plantation Mobile Home Park, owner-occupied units account for 107 (24.5%), while renter-occupied units make up 329 (75.5%).
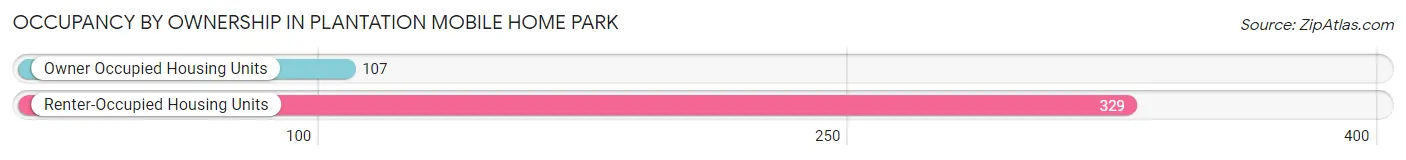
| Occupancy | # Housing Units | % Housing Units |
| Owner Occupied Housing Units | 107 | 24.5% |
| Renter-Occupied Housing Units | 329 | 75.5% |
| Total Occupied Housing Units | 436 | 100.0% |
Occupancy by Household Size in Plantation Mobile Home Park
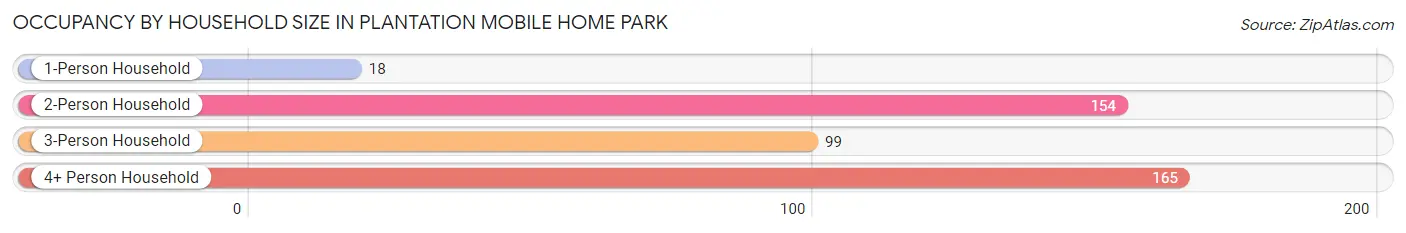
| Household Size | # Housing Units | % Housing Units |
| 1-Person Household | 18 | 4.1% |
| 2-Person Household | 154 | 35.3% |
| 3-Person Household | 99 | 22.7% |
| 4+ Person Household | 165 | 37.8% |
| Total Housing Units | 436 | 100.0% |
Occupancy by Ownership by Household Size in Plantation Mobile Home Park
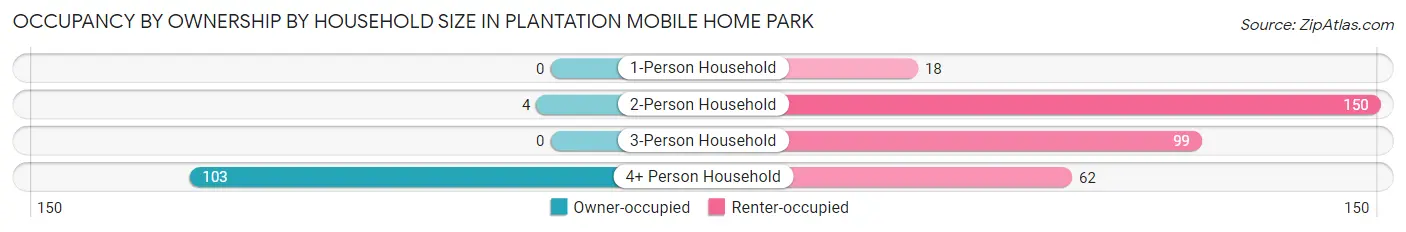
| Household Size | Owner-occupied | Renter-occupied |
| 1-Person Household | 0 (0.0%) | 18 (100.0%) |
| 2-Person Household | 4 (2.6%) | 150 (97.4%) |
| 3-Person Household | 0 (0.0%) | 99 (100.0%) |
| 4+ Person Household | 103 (62.4%) | 62 (37.6%) |
| Total Housing Units | 107 (24.5%) | 329 (75.5%) |
Occupancy by Educational Attainment in Plantation Mobile Home Park
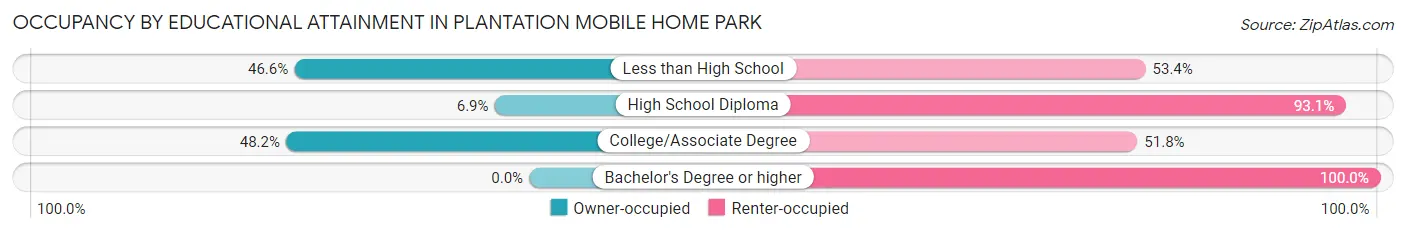
| Household Size | Owner-occupied | Renter-occupied |
| Less than High School | 68 (46.6%) | 78 (53.4%) |
| High School Diploma | 12 (6.9%) | 163 (93.1%) |
| College/Associate Degree | 27 (48.2%) | 29 (51.8%) |
| Bachelor's Degree or higher | 0 (0.0%) | 59 (100.0%) |
Occupancy by Age of Householder in Plantation Mobile Home Park
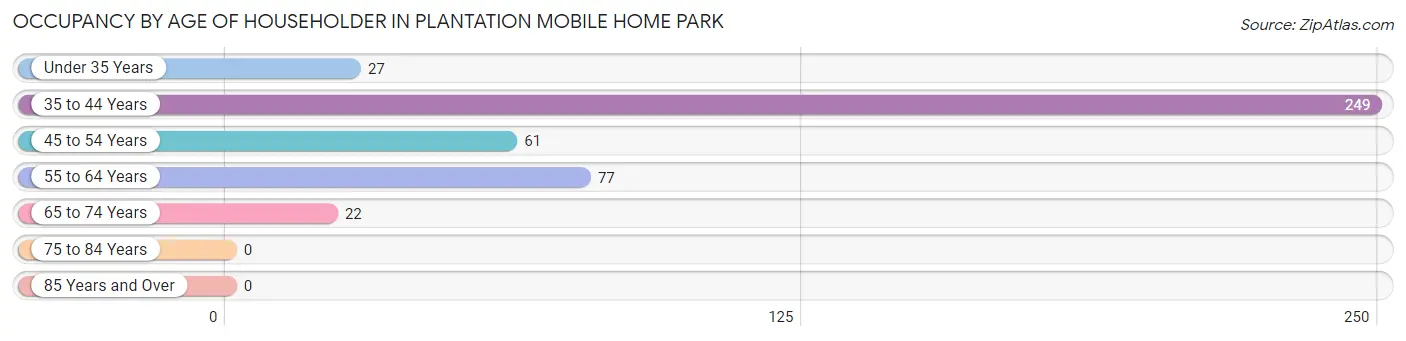
| Age Bracket | # Households | % Households |
| Under 35 Years | 27 | 6.2% |
| 35 to 44 Years | 249 | 57.1% |
| 45 to 54 Years | 61 | 14.0% |
| 55 to 64 Years | 77 | 17.7% |
| 65 to 74 Years | 22 | 5.1% |
| 75 to 84 Years | 0 | 0.0% |
| 85 Years and Over | 0 | 0.0% |
| Total | 436 | 100.0% |
Housing Finances in Plantation Mobile Home Park
Median Income by Occupancy in Plantation Mobile Home Park
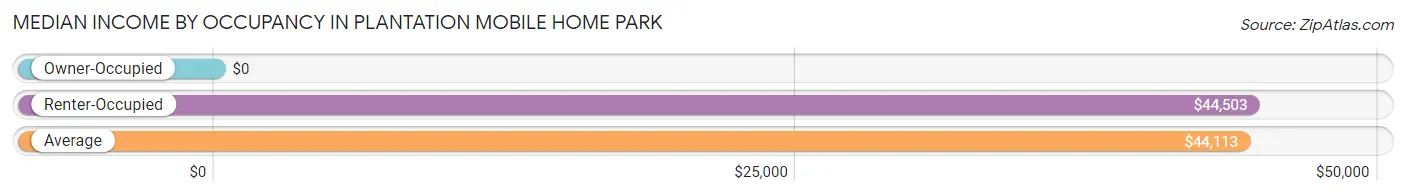
| Occupancy Type | # Households | Median Income |
| Owner-Occupied | 107 (24.5%) | $0 |
| Renter-Occupied | 329 (75.5%) | $44,503 |
| Average | 436 (100.0%) | $44,113 |
Occupancy by Householder Income Bracket in Plantation Mobile Home Park
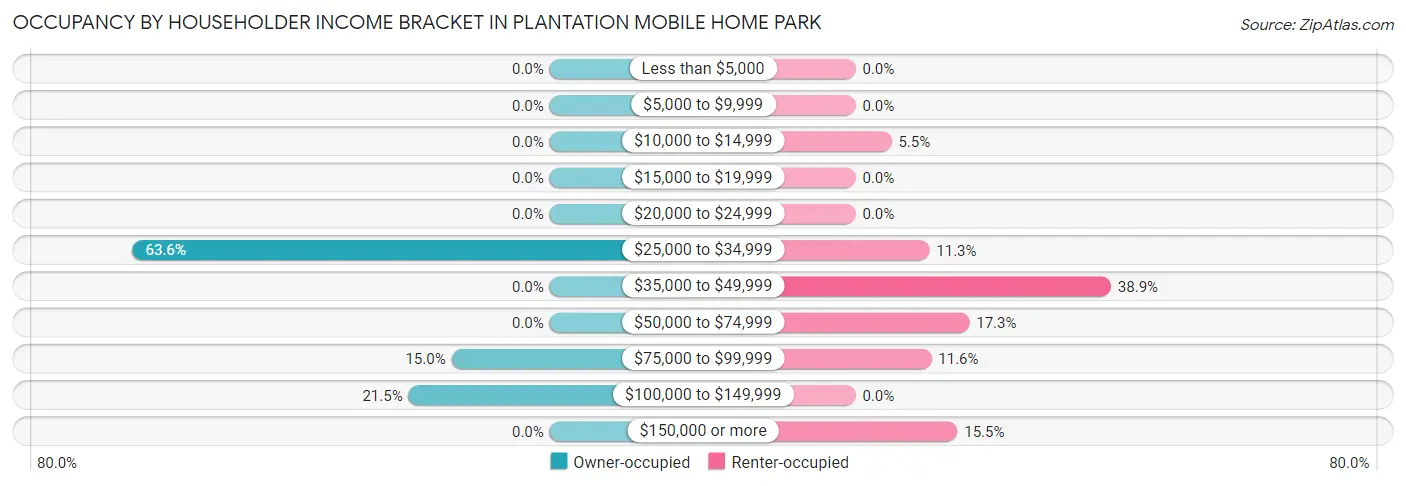
| Income Bracket | Owner-occupied | Renter-occupied |
| Less than $5,000 | 0 (0.0%) | 0 (0.0%) |
| $5,000 to $9,999 | 0 (0.0%) | 0 (0.0%) |
| $10,000 to $14,999 | 0 (0.0%) | 18 (5.5%) |
| $15,000 to $19,999 | 0 (0.0%) | 0 (0.0%) |
| $20,000 to $24,999 | 0 (0.0%) | 0 (0.0%) |
| $25,000 to $34,999 | 68 (63.5%) | 37 (11.3%) |
| $35,000 to $49,999 | 0 (0.0%) | 128 (38.9%) |
| $50,000 to $74,999 | 0 (0.0%) | 57 (17.3%) |
| $75,000 to $99,999 | 16 (14.9%) | 38 (11.6%) |
| $100,000 to $149,999 | 23 (21.5%) | 0 (0.0%) |
| $150,000 or more | 0 (0.0%) | 51 (15.5%) |
| Total | 107 (100.0%) | 329 (100.0%) |
Monthly Housing Cost Tiers in Plantation Mobile Home Park
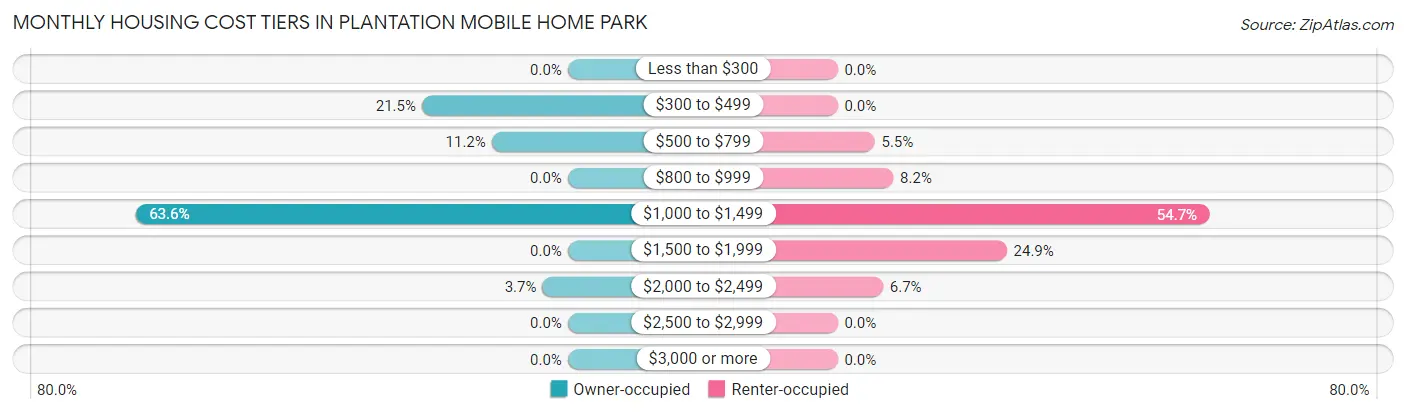
| Monthly Cost | Owner-occupied | Renter-occupied |
| Less than $300 | 0 (0.0%) | 0 (0.0%) |
| $300 to $499 | 23 (21.5%) | 0 (0.0%) |
| $500 to $799 | 12 (11.2%) | 18 (5.5%) |
| $800 to $999 | 0 (0.0%) | 27 (8.2%) |
| $1,000 to $1,499 | 68 (63.5%) | 180 (54.7%) |
| $1,500 to $1,999 | 0 (0.0%) | 82 (24.9%) |
| $2,000 to $2,499 | 4 (3.7%) | 22 (6.7%) |
| $2,500 to $2,999 | 0 (0.0%) | 0 (0.0%) |
| $3,000 or more | 0 (0.0%) | 0 (0.0%) |
| Total | 107 (100.0%) | 329 (100.0%) |
Physical Housing Characteristics in Plantation Mobile Home Park
Housing Structures in Plantation Mobile Home Park
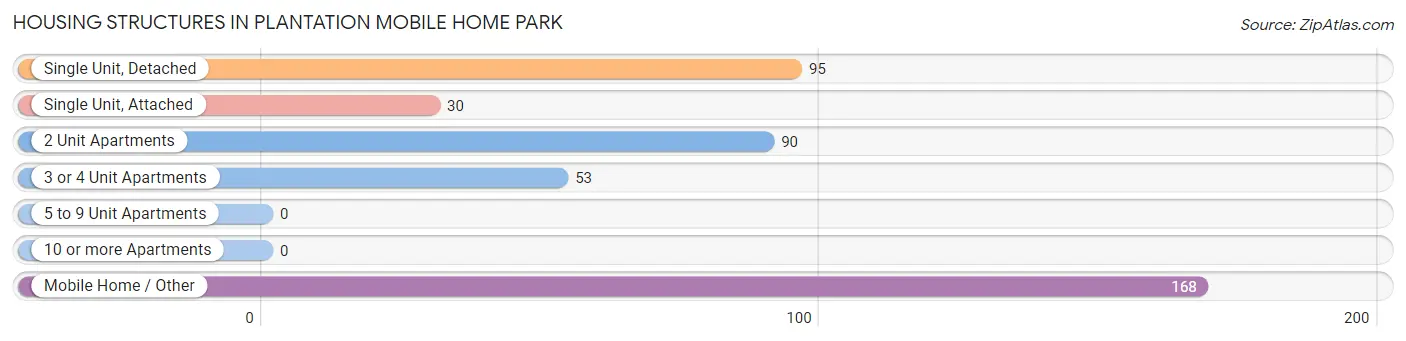
| Structure Type | # Housing Units | % Housing Units |
| Single Unit, Detached | 95 | 21.8% |
| Single Unit, Attached | 30 | 6.9% |
| 2 Unit Apartments | 90 | 20.6% |
| 3 or 4 Unit Apartments | 53 | 12.2% |
| 5 to 9 Unit Apartments | 0 | 0.0% |
| 10 or more Apartments | 0 | 0.0% |
| Mobile Home / Other | 168 | 38.5% |
| Total | 436 | 100.0% |
Housing Structures by Occupancy in Plantation Mobile Home Park
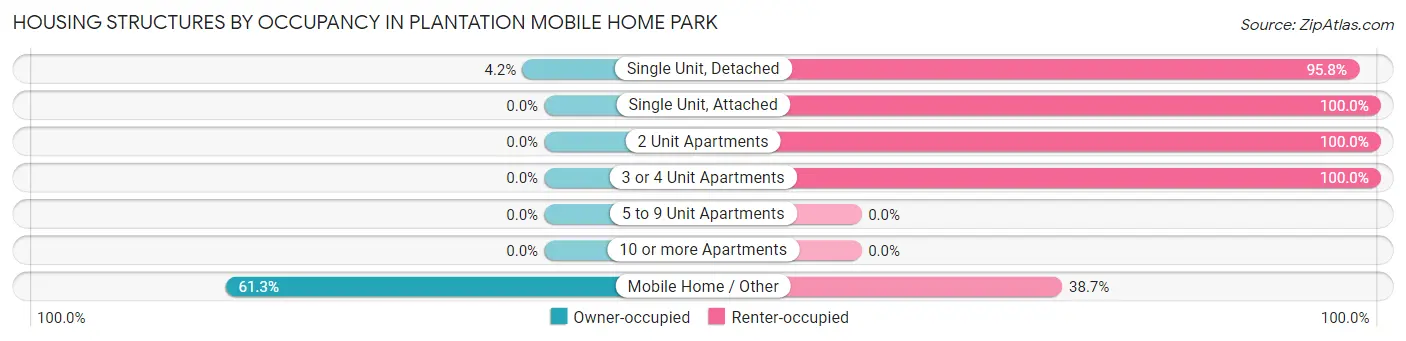
| Structure Type | Owner-occupied | Renter-occupied |
| Single Unit, Detached | 4 (4.2%) | 91 (95.8%) |
| Single Unit, Attached | 0 (0.0%) | 30 (100.0%) |
| 2 Unit Apartments | 0 (0.0%) | 90 (100.0%) |
| 3 or 4 Unit Apartments | 0 (0.0%) | 53 (100.0%) |
| 5 to 9 Unit Apartments | 0 (0.0%) | 0 (0.0%) |
| 10 or more Apartments | 0 (0.0%) | 0 (0.0%) |
| Mobile Home / Other | 103 (61.3%) | 65 (38.7%) |
| Total | 107 (24.5%) | 329 (75.5%) |
Housing Structures by Number of Rooms in Plantation Mobile Home Park
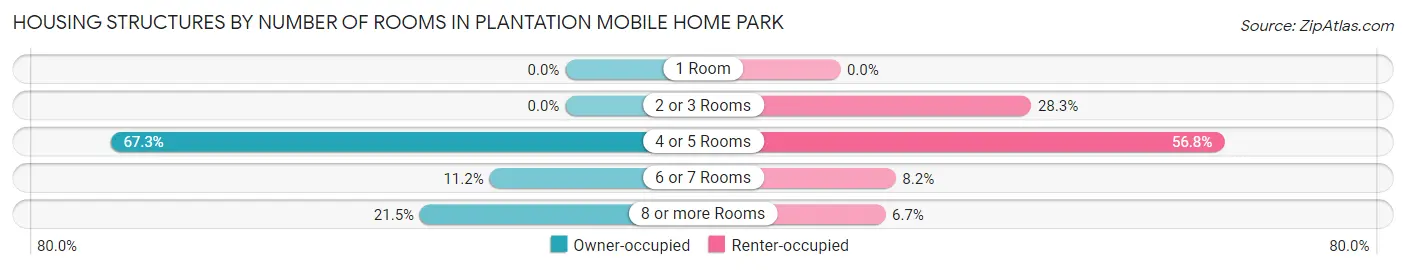
| Number of Rooms | Owner-occupied | Renter-occupied |
| 1 Room | 0 (0.0%) | 0 (0.0%) |
| 2 or 3 Rooms | 0 (0.0%) | 93 (28.3%) |
| 4 or 5 Rooms | 72 (67.3%) | 187 (56.8%) |
| 6 or 7 Rooms | 12 (11.2%) | 27 (8.2%) |
| 8 or more Rooms | 23 (21.5%) | 22 (6.7%) |
| Total | 107 (100.0%) | 329 (100.0%) |
Housing Structure by Heating Type in Plantation Mobile Home Park
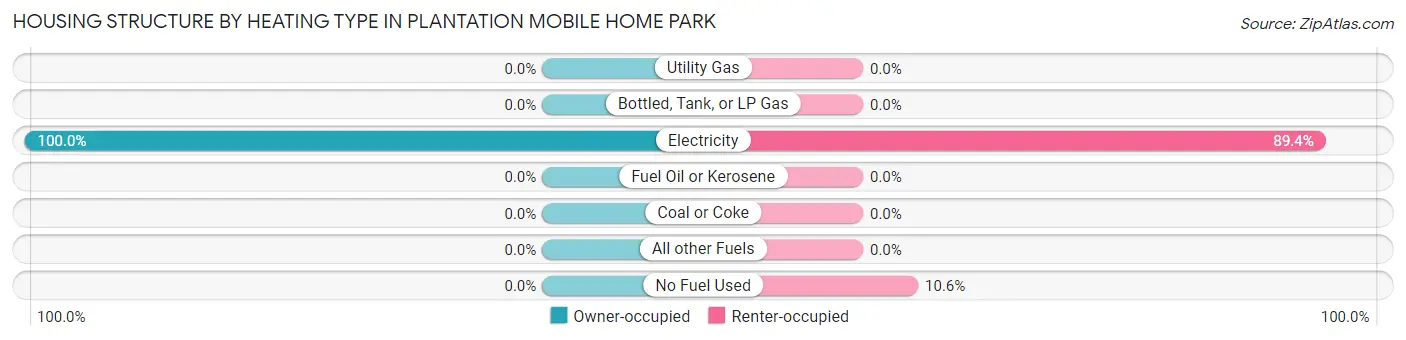
| Heating Type | Owner-occupied | Renter-occupied |
| Utility Gas | 0 (0.0%) | 0 (0.0%) |
| Bottled, Tank, or LP Gas | 0 (0.0%) | 0 (0.0%) |
| Electricity | 107 (100.0%) | 294 (89.4%) |
| Fuel Oil or Kerosene | 0 (0.0%) | 0 (0.0%) |
| Coal or Coke | 0 (0.0%) | 0 (0.0%) |
| All other Fuels | 0 (0.0%) | 0 (0.0%) |
| No Fuel Used | 0 (0.0%) | 35 (10.6%) |
| Total | 107 (100.0%) | 329 (100.0%) |
Household Vehicle Usage in Plantation Mobile Home Park
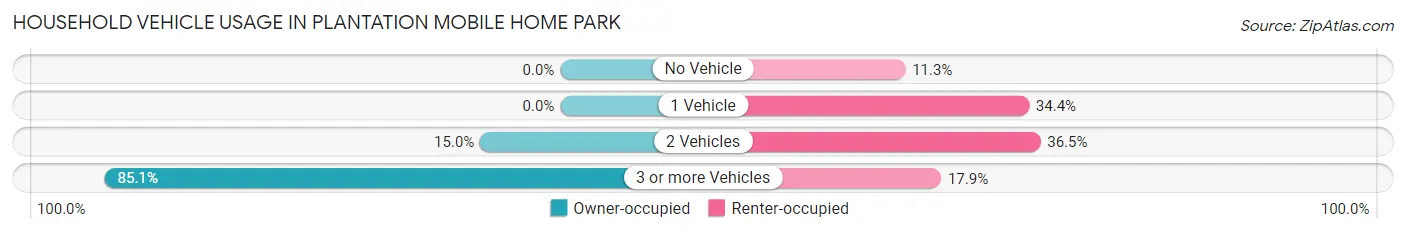
| Vehicles per Household | Owner-occupied | Renter-occupied |
| No Vehicle | 0 (0.0%) | 37 (11.3%) |
| 1 Vehicle | 0 (0.0%) | 113 (34.4%) |
| 2 Vehicles | 16 (14.9%) | 120 (36.5%) |
| 3 or more Vehicles | 91 (85.1%) | 59 (17.9%) |
| Total | 107 (100.0%) | 329 (100.0%) |
Real Estate & Mortgages in Plantation Mobile Home Park
Real Estate and Mortgage Overview in Plantation Mobile Home Park
| Characteristic | Without Mortgage | With Mortgage |
| Housing Units | 103 | 4 |
| Median Property Value | - | - |
| Median Household Income | - | - |
| Monthly Housing Costs | $1,124 | $0 |
| Real Estate Taxes | $199 | $0 |
Property Value by Mortgage Status in Plantation Mobile Home Park
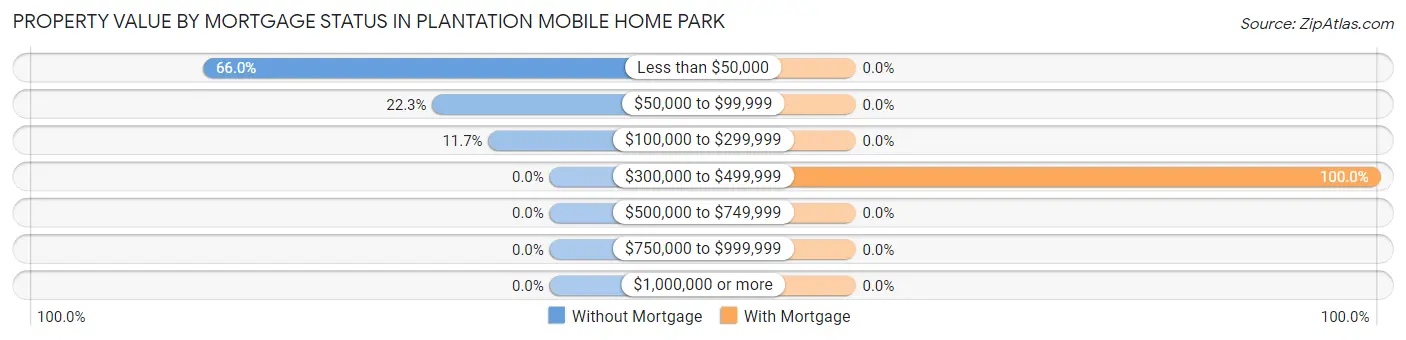
| Property Value | Without Mortgage | With Mortgage |
| Less than $50,000 | 68 (66.0%) | 0 (0.0%) |
| $50,000 to $99,999 | 23 (22.3%) | 0 (0.0%) |
| $100,000 to $299,999 | 12 (11.7%) | 0 (0.0%) |
| $300,000 to $499,999 | 0 (0.0%) | 4 (100.0%) |
| $500,000 to $749,999 | 0 (0.0%) | 0 (0.0%) |
| $750,000 to $999,999 | 0 (0.0%) | 0 (0.0%) |
| $1,000,000 or more | 0 (0.0%) | 0 (0.0%) |
| Total | 103 (100.0%) | 4 (100.0%) |
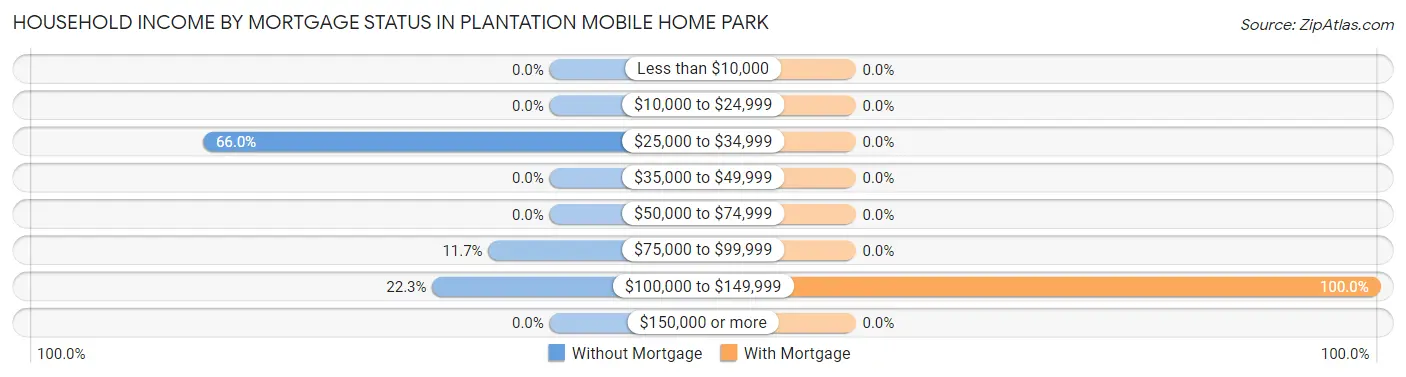
Household Income by Mortgage Status in Plantation Mobile Home Park
| Household Income | Without Mortgage | With Mortgage |
| Less than $10,000 | 0 (0.0%) | 0 (0.0%) |
| $10,000 to $24,999 | 0 (0.0%) | 0 (0.0%) |
| $25,000 to $34,999 | 68 (66.0%) | 0 (0.0%) |
| $35,000 to $49,999 | 0 (0.0%) | 0 (0.0%) |
| $50,000 to $74,999 | 0 (0.0%) | 0 (0.0%) |
| $75,000 to $99,999 | 12 (11.7%) | 0 (0.0%) |
| $100,000 to $149,999 | 23 (22.3%) | 4 (100.0%) |
| $150,000 or more | 0 (0.0%) | 0 (0.0%) |
| Total | 103 (100.0%) | 4 (100.0%) |
Property Value to Household Income Ratio in Plantation Mobile Home Park
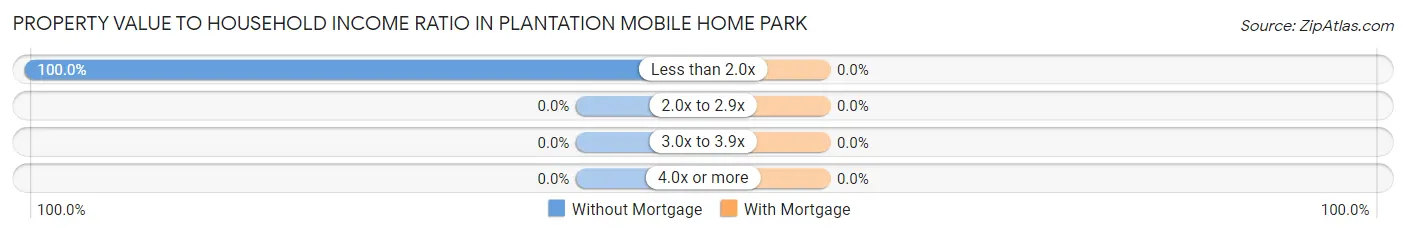
| Value-to-Income Ratio | Without Mortgage | With Mortgage |
| Less than 2.0x | 103 (100.0%) | 0 (0.0%) |
| 2.0x to 2.9x | 0 (0.0%) | 0 (0.0%) |
| 3.0x to 3.9x | 0 (0.0%) | 0 (0.0%) |
| 4.0x or more | 0 (0.0%) | 0 (0.0%) |
| Total | 103 (100.0%) | 4 (100.0%) |
Real Estate Taxes by Mortgage Status in Plantation Mobile Home Park
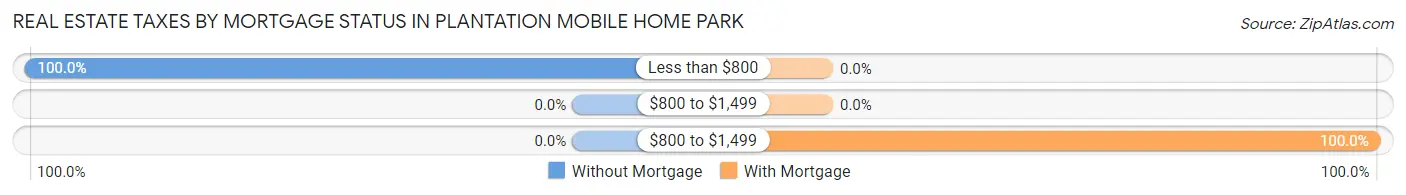
| Property Taxes | Without Mortgage | With Mortgage |
| Less than $800 | 103 (100.0%) | 0 (0.0%) |
| $800 to $1,499 | 0 (0.0%) | 0 (0.0%) |
| $800 to $1,499 | 0 (0.0%) | 4 (100.0%) |
| Total | 103 (100.0%) | 4 (100.0%) |
Health & Disability in Plantation Mobile Home Park
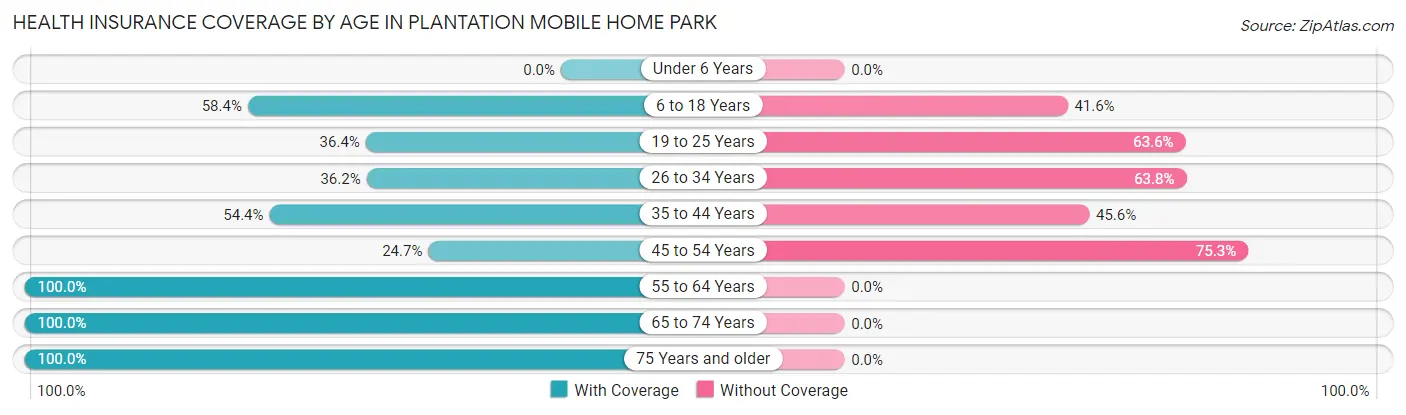
Health Insurance Coverage by Age in Plantation Mobile Home Park
| Age Bracket | With Coverage | Without Coverage |
| Under 6 Years | 0 (0.0%) | 0 (0.0%) |
| 6 to 18 Years | 181 (58.4%) | 129 (41.6%) |
| 19 to 25 Years | 87 (36.4%) | 152 (63.6%) |
| 26 to 34 Years | 54 (36.2%) | 95 (63.8%) |
| 35 to 44 Years | 187 (54.4%) | 157 (45.6%) |
| 45 to 54 Years | 46 (24.7%) | 140 (75.3%) |
| 55 to 64 Years | 167 (100.0%) | 0 (0.0%) |
| 65 to 74 Years | 126 (100.0%) | 0 (0.0%) |
| 75 Years and older | 19 (100.0%) | 0 (0.0%) |
| Total | 867 (56.3%) | 673 (43.7%) |
Health Insurance Coverage by Citizenship Status in Plantation Mobile Home Park
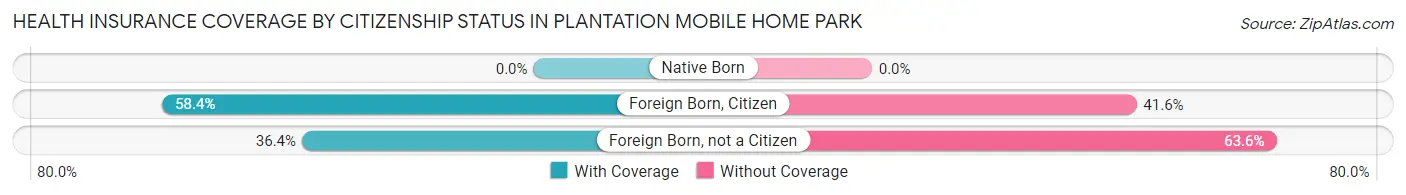
| Citizenship Status | With Coverage | Without Coverage |
| Native Born | 0 (0.0%) | 0 (0.0%) |
| Foreign Born, Citizen | 181 (58.4%) | 129 (41.6%) |
| Foreign Born, not a Citizen | 87 (36.4%) | 152 (63.6%) |
Health Insurance Coverage by Household Income in Plantation Mobile Home Park
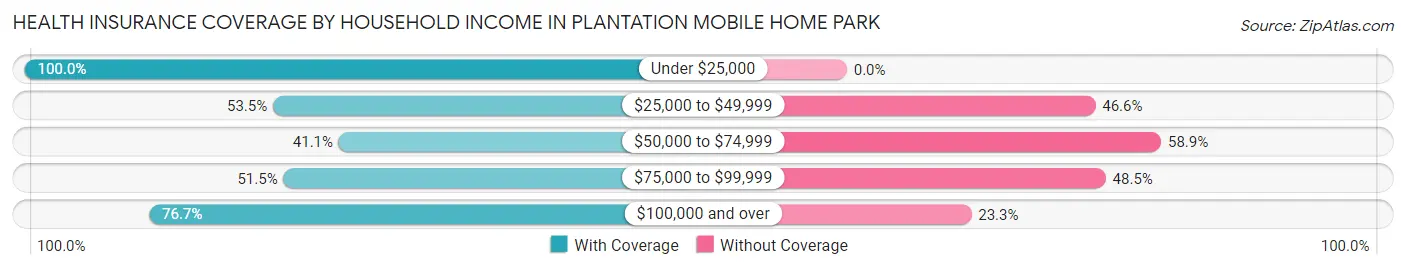
| Household Income | With Coverage | Without Coverage |
| Under $25,000 | 18 (100.0%) | 0 (0.0%) |
| $25,000 to $49,999 | 441 (53.4%) | 384 (46.6%) |
| $50,000 to $74,999 | 88 (41.1%) | 126 (58.9%) |
| $75,000 to $99,999 | 103 (51.5%) | 97 (48.5%) |
| $100,000 and over | 217 (76.7%) | 66 (23.3%) |
Public vs Private Health Insurance Coverage by Age in Plantation Mobile Home Park
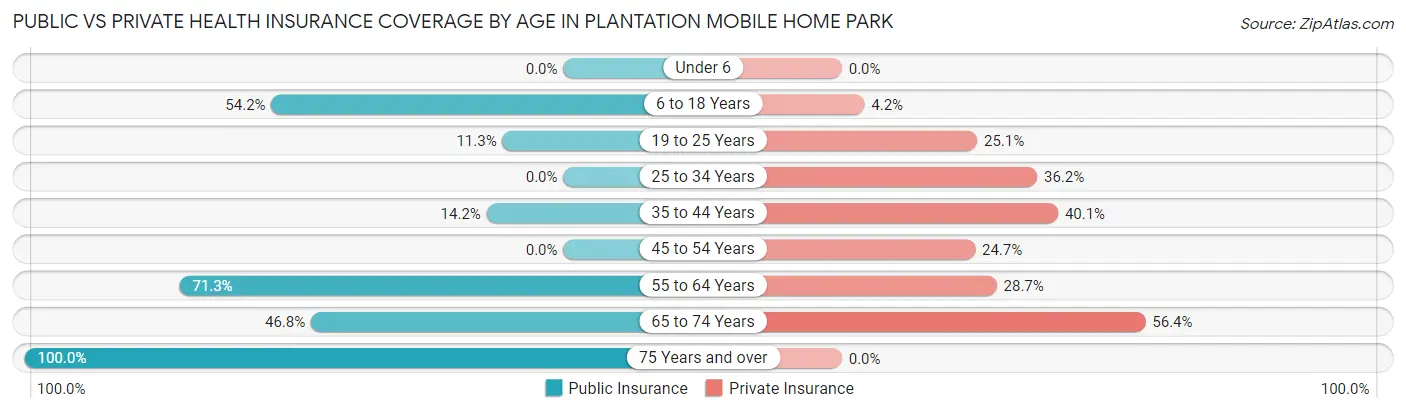
| Age Bracket | Public Insurance | Private Insurance |
| Under 6 | 0 (0.0%) | 0 (0.0%) |
| 6 to 18 Years | 168 (54.2%) | 13 (4.2%) |
| 19 to 25 Years | 27 (11.3%) | 60 (25.1%) |
| 25 to 34 Years | 0 (0.0%) | 54 (36.2%) |
| 35 to 44 Years | 49 (14.2%) | 138 (40.1%) |
| 45 to 54 Years | 0 (0.0%) | 46 (24.7%) |
| 55 to 64 Years | 119 (71.3%) | 48 (28.7%) |
| 65 to 74 Years | 59 (46.8%) | 71 (56.4%) |
| 75 Years and over | 19 (100.0%) | 0 (0.0%) |
| Total | 441 (28.6%) | 430 (27.9%) |
Disability Status by Sex by Age in Plantation Mobile Home Park
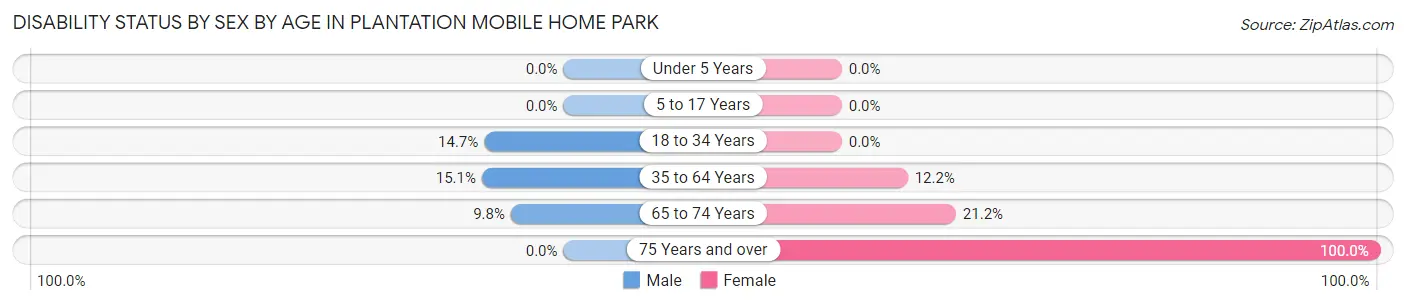
| Age Bracket | Male | Female |
| Under 5 Years | 0 (0.0%) | 0 (0.0%) |
| 5 to 17 Years | 0 (0.0%) | 0 (0.0%) |
| 18 to 34 Years | 45 (14.7%) | 0 (0.0%) |
| 35 to 64 Years | 56 (15.1%) | 40 (12.2%) |
| 65 to 74 Years | 4 (9.8%) | 18 (21.2%) |
| 75 Years and over | 0 (0.0%) | 19 (100.0%) |
Disability Class by Sex by Age in Plantation Mobile Home Park
Disability Class: Hearing Difficulty
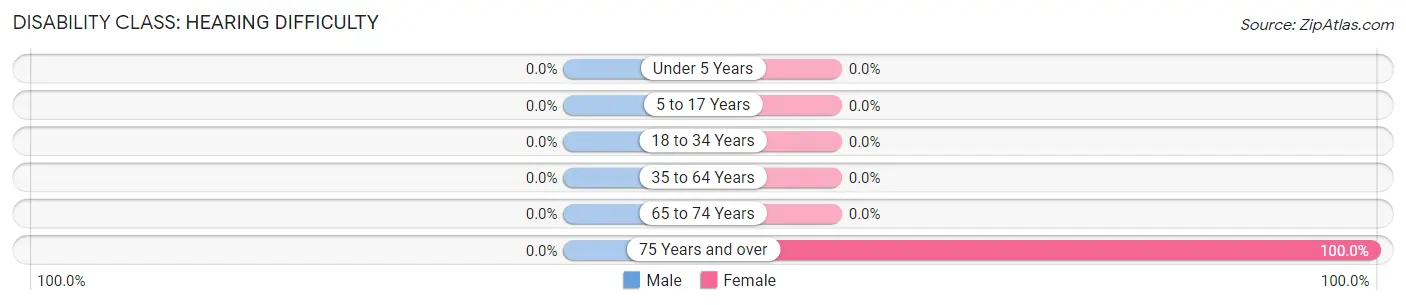
| Age Bracket | Male | Female |
| Under 5 Years | 0 (0.0%) | 0 (0.0%) |
| 5 to 17 Years | 0 (0.0%) | 0 (0.0%) |
| 18 to 34 Years | 0 (0.0%) | 0 (0.0%) |
| 35 to 64 Years | 0 (0.0%) | 0 (0.0%) |
| 65 to 74 Years | 0 (0.0%) | 0 (0.0%) |
| 75 Years and over | 0 (0.0%) | 19 (100.0%) |
Disability Class: Vision Difficulty
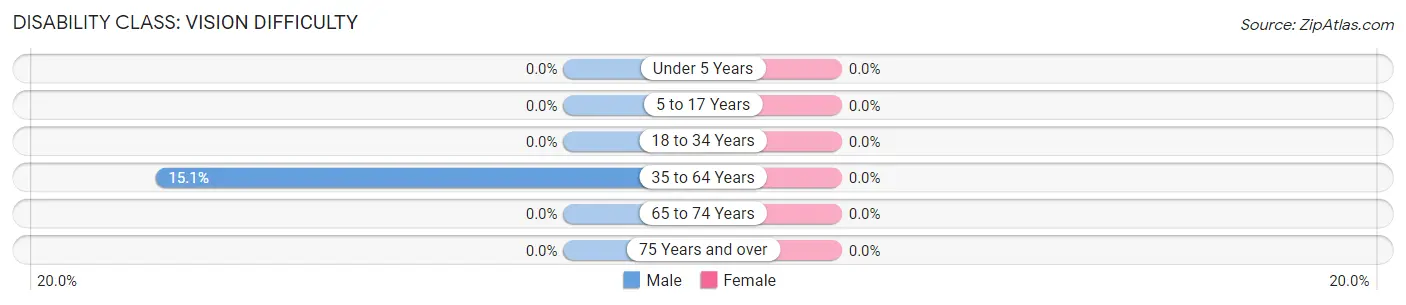
| Age Bracket | Male | Female |
| Under 5 Years | 0 (0.0%) | 0 (0.0%) |
| 5 to 17 Years | 0 (0.0%) | 0 (0.0%) |
| 18 to 34 Years | 0 (0.0%) | 0 (0.0%) |
| 35 to 64 Years | 56 (15.1%) | 0 (0.0%) |
| 65 to 74 Years | 0 (0.0%) | 0 (0.0%) |
| 75 Years and over | 0 (0.0%) | 0 (0.0%) |
Disability Class: Cognitive Difficulty
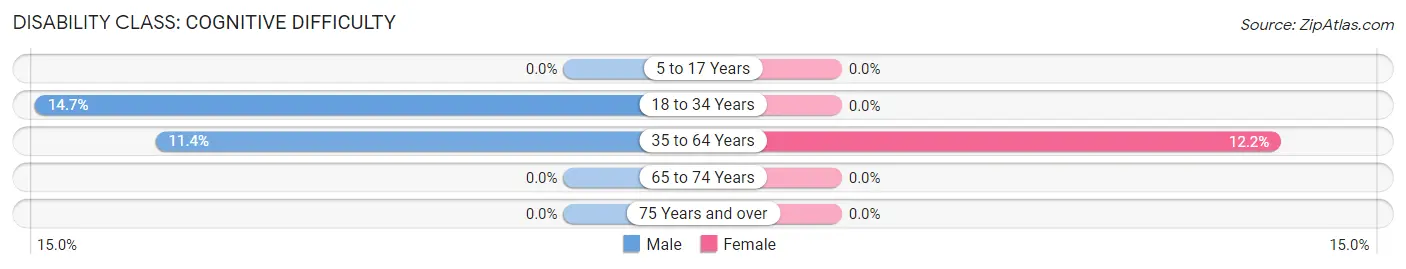
| Age Bracket | Male | Female |
| 5 to 17 Years | 0 (0.0%) | 0 (0.0%) |
| 18 to 34 Years | 45 (14.7%) | 0 (0.0%) |
| 35 to 64 Years | 42 (11.4%) | 40 (12.2%) |
| 65 to 74 Years | 0 (0.0%) | 0 (0.0%) |
| 75 Years and over | 0 (0.0%) | 0 (0.0%) |
Disability Class: Ambulatory Difficulty
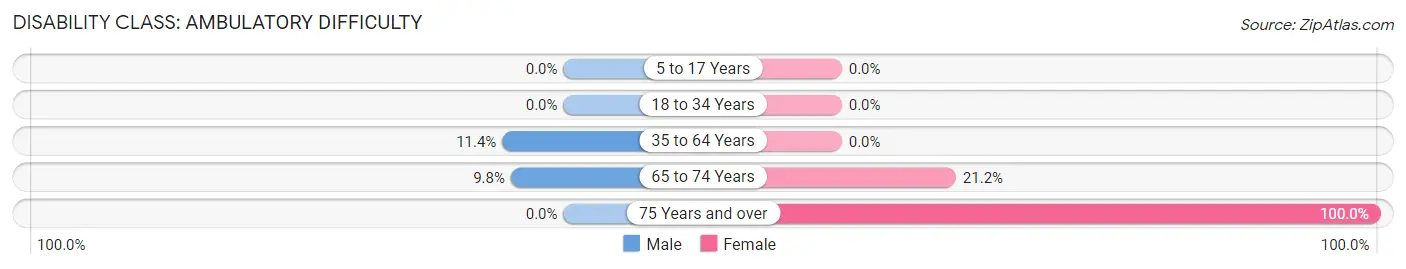
| Age Bracket | Male | Female |
| 5 to 17 Years | 0 (0.0%) | 0 (0.0%) |
| 18 to 34 Years | 0 (0.0%) | 0 (0.0%) |
| 35 to 64 Years | 42 (11.4%) | 0 (0.0%) |
| 65 to 74 Years | 4 (9.8%) | 18 (21.2%) |
| 75 Years and over | 0 (0.0%) | 19 (100.0%) |
Disability Class: Self-Care Difficulty
| Age Bracket | Male | Female |
| 5 to 17 Years | 0 (0.0%) | 0 (0.0%) |
| 18 to 34 Years | 0 (0.0%) | 0 (0.0%) |
| 35 to 64 Years | 0 (0.0%) | 0 (0.0%) |
| 65 to 74 Years | 0 (0.0%) | 0 (0.0%) |
| 75 Years and over | 0 (0.0%) | 0 (0.0%) |
Technology Access in Plantation Mobile Home Park
Computing Device Access in Plantation Mobile Home Park
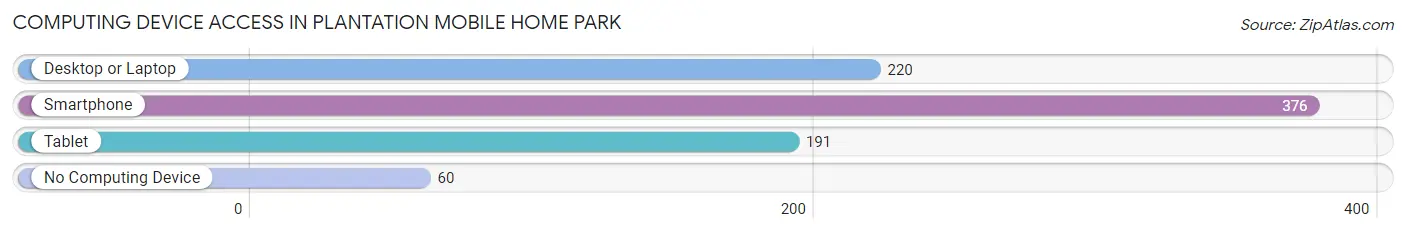
| Device Type | # Households | % Households |
| Desktop or Laptop | 220 | 50.5% |
| Smartphone | 376 | 86.2% |
| Tablet | 191 | 43.8% |
| No Computing Device | 60 | 13.8% |
| Total | 436 | 100.0% |
Internet Access in Plantation Mobile Home Park
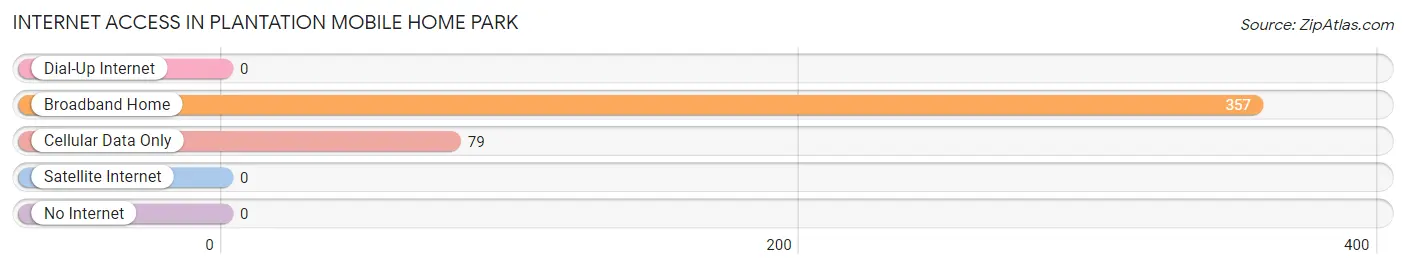
| Internet Type | # Households | % Households |
| Dial-Up Internet | 0 | 0.0% |
| Broadband Home | 357 | 81.9% |
| Cellular Data Only | 79 | 18.1% |
| Satellite Internet | 0 | 0.0% |
| No Internet | 0 | 0.0% |
| Total | 436 | 100.0% |
Plantation Mobile Home Park Summary
Plantation Mobile Home Park, Florida is a small, unincorporated community located in the heart of the Florida Panhandle. It is situated in Okaloosa County, approximately 20 miles east of Pensacola and 30 miles west of Panama City. The community is home to a population of approximately 1,000 people, most of whom are retirees.
History
Plantation Mobile Home Park was established in the late 1950s as a retirement community for seniors. The community was originally developed by a group of investors who wanted to create a place where seniors could enjoy a peaceful and affordable lifestyle. The community was designed to be a self-contained village, with its own shopping center, post office, and other amenities.
The community was initially successful, and by the early 1970s, it had grown to include over 500 homes. However, in the late 1970s, the community began to decline due to a lack of investment and maintenance. By the early 1980s, the community had become run-down and many of the homes were in disrepair.
In the late 1980s, the community was purchased by a new group of investors who wanted to revitalize the area. They invested in new infrastructure, such as roads, sidewalks, and utilities, and began to attract new residents. By the early 1990s, the community had been completely revitalized and was once again a thriving retirement community.
Geography
Plantation Mobile Home Park is located in the Florida Panhandle, approximately 20 miles east of Pensacola and 30 miles west of Panama City. The community is situated on the banks of the Choctawhatchee Bay, which provides a beautiful view of the Gulf of Mexico. The area is known for its white sand beaches, lush vegetation, and abundant wildlife.
The community is located in a rural area, and is surrounded by small towns and villages. The nearest major city is Pensacola, which is approximately 20 miles away. The area is served by a number of small airports, including the Pensacola International Airport.
Economy
The economy of Plantation Mobile Home Park is largely based on tourism and retirement. The community is home to a number of small businesses, including restaurants, shops, and other services. The community also has a number of recreational activities, such as fishing, boating, and golfing.
The community is also home to a number of retirees, who are drawn to the area for its peaceful atmosphere and affordable cost of living. Many of the retirees are drawn to the area for its proximity to the Gulf of Mexico and its white sand beaches.
Demographics
As of the 2010 census, the population of Plantation Mobile Home Park was 1,000. The population is largely composed of retirees, with the median age being 65. The racial makeup of the community is predominantly white, with approximately 95% of the population being white. The remaining 5% of the population is composed of African Americans, Hispanics, and other races.
The median household income in Plantation Mobile Home Park is approximately $30,000, which is significantly lower than the national average. The poverty rate in the community is also higher than the national average, with approximately 20% of the population living below the poverty line.
Conclusion
Plantation Mobile Home Park, Florida is a small, unincorporated community located in the heart of the Florida Panhandle. It is home to a population of approximately 1,000 people, most of whom are retirees. The community was established in the late 1950s as a retirement community for seniors, and has since been revitalized and is now a thriving retirement community. The economy of the community is largely based on tourism and retirement, and the area is known for its white sand beaches, lush vegetation, and abundant wildlife. The population of the community is largely composed of retirees, with the median age being 65. The median household income in Plantation Mobile Home Park is approximately $30,000, which is significantly lower than the national average.
Common Questions
What is Per Capita Income in Plantation Mobile Home Park?
Per Capita income in Plantation Mobile Home Park is $23,848.
What is the Median Family Income in Plantation Mobile Home Park?
Median Family Income in Plantation Mobile Home Park is $37,231.
What is the Median Household income in Plantation Mobile Home Park?
Median Household Income in Plantation Mobile Home Park is $44,113.
What is Income or Wage Gap in Plantation Mobile Home Park?
Income or Wage Gap in Plantation Mobile Home Park is 14.7%.
Women in Plantation Mobile Home Park earn 85.3 cents for every dollar earned by a man.
What is Inequality or Gini Index in Plantation Mobile Home Park?
Inequality or Gini Index in Plantation Mobile Home Park is 0.40.
What is the Total Population of Plantation Mobile Home Park?
Total Population of Plantation Mobile Home Park is 1,540.
What is the Total Male Population of Plantation Mobile Home Park?
Total Male Population of Plantation Mobile Home Park is 779.
What is the Total Female Population of Plantation Mobile Home Park?
Total Female Population of Plantation Mobile Home Park is 761.
What is the Ratio of Males per 100 Females in Plantation Mobile Home Park?
There are 102.37 Males per 100 Females in Plantation Mobile Home Park.
What is the Ratio of Females per 100 Males in Plantation Mobile Home Park?
There are 97.69 Females per 100 Males in Plantation Mobile Home Park.
What is the Median Population Age in Plantation Mobile Home Park?
Median Population Age in Plantation Mobile Home Park is 38.3 Years.
What is the Average Family Size in Plantation Mobile Home Park
Average Family Size in Plantation Mobile Home Park is 3.5 People.
What is the Average Household Size in Plantation Mobile Home Park
Average Household Size in Plantation Mobile Home Park is 3.5 People.
How Large is the Labor Force in Plantation Mobile Home Park?
There are 1,078 People in the Labor Forcein in Plantation Mobile Home Park.
What is the Percentage of People in the Labor Force in Plantation Mobile Home Park?
77.3% of People are in the Labor Force in Plantation Mobile Home Park.
What is the Unemployment Rate in Plantation Mobile Home Park?
Unemployment Rate in Plantation Mobile Home Park is 25.6%.