San Castle, FL Map & Demographics
San Castle Map
San Castle Overview
$23,602
PER CAPITA INCOME
$49,246
AVG FAMILY INCOME
$47,953
AVG HOUSEHOLD INCOME
39.6%
WAGE / INCOME GAP [ % ]
60.4¢/ $1
WAGE / INCOME GAP [ $ ]
0.50
INEQUALITY / GINI INDEX
3,192
TOTAL POPULATION
1,845
MALE POPULATION
1,347
FEMALE POPULATION
136.97
MALES / 100 FEMALES
73.01
FEMALES / 100 MALES
34.2
MEDIAN AGE
3.7
AVG FAMILY SIZE
3.3
AVG HOUSEHOLD SIZE
1,780
LABOR FORCE [ PEOPLE ]
71.7%
PERCENT IN LABOR FORCE
4.9%
UNEMPLOYMENT RATE
Income in San Castle
Income Overview in San Castle
Per Capita Income in San Castle is $23,602, while median incomes of families and households are $49,246 and $47,953 respectively.
| Characteristic | Number | Measure |
| Per Capita Income | 3,192 | $23,602 |
| Median Family Income | 687 | $49,246 |
| Mean Family Income | 687 | $68,872 |
| Median Household Income | 971 | $47,953 |
| Mean Household Income | 971 | $69,045 |
| Income Deficit | 687 | $0 |
| Wage / Income Gap (%) | 3,192 | 39.64% |
| Wage / Income Gap ($) | 3,192 | 60.36¢ per $1 |
| Gini / Inequality Index | 3,192 | 0.50 |
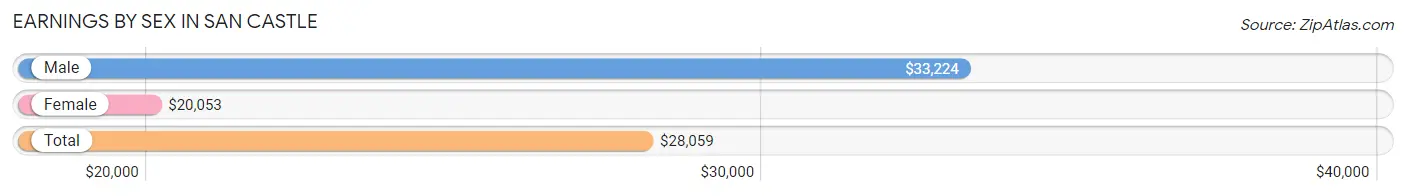
Earnings by Sex in San Castle
Average Earnings in San Castle are $28,059, $33,224 for men and $20,053 for women, a difference of 39.6%.
| Sex | Number | Average Earnings |
| Male | 1,135 (62.9%) | $33,224 |
| Female | 669 (37.1%) | $20,053 |
| Total | 1,804 (100.0%) | $28,059 |
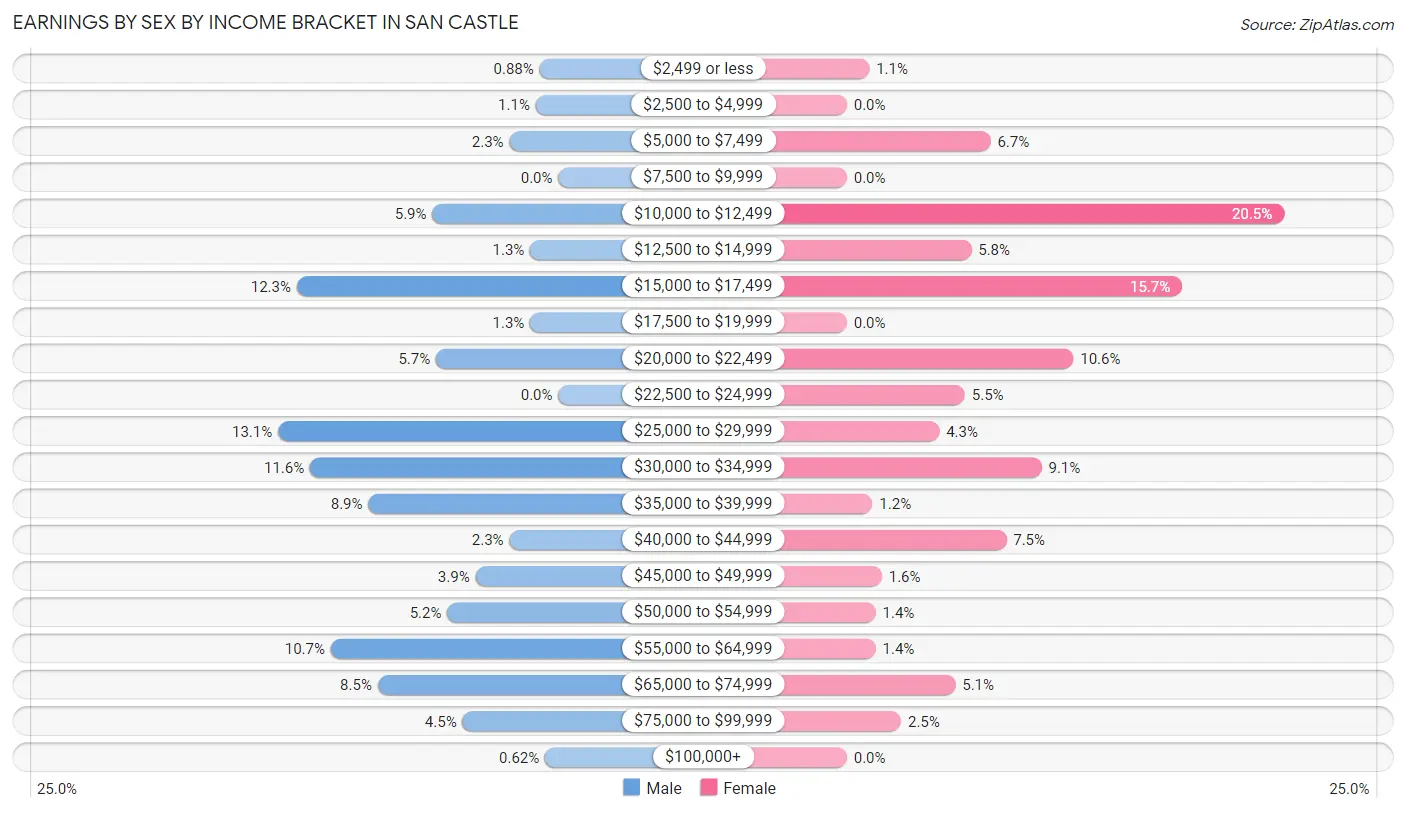
Earnings by Sex by Income Bracket in San Castle
The most common earnings brackets in San Castle are $25,000 to $29,999 for men (149 | 13.1%) and $10,000 to $12,499 for women (137 | 20.5%).
| Income | Male | Female |
| $2,499 or less | 10 (0.9%) | 7 (1.1%) |
| $2,500 to $4,999 | 12 (1.1%) | 0 (0.0%) |
| $5,000 to $7,499 | 26 (2.3%) | 45 (6.7%) |
| $7,500 to $9,999 | 0 (0.0%) | 0 (0.0%) |
| $10,000 to $12,499 | 67 (5.9%) | 137 (20.5%) |
| $12,500 to $14,999 | 15 (1.3%) | 39 (5.8%) |
| $15,000 to $17,499 | 139 (12.2%) | 105 (15.7%) |
| $17,500 to $19,999 | 15 (1.3%) | 0 (0.0%) |
| $20,000 to $22,499 | 65 (5.7%) | 71 (10.6%) |
| $22,500 to $24,999 | 0 (0.0%) | 37 (5.5%) |
| $25,000 to $29,999 | 149 (13.1%) | 29 (4.3%) |
| $30,000 to $34,999 | 132 (11.6%) | 61 (9.1%) |
| $35,000 to $39,999 | 101 (8.9%) | 8 (1.2%) |
| $40,000 to $44,999 | 26 (2.3%) | 50 (7.5%) |
| $45,000 to $49,999 | 44 (3.9%) | 11 (1.6%) |
| $50,000 to $54,999 | 59 (5.2%) | 9 (1.3%) |
| $55,000 to $64,999 | 121 (10.7%) | 9 (1.3%) |
| $65,000 to $74,999 | 96 (8.5%) | 34 (5.1%) |
| $75,000 to $99,999 | 51 (4.5%) | 17 (2.5%) |
| $100,000+ | 7 (0.6%) | 0 (0.0%) |
| Total | 1,135 (100.0%) | 669 (100.0%) |
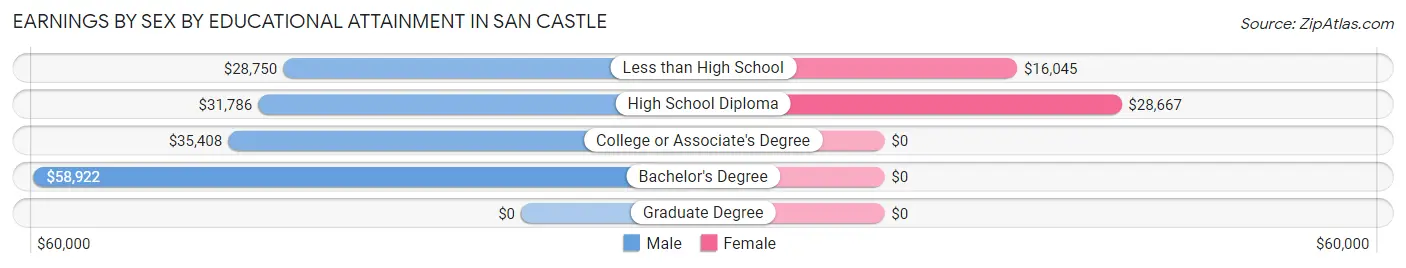
Earnings by Sex by Educational Attainment in San Castle
Average earnings in San Castle are $34,730 for men and $17,405 for women, a difference of 49.9%. Men with an educational attainment of bachelor's degree enjoy the highest average annual earnings of $58,922, while those with less than high school education earn the least with $28,750. Women with an educational attainment of high school diploma earn the most with the average annual earnings of $28,667, while those with less than high school education have the smallest earnings of $16,045.
| Educational Attainment | Male Income | Female Income |
| Less than High School | $28,750 | $16,045 |
| High School Diploma | $31,786 | $28,667 |
| College or Associate's Degree | $35,408 | $0 |
| Bachelor's Degree | $58,922 | $0 |
| Graduate Degree | - | - |
| Total | $34,730 | $17,405 |
Family Income in San Castle
Family Income Brackets in San Castle
According to the San Castle family income data, there are 168 families falling into the $75,000 to $99,999 income range, which is the most common income bracket and makes up 24.4% of all families. Conversely, the $200,000+ income bracket is the least frequent group with only 7 families (1.0%) belonging to this category.
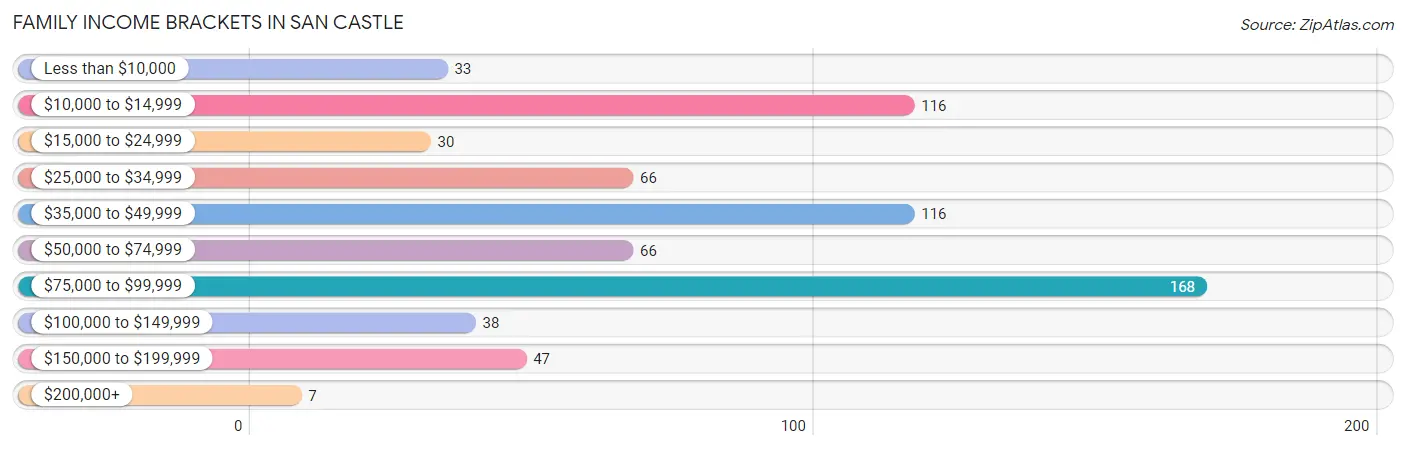
| Income Bracket | # Families | % Families |
| Less than $10,000 | 33 | 4.8% |
| $10,000 to $14,999 | 116 | 16.9% |
| $15,000 to $24,999 | 30 | 4.4% |
| $25,000 to $34,999 | 66 | 9.6% |
| $35,000 to $49,999 | 116 | 16.9% |
| $50,000 to $74,999 | 66 | 9.6% |
| $75,000 to $99,999 | 168 | 24.5% |
| $100,000 to $149,999 | 38 | 5.5% |
| $150,000 to $199,999 | 47 | 6.8% |
| $200,000+ | 7 | 1.0% |
Family Income by Famaliy Size in San Castle
4-person families (102 | 14.8%) account for the highest median family income in San Castle with $76,324 per family, while 4-person families (102 | 14.8%) have the highest median income of $19,081 per family member.
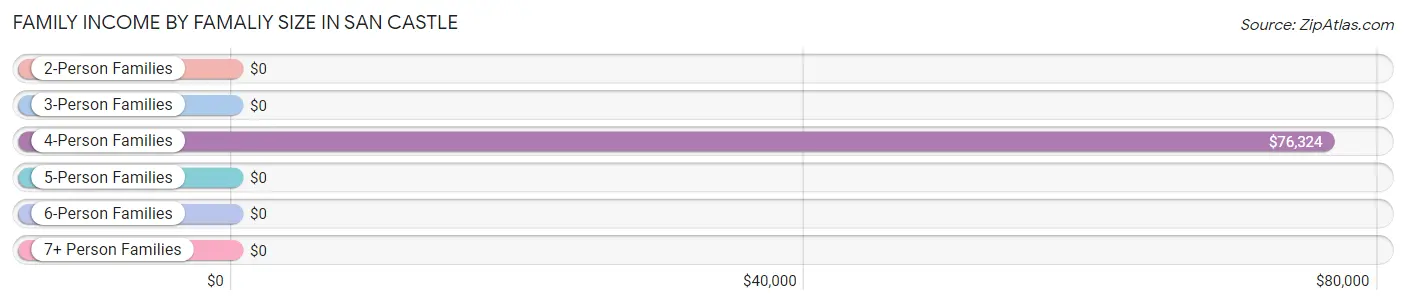
| Income Bracket | # Families | Median Income |
| 2-Person Families | 234 (34.1%) | $0 |
| 3-Person Families | 241 (35.1%) | $0 |
| 4-Person Families | 102 (14.8%) | $76,324 |
| 5-Person Families | 64 (9.3%) | $0 |
| 6-Person Families | 31 (4.5%) | $0 |
| 7+ Person Families | 15 (2.2%) | $0 |
| Total | 687 (100.0%) | $49,246 |
Family Income by Number of Earners in San Castle
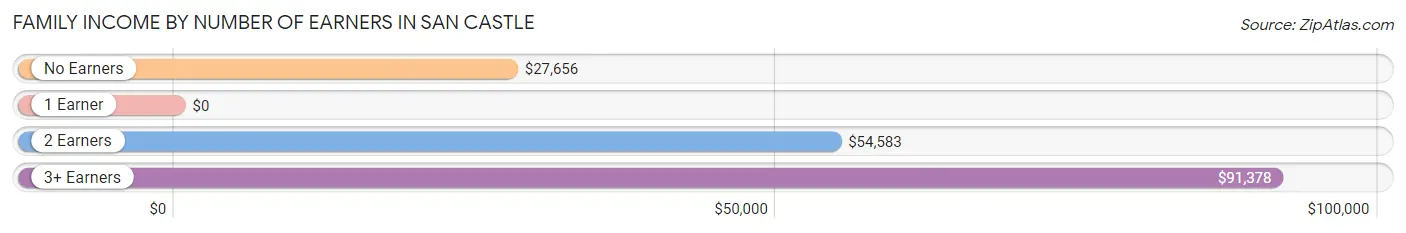
| Number of Earners | # Families | Median Income |
| No Earners | 111 (16.2%) | $27,656 |
| 1 Earner | 244 (35.5%) | $0 |
| 2 Earners | 173 (25.2%) | $54,583 |
| 3+ Earners | 159 (23.1%) | $91,378 |
| Total | 687 (100.0%) | $49,246 |
Household Income in San Castle
Household Income Brackets in San Castle
With 168 households falling in the category, the $75,000 to $99,999 income range is the most frequent in San Castle, accounting for 17.3% of all households. In contrast, only 41 households (4.2%) fall into the less than $10,000 income bracket, making it the least populous group.
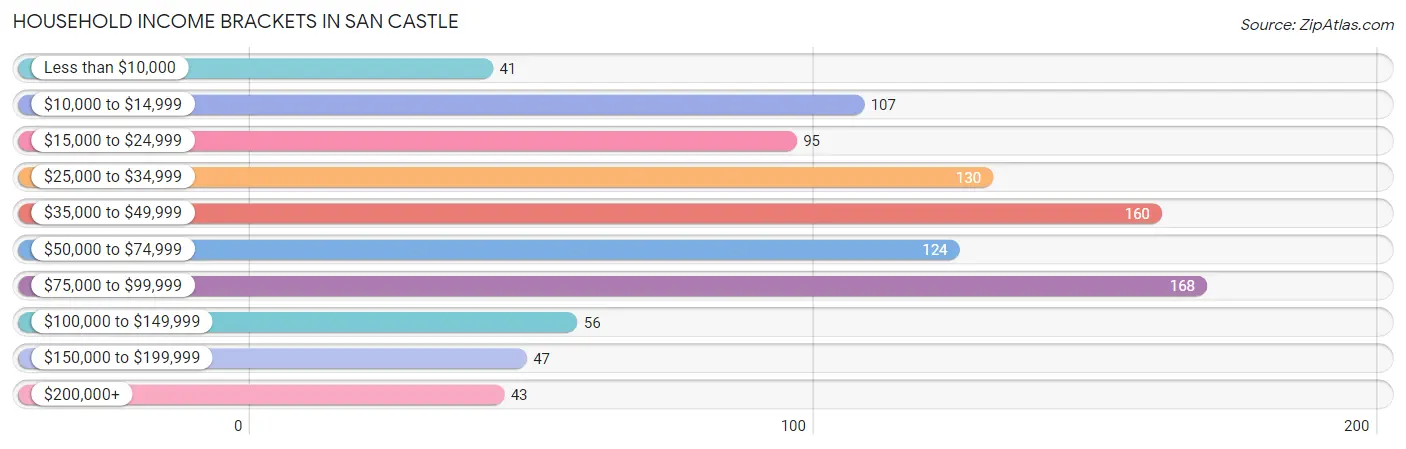
| Income Bracket | # Households | % Households |
| Less than $10,000 | 41 | 4.2% |
| $10,000 to $14,999 | 107 | 11.0% |
| $15,000 to $24,999 | 95 | 9.8% |
| $25,000 to $34,999 | 130 | 13.4% |
| $35,000 to $49,999 | 160 | 16.5% |
| $50,000 to $74,999 | 124 | 12.8% |
| $75,000 to $99,999 | 168 | 17.3% |
| $100,000 to $149,999 | 56 | 5.8% |
| $150,000 to $199,999 | 47 | 4.8% |
| $200,000+ | 43 | 4.4% |
Household Income by Householder Age in San Castle
The median household income in San Castle is $47,953, with the highest median household income of $49,483 found in the 45 to 64 years age bracket for the primary householder. A total of 434 households (44.7%) fall into this category.
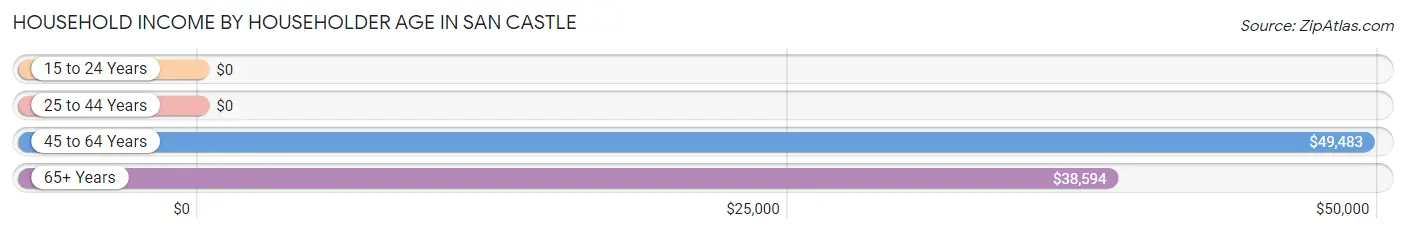
| Income Bracket | # Households | Median Income |
| 15 to 24 Years | 0 (0.0%) | $0 |
| 25 to 44 Years | 285 (29.3%) | $0 |
| 45 to 64 Years | 434 (44.7%) | $49,483 |
| 65+ Years | 252 (26.0%) | $38,594 |
| Total | 971 (100.0%) | $47,953 |
Poverty in San Castle
Income Below Poverty by Sex and Age in San Castle
With 19.5% poverty level for males and 21.7% for females among the residents of San Castle, 75 year old and over males and 16 and 17 year old females are the most vulnerable to poverty, with 51 males (82.3%) and 39 females (100.0%) in their respective age groups living below the poverty level.
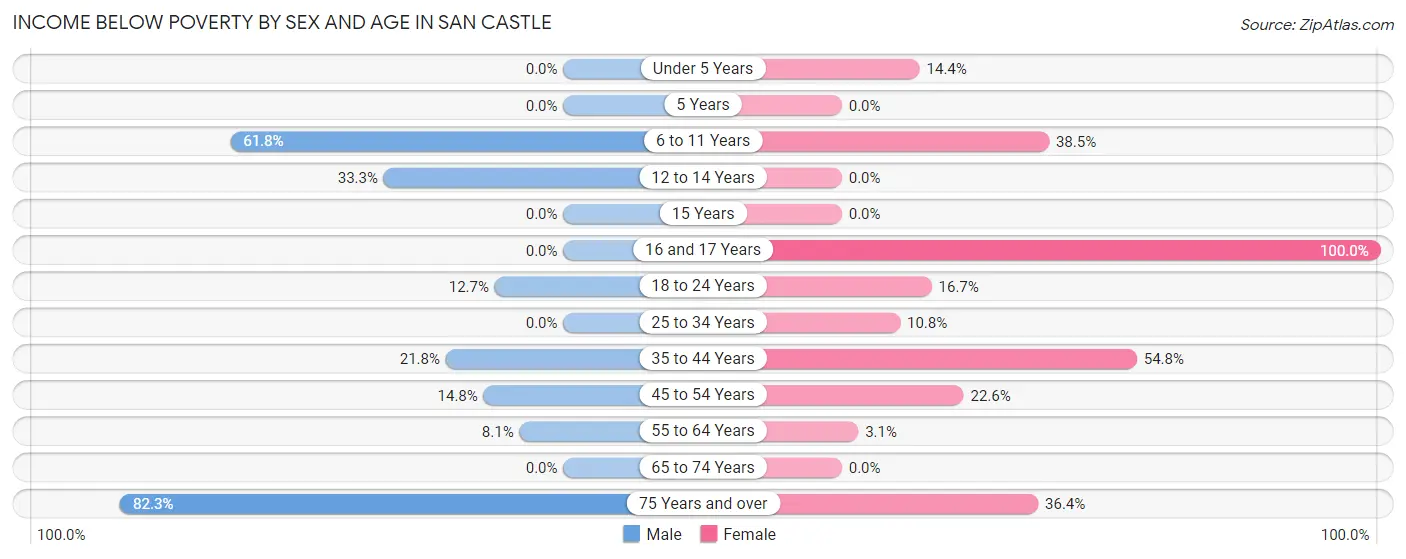
| Age Bracket | Male | Female |
| Under 5 Years | 0 (0.0%) | 13 (14.4%) |
| 5 Years | 0 (0.0%) | 0 (0.0%) |
| 6 to 11 Years | 204 (61.8%) | 40 (38.5%) |
| 12 to 14 Years | 11 (33.3%) | 0 (0.0%) |
| 15 Years | 0 (0.0%) | 0 (0.0%) |
| 16 and 17 Years | 0 (0.0%) | 39 (100.0%) |
| 18 to 24 Years | 14 (12.7%) | 12 (16.7%) |
| 25 to 34 Years | 0 (0.0%) | 12 (10.8%) |
| 35 to 44 Years | 24 (21.8%) | 92 (54.8%) |
| 45 to 54 Years | 37 (14.8%) | 33 (22.6%) |
| 55 to 64 Years | 18 (8.1%) | 9 (3.0%) |
| 65 to 74 Years | 0 (0.0%) | 0 (0.0%) |
| 75 Years and over | 51 (82.3%) | 43 (36.4%) |
| Total | 359 (19.5%) | 293 (21.7%) |
Income Above Poverty by Sex and Age in San Castle
According to the poverty statistics in San Castle, males aged under 5 years and females aged 5 years are the age groups that are most secure financially, with 100.0% of males and 100.0% of females in these age groups living above the poverty line.
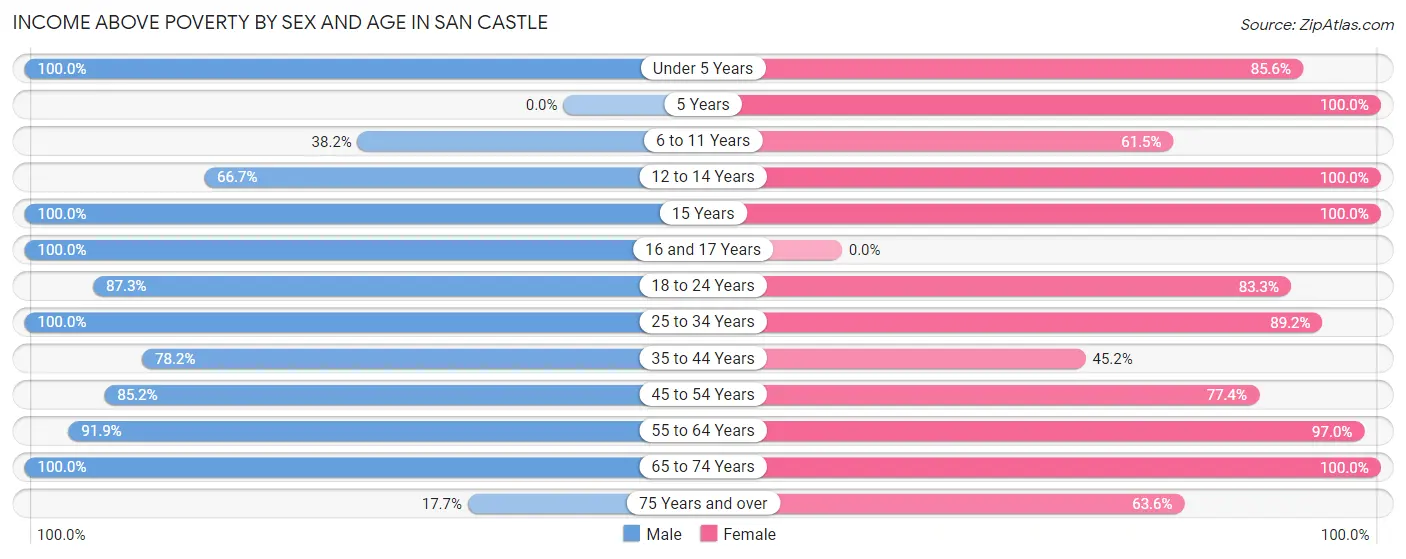
| Age Bracket | Male | Female |
| Under 5 Years | 25 (100.0%) | 77 (85.6%) |
| 5 Years | 0 (0.0%) | 29 (100.0%) |
| 6 to 11 Years | 126 (38.2%) | 64 (61.5%) |
| 12 to 14 Years | 22 (66.7%) | 59 (100.0%) |
| 15 Years | 13 (100.0%) | 26 (100.0%) |
| 16 and 17 Years | 15 (100.0%) | 0 (0.0%) |
| 18 to 24 Years | 96 (87.3%) | 60 (83.3%) |
| 25 to 34 Years | 576 (100.0%) | 99 (89.2%) |
| 35 to 44 Years | 86 (78.2%) | 76 (45.2%) |
| 45 to 54 Years | 213 (85.2%) | 113 (77.4%) |
| 55 to 64 Years | 203 (91.9%) | 286 (97.0%) |
| 65 to 74 Years | 100 (100.0%) | 90 (100.0%) |
| 75 Years and over | 11 (17.7%) | 75 (63.6%) |
| Total | 1,486 (80.5%) | 1,054 (78.2%) |
Income Below Poverty Among Married-Couple Families in San Castle
The poverty statistics for married-couple families in San Castle show that 5.9% or 16 of the total 271 families live below the poverty line. Families with 3 or 4 children have the highest poverty rate of 35.7%, comprising of 10 families. On the other hand, families with 1 or 2 children have the lowest poverty rate of 0.0%, which includes 0 families.
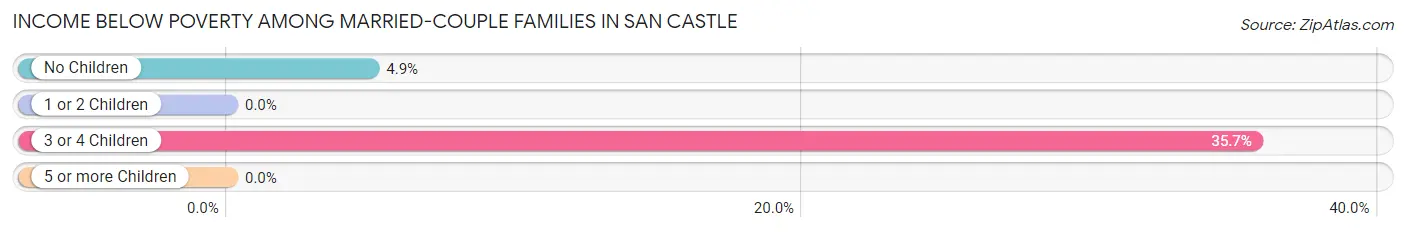
| Children | Above Poverty | Below Poverty |
| No Children | 116 (95.1%) | 6 (4.9%) |
| 1 or 2 Children | 106 (100.0%) | 0 (0.0%) |
| 3 or 4 Children | 18 (64.3%) | 10 (35.7%) |
| 5 or more Children | 15 (100.0%) | 0 (0.0%) |
| Total | 255 (94.1%) | 16 (5.9%) |
Income Below Poverty Among Single-Parent Households in San Castle
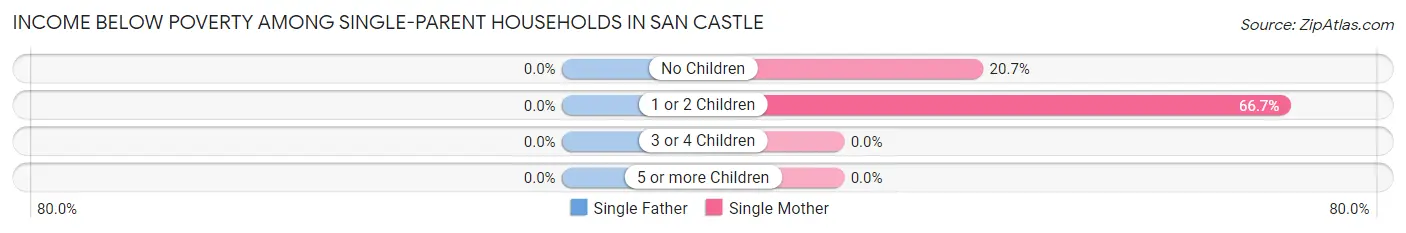
| Children | Single Father | Single Mother |
| No Children | 0 (0.0%) | 35 (20.7%) |
| 1 or 2 Children | 0 (0.0%) | 124 (66.7%) |
| 3 or 4 Children | 0 (0.0%) | 0 (0.0%) |
| 5 or more Children | 0 (0.0%) | 0 (0.0%) |
| Total | 0 (0.0%) | 159 (44.8%) |
Income Below Poverty Among Married-Couple vs Single-Parent Households in San Castle
The poverty data for San Castle shows that 16 of the married-couple family households (5.9%) and 159 of the single-parent households (38.2%) are living below the poverty level. Within the married-couple family households, those with 3 or 4 children have the highest poverty rate, with 10 households (35.7%) falling below the poverty line. Among the single-parent households, those with 1 or 2 children have the highest poverty rate, with 124 household (60.8%) living below poverty.
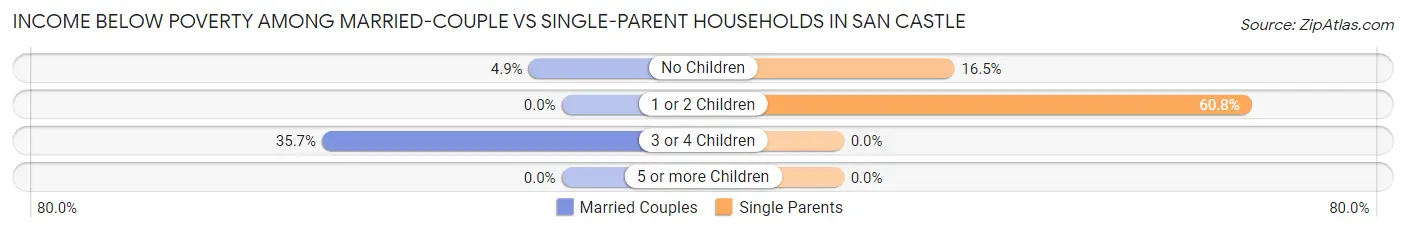
| Children | Married-Couple Families | Single-Parent Households |
| No Children | 6 (4.9%) | 35 (16.5%) |
| 1 or 2 Children | 0 (0.0%) | 124 (60.8%) |
| 3 or 4 Children | 10 (35.7%) | 0 (0.0%) |
| 5 or more Children | 0 (0.0%) | 0 (0.0%) |
| Total | 16 (5.9%) | 159 (38.2%) |
Race in San Castle
The most populous races in San Castle are White / Caucasian (1,209 | 37.9%), Black / African American (1,137 | 35.6%), and Hispanic or Latino (1,075 | 33.7%).
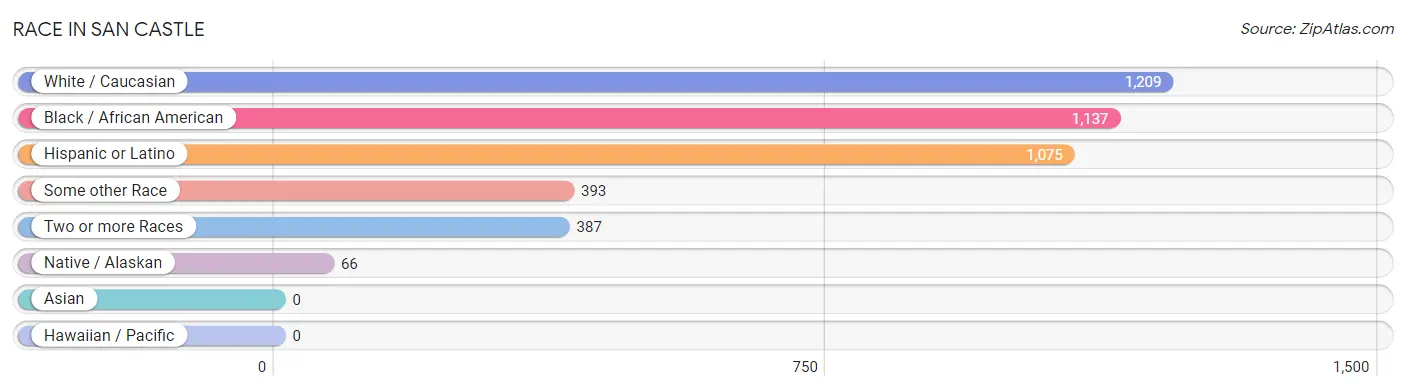
| Race | # Population | % Population |
| Asian | 0 | 0.0% |
| Black / African American | 1,137 | 35.6% |
| Hawaiian / Pacific | 0 | 0.0% |
| Hispanic or Latino | 1,075 | 33.7% |
| Native / Alaskan | 66 | 2.1% |
| White / Caucasian | 1,209 | 37.9% |
| Two or more Races | 387 | 12.1% |
| Some other Race | 393 | 12.3% |
| Total | 3,192 | 100.0% |
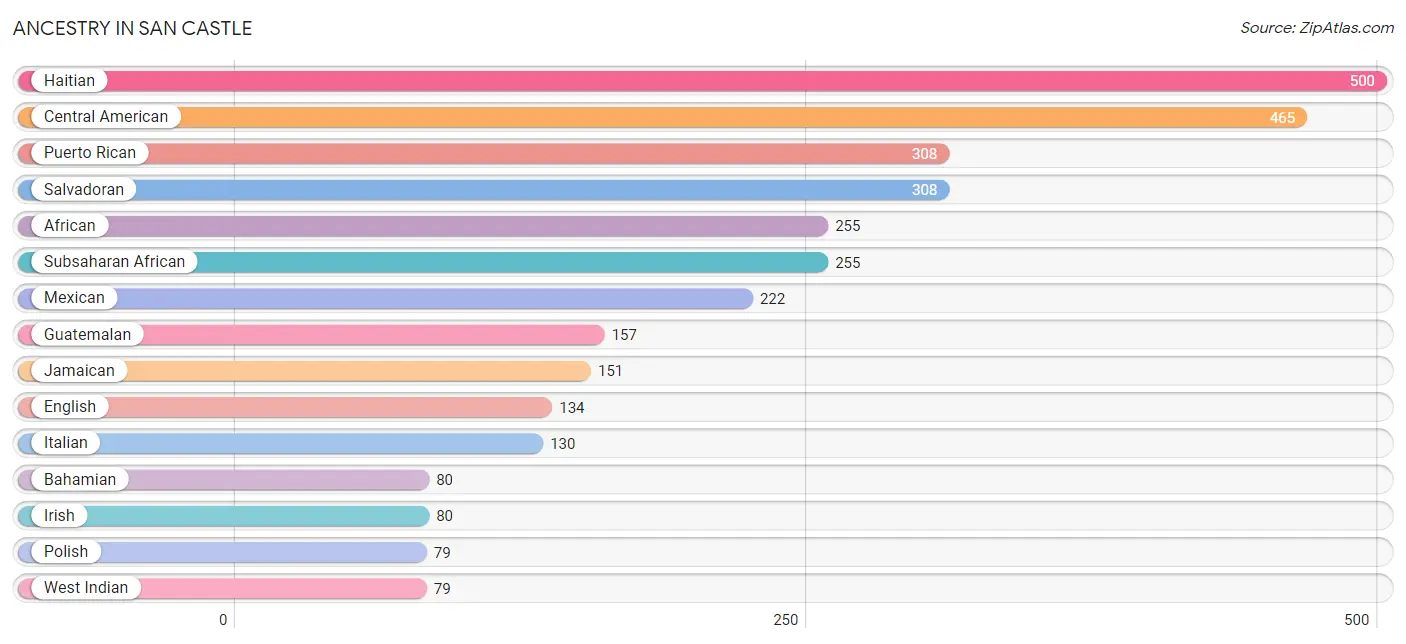
Ancestry in San Castle
The most populous ancestries reported in San Castle are Haitian (500 | 15.7%), Central American (465 | 14.6%), Puerto Rican (308 | 9.7%), Salvadoran (308 | 9.7%), and African (255 | 8.0%), together accounting for 57.5% of all San Castle residents.
| Ancestry | # Population | % Population |
| African | 255 | 8.0% |
| American | 69 | 2.2% |
| Bahamian | 80 | 2.5% |
| British West Indian | 35 | 1.1% |
| Central American | 465 | 14.6% |
| Central American Indian | 66 | 2.1% |
| Colombian | 17 | 0.5% |
| Cuban | 18 | 0.6% |
| English | 134 | 4.2% |
| European | 9 | 0.3% |
| Finnish | 35 | 1.1% |
| French | 42 | 1.3% |
| German | 40 | 1.3% |
| Greek | 9 | 0.3% |
| Guatemalan | 157 | 4.9% |
| Haitian | 500 | 15.7% |
| Hungarian | 5 | 0.2% |
| Irish | 80 | 2.5% |
| Italian | 130 | 4.1% |
| Jamaican | 151 | 4.7% |
| Lithuanian | 18 | 0.6% |
| Mexican | 222 | 7.0% |
| Polish | 79 | 2.5% |
| Portuguese | 66 | 2.1% |
| Puerto Rican | 308 | 9.7% |
| Salvadoran | 308 | 9.7% |
| Scandinavian | 11 | 0.3% |
| Scottish | 28 | 0.9% |
| South American | 17 | 0.5% |
| Spaniard | 9 | 0.3% |
| Spanish | 11 | 0.3% |
| Subsaharan African | 255 | 8.0% |
| Thai | 9 | 0.3% |
| Trinidadian and Tobagonian | 9 | 0.3% |
| Ukrainian | 7 | 0.2% |
| West Indian | 79 | 2.5% | View All 36 Rows |
Immigrants in San Castle
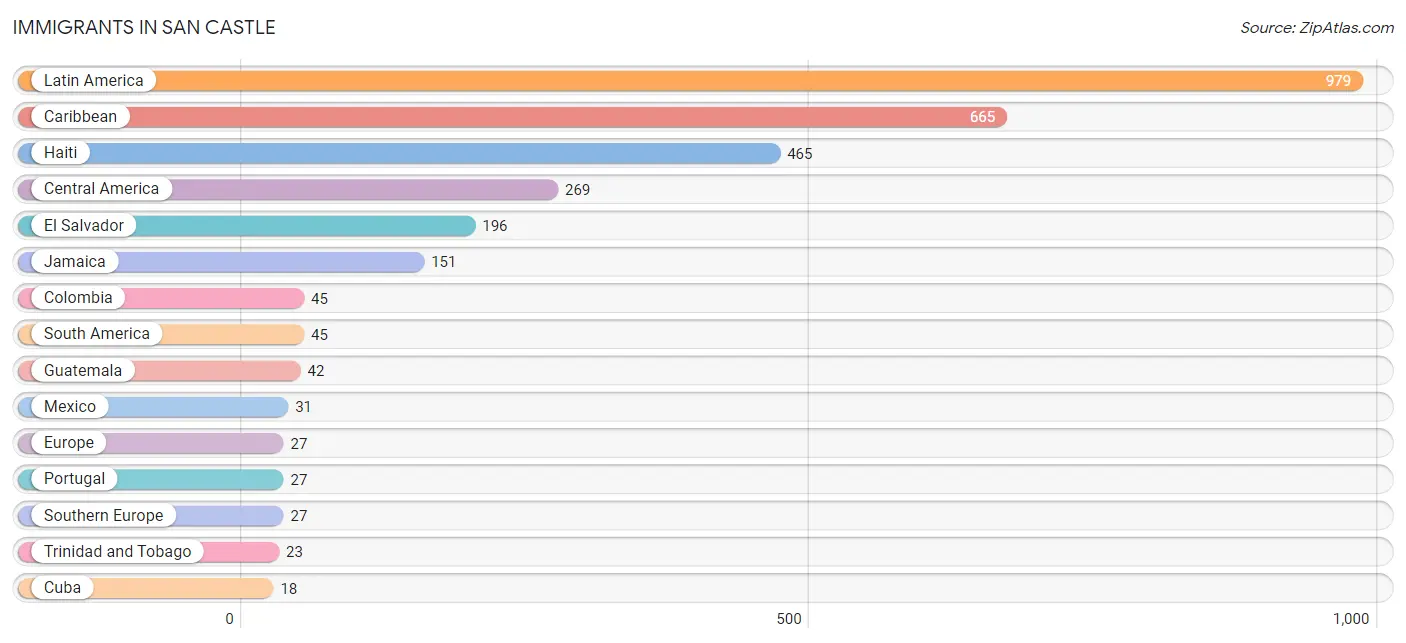
The most numerous immigrant groups reported in San Castle came from Latin America (979 | 30.7%), Caribbean (665 | 20.8%), Haiti (465 | 14.6%), Central America (269 | 8.4%), and El Salvador (196 | 6.1%), together accounting for 80.6% of all San Castle residents.
| Immigration Origin | # Population | % Population |
| Bahamas | 8 | 0.3% |
| Canada | 7 | 0.2% |
| Caribbean | 665 | 20.8% |
| Central America | 269 | 8.4% |
| Colombia | 45 | 1.4% |
| Cuba | 18 | 0.6% |
| El Salvador | 196 | 6.1% |
| Europe | 27 | 0.9% |
| Guatemala | 42 | 1.3% |
| Haiti | 465 | 14.6% |
| Jamaica | 151 | 4.7% |
| Latin America | 979 | 30.7% |
| Mexico | 31 | 1.0% |
| Portugal | 27 | 0.9% |
| South America | 45 | 1.4% |
| Southern Europe | 27 | 0.9% |
| Trinidad and Tobago | 23 | 0.7% | View All 17 Rows |
Sex and Age in San Castle
Sex and Age in San Castle
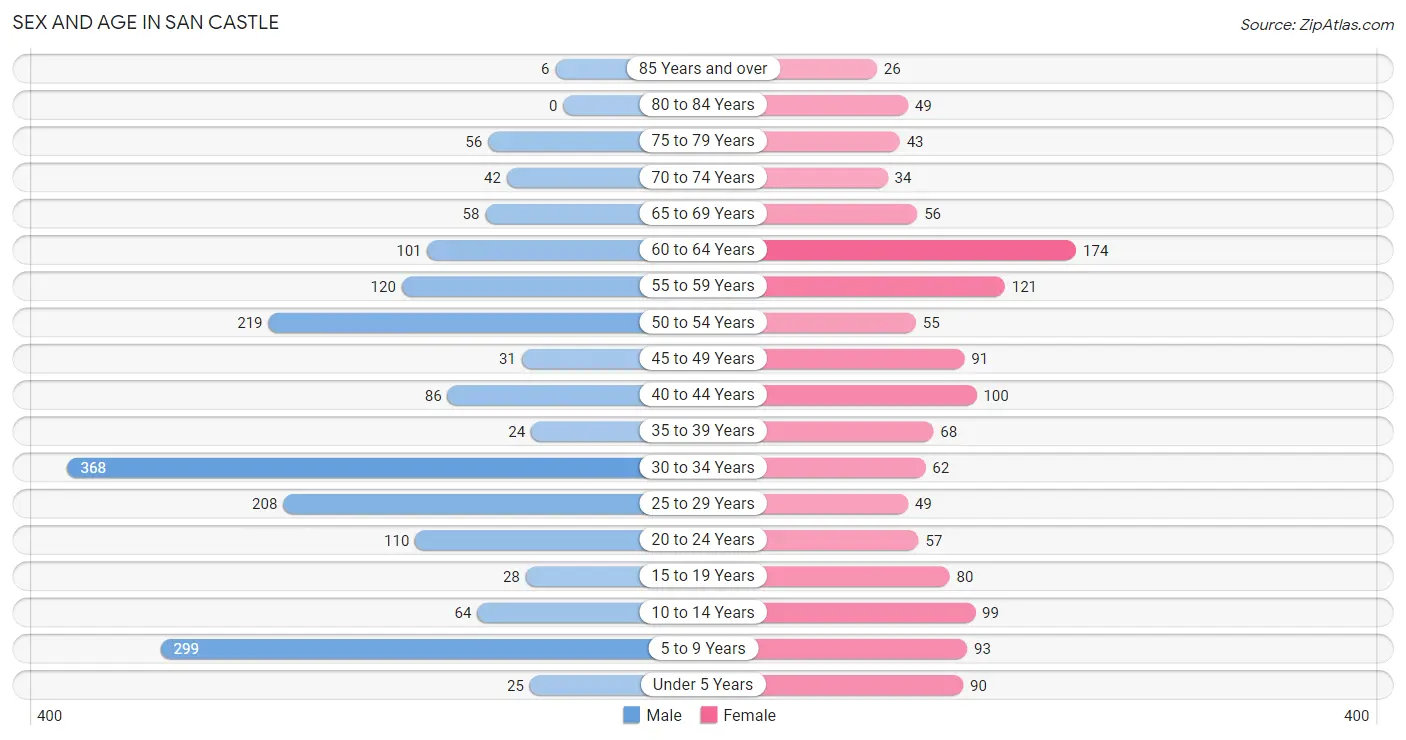
The most populous age groups in San Castle are 30 to 34 Years (368 | 20.0%) for men and 60 to 64 Years (174 | 12.9%) for women.
| Age Bracket | Male | Female |
| Under 5 Years | 25 (1.4%) | 90 (6.7%) |
| 5 to 9 Years | 299 (16.2%) | 93 (6.9%) |
| 10 to 14 Years | 64 (3.5%) | 99 (7.3%) |
| 15 to 19 Years | 28 (1.5%) | 80 (5.9%) |
| 20 to 24 Years | 110 (6.0%) | 57 (4.2%) |
| 25 to 29 Years | 208 (11.3%) | 49 (3.6%) |
| 30 to 34 Years | 368 (20.0%) | 62 (4.6%) |
| 35 to 39 Years | 24 (1.3%) | 68 (5.1%) |
| 40 to 44 Years | 86 (4.7%) | 100 (7.4%) |
| 45 to 49 Years | 31 (1.7%) | 91 (6.8%) |
| 50 to 54 Years | 219 (11.9%) | 55 (4.1%) |
| 55 to 59 Years | 120 (6.5%) | 121 (9.0%) |
| 60 to 64 Years | 101 (5.5%) | 174 (12.9%) |
| 65 to 69 Years | 58 (3.1%) | 56 (4.2%) |
| 70 to 74 Years | 42 (2.3%) | 34 (2.5%) |
| 75 to 79 Years | 56 (3.0%) | 43 (3.2%) |
| 80 to 84 Years | 0 (0.0%) | 49 (3.6%) |
| 85 Years and over | 6 (0.3%) | 26 (1.9%) |
| Total | 1,845 (100.0%) | 1,347 (100.0%) |
Families and Households in San Castle
Median Family Size in San Castle
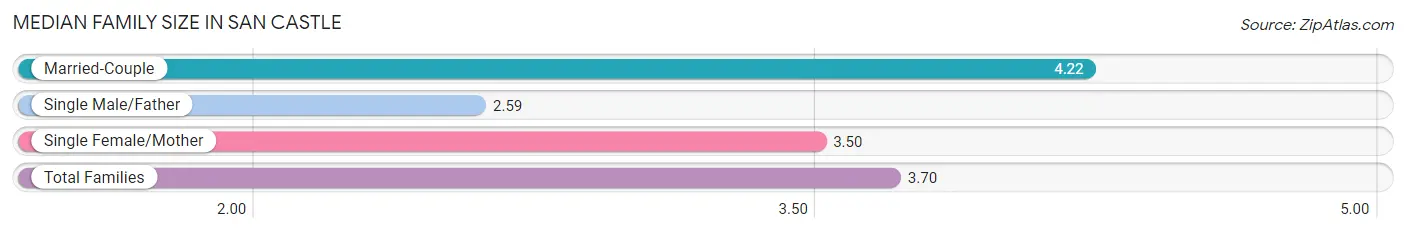
The median family size in San Castle is 3.70 persons per family, with married-couple families (271 | 39.5%) accounting for the largest median family size of 4.22 persons per family. On the other hand, single male/father families (61 | 8.9%) represent the smallest median family size with 2.59 persons per family.
| Family Type | # Families | Family Size |
| Married-Couple | 271 (39.5%) | 4.22 |
| Single Male/Father | 61 (8.9%) | 2.59 |
| Single Female/Mother | 355 (51.7%) | 3.50 |
| Total Families | 687 (100.0%) | 3.70 |
Median Household Size in San Castle
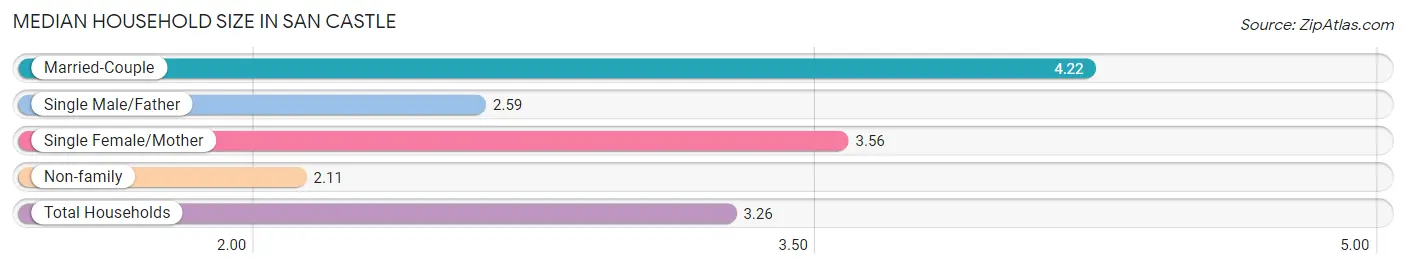
The median household size in San Castle is 3.26 persons per household, with married-couple households (271 | 27.9%) accounting for the largest median household size of 4.22 persons per household. non-family households (284 | 29.2%) represent the smallest median household size with 2.11 persons per household.
| Household Type | # Households | Household Size |
| Married-Couple | 271 (27.9%) | 4.22 |
| Single Male/Father | 61 (6.3%) | 2.59 |
| Single Female/Mother | 355 (36.6%) | 3.56 |
| Non-family | 284 (29.2%) | 2.11 |
| Total Households | 971 (100.0%) | 3.26 |
Household Size by Marriage Status in San Castle
Out of a total of 971 households in San Castle, 687 (70.8%) are family households, while 284 (29.2%) are nonfamily households. The most numerous type of family households are 3-person households, comprising 251, and the most common type of nonfamily households are 1-person households, comprising 193.
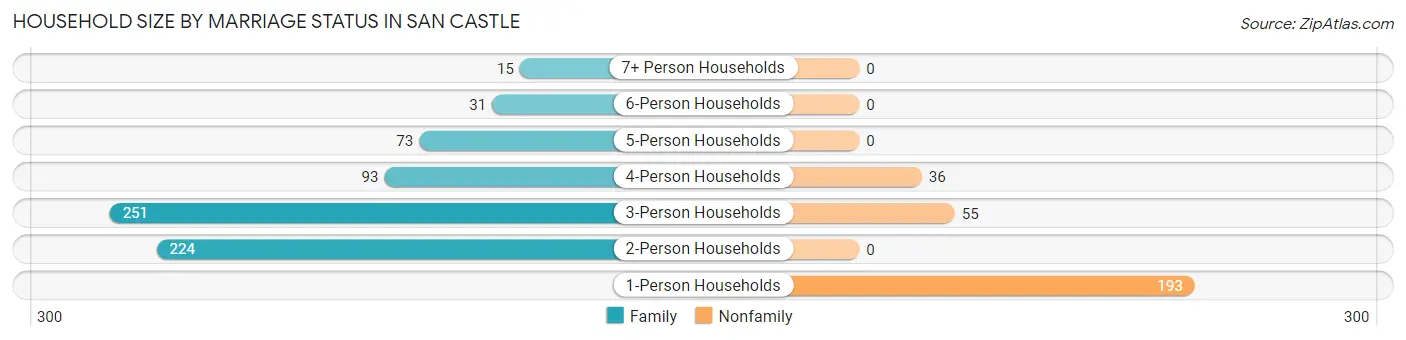
| Household Size | Family Households | Nonfamily Households |
| 1-Person Households | - | 193 (19.9%) |
| 2-Person Households | 224 (23.1%) | 0 (0.0%) |
| 3-Person Households | 251 (25.9%) | 55 (5.7%) |
| 4-Person Households | 93 (9.6%) | 36 (3.7%) |
| 5-Person Households | 73 (7.5%) | 0 (0.0%) |
| 6-Person Households | 31 (3.2%) | 0 (0.0%) |
| 7+ Person Households | 15 (1.5%) | 0 (0.0%) |
| Total | 687 (70.8%) | 284 (29.2%) |
Female Fertility in San Castle
Fertility by Age in San Castle
Average fertility rate in San Castle is 67.0 births per 1,000 women. Women in the age bracket of 20 to 34 years have the highest fertility rate with 101.0 births per 1,000 women. Women in the age bracket of 35 to 50 years acount for 52.8% of all women with births.
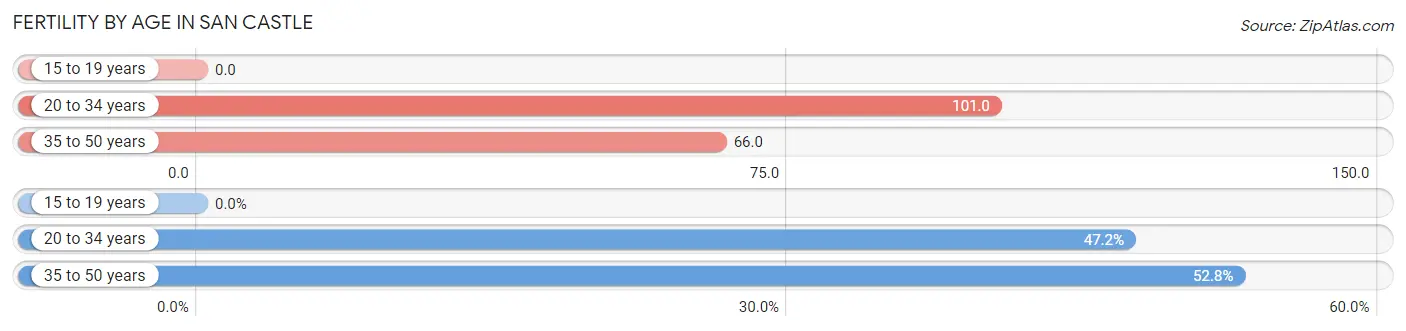
| Age Bracket | Women with Births | Births / 1,000 Women |
| 15 to 19 years | 0 (0.0%) | 0.0 |
| 20 to 34 years | 17 (47.2%) | 101.0 |
| 35 to 50 years | 19 (52.8%) | 66.0 |
| Total | 36 (100.0%) | 67.0 |
Fertility by Age by Marriage Status in San Castle
47.2% of women with births (36) in San Castle are married. The highest percentage of unmarried women with births falls into 35 to 50 years age bracket with 100.0% of them unmarried at the time of birth, while the lowest percentage of unmarried women with births belong to 20 to 34 years age bracket with 0.0% of them unmarried.
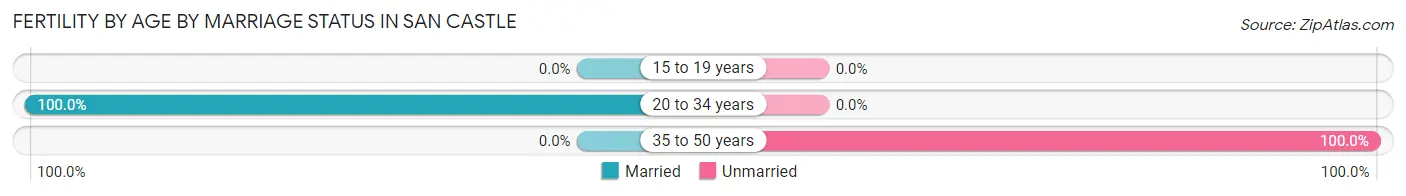
| Age Bracket | Married | Unmarried |
| 15 to 19 years | 0 (0.0%) | 0 (0.0%) |
| 20 to 34 years | 17 (100.0%) | 0 (0.0%) |
| 35 to 50 years | 0 (0.0%) | 19 (100.0%) |
| Total | 17 (47.2%) | 19 (52.8%) |
Fertility by Education in San Castle
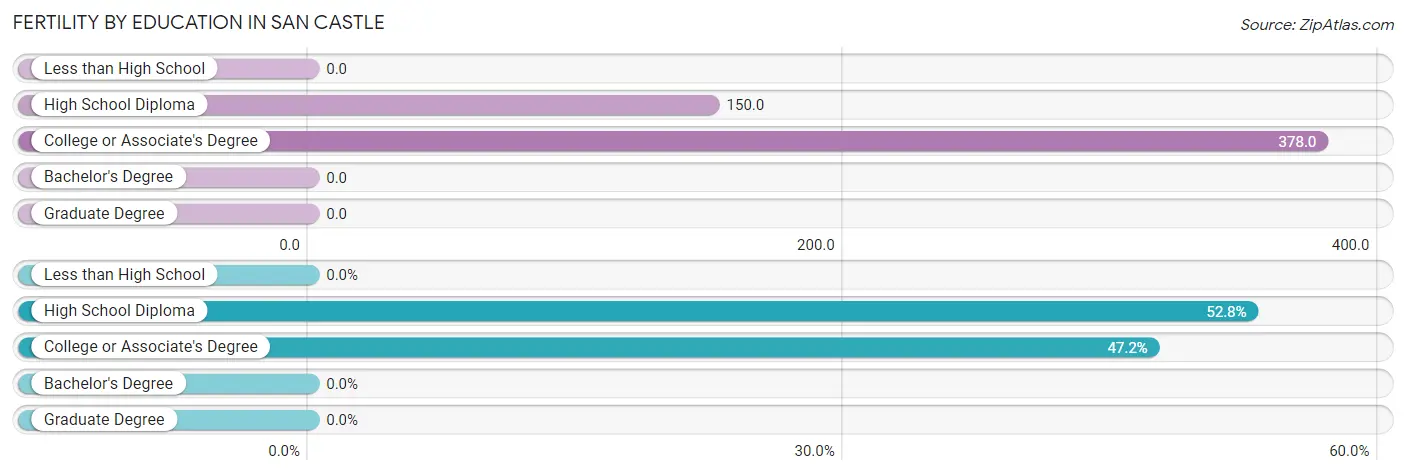
| Educational Attainment | Women with Births | Births / 1,000 Women |
| Less than High School | 0 (0.0%) | 0.0 |
| High School Diploma | 19 (52.8%) | 150.0 |
| College or Associate's Degree | 17 (47.2%) | 378.0 |
| Bachelor's Degree | 0 (0.0%) | 0.0 |
| Graduate Degree | 0 (0.0%) | 0.0 |
| Total | 36 (100.0%) | 67.0 |
Fertility by Education by Marriage Status in San Castle
52.8% of women with births in San Castle are unmarried. Women with the educational attainment of college or associate's degree are most likely to be married with 100.0% of them married at childbirth, while women with the educational attainment of high school diploma are least likely to be married with 100.0% of them unmarried at childbirth.
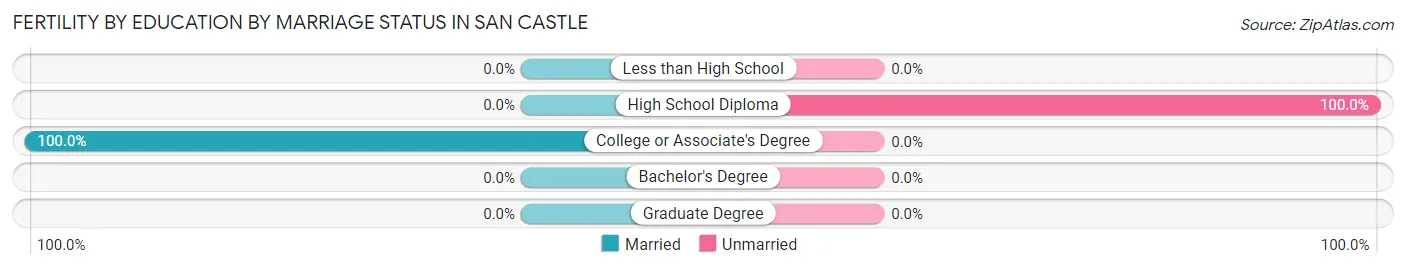
| Educational Attainment | Married | Unmarried |
| Less than High School | 0 (0.0%) | 0 (0.0%) |
| High School Diploma | 0 (0.0%) | 19 (100.0%) |
| College or Associate's Degree | 17 (100.0%) | 0 (0.0%) |
| Bachelor's Degree | 0 (0.0%) | 0 (0.0%) |
| Graduate Degree | 0 (0.0%) | 0 (0.0%) |
| Total | 17 (47.2%) | 19 (52.8%) |
Employment Characteristics in San Castle
Employment by Class of Employer in San Castle
Among the 1,693 employed individuals in San Castle, private company employees (1,537 | 90.8%), not-for-profit organizations (59 | 3.5%), and self-employed (not incorporated) (55 | 3.3%) make up the most common classes of employment.
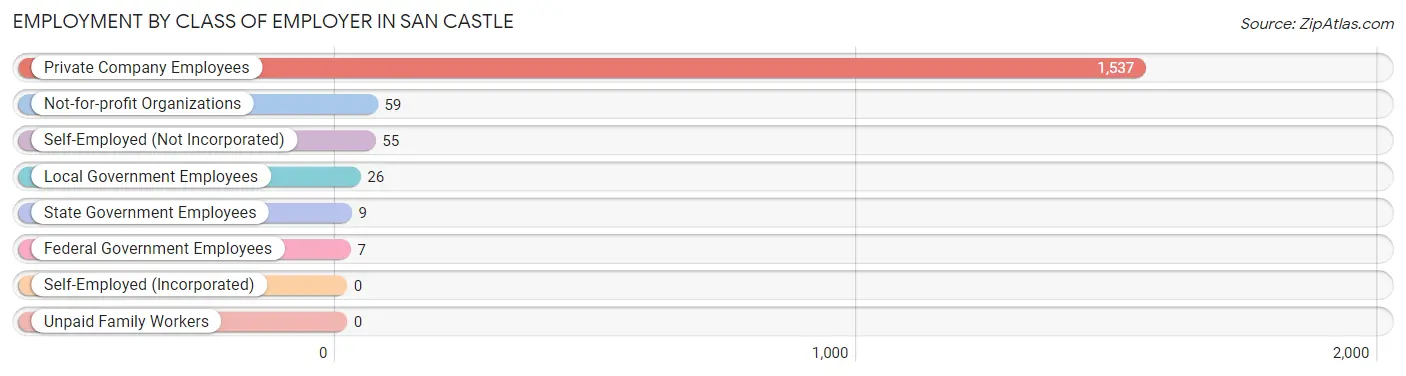
| Employer Class | # Employees | % Employees |
| Private Company Employees | 1,537 | 90.8% |
| Self-Employed (Incorporated) | 0 | 0.0% |
| Self-Employed (Not Incorporated) | 55 | 3.3% |
| Not-for-profit Organizations | 59 | 3.5% |
| Local Government Employees | 26 | 1.5% |
| State Government Employees | 9 | 0.5% |
| Federal Government Employees | 7 | 0.4% |
| Unpaid Family Workers | 0 | 0.0% |
| Total | 1,693 | 100.0% |
Employment Status by Age in San Castle
According to the labor force statistics for San Castle, out of the total population over 16 years of age (2,483), 71.7% or 1,780 individuals are in the labor force, with 4.9% or 87 of them unemployed. The age group with the highest labor force participation rate is 25 to 29 years, with 91.8% or 236 individuals in the labor force. Within the labor force, the 45 to 54 years age range has the highest percentage of unemployed individuals, with 13.3% or 44 of them being unemployed.
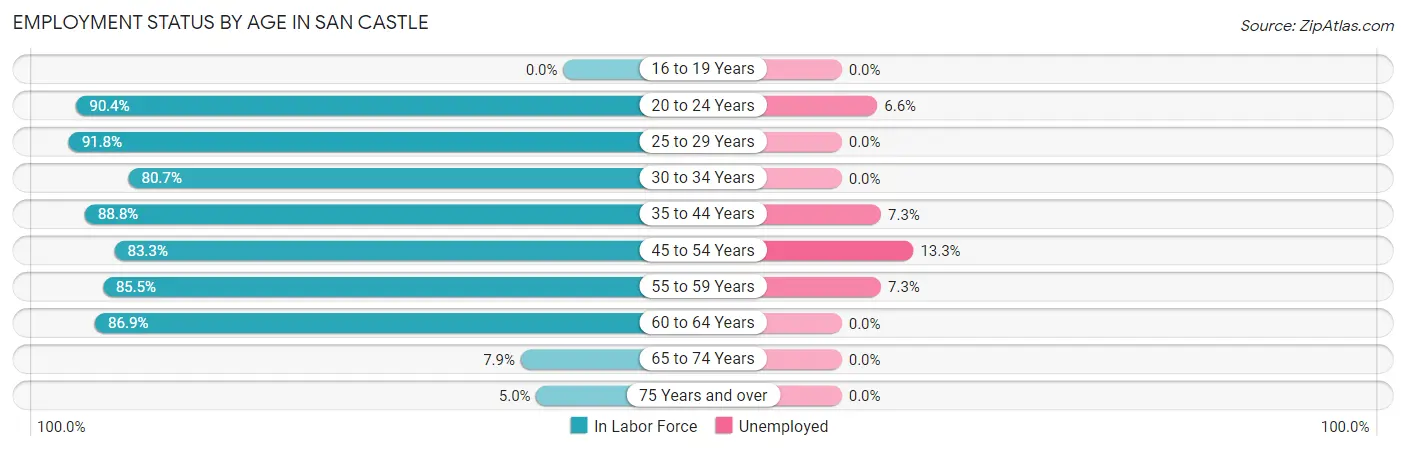
| Age Bracket | In Labor Force | Unemployed |
| 16 to 19 Years | 0 (0.0%) | 0 (0.0%) |
| 20 to 24 Years | 151 (90.4%) | 10 (6.6%) |
| 25 to 29 Years | 236 (91.8%) | 0 (0.0%) |
| 30 to 34 Years | 347 (80.7%) | 0 (0.0%) |
| 35 to 44 Years | 247 (88.8%) | 18 (7.3%) |
| 45 to 54 Years | 330 (83.3%) | 44 (13.3%) |
| 55 to 59 Years | 206 (85.5%) | 15 (7.3%) |
| 60 to 64 Years | 239 (86.9%) | 0 (0.0%) |
| 65 to 74 Years | 15 (7.9%) | 0 (0.0%) |
| 75 Years and over | 9 (5.0%) | 0 (0.0%) |
| Total | 1,780 (71.7%) | 87 (4.9%) |
Employment Status by Educational Attainment in San Castle
According to labor force statistics for San Castle, 85.5% of individuals (1,605) out of the total population between 25 and 64 years of age (1,877) are in the labor force, with 4.8% or 77 of them being unemployed. The group with the highest labor force participation rate are those with the educational attainment of high school diploma, with 93.4% or 484 individuals in the labor force. Within the labor force, individuals with less than high school education have the highest percentage of unemployment, with 14.7% or 62 of them being unemployed.
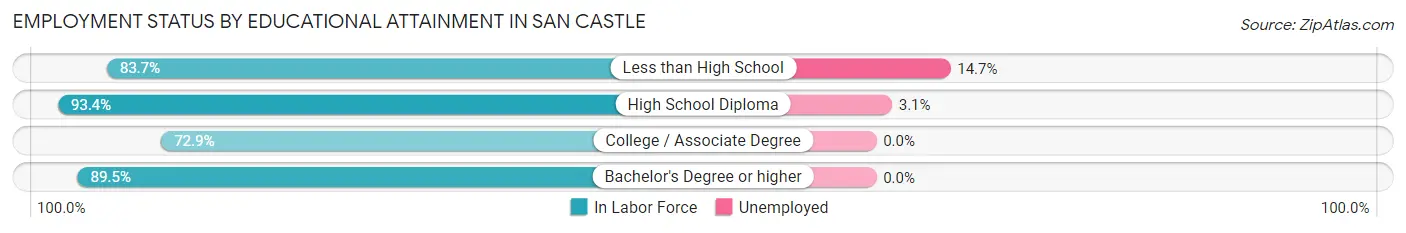
| Educational Attainment | In Labor Force | Unemployed |
| Less than High School | 421 (83.7%) | 74 (14.7%) |
| High School Diploma | 484 (93.4%) | 16 (3.1%) |
| College / Associate Degree | 290 (72.9%) | 0 (0.0%) |
| Bachelor's Degree or higher | 410 (89.5%) | 0 (0.0%) |
| Total | 1,605 (85.5%) | 90 (4.8%) |
Employment Occupations by Sex in San Castle
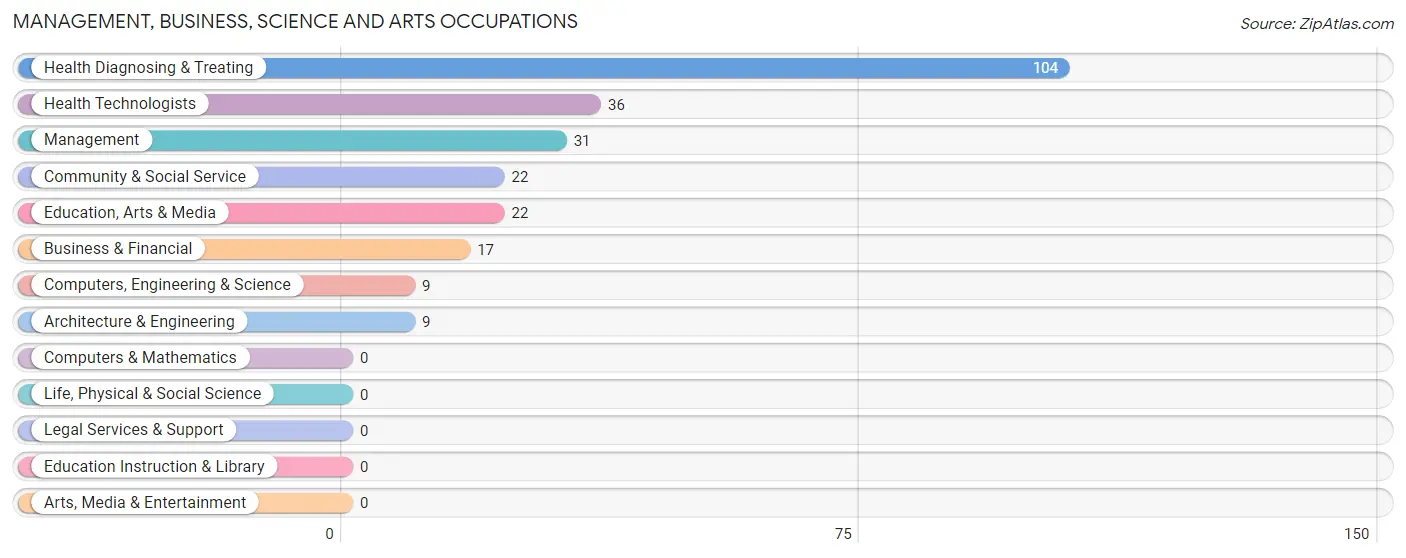
Management, Business, Science and Arts Occupations
The most common Management, Business, Science and Arts occupations in San Castle are Health Diagnosing & Treating (104 | 6.1%), Health Technologists (36 | 2.1%), Management (31 | 1.8%), Community & Social Service (22 | 1.3%), and Education, Arts & Media (22 | 1.3%).
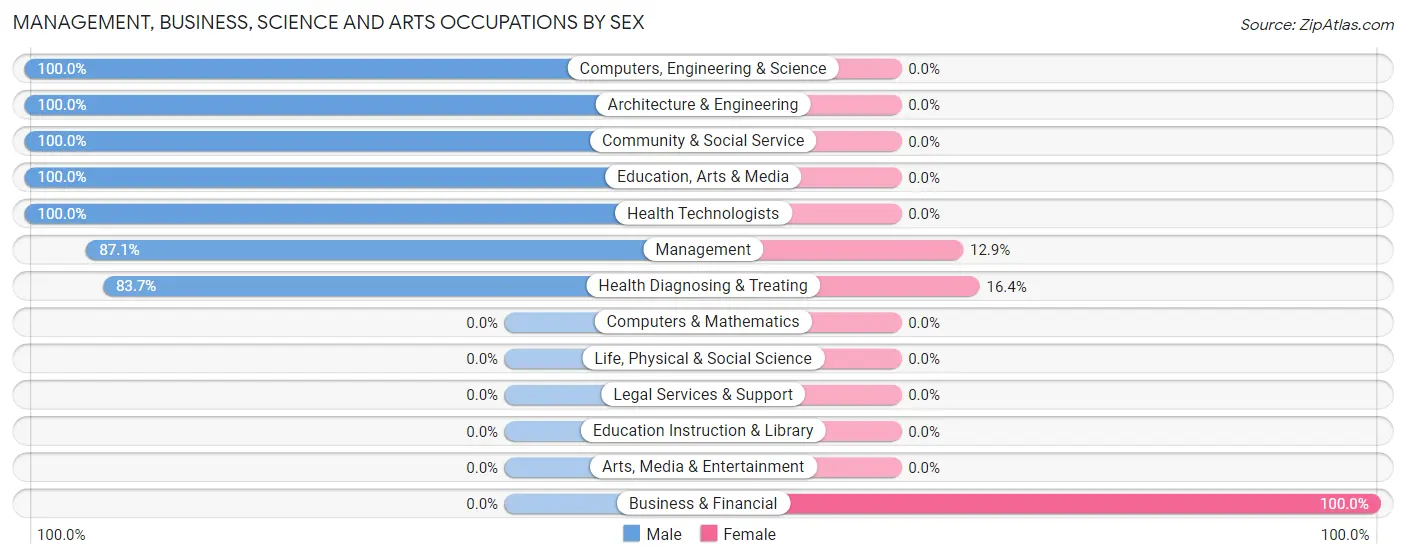
Management, Business, Science and Arts Occupations by Sex
Within the Management, Business, Science and Arts occupations in San Castle, the most male-oriented occupations are Computers, Engineering & Science (100.0%), Architecture & Engineering (100.0%), and Community & Social Service (100.0%), while the most female-oriented occupations are Business & Financial (100.0%), Health Diagnosing & Treating (16.4%), and Management (12.9%).
| Occupation | Male | Female |
| Management | 27 (87.1%) | 4 (12.9%) |
| Business & Financial | 0 (0.0%) | 17 (100.0%) |
| Computers, Engineering & Science | 9 (100.0%) | 0 (0.0%) |
| Computers & Mathematics | 0 (0.0%) | 0 (0.0%) |
| Architecture & Engineering | 9 (100.0%) | 0 (0.0%) |
| Life, Physical & Social Science | 0 (0.0%) | 0 (0.0%) |
| Community & Social Service | 22 (100.0%) | 0 (0.0%) |
| Education, Arts & Media | 22 (100.0%) | 0 (0.0%) |
| Legal Services & Support | 0 (0.0%) | 0 (0.0%) |
| Education Instruction & Library | 0 (0.0%) | 0 (0.0%) |
| Arts, Media & Entertainment | 0 (0.0%) | 0 (0.0%) |
| Health Diagnosing & Treating | 87 (83.7%) | 17 (16.4%) |
| Health Technologists | 36 (100.0%) | 0 (0.0%) |
| Total (Category) | 145 (79.2%) | 38 (20.8%) |
| Total (Overall) | 1,069 (63.1%) | 624 (36.9%) |
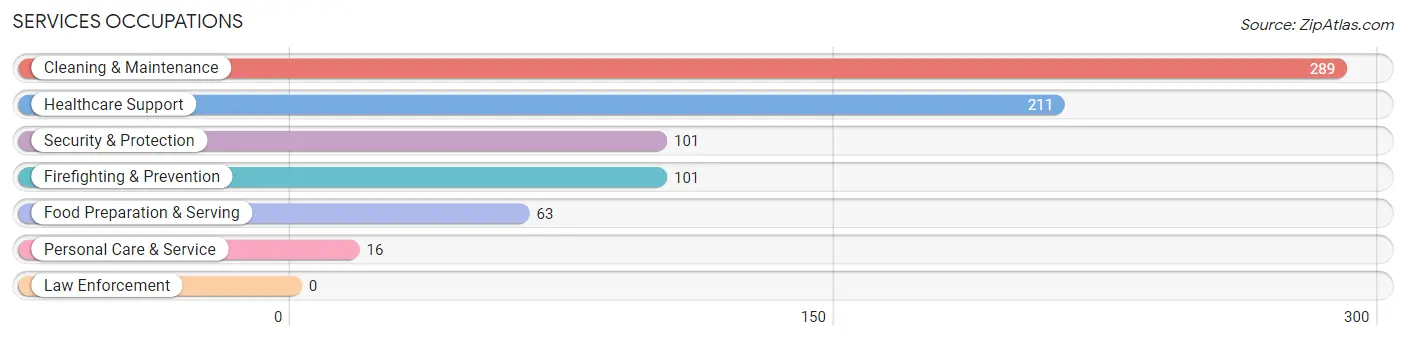
Services Occupations
The most common Services occupations in San Castle are Cleaning & Maintenance (289 | 17.1%), Healthcare Support (211 | 12.5%), Security & Protection (101 | 6.0%), Firefighting & Prevention (101 | 6.0%), and Food Preparation & Serving (63 | 3.7%).
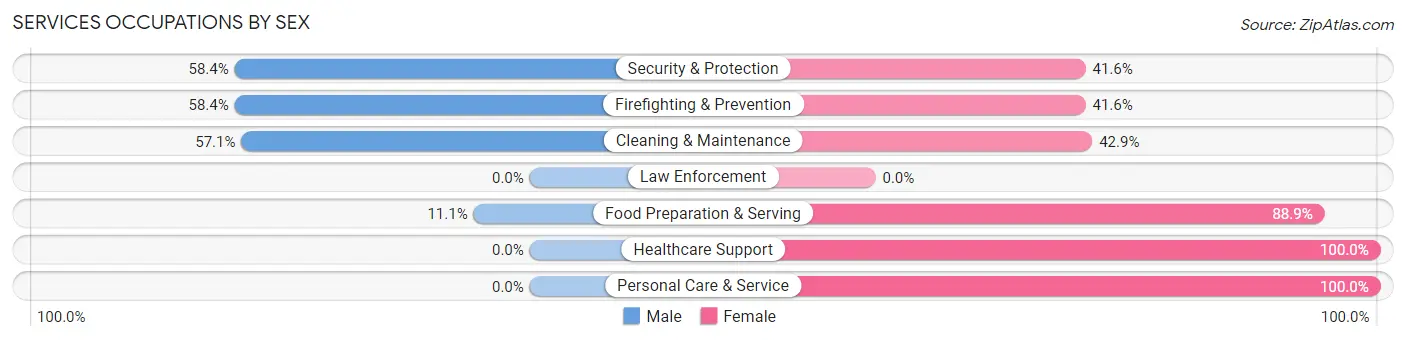
Services Occupations by Sex
Within the Services occupations in San Castle, the most male-oriented occupations are Security & Protection (58.4%), Firefighting & Prevention (58.4%), and Cleaning & Maintenance (57.1%), while the most female-oriented occupations are Healthcare Support (100.0%), Personal Care & Service (100.0%), and Food Preparation & Serving (88.9%).
| Occupation | Male | Female |
| Healthcare Support | 0 (0.0%) | 211 (100.0%) |
| Security & Protection | 59 (58.4%) | 42 (41.6%) |
| Firefighting & Prevention | 59 (58.4%) | 42 (41.6%) |
| Law Enforcement | 0 (0.0%) | 0 (0.0%) |
| Food Preparation & Serving | 7 (11.1%) | 56 (88.9%) |
| Cleaning & Maintenance | 165 (57.1%) | 124 (42.9%) |
| Personal Care & Service | 0 (0.0%) | 16 (100.0%) |
| Total (Category) | 231 (34.0%) | 449 (66.0%) |
| Total (Overall) | 1,069 (63.1%) | 624 (36.9%) |
Sales and Office Occupations
The most common Sales and Office occupations in San Castle are Office & Administration (258 | 15.2%), and Sales & Related (100 | 5.9%).
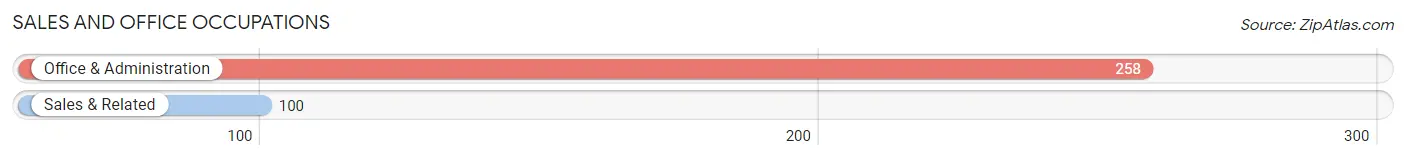
Sales and Office Occupations by Sex
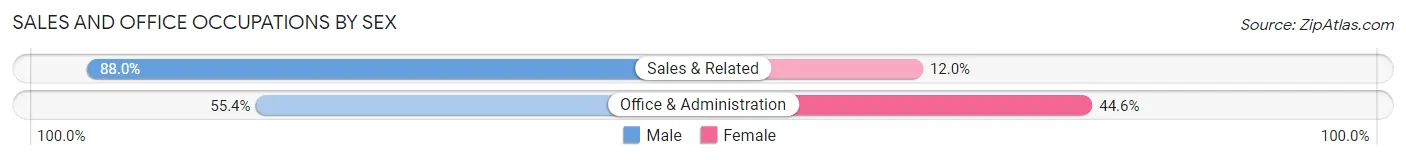
| Occupation | Male | Female |
| Sales & Related | 88 (88.0%) | 12 (12.0%) |
| Office & Administration | 143 (55.4%) | 115 (44.6%) |
| Total (Category) | 231 (64.5%) | 127 (35.5%) |
| Total (Overall) | 1,069 (63.1%) | 624 (36.9%) |
Natural Resources, Construction and Maintenance Occupations
The most common Natural Resources, Construction and Maintenance occupations in San Castle are Installation, Maintenance & Repair (218 | 12.9%), and Construction & Extraction (57 | 3.4%).
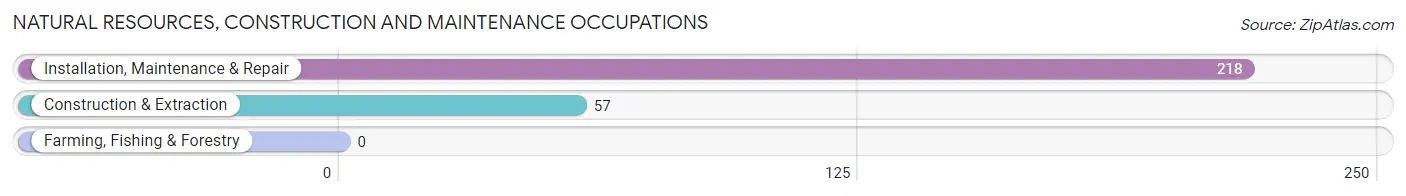
Natural Resources, Construction and Maintenance Occupations by Sex
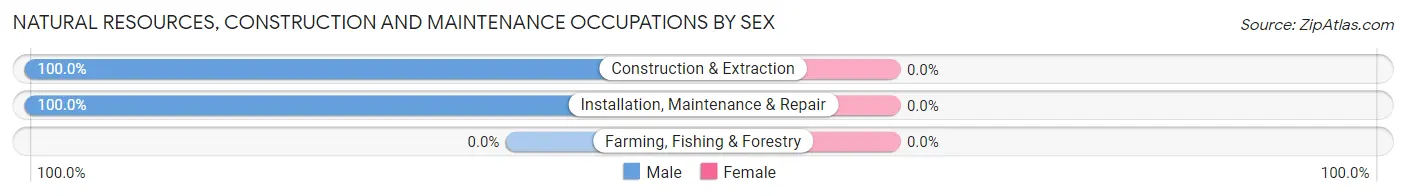
| Occupation | Male | Female |
| Farming, Fishing & Forestry | 0 (0.0%) | 0 (0.0%) |
| Construction & Extraction | 57 (100.0%) | 0 (0.0%) |
| Installation, Maintenance & Repair | 218 (100.0%) | 0 (0.0%) |
| Total (Category) | 275 (100.0%) | 0 (0.0%) |
| Total (Overall) | 1,069 (63.1%) | 624 (36.9%) |
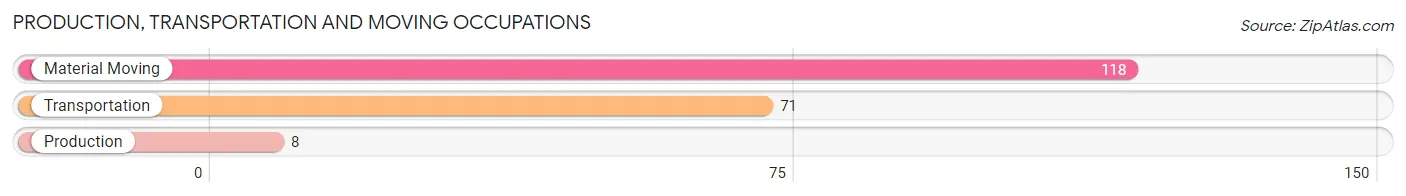
Production, Transportation and Moving Occupations
The most common Production, Transportation and Moving occupations in San Castle are Material Moving (118 | 7.0%), Transportation (71 | 4.2%), and Production (8 | 0.5%).
Production, Transportation and Moving Occupations by Sex
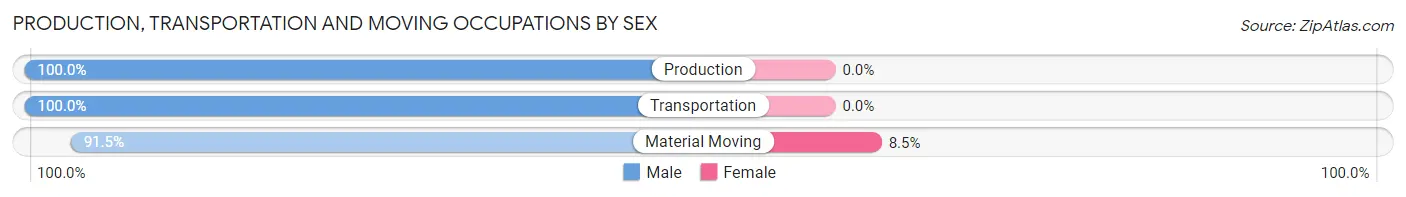
| Occupation | Male | Female |
| Production | 8 (100.0%) | 0 (0.0%) |
| Transportation | 71 (100.0%) | 0 (0.0%) |
| Material Moving | 108 (91.5%) | 10 (8.5%) |
| Total (Category) | 187 (94.9%) | 10 (5.1%) |
| Total (Overall) | 1,069 (63.1%) | 624 (36.9%) |
Employment Industries by Sex in San Castle
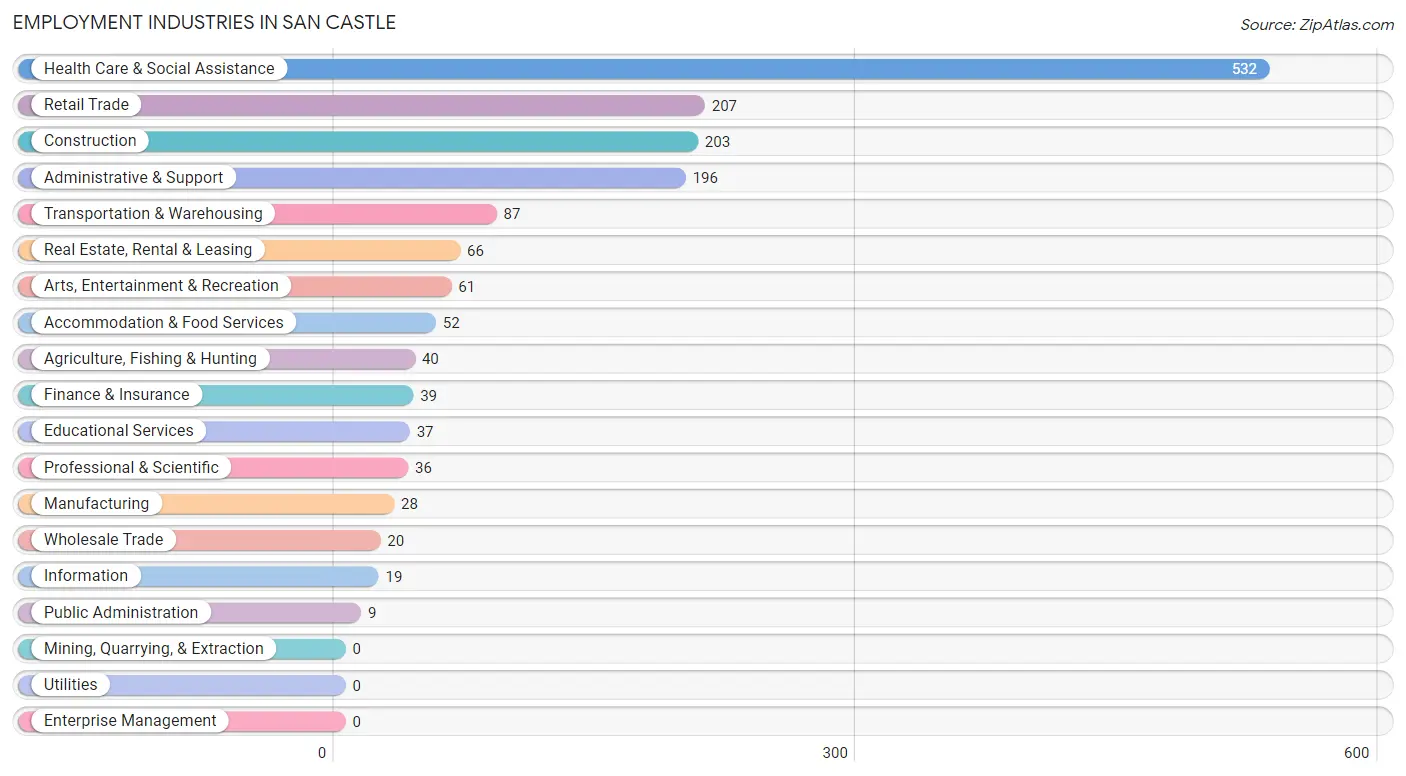
Employment Industries in San Castle
The major employment industries in San Castle include Health Care & Social Assistance (532 | 31.4%), Retail Trade (207 | 12.2%), Construction (203 | 12.0%), Administrative & Support (196 | 11.6%), and Transportation & Warehousing (87 | 5.1%).
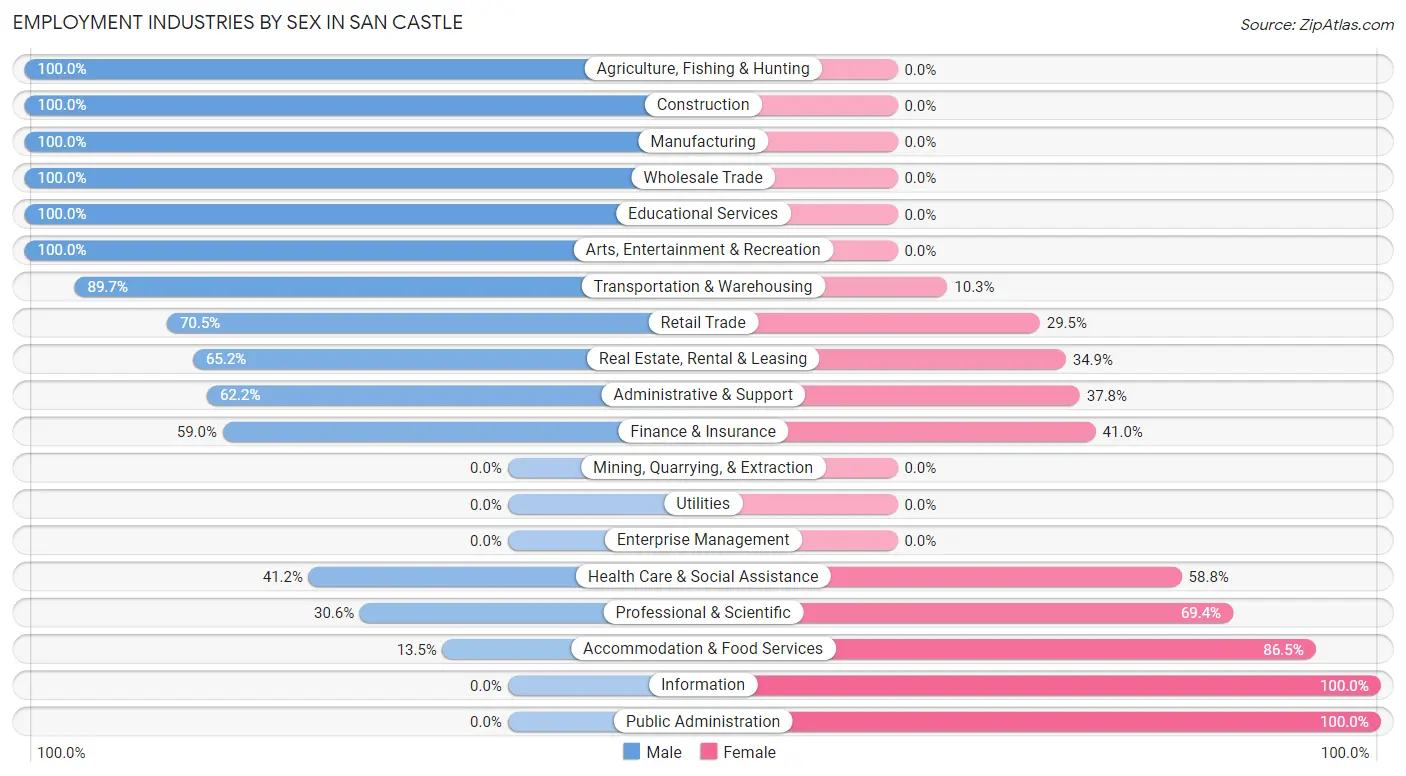
Employment Industries by Sex in San Castle
The San Castle industries that see more men than women are Agriculture, Fishing & Hunting (100.0%), Construction (100.0%), and Manufacturing (100.0%), whereas the industries that tend to have a higher number of women are Information (100.0%), Public Administration (100.0%), and Accommodation & Food Services (86.5%).
| Industry | Male | Female |
| Agriculture, Fishing & Hunting | 40 (100.0%) | 0 (0.0%) |
| Mining, Quarrying, & Extraction | 0 (0.0%) | 0 (0.0%) |
| Construction | 203 (100.0%) | 0 (0.0%) |
| Manufacturing | 28 (100.0%) | 0 (0.0%) |
| Wholesale Trade | 20 (100.0%) | 0 (0.0%) |
| Retail Trade | 146 (70.5%) | 61 (29.5%) |
| Transportation & Warehousing | 78 (89.7%) | 9 (10.3%) |
| Utilities | 0 (0.0%) | 0 (0.0%) |
| Information | 0 (0.0%) | 19 (100.0%) |
| Finance & Insurance | 23 (59.0%) | 16 (41.0%) |
| Real Estate, Rental & Leasing | 43 (65.1%) | 23 (34.8%) |
| Professional & Scientific | 11 (30.6%) | 25 (69.4%) |
| Enterprise Management | 0 (0.0%) | 0 (0.0%) |
| Administrative & Support | 122 (62.2%) | 74 (37.8%) |
| Educational Services | 37 (100.0%) | 0 (0.0%) |
| Health Care & Social Assistance | 219 (41.2%) | 313 (58.8%) |
| Arts, Entertainment & Recreation | 61 (100.0%) | 0 (0.0%) |
| Accommodation & Food Services | 7 (13.5%) | 45 (86.5%) |
| Public Administration | 0 (0.0%) | 9 (100.0%) |
| Total | 1,069 (63.1%) | 624 (36.9%) |
Education in San Castle
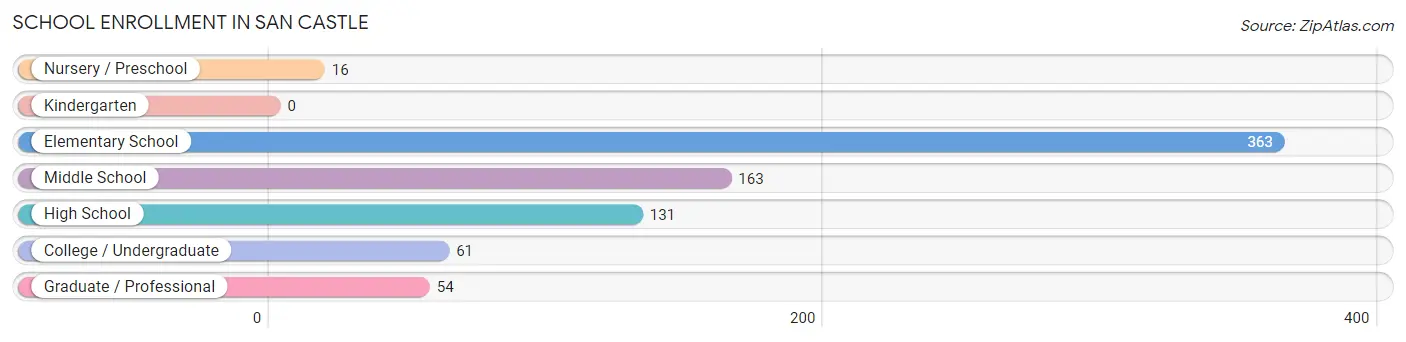
School Enrollment in San Castle
The most common levels of schooling among the 788 students in San Castle are elementary school (363 | 46.1%), middle school (163 | 20.7%), and high school (131 | 16.6%).
| School Level | # Students | % Students |
| Nursery / Preschool | 16 | 2.0% |
| Kindergarten | 0 | 0.0% |
| Elementary School | 363 | 46.1% |
| Middle School | 163 | 20.7% |
| High School | 131 | 16.6% |
| College / Undergraduate | 61 | 7.7% |
| Graduate / Professional | 54 | 6.9% |
| Total | 788 | 100.0% |
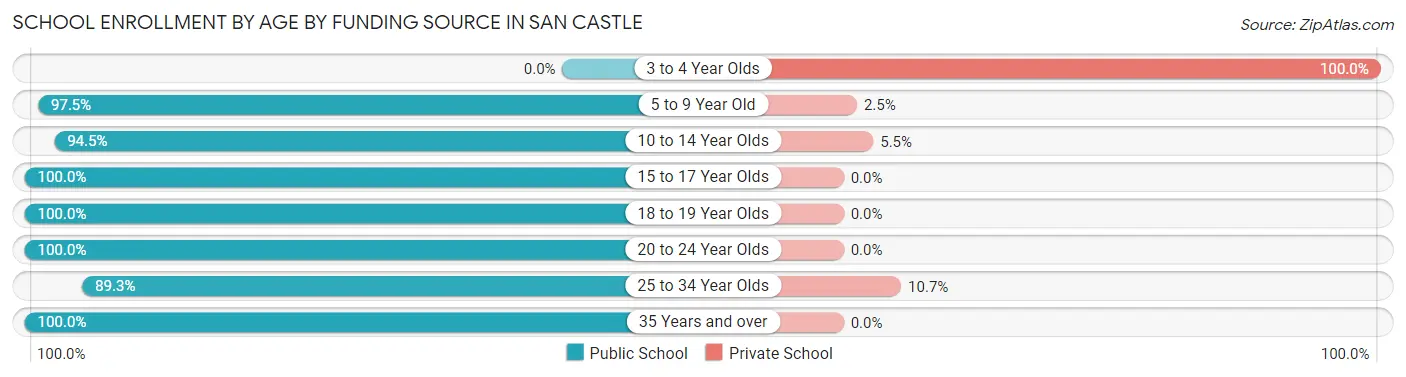
School Enrollment by Age by Funding Source in San Castle
Out of a total of 788 students who are enrolled in schools in San Castle, 43 (5.5%) attend a private institution, while the remaining 745 (94.5%) are enrolled in public schools. The age group of 3 to 4 year olds has the highest likelihood of being enrolled in private schools, with 16 (100.0% in the age bracket) enrolled. Conversely, the age group of 15 to 17 year olds has the lowest likelihood of being enrolled in a private school, with 93 (100.0% in the age bracket) attending a public institution.
| Age Bracket | Public School | Private School |
| 3 to 4 Year Olds | 0 (0.0%) | 16 (100.0%) |
| 5 to 9 Year Old | 354 (97.5%) | 9 (2.5%) |
| 10 to 14 Year Olds | 154 (94.5%) | 9 (5.5%) |
| 15 to 17 Year Olds | 93 (100.0%) | 0 (0.0%) |
| 18 to 19 Year Olds | 15 (100.0%) | 0 (0.0%) |
| 20 to 24 Year Olds | 45 (100.0%) | 0 (0.0%) |
| 25 to 34 Year Olds | 75 (89.3%) | 9 (10.7%) |
| 35 Years and over | 9 (100.0%) | 0 (0.0%) |
| Total | 745 (94.5%) | 43 (5.5%) |
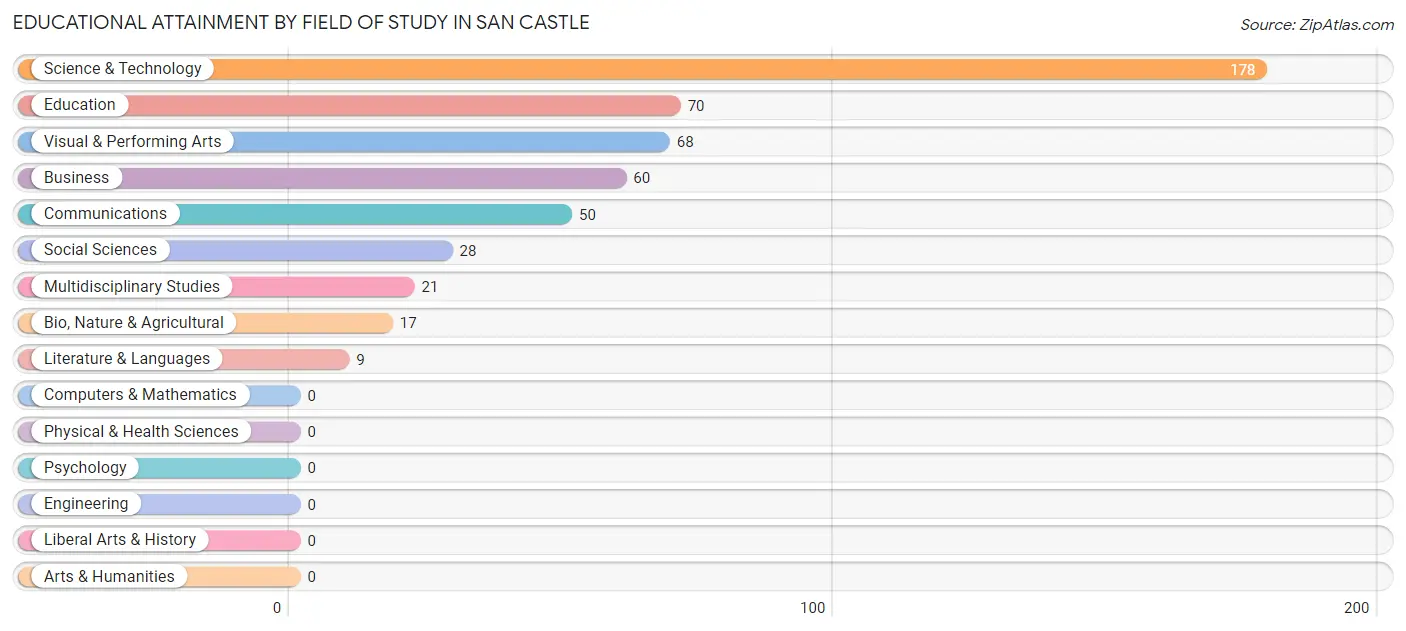
Educational Attainment by Field of Study in San Castle
Science & technology (178 | 35.5%), education (70 | 14.0%), visual & performing arts (68 | 13.6%), business (60 | 12.0%), and communications (50 | 10.0%) are the most common fields of study among 501 individuals in San Castle who have obtained a bachelor's degree or higher.
| Field of Study | # Graduates | % Graduates |
| Computers & Mathematics | 0 | 0.0% |
| Bio, Nature & Agricultural | 17 | 3.4% |
| Physical & Health Sciences | 0 | 0.0% |
| Psychology | 0 | 0.0% |
| Social Sciences | 28 | 5.6% |
| Engineering | 0 | 0.0% |
| Multidisciplinary Studies | 21 | 4.2% |
| Science & Technology | 178 | 35.5% |
| Business | 60 | 12.0% |
| Education | 70 | 14.0% |
| Literature & Languages | 9 | 1.8% |
| Liberal Arts & History | 0 | 0.0% |
| Visual & Performing Arts | 68 | 13.6% |
| Communications | 50 | 10.0% |
| Arts & Humanities | 0 | 0.0% |
| Total | 501 | 100.0% |
Transportation & Commute in San Castle
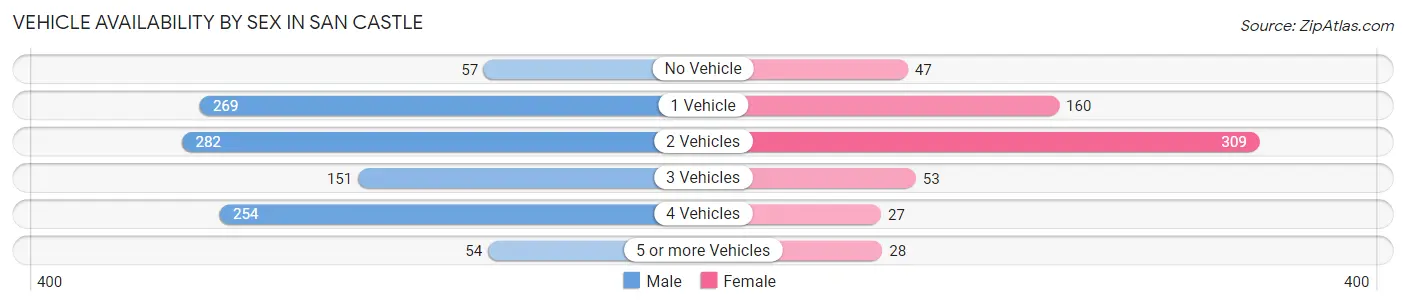
Vehicle Availability by Sex in San Castle
The most prevalent vehicle ownership categories in San Castle are males with 2 vehicles (282, accounting for 26.4%) and females with 2 vehicles (309, making up 45.2%).
| Vehicles Available | Male | Female |
| No Vehicle | 57 (5.3%) | 47 (7.5%) |
| 1 Vehicle | 269 (25.2%) | 160 (25.6%) |
| 2 Vehicles | 282 (26.4%) | 309 (49.5%) |
| 3 Vehicles | 151 (14.1%) | 53 (8.5%) |
| 4 Vehicles | 254 (23.8%) | 27 (4.3%) |
| 5 or more Vehicles | 54 (5.1%) | 28 (4.5%) |
| Total | 1,067 (100.0%) | 624 (100.0%) |
Commute Time in San Castle
The most frequently occuring commute durations in San Castle are 20 to 24 minutes (429 commuters, 28.1%), 30 to 34 minutes (184 commuters, 12.0%), and 40 to 44 minutes (158 commuters, 10.3%).
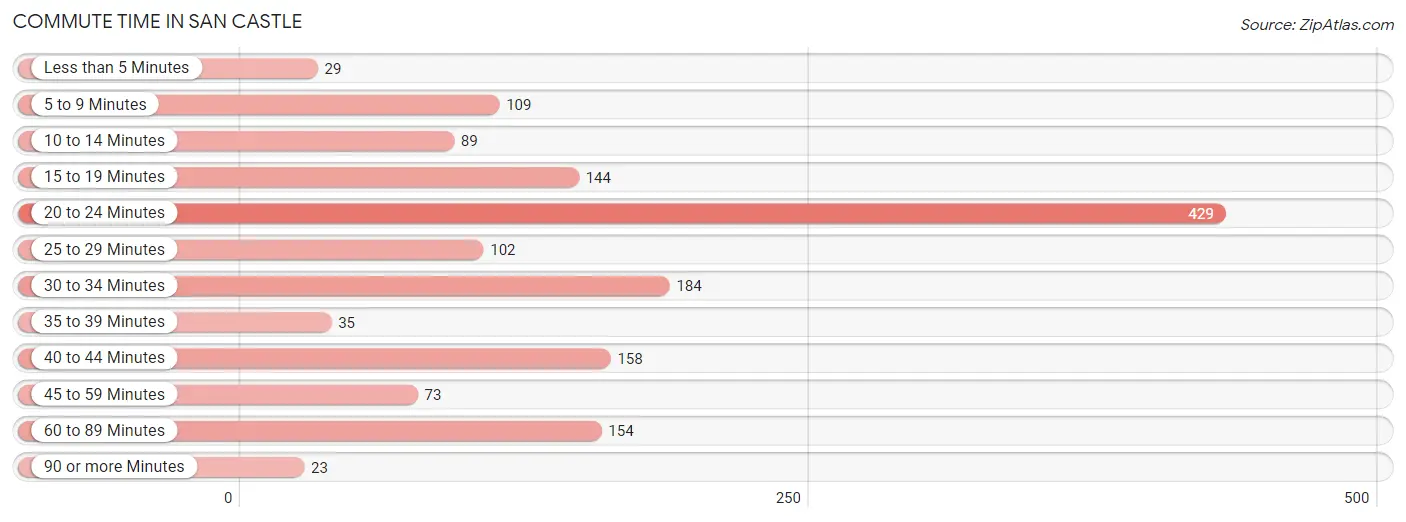
| Commute Time | # Commuters | % Commuters |
| Less than 5 Minutes | 29 | 1.9% |
| 5 to 9 Minutes | 109 | 7.1% |
| 10 to 14 Minutes | 89 | 5.8% |
| 15 to 19 Minutes | 144 | 9.4% |
| 20 to 24 Minutes | 429 | 28.1% |
| 25 to 29 Minutes | 102 | 6.7% |
| 30 to 34 Minutes | 184 | 12.0% |
| 35 to 39 Minutes | 35 | 2.3% |
| 40 to 44 Minutes | 158 | 10.3% |
| 45 to 59 Minutes | 73 | 4.8% |
| 60 to 89 Minutes | 154 | 10.1% |
| 90 or more Minutes | 23 | 1.5% |
Commute Time by Sex in San Castle
The most common commute times in San Castle are 20 to 24 minutes (188 commuters, 19.6%) for males and 20 to 24 minutes (241 commuters, 42.4%) for females.
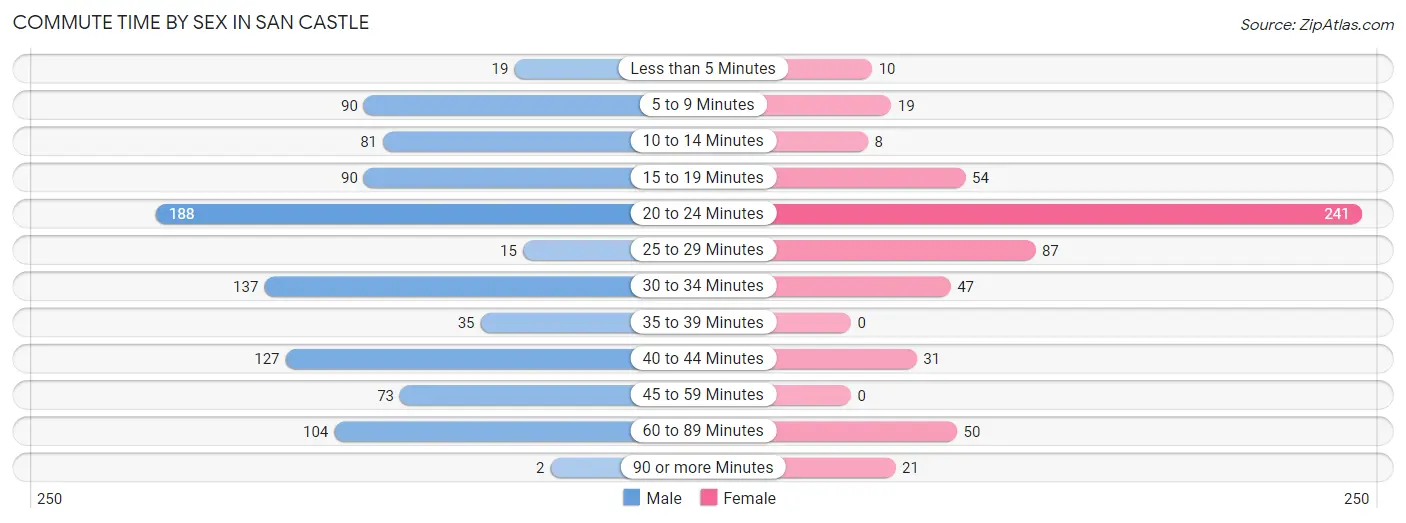
| Commute Time | Male | Female |
| Less than 5 Minutes | 19 (2.0%) | 10 (1.8%) |
| 5 to 9 Minutes | 90 (9.4%) | 19 (3.4%) |
| 10 to 14 Minutes | 81 (8.4%) | 8 (1.4%) |
| 15 to 19 Minutes | 90 (9.4%) | 54 (9.5%) |
| 20 to 24 Minutes | 188 (19.6%) | 241 (42.4%) |
| 25 to 29 Minutes | 15 (1.6%) | 87 (15.3%) |
| 30 to 34 Minutes | 137 (14.3%) | 47 (8.3%) |
| 35 to 39 Minutes | 35 (3.6%) | 0 (0.0%) |
| 40 to 44 Minutes | 127 (13.2%) | 31 (5.5%) |
| 45 to 59 Minutes | 73 (7.6%) | 0 (0.0%) |
| 60 to 89 Minutes | 104 (10.8%) | 50 (8.8%) |
| 90 or more Minutes | 2 (0.2%) | 21 (3.7%) |
Time of Departure to Work by Sex in San Castle
The most frequent times of departure to work in San Castle are 5:30 AM to 5:59 AM (280, 29.1%) for males and 7:30 AM to 7:59 AM (132, 23.2%) for females.
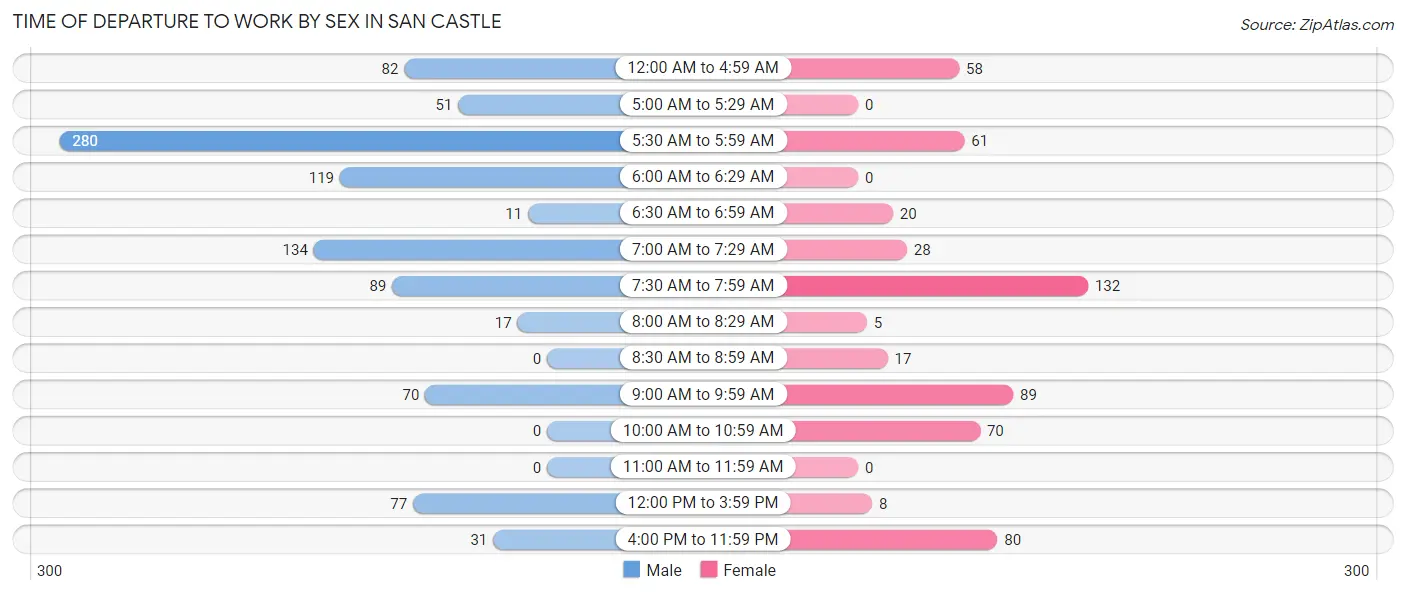
| Time of Departure | Male | Female |
| 12:00 AM to 4:59 AM | 82 (8.5%) | 58 (10.2%) |
| 5:00 AM to 5:29 AM | 51 (5.3%) | 0 (0.0%) |
| 5:30 AM to 5:59 AM | 280 (29.1%) | 61 (10.7%) |
| 6:00 AM to 6:29 AM | 119 (12.4%) | 0 (0.0%) |
| 6:30 AM to 6:59 AM | 11 (1.1%) | 20 (3.5%) |
| 7:00 AM to 7:29 AM | 134 (13.9%) | 28 (4.9%) |
| 7:30 AM to 7:59 AM | 89 (9.3%) | 132 (23.2%) |
| 8:00 AM to 8:29 AM | 17 (1.8%) | 5 (0.9%) |
| 8:30 AM to 8:59 AM | 0 (0.0%) | 17 (3.0%) |
| 9:00 AM to 9:59 AM | 70 (7.3%) | 89 (15.7%) |
| 10:00 AM to 10:59 AM | 0 (0.0%) | 70 (12.3%) |
| 11:00 AM to 11:59 AM | 0 (0.0%) | 0 (0.0%) |
| 12:00 PM to 3:59 PM | 77 (8.0%) | 8 (1.4%) |
| 4:00 PM to 11:59 PM | 31 (3.2%) | 80 (14.1%) |
| Total | 961 (100.0%) | 568 (100.0%) |
Housing Occupancy in San Castle
Occupancy by Ownership in San Castle
Of the total 971 dwellings in San Castle, owner-occupied units account for 466 (48.0%), while renter-occupied units make up 505 (52.0%).
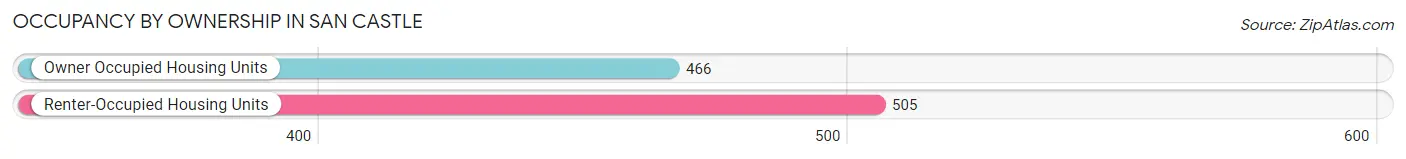
| Occupancy | # Housing Units | % Housing Units |
| Owner Occupied Housing Units | 466 | 48.0% |
| Renter-Occupied Housing Units | 505 | 52.0% |
| Total Occupied Housing Units | 971 | 100.0% |
Occupancy by Household Size in San Castle
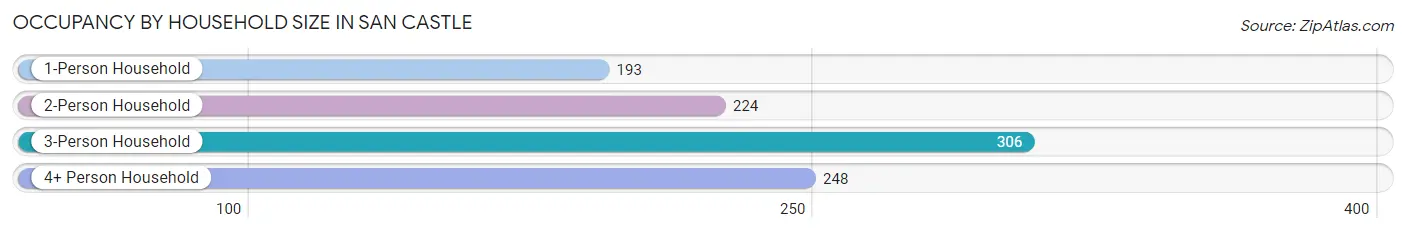
| Household Size | # Housing Units | % Housing Units |
| 1-Person Household | 193 | 19.9% |
| 2-Person Household | 224 | 23.1% |
| 3-Person Household | 306 | 31.5% |
| 4+ Person Household | 248 | 25.5% |
| Total Housing Units | 971 | 100.0% |
Occupancy by Ownership by Household Size in San Castle
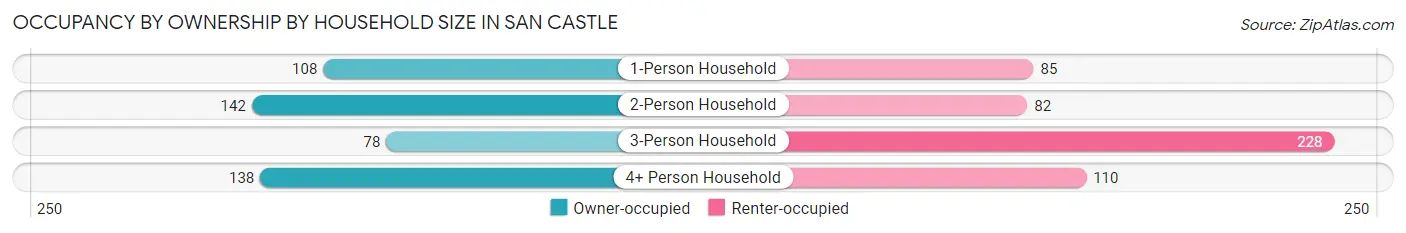
| Household Size | Owner-occupied | Renter-occupied |
| 1-Person Household | 108 (56.0%) | 85 (44.0%) |
| 2-Person Household | 142 (63.4%) | 82 (36.6%) |
| 3-Person Household | 78 (25.5%) | 228 (74.5%) |
| 4+ Person Household | 138 (55.6%) | 110 (44.4%) |
| Total Housing Units | 466 (48.0%) | 505 (52.0%) |
Occupancy by Educational Attainment in San Castle
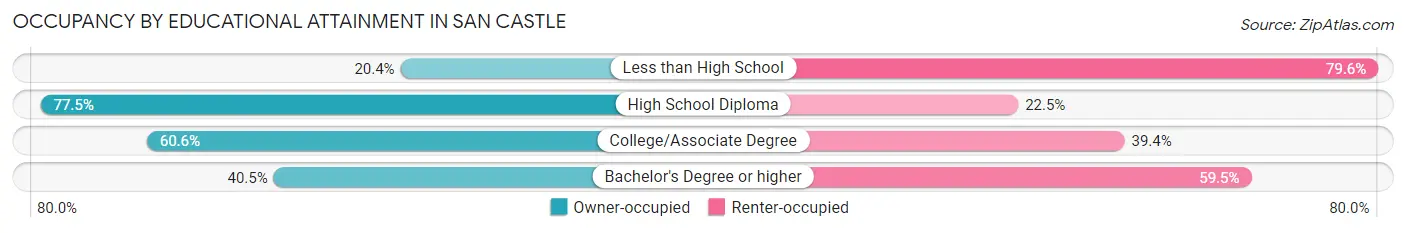
| Household Size | Owner-occupied | Renter-occupied |
| Less than High School | 63 (20.4%) | 246 (79.6%) |
| High School Diploma | 227 (77.5%) | 66 (22.5%) |
| College/Associate Degree | 80 (60.6%) | 52 (39.4%) |
| Bachelor's Degree or higher | 96 (40.5%) | 141 (59.5%) |
Occupancy by Age of Householder in San Castle
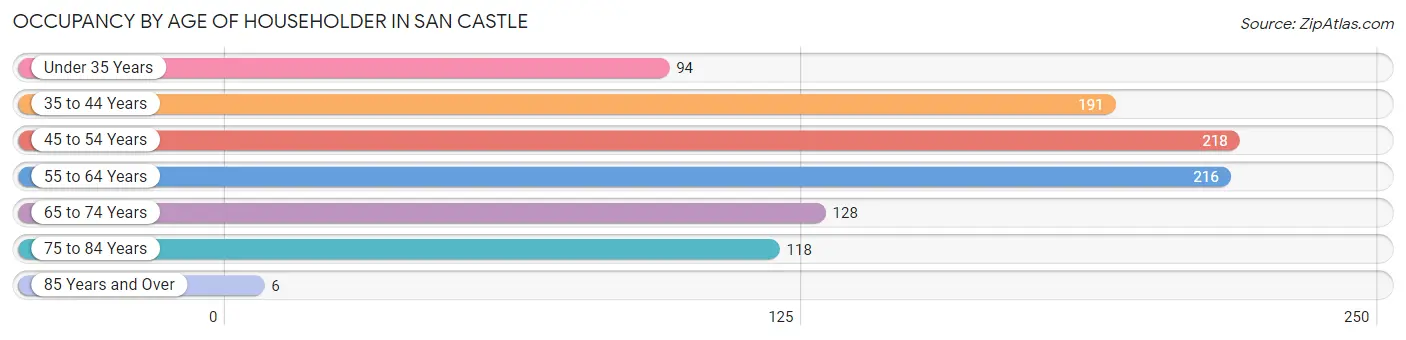
| Age Bracket | # Households | % Households |
| Under 35 Years | 94 | 9.7% |
| 35 to 44 Years | 191 | 19.7% |
| 45 to 54 Years | 218 | 22.5% |
| 55 to 64 Years | 216 | 22.3% |
| 65 to 74 Years | 128 | 13.2% |
| 75 to 84 Years | 118 | 12.1% |
| 85 Years and Over | 6 | 0.6% |
| Total | 971 | 100.0% |
Housing Finances in San Castle
Median Income by Occupancy in San Castle
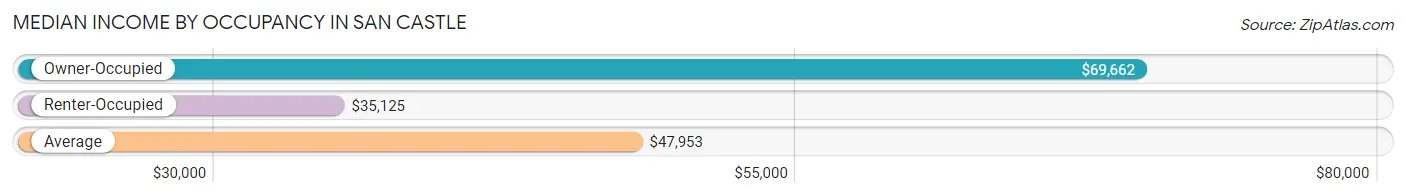
| Occupancy Type | # Households | Median Income |
| Owner-Occupied | 466 (48.0%) | $69,662 |
| Renter-Occupied | 505 (52.0%) | $35,125 |
| Average | 971 (100.0%) | $47,953 |
Occupancy by Householder Income Bracket in San Castle
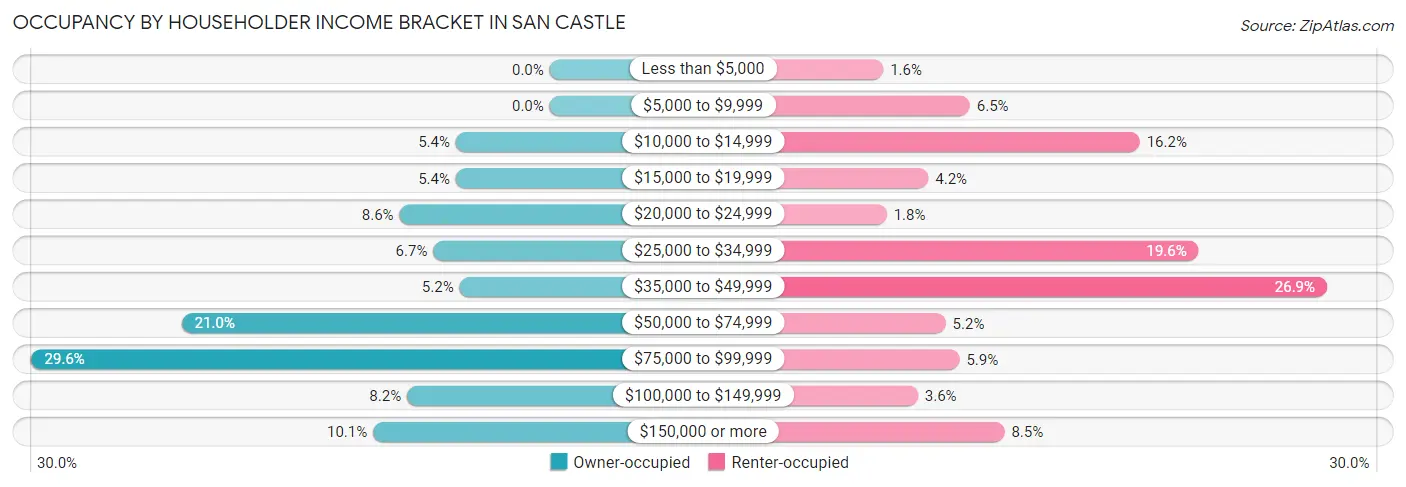
| Income Bracket | Owner-occupied | Renter-occupied |
| Less than $5,000 | 0 (0.0%) | 8 (1.6%) |
| $5,000 to $9,999 | 0 (0.0%) | 33 (6.5%) |
| $10,000 to $14,999 | 25 (5.4%) | 82 (16.2%) |
| $15,000 to $19,999 | 25 (5.4%) | 21 (4.2%) |
| $20,000 to $24,999 | 40 (8.6%) | 9 (1.8%) |
| $25,000 to $34,999 | 31 (6.7%) | 99 (19.6%) |
| $35,000 to $49,999 | 24 (5.1%) | 136 (26.9%) |
| $50,000 to $74,999 | 98 (21.0%) | 26 (5.1%) |
| $75,000 to $99,999 | 138 (29.6%) | 30 (5.9%) |
| $100,000 to $149,999 | 38 (8.2%) | 18 (3.6%) |
| $150,000 or more | 47 (10.1%) | 43 (8.5%) |
| Total | 466 (100.0%) | 505 (100.0%) |
Monthly Housing Cost Tiers in San Castle
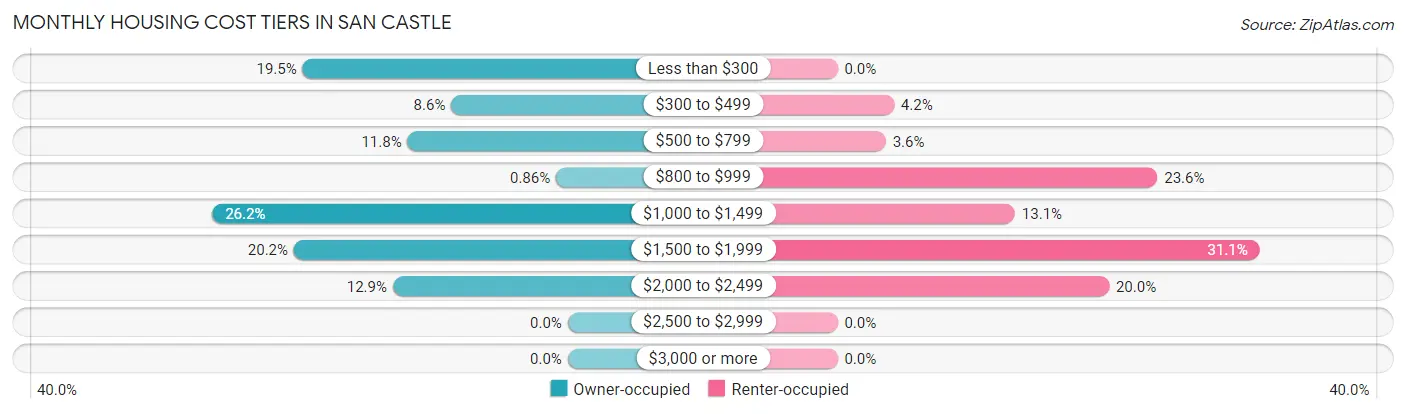
| Monthly Cost | Owner-occupied | Renter-occupied |
| Less than $300 | 91 (19.5%) | 0 (0.0%) |
| $300 to $499 | 40 (8.6%) | 21 (4.2%) |
| $500 to $799 | 55 (11.8%) | 18 (3.6%) |
| $800 to $999 | 4 (0.9%) | 119 (23.6%) |
| $1,000 to $1,499 | 122 (26.2%) | 66 (13.1%) |
| $1,500 to $1,999 | 94 (20.2%) | 157 (31.1%) |
| $2,000 to $2,499 | 60 (12.9%) | 101 (20.0%) |
| $2,500 to $2,999 | 0 (0.0%) | 0 (0.0%) |
| $3,000 or more | 0 (0.0%) | 0 (0.0%) |
| Total | 466 (100.0%) | 505 (100.0%) |
Physical Housing Characteristics in San Castle
Housing Structures in San Castle
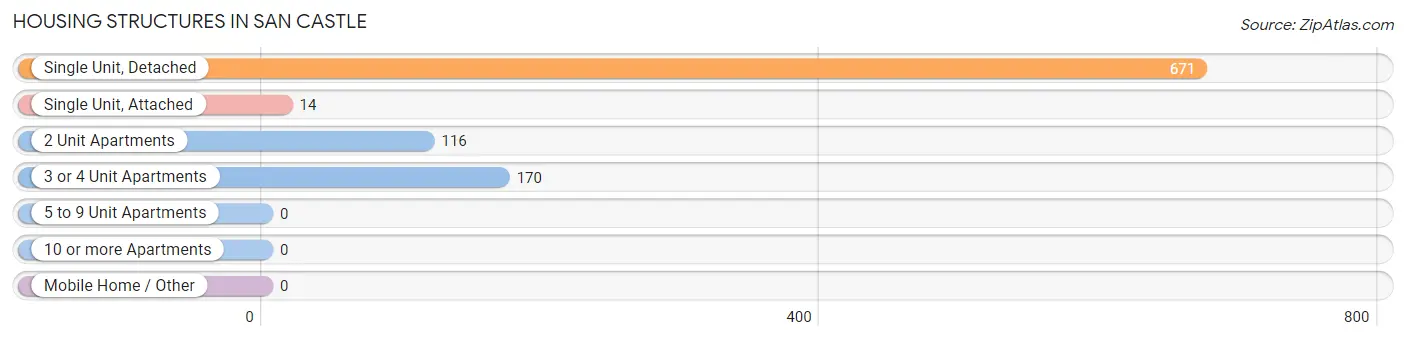
| Structure Type | # Housing Units | % Housing Units |
| Single Unit, Detached | 671 | 69.1% |
| Single Unit, Attached | 14 | 1.4% |
| 2 Unit Apartments | 116 | 11.9% |
| 3 or 4 Unit Apartments | 170 | 17.5% |
| 5 to 9 Unit Apartments | 0 | 0.0% |
| 10 or more Apartments | 0 | 0.0% |
| Mobile Home / Other | 0 | 0.0% |
| Total | 971 | 100.0% |
Housing Structures by Occupancy in San Castle
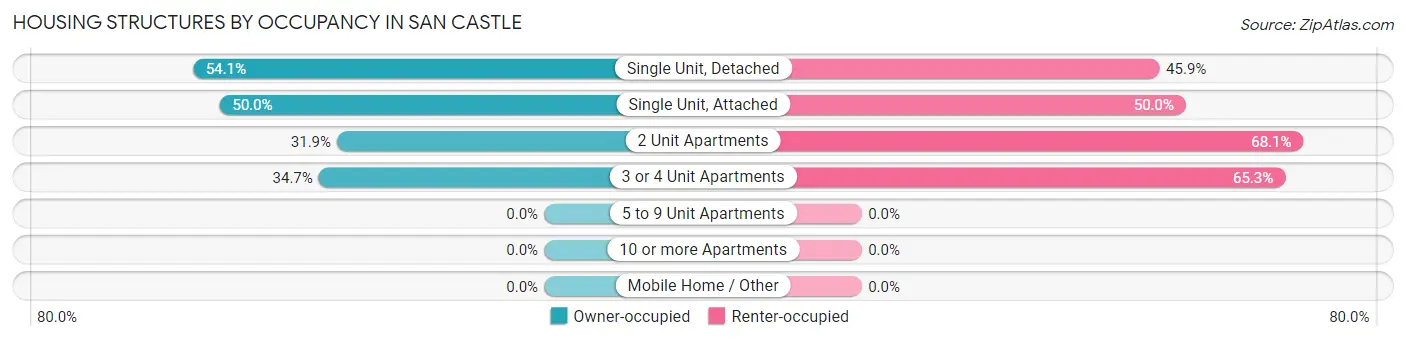
| Structure Type | Owner-occupied | Renter-occupied |
| Single Unit, Detached | 363 (54.1%) | 308 (45.9%) |
| Single Unit, Attached | 7 (50.0%) | 7 (50.0%) |
| 2 Unit Apartments | 37 (31.9%) | 79 (68.1%) |
| 3 or 4 Unit Apartments | 59 (34.7%) | 111 (65.3%) |
| 5 to 9 Unit Apartments | 0 (0.0%) | 0 (0.0%) |
| 10 or more Apartments | 0 (0.0%) | 0 (0.0%) |
| Mobile Home / Other | 0 (0.0%) | 0 (0.0%) |
| Total | 466 (48.0%) | 505 (52.0%) |
Housing Structures by Number of Rooms in San Castle
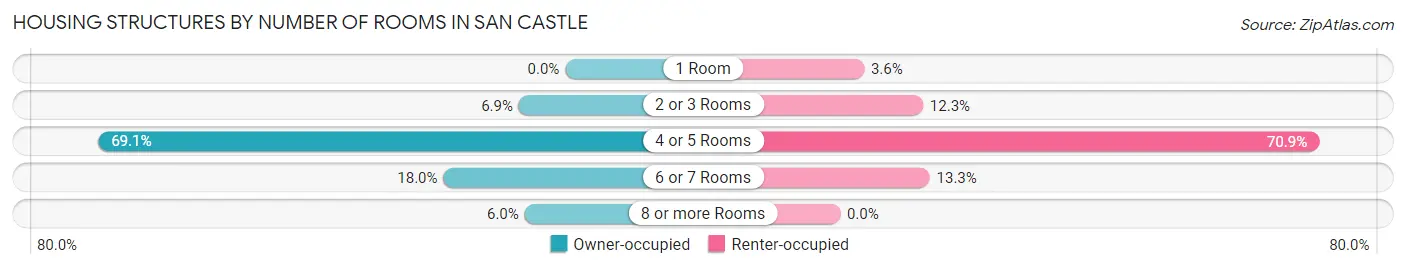
| Number of Rooms | Owner-occupied | Renter-occupied |
| 1 Room | 0 (0.0%) | 18 (3.6%) |
| 2 or 3 Rooms | 32 (6.9%) | 62 (12.3%) |
| 4 or 5 Rooms | 322 (69.1%) | 358 (70.9%) |
| 6 or 7 Rooms | 84 (18.0%) | 67 (13.3%) |
| 8 or more Rooms | 28 (6.0%) | 0 (0.0%) |
| Total | 466 (100.0%) | 505 (100.0%) |
Housing Structure by Heating Type in San Castle
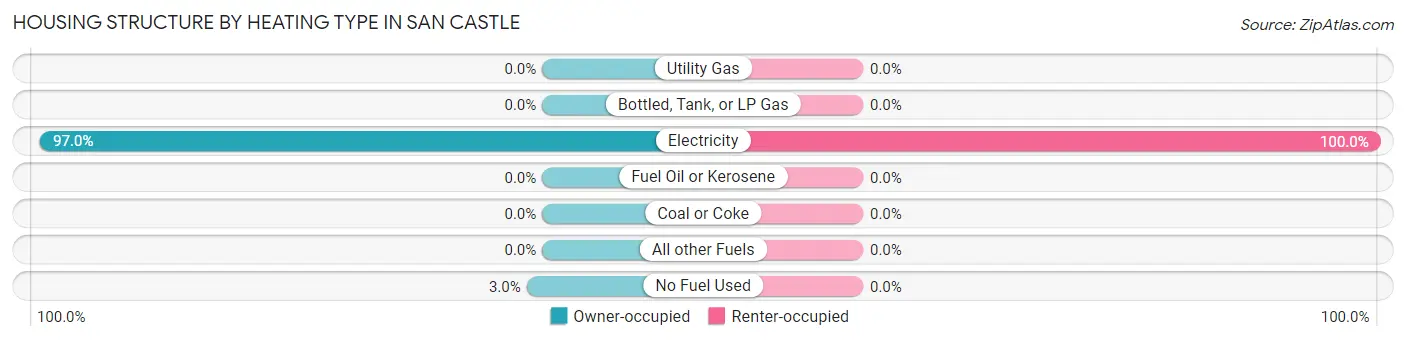
| Heating Type | Owner-occupied | Renter-occupied |
| Utility Gas | 0 (0.0%) | 0 (0.0%) |
| Bottled, Tank, or LP Gas | 0 (0.0%) | 0 (0.0%) |
| Electricity | 452 (97.0%) | 505 (100.0%) |
| Fuel Oil or Kerosene | 0 (0.0%) | 0 (0.0%) |
| Coal or Coke | 0 (0.0%) | 0 (0.0%) |
| All other Fuels | 0 (0.0%) | 0 (0.0%) |
| No Fuel Used | 14 (3.0%) | 0 (0.0%) |
| Total | 466 (100.0%) | 505 (100.0%) |
Household Vehicle Usage in San Castle
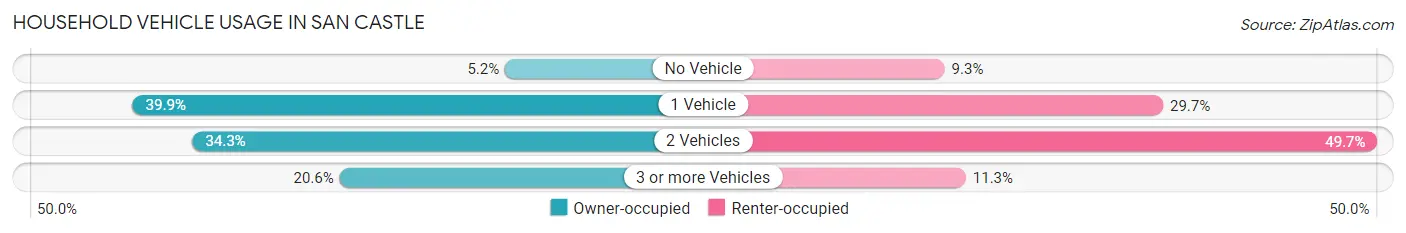
| Vehicles per Household | Owner-occupied | Renter-occupied |
| No Vehicle | 24 (5.1%) | 47 (9.3%) |
| 1 Vehicle | 186 (39.9%) | 150 (29.7%) |
| 2 Vehicles | 160 (34.3%) | 251 (49.7%) |
| 3 or more Vehicles | 96 (20.6%) | 57 (11.3%) |
| Total | 466 (100.0%) | 505 (100.0%) |
Real Estate & Mortgages in San Castle
Real Estate and Mortgage Overview in San Castle
| Characteristic | Without Mortgage | With Mortgage |
| Housing Units | 175 | 291 |
| Median Property Value | $145,300 | $212,100 |
| Median Household Income | $30,515 | $20 |
| Monthly Housing Costs | $296 | $0 |
| Real Estate Taxes | $1,095 | $25 |
Property Value by Mortgage Status in San Castle
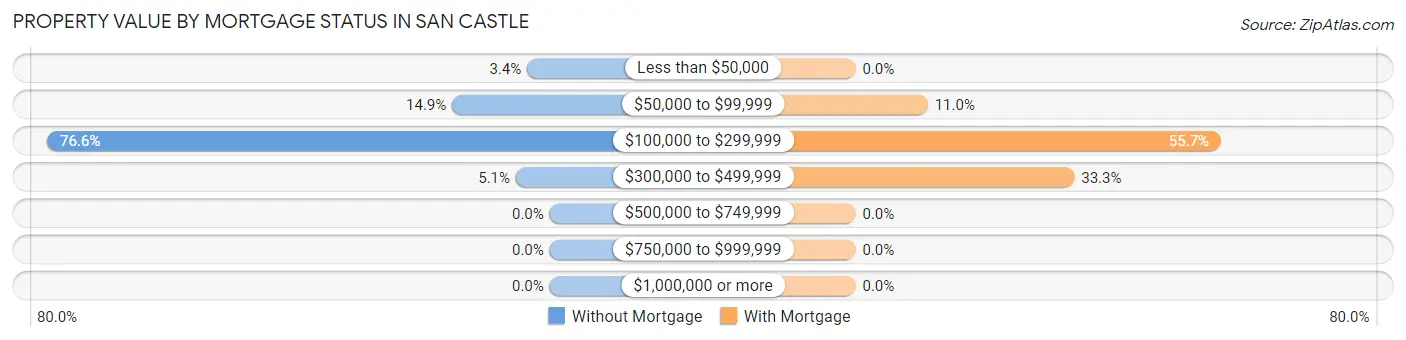
| Property Value | Without Mortgage | With Mortgage |
| Less than $50,000 | 6 (3.4%) | 0 (0.0%) |
| $50,000 to $99,999 | 26 (14.9%) | 32 (11.0%) |
| $100,000 to $299,999 | 134 (76.6%) | 162 (55.7%) |
| $300,000 to $499,999 | 9 (5.1%) | 97 (33.3%) |
| $500,000 to $749,999 | 0 (0.0%) | 0 (0.0%) |
| $750,000 to $999,999 | 0 (0.0%) | 0 (0.0%) |
| $1,000,000 or more | 0 (0.0%) | 0 (0.0%) |
| Total | 175 (100.0%) | 291 (100.0%) |
Household Income by Mortgage Status in San Castle
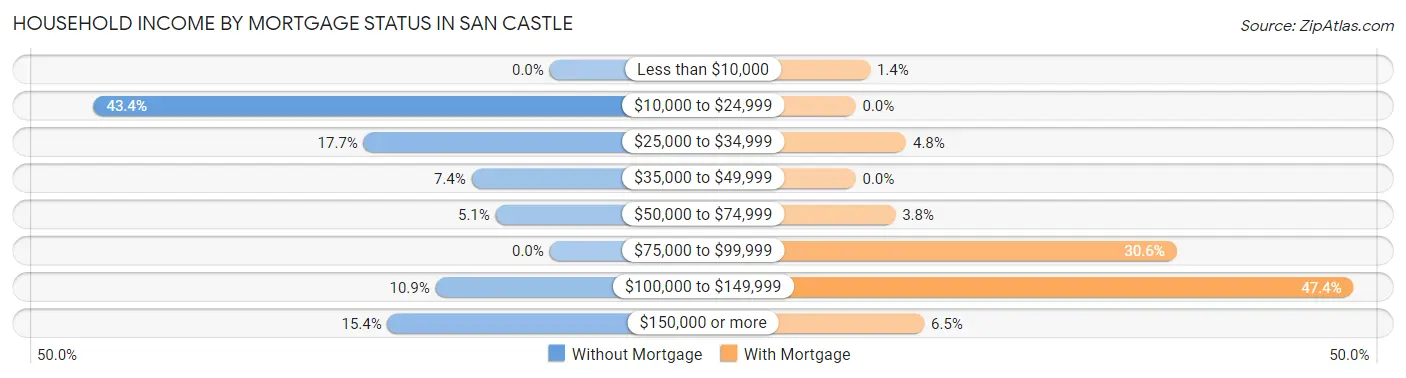
| Household Income | Without Mortgage | With Mortgage |
| Less than $10,000 | 0 (0.0%) | 4 (1.4%) |
| $10,000 to $24,999 | 76 (43.4%) | 0 (0.0%) |
| $25,000 to $34,999 | 31 (17.7%) | 14 (4.8%) |
| $35,000 to $49,999 | 13 (7.4%) | 0 (0.0%) |
| $50,000 to $74,999 | 9 (5.1%) | 11 (3.8%) |
| $75,000 to $99,999 | 0 (0.0%) | 89 (30.6%) |
| $100,000 to $149,999 | 19 (10.9%) | 138 (47.4%) |
| $150,000 or more | 27 (15.4%) | 19 (6.5%) |
| Total | 175 (100.0%) | 291 (100.0%) |
Property Value to Household Income Ratio in San Castle
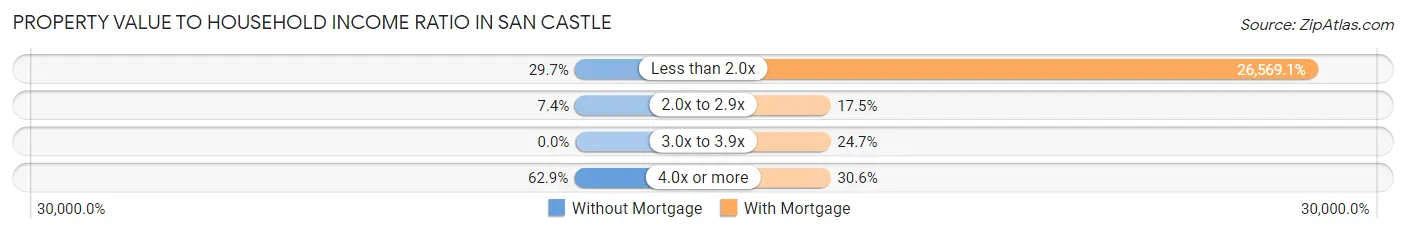
| Value-to-Income Ratio | Without Mortgage | With Mortgage |
| Less than 2.0x | 52 (29.7%) | 77,316 (26,569.1%) |
| 2.0x to 2.9x | 13 (7.4%) | 51 (17.5%) |
| 3.0x to 3.9x | 0 (0.0%) | 72 (24.7%) |
| 4.0x or more | 110 (62.9%) | 89 (30.6%) |
| Total | 175 (100.0%) | 291 (100.0%) |
Real Estate Taxes by Mortgage Status in San Castle
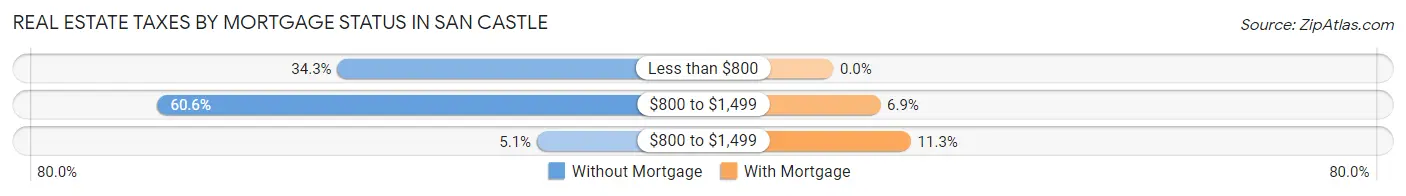
| Property Taxes | Without Mortgage | With Mortgage |
| Less than $800 | 60 (34.3%) | 0 (0.0%) |
| $800 to $1,499 | 106 (60.6%) | 20 (6.9%) |
| $800 to $1,499 | 9 (5.1%) | 33 (11.3%) |
| Total | 175 (100.0%) | 291 (100.0%) |
Health & Disability in San Castle
Health Insurance Coverage by Age in San Castle
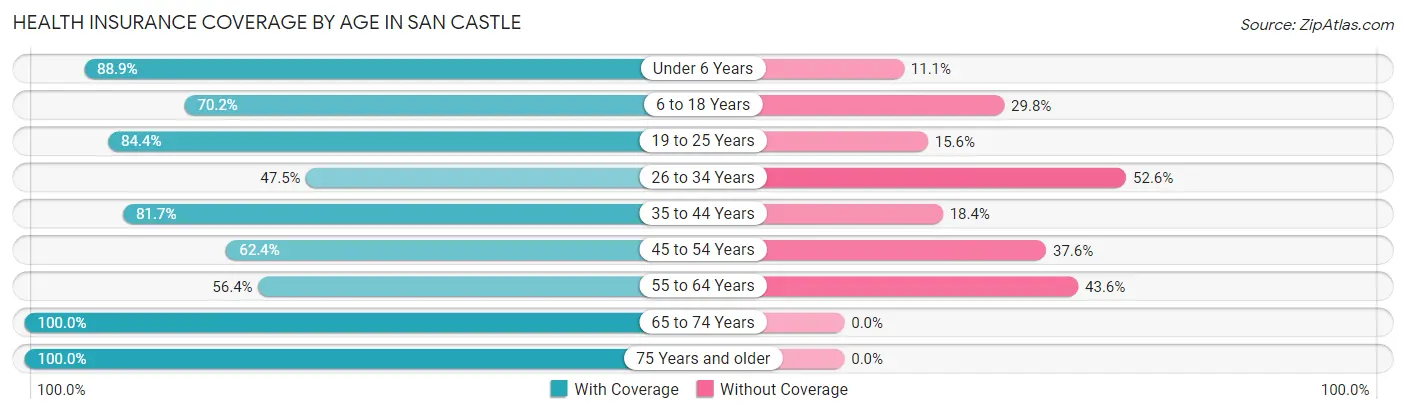
| Age Bracket | With Coverage | Without Coverage |
| Under 6 Years | 128 (88.9%) | 16 (11.1%) |
| 6 to 18 Years | 445 (70.2%) | 189 (29.8%) |
| 19 to 25 Years | 141 (84.4%) | 26 (15.6%) |
| 26 to 34 Years | 326 (47.4%) | 361 (52.5%) |
| 35 to 44 Years | 227 (81.7%) | 51 (18.3%) |
| 45 to 54 Years | 247 (62.4%) | 149 (37.6%) |
| 55 to 64 Years | 291 (56.4%) | 225 (43.6%) |
| 65 to 74 Years | 190 (100.0%) | 0 (0.0%) |
| 75 Years and older | 180 (100.0%) | 0 (0.0%) |
| Total | 2,175 (68.1%) | 1,017 (31.9%) |
Health Insurance Coverage by Citizenship Status in San Castle
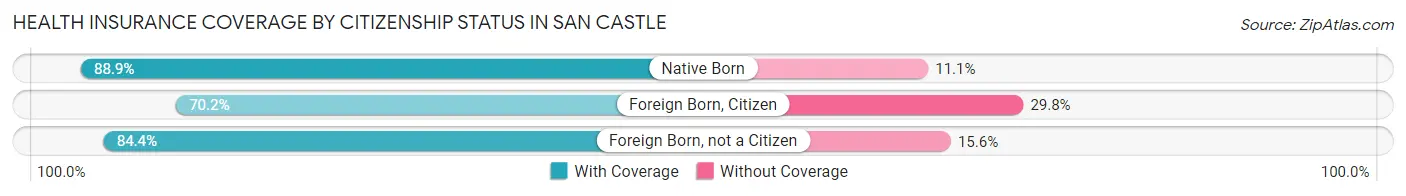
| Citizenship Status | With Coverage | Without Coverage |
| Native Born | 128 (88.9%) | 16 (11.1%) |
| Foreign Born, Citizen | 445 (70.2%) | 189 (29.8%) |
| Foreign Born, not a Citizen | 141 (84.4%) | 26 (15.6%) |
Health Insurance Coverage by Household Income in San Castle
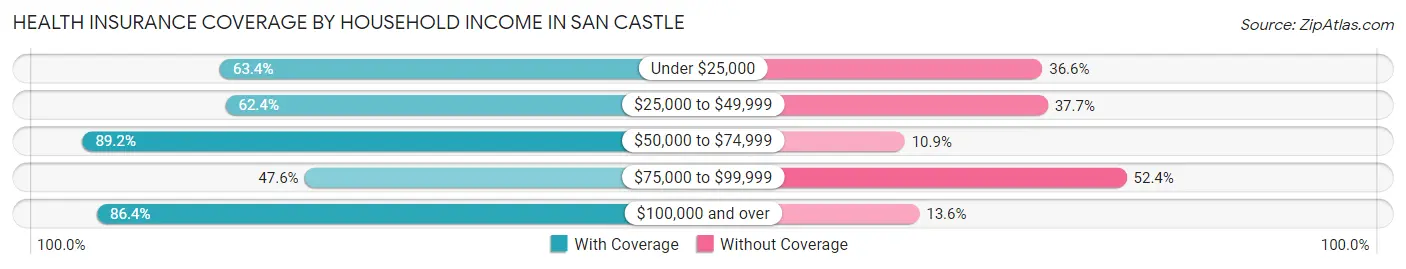
| Household Income | With Coverage | Without Coverage |
| Under $25,000 | 391 (63.4%) | 226 (36.6%) |
| $25,000 to $49,999 | 457 (62.4%) | 276 (37.7%) |
| $50,000 to $74,999 | 337 (89.1%) | 41 (10.8%) |
| $75,000 to $99,999 | 334 (47.6%) | 368 (52.4%) |
| $100,000 and over | 636 (86.4%) | 100 (13.6%) |
Public vs Private Health Insurance Coverage by Age in San Castle
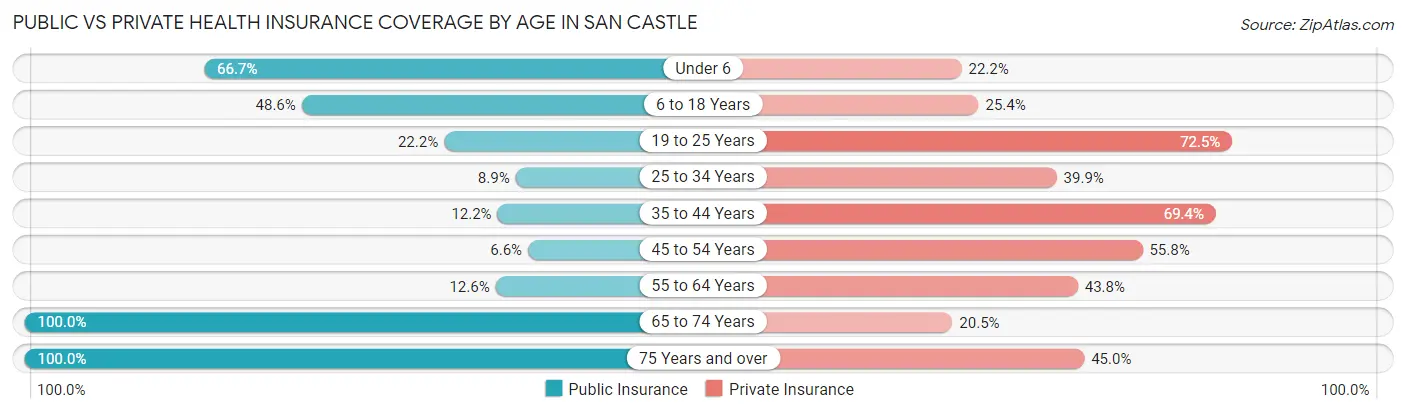
| Age Bracket | Public Insurance | Private Insurance |
| Under 6 | 96 (66.7%) | 32 (22.2%) |
| 6 to 18 Years | 308 (48.6%) | 161 (25.4%) |
| 19 to 25 Years | 37 (22.2%) | 121 (72.5%) |
| 25 to 34 Years | 61 (8.9%) | 274 (39.9%) |
| 35 to 44 Years | 34 (12.2%) | 193 (69.4%) |
| 45 to 54 Years | 26 (6.6%) | 221 (55.8%) |
| 55 to 64 Years | 65 (12.6%) | 226 (43.8%) |
| 65 to 74 Years | 190 (100.0%) | 39 (20.5%) |
| 75 Years and over | 180 (100.0%) | 81 (45.0%) |
| Total | 997 (31.2%) | 1,348 (42.2%) |
Disability Status by Sex by Age in San Castle
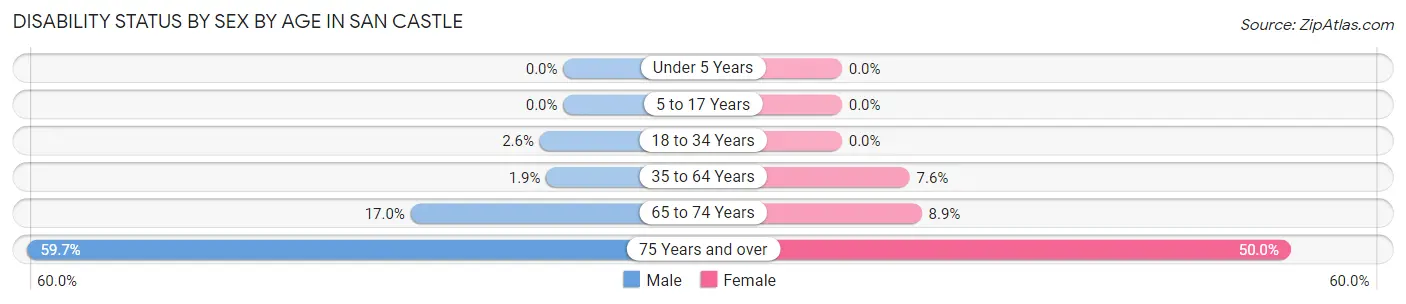
| Age Bracket | Male | Female |
| Under 5 Years | 0 (0.0%) | 0 (0.0%) |
| 5 to 17 Years | 0 (0.0%) | 0 (0.0%) |
| 18 to 34 Years | 18 (2.6%) | 0 (0.0%) |
| 35 to 64 Years | 11 (1.9%) | 46 (7.5%) |
| 65 to 74 Years | 17 (17.0%) | 8 (8.9%) |
| 75 Years and over | 37 (59.7%) | 59 (50.0%) |
Disability Class by Sex by Age in San Castle
Disability Class: Hearing Difficulty
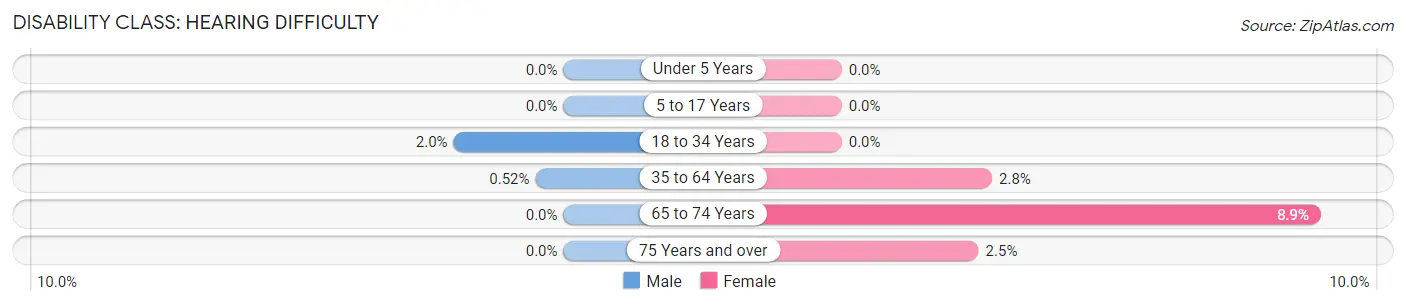
| Age Bracket | Male | Female |
| Under 5 Years | 0 (0.0%) | 0 (0.0%) |
| 5 to 17 Years | 0 (0.0%) | 0 (0.0%) |
| 18 to 34 Years | 14 (2.0%) | 0 (0.0%) |
| 35 to 64 Years | 3 (0.5%) | 17 (2.8%) |
| 65 to 74 Years | 0 (0.0%) | 8 (8.9%) |
| 75 Years and over | 0 (0.0%) | 3 (2.5%) |
Disability Class: Vision Difficulty
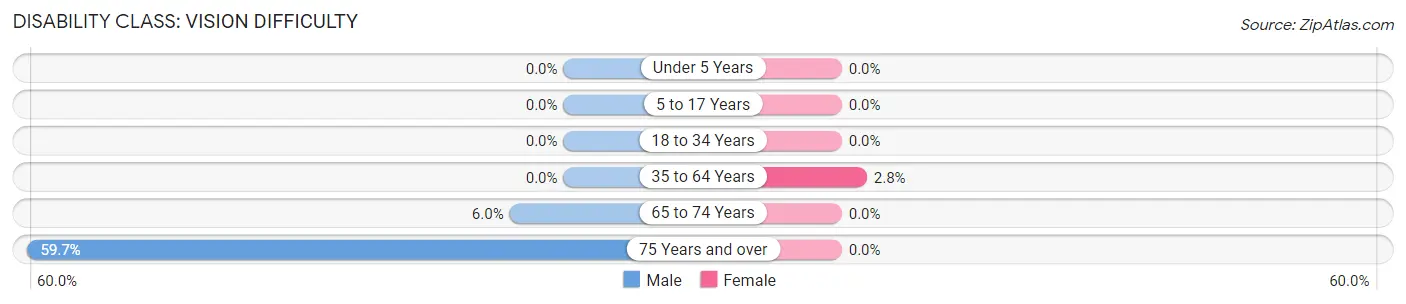
| Age Bracket | Male | Female |
| Under 5 Years | 0 (0.0%) | 0 (0.0%) |
| 5 to 17 Years | 0 (0.0%) | 0 (0.0%) |
| 18 to 34 Years | 0 (0.0%) | 0 (0.0%) |
| 35 to 64 Years | 0 (0.0%) | 17 (2.8%) |
| 65 to 74 Years | 6 (6.0%) | 0 (0.0%) |
| 75 Years and over | 37 (59.7%) | 0 (0.0%) |
Disability Class: Cognitive Difficulty
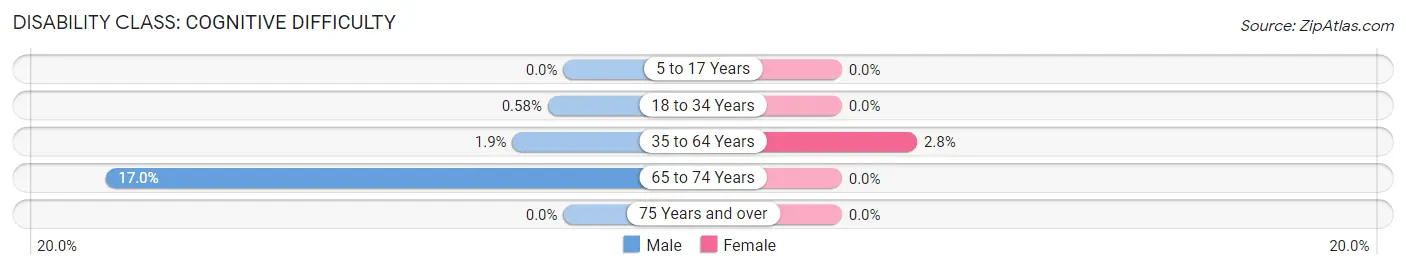
| Age Bracket | Male | Female |
| 5 to 17 Years | 0 (0.0%) | 0 (0.0%) |
| 18 to 34 Years | 4 (0.6%) | 0 (0.0%) |
| 35 to 64 Years | 11 (1.9%) | 17 (2.8%) |
| 65 to 74 Years | 17 (17.0%) | 0 (0.0%) |
| 75 Years and over | 0 (0.0%) | 0 (0.0%) |
Disability Class: Ambulatory Difficulty
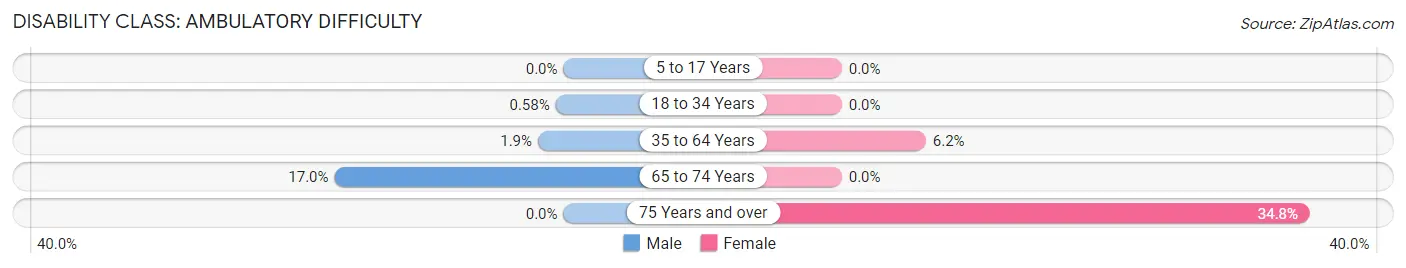
| Age Bracket | Male | Female |
| 5 to 17 Years | 0 (0.0%) | 0 (0.0%) |
| 18 to 34 Years | 4 (0.6%) | 0 (0.0%) |
| 35 to 64 Years | 11 (1.9%) | 38 (6.2%) |
| 65 to 74 Years | 17 (17.0%) | 0 (0.0%) |
| 75 Years and over | 0 (0.0%) | 41 (34.7%) |
Disability Class: Self-Care Difficulty
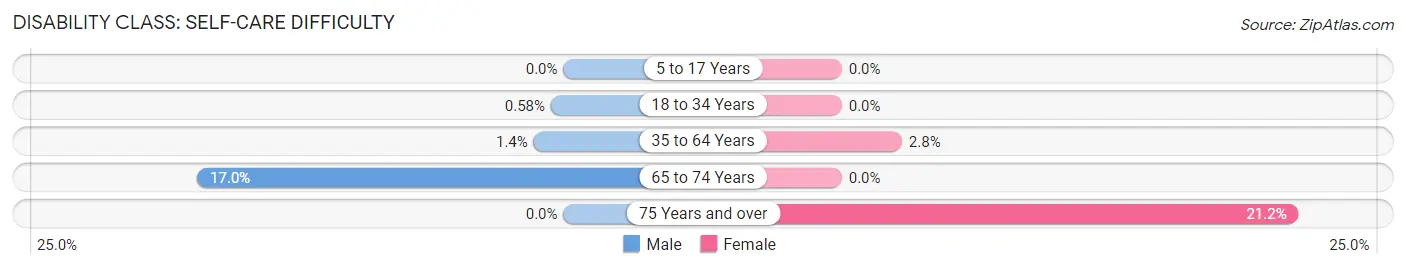
| Age Bracket | Male | Female |
| 5 to 17 Years | 0 (0.0%) | 0 (0.0%) |
| 18 to 34 Years | 4 (0.6%) | 0 (0.0%) |
| 35 to 64 Years | 8 (1.4%) | 17 (2.8%) |
| 65 to 74 Years | 17 (17.0%) | 0 (0.0%) |
| 75 Years and over | 0 (0.0%) | 25 (21.2%) |
Technology Access in San Castle
Computing Device Access in San Castle
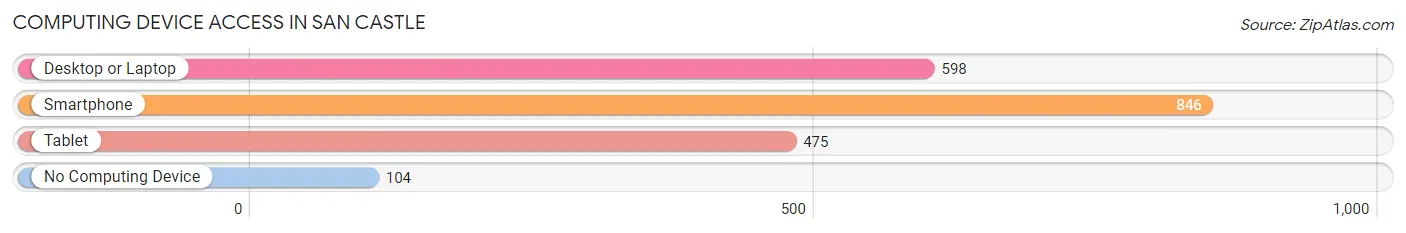
| Device Type | # Households | % Households |
| Desktop or Laptop | 598 | 61.6% |
| Smartphone | 846 | 87.1% |
| Tablet | 475 | 48.9% |
| No Computing Device | 104 | 10.7% |
| Total | 971 | 100.0% |
Internet Access in San Castle
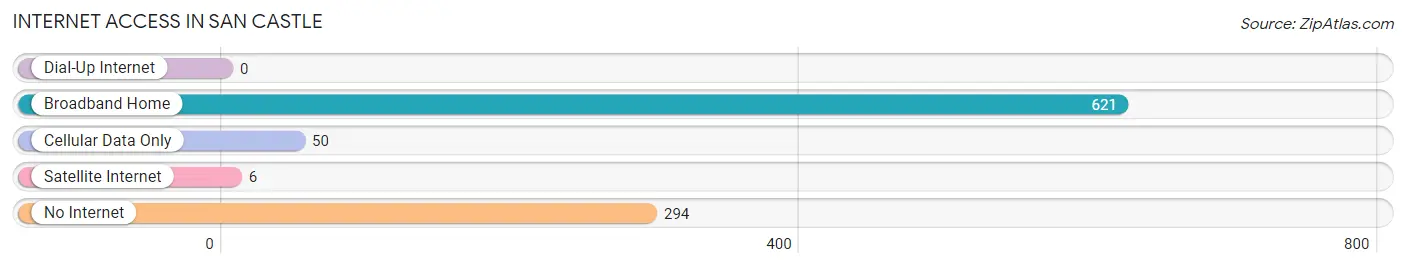
| Internet Type | # Households | % Households |
| Dial-Up Internet | 0 | 0.0% |
| Broadband Home | 621 | 63.9% |
| Cellular Data Only | 50 | 5.1% |
| Satellite Internet | 6 | 0.6% |
| No Internet | 294 | 30.3% |
| Total | 971 | 100.0% |
San Castle Summary
Castle, Florida is a small town located in the central part of the state, just south of Orlando. It is part of the Orlando-Kissimmee-Sanford Metropolitan Statistical Area and is home to a population of just over 1,000 people. The town is known for its quaint charm and its proximity to the larger cities of Orlando and Sanford.
Geography
Castle, Florida is located in Orange County, Florida, just south of Orlando. It is situated on the eastern shore of Lake Apopka, which is the fourth largest lake in the state. The town is bordered by the cities of Apopka, Ocoee, and Winter Garden. The town is located in a humid subtropical climate zone, with hot summers and mild winters. The average temperature in the summer is around 90 degrees Fahrenheit, and the average temperature in the winter is around 60 degrees Fahrenheit.
Economy
The economy of Castle, Florida is largely based on tourism and agriculture. The town is home to several tourist attractions, including the Castle Rock State Park, which is a popular destination for camping, fishing, and hiking. The town is also home to several farms, which produce a variety of fruits and vegetables. The town is also home to several small businesses, including restaurants, retail stores, and service providers.
Demographics
As of the 2010 census, the population of Castle, Florida was 1,037. The racial makeup of the town was 79.3% White, 15.2% African American, 0.3% Native American, 0.7% Asian, 0.1% Pacific Islander, and 4.4% from other races. The median household income was $37,917, and the median family income was $45,917. The per capita income was $19,917.
Conclusion
Castle, Florida is a small town located in the central part of the state, just south of Orlando. It is part of the Orlando-Kissimmee-Sanford Metropolitan Statistical Area and is home to a population of just over 1,000 people. The town is known for its quaint charm and its proximity to the larger cities of Orlando and Sanford. The economy of Castle, Florida is largely based on tourism and agriculture, and the town is home to several tourist attractions and farms. The population of Castle, Florida is largely White, with a small percentage of African Americans, Native Americans, Asians, and Pacific Islanders. The median household income is $37,917, and the median family income is $45,917.
Common Questions
What is Per Capita Income in San Castle?
Per Capita income in San Castle is $23,602.
What is the Median Family Income in San Castle?
Median Family Income in San Castle is $49,246.
What is the Median Household income in San Castle?
Median Household Income in San Castle is $47,953.
What is Income or Wage Gap in San Castle?
Income or Wage Gap in San Castle is 39.6%.
Women in San Castle earn 60.4 cents for every dollar earned by a man.
What is Inequality or Gini Index in San Castle?
Inequality or Gini Index in San Castle is 0.50.
What is the Total Population of San Castle?
Total Population of San Castle is 3,192.
What is the Total Male Population of San Castle?
Total Male Population of San Castle is 1,845.
What is the Total Female Population of San Castle?
Total Female Population of San Castle is 1,347.
What is the Ratio of Males per 100 Females in San Castle?
There are 136.97 Males per 100 Females in San Castle.
What is the Ratio of Females per 100 Males in San Castle?
There are 73.01 Females per 100 Males in San Castle.
What is the Median Population Age in San Castle?
Median Population Age in San Castle is 34.2 Years.
What is the Average Family Size in San Castle
Average Family Size in San Castle is 3.7 People.
What is the Average Household Size in San Castle
Average Household Size in San Castle is 3.3 People.
How Large is the Labor Force in San Castle?
There are 1,780 People in the Labor Forcein in San Castle.
What is the Percentage of People in the Labor Force in San Castle?
71.7% of People are in the Labor Force in San Castle.
What is the Unemployment Rate in San Castle?
Unemployment Rate in San Castle is 4.9%.