Simonton Lake, IN Map & Demographics
Simonton Lake Map
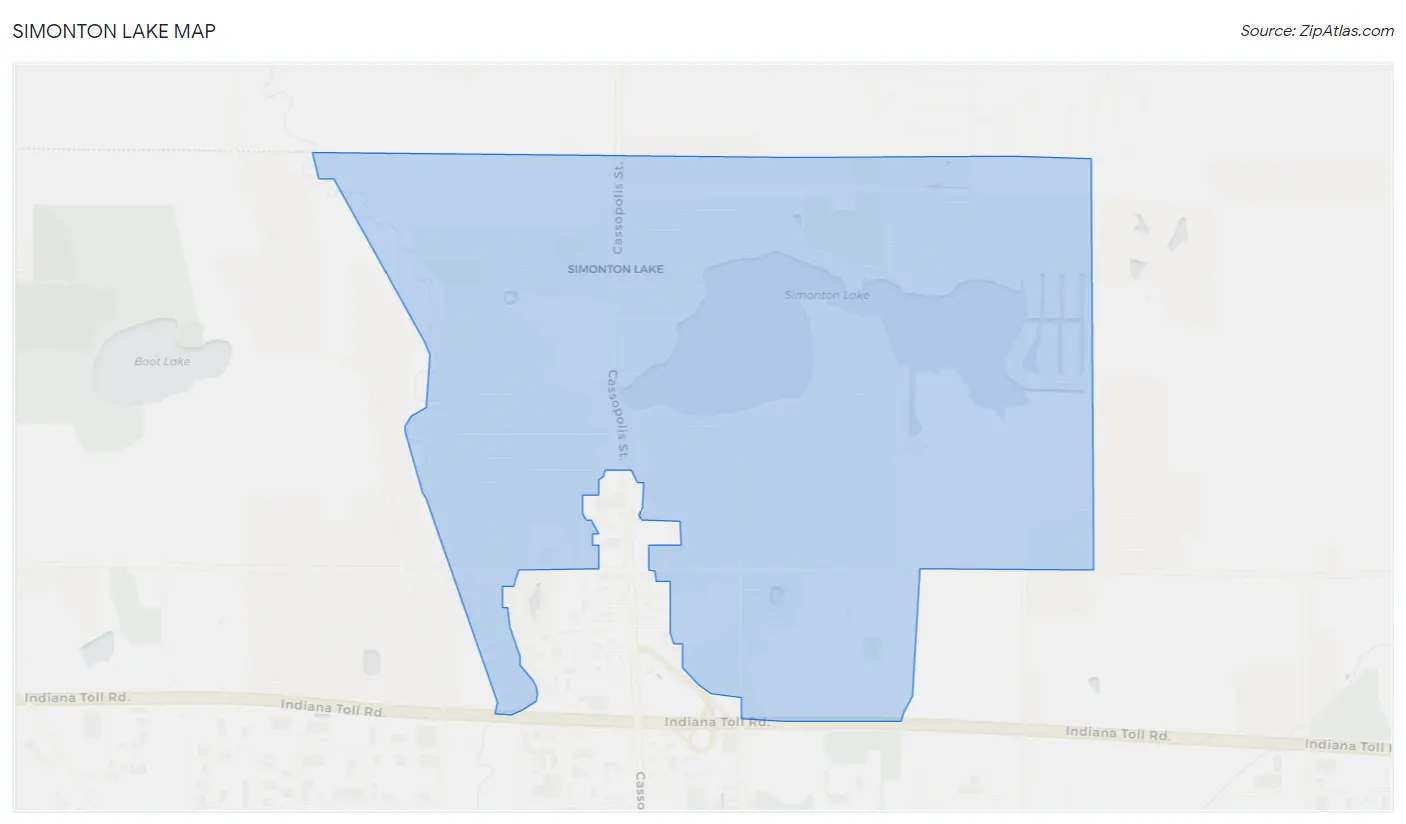
Simonton Lake Overview
$38,880
PER CAPITA INCOME
$83,429
AVG FAMILY INCOME
$66,852
AVG HOUSEHOLD INCOME
23.3%
WAGE / INCOME GAP [ % ]
76.7¢/ $1
WAGE / INCOME GAP [ $ ]
0.46
INEQUALITY / GINI INDEX
4,527
TOTAL POPULATION
2,265
MALE POPULATION
2,262
FEMALE POPULATION
100.13
MALES / 100 FEMALES
99.87
FEMALES / 100 MALES
48.7
MEDIAN AGE
3.0
AVG FAMILY SIZE
2.5
AVG HOUSEHOLD SIZE
2,322
LABOR FORCE [ PEOPLE ]
64.1%
PERCENT IN LABOR FORCE
3.6%
UNEMPLOYMENT RATE
Income in Simonton Lake
Income Overview in Simonton Lake
Per Capita Income in Simonton Lake is $38,880, while median incomes of families and households are $83,429 and $66,852 respectively.
| Characteristic | Number | Measure |
| Per Capita Income | 4,527 | $38,880 |
| Median Family Income | 1,295 | $83,429 |
| Mean Family Income | 1,295 | $102,134 |
| Median Household Income | 1,848 | $66,852 |
| Mean Household Income | 1,848 | $89,377 |
| Income Deficit | 1,295 | $0 |
| Wage / Income Gap (%) | 4,527 | 23.32% |
| Wage / Income Gap ($) | 4,527 | 76.68¢ per $1 |
| Gini / Inequality Index | 4,527 | 0.46 |
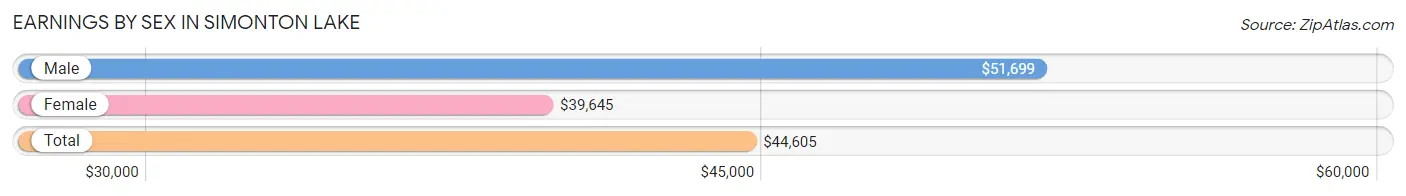
Earnings by Sex in Simonton Lake
Average Earnings in Simonton Lake are $44,605, $51,699 for men and $39,645 for women, a difference of 23.3%.
| Sex | Number | Average Earnings |
| Male | 1,265 (53.0%) | $51,699 |
| Female | 1,121 (47.0%) | $39,645 |
| Total | 2,386 (100.0%) | $44,605 |
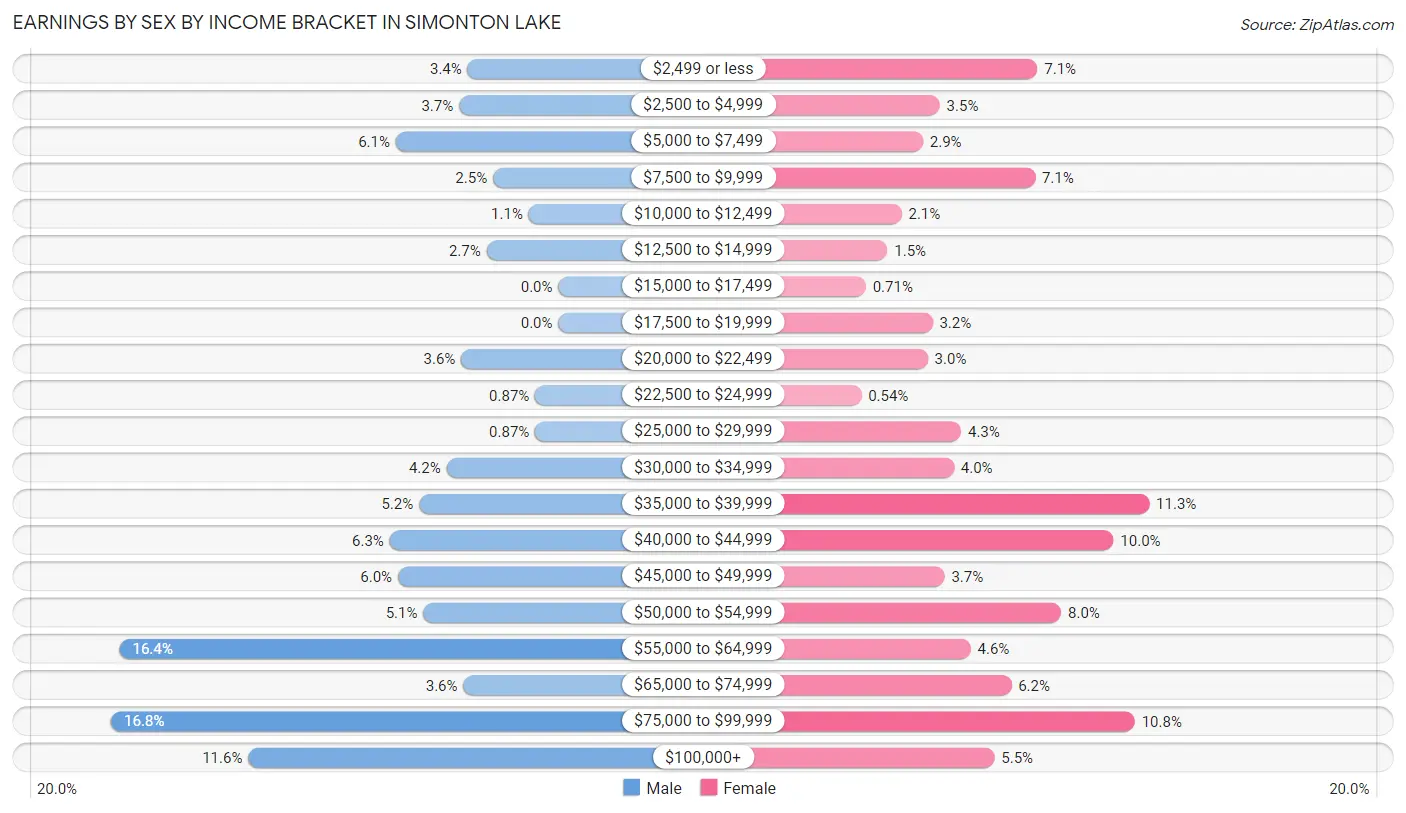
Earnings by Sex by Income Bracket in Simonton Lake
The most common earnings brackets in Simonton Lake are $75,000 to $99,999 for men (212 | 16.8%) and $35,000 to $39,999 for women (127 | 11.3%).
| Income | Male | Female |
| $2,499 or less | 43 (3.4%) | 80 (7.1%) |
| $2,500 to $4,999 | 47 (3.7%) | 39 (3.5%) |
| $5,000 to $7,499 | 77 (6.1%) | 32 (2.9%) |
| $7,500 to $9,999 | 31 (2.5%) | 79 (7.0%) |
| $10,000 to $12,499 | 14 (1.1%) | 23 (2.1%) |
| $12,500 to $14,999 | 34 (2.7%) | 17 (1.5%) |
| $15,000 to $17,499 | 0 (0.0%) | 8 (0.7%) |
| $17,500 to $19,999 | 0 (0.0%) | 36 (3.2%) |
| $20,000 to $22,499 | 46 (3.6%) | 34 (3.0%) |
| $22,500 to $24,999 | 11 (0.9%) | 6 (0.5%) |
| $25,000 to $29,999 | 11 (0.9%) | 48 (4.3%) |
| $30,000 to $34,999 | 53 (4.2%) | 45 (4.0%) |
| $35,000 to $39,999 | 66 (5.2%) | 127 (11.3%) |
| $40,000 to $44,999 | 80 (6.3%) | 112 (10.0%) |
| $45,000 to $49,999 | 76 (6.0%) | 41 (3.7%) |
| $50,000 to $54,999 | 64 (5.1%) | 90 (8.0%) |
| $55,000 to $64,999 | 208 (16.4%) | 52 (4.6%) |
| $65,000 to $74,999 | 45 (3.6%) | 69 (6.2%) |
| $75,000 to $99,999 | 212 (16.8%) | 121 (10.8%) |
| $100,000+ | 147 (11.6%) | 62 (5.5%) |
| Total | 1,265 (100.0%) | 1,121 (100.0%) |
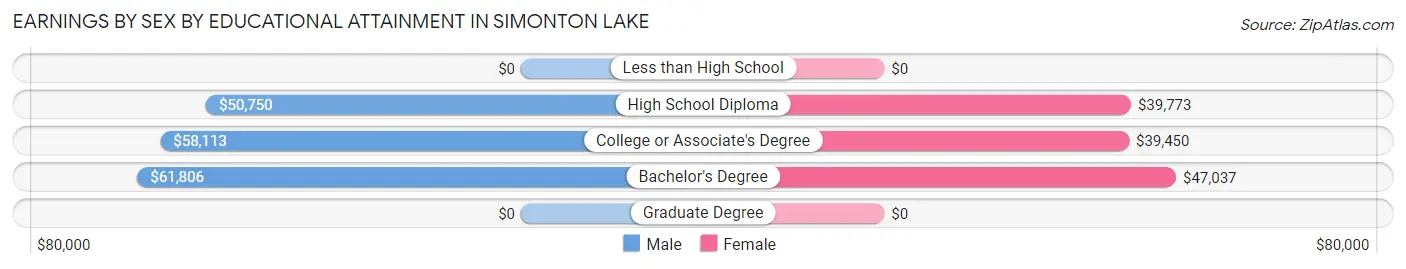
Earnings by Sex by Educational Attainment in Simonton Lake
Average earnings in Simonton Lake are $55,798 for men and $40,876 for women, a difference of 26.7%. Men with an educational attainment of bachelor's degree enjoy the highest average annual earnings of $61,806, while those with high school diploma education earn the least with $50,750. Women with an educational attainment of bachelor's degree earn the most with the average annual earnings of $47,037, while those with college or associate's degree education have the smallest earnings of $39,450.
| Educational Attainment | Male Income | Female Income |
| Less than High School | - | - |
| High School Diploma | $50,750 | $39,773 |
| College or Associate's Degree | $58,113 | $39,450 |
| Bachelor's Degree | $61,806 | $47,037 |
| Graduate Degree | - | - |
| Total | $55,798 | $40,876 |
Family Income in Simonton Lake
Family Income Brackets in Simonton Lake
According to the Simonton Lake family income data, there are 334 families falling into the $100,000 to $149,999 income range, which is the most common income bracket and makes up 25.8% of all families. Conversely, the $10,000 to $14,999 income bracket is the least frequent group with only 17 families (1.3%) belonging to this category.
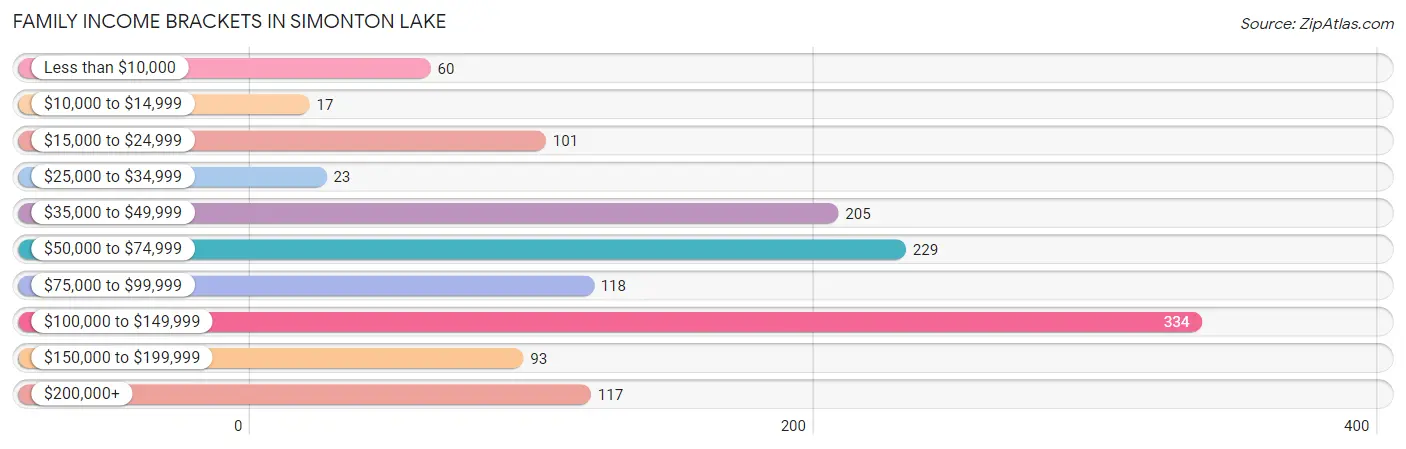
| Income Bracket | # Families | % Families |
| Less than $10,000 | 60 | 4.6% |
| $10,000 to $14,999 | 17 | 1.3% |
| $15,000 to $24,999 | 101 | 7.8% |
| $25,000 to $34,999 | 23 | 1.8% |
| $35,000 to $49,999 | 205 | 15.8% |
| $50,000 to $74,999 | 229 | 17.7% |
| $75,000 to $99,999 | 118 | 9.1% |
| $100,000 to $149,999 | 334 | 25.8% |
| $150,000 to $199,999 | 93 | 7.2% |
| $200,000+ | 117 | 9.0% |
Family Income by Famaliy Size in Simonton Lake
5-person families (33 | 2.5%) account for the highest median family income in Simonton Lake with $165,956 per family, while 2-person families (766 | 59.2%) have the highest median income of $46,845 per family member.
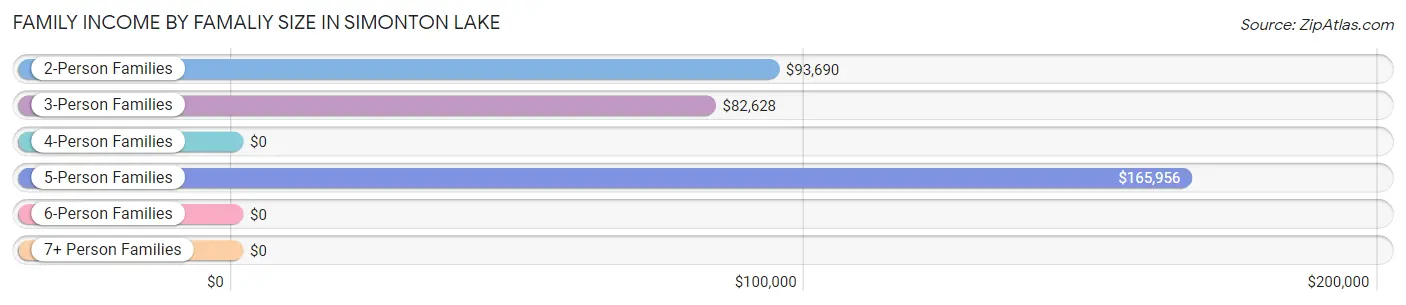
| Income Bracket | # Families | Median Income |
| 2-Person Families | 766 (59.2%) | $93,690 |
| 3-Person Families | 284 (21.9%) | $82,628 |
| 4-Person Families | 205 (15.8%) | $0 |
| 5-Person Families | 33 (2.5%) | $165,956 |
| 6-Person Families | 7 (0.5%) | $0 |
| 7+ Person Families | 0 (0.0%) | $0 |
| Total | 1,295 (100.0%) | $83,429 |
Family Income by Number of Earners in Simonton Lake
The median family income in Simonton Lake is $83,429, with families comprising 3+ earners (100) having the highest median family income of $143,846, while families with no earners (281) have the lowest median family income of $44,219, accounting for 7.7% and 21.7% of families, respectively.
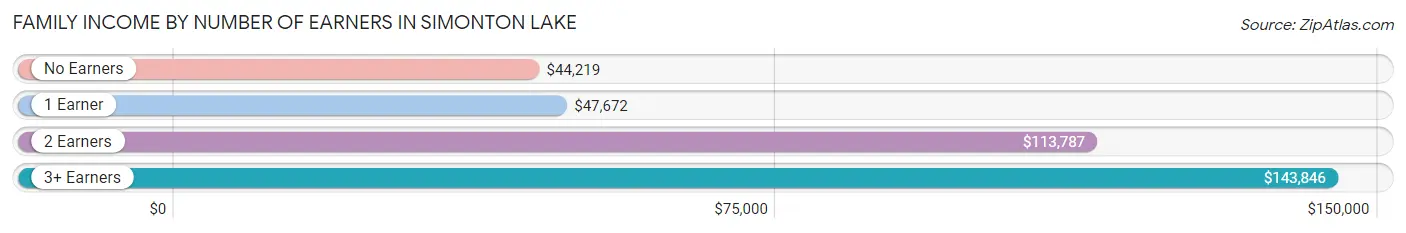
| Number of Earners | # Families | Median Income |
| No Earners | 281 (21.7%) | $44,219 |
| 1 Earner | 262 (20.2%) | $47,672 |
| 2 Earners | 652 (50.3%) | $113,787 |
| 3+ Earners | 100 (7.7%) | $143,846 |
| Total | 1,295 (100.0%) | $83,429 |
Household Income in Simonton Lake
Household Income Brackets in Simonton Lake
With 386 households falling in the category, the $100,000 to $149,999 income range is the most frequent in Simonton Lake, accounting for 20.9% of all households. In contrast, only 31 households (1.7%) fall into the $10,000 to $14,999 income bracket, making it the least populous group.
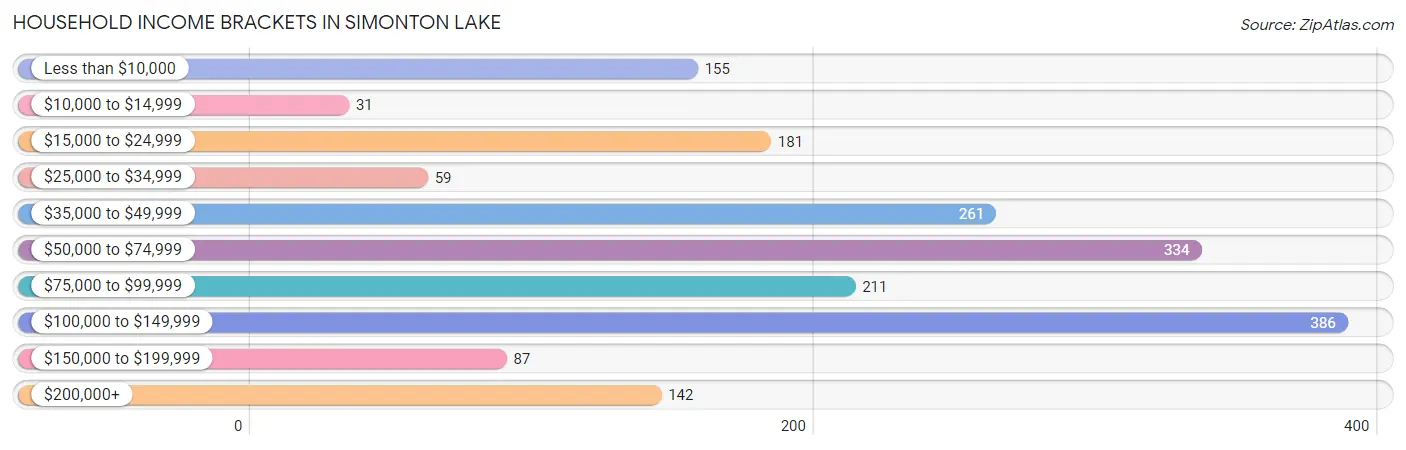
| Income Bracket | # Households | % Households |
| Less than $10,000 | 155 | 8.4% |
| $10,000 to $14,999 | 31 | 1.7% |
| $15,000 to $24,999 | 181 | 9.8% |
| $25,000 to $34,999 | 59 | 3.2% |
| $35,000 to $49,999 | 261 | 14.1% |
| $50,000 to $74,999 | 334 | 18.1% |
| $75,000 to $99,999 | 211 | 11.4% |
| $100,000 to $149,999 | 386 | 20.9% |
| $150,000 to $199,999 | 87 | 4.7% |
| $200,000+ | 142 | 7.7% |
Household Income by Householder Age in Simonton Lake
The median household income in Simonton Lake is $66,852, with the highest median household income of $108,636 found in the 45 to 64 years age bracket for the primary householder. A total of 772 households (41.8%) fall into this category.
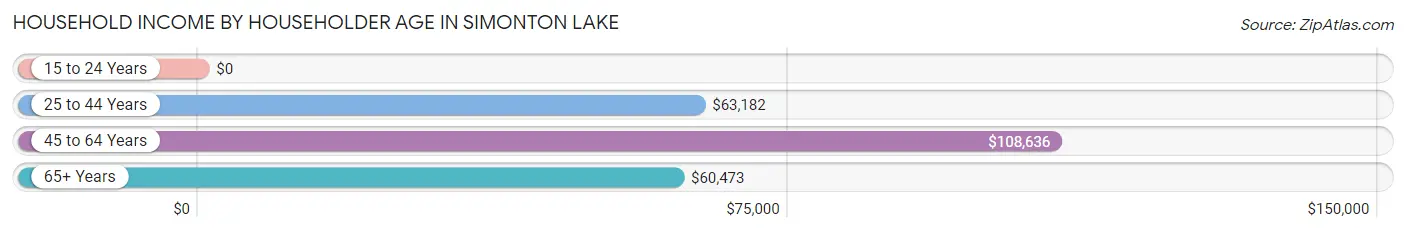
| Income Bracket | # Households | Median Income |
| 15 to 24 Years | 0 (0.0%) | $0 |
| 25 to 44 Years | 492 (26.6%) | $63,182 |
| 45 to 64 Years | 772 (41.8%) | $108,636 |
| 65+ Years | 584 (31.6%) | $60,473 |
| Total | 1,848 (100.0%) | $66,852 |
Poverty in Simonton Lake
Income Below Poverty by Sex and Age in Simonton Lake
With 14.5% poverty level for males and 15.4% for females among the residents of Simonton Lake, 12 to 14 year old males and 15 year old females are the most vulnerable to poverty, with 52 males (59.1%) and 29 females (60.4%) in their respective age groups living below the poverty level.
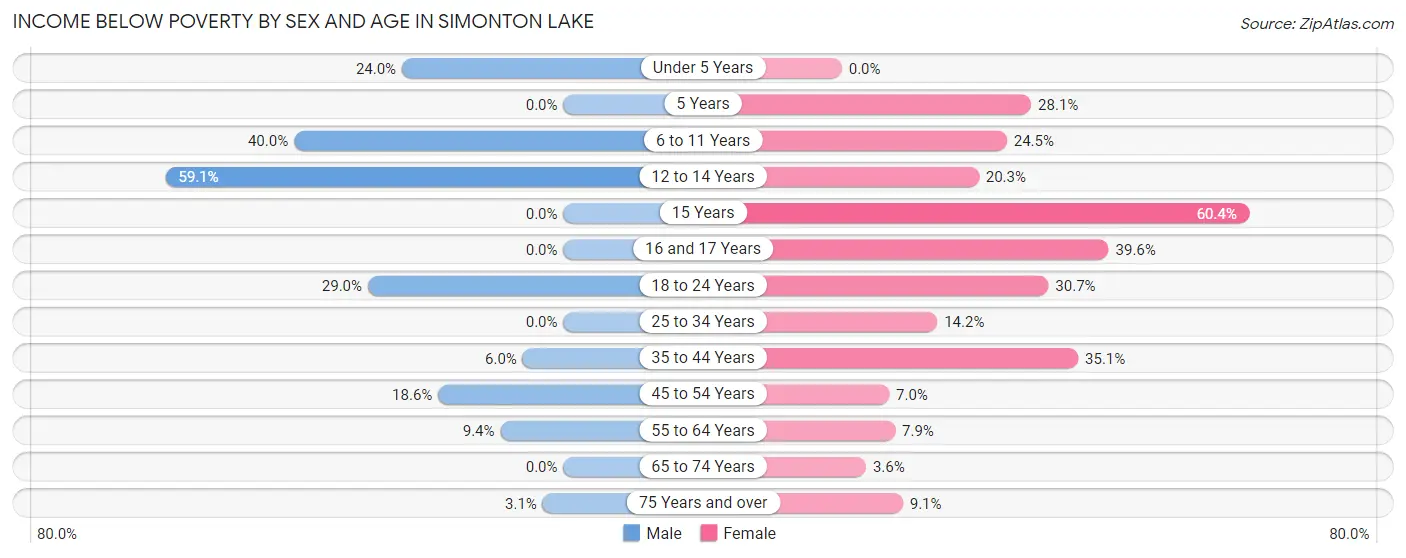
| Age Bracket | Male | Female |
| Under 5 Years | 29 (24.0%) | 0 (0.0%) |
| 5 Years | 0 (0.0%) | 9 (28.1%) |
| 6 to 11 Years | 100 (40.0%) | 37 (24.5%) |
| 12 to 14 Years | 52 (59.1%) | 12 (20.3%) |
| 15 Years | 0 (0.0%) | 29 (60.4%) |
| 16 and 17 Years | 0 (0.0%) | 21 (39.6%) |
| 18 to 24 Years | 36 (29.0%) | 27 (30.7%) |
| 25 to 34 Years | 0 (0.0%) | 34 (14.2%) |
| 35 to 44 Years | 9 (6.0%) | 93 (35.1%) |
| 45 to 54 Years | 58 (18.6%) | 20 (7.0%) |
| 55 to 64 Years | 36 (9.3%) | 36 (7.9%) |
| 65 to 74 Years | 0 (0.0%) | 7 (3.6%) |
| 75 Years and over | 8 (3.1%) | 24 (9.1%) |
| Total | 328 (14.5%) | 349 (15.4%) |
Income Above Poverty by Sex and Age in Simonton Lake
According to the poverty statistics in Simonton Lake, males aged 5 years and females aged under 5 years are the age groups that are most secure financially, with 100.0% of males and 100.0% of females in these age groups living above the poverty line.
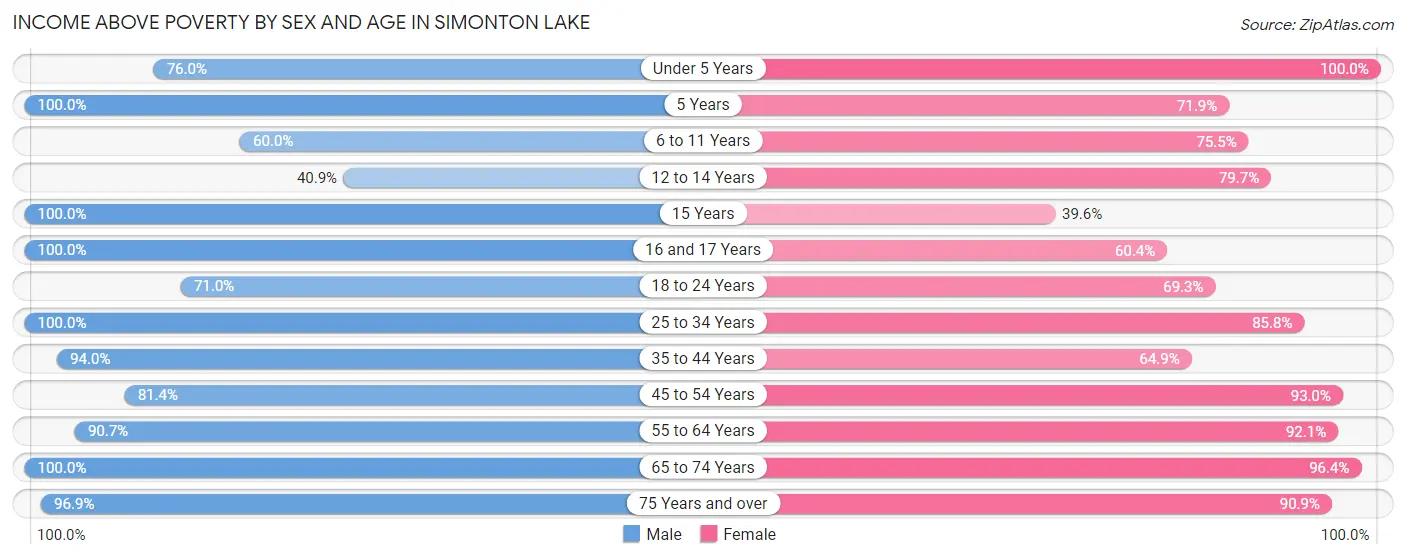
| Age Bracket | Male | Female |
| Under 5 Years | 92 (76.0%) | 126 (100.0%) |
| 5 Years | 19 (100.0%) | 23 (71.9%) |
| 6 to 11 Years | 150 (60.0%) | 114 (75.5%) |
| 12 to 14 Years | 36 (40.9%) | 47 (79.7%) |
| 15 Years | 11 (100.0%) | 19 (39.6%) |
| 16 and 17 Years | 12 (100.0%) | 32 (60.4%) |
| 18 to 24 Years | 88 (71.0%) | 61 (69.3%) |
| 25 to 34 Years | 259 (100.0%) | 206 (85.8%) |
| 35 to 44 Years | 140 (94.0%) | 172 (64.9%) |
| 45 to 54 Years | 254 (81.4%) | 265 (93.0%) |
| 55 to 64 Years | 349 (90.6%) | 419 (92.1%) |
| 65 to 74 Years | 274 (100.0%) | 188 (96.4%) |
| 75 Years and over | 253 (96.9%) | 241 (90.9%) |
| Total | 1,937 (85.5%) | 1,913 (84.6%) |
Income Below Poverty Among Married-Couple Families in Simonton Lake
The poverty statistics for married-couple families in Simonton Lake show that 2.1% or 20 of the total 962 families live below the poverty line. Families with 1 or 2 children have the highest poverty rate of 8.1%, comprising of 20 families. On the other hand, families with no children have the lowest poverty rate of 0.0%, which includes 0 families.
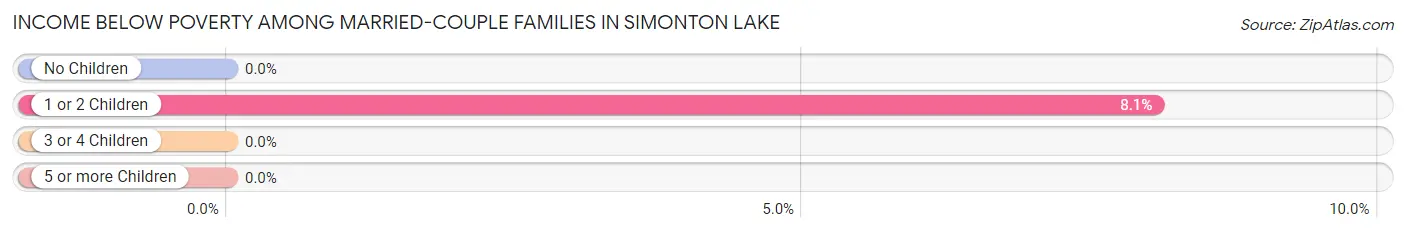
| Children | Above Poverty | Below Poverty |
| No Children | 708 (100.0%) | 0 (0.0%) |
| 1 or 2 Children | 228 (91.9%) | 20 (8.1%) |
| 3 or 4 Children | 6 (100.0%) | 0 (0.0%) |
| 5 or more Children | 0 (0.0%) | 0 (0.0%) |
| Total | 942 (97.9%) | 20 (2.1%) |
Income Below Poverty Among Single-Parent Households in Simonton Lake
According to the poverty data in Simonton Lake, 35.6% or 36 single-father households and 33.2% or 77 single-mother households are living below the poverty line. Among single-father households, those with 1 or 2 children have the highest poverty rate, with 36 households (100.0%) experiencing poverty. Likewise, among single-mother households, those with 1 or 2 children have the highest poverty rate, with 56 households (54.9%) falling below the poverty line.
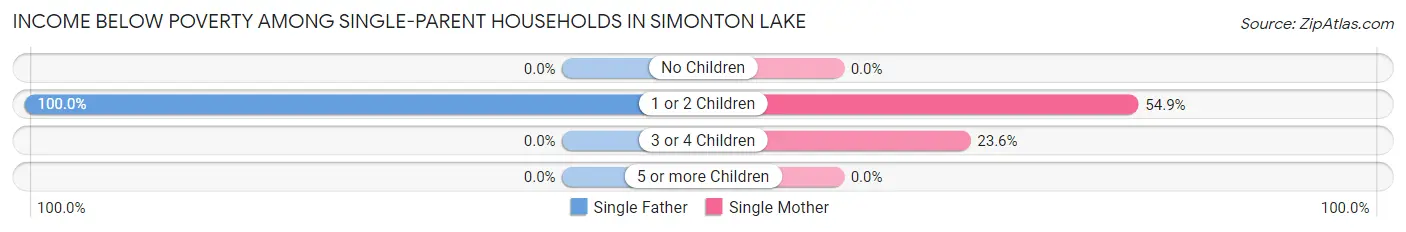
| Children | Single Father | Single Mother |
| No Children | 0 (0.0%) | 0 (0.0%) |
| 1 or 2 Children | 36 (100.0%) | 56 (54.9%) |
| 3 or 4 Children | 0 (0.0%) | 21 (23.6%) |
| 5 or more Children | 0 (0.0%) | 0 (0.0%) |
| Total | 36 (35.6%) | 77 (33.2%) |
Income Below Poverty Among Married-Couple vs Single-Parent Households in Simonton Lake
The poverty data for Simonton Lake shows that 20 of the married-couple family households (2.1%) and 113 of the single-parent households (33.9%) are living below the poverty level. Within the married-couple family households, those with 1 or 2 children have the highest poverty rate, with 20 households (8.1%) falling below the poverty line. Among the single-parent households, those with 1 or 2 children have the highest poverty rate, with 92 household (66.7%) living below poverty.
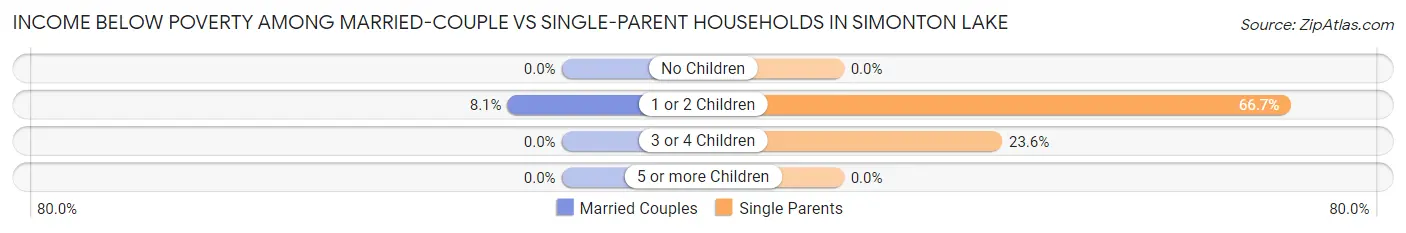
| Children | Married-Couple Families | Single-Parent Households |
| No Children | 0 (0.0%) | 0 (0.0%) |
| 1 or 2 Children | 20 (8.1%) | 92 (66.7%) |
| 3 or 4 Children | 0 (0.0%) | 21 (23.6%) |
| 5 or more Children | 0 (0.0%) | 0 (0.0%) |
| Total | 20 (2.1%) | 113 (33.9%) |
Race in Simonton Lake
The most populous races in Simonton Lake are White / Caucasian (3,310 | 73.1%), Two or more Races (470 | 10.4%), and Black / African American (422 | 9.3%).
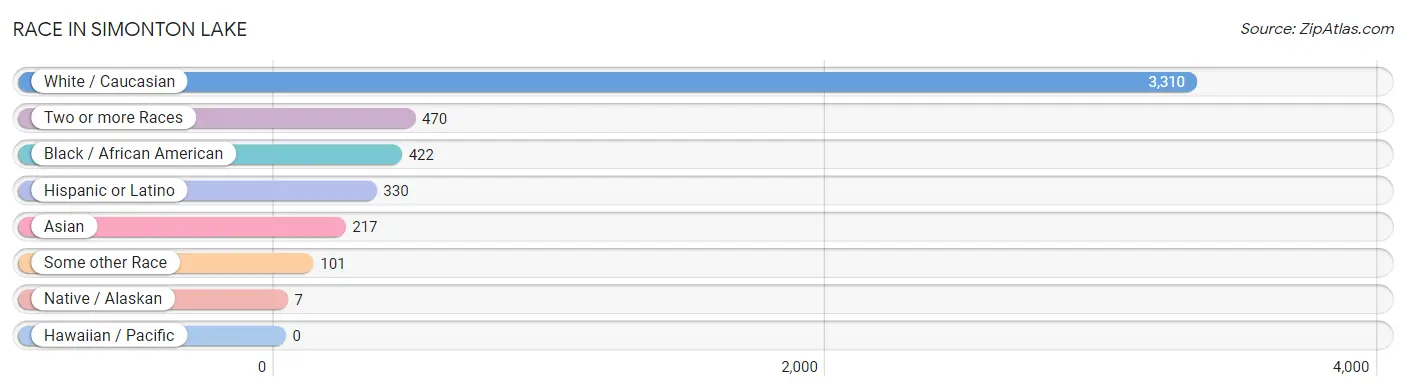
| Race | # Population | % Population |
| Asian | 217 | 4.8% |
| Black / African American | 422 | 9.3% |
| Hawaiian / Pacific | 0 | 0.0% |
| Hispanic or Latino | 330 | 7.3% |
| Native / Alaskan | 7 | 0.2% |
| White / Caucasian | 3,310 | 73.1% |
| Two or more Races | 470 | 10.4% |
| Some other Race | 101 | 2.2% |
| Total | 4,527 | 100.0% |
Ancestry in Simonton Lake
The most populous ancestries reported in Simonton Lake are German (815 | 18.0%), Irish (429 | 9.5%), American (372 | 8.2%), Italian (343 | 7.6%), and Polish (318 | 7.0%), together accounting for 50.3% of all Simonton Lake residents.
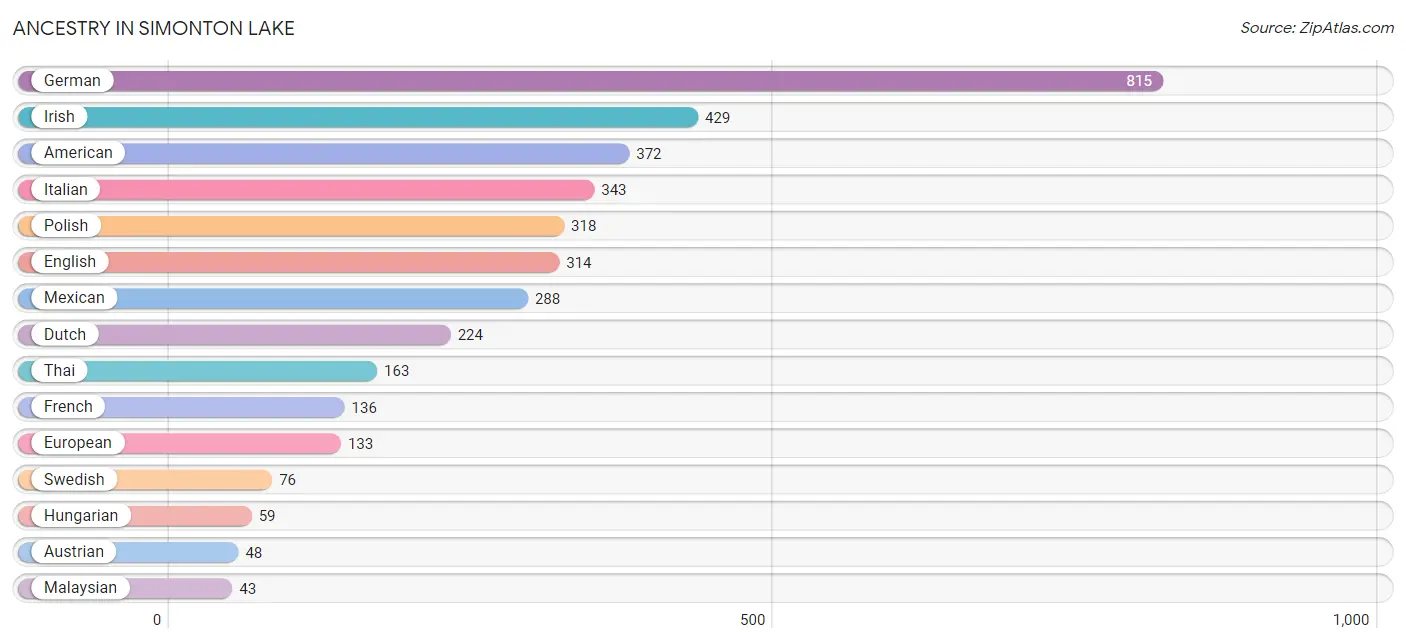
| Ancestry | # Population | % Population |
| African | 24 | 0.5% |
| American | 372 | 8.2% |
| Austrian | 48 | 1.1% |
| Bahamian | 27 | 0.6% |
| Belgian | 29 | 0.6% |
| British | 16 | 0.4% |
| Cambodian | 30 | 0.7% |
| Canadian | 8 | 0.2% |
| Cuban | 42 | 0.9% |
| Czech | 32 | 0.7% |
| Danish | 24 | 0.5% |
| Dutch | 224 | 5.0% |
| English | 314 | 6.9% |
| European | 133 | 2.9% |
| Finnish | 15 | 0.3% |
| French | 136 | 3.0% |
| French Canadian | 27 | 0.6% |
| German | 815 | 18.0% |
| Hungarian | 59 | 1.3% |
| Irish | 429 | 9.5% |
| Italian | 343 | 7.6% |
| Korean | 36 | 0.8% |
| Malaysian | 43 | 0.9% |
| Mexican | 288 | 6.4% |
| Mexican American Indian | 7 | 0.2% |
| Norwegian | 19 | 0.4% |
| Pennsylvania German | 9 | 0.2% |
| Polish | 318 | 7.0% |
| Scandinavian | 10 | 0.2% |
| Scotch-Irish | 10 | 0.2% |
| Scottish | 14 | 0.3% |
| Subsaharan African | 24 | 0.5% |
| Swedish | 76 | 1.7% |
| Swiss | 39 | 0.9% |
| Thai | 163 | 3.6% |
| Welsh | 17 | 0.4% | View All 36 Rows |
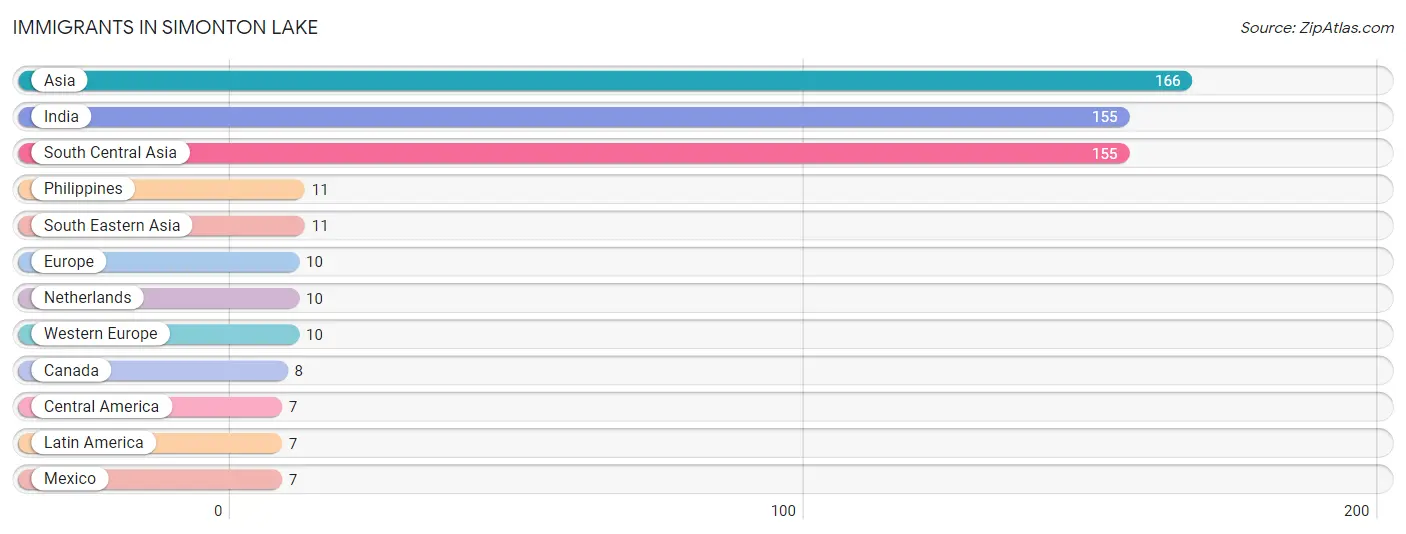
Immigrants in Simonton Lake
The most numerous immigrant groups reported in Simonton Lake came from Asia (166 | 3.7%), India (155 | 3.4%), South Central Asia (155 | 3.4%), Philippines (11 | 0.2%), and South Eastern Asia (11 | 0.2%), together accounting for 11.0% of all Simonton Lake residents.
| Immigration Origin | # Population | % Population |
| Asia | 166 | 3.7% |
| Canada | 8 | 0.2% |
| Central America | 7 | 0.2% |
| Europe | 10 | 0.2% |
| India | 155 | 3.4% |
| Latin America | 7 | 0.2% |
| Mexico | 7 | 0.2% |
| Netherlands | 10 | 0.2% |
| Philippines | 11 | 0.2% |
| South Central Asia | 155 | 3.4% |
| South Eastern Asia | 11 | 0.2% |
| Western Europe | 10 | 0.2% | View All 12 Rows |
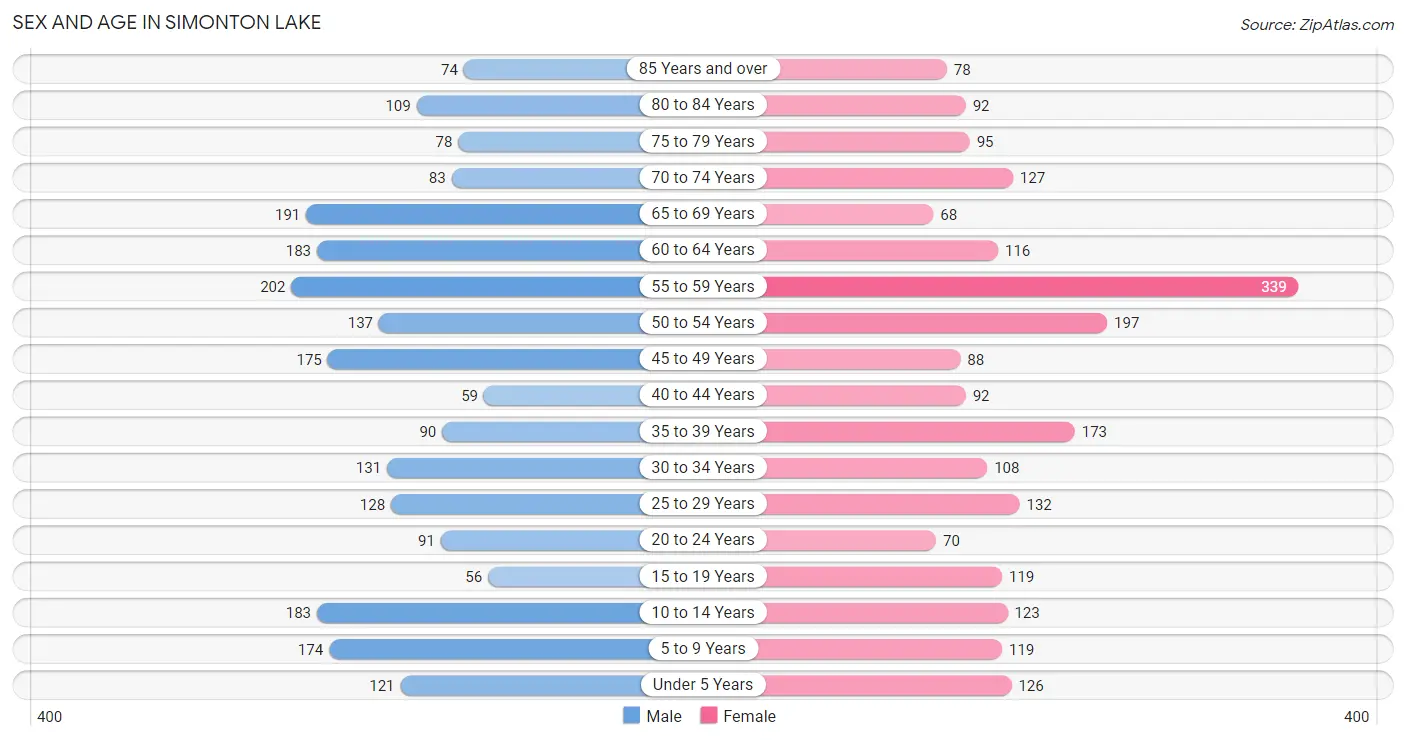
Sex and Age in Simonton Lake
Sex and Age in Simonton Lake
The most populous age groups in Simonton Lake are 55 to 59 Years (202 | 8.9%) for men and 55 to 59 Years (339 | 15.0%) for women.
| Age Bracket | Male | Female |
| Under 5 Years | 121 (5.3%) | 126 (5.6%) |
| 5 to 9 Years | 174 (7.7%) | 119 (5.3%) |
| 10 to 14 Years | 183 (8.1%) | 123 (5.4%) |
| 15 to 19 Years | 56 (2.5%) | 119 (5.3%) |
| 20 to 24 Years | 91 (4.0%) | 70 (3.1%) |
| 25 to 29 Years | 128 (5.7%) | 132 (5.8%) |
| 30 to 34 Years | 131 (5.8%) | 108 (4.8%) |
| 35 to 39 Years | 90 (4.0%) | 173 (7.6%) |
| 40 to 44 Years | 59 (2.6%) | 92 (4.1%) |
| 45 to 49 Years | 175 (7.7%) | 88 (3.9%) |
| 50 to 54 Years | 137 (6.0%) | 197 (8.7%) |
| 55 to 59 Years | 202 (8.9%) | 339 (15.0%) |
| 60 to 64 Years | 183 (8.1%) | 116 (5.1%) |
| 65 to 69 Years | 191 (8.4%) | 68 (3.0%) |
| 70 to 74 Years | 83 (3.7%) | 127 (5.6%) |
| 75 to 79 Years | 78 (3.4%) | 95 (4.2%) |
| 80 to 84 Years | 109 (4.8%) | 92 (4.1%) |
| 85 Years and over | 74 (3.3%) | 78 (3.5%) |
| Total | 2,265 (100.0%) | 2,262 (100.0%) |
Families and Households in Simonton Lake
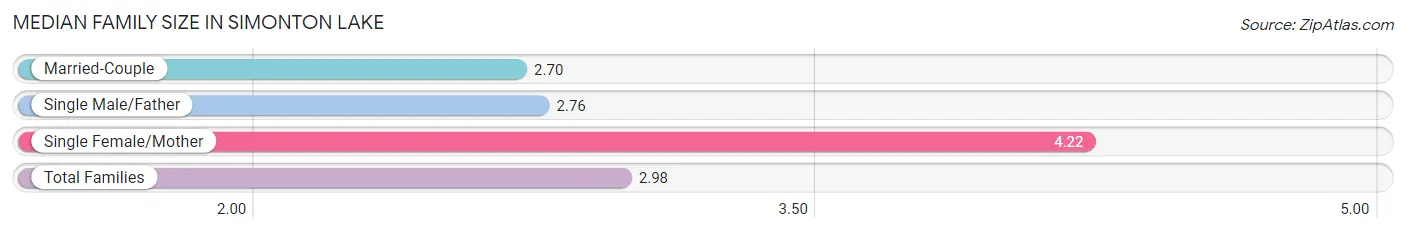
Median Family Size in Simonton Lake
The median family size in Simonton Lake is 2.98 persons per family, with single female/mother families (232 | 17.9%) accounting for the largest median family size of 4.22 persons per family. On the other hand, married-couple families (962 | 74.3%) represent the smallest median family size with 2.70 persons per family.
| Family Type | # Families | Family Size |
| Married-Couple | 962 (74.3%) | 2.70 |
| Single Male/Father | 101 (7.8%) | 2.76 |
| Single Female/Mother | 232 (17.9%) | 4.22 |
| Total Families | 1,295 (100.0%) | 2.98 |
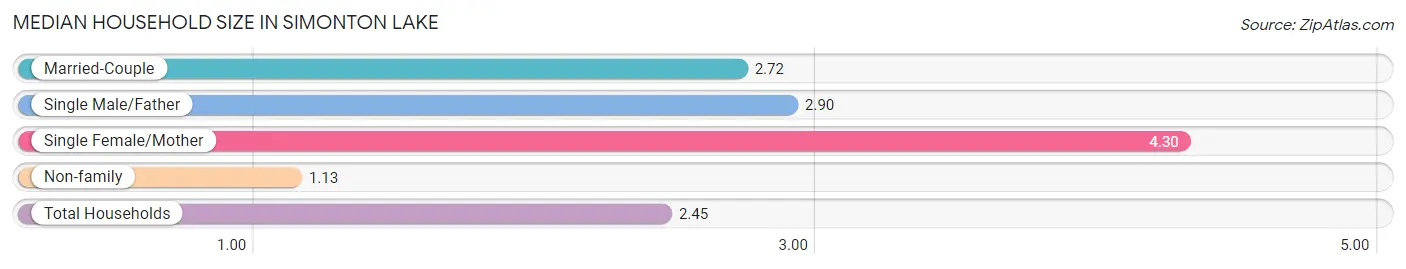
Median Household Size in Simonton Lake
The median household size in Simonton Lake is 2.45 persons per household, with single female/mother households (232 | 12.6%) accounting for the largest median household size of 4.3 persons per household. non-family households (553 | 29.9%) represent the smallest median household size with 1.13 persons per household.
| Household Type | # Households | Household Size |
| Married-Couple | 962 (52.1%) | 2.72 |
| Single Male/Father | 101 (5.5%) | 2.90 |
| Single Female/Mother | 232 (12.6%) | 4.30 |
| Non-family | 553 (29.9%) | 1.13 |
| Total Households | 1,848 (100.0%) | 2.45 |
Household Size by Marriage Status in Simonton Lake
Out of a total of 1,848 households in Simonton Lake, 1,295 (70.1%) are family households, while 553 (29.9%) are nonfamily households. The most numerous type of family households are 2-person households, comprising 752, and the most common type of nonfamily households are 1-person households, comprising 500.
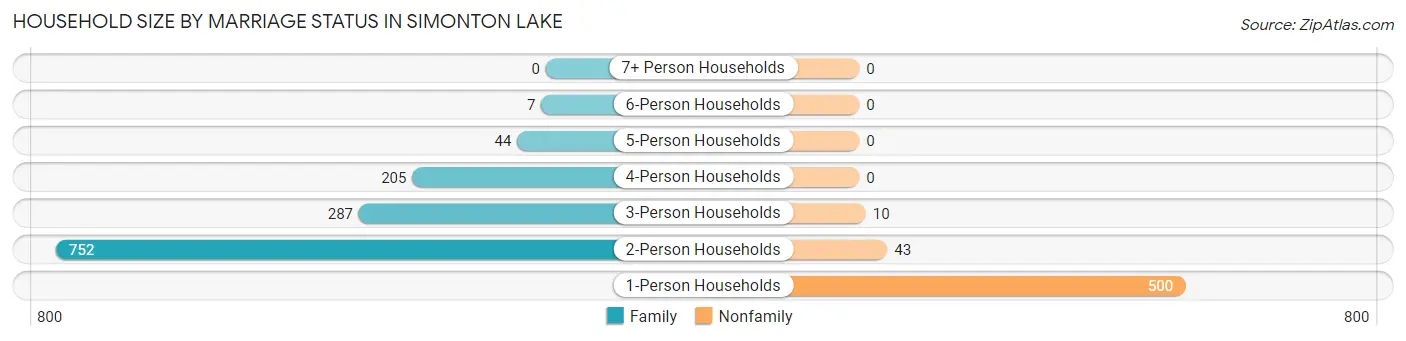
| Household Size | Family Households | Nonfamily Households |
| 1-Person Households | - | 500 (27.1%) |
| 2-Person Households | 752 (40.7%) | 43 (2.3%) |
| 3-Person Households | 287 (15.5%) | 10 (0.5%) |
| 4-Person Households | 205 (11.1%) | 0 (0.0%) |
| 5-Person Households | 44 (2.4%) | 0 (0.0%) |
| 6-Person Households | 7 (0.4%) | 0 (0.0%) |
| 7+ Person Households | 0 (0.0%) | 0 (0.0%) |
| Total | 1,295 (70.1%) | 553 (29.9%) |
Female Fertility in Simonton Lake
Fertility by Age in Simonton Lake
| Age Bracket | Women with Births | Births / 1,000 Women |
| 15 to 19 years | 0 (0.0%) | 0.0 |
| 20 to 34 years | 0 (0.0%) | 0.0 |
| 35 to 50 years | 0 (0.0%) | 0.0 |
| Total | 0 (0.0%) | 0.0 |
Fertility by Age by Marriage Status in Simonton Lake
| Age Bracket | Married | Unmarried |
| 15 to 19 years | 0 (0.0%) | 0 (0.0%) |
| 20 to 34 years | 0 (0.0%) | 0 (0.0%) |
| 35 to 50 years | 0 (0.0%) | 0 (0.0%) |
| Total | 0 (0.0%) | 0 (0.0%) |
Fertility by Education in Simonton Lake
| Educational Attainment | Women with Births | Births / 1,000 Women |
| Less than High School | 0 (0.0%) | 0.0 |
| High School Diploma | 0 (0.0%) | 0.0 |
| College or Associate's Degree | 0 (0.0%) | 0.0 |
| Bachelor's Degree | 0 (0.0%) | 0.0 |
| Graduate Degree | 0 (0.0%) | 0.0 |
| Total | 0 (0.0%) | 0.0 |
Fertility by Education by Marriage Status in Simonton Lake
| Educational Attainment | Married | Unmarried |
| Less than High School | 0 (0.0%) | 0 (0.0%) |
| High School Diploma | 0 (0.0%) | 0 (0.0%) |
| College or Associate's Degree | 0 (0.0%) | 0 (0.0%) |
| Bachelor's Degree | 0 (0.0%) | 0 (0.0%) |
| Graduate Degree | 0 (0.0%) | 0 (0.0%) |
| Total | 0 (0.0%) | 0 (0.0%) |
Employment Characteristics in Simonton Lake
Employment by Class of Employer in Simonton Lake
Among the 2,210 employed individuals in Simonton Lake, private company employees (1,539 | 69.6%), local government employees (154 | 7.0%), and not-for-profit organizations (143 | 6.5%) make up the most common classes of employment.
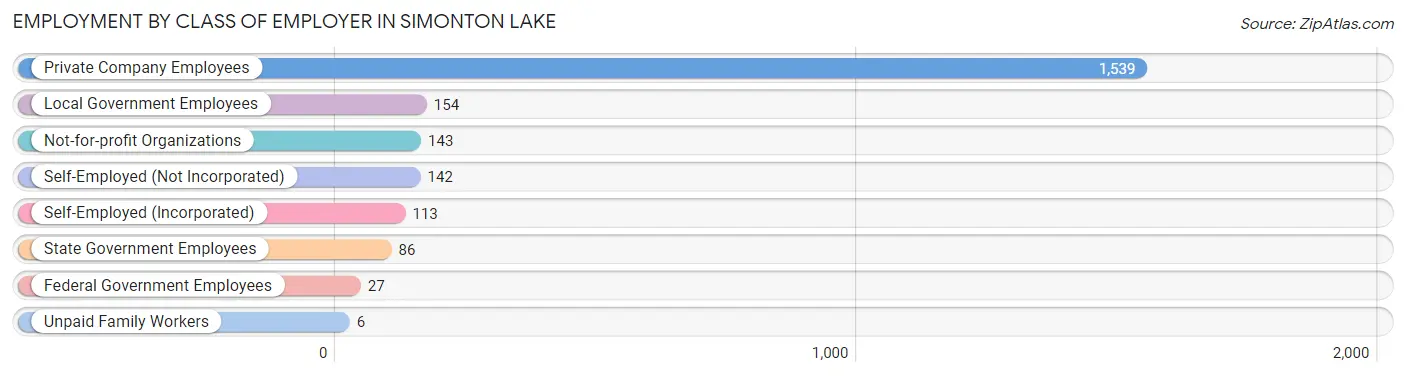
| Employer Class | # Employees | % Employees |
| Private Company Employees | 1,539 | 69.6% |
| Self-Employed (Incorporated) | 113 | 5.1% |
| Self-Employed (Not Incorporated) | 142 | 6.4% |
| Not-for-profit Organizations | 143 | 6.5% |
| Local Government Employees | 154 | 7.0% |
| State Government Employees | 86 | 3.9% |
| Federal Government Employees | 27 | 1.2% |
| Unpaid Family Workers | 6 | 0.3% |
| Total | 2,210 | 100.0% |
Employment Status by Age in Simonton Lake
According to the labor force statistics for Simonton Lake, out of the total population over 16 years of age (3,622), 64.1% or 2,322 individuals are in the labor force, with 3.6% or 84 of them unemployed. The age group with the highest labor force participation rate is 25 to 29 years, with 100.0% or 260 individuals in the labor force. Within the labor force, the 20 to 24 years age range has the highest percentage of unemployed individuals, with 28.4% or 42 of them being unemployed.
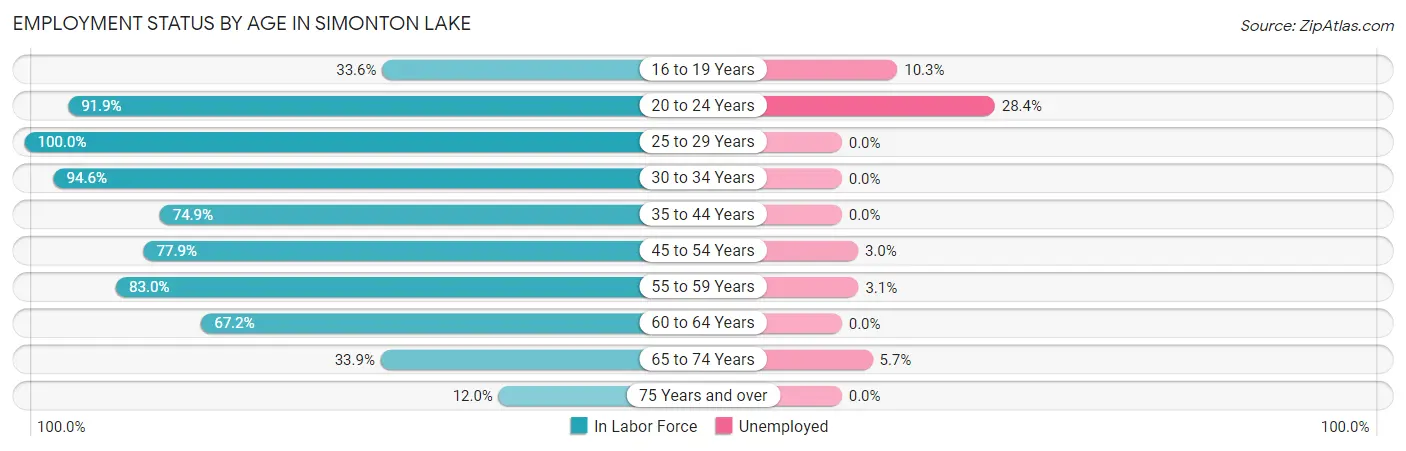
| Age Bracket | In Labor Force | Unemployed |
| 16 to 19 Years | 39 (33.6%) | 4 (10.3%) |
| 20 to 24 Years | 148 (91.9%) | 42 (28.4%) |
| 25 to 29 Years | 260 (100.0%) | 0 (0.0%) |
| 30 to 34 Years | 226 (94.6%) | 0 (0.0%) |
| 35 to 44 Years | 310 (74.9%) | 0 (0.0%) |
| 45 to 54 Years | 465 (77.9%) | 14 (3.0%) |
| 55 to 59 Years | 449 (83.0%) | 14 (3.1%) |
| 60 to 64 Years | 201 (67.2%) | 0 (0.0%) |
| 65 to 74 Years | 159 (33.9%) | 9 (5.7%) |
| 75 Years and over | 63 (12.0%) | 0 (0.0%) |
| Total | 2,322 (64.1%) | 84 (3.6%) |
Employment Status by Educational Attainment in Simonton Lake
According to labor force statistics for Simonton Lake, 81.3% of individuals (1,911) out of the total population between 25 and 64 years of age (2,350) are in the labor force, with 1.5% or 29 of them being unemployed. The group with the highest labor force participation rate are those with the educational attainment of bachelor's degree or higher, with 96.9% or 533 individuals in the labor force. Within the labor force, individuals with high school diploma education have the highest percentage of unemployment, with 3.3% or 14 of them being unemployed.
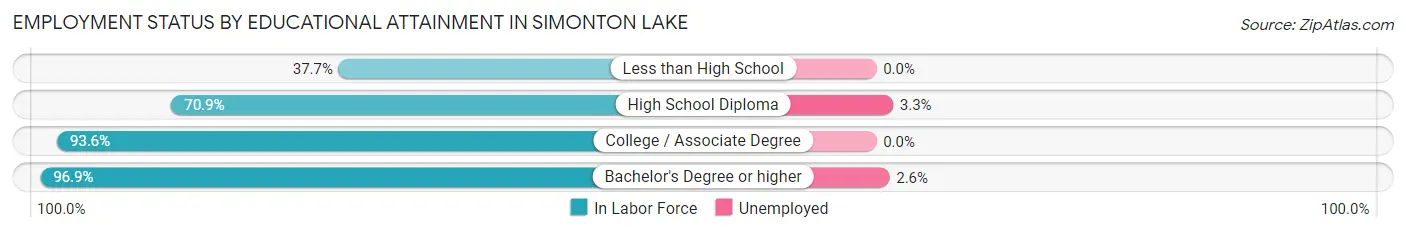
| Educational Attainment | In Labor Force | Unemployed |
| Less than High School | 115 (37.7%) | 0 (0.0%) |
| High School Diploma | 427 (70.9%) | 20 (3.3%) |
| College / Associate Degree | 836 (93.6%) | 0 (0.0%) |
| Bachelor's Degree or higher | 533 (96.9%) | 14 (2.6%) |
| Total | 1,911 (81.3%) | 35 (1.5%) |
Employment Occupations by Sex in Simonton Lake
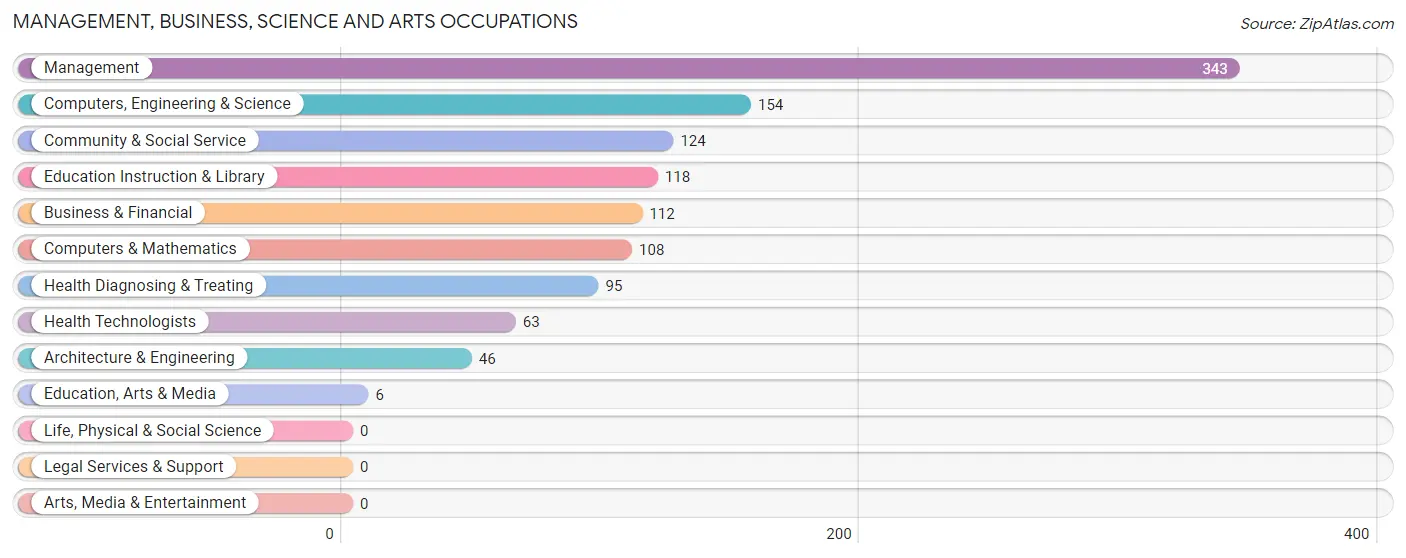
Management, Business, Science and Arts Occupations
The most common Management, Business, Science and Arts occupations in Simonton Lake are Management (343 | 15.3%), Computers, Engineering & Science (154 | 6.9%), Community & Social Service (124 | 5.5%), Education Instruction & Library (118 | 5.3%), and Business & Financial (112 | 5.0%).
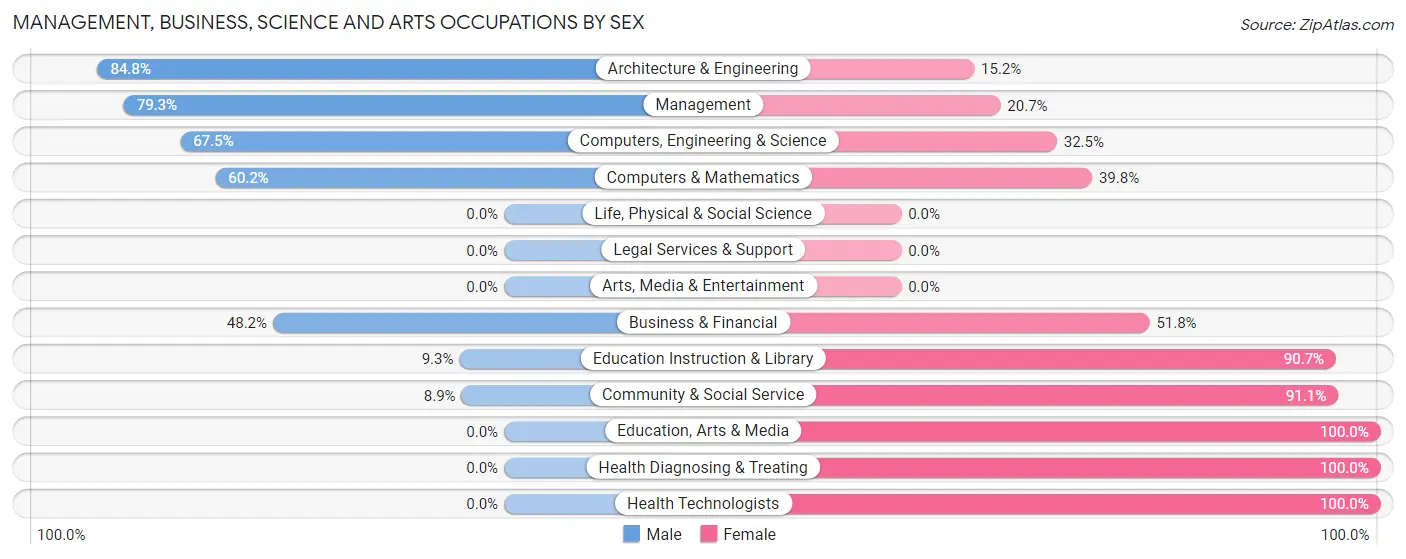
Management, Business, Science and Arts Occupations by Sex
Within the Management, Business, Science and Arts occupations in Simonton Lake, the most male-oriented occupations are Architecture & Engineering (84.8%), Management (79.3%), and Computers, Engineering & Science (67.5%), while the most female-oriented occupations are Education, Arts & Media (100.0%), Health Diagnosing & Treating (100.0%), and Health Technologists (100.0%).
| Occupation | Male | Female |
| Management | 272 (79.3%) | 71 (20.7%) |
| Business & Financial | 54 (48.2%) | 58 (51.8%) |
| Computers, Engineering & Science | 104 (67.5%) | 50 (32.5%) |
| Computers & Mathematics | 65 (60.2%) | 43 (39.8%) |
| Architecture & Engineering | 39 (84.8%) | 7 (15.2%) |
| Life, Physical & Social Science | 0 (0.0%) | 0 (0.0%) |
| Community & Social Service | 11 (8.9%) | 113 (91.1%) |
| Education, Arts & Media | 0 (0.0%) | 6 (100.0%) |
| Legal Services & Support | 0 (0.0%) | 0 (0.0%) |
| Education Instruction & Library | 11 (9.3%) | 107 (90.7%) |
| Arts, Media & Entertainment | 0 (0.0%) | 0 (0.0%) |
| Health Diagnosing & Treating | 0 (0.0%) | 95 (100.0%) |
| Health Technologists | 0 (0.0%) | 63 (100.0%) |
| Total (Category) | 441 (53.3%) | 387 (46.7%) |
| Total (Overall) | 1,153 (51.5%) | 1,084 (48.5%) |
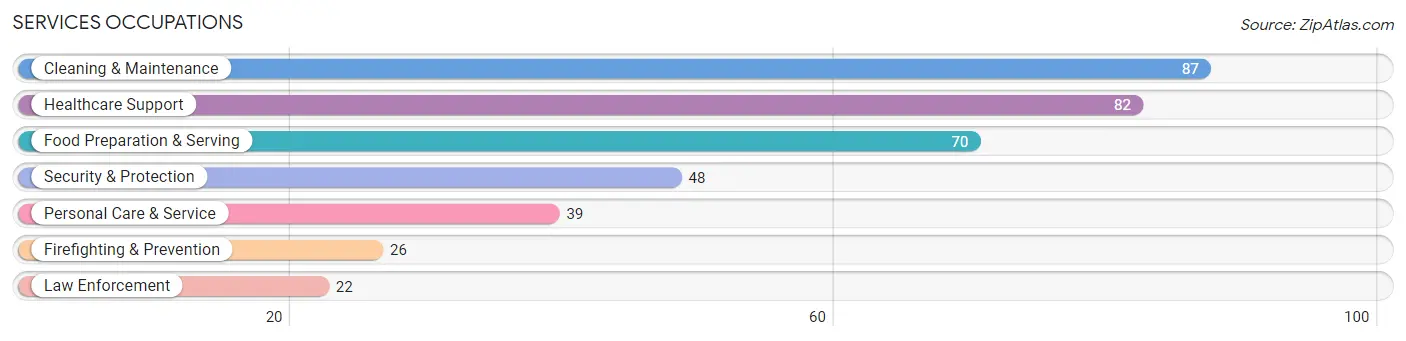
Services Occupations
The most common Services occupations in Simonton Lake are Cleaning & Maintenance (87 | 3.9%), Healthcare Support (82 | 3.7%), Food Preparation & Serving (70 | 3.1%), Security & Protection (48 | 2.1%), and Personal Care & Service (39 | 1.7%).
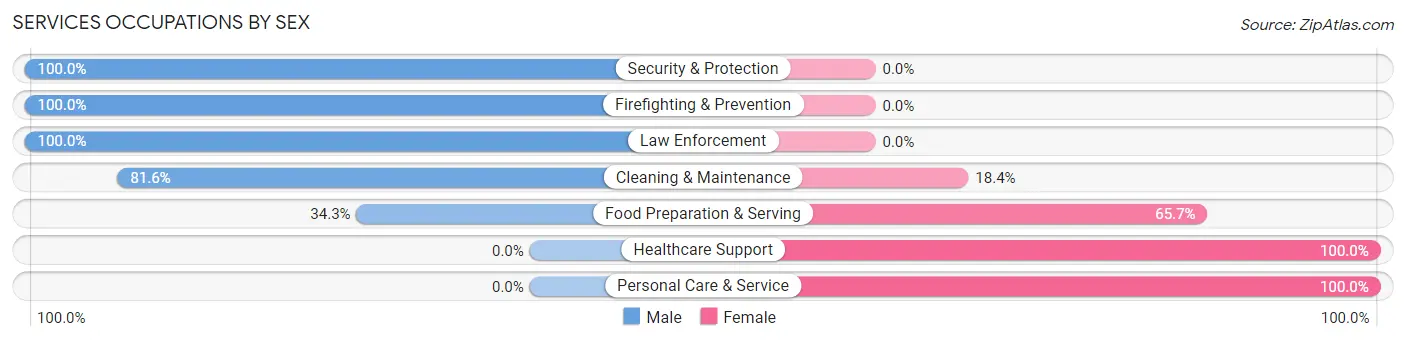
Services Occupations by Sex
Within the Services occupations in Simonton Lake, the most male-oriented occupations are Security & Protection (100.0%), Firefighting & Prevention (100.0%), and Law Enforcement (100.0%), while the most female-oriented occupations are Healthcare Support (100.0%), Personal Care & Service (100.0%), and Food Preparation & Serving (65.7%).
| Occupation | Male | Female |
| Healthcare Support | 0 (0.0%) | 82 (100.0%) |
| Security & Protection | 48 (100.0%) | 0 (0.0%) |
| Firefighting & Prevention | 26 (100.0%) | 0 (0.0%) |
| Law Enforcement | 22 (100.0%) | 0 (0.0%) |
| Food Preparation & Serving | 24 (34.3%) | 46 (65.7%) |
| Cleaning & Maintenance | 71 (81.6%) | 16 (18.4%) |
| Personal Care & Service | 0 (0.0%) | 39 (100.0%) |
| Total (Category) | 143 (43.9%) | 183 (56.1%) |
| Total (Overall) | 1,153 (51.5%) | 1,084 (48.5%) |
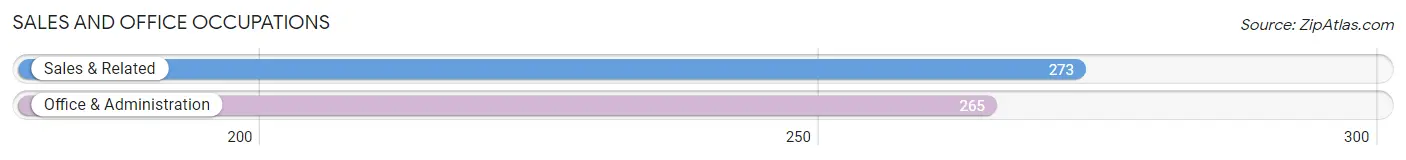
Sales and Office Occupations
The most common Sales and Office occupations in Simonton Lake are Sales & Related (273 | 12.2%), and Office & Administration (265 | 11.8%).
Sales and Office Occupations by Sex
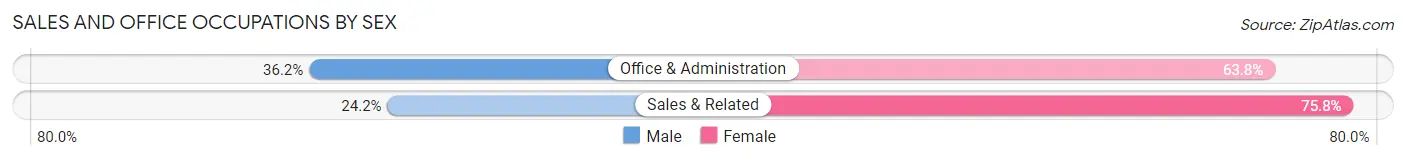
| Occupation | Male | Female |
| Sales & Related | 66 (24.2%) | 207 (75.8%) |
| Office & Administration | 96 (36.2%) | 169 (63.8%) |
| Total (Category) | 162 (30.1%) | 376 (69.9%) |
| Total (Overall) | 1,153 (51.5%) | 1,084 (48.5%) |
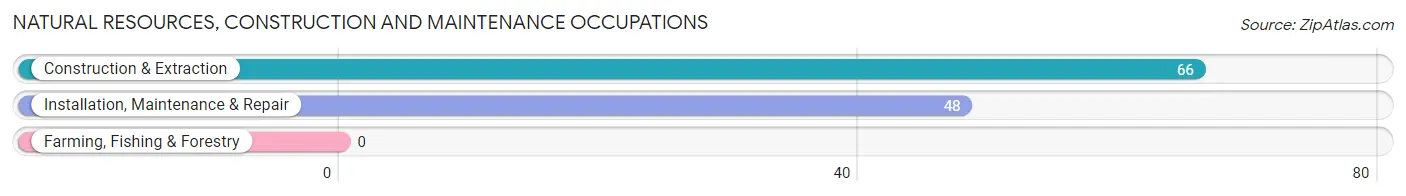
Natural Resources, Construction and Maintenance Occupations
The most common Natural Resources, Construction and Maintenance occupations in Simonton Lake are Construction & Extraction (66 | 2.9%), and Installation, Maintenance & Repair (48 | 2.1%).
Natural Resources, Construction and Maintenance Occupations by Sex
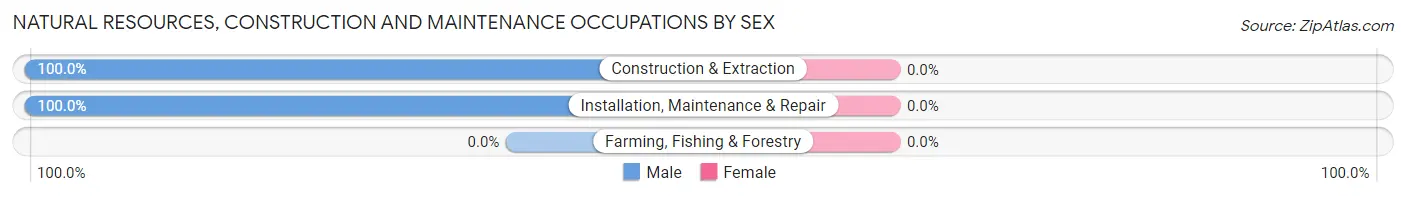
| Occupation | Male | Female |
| Farming, Fishing & Forestry | 0 (0.0%) | 0 (0.0%) |
| Construction & Extraction | 66 (100.0%) | 0 (0.0%) |
| Installation, Maintenance & Repair | 48 (100.0%) | 0 (0.0%) |
| Total (Category) | 114 (100.0%) | 0 (0.0%) |
| Total (Overall) | 1,153 (51.5%) | 1,084 (48.5%) |
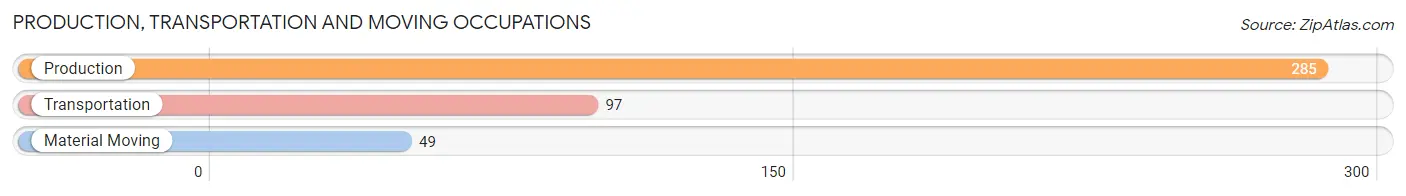
Production, Transportation and Moving Occupations
The most common Production, Transportation and Moving occupations in Simonton Lake are Production (285 | 12.7%), Transportation (97 | 4.3%), and Material Moving (49 | 2.2%).
Production, Transportation and Moving Occupations by Sex
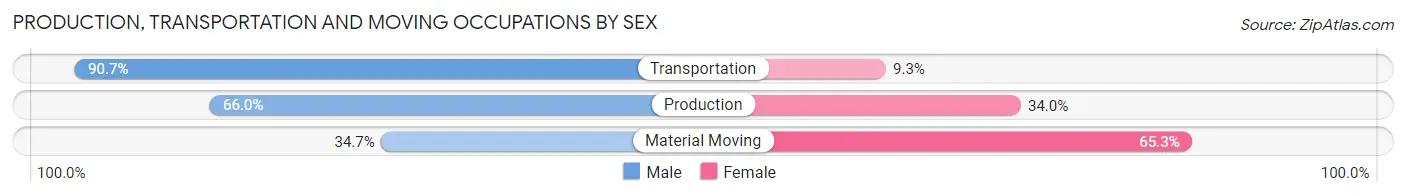
| Occupation | Male | Female |
| Production | 188 (66.0%) | 97 (34.0%) |
| Transportation | 88 (90.7%) | 9 (9.3%) |
| Material Moving | 17 (34.7%) | 32 (65.3%) |
| Total (Category) | 293 (68.0%) | 138 (32.0%) |
| Total (Overall) | 1,153 (51.5%) | 1,084 (48.5%) |
Employment Industries by Sex in Simonton Lake
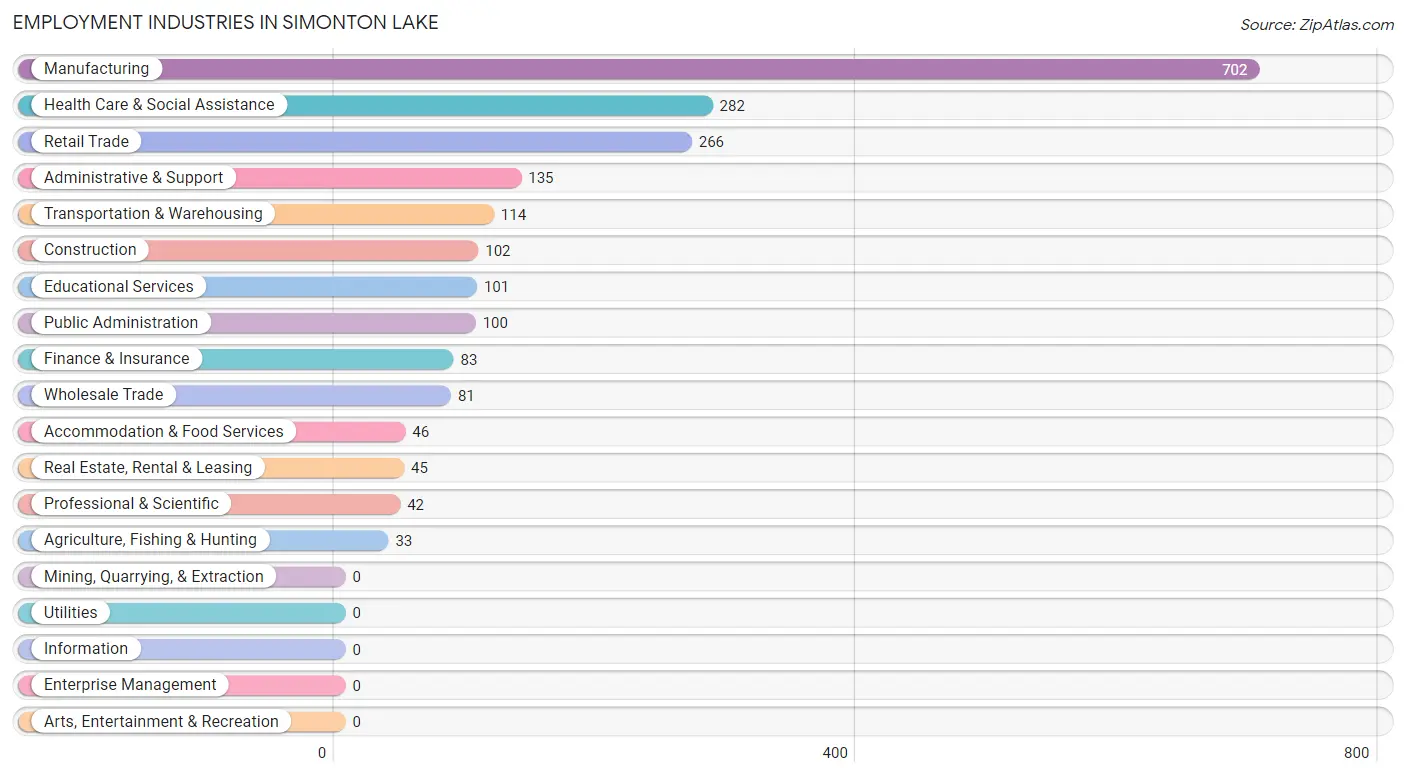
Employment Industries in Simonton Lake
The major employment industries in Simonton Lake include Manufacturing (702 | 31.4%), Health Care & Social Assistance (282 | 12.6%), Retail Trade (266 | 11.9%), Administrative & Support (135 | 6.0%), and Transportation & Warehousing (114 | 5.1%).
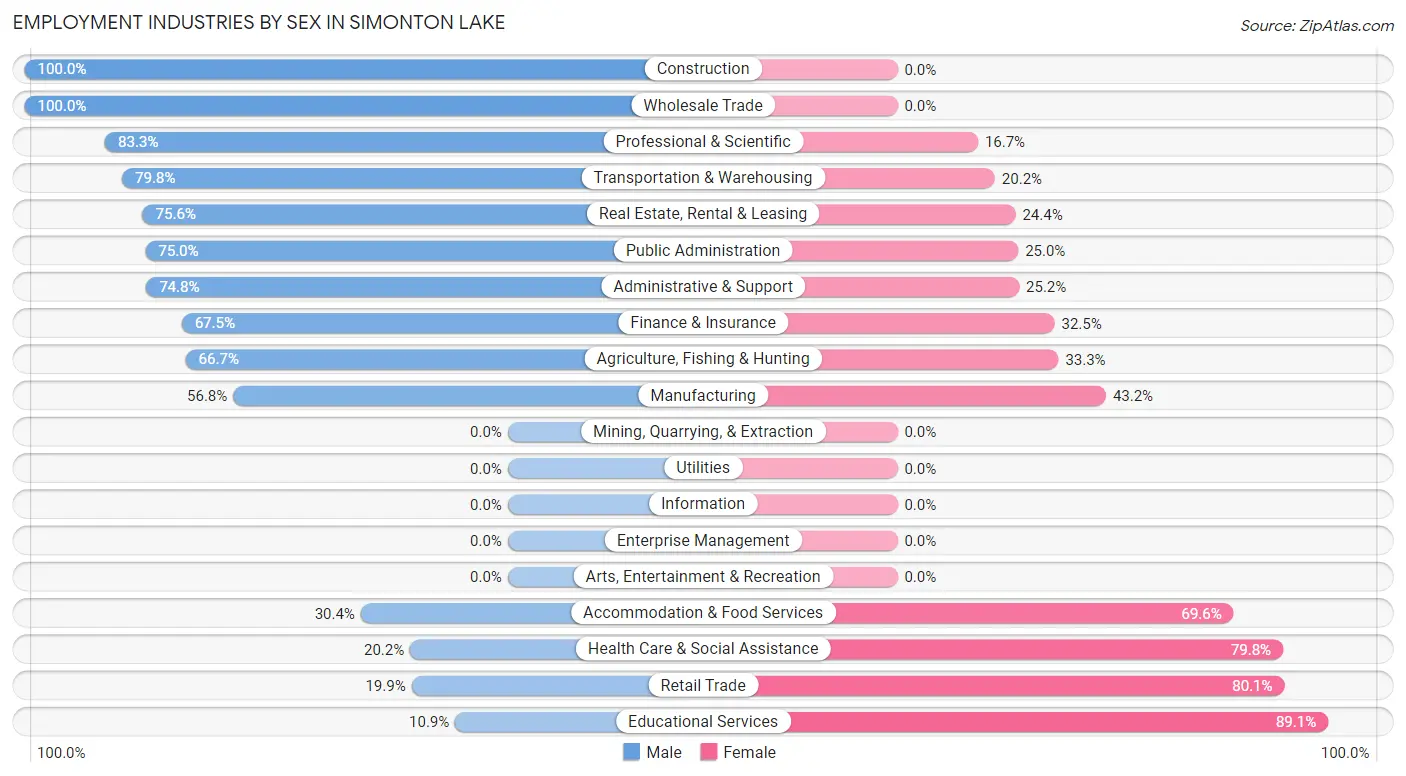
Employment Industries by Sex in Simonton Lake
The Simonton Lake industries that see more men than women are Construction (100.0%), Wholesale Trade (100.0%), and Professional & Scientific (83.3%), whereas the industries that tend to have a higher number of women are Educational Services (89.1%), Retail Trade (80.1%), and Health Care & Social Assistance (79.8%).
| Industry | Male | Female |
| Agriculture, Fishing & Hunting | 22 (66.7%) | 11 (33.3%) |
| Mining, Quarrying, & Extraction | 0 (0.0%) | 0 (0.0%) |
| Construction | 102 (100.0%) | 0 (0.0%) |
| Manufacturing | 399 (56.8%) | 303 (43.2%) |
| Wholesale Trade | 81 (100.0%) | 0 (0.0%) |
| Retail Trade | 53 (19.9%) | 213 (80.1%) |
| Transportation & Warehousing | 91 (79.8%) | 23 (20.2%) |
| Utilities | 0 (0.0%) | 0 (0.0%) |
| Information | 0 (0.0%) | 0 (0.0%) |
| Finance & Insurance | 56 (67.5%) | 27 (32.5%) |
| Real Estate, Rental & Leasing | 34 (75.6%) | 11 (24.4%) |
| Professional & Scientific | 35 (83.3%) | 7 (16.7%) |
| Enterprise Management | 0 (0.0%) | 0 (0.0%) |
| Administrative & Support | 101 (74.8%) | 34 (25.2%) |
| Educational Services | 11 (10.9%) | 90 (89.1%) |
| Health Care & Social Assistance | 57 (20.2%) | 225 (79.8%) |
| Arts, Entertainment & Recreation | 0 (0.0%) | 0 (0.0%) |
| Accommodation & Food Services | 14 (30.4%) | 32 (69.6%) |
| Public Administration | 75 (75.0%) | 25 (25.0%) |
| Total | 1,153 (51.5%) | 1,084 (48.5%) |
Education in Simonton Lake
School Enrollment in Simonton Lake
The most common levels of schooling among the 1,045 students in Simonton Lake are high school (293 | 28.0%), elementary school (245 | 23.4%), and middle school (225 | 21.5%).
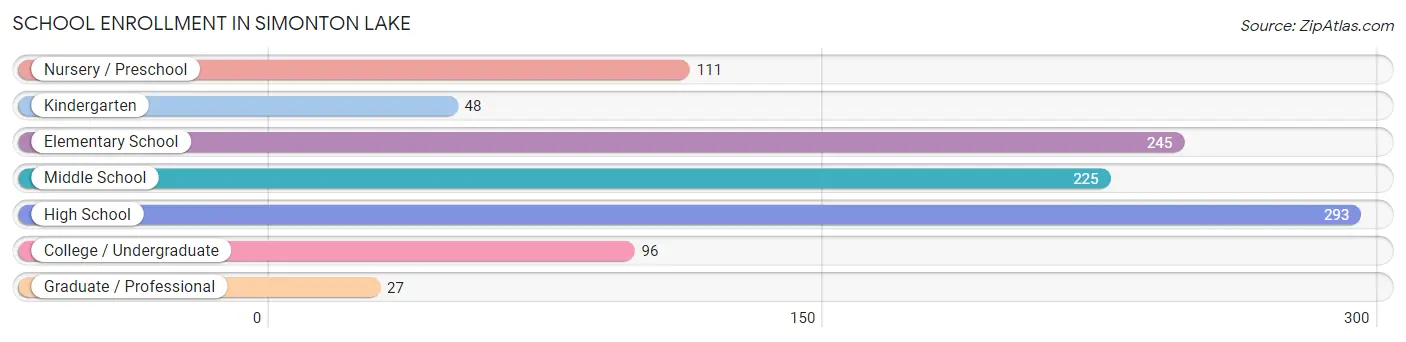
| School Level | # Students | % Students |
| Nursery / Preschool | 111 | 10.6% |
| Kindergarten | 48 | 4.6% |
| Elementary School | 245 | 23.4% |
| Middle School | 225 | 21.5% |
| High School | 293 | 28.0% |
| College / Undergraduate | 96 | 9.2% |
| Graduate / Professional | 27 | 2.6% |
| Total | 1,045 | 100.0% |
School Enrollment by Age by Funding Source in Simonton Lake
Out of a total of 1,045 students who are enrolled in schools in Simonton Lake, 140 (13.4%) attend a private institution, while the remaining 905 (86.6%) are enrolled in public schools. The age group of 3 to 4 year olds has the highest likelihood of being enrolled in private schools, with 75 (75.8% in the age bracket) enrolled. Conversely, the age group of 10 to 14 year olds has the lowest likelihood of being enrolled in a private school, with 306 (100.0% in the age bracket) attending a public institution.
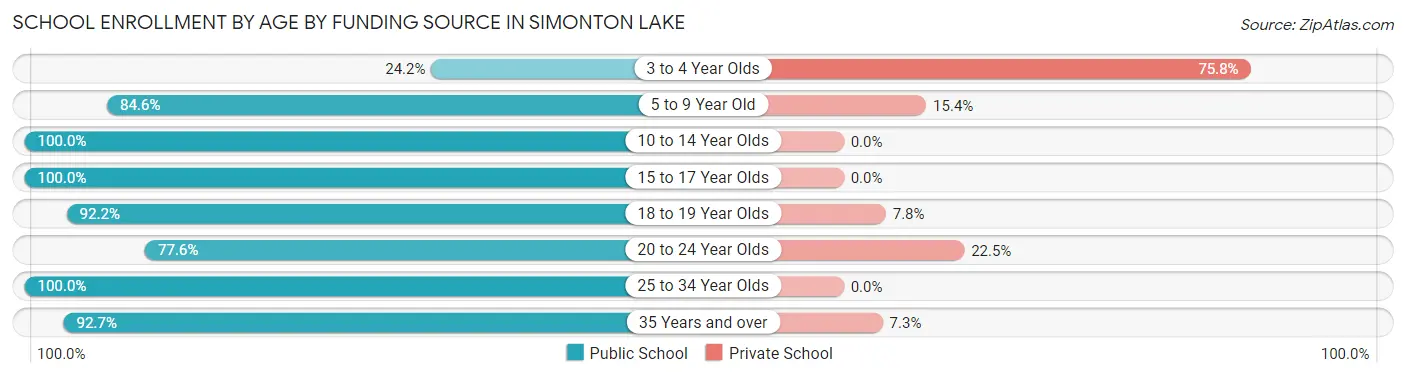
| Age Bracket | Public School | Private School |
| 3 to 4 Year Olds | 24 (24.2%) | 75 (75.8%) |
| 5 to 9 Year Old | 226 (84.6%) | 41 (15.4%) |
| 10 to 14 Year Olds | 306 (100.0%) | 0 (0.0%) |
| 15 to 17 Year Olds | 124 (100.0%) | 0 (0.0%) |
| 18 to 19 Year Olds | 47 (92.2%) | 4 (7.8%) |
| 20 to 24 Year Olds | 38 (77.5%) | 11 (22.5%) |
| 25 to 34 Year Olds | 25 (100.0%) | 0 (0.0%) |
| 35 Years and over | 115 (92.7%) | 9 (7.3%) |
| Total | 905 (86.6%) | 140 (13.4%) |
Educational Attainment by Field of Study in Simonton Lake
Business (226 | 27.8%), education (127 | 15.6%), science & technology (116 | 14.3%), social sciences (59 | 7.3%), and engineering (51 | 6.3%) are the most common fields of study among 813 individuals in Simonton Lake who have obtained a bachelor's degree or higher.
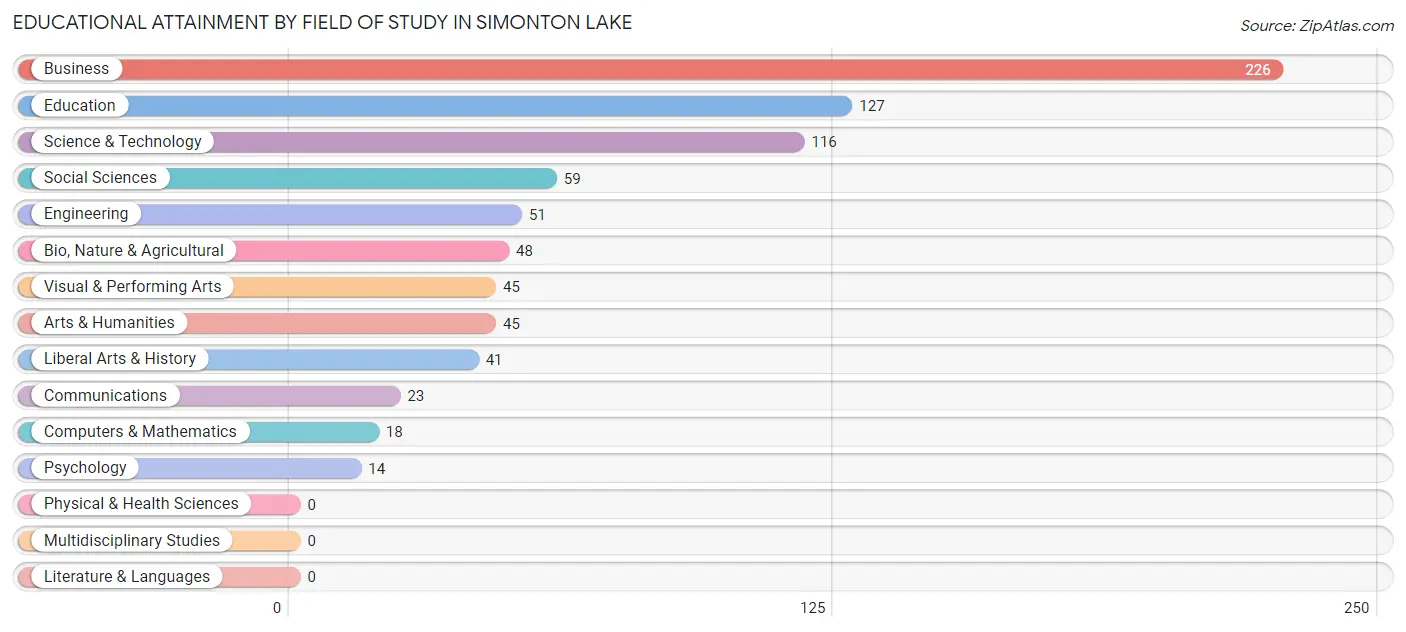
| Field of Study | # Graduates | % Graduates |
| Computers & Mathematics | 18 | 2.2% |
| Bio, Nature & Agricultural | 48 | 5.9% |
| Physical & Health Sciences | 0 | 0.0% |
| Psychology | 14 | 1.7% |
| Social Sciences | 59 | 7.3% |
| Engineering | 51 | 6.3% |
| Multidisciplinary Studies | 0 | 0.0% |
| Science & Technology | 116 | 14.3% |
| Business | 226 | 27.8% |
| Education | 127 | 15.6% |
| Literature & Languages | 0 | 0.0% |
| Liberal Arts & History | 41 | 5.0% |
| Visual & Performing Arts | 45 | 5.5% |
| Communications | 23 | 2.8% |
| Arts & Humanities | 45 | 5.5% |
| Total | 813 | 100.0% |
Transportation & Commute in Simonton Lake
Vehicle Availability by Sex in Simonton Lake
The most prevalent vehicle ownership categories in Simonton Lake are males with 2 vehicles (554, accounting for 49.2%) and females with 2 vehicles (514, making up 51.1%).
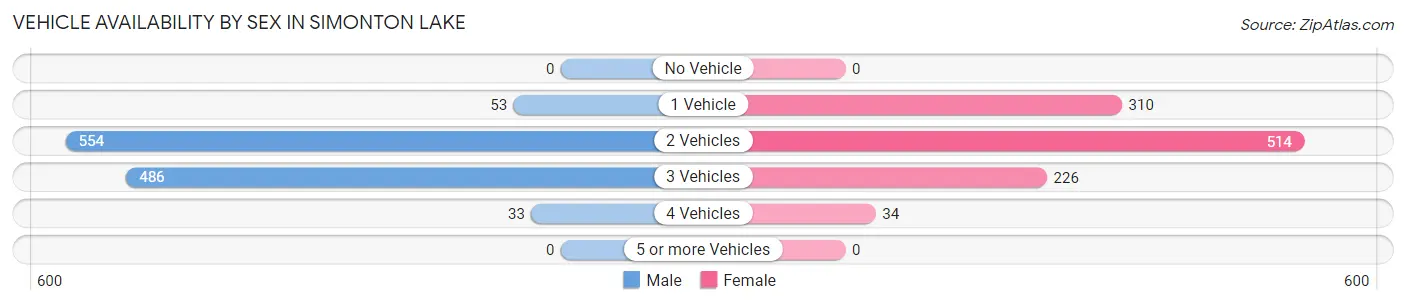
| Vehicles Available | Male | Female |
| No Vehicle | 0 (0.0%) | 0 (0.0%) |
| 1 Vehicle | 53 (4.7%) | 310 (28.6%) |
| 2 Vehicles | 554 (49.2%) | 514 (47.4%) |
| 3 Vehicles | 486 (43.2%) | 226 (20.8%) |
| 4 Vehicles | 33 (2.9%) | 34 (3.1%) |
| 5 or more Vehicles | 0 (0.0%) | 0 (0.0%) |
| Total | 1,126 (100.0%) | 1,084 (100.0%) |
Commute Time in Simonton Lake
The most frequently occuring commute durations in Simonton Lake are 15 to 19 minutes (582 commuters, 28.7%), 10 to 14 minutes (328 commuters, 16.2%), and 5 to 9 minutes (310 commuters, 15.3%).
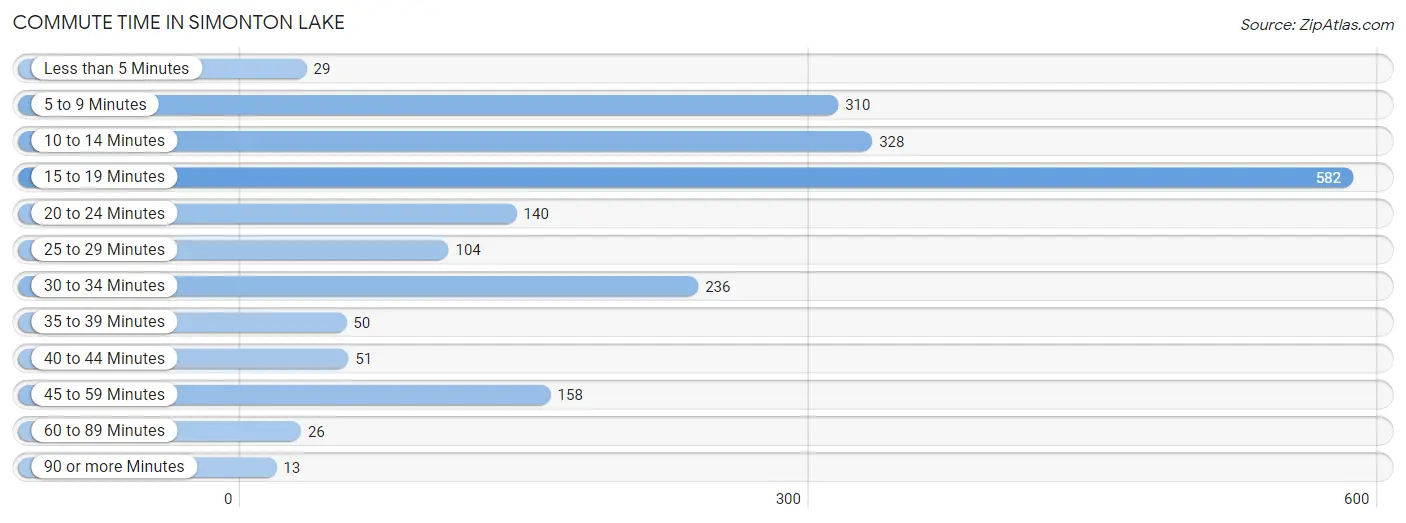
| Commute Time | # Commuters | % Commuters |
| Less than 5 Minutes | 29 | 1.4% |
| 5 to 9 Minutes | 310 | 15.3% |
| 10 to 14 Minutes | 328 | 16.2% |
| 15 to 19 Minutes | 582 | 28.7% |
| 20 to 24 Minutes | 140 | 6.9% |
| 25 to 29 Minutes | 104 | 5.1% |
| 30 to 34 Minutes | 236 | 11.6% |
| 35 to 39 Minutes | 50 | 2.5% |
| 40 to 44 Minutes | 51 | 2.5% |
| 45 to 59 Minutes | 158 | 7.8% |
| 60 to 89 Minutes | 26 | 1.3% |
| 90 or more Minutes | 13 | 0.6% |
Commute Time by Sex in Simonton Lake
The most common commute times in Simonton Lake are 10 to 14 minutes (234 commuters, 22.7%) for males and 15 to 19 minutes (392 commuters, 39.3%) for females.
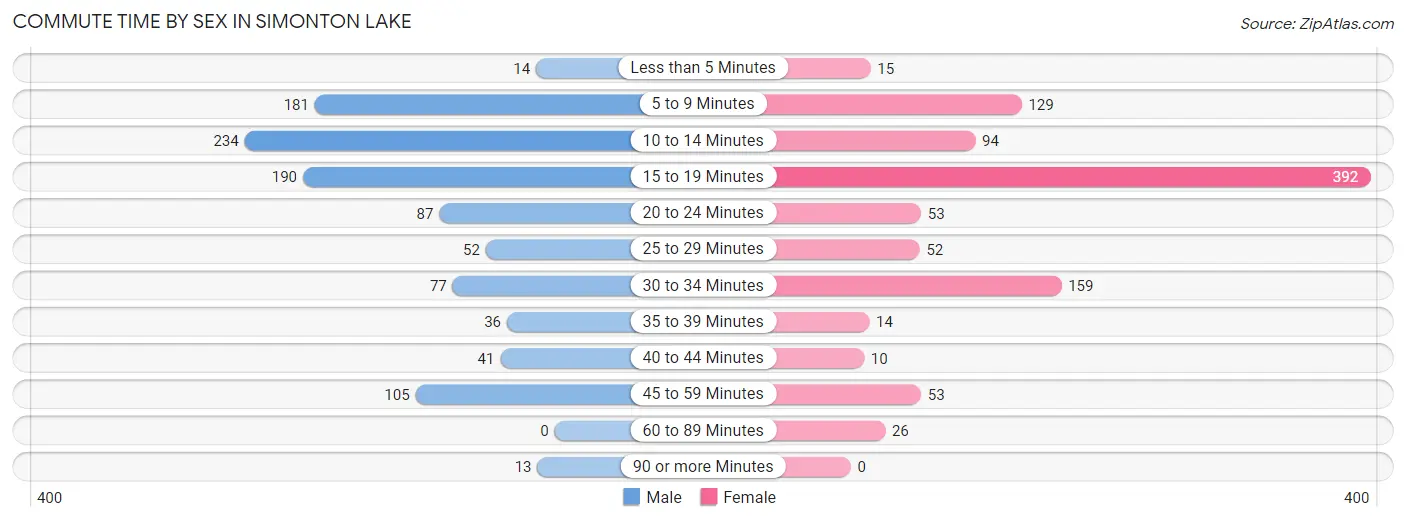
| Commute Time | Male | Female |
| Less than 5 Minutes | 14 (1.4%) | 15 (1.5%) |
| 5 to 9 Minutes | 181 (17.6%) | 129 (12.9%) |
| 10 to 14 Minutes | 234 (22.7%) | 94 (9.4%) |
| 15 to 19 Minutes | 190 (18.4%) | 392 (39.3%) |
| 20 to 24 Minutes | 87 (8.5%) | 53 (5.3%) |
| 25 to 29 Minutes | 52 (5.1%) | 52 (5.2%) |
| 30 to 34 Minutes | 77 (7.5%) | 159 (16.0%) |
| 35 to 39 Minutes | 36 (3.5%) | 14 (1.4%) |
| 40 to 44 Minutes | 41 (4.0%) | 10 (1.0%) |
| 45 to 59 Minutes | 105 (10.2%) | 53 (5.3%) |
| 60 to 89 Minutes | 0 (0.0%) | 26 (2.6%) |
| 90 or more Minutes | 13 (1.3%) | 0 (0.0%) |
Time of Departure to Work by Sex in Simonton Lake
The most frequent times of departure to work in Simonton Lake are 6:30 AM to 6:59 AM (229, 22.2%) for males and 7:30 AM to 7:59 AM (203, 20.4%) for females.
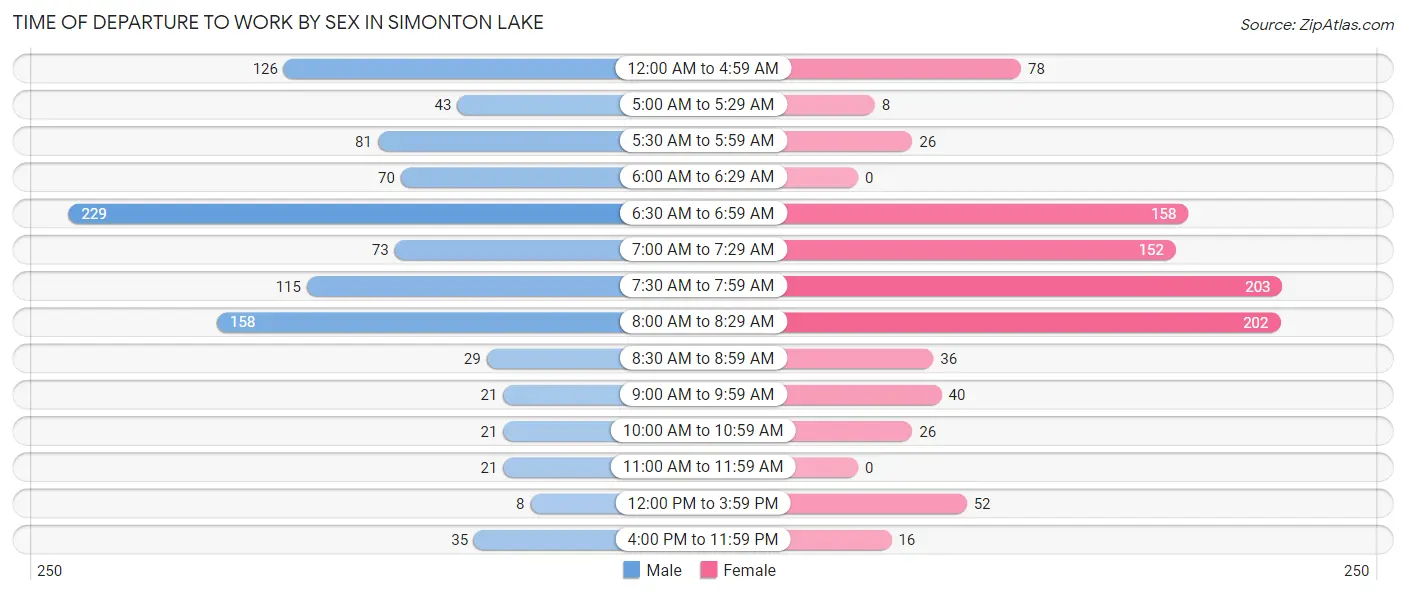
| Time of Departure | Male | Female |
| 12:00 AM to 4:59 AM | 126 (12.2%) | 78 (7.8%) |
| 5:00 AM to 5:29 AM | 43 (4.2%) | 8 (0.8%) |
| 5:30 AM to 5:59 AM | 81 (7.9%) | 26 (2.6%) |
| 6:00 AM to 6:29 AM | 70 (6.8%) | 0 (0.0%) |
| 6:30 AM to 6:59 AM | 229 (22.2%) | 158 (15.9%) |
| 7:00 AM to 7:29 AM | 73 (7.1%) | 152 (15.2%) |
| 7:30 AM to 7:59 AM | 115 (11.2%) | 203 (20.4%) |
| 8:00 AM to 8:29 AM | 158 (15.3%) | 202 (20.3%) |
| 8:30 AM to 8:59 AM | 29 (2.8%) | 36 (3.6%) |
| 9:00 AM to 9:59 AM | 21 (2.0%) | 40 (4.0%) |
| 10:00 AM to 10:59 AM | 21 (2.0%) | 26 (2.6%) |
| 11:00 AM to 11:59 AM | 21 (2.0%) | 0 (0.0%) |
| 12:00 PM to 3:59 PM | 8 (0.8%) | 52 (5.2%) |
| 4:00 PM to 11:59 PM | 35 (3.4%) | 16 (1.6%) |
| Total | 1,030 (100.0%) | 997 (100.0%) |
Housing Occupancy in Simonton Lake
Occupancy by Ownership in Simonton Lake
Of the total 1,848 dwellings in Simonton Lake, owner-occupied units account for 1,451 (78.5%), while renter-occupied units make up 397 (21.5%).
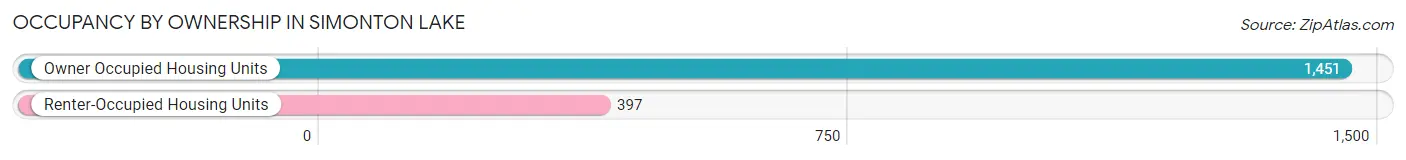
| Occupancy | # Housing Units | % Housing Units |
| Owner Occupied Housing Units | 1,451 | 78.5% |
| Renter-Occupied Housing Units | 397 | 21.5% |
| Total Occupied Housing Units | 1,848 | 100.0% |
Occupancy by Household Size in Simonton Lake
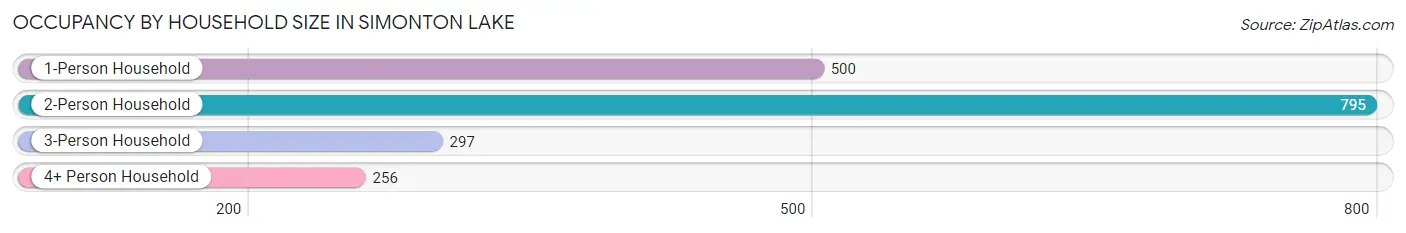
| Household Size | # Housing Units | % Housing Units |
| 1-Person Household | 500 | 27.1% |
| 2-Person Household | 795 | 43.0% |
| 3-Person Household | 297 | 16.1% |
| 4+ Person Household | 256 | 13.9% |
| Total Housing Units | 1,848 | 100.0% |
Occupancy by Ownership by Household Size in Simonton Lake
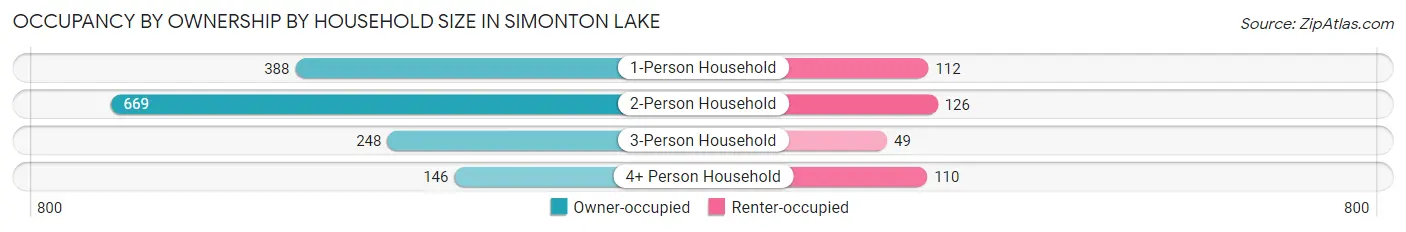
| Household Size | Owner-occupied | Renter-occupied |
| 1-Person Household | 388 (77.6%) | 112 (22.4%) |
| 2-Person Household | 669 (84.2%) | 126 (15.9%) |
| 3-Person Household | 248 (83.5%) | 49 (16.5%) |
| 4+ Person Household | 146 (57.0%) | 110 (43.0%) |
| Total Housing Units | 1,451 (78.5%) | 397 (21.5%) |
Occupancy by Educational Attainment in Simonton Lake
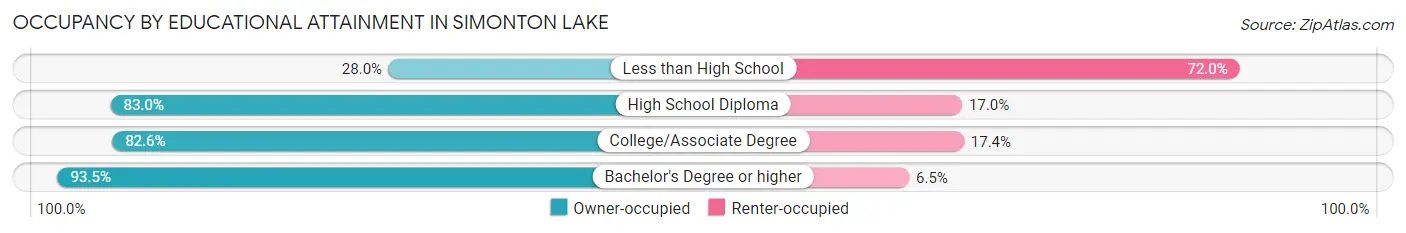
| Household Size | Owner-occupied | Renter-occupied |
| Less than High School | 66 (28.0%) | 170 (72.0%) |
| High School Diploma | 404 (83.0%) | 83 (17.0%) |
| College/Associate Degree | 537 (82.6%) | 113 (17.4%) |
| Bachelor's Degree or higher | 444 (93.5%) | 31 (6.5%) |
Occupancy by Age of Householder in Simonton Lake
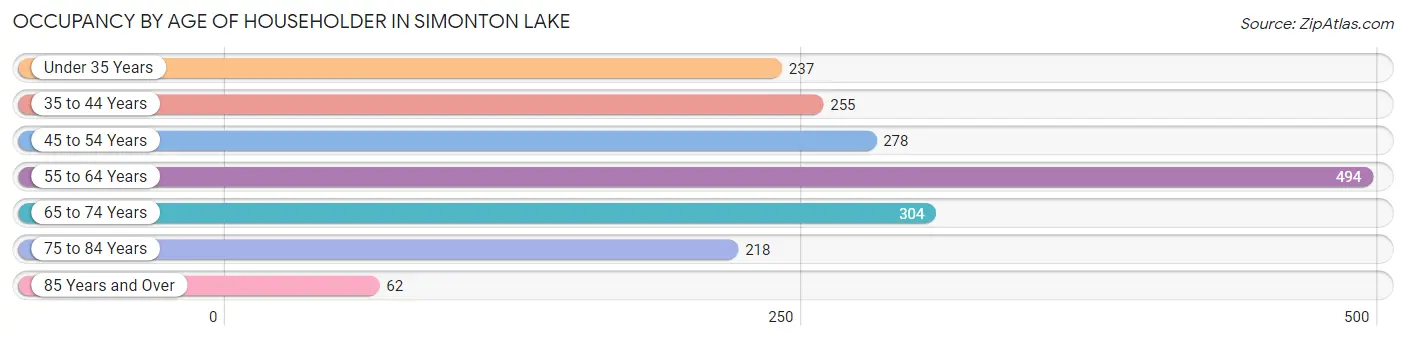
| Age Bracket | # Households | % Households |
| Under 35 Years | 237 | 12.8% |
| 35 to 44 Years | 255 | 13.8% |
| 45 to 54 Years | 278 | 15.0% |
| 55 to 64 Years | 494 | 26.7% |
| 65 to 74 Years | 304 | 16.5% |
| 75 to 84 Years | 218 | 11.8% |
| 85 Years and Over | 62 | 3.4% |
| Total | 1,848 | 100.0% |
Housing Finances in Simonton Lake
Median Income by Occupancy in Simonton Lake
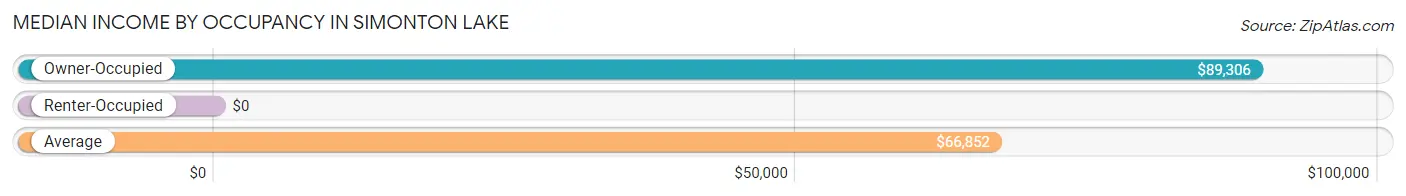
| Occupancy Type | # Households | Median Income |
| Owner-Occupied | 1,451 (78.5%) | $89,306 |
| Renter-Occupied | 397 (21.5%) | $0 |
| Average | 1,848 (100.0%) | $66,852 |
Occupancy by Householder Income Bracket in Simonton Lake
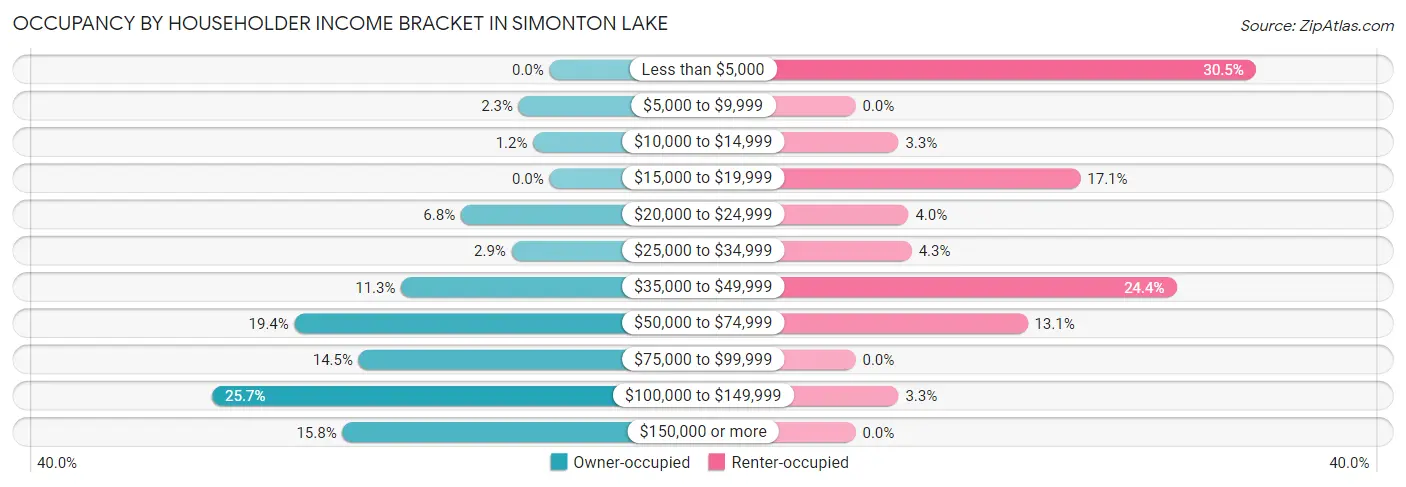
| Income Bracket | Owner-occupied | Renter-occupied |
| Less than $5,000 | 0 (0.0%) | 121 (30.5%) |
| $5,000 to $9,999 | 34 (2.3%) | 0 (0.0%) |
| $10,000 to $14,999 | 18 (1.2%) | 13 (3.3%) |
| $15,000 to $19,999 | 0 (0.0%) | 68 (17.1%) |
| $20,000 to $24,999 | 98 (6.8%) | 16 (4.0%) |
| $25,000 to $34,999 | 42 (2.9%) | 17 (4.3%) |
| $35,000 to $49,999 | 164 (11.3%) | 97 (24.4%) |
| $50,000 to $74,999 | 282 (19.4%) | 52 (13.1%) |
| $75,000 to $99,999 | 211 (14.5%) | 0 (0.0%) |
| $100,000 to $149,999 | 373 (25.7%) | 13 (3.3%) |
| $150,000 or more | 229 (15.8%) | 0 (0.0%) |
| Total | 1,451 (100.0%) | 397 (100.0%) |
Monthly Housing Cost Tiers in Simonton Lake
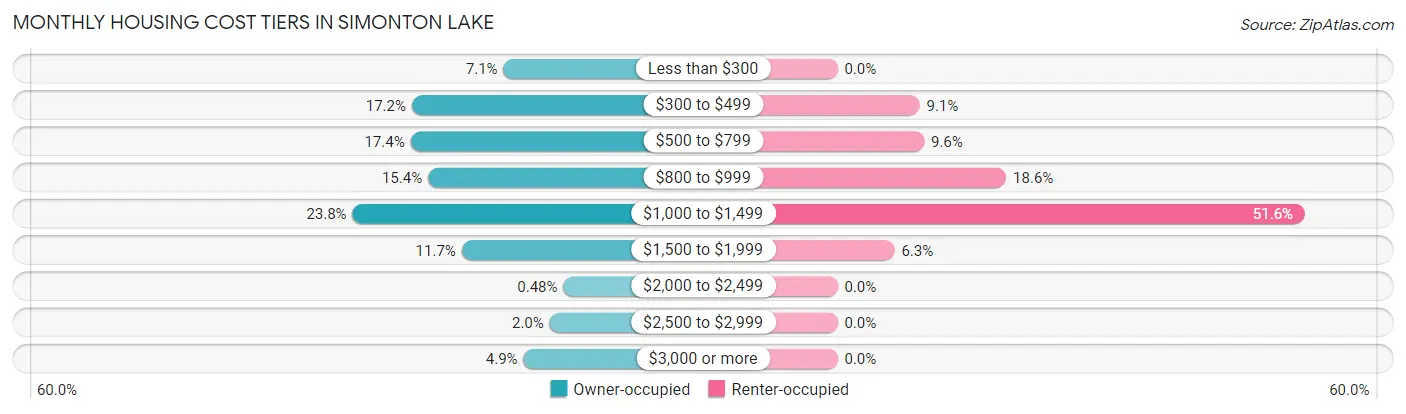
| Monthly Cost | Owner-occupied | Renter-occupied |
| Less than $300 | 103 (7.1%) | 0 (0.0%) |
| $300 to $499 | 250 (17.2%) | 36 (9.1%) |
| $500 to $799 | 252 (17.4%) | 38 (9.6%) |
| $800 to $999 | 224 (15.4%) | 74 (18.6%) |
| $1,000 to $1,499 | 345 (23.8%) | 205 (51.6%) |
| $1,500 to $1,999 | 170 (11.7%) | 25 (6.3%) |
| $2,000 to $2,499 | 7 (0.5%) | 0 (0.0%) |
| $2,500 to $2,999 | 29 (2.0%) | 0 (0.0%) |
| $3,000 or more | 71 (4.9%) | 0 (0.0%) |
| Total | 1,451 (100.0%) | 397 (100.0%) |
Physical Housing Characteristics in Simonton Lake
Housing Structures in Simonton Lake
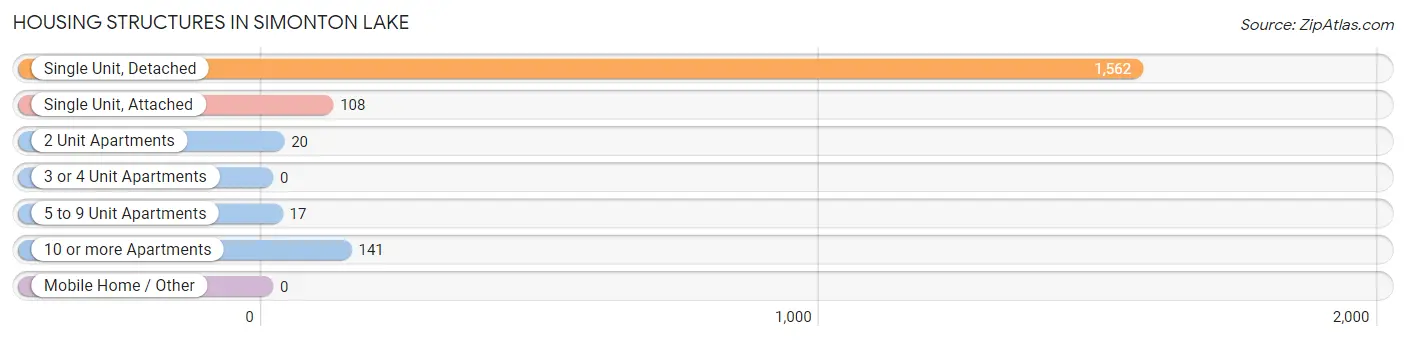
| Structure Type | # Housing Units | % Housing Units |
| Single Unit, Detached | 1,562 | 84.5% |
| Single Unit, Attached | 108 | 5.8% |
| 2 Unit Apartments | 20 | 1.1% |
| 3 or 4 Unit Apartments | 0 | 0.0% |
| 5 to 9 Unit Apartments | 17 | 0.9% |
| 10 or more Apartments | 141 | 7.6% |
| Mobile Home / Other | 0 | 0.0% |
| Total | 1,848 | 100.0% |
Housing Structures by Occupancy in Simonton Lake
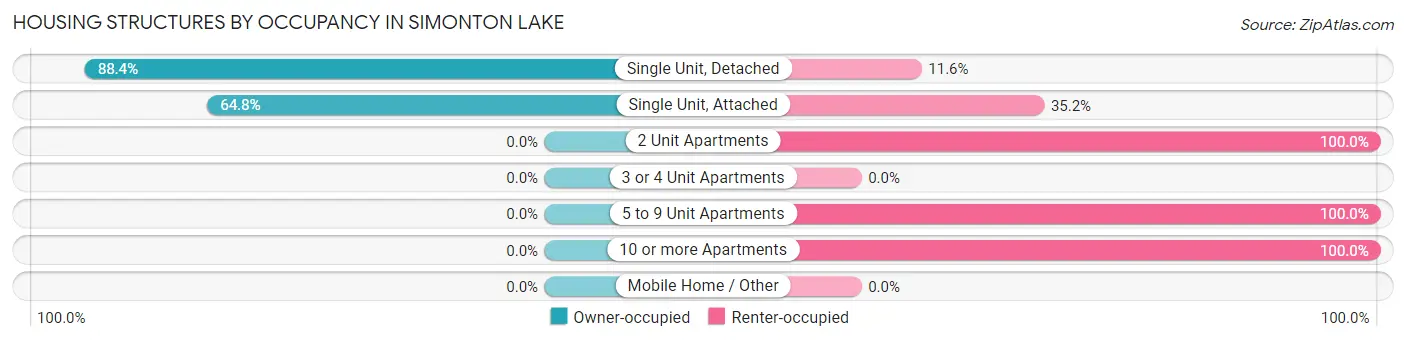
| Structure Type | Owner-occupied | Renter-occupied |
| Single Unit, Detached | 1,381 (88.4%) | 181 (11.6%) |
| Single Unit, Attached | 70 (64.8%) | 38 (35.2%) |
| 2 Unit Apartments | 0 (0.0%) | 20 (100.0%) |
| 3 or 4 Unit Apartments | 0 (0.0%) | 0 (0.0%) |
| 5 to 9 Unit Apartments | 0 (0.0%) | 17 (100.0%) |
| 10 or more Apartments | 0 (0.0%) | 141 (100.0%) |
| Mobile Home / Other | 0 (0.0%) | 0 (0.0%) |
| Total | 1,451 (78.5%) | 397 (21.5%) |
Housing Structures by Number of Rooms in Simonton Lake
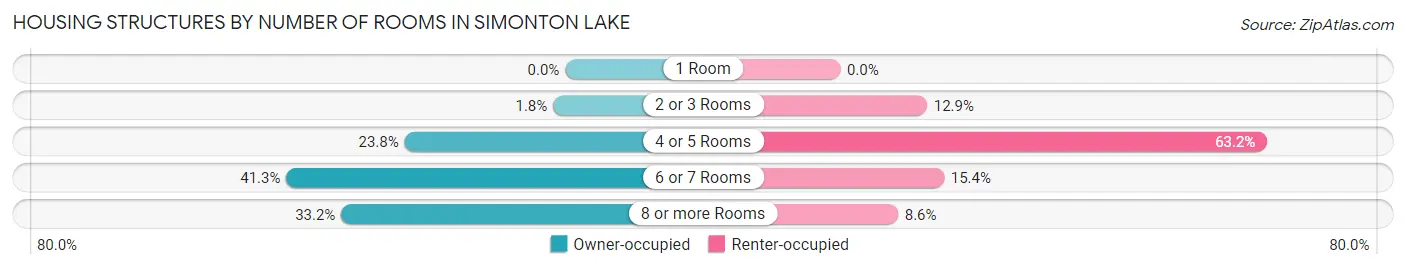
| Number of Rooms | Owner-occupied | Renter-occupied |
| 1 Room | 0 (0.0%) | 0 (0.0%) |
| 2 or 3 Rooms | 26 (1.8%) | 51 (12.9%) |
| 4 or 5 Rooms | 345 (23.8%) | 251 (63.2%) |
| 6 or 7 Rooms | 599 (41.3%) | 61 (15.4%) |
| 8 or more Rooms | 481 (33.2%) | 34 (8.6%) |
| Total | 1,451 (100.0%) | 397 (100.0%) |
Housing Structure by Heating Type in Simonton Lake
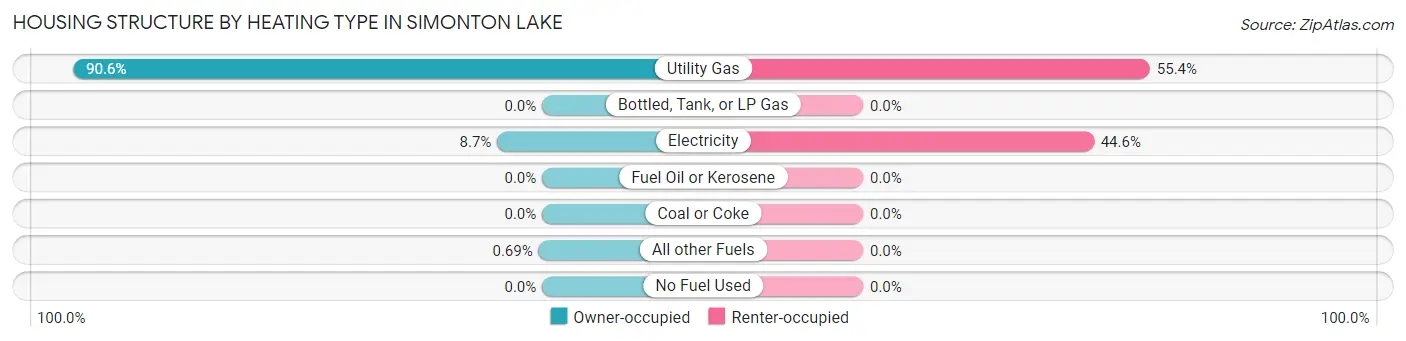
| Heating Type | Owner-occupied | Renter-occupied |
| Utility Gas | 1,315 (90.6%) | 220 (55.4%) |
| Bottled, Tank, or LP Gas | 0 (0.0%) | 0 (0.0%) |
| Electricity | 126 (8.7%) | 177 (44.6%) |
| Fuel Oil or Kerosene | 0 (0.0%) | 0 (0.0%) |
| Coal or Coke | 0 (0.0%) | 0 (0.0%) |
| All other Fuels | 10 (0.7%) | 0 (0.0%) |
| No Fuel Used | 0 (0.0%) | 0 (0.0%) |
| Total | 1,451 (100.0%) | 397 (100.0%) |
Household Vehicle Usage in Simonton Lake
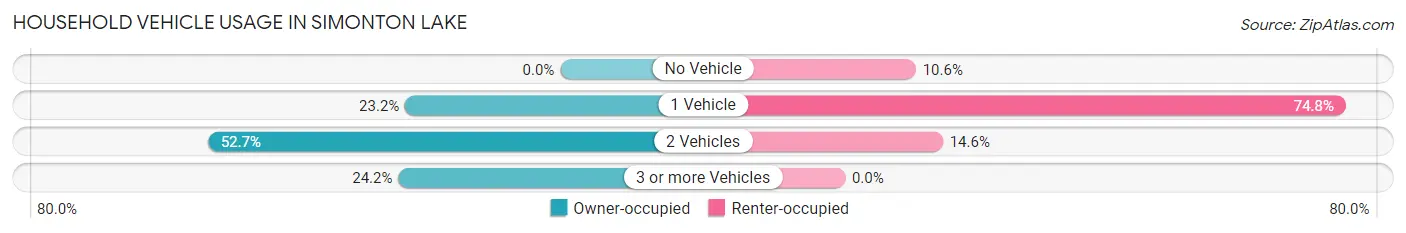
| Vehicles per Household | Owner-occupied | Renter-occupied |
| No Vehicle | 0 (0.0%) | 42 (10.6%) |
| 1 Vehicle | 336 (23.2%) | 297 (74.8%) |
| 2 Vehicles | 764 (52.6%) | 58 (14.6%) |
| 3 or more Vehicles | 351 (24.2%) | 0 (0.0%) |
| Total | 1,451 (100.0%) | 397 (100.0%) |
Real Estate & Mortgages in Simonton Lake
Real Estate and Mortgage Overview in Simonton Lake
| Characteristic | Without Mortgage | With Mortgage |
| Housing Units | 540 | 911 |
| Median Property Value | $213,600 | $206,100 |
| Median Household Income | $58,333 | $145 |
| Monthly Housing Costs | $441 | $71 |
| Real Estate Taxes | $1,745 | $0 |
Property Value by Mortgage Status in Simonton Lake
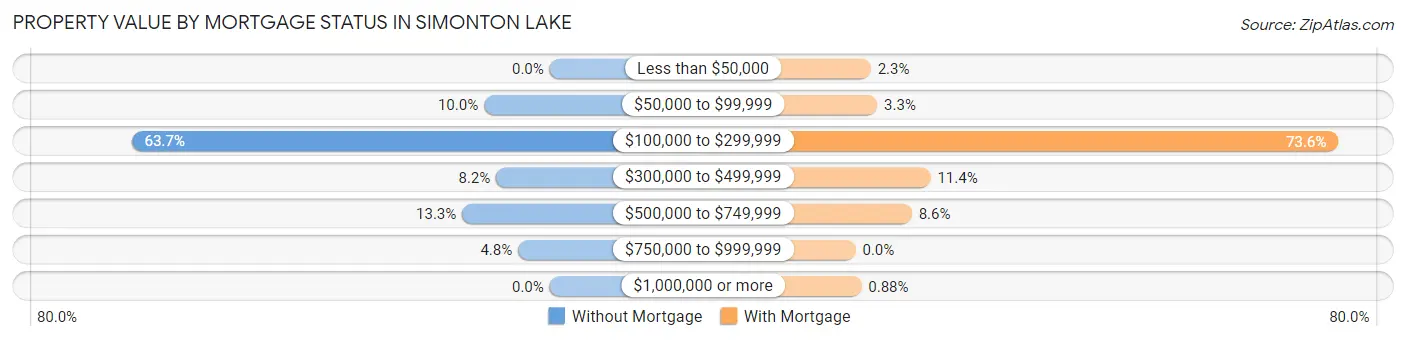
| Property Value | Without Mortgage | With Mortgage |
| Less than $50,000 | 0 (0.0%) | 21 (2.3%) |
| $50,000 to $99,999 | 54 (10.0%) | 30 (3.3%) |
| $100,000 to $299,999 | 344 (63.7%) | 670 (73.6%) |
| $300,000 to $499,999 | 44 (8.2%) | 104 (11.4%) |
| $500,000 to $749,999 | 72 (13.3%) | 78 (8.6%) |
| $750,000 to $999,999 | 26 (4.8%) | 0 (0.0%) |
| $1,000,000 or more | 0 (0.0%) | 8 (0.9%) |
| Total | 540 (100.0%) | 911 (100.0%) |
Household Income by Mortgage Status in Simonton Lake
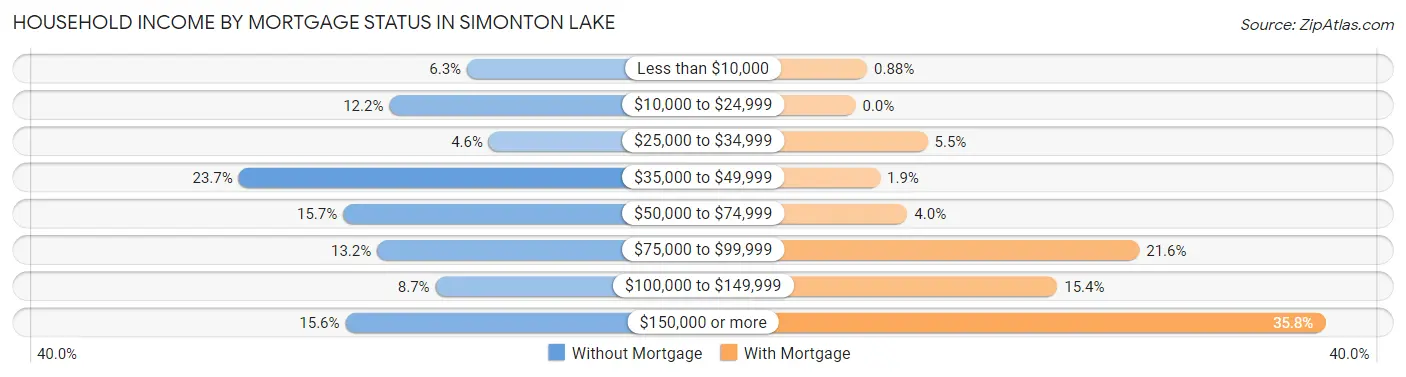
| Household Income | Without Mortgage | With Mortgage |
| Less than $10,000 | 34 (6.3%) | 8 (0.9%) |
| $10,000 to $24,999 | 66 (12.2%) | 0 (0.0%) |
| $25,000 to $34,999 | 25 (4.6%) | 50 (5.5%) |
| $35,000 to $49,999 | 128 (23.7%) | 17 (1.9%) |
| $50,000 to $74,999 | 85 (15.7%) | 36 (4.0%) |
| $75,000 to $99,999 | 71 (13.2%) | 197 (21.6%) |
| $100,000 to $149,999 | 47 (8.7%) | 140 (15.4%) |
| $150,000 or more | 84 (15.6%) | 326 (35.8%) |
| Total | 540 (100.0%) | 911 (100.0%) |
Property Value to Household Income Ratio in Simonton Lake
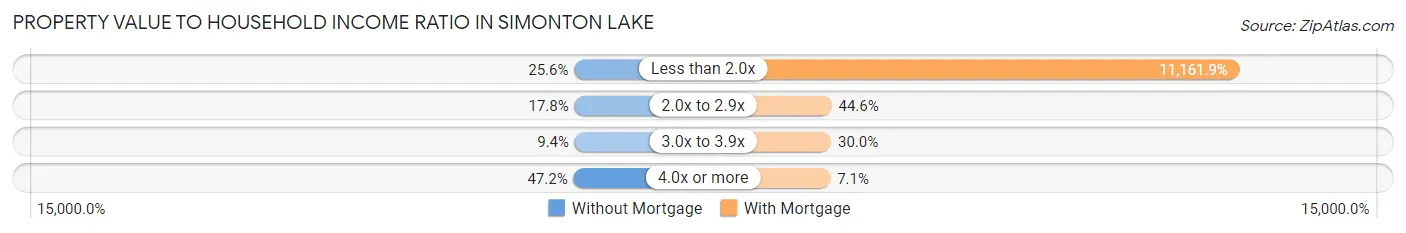
| Value-to-Income Ratio | Without Mortgage | With Mortgage |
| Less than 2.0x | 138 (25.6%) | 101,685 (11,161.9%) |
| 2.0x to 2.9x | 96 (17.8%) | 406 (44.6%) |
| 3.0x to 3.9x | 51 (9.4%) | 273 (30.0%) |
| 4.0x or more | 255 (47.2%) | 65 (7.1%) |
| Total | 540 (100.0%) | 911 (100.0%) |
Real Estate Taxes by Mortgage Status in Simonton Lake
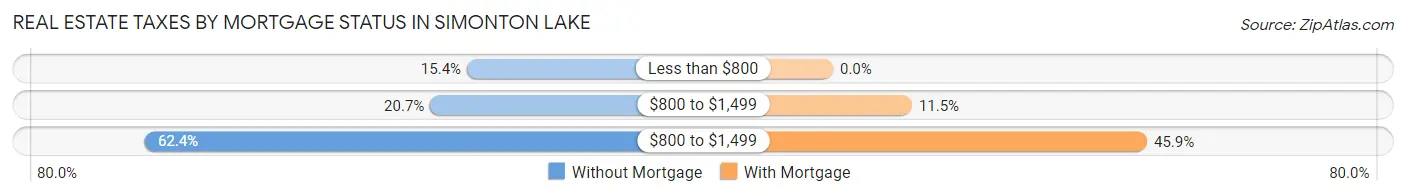
| Property Taxes | Without Mortgage | With Mortgage |
| Less than $800 | 83 (15.4%) | 0 (0.0%) |
| $800 to $1,499 | 112 (20.7%) | 105 (11.5%) |
| $800 to $1,499 | 337 (62.4%) | 418 (45.9%) |
| Total | 540 (100.0%) | 911 (100.0%) |
Health & Disability in Simonton Lake
Health Insurance Coverage by Age in Simonton Lake

| Age Bracket | With Coverage | Without Coverage |
| Under 6 Years | 269 (90.3%) | 29 (9.7%) |
| 6 to 18 Years | 693 (100.0%) | 0 (0.0%) |
| 19 to 25 Years | 176 (80.7%) | 42 (19.3%) |
| 26 to 34 Years | 449 (95.1%) | 23 (4.9%) |
| 35 to 44 Years | 414 (100.0%) | 0 (0.0%) |
| 45 to 54 Years | 540 (90.4%) | 57 (9.6%) |
| 55 to 64 Years | 810 (96.4%) | 30 (3.6%) |
| 65 to 74 Years | 469 (100.0%) | 0 (0.0%) |
| 75 Years and older | 526 (100.0%) | 0 (0.0%) |
| Total | 4,346 (96.0%) | 181 (4.0%) |
Health Insurance Coverage by Citizenship Status in Simonton Lake
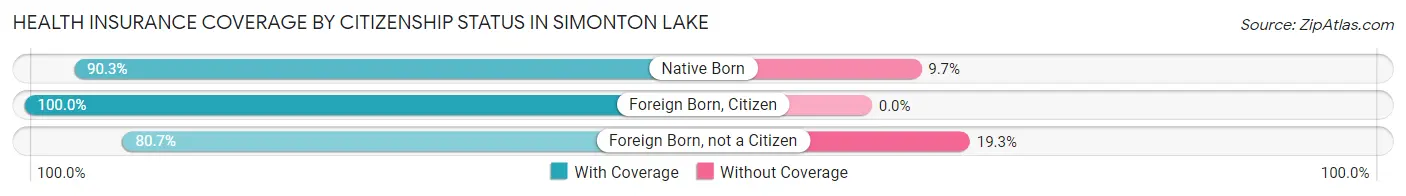
| Citizenship Status | With Coverage | Without Coverage |
| Native Born | 269 (90.3%) | 29 (9.7%) |
| Foreign Born, Citizen | 693 (100.0%) | 0 (0.0%) |
| Foreign Born, not a Citizen | 176 (80.7%) | 42 (19.3%) |
Health Insurance Coverage by Household Income in Simonton Lake
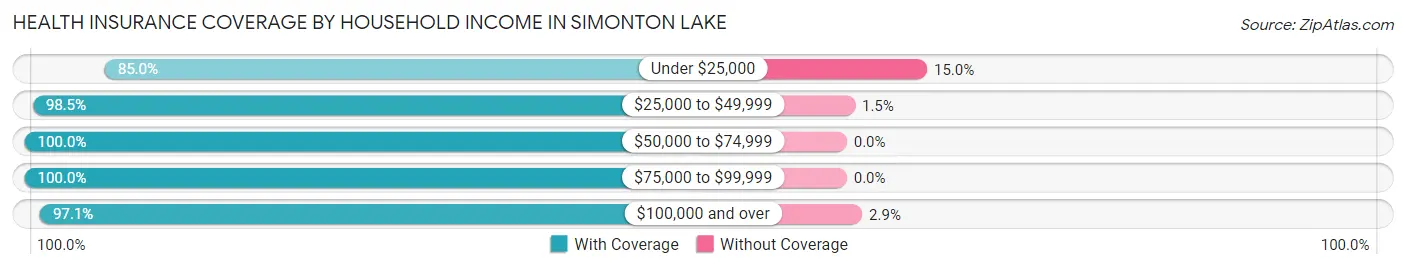
| Household Income | With Coverage | Without Coverage |
| Under $25,000 | 673 (85.0%) | 119 (15.0%) |
| $25,000 to $49,999 | 766 (98.5%) | 12 (1.5%) |
| $50,000 to $74,999 | 777 (100.0%) | 0 (0.0%) |
| $75,000 to $99,999 | 443 (100.0%) | 0 (0.0%) |
| $100,000 and over | 1,687 (97.1%) | 50 (2.9%) |
Public vs Private Health Insurance Coverage by Age in Simonton Lake
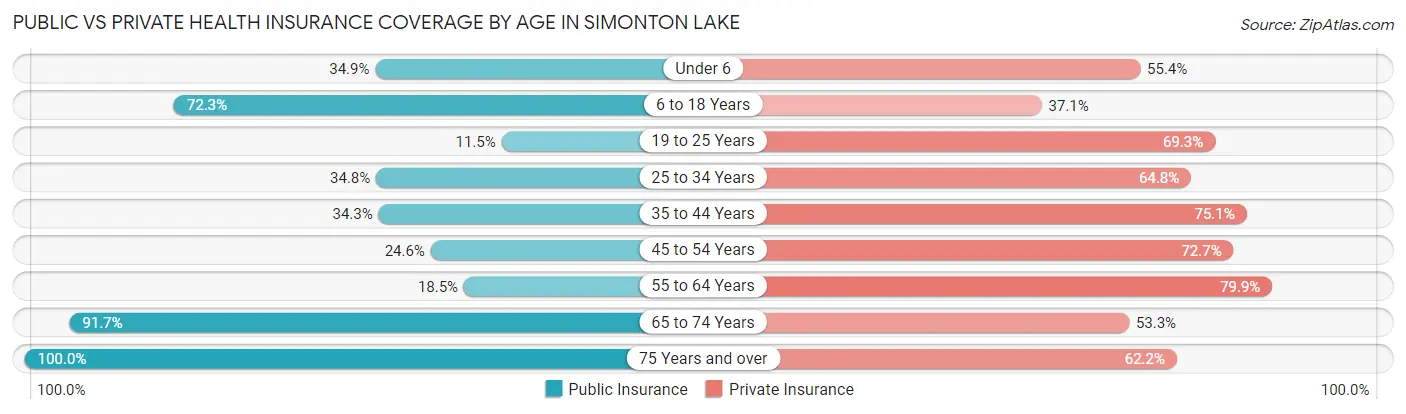
| Age Bracket | Public Insurance | Private Insurance |
| Under 6 | 104 (34.9%) | 165 (55.4%) |
| 6 to 18 Years | 501 (72.3%) | 257 (37.1%) |
| 19 to 25 Years | 25 (11.5%) | 151 (69.3%) |
| 25 to 34 Years | 164 (34.7%) | 306 (64.8%) |
| 35 to 44 Years | 142 (34.3%) | 311 (75.1%) |
| 45 to 54 Years | 147 (24.6%) | 434 (72.7%) |
| 55 to 64 Years | 155 (18.4%) | 671 (79.9%) |
| 65 to 74 Years | 430 (91.7%) | 250 (53.3%) |
| 75 Years and over | 526 (100.0%) | 327 (62.2%) |
| Total | 2,194 (48.5%) | 2,872 (63.4%) |
Disability Status by Sex by Age in Simonton Lake
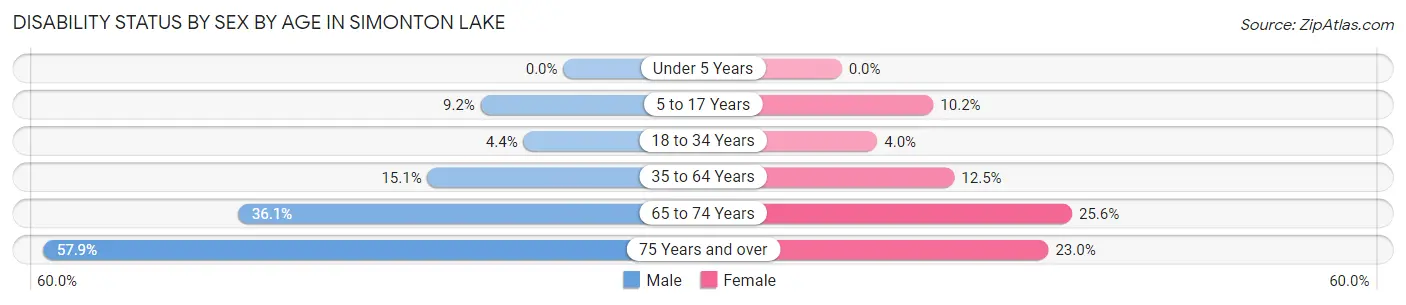
| Age Bracket | Male | Female |
| Under 5 Years | 0 (0.0%) | 0 (0.0%) |
| 5 to 17 Years | 35 (9.2%) | 35 (10.2%) |
| 18 to 34 Years | 17 (4.4%) | 13 (4.0%) |
| 35 to 64 Years | 128 (15.1%) | 126 (12.5%) |
| 65 to 74 Years | 99 (36.1%) | 50 (25.6%) |
| 75 Years and over | 151 (57.9%) | 61 (23.0%) |
Disability Class by Sex by Age in Simonton Lake
Disability Class: Hearing Difficulty
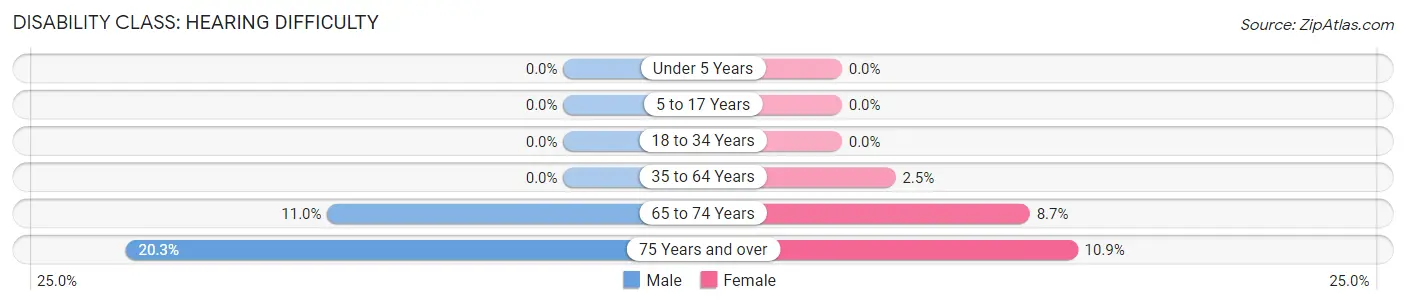
| Age Bracket | Male | Female |
| Under 5 Years | 0 (0.0%) | 0 (0.0%) |
| 5 to 17 Years | 0 (0.0%) | 0 (0.0%) |
| 18 to 34 Years | 0 (0.0%) | 0 (0.0%) |
| 35 to 64 Years | 0 (0.0%) | 25 (2.5%) |
| 65 to 74 Years | 30 (11.0%) | 17 (8.7%) |
| 75 Years and over | 53 (20.3%) | 29 (10.9%) |
Disability Class: Vision Difficulty
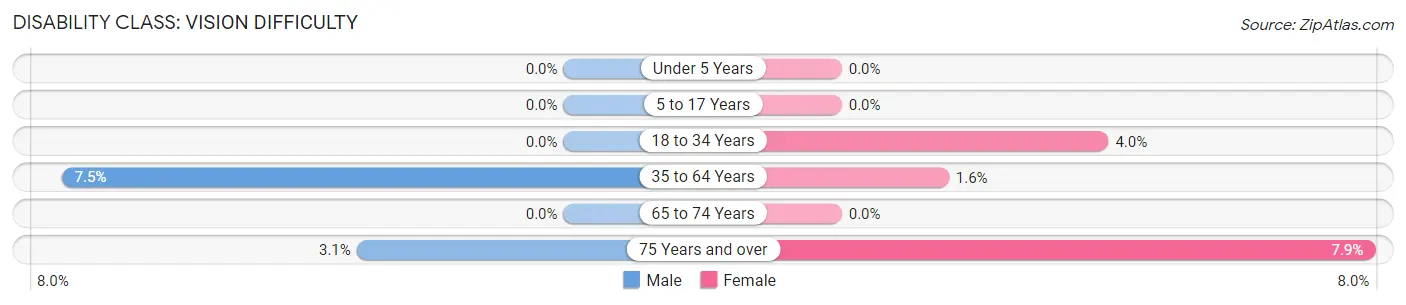
| Age Bracket | Male | Female |
| Under 5 Years | 0 (0.0%) | 0 (0.0%) |
| 5 to 17 Years | 0 (0.0%) | 0 (0.0%) |
| 18 to 34 Years | 0 (0.0%) | 13 (4.0%) |
| 35 to 64 Years | 63 (7.4%) | 16 (1.6%) |
| 65 to 74 Years | 0 (0.0%) | 0 (0.0%) |
| 75 Years and over | 8 (3.1%) | 21 (7.9%) |
Disability Class: Cognitive Difficulty
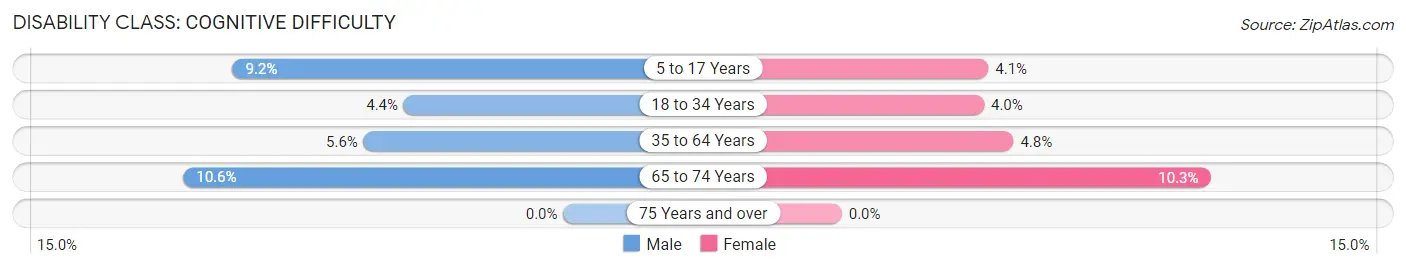
| Age Bracket | Male | Female |
| 5 to 17 Years | 35 (9.2%) | 14 (4.1%) |
| 18 to 34 Years | 17 (4.4%) | 13 (4.0%) |
| 35 to 64 Years | 47 (5.6%) | 48 (4.8%) |
| 65 to 74 Years | 29 (10.6%) | 20 (10.3%) |
| 75 Years and over | 0 (0.0%) | 0 (0.0%) |
Disability Class: Ambulatory Difficulty
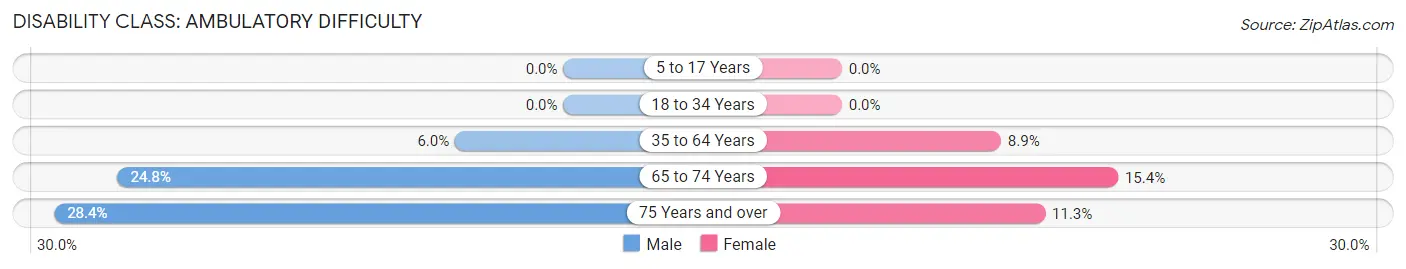
| Age Bracket | Male | Female |
| 5 to 17 Years | 0 (0.0%) | 0 (0.0%) |
| 18 to 34 Years | 0 (0.0%) | 0 (0.0%) |
| 35 to 64 Years | 51 (6.0%) | 89 (8.9%) |
| 65 to 74 Years | 68 (24.8%) | 30 (15.4%) |
| 75 Years and over | 74 (28.3%) | 30 (11.3%) |
Disability Class: Self-Care Difficulty
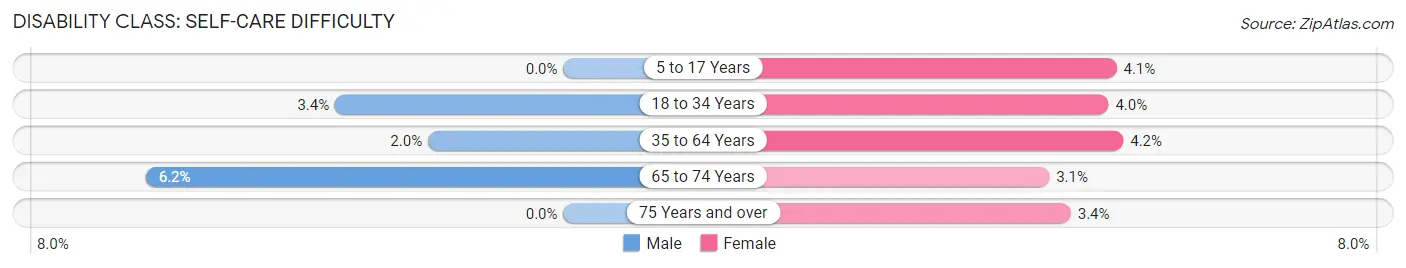
| Age Bracket | Male | Female |
| 5 to 17 Years | 0 (0.0%) | 14 (4.1%) |
| 18 to 34 Years | 13 (3.4%) | 13 (4.0%) |
| 35 to 64 Years | 17 (2.0%) | 42 (4.2%) |
| 65 to 74 Years | 17 (6.2%) | 6 (3.1%) |
| 75 Years and over | 0 (0.0%) | 9 (3.4%) |
Technology Access in Simonton Lake
Computing Device Access in Simonton Lake
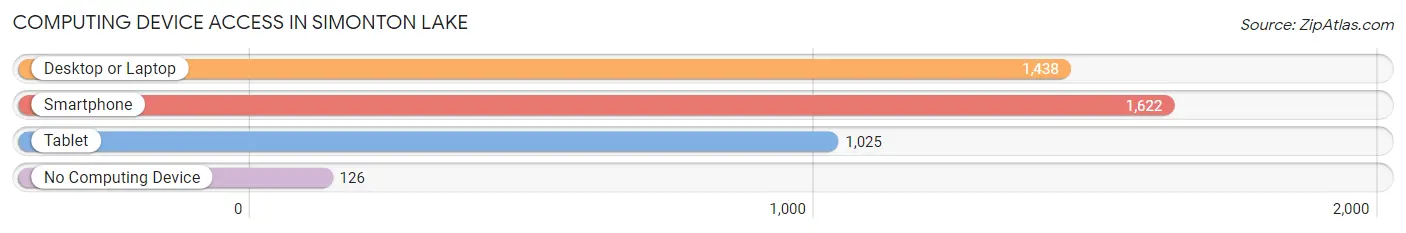
| Device Type | # Households | % Households |
| Desktop or Laptop | 1,438 | 77.8% |
| Smartphone | 1,622 | 87.8% |
| Tablet | 1,025 | 55.5% |
| No Computing Device | 126 | 6.8% |
| Total | 1,848 | 100.0% |
Internet Access in Simonton Lake
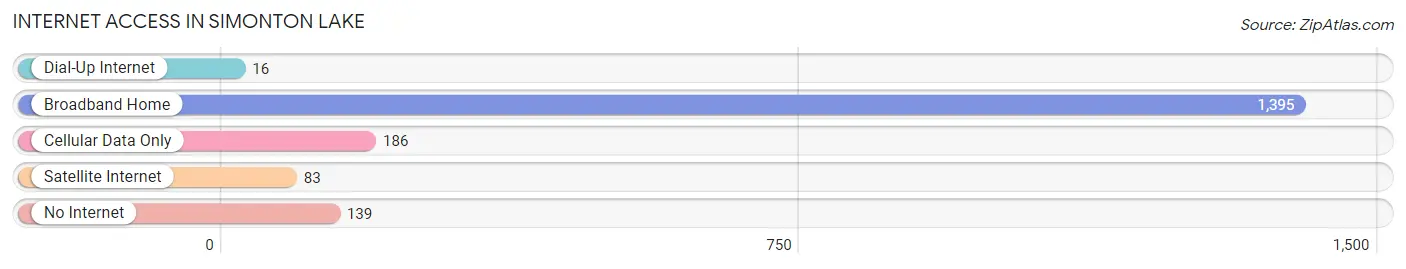
| Internet Type | # Households | % Households |
| Dial-Up Internet | 16 | 0.9% |
| Broadband Home | 1,395 | 75.5% |
| Cellular Data Only | 186 | 10.1% |
| Satellite Internet | 83 | 4.5% |
| No Internet | 139 | 7.5% |
| Total | 1,848 | 100.0% |
Simonton Lake Summary
Simonton Lake is a small lake located in the northern part of Indiana, in the United States. It is located in the city of Fort Wayne, and is part of the Fort Wayne metropolitan area. The lake is approximately 1.5 miles long and 0.5 miles wide, and is surrounded by residential neighborhoods.
History
Simonton Lake was originally part of the Great Black Swamp, a large marshland that covered much of northern Indiana. The swamp was drained in the late 19th century, and the lake was created in the early 20th century. The lake was named after the Simonton family, who were early settlers in the area.
The lake has been a popular recreational spot since the early 1900s. It was a popular spot for swimming, fishing, and boating. In the 1950s, the lake was developed into a residential area, with homes being built around the lake.
Geography
Simonton Lake is located in the northern part of Indiana, in the city of Fort Wayne. It is part of the Fort Wayne metropolitan area. The lake is approximately 1.5 miles long and 0.5 miles wide. It is surrounded by residential neighborhoods.
The lake is fed by several small creeks, including the Little River, which flows into the lake from the north. The lake is drained by the St. Joseph River, which flows out of the lake to the south.
Economy
Simonton Lake is primarily a residential area, with most of the economy centered around the lake. There are several small businesses located around the lake, including restaurants, marinas, and boat rental companies.
The lake is also a popular recreational spot, with many people visiting the lake for swimming, fishing, and boating. There are several parks located around the lake, including Simonton Lake Park, which offers a beach, picnic areas, and a playground.
Demographics
As of the 2010 census, the population of Simonton Lake was 1,845. The population is primarily white (90.2%), with a small percentage of African Americans (3.2%) and Hispanics (2.2%). The median household income is $45,945, and the median age is 37.
Conclusion
Simonton Lake is a small lake located in the northern part of Indiana, in the city of Fort Wayne. It is part of the Fort Wayne metropolitan area, and is a popular recreational spot for swimming, fishing, and boating. The lake is surrounded by residential neighborhoods, and is home to a population of 1,845 people. The economy of the area is primarily centered around the lake, with several small businesses located around the lake.
Common Questions
What is Per Capita Income in Simonton Lake?
Per Capita income in Simonton Lake is $38,880.
What is the Median Family Income in Simonton Lake?
Median Family Income in Simonton Lake is $83,429.
What is the Median Household income in Simonton Lake?
Median Household Income in Simonton Lake is $66,852.
What is Income or Wage Gap in Simonton Lake?
Income or Wage Gap in Simonton Lake is 23.3%.
Women in Simonton Lake earn 76.7 cents for every dollar earned by a man.
What is Inequality or Gini Index in Simonton Lake?
Inequality or Gini Index in Simonton Lake is 0.46.
What is the Total Population of Simonton Lake?
Total Population of Simonton Lake is 4,527.
What is the Total Male Population of Simonton Lake?
Total Male Population of Simonton Lake is 2,265.
What is the Total Female Population of Simonton Lake?
Total Female Population of Simonton Lake is 2,262.
What is the Ratio of Males per 100 Females in Simonton Lake?
There are 100.13 Males per 100 Females in Simonton Lake.
What is the Ratio of Females per 100 Males in Simonton Lake?
There are 99.87 Females per 100 Males in Simonton Lake.
What is the Median Population Age in Simonton Lake?
Median Population Age in Simonton Lake is 48.7 Years.
What is the Average Family Size in Simonton Lake
Average Family Size in Simonton Lake is 3.0 People.
What is the Average Household Size in Simonton Lake
Average Household Size in Simonton Lake is 2.5 People.
How Large is the Labor Force in Simonton Lake?
There are 2,322 People in the Labor Forcein in Simonton Lake.
What is the Percentage of People in the Labor Force in Simonton Lake?
64.1% of People are in the Labor Force in Simonton Lake.
What is the Unemployment Rate in Simonton Lake?
Unemployment Rate in Simonton Lake is 3.6%.