Glen Burnie, MD Map & Demographics
Glen Burnie Map
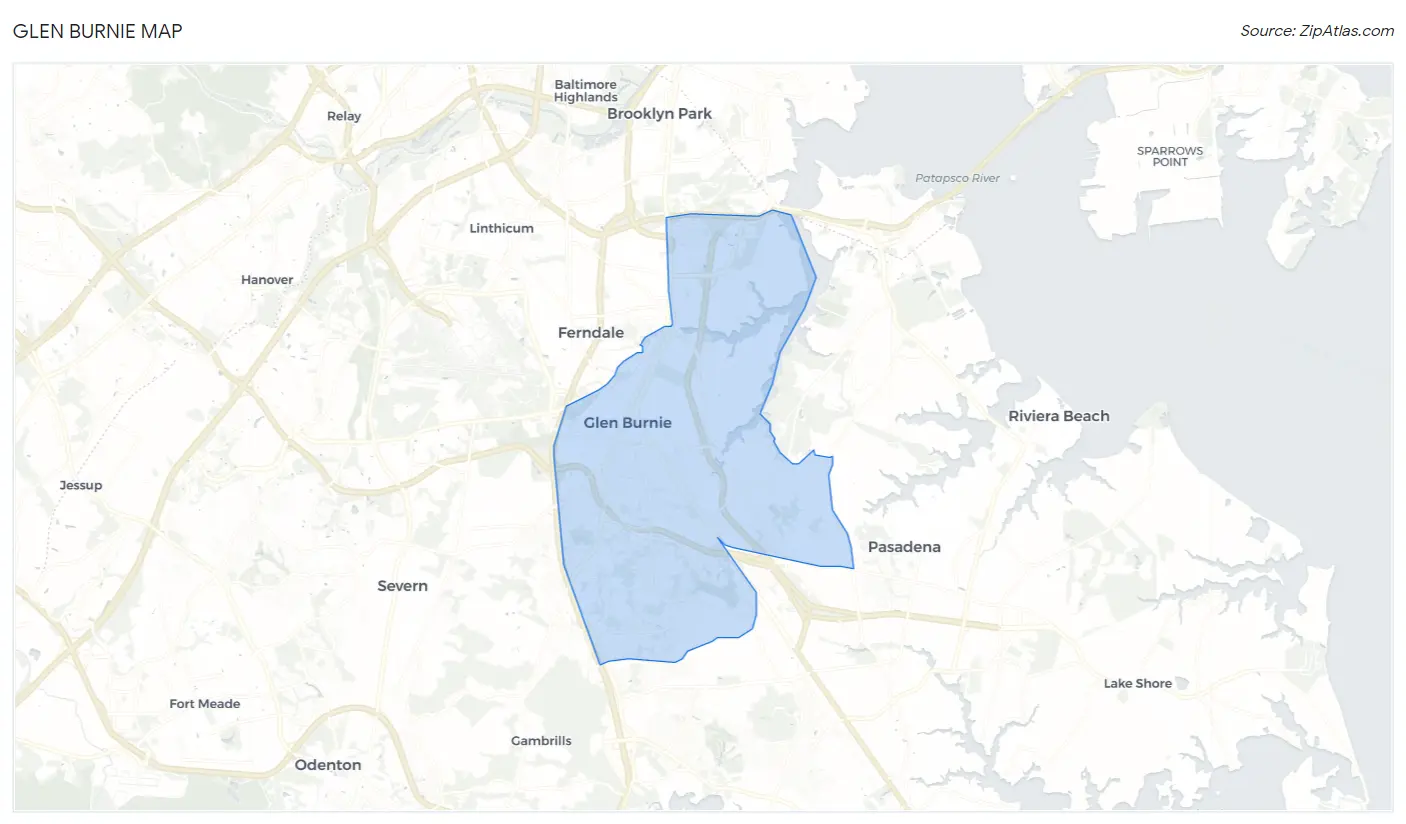
Glen Burnie Overview
$41,570
PER CAPITA INCOME
$100,034
AVG FAMILY INCOME
$86,283
AVG HOUSEHOLD INCOME
19.7%
WAGE / INCOME GAP [ % ]
80.3¢/ $1
WAGE / INCOME GAP [ $ ]
$11,146
FAMILY INCOME DEFICIT
0.40
INEQUALITY / GINI INDEX
71,427
TOTAL POPULATION
34,873
MALE POPULATION
36,554
FEMALE POPULATION
95.40
MALES / 100 FEMALES
104.82
FEMALES / 100 MALES
37.7
MEDIAN AGE
3.1
AVG FAMILY SIZE
2.5
AVG HOUSEHOLD SIZE
41,363
LABOR FORCE [ PEOPLE ]
70.5%
PERCENT IN LABOR FORCE
4.1%
UNEMPLOYMENT RATE
Income in Glen Burnie
Income Overview in Glen Burnie
Per Capita Income in Glen Burnie is $41,570, while median incomes of families and households are $100,034 and $86,283 respectively.
| Characteristic | Number | Measure |
| Per Capita Income | 71,427 | $41,570 |
| Median Family Income | 17,833 | $100,034 |
| Mean Family Income | 17,833 | $119,633 |
| Median Household Income | 28,804 | $86,283 |
| Mean Household Income | 28,804 | $102,562 |
| Income Deficit | 17,833 | $11,146 |
| Wage / Income Gap (%) | 71,427 | 19.69% |
| Wage / Income Gap ($) | 71,427 | 80.31¢ per $1 |
| Gini / Inequality Index | 71,427 | 0.40 |
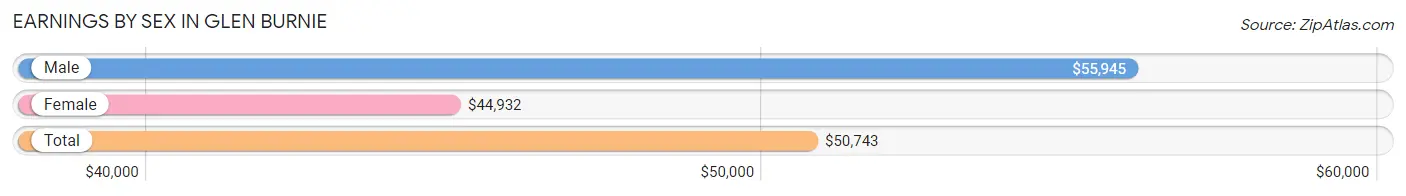
Earnings by Sex in Glen Burnie
Average Earnings in Glen Burnie are $50,743, $55,945 for men and $44,932 for women, a difference of 19.7%.
| Sex | Number | Average Earnings |
| Male | 21,190 (50.4%) | $55,945 |
| Female | 20,877 (49.6%) | $44,932 |
| Total | 42,067 (100.0%) | $50,743 |
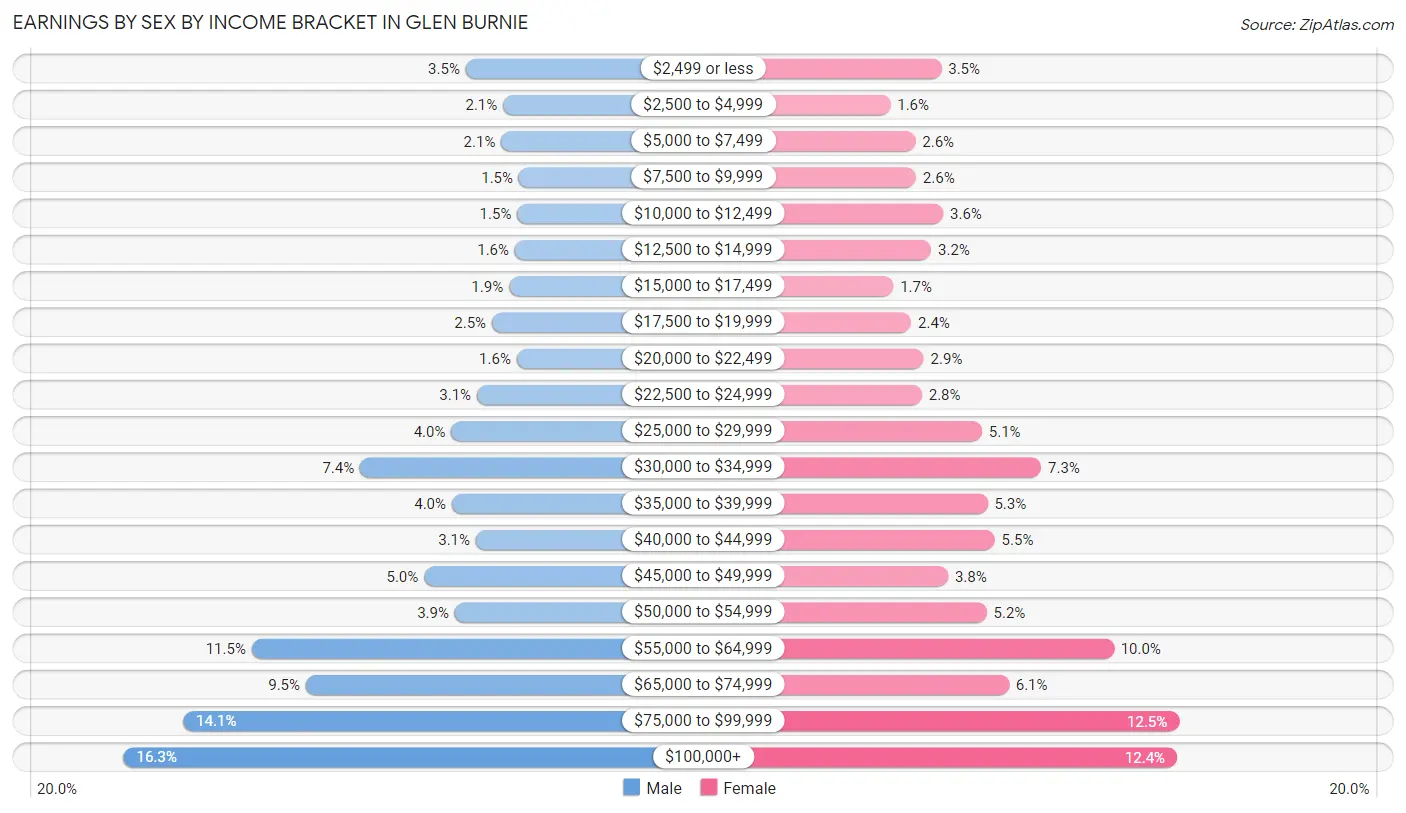
Earnings by Sex by Income Bracket in Glen Burnie
The most common earnings brackets in Glen Burnie are $100,000+ for men (3,452 | 16.3%) and $75,000 to $99,999 for women (2,600 | 12.4%).
| Income | Male | Female |
| $2,499 or less | 735 (3.5%) | 739 (3.5%) |
| $2,500 to $4,999 | 439 (2.1%) | 340 (1.6%) |
| $5,000 to $7,499 | 453 (2.1%) | 536 (2.6%) |
| $7,500 to $9,999 | 314 (1.5%) | 540 (2.6%) |
| $10,000 to $12,499 | 326 (1.5%) | 753 (3.6%) |
| $12,500 to $14,999 | 346 (1.6%) | 659 (3.2%) |
| $15,000 to $17,499 | 391 (1.8%) | 364 (1.7%) |
| $17,500 to $19,999 | 527 (2.5%) | 503 (2.4%) |
| $20,000 to $22,499 | 330 (1.6%) | 601 (2.9%) |
| $22,500 to $24,999 | 646 (3.0%) | 586 (2.8%) |
| $25,000 to $29,999 | 850 (4.0%) | 1,057 (5.1%) |
| $30,000 to $34,999 | 1,574 (7.4%) | 1,519 (7.3%) |
| $35,000 to $39,999 | 845 (4.0%) | 1,101 (5.3%) |
| $40,000 to $44,999 | 654 (3.1%) | 1,157 (5.5%) |
| $45,000 to $49,999 | 1,066 (5.0%) | 792 (3.8%) |
| $50,000 to $54,999 | 823 (3.9%) | 1,094 (5.2%) |
| $55,000 to $64,999 | 2,434 (11.5%) | 2,087 (10.0%) |
| $65,000 to $74,999 | 2,005 (9.5%) | 1,267 (6.1%) |
| $75,000 to $99,999 | 2,980 (14.1%) | 2,600 (12.4%) |
| $100,000+ | 3,452 (16.3%) | 2,582 (12.4%) |
| Total | 21,190 (100.0%) | 20,877 (100.0%) |
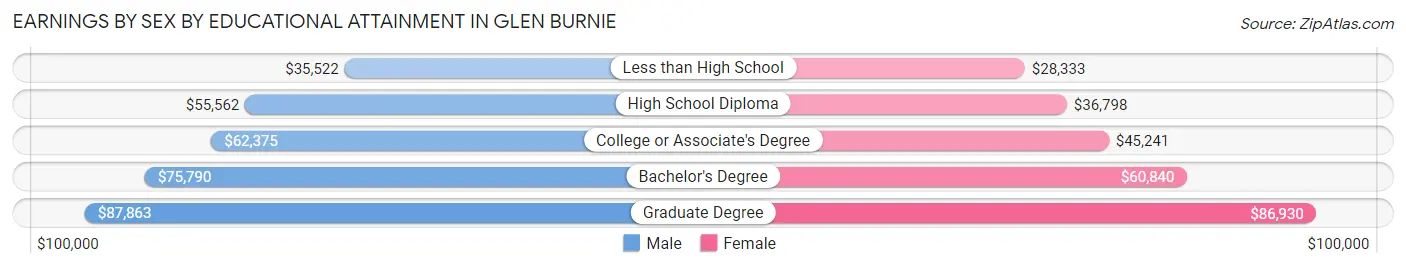
Earnings by Sex by Educational Attainment in Glen Burnie
Average earnings in Glen Burnie are $59,617 for men and $51,931 for women, a difference of 12.9%. Men with an educational attainment of graduate degree enjoy the highest average annual earnings of $87,863, while those with less than high school education earn the least with $35,522. Women with an educational attainment of graduate degree earn the most with the average annual earnings of $86,930, while those with less than high school education have the smallest earnings of $28,333.
| Educational Attainment | Male Income | Female Income |
| Less than High School | $35,522 | $28,333 |
| High School Diploma | $55,562 | $36,798 |
| College or Associate's Degree | $62,375 | $45,241 |
| Bachelor's Degree | $75,790 | $60,840 |
| Graduate Degree | $87,863 | $86,930 |
| Total | $59,617 | $51,931 |
Family Income in Glen Burnie
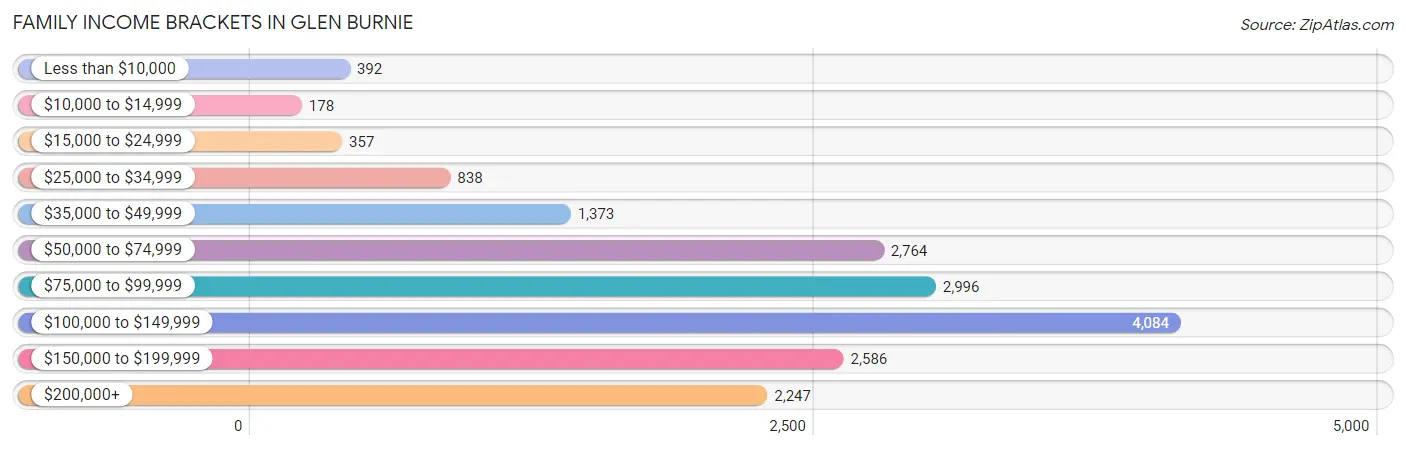
Family Income Brackets in Glen Burnie
According to the Glen Burnie family income data, there are 4,084 families falling into the $100,000 to $149,999 income range, which is the most common income bracket and makes up 22.9% of all families. Conversely, the $10,000 to $14,999 income bracket is the least frequent group with only 178 families (1.0%) belonging to this category.
| Income Bracket | # Families | % Families |
| Less than $10,000 | 392 | 2.2% |
| $10,000 to $14,999 | 178 | 1.0% |
| $15,000 to $24,999 | 357 | 2.0% |
| $25,000 to $34,999 | 838 | 4.7% |
| $35,000 to $49,999 | 1,373 | 7.7% |
| $50,000 to $74,999 | 2,764 | 15.5% |
| $75,000 to $99,999 | 2,996 | 16.8% |
| $100,000 to $149,999 | 4,084 | 22.9% |
| $150,000 to $199,999 | 2,586 | 14.5% |
| $200,000+ | 2,247 | 12.6% |
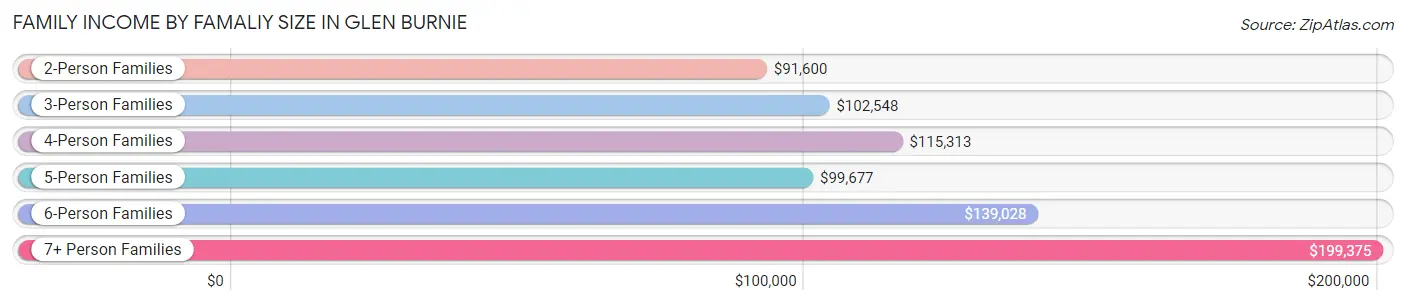
Family Income by Famaliy Size in Glen Burnie
7+ person families (280 | 1.6%) account for the highest median family income in Glen Burnie with $199,375 per family, while 2-person families (8,410 | 47.2%) have the highest median income of $45,800 per family member.
| Income Bracket | # Families | Median Income |
| 2-Person Families | 8,410 (47.2%) | $91,600 |
| 3-Person Families | 3,833 (21.5%) | $102,548 |
| 4-Person Families | 3,418 (19.2%) | $115,313 |
| 5-Person Families | 1,517 (8.5%) | $99,677 |
| 6-Person Families | 375 (2.1%) | $139,028 |
| 7+ Person Families | 280 (1.6%) | $199,375 |
| Total | 17,833 (100.0%) | $100,034 |
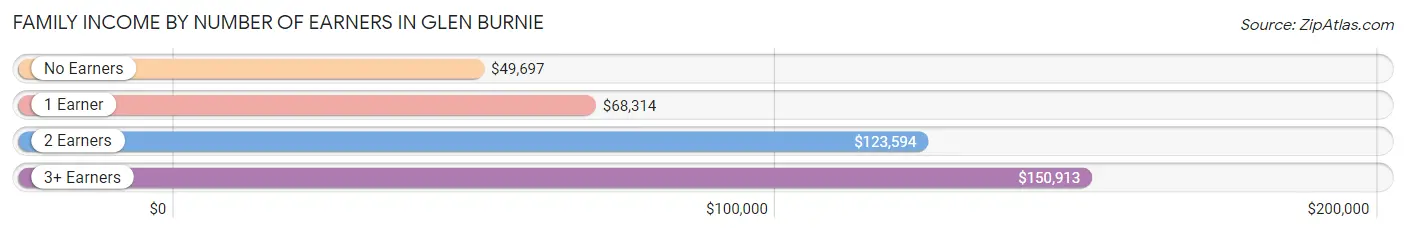
Family Income by Number of Earners in Glen Burnie
The median family income in Glen Burnie is $100,034, with families comprising 3+ earners (2,767) having the highest median family income of $150,913, while families with no earners (1,898) have the lowest median family income of $49,697, accounting for 15.5% and 10.6% of families, respectively.
| Number of Earners | # Families | Median Income |
| No Earners | 1,898 (10.6%) | $49,697 |
| 1 Earner | 5,295 (29.7%) | $68,314 |
| 2 Earners | 7,873 (44.2%) | $123,594 |
| 3+ Earners | 2,767 (15.5%) | $150,913 |
| Total | 17,833 (100.0%) | $100,034 |
Household Income in Glen Burnie
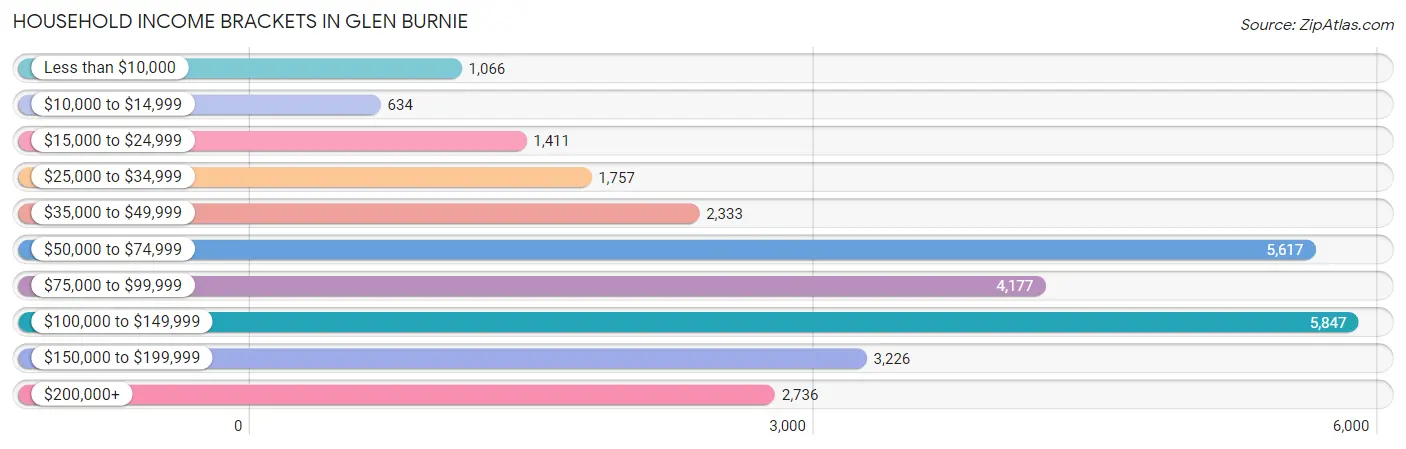
Household Income Brackets in Glen Burnie
With 5,847 households falling in the category, the $100,000 to $149,999 income range is the most frequent in Glen Burnie, accounting for 20.3% of all households. In contrast, only 634 households (2.2%) fall into the $10,000 to $14,999 income bracket, making it the least populous group.
| Income Bracket | # Households | % Households |
| Less than $10,000 | 1,066 | 3.7% |
| $10,000 to $14,999 | 634 | 2.2% |
| $15,000 to $24,999 | 1,411 | 4.9% |
| $25,000 to $34,999 | 1,757 | 6.1% |
| $35,000 to $49,999 | 2,333 | 8.1% |
| $50,000 to $74,999 | 5,617 | 19.5% |
| $75,000 to $99,999 | 4,177 | 14.5% |
| $100,000 to $149,999 | 5,847 | 20.3% |
| $150,000 to $199,999 | 3,226 | 11.2% |
| $200,000+ | 2,736 | 9.5% |
Household Income by Householder Age in Glen Burnie
The median household income in Glen Burnie is $86,283, with the highest median household income of $99,985 found in the 45 to 64 years age bracket for the primary householder. A total of 10,582 households (36.7%) fall into this category. Meanwhile, the 65+ years age bracket for the primary householder has the lowest median household income of $58,708, with 6,476 households (22.5%) in this group.
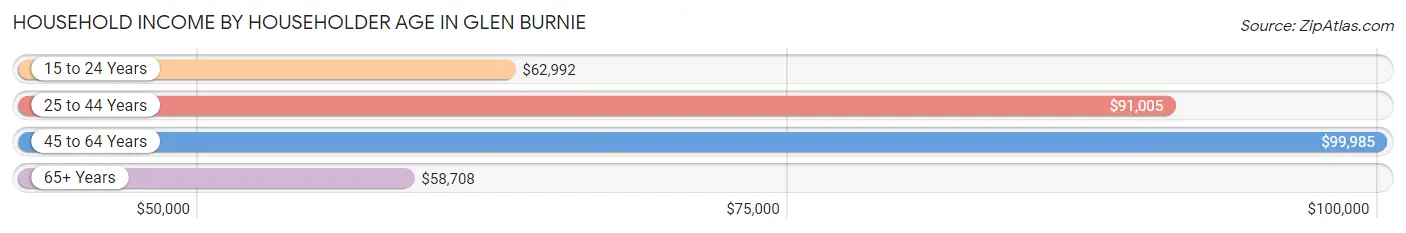
| Income Bracket | # Households | Median Income |
| 15 to 24 Years | 1,124 (3.9%) | $62,992 |
| 25 to 44 Years | 10,622 (36.9%) | $91,005 |
| 45 to 64 Years | 10,582 (36.7%) | $99,985 |
| 65+ Years | 6,476 (22.5%) | $58,708 |
| Total | 28,804 (100.0%) | $86,283 |
Poverty in Glen Burnie
Income Below Poverty by Sex and Age in Glen Burnie
With 7.5% poverty level for males and 8.7% for females among the residents of Glen Burnie, 5 year old males and 75 year old and over females are the most vulnerable to poverty, with 83 males (21.3%) and 344 females (13.3%) in their respective age groups living below the poverty level.
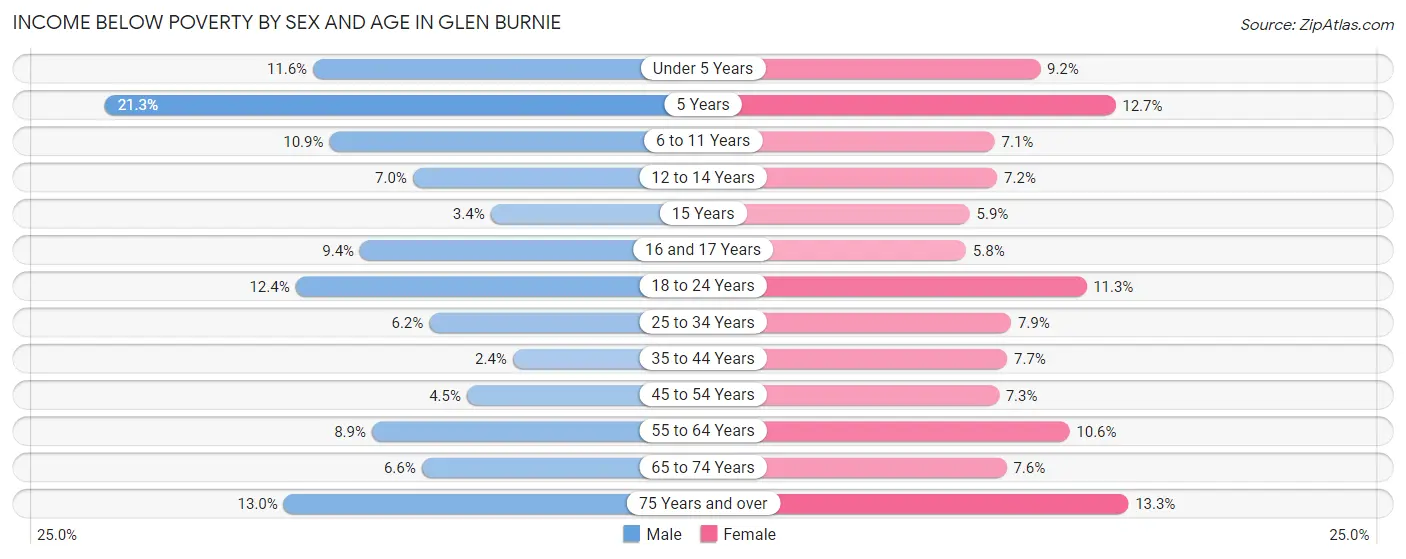
| Age Bracket | Male | Female |
| Under 5 Years | 220 (11.6%) | 143 (9.2%) |
| 5 Years | 83 (21.3%) | 49 (12.7%) |
| 6 to 11 Years | 279 (10.9%) | 157 (7.1%) |
| 12 to 14 Years | 94 (7.0%) | 88 (7.2%) |
| 15 Years | 17 (3.4%) | 30 (5.9%) |
| 16 and 17 Years | 77 (9.4%) | 49 (5.8%) |
| 18 to 24 Years | 413 (12.4%) | 383 (11.3%) |
| 25 to 34 Years | 355 (6.2%) | 451 (7.9%) |
| 35 to 44 Years | 115 (2.4%) | 422 (7.7%) |
| 45 to 54 Years | 221 (4.5%) | 346 (7.3%) |
| 55 to 64 Years | 355 (8.9%) | 481 (10.6%) |
| 65 to 74 Years | 170 (6.6%) | 233 (7.6%) |
| 75 Years and over | 200 (13.0%) | 344 (13.3%) |
| Total | 2,599 (7.5%) | 3,176 (8.7%) |
Income Above Poverty by Sex and Age in Glen Burnie
According to the poverty statistics in Glen Burnie, males aged 35 to 44 years and females aged 16 and 17 years are the age groups that are most secure financially, with 97.7% of males and 94.2% of females in these age groups living above the poverty line.
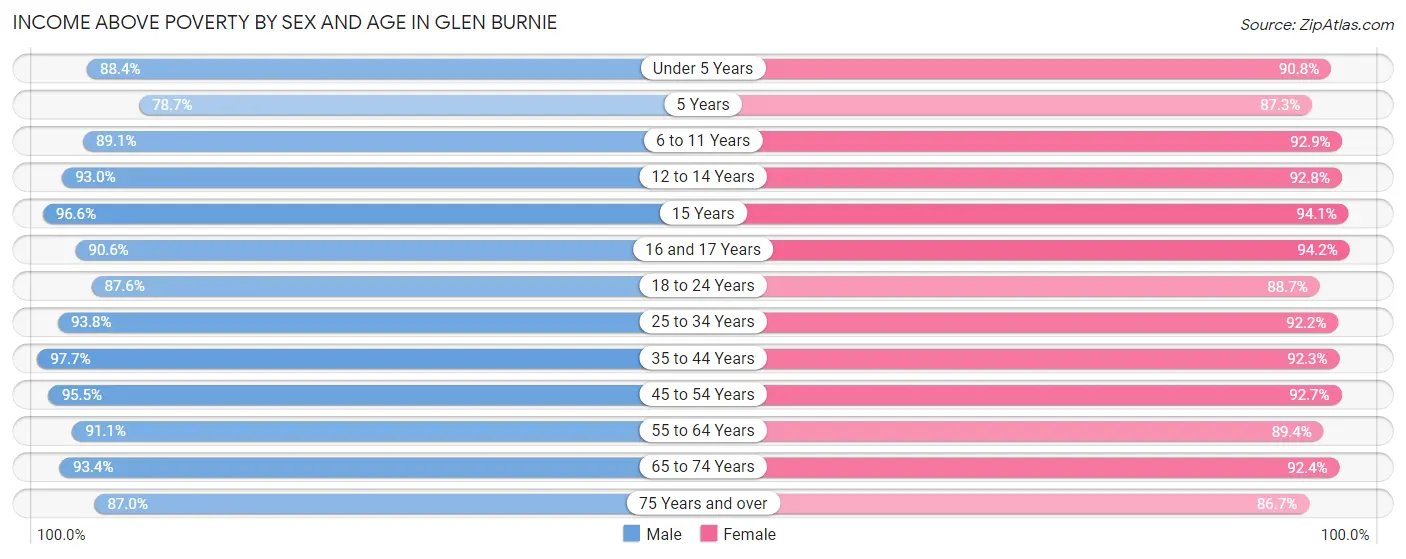
| Age Bracket | Male | Female |
| Under 5 Years | 1,674 (88.4%) | 1,412 (90.8%) |
| 5 Years | 307 (78.7%) | 337 (87.3%) |
| 6 to 11 Years | 2,291 (89.1%) | 2,058 (92.9%) |
| 12 to 14 Years | 1,250 (93.0%) | 1,133 (92.8%) |
| 15 Years | 486 (96.6%) | 476 (94.1%) |
| 16 and 17 Years | 739 (90.6%) | 801 (94.2%) |
| 18 to 24 Years | 2,910 (87.6%) | 2,993 (88.7%) |
| 25 to 34 Years | 5,343 (93.8%) | 5,295 (92.1%) |
| 35 to 44 Years | 4,776 (97.7%) | 5,079 (92.3%) |
| 45 to 54 Years | 4,717 (95.5%) | 4,409 (92.7%) |
| 55 to 64 Years | 3,638 (91.1%) | 4,073 (89.4%) |
| 65 to 74 Years | 2,414 (93.4%) | 2,816 (92.4%) |
| 75 Years and over | 1,341 (87.0%) | 2,245 (86.7%) |
| Total | 31,886 (92.5%) | 33,127 (91.2%) |
Income Below Poverty Among Married-Couple Families in Glen Burnie
The poverty statistics for married-couple families in Glen Burnie show that 2.8% or 333 of the total 11,854 families live below the poverty line. Families with no children have the highest poverty rate of 3.3%, comprising of 242 families. On the other hand, families with 5 or more children have the lowest poverty rate of 0.0%, which includes 0 families.
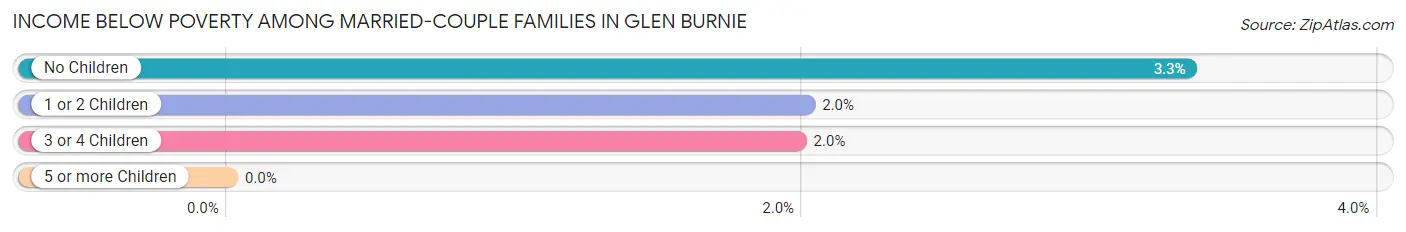
| Children | Above Poverty | Below Poverty |
| No Children | 7,014 (96.7%) | 242 (3.3%) |
| 1 or 2 Children | 3,600 (98.0%) | 74 (2.0%) |
| 3 or 4 Children | 842 (98.0%) | 17 (2.0%) |
| 5 or more Children | 65 (100.0%) | 0 (0.0%) |
| Total | 11,521 (97.2%) | 333 (2.8%) |
Income Below Poverty Among Single-Parent Households in Glen Burnie
According to the poverty data in Glen Burnie, 5.8% or 74 single-father households and 11.9% or 559 single-mother households are living below the poverty line. Among single-father households, those with 3 or 4 children have the highest poverty rate, with 28 households (30.1%) experiencing poverty. Likewise, among single-mother households, those with 5 or more children have the highest poverty rate, with 17 households (100.0%) falling below the poverty line.
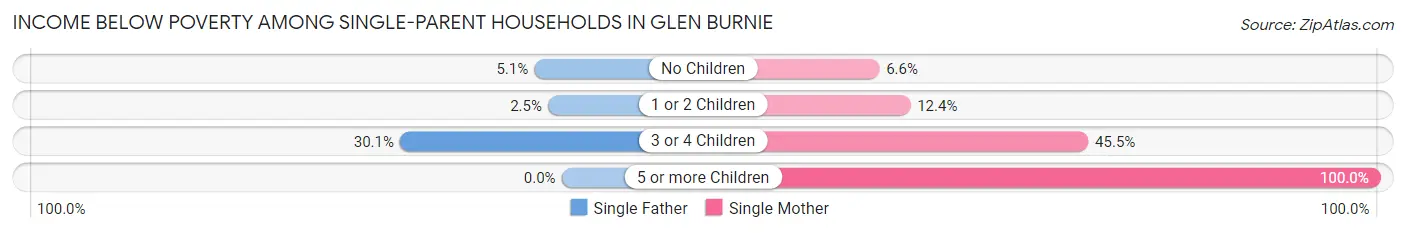
| Children | Single Father | Single Mother |
| No Children | 32 (5.1%) | 122 (6.6%) |
| 1 or 2 Children | 14 (2.5%) | 328 (12.4%) |
| 3 or 4 Children | 28 (30.1%) | 92 (45.5%) |
| 5 or more Children | 0 (0.0%) | 17 (100.0%) |
| Total | 74 (5.8%) | 559 (11.9%) |
Income Below Poverty Among Married-Couple vs Single-Parent Households in Glen Burnie
The poverty data for Glen Burnie shows that 333 of the married-couple family households (2.8%) and 633 of the single-parent households (10.6%) are living below the poverty level. Within the married-couple family households, those with no children have the highest poverty rate, with 242 households (3.3%) falling below the poverty line. Among the single-parent households, those with 5 or more children have the highest poverty rate, with 17 household (100.0%) living below poverty.
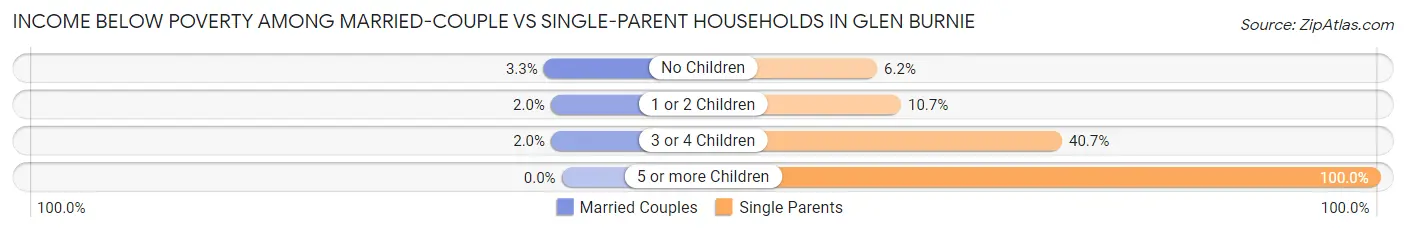
| Children | Married-Couple Families | Single-Parent Households |
| No Children | 242 (3.3%) | 154 (6.2%) |
| 1 or 2 Children | 74 (2.0%) | 342 (10.7%) |
| 3 or 4 Children | 17 (2.0%) | 120 (40.7%) |
| 5 or more Children | 0 (0.0%) | 17 (100.0%) |
| Total | 333 (2.8%) | 633 (10.6%) |
Race in Glen Burnie
The most populous races in Glen Burnie are White / Caucasian (40,741 | 57.0%), Black / African American (18,359 | 25.7%), and Hispanic or Latino (6,640 | 9.3%).
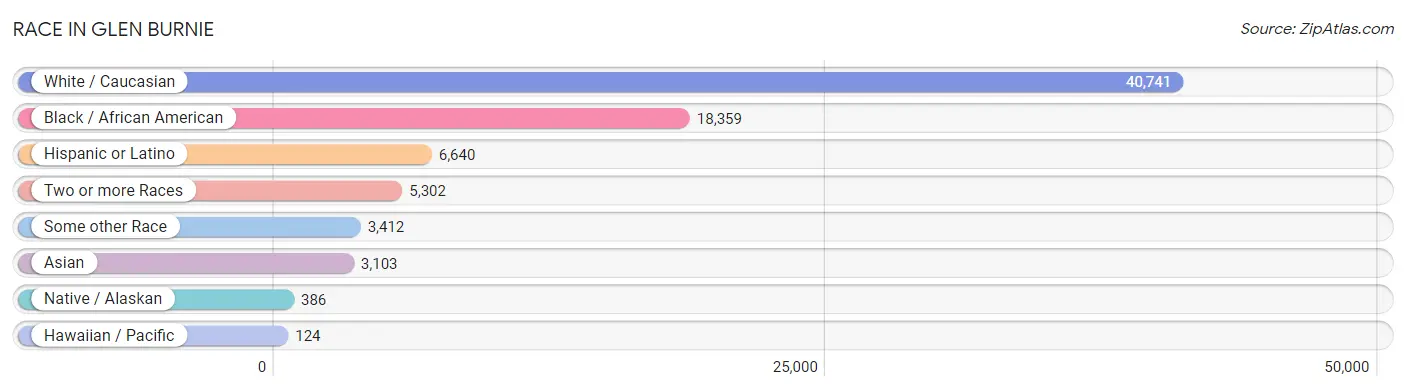
| Race | # Population | % Population |
| Asian | 3,103 | 4.3% |
| Black / African American | 18,359 | 25.7% |
| Hawaiian / Pacific | 124 | 0.2% |
| Hispanic or Latino | 6,640 | 9.3% |
| Native / Alaskan | 386 | 0.5% |
| White / Caucasian | 40,741 | 57.0% |
| Two or more Races | 5,302 | 7.4% |
| Some other Race | 3,412 | 4.8% |
| Total | 71,427 | 100.0% |
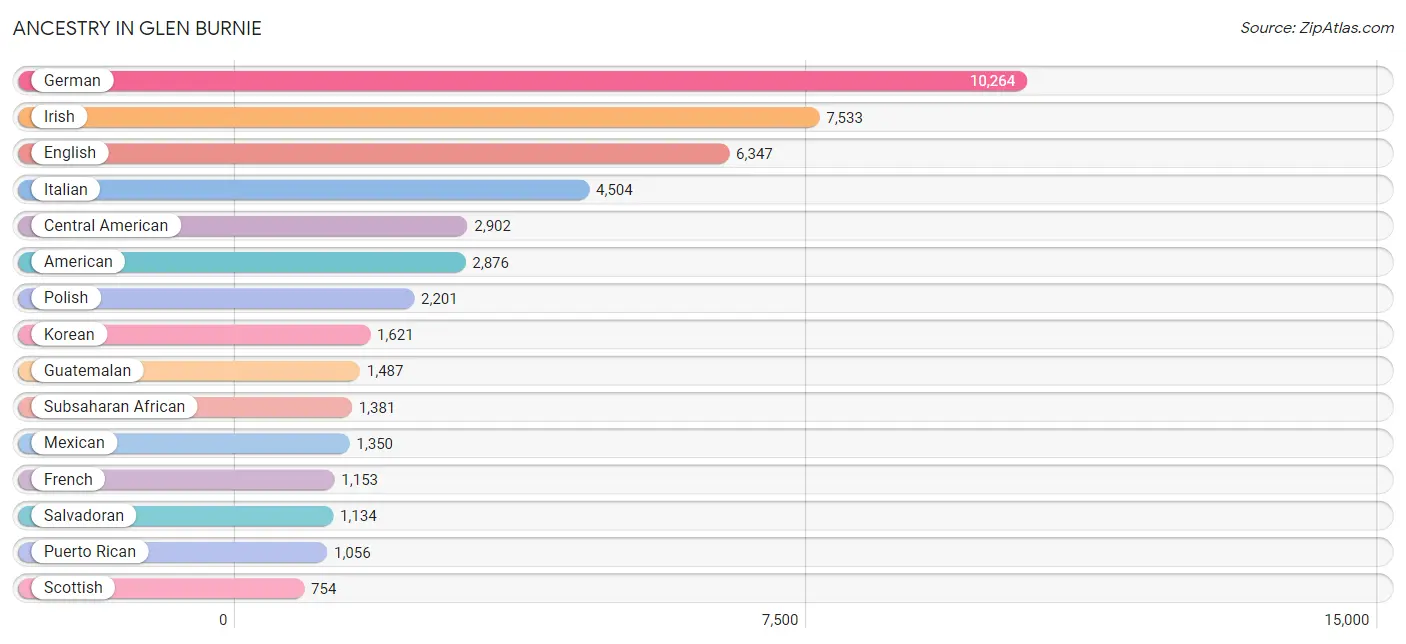
Ancestry in Glen Burnie
The most populous ancestries reported in Glen Burnie are German (10,264 | 14.4%), Irish (7,533 | 10.5%), English (6,347 | 8.9%), Italian (4,504 | 6.3%), and Central American (2,902 | 4.1%), together accounting for 44.2% of all Glen Burnie residents.
| Ancestry | # Population | % Population |
| African | 570 | 0.8% |
| American | 2,876 | 4.0% |
| Apache | 26 | 0.0% |
| Arab | 244 | 0.3% |
| Argentinean | 18 | 0.0% |
| Armenian | 79 | 0.1% |
| Austrian | 95 | 0.1% |
| Barbadian | 16 | 0.0% |
| Belgian | 56 | 0.1% |
| Bhutanese | 78 | 0.1% |
| Blackfeet | 6 | 0.0% |
| Bolivian | 4 | 0.0% |
| Brazilian | 4 | 0.0% |
| British | 345 | 0.5% |
| Burmese | 334 | 0.5% |
| Canadian | 59 | 0.1% |
| Celtic | 23 | 0.0% |
| Central American | 2,902 | 4.1% |
| Central American Indian | 46 | 0.1% |
| Cherokee | 361 | 0.5% |
| Choctaw | 9 | 0.0% |
| Colombian | 73 | 0.1% |
| Creek | 10 | 0.0% |
| Cuban | 213 | 0.3% |
| Czech | 132 | 0.2% |
| Czechoslovakian | 136 | 0.2% |
| Danish | 146 | 0.2% |
| Dominican | 277 | 0.4% |
| Dutch | 316 | 0.4% |
| Eastern European | 383 | 0.5% |
| Ecuadorian | 189 | 0.3% |
| Egyptian | 173 | 0.2% |
| English | 6,347 | 8.9% |
| Ethiopian | 24 | 0.0% |
| European | 746 | 1.0% |
| Finnish | 25 | 0.0% |
| French | 1,153 | 1.6% |
| French American Indian | 6 | 0.0% |
| French Canadian | 54 | 0.1% |
| German | 10,264 | 14.4% |
| Ghanaian | 58 | 0.1% |
| Greek | 197 | 0.3% |
| Guamanian / Chamorro | 101 | 0.1% |
| Guatemalan | 1,487 | 2.1% |
| Haitian | 180 | 0.3% |
| Honduran | 174 | 0.2% |
| Hungarian | 114 | 0.2% |
| Indian (Asian) | 243 | 0.3% |
| Inupiat | 8 | 0.0% |
| Iranian | 18 | 0.0% |
| Irish | 7,533 | 10.5% |
| Iroquois | 7 | 0.0% |
| Israeli | 12 | 0.0% |
| Italian | 4,504 | 6.3% |
| Jamaican | 562 | 0.8% |
| Japanese | 81 | 0.1% |
| Kenyan | 25 | 0.0% |
| Korean | 1,621 | 2.3% |
| Lebanese | 18 | 0.0% |
| Liberian | 16 | 0.0% |
| Lithuanian | 284 | 0.4% |
| Lumbee | 7 | 0.0% |
| Mexican | 1,350 | 1.9% |
| Mexican American Indian | 17 | 0.0% |
| Moroccan | 14 | 0.0% |
| Native Hawaiian | 9 | 0.0% |
| Navajo | 53 | 0.1% |
| Nicaraguan | 51 | 0.1% |
| Nigerian | 495 | 0.7% |
| Northern European | 49 | 0.1% |
| Norwegian | 354 | 0.5% |
| Pakistani | 46 | 0.1% |
| Panamanian | 56 | 0.1% |
| Paraguayan | 25 | 0.0% |
| Pennsylvania German | 31 | 0.0% |
| Peruvian | 190 | 0.3% |
| Polish | 2,201 | 3.1% |
| Portuguese | 223 | 0.3% |
| Pueblo | 14 | 0.0% |
| Puerto Rican | 1,056 | 1.5% |
| Romanian | 25 | 0.0% |
| Russian | 214 | 0.3% |
| Salvadoran | 1,134 | 1.6% |
| Samoan | 28 | 0.0% |
| Scandinavian | 40 | 0.1% |
| Scotch-Irish | 632 | 0.9% |
| Scottish | 754 | 1.1% |
| Seminole | 5 | 0.0% |
| Senegalese | 17 | 0.0% |
| Serbian | 25 | 0.0% |
| Sierra Leonean | 31 | 0.0% |
| Sioux | 63 | 0.1% |
| Slavic | 10 | 0.0% |
| Slovak | 88 | 0.1% |
| Slovene | 17 | 0.0% |
| South African | 12 | 0.0% |
| South American | 506 | 0.7% |
| South American Indian | 44 | 0.1% |
| Spaniard | 23 | 0.0% |
| Spanish | 215 | 0.3% |
| Sri Lankan | 235 | 0.3% |
| Subsaharan African | 1,381 | 1.9% |
| Swedish | 267 | 0.4% |
| Swiss | 111 | 0.2% |
| Syrian | 39 | 0.1% |
| Thai | 217 | 0.3% |
| Trinidadian and Tobagonian | 65 | 0.1% |
| Turkish | 260 | 0.4% |
| Ukrainian | 212 | 0.3% |
| Vietnamese | 329 | 0.5% |
| Welsh | 386 | 0.5% |
| West Indian | 83 | 0.1% |
| Zimbabwean | 7 | 0.0% | View All 113 Rows |
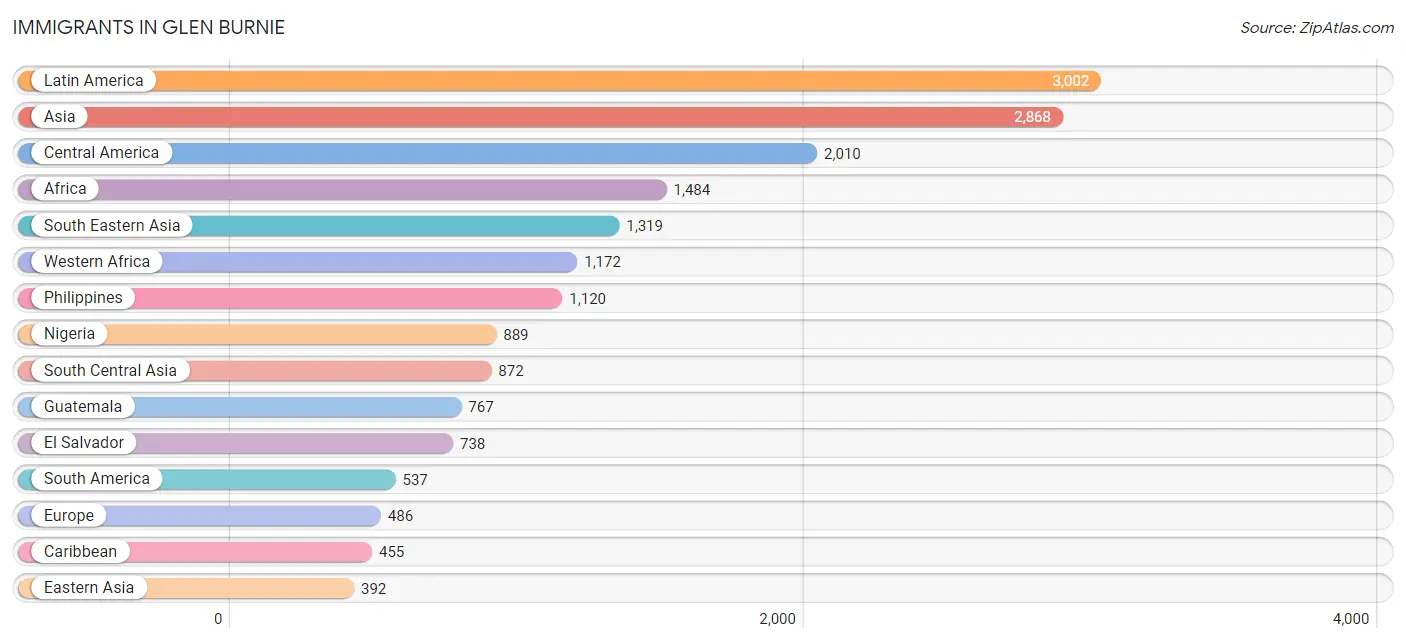
Immigrants in Glen Burnie
The most numerous immigrant groups reported in Glen Burnie came from Latin America (3,002 | 4.2%), Asia (2,868 | 4.0%), Central America (2,010 | 2.8%), Africa (1,484 | 2.1%), and South Eastern Asia (1,319 | 1.8%), together accounting for 15.0% of all Glen Burnie residents.
| Immigration Origin | # Population | % Population |
| Africa | 1,484 | 2.1% |
| Asia | 2,868 | 4.0% |
| Bangladesh | 314 | 0.4% |
| Barbados | 16 | 0.0% |
| Brazil | 184 | 0.3% |
| Cambodia | 51 | 0.1% |
| Canada | 61 | 0.1% |
| Caribbean | 455 | 0.6% |
| Central America | 2,010 | 2.8% |
| China | 181 | 0.3% |
| Colombia | 136 | 0.2% |
| Cuba | 1 | 0.0% |
| Czechoslovakia | 35 | 0.1% |
| Denmark | 6 | 0.0% |
| Dominican Republic | 142 | 0.2% |
| Eastern Africa | 85 | 0.1% |
| Eastern Asia | 392 | 0.5% |
| Eastern Europe | 35 | 0.1% |
| Ecuador | 92 | 0.1% |
| Egypt | 173 | 0.2% |
| El Salvador | 738 | 1.0% |
| England | 131 | 0.2% |
| Ethiopia | 55 | 0.1% |
| Europe | 486 | 0.7% |
| Fiji | 68 | 0.1% |
| France | 34 | 0.1% |
| Germany | 122 | 0.2% |
| Ghana | 12 | 0.0% |
| Greece | 92 | 0.1% |
| Grenada | 70 | 0.1% |
| Guatemala | 767 | 1.1% |
| Haiti | 50 | 0.1% |
| Honduras | 114 | 0.2% |
| India | 88 | 0.1% |
| Indonesia | 16 | 0.0% |
| Iran | 41 | 0.1% |
| Italy | 8 | 0.0% |
| Jamaica | 140 | 0.2% |
| Japan | 33 | 0.1% |
| Kazakhstan | 32 | 0.0% |
| Korea | 178 | 0.3% |
| Latin America | 3,002 | 4.2% |
| Lebanon | 18 | 0.0% |
| Liberia | 16 | 0.0% |
| Mexico | 336 | 0.5% |
| Morocco | 14 | 0.0% |
| Nepal | 72 | 0.1% |
| Netherlands | 14 | 0.0% |
| Nigeria | 889 | 1.2% |
| Northern Africa | 187 | 0.3% |
| Northern Europe | 145 | 0.2% |
| Oceania | 68 | 0.1% |
| Pakistan | 325 | 0.5% |
| Panama | 55 | 0.1% |
| Peru | 100 | 0.1% |
| Philippines | 1,120 | 1.6% |
| Senegal | 27 | 0.0% |
| Sierra Leone | 157 | 0.2% |
| South Africa | 40 | 0.1% |
| South America | 537 | 0.7% |
| South Central Asia | 872 | 1.2% |
| South Eastern Asia | 1,319 | 1.8% |
| Southern Europe | 136 | 0.2% |
| Spain | 36 | 0.1% |
| Thailand | 26 | 0.0% |
| Trinidad and Tobago | 36 | 0.1% |
| Turkey | 267 | 0.4% |
| Vietnam | 106 | 0.2% |
| Western Africa | 1,172 | 1.6% |
| Western Asia | 285 | 0.4% |
| Western Europe | 170 | 0.2% |
| Zimbabwe | 30 | 0.0% | View All 72 Rows |
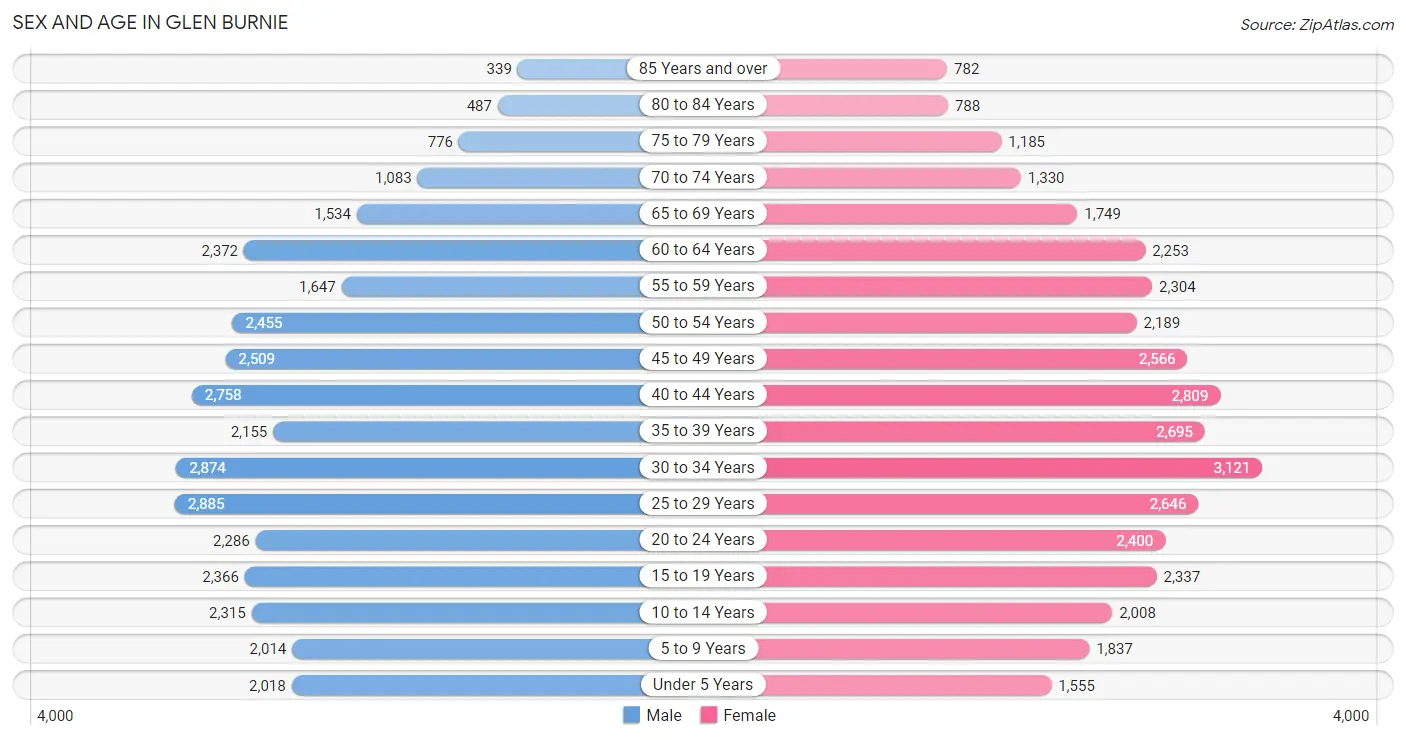
Sex and Age in Glen Burnie
Sex and Age in Glen Burnie
The most populous age groups in Glen Burnie are 25 to 29 Years (2,885 | 8.3%) for men and 30 to 34 Years (3,121 | 8.5%) for women.
| Age Bracket | Male | Female |
| Under 5 Years | 2,018 (5.8%) | 1,555 (4.3%) |
| 5 to 9 Years | 2,014 (5.8%) | 1,837 (5.0%) |
| 10 to 14 Years | 2,315 (6.6%) | 2,008 (5.5%) |
| 15 to 19 Years | 2,366 (6.8%) | 2,337 (6.4%) |
| 20 to 24 Years | 2,286 (6.6%) | 2,400 (6.6%) |
| 25 to 29 Years | 2,885 (8.3%) | 2,646 (7.2%) |
| 30 to 34 Years | 2,874 (8.2%) | 3,121 (8.5%) |
| 35 to 39 Years | 2,155 (6.2%) | 2,695 (7.4%) |
| 40 to 44 Years | 2,758 (7.9%) | 2,809 (7.7%) |
| 45 to 49 Years | 2,509 (7.2%) | 2,566 (7.0%) |
| 50 to 54 Years | 2,455 (7.0%) | 2,189 (6.0%) |
| 55 to 59 Years | 1,647 (4.7%) | 2,304 (6.3%) |
| 60 to 64 Years | 2,372 (6.8%) | 2,253 (6.2%) |
| 65 to 69 Years | 1,534 (4.4%) | 1,749 (4.8%) |
| 70 to 74 Years | 1,083 (3.1%) | 1,330 (3.6%) |
| 75 to 79 Years | 776 (2.2%) | 1,185 (3.2%) |
| 80 to 84 Years | 487 (1.4%) | 788 (2.2%) |
| 85 Years and over | 339 (1.0%) | 782 (2.1%) |
| Total | 34,873 (100.0%) | 36,554 (100.0%) |
Families and Households in Glen Burnie
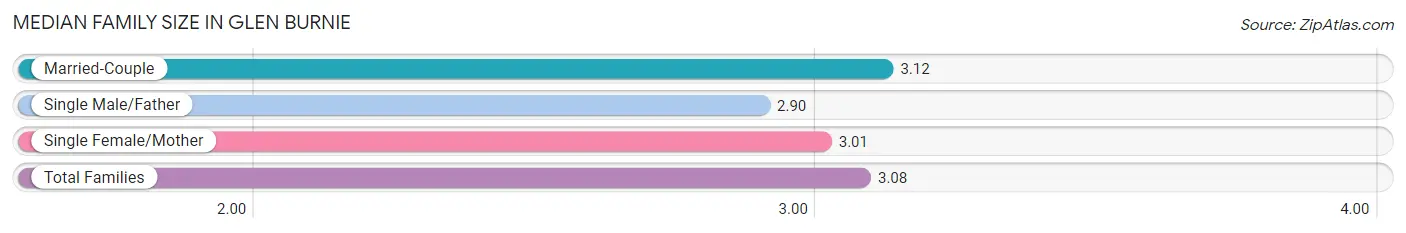
Median Family Size in Glen Burnie
The median family size in Glen Burnie is 3.08 persons per family, with married-couple families (11,854 | 66.5%) accounting for the largest median family size of 3.12 persons per family. On the other hand, single male/father families (1,271 | 7.1%) represent the smallest median family size with 2.90 persons per family.
| Family Type | # Families | Family Size |
| Married-Couple | 11,854 (66.5%) | 3.12 |
| Single Male/Father | 1,271 (7.1%) | 2.90 |
| Single Female/Mother | 4,708 (26.4%) | 3.01 |
| Total Families | 17,833 (100.0%) | 3.08 |
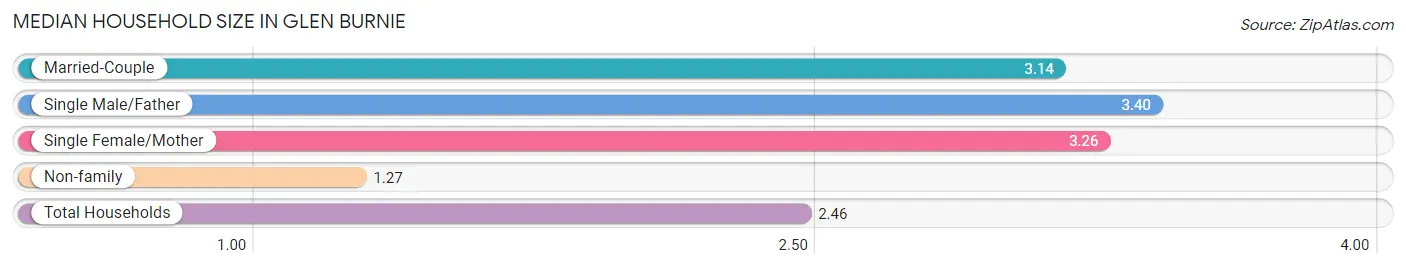
Median Household Size in Glen Burnie
The median household size in Glen Burnie is 2.46 persons per household, with single male/father households (1,271 | 4.4%) accounting for the largest median household size of 3.4 persons per household. non-family households (10,971 | 38.1%) represent the smallest median household size with 1.27 persons per household.
| Household Type | # Households | Household Size |
| Married-Couple | 11,854 (41.1%) | 3.14 |
| Single Male/Father | 1,271 (4.4%) | 3.40 |
| Single Female/Mother | 4,708 (16.3%) | 3.26 |
| Non-family | 10,971 (38.1%) | 1.27 |
| Total Households | 28,804 (100.0%) | 2.46 |
Household Size by Marriage Status in Glen Burnie
Out of a total of 28,804 households in Glen Burnie, 17,833 (61.9%) are family households, while 10,971 (38.1%) are nonfamily households. The most numerous type of family households are 2-person households, comprising 7,751, and the most common type of nonfamily households are 1-person households, comprising 8,510.
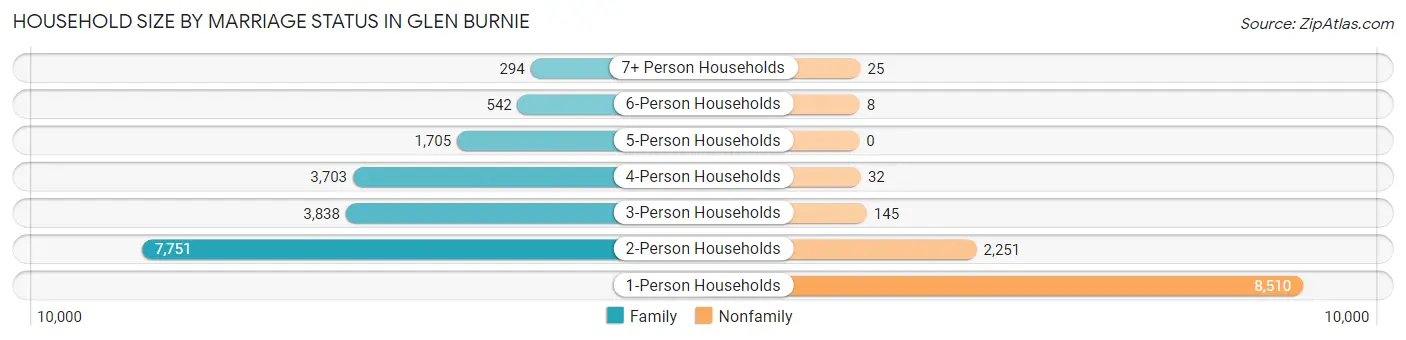
| Household Size | Family Households | Nonfamily Households |
| 1-Person Households | - | 8,510 (29.5%) |
| 2-Person Households | 7,751 (26.9%) | 2,251 (7.8%) |
| 3-Person Households | 3,838 (13.3%) | 145 (0.5%) |
| 4-Person Households | 3,703 (12.9%) | 32 (0.1%) |
| 5-Person Households | 1,705 (5.9%) | 0 (0.0%) |
| 6-Person Households | 542 (1.9%) | 8 (0.0%) |
| 7+ Person Households | 294 (1.0%) | 25 (0.1%) |
| Total | 17,833 (61.9%) | 10,971 (38.1%) |
Female Fertility in Glen Burnie
Fertility by Age in Glen Burnie
Average fertility rate in Glen Burnie is 27.0 births per 1,000 women. Women in the age bracket of 20 to 34 years have the highest fertility rate with 43.0 births per 1,000 women. Women in the age bracket of 20 to 34 years acount for 69.1% of all women with births.
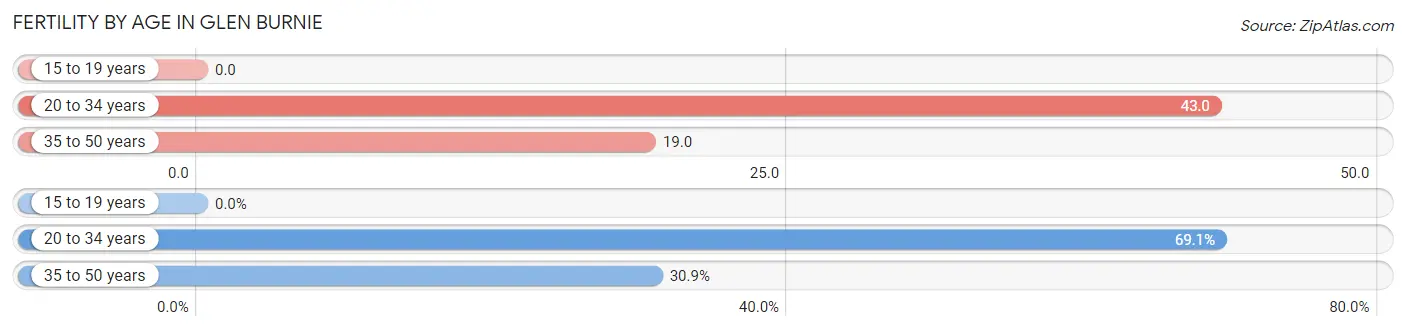
| Age Bracket | Women with Births | Births / 1,000 Women |
| 15 to 19 years | 0 (0.0%) | 0.0 |
| 20 to 34 years | 354 (69.1%) | 43.0 |
| 35 to 50 years | 158 (30.9%) | 19.0 |
| Total | 512 (100.0%) | 27.0 |
Fertility by Age by Marriage Status in Glen Burnie
83.6% of women with births (512) in Glen Burnie are married. The highest percentage of unmarried women with births falls into 20 to 34 years age bracket with 17.5% of them unmarried at the time of birth, while the lowest percentage of unmarried women with births belong to 35 to 50 years age bracket with 13.9% of them unmarried.
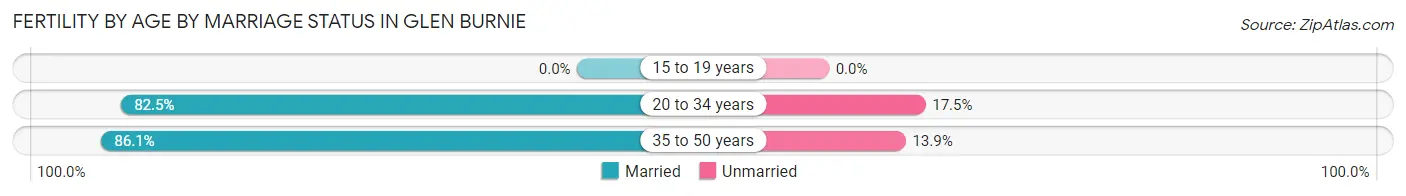
| Age Bracket | Married | Unmarried |
| 15 to 19 years | 0 (0.0%) | 0 (0.0%) |
| 20 to 34 years | 292 (82.5%) | 62 (17.5%) |
| 35 to 50 years | 136 (86.1%) | 22 (13.9%) |
| Total | 428 (83.6%) | 84 (16.4%) |
Fertility by Education in Glen Burnie
Average fertility rate in Glen Burnie is 27.0 births per 1,000 women. Women with the education attainment of graduate degree have the highest fertility rate of 40.0 births per 1,000 women, while women with the education attainment of less than high school have the lowest fertility at 10.0 births per 1,000 women. Women with the education attainment of high school diploma represent 33.0% of all women with births.
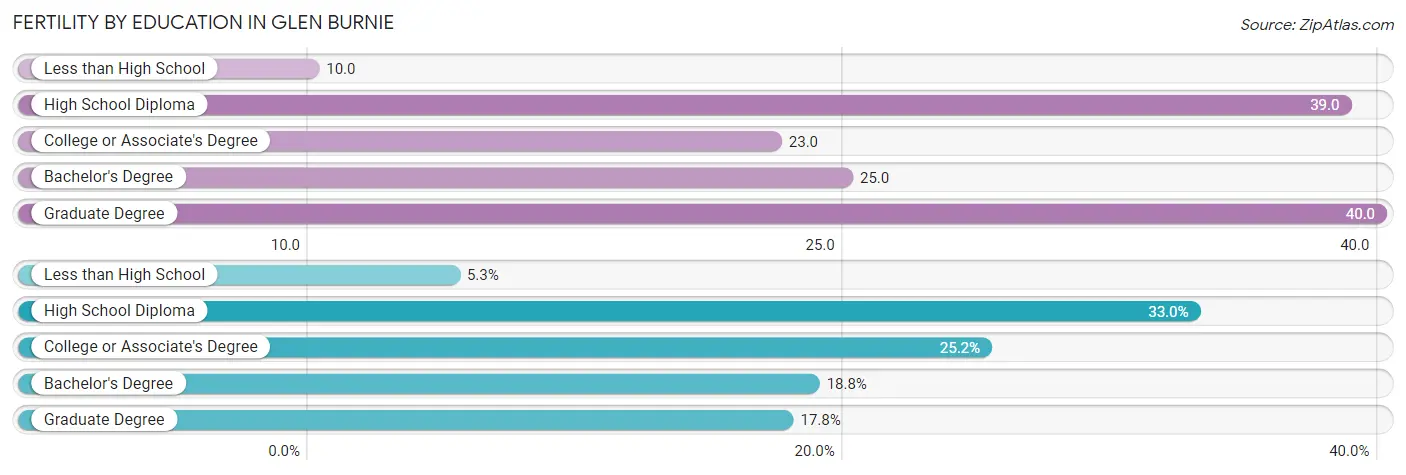
| Educational Attainment | Women with Births | Births / 1,000 Women |
| Less than High School | 27 (5.3%) | 10.0 |
| High School Diploma | 169 (33.0%) | 39.0 |
| College or Associate's Degree | 129 (25.2%) | 23.0 |
| Bachelor's Degree | 96 (18.8%) | 25.0 |
| Graduate Degree | 91 (17.8%) | 40.0 |
| Total | 512 (100.0%) | 27.0 |
Fertility by Education by Marriage Status in Glen Burnie
16.4% of women with births in Glen Burnie are unmarried. Women with the educational attainment of college or associate's degree are most likely to be married with 90.7% of them married at childbirth, while women with the educational attainment of less than high school are least likely to be married with 44.4% of them unmarried at childbirth.
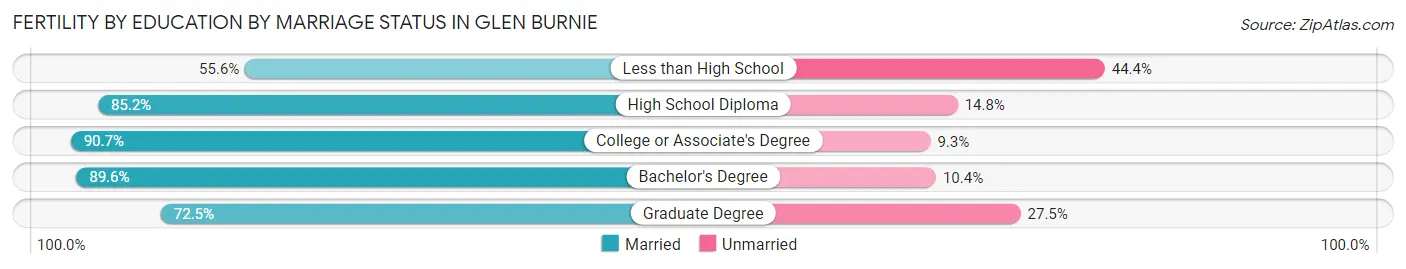
| Educational Attainment | Married | Unmarried |
| Less than High School | 15 (55.6%) | 12 (44.4%) |
| High School Diploma | 144 (85.2%) | 25 (14.8%) |
| College or Associate's Degree | 117 (90.7%) | 12 (9.3%) |
| Bachelor's Degree | 86 (89.6%) | 10 (10.4%) |
| Graduate Degree | 66 (72.5%) | 25 (27.5%) |
| Total | 428 (83.6%) | 84 (16.4%) |
Employment Characteristics in Glen Burnie
Employment by Class of Employer in Glen Burnie
Among the 38,851 employed individuals in Glen Burnie, private company employees (24,646 | 63.4%), federal government employees (4,100 | 10.5%), and local government employees (3,281 | 8.5%) make up the most common classes of employment.
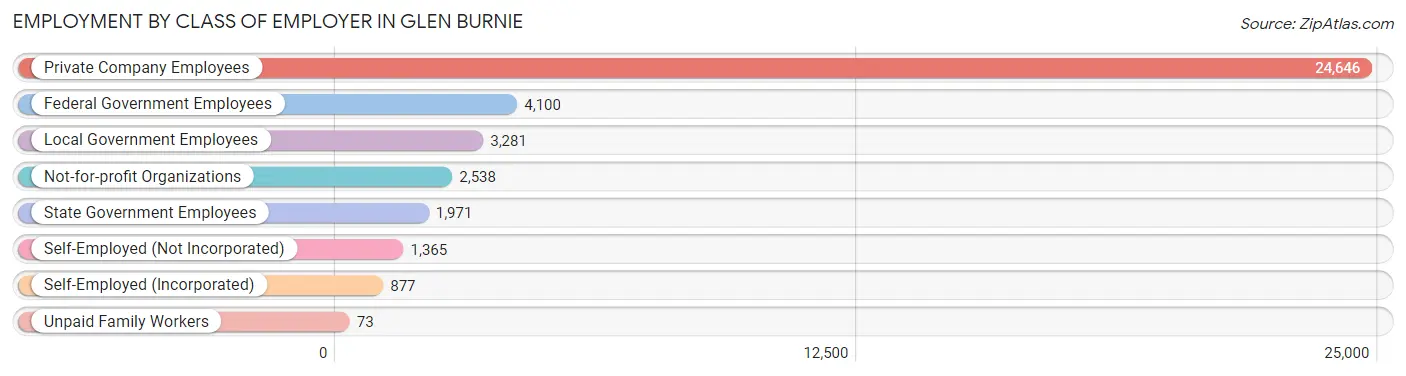
| Employer Class | # Employees | % Employees |
| Private Company Employees | 24,646 | 63.4% |
| Self-Employed (Incorporated) | 877 | 2.3% |
| Self-Employed (Not Incorporated) | 1,365 | 3.5% |
| Not-for-profit Organizations | 2,538 | 6.5% |
| Local Government Employees | 3,281 | 8.5% |
| State Government Employees | 1,971 | 5.1% |
| Federal Government Employees | 4,100 | 10.5% |
| Unpaid Family Workers | 73 | 0.2% |
| Total | 38,851 | 100.0% |
Employment Status by Age in Glen Burnie
According to the labor force statistics for Glen Burnie, out of the total population over 16 years of age (58,671), 70.5% or 41,363 individuals are in the labor force, with 4.1% or 1,696 of them unemployed. The age group with the highest labor force participation rate is 35 to 44 years, with 90.0% or 9,375 individuals in the labor force. Within the labor force, the 16 to 19 years age range has the highest percentage of unemployed individuals, with 15.7% or 267 of them being unemployed.
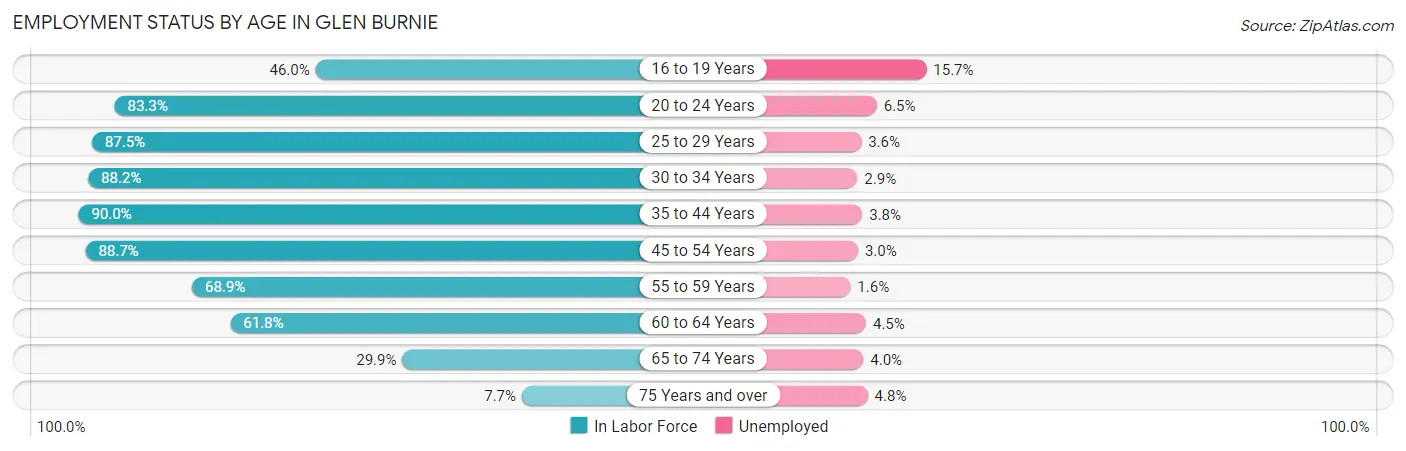
| Age Bracket | In Labor Force | Unemployed |
| 16 to 19 Years | 1,699 (46.0%) | 267 (15.7%) |
| 20 to 24 Years | 3,903 (83.3%) | 254 (6.5%) |
| 25 to 29 Years | 4,840 (87.5%) | 174 (3.6%) |
| 30 to 34 Years | 5,288 (88.2%) | 153 (2.9%) |
| 35 to 44 Years | 9,375 (90.0%) | 356 (3.8%) |
| 45 to 54 Years | 8,621 (88.7%) | 259 (3.0%) |
| 55 to 59 Years | 2,722 (68.9%) | 44 (1.6%) |
| 60 to 64 Years | 2,858 (61.8%) | 129 (4.5%) |
| 65 to 74 Years | 1,703 (29.9%) | 68 (4.0%) |
| 75 Years and over | 335 (7.7%) | 16 (4.8%) |
| Total | 41,363 (70.5%) | 1,696 (4.1%) |
Employment Status by Educational Attainment in Glen Burnie
According to labor force statistics for Glen Burnie, 83.8% of individuals (33,719) out of the total population between 25 and 64 years of age (40,238) are in the labor force, with 3.3% or 1,113 of them being unemployed. The group with the highest labor force participation rate are those with the educational attainment of bachelor's degree or higher, with 91.7% or 11,298 individuals in the labor force. Within the labor force, individuals with college / associate degree education have the highest percentage of unemployment, with 4.2% or 466 of them being unemployed.
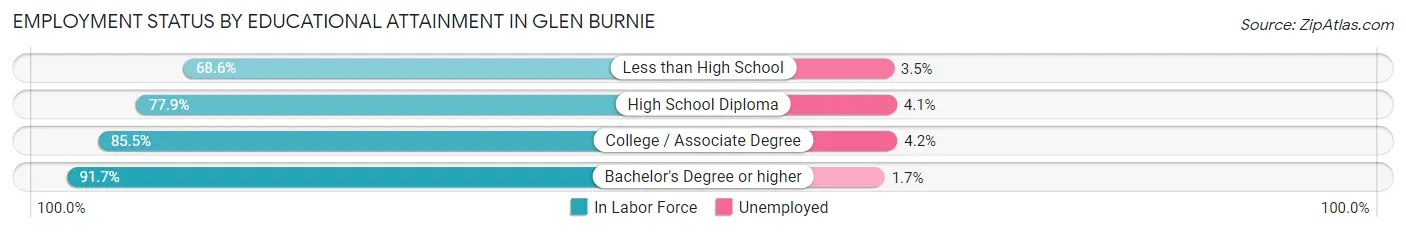
| Educational Attainment | In Labor Force | Unemployed |
| Less than High School | 2,364 (68.6%) | 121 (3.5%) |
| High School Diploma | 8,954 (77.9%) | 471 (4.1%) |
| College / Associate Degree | 11,095 (85.5%) | 545 (4.2%) |
| Bachelor's Degree or higher | 11,298 (91.7%) | 209 (1.7%) |
| Total | 33,719 (83.8%) | 1,328 (3.3%) |
Employment Occupations by Sex in Glen Burnie
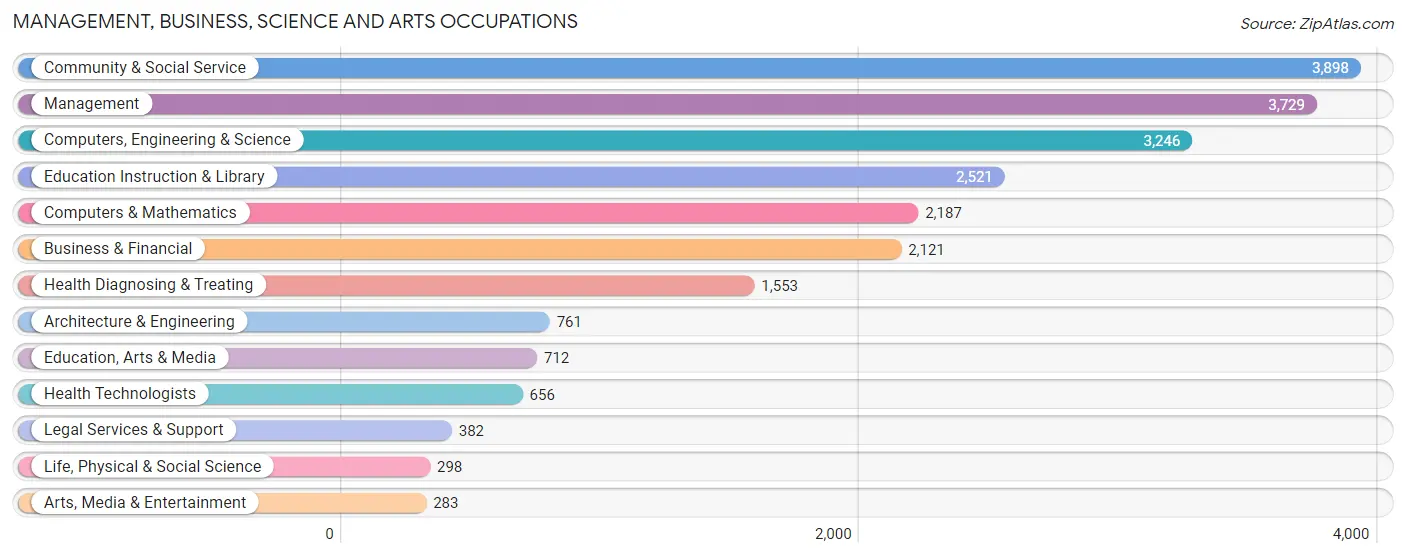
Management, Business, Science and Arts Occupations
The most common Management, Business, Science and Arts occupations in Glen Burnie are Community & Social Service (3,898 | 10.0%), Management (3,729 | 9.6%), Computers, Engineering & Science (3,246 | 8.3%), Education Instruction & Library (2,521 | 6.5%), and Computers & Mathematics (2,187 | 5.6%).
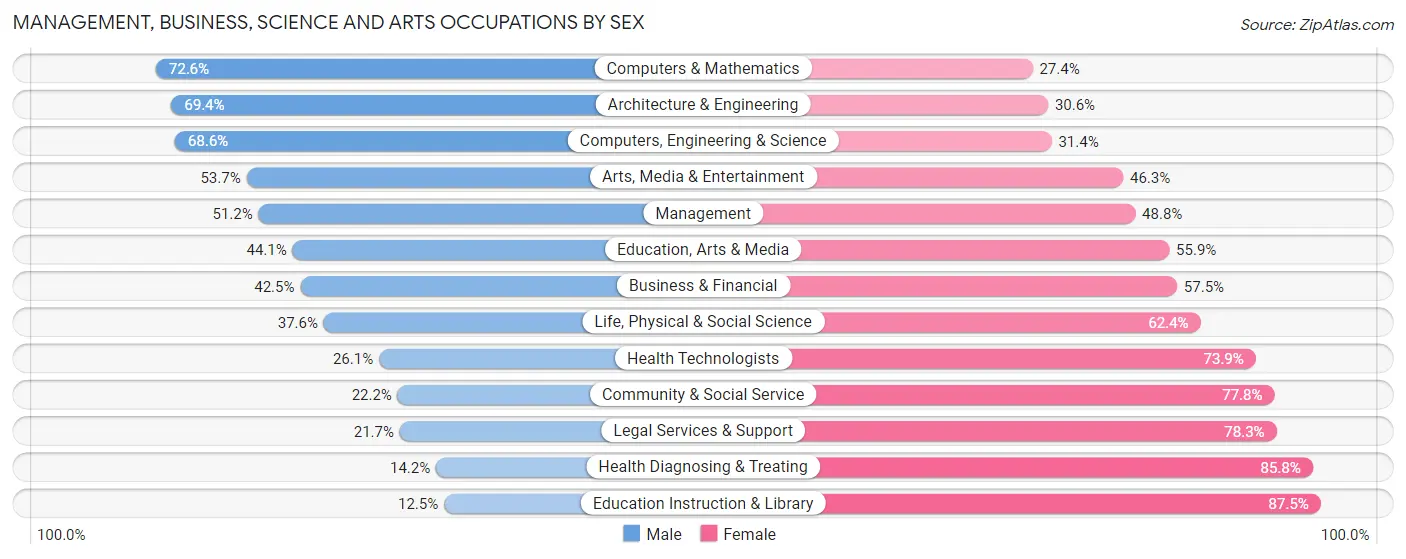
Management, Business, Science and Arts Occupations by Sex
Within the Management, Business, Science and Arts occupations in Glen Burnie, the most male-oriented occupations are Computers & Mathematics (72.6%), Architecture & Engineering (69.4%), and Computers, Engineering & Science (68.6%), while the most female-oriented occupations are Education Instruction & Library (87.5%), Health Diagnosing & Treating (85.8%), and Legal Services & Support (78.3%).
| Occupation | Male | Female |
| Management | 1,909 (51.2%) | 1,820 (48.8%) |
| Business & Financial | 901 (42.5%) | 1,220 (57.5%) |
| Computers, Engineering & Science | 2,228 (68.6%) | 1,018 (31.4%) |
| Computers & Mathematics | 1,588 (72.6%) | 599 (27.4%) |
| Architecture & Engineering | 528 (69.4%) | 233 (30.6%) |
| Life, Physical & Social Science | 112 (37.6%) | 186 (62.4%) |
| Community & Social Service | 864 (22.2%) | 3,034 (77.8%) |
| Education, Arts & Media | 314 (44.1%) | 398 (55.9%) |
| Legal Services & Support | 83 (21.7%) | 299 (78.3%) |
| Education Instruction & Library | 315 (12.5%) | 2,206 (87.5%) |
| Arts, Media & Entertainment | 152 (53.7%) | 131 (46.3%) |
| Health Diagnosing & Treating | 220 (14.2%) | 1,333 (85.8%) |
| Health Technologists | 171 (26.1%) | 485 (73.9%) |
| Total (Category) | 6,122 (42.1%) | 8,425 (57.9%) |
| Total (Overall) | 19,383 (49.8%) | 19,537 (50.2%) |
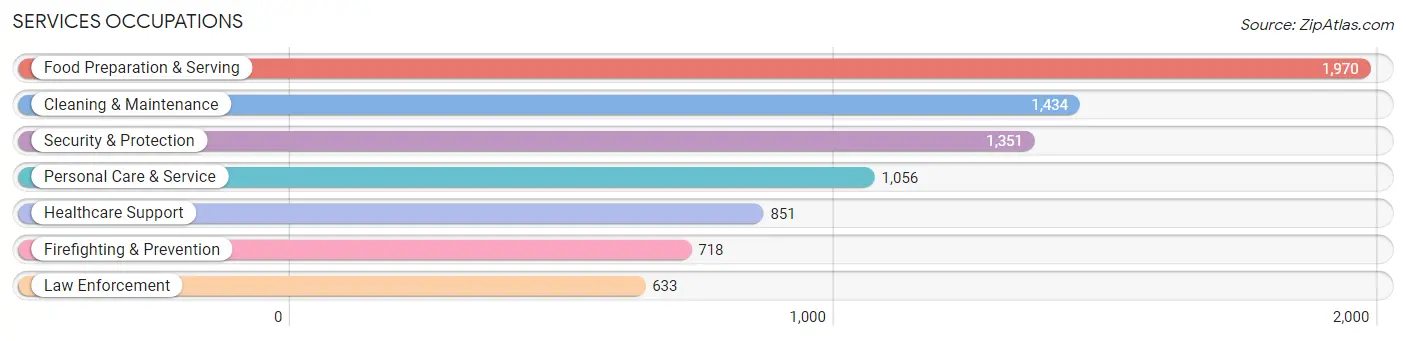
Services Occupations
The most common Services occupations in Glen Burnie are Food Preparation & Serving (1,970 | 5.1%), Cleaning & Maintenance (1,434 | 3.7%), Security & Protection (1,351 | 3.5%), Personal Care & Service (1,056 | 2.7%), and Healthcare Support (851 | 2.2%).
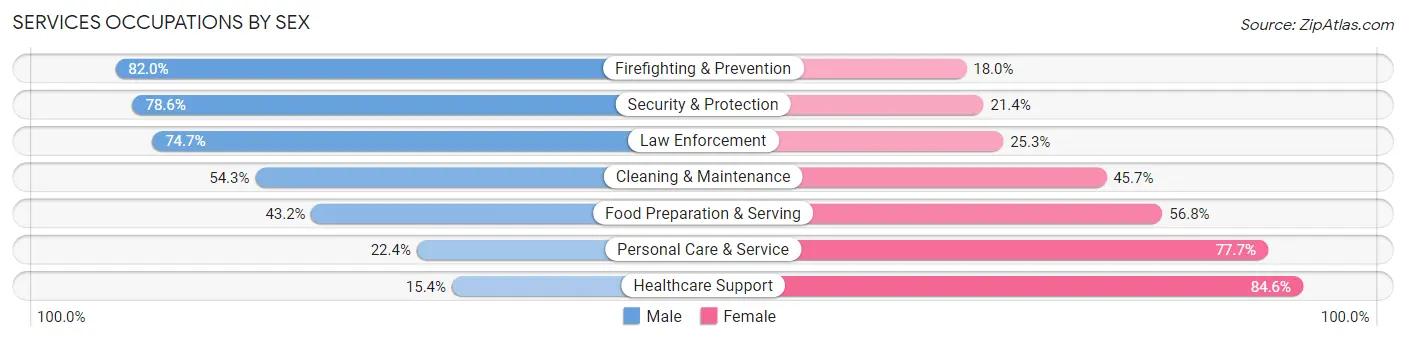
Services Occupations by Sex
Within the Services occupations in Glen Burnie, the most male-oriented occupations are Firefighting & Prevention (82.0%), Security & Protection (78.6%), and Law Enforcement (74.7%), while the most female-oriented occupations are Healthcare Support (84.6%), Personal Care & Service (77.6%), and Food Preparation & Serving (56.8%).
| Occupation | Male | Female |
| Healthcare Support | 131 (15.4%) | 720 (84.6%) |
| Security & Protection | 1,062 (78.6%) | 289 (21.4%) |
| Firefighting & Prevention | 589 (82.0%) | 129 (18.0%) |
| Law Enforcement | 473 (74.7%) | 160 (25.3%) |
| Food Preparation & Serving | 851 (43.2%) | 1,119 (56.8%) |
| Cleaning & Maintenance | 779 (54.3%) | 655 (45.7%) |
| Personal Care & Service | 236 (22.4%) | 820 (77.6%) |
| Total (Category) | 3,059 (45.9%) | 3,603 (54.1%) |
| Total (Overall) | 19,383 (49.8%) | 19,537 (50.2%) |
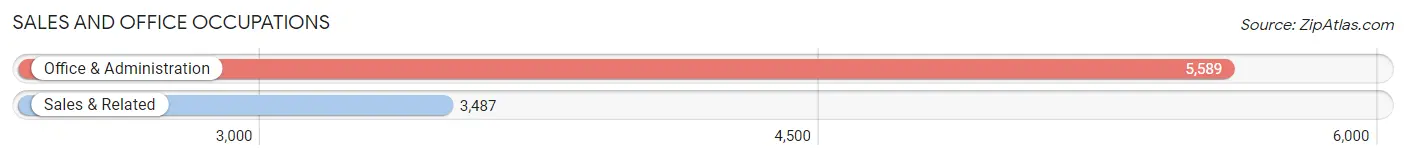
Sales and Office Occupations
The most common Sales and Office occupations in Glen Burnie are Office & Administration (5,589 | 14.4%), and Sales & Related (3,487 | 9.0%).
Sales and Office Occupations by Sex
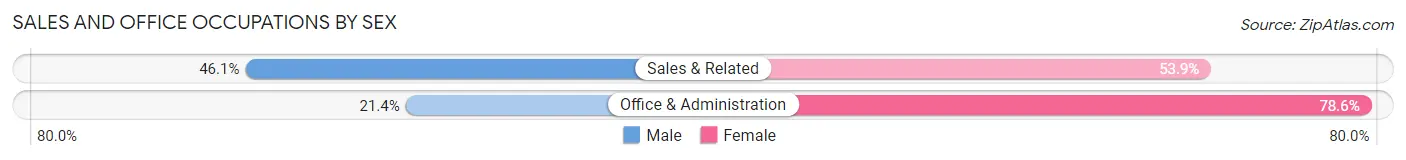
| Occupation | Male | Female |
| Sales & Related | 1,606 (46.1%) | 1,881 (53.9%) |
| Office & Administration | 1,196 (21.4%) | 4,393 (78.6%) |
| Total (Category) | 2,802 (30.9%) | 6,274 (69.1%) |
| Total (Overall) | 19,383 (49.8%) | 19,537 (50.2%) |
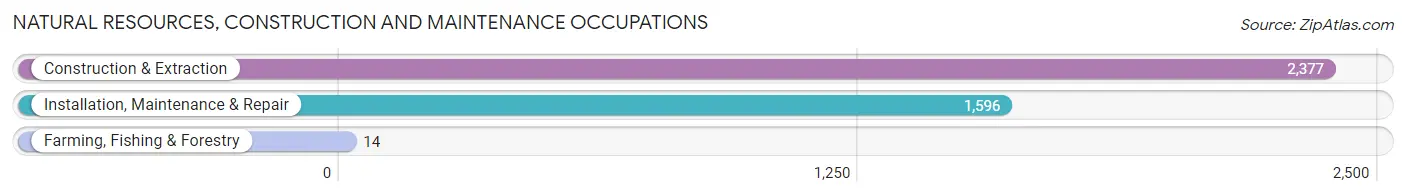
Natural Resources, Construction and Maintenance Occupations
The most common Natural Resources, Construction and Maintenance occupations in Glen Burnie are Construction & Extraction (2,377 | 6.1%), Installation, Maintenance & Repair (1,596 | 4.1%), and Farming, Fishing & Forestry (14 | 0.0%).
Natural Resources, Construction and Maintenance Occupations by Sex
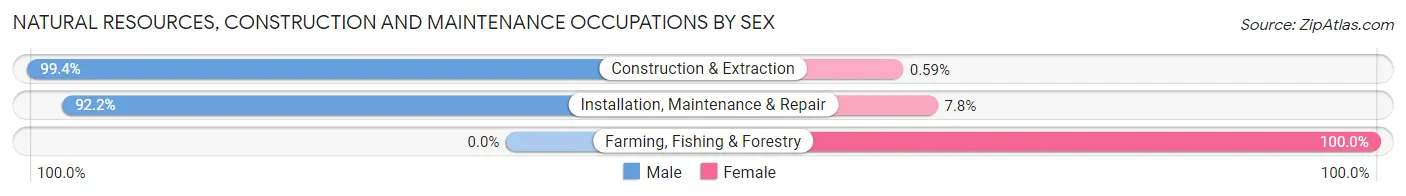
| Occupation | Male | Female |
| Farming, Fishing & Forestry | 0 (0.0%) | 14 (100.0%) |
| Construction & Extraction | 2,363 (99.4%) | 14 (0.6%) |
| Installation, Maintenance & Repair | 1,471 (92.2%) | 125 (7.8%) |
| Total (Category) | 3,834 (96.2%) | 153 (3.8%) |
| Total (Overall) | 19,383 (49.8%) | 19,537 (50.2%) |
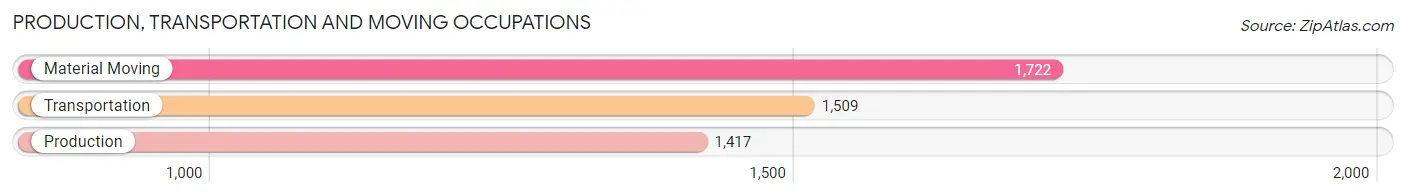
Production, Transportation and Moving Occupations
The most common Production, Transportation and Moving occupations in Glen Burnie are Material Moving (1,722 | 4.4%), Transportation (1,509 | 3.9%), and Production (1,417 | 3.6%).
Production, Transportation and Moving Occupations by Sex
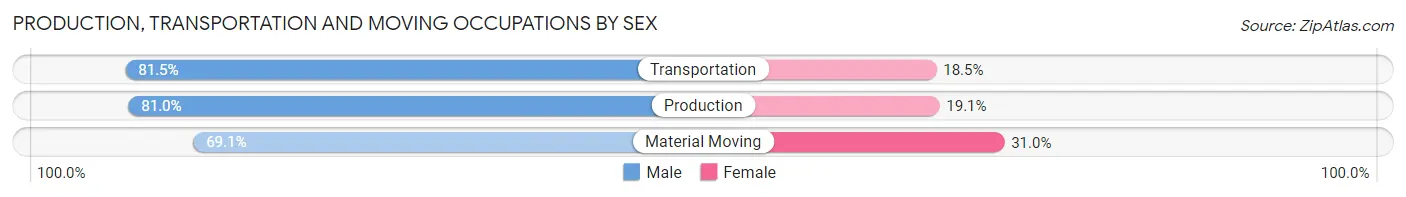
| Occupation | Male | Female |
| Production | 1,147 (80.9%) | 270 (19.1%) |
| Transportation | 1,230 (81.5%) | 279 (18.5%) |
| Material Moving | 1,189 (69.1%) | 533 (30.9%) |
| Total (Category) | 3,566 (76.7%) | 1,082 (23.3%) |
| Total (Overall) | 19,383 (49.8%) | 19,537 (50.2%) |
Employment Industries by Sex in Glen Burnie
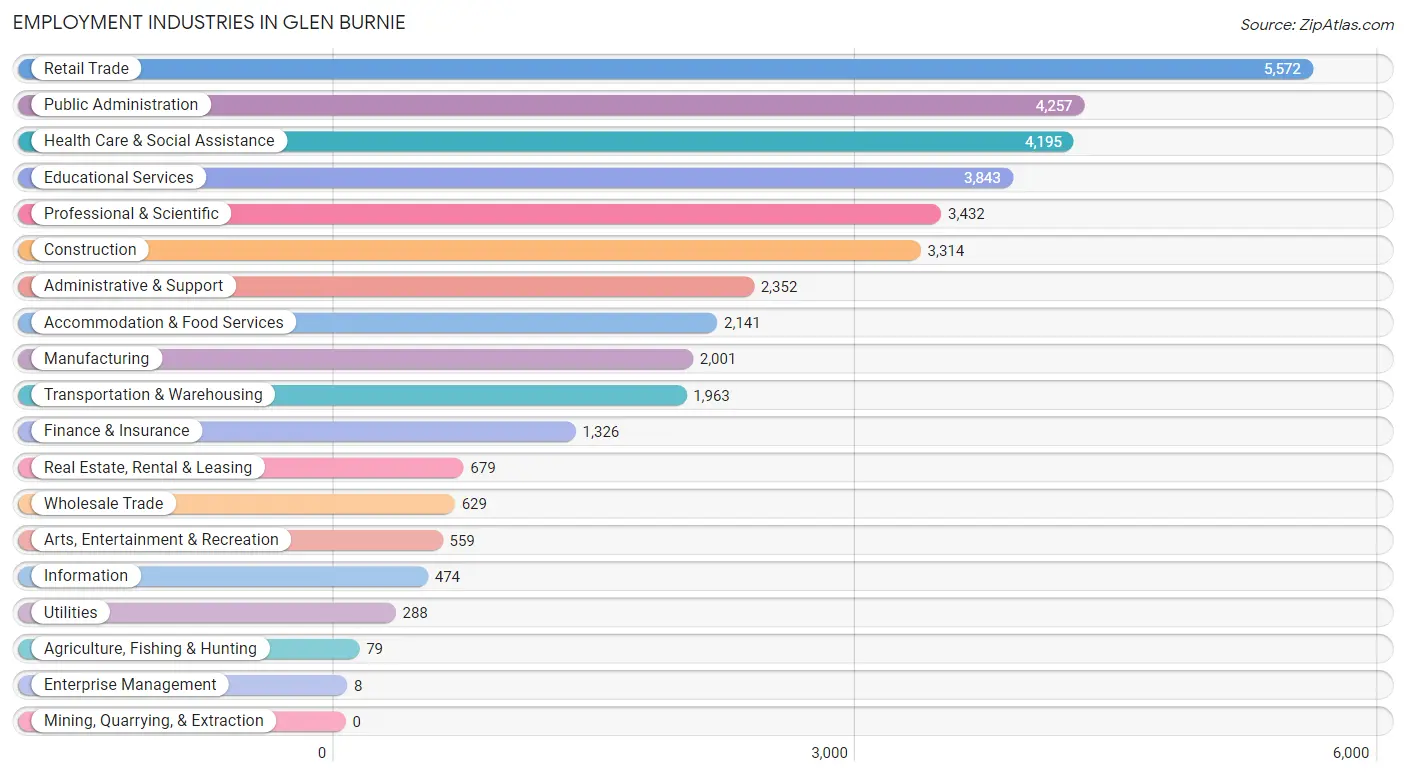
Employment Industries in Glen Burnie
The major employment industries in Glen Burnie include Retail Trade (5,572 | 14.3%), Public Administration (4,257 | 10.9%), Health Care & Social Assistance (4,195 | 10.8%), Educational Services (3,843 | 9.9%), and Professional & Scientific (3,432 | 8.8%).
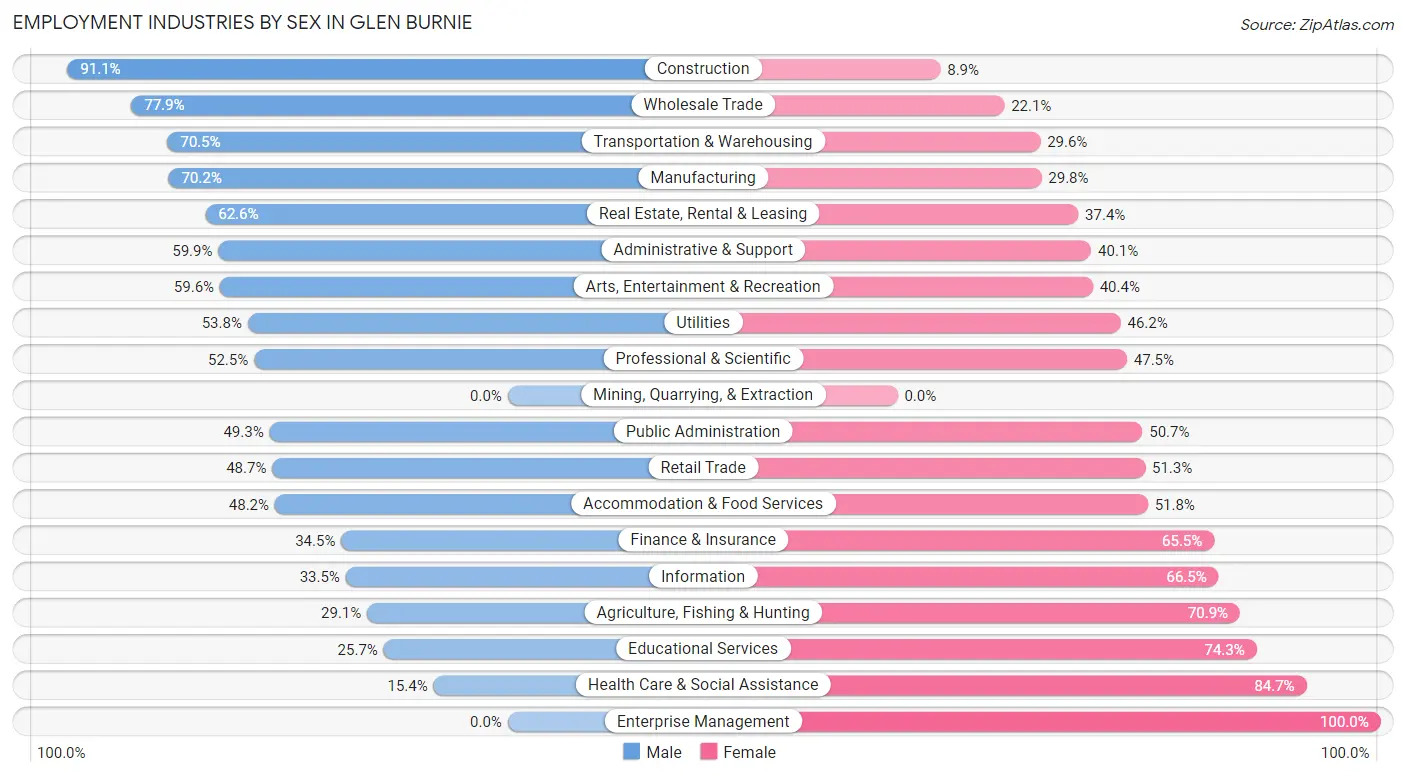
Employment Industries by Sex in Glen Burnie
The Glen Burnie industries that see more men than women are Construction (91.1%), Wholesale Trade (77.9%), and Transportation & Warehousing (70.5%), whereas the industries that tend to have a higher number of women are Enterprise Management (100.0%), Health Care & Social Assistance (84.7%), and Educational Services (74.3%).
| Industry | Male | Female |
| Agriculture, Fishing & Hunting | 23 (29.1%) | 56 (70.9%) |
| Mining, Quarrying, & Extraction | 0 (0.0%) | 0 (0.0%) |
| Construction | 3,020 (91.1%) | 294 (8.9%) |
| Manufacturing | 1,405 (70.2%) | 596 (29.8%) |
| Wholesale Trade | 490 (77.9%) | 139 (22.1%) |
| Retail Trade | 2,716 (48.7%) | 2,856 (51.3%) |
| Transportation & Warehousing | 1,383 (70.5%) | 580 (29.5%) |
| Utilities | 155 (53.8%) | 133 (46.2%) |
| Information | 159 (33.5%) | 315 (66.5%) |
| Finance & Insurance | 457 (34.5%) | 869 (65.5%) |
| Real Estate, Rental & Leasing | 425 (62.6%) | 254 (37.4%) |
| Professional & Scientific | 1,802 (52.5%) | 1,630 (47.5%) |
| Enterprise Management | 0 (0.0%) | 8 (100.0%) |
| Administrative & Support | 1,409 (59.9%) | 943 (40.1%) |
| Educational Services | 987 (25.7%) | 2,856 (74.3%) |
| Health Care & Social Assistance | 644 (15.3%) | 3,551 (84.7%) |
| Arts, Entertainment & Recreation | 333 (59.6%) | 226 (40.4%) |
| Accommodation & Food Services | 1,032 (48.2%) | 1,109 (51.8%) |
| Public Administration | 2,099 (49.3%) | 2,158 (50.7%) |
| Total | 19,383 (49.8%) | 19,537 (50.2%) |
Education in Glen Burnie
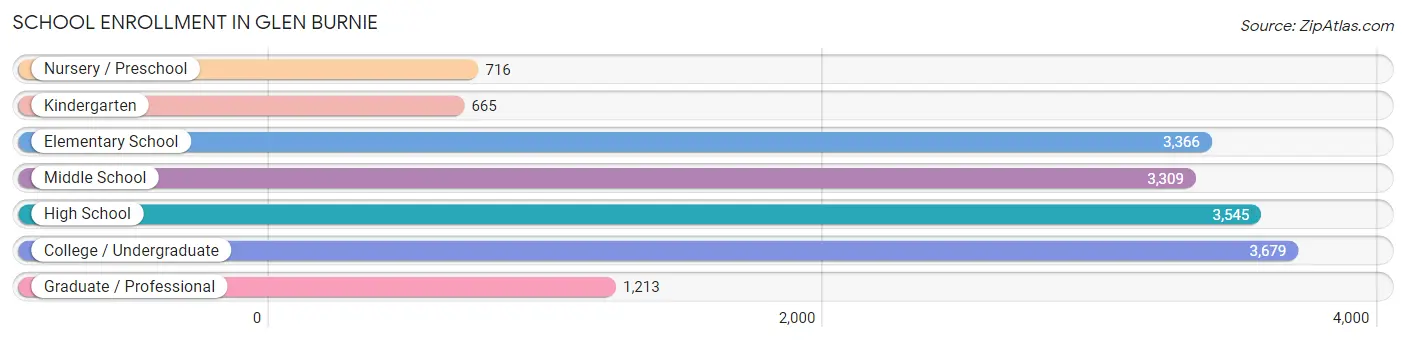
School Enrollment in Glen Burnie
The most common levels of schooling among the 16,493 students in Glen Burnie are college / undergraduate (3,679 | 22.3%), high school (3,545 | 21.5%), and elementary school (3,366 | 20.4%).
| School Level | # Students | % Students |
| Nursery / Preschool | 716 | 4.3% |
| Kindergarten | 665 | 4.0% |
| Elementary School | 3,366 | 20.4% |
| Middle School | 3,309 | 20.1% |
| High School | 3,545 | 21.5% |
| College / Undergraduate | 3,679 | 22.3% |
| Graduate / Professional | 1,213 | 7.3% |
| Total | 16,493 | 100.0% |
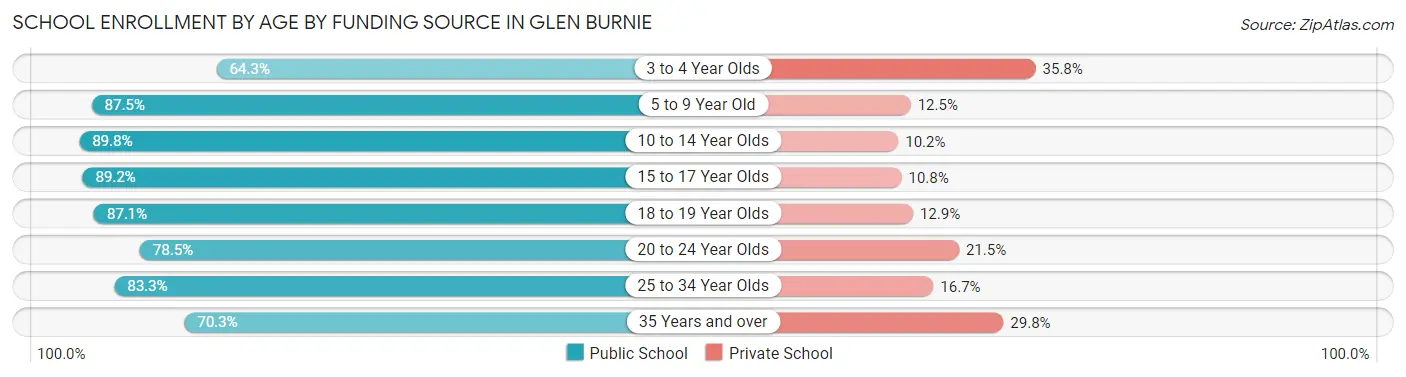
School Enrollment by Age by Funding Source in Glen Burnie
Out of a total of 16,493 students who are enrolled in schools in Glen Burnie, 2,507 (15.2%) attend a private institution, while the remaining 13,986 (84.8%) are enrolled in public schools. The age group of 3 to 4 year olds has the highest likelihood of being enrolled in private schools, with 202 (35.7% in the age bracket) enrolled. Conversely, the age group of 10 to 14 year olds has the lowest likelihood of being enrolled in a private school, with 3,836 (89.8% in the age bracket) attending a public institution.
| Age Bracket | Public School | Private School |
| 3 to 4 Year Olds | 363 (64.2%) | 202 (35.7%) |
| 5 to 9 Year Old | 3,180 (87.5%) | 454 (12.5%) |
| 10 to 14 Year Olds | 3,836 (89.8%) | 435 (10.2%) |
| 15 to 17 Year Olds | 2,376 (89.2%) | 287 (10.8%) |
| 18 to 19 Year Olds | 1,019 (87.1%) | 151 (12.9%) |
| 20 to 24 Year Olds | 1,075 (78.5%) | 294 (21.5%) |
| 25 to 34 Year Olds | 992 (83.3%) | 199 (16.7%) |
| 35 Years and over | 1,145 (70.3%) | 485 (29.7%) |
| Total | 13,986 (84.8%) | 2,507 (15.2%) |
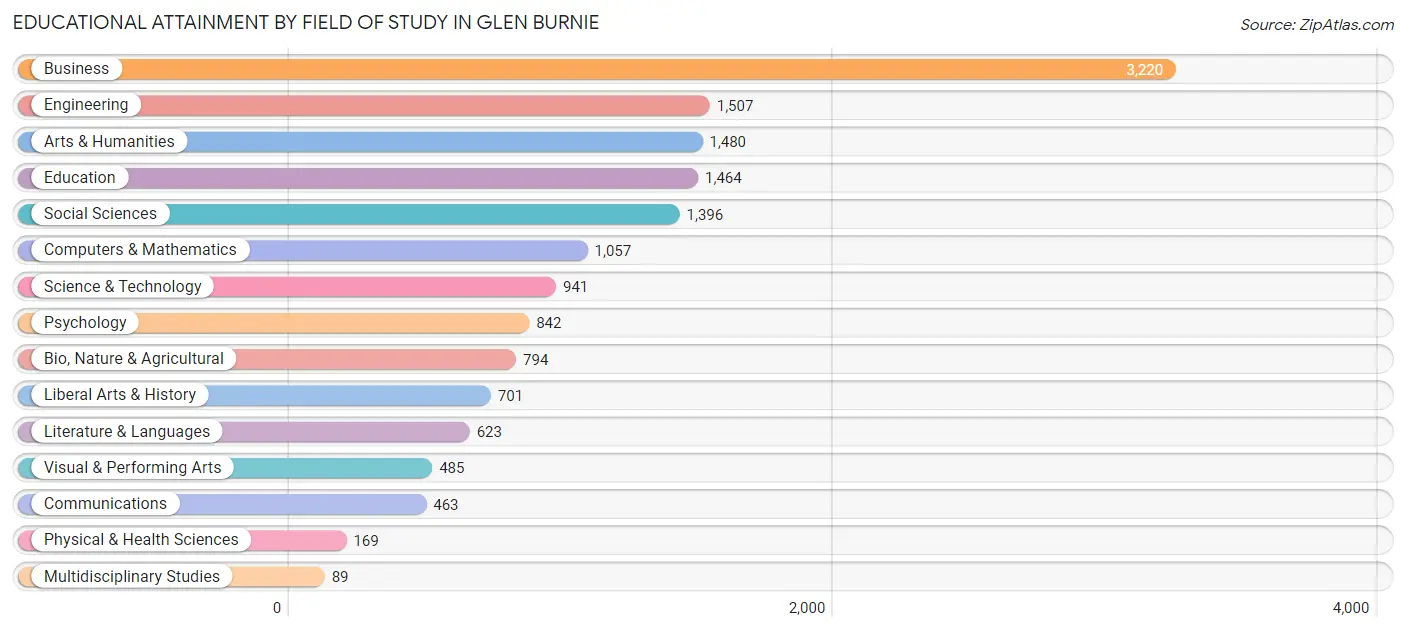
Educational Attainment by Field of Study in Glen Burnie
Business (3,220 | 21.1%), engineering (1,507 | 9.9%), arts & humanities (1,480 | 9.7%), education (1,464 | 9.6%), and social sciences (1,396 | 9.2%) are the most common fields of study among 15,231 individuals in Glen Burnie who have obtained a bachelor's degree or higher.
| Field of Study | # Graduates | % Graduates |
| Computers & Mathematics | 1,057 | 6.9% |
| Bio, Nature & Agricultural | 794 | 5.2% |
| Physical & Health Sciences | 169 | 1.1% |
| Psychology | 842 | 5.5% |
| Social Sciences | 1,396 | 9.2% |
| Engineering | 1,507 | 9.9% |
| Multidisciplinary Studies | 89 | 0.6% |
| Science & Technology | 941 | 6.2% |
| Business | 3,220 | 21.1% |
| Education | 1,464 | 9.6% |
| Literature & Languages | 623 | 4.1% |
| Liberal Arts & History | 701 | 4.6% |
| Visual & Performing Arts | 485 | 3.2% |
| Communications | 463 | 3.0% |
| Arts & Humanities | 1,480 | 9.7% |
| Total | 15,231 | 100.0% |
Transportation & Commute in Glen Burnie
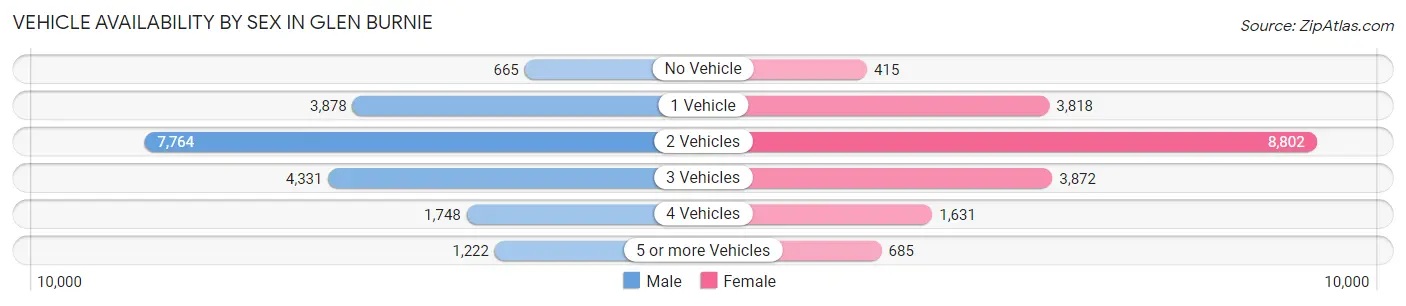
Vehicle Availability by Sex in Glen Burnie
The most prevalent vehicle ownership categories in Glen Burnie are males with 2 vehicles (7,764, accounting for 39.6%) and females with 2 vehicles (8,802, making up 40.4%).
| Vehicles Available | Male | Female |
| No Vehicle | 665 (3.4%) | 415 (2.2%) |
| 1 Vehicle | 3,878 (19.8%) | 3,818 (19.9%) |
| 2 Vehicles | 7,764 (39.6%) | 8,802 (45.8%) |
| 3 Vehicles | 4,331 (22.1%) | 3,872 (20.1%) |
| 4 Vehicles | 1,748 (8.9%) | 1,631 (8.5%) |
| 5 or more Vehicles | 1,222 (6.2%) | 685 (3.6%) |
| Total | 19,608 (100.0%) | 19,223 (100.0%) |
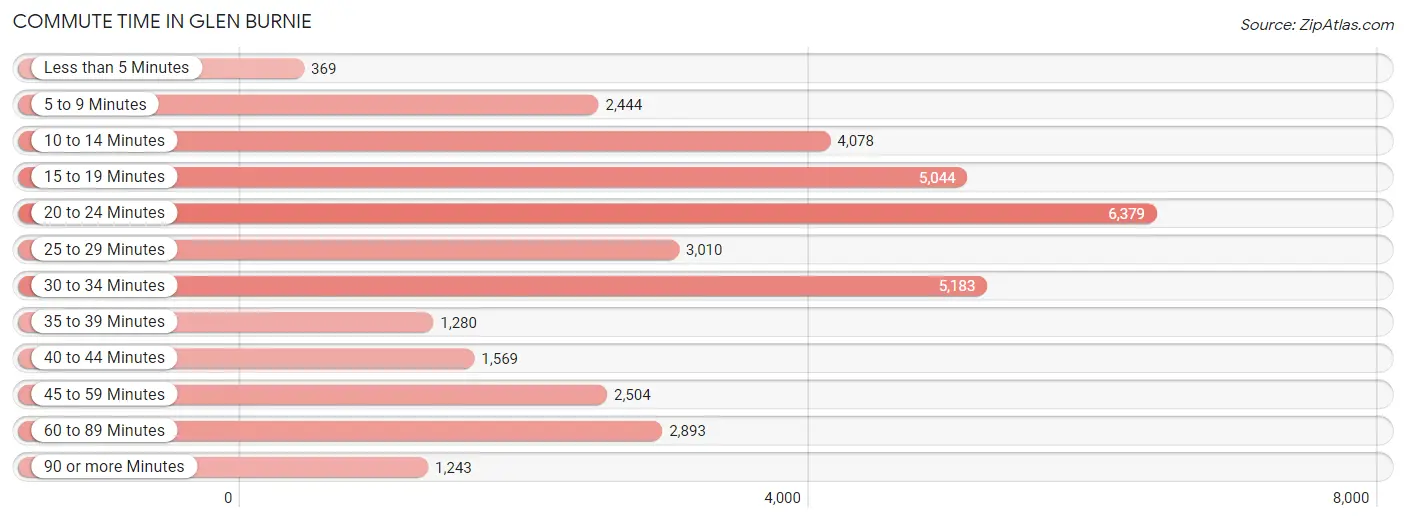
Commute Time in Glen Burnie
The most frequently occuring commute durations in Glen Burnie are 20 to 24 minutes (6,379 commuters, 17.7%), 30 to 34 minutes (5,183 commuters, 14.4%), and 15 to 19 minutes (5,044 commuters, 14.0%).
| Commute Time | # Commuters | % Commuters |
| Less than 5 Minutes | 369 | 1.0% |
| 5 to 9 Minutes | 2,444 | 6.8% |
| 10 to 14 Minutes | 4,078 | 11.3% |
| 15 to 19 Minutes | 5,044 | 14.0% |
| 20 to 24 Minutes | 6,379 | 17.7% |
| 25 to 29 Minutes | 3,010 | 8.4% |
| 30 to 34 Minutes | 5,183 | 14.4% |
| 35 to 39 Minutes | 1,280 | 3.6% |
| 40 to 44 Minutes | 1,569 | 4.4% |
| 45 to 59 Minutes | 2,504 | 7.0% |
| 60 to 89 Minutes | 2,893 | 8.0% |
| 90 or more Minutes | 1,243 | 3.5% |
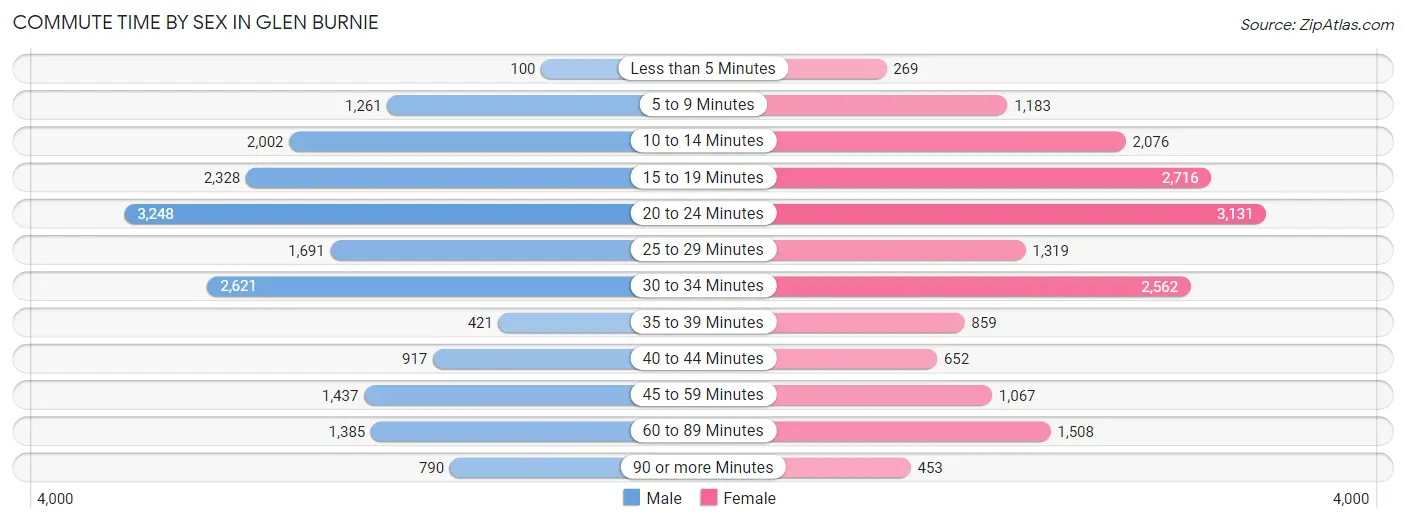
Commute Time by Sex in Glen Burnie
The most common commute times in Glen Burnie are 20 to 24 minutes (3,248 commuters, 17.8%) for males and 20 to 24 minutes (3,131 commuters, 17.6%) for females.
| Commute Time | Male | Female |
| Less than 5 Minutes | 100 (0.5%) | 269 (1.5%) |
| 5 to 9 Minutes | 1,261 (6.9%) | 1,183 (6.7%) |
| 10 to 14 Minutes | 2,002 (11.0%) | 2,076 (11.7%) |
| 15 to 19 Minutes | 2,328 (12.8%) | 2,716 (15.3%) |
| 20 to 24 Minutes | 3,248 (17.8%) | 3,131 (17.6%) |
| 25 to 29 Minutes | 1,691 (9.3%) | 1,319 (7.4%) |
| 30 to 34 Minutes | 2,621 (14.4%) | 2,562 (14.4%) |
| 35 to 39 Minutes | 421 (2.3%) | 859 (4.8%) |
| 40 to 44 Minutes | 917 (5.0%) | 652 (3.7%) |
| 45 to 59 Minutes | 1,437 (7.9%) | 1,067 (6.0%) |
| 60 to 89 Minutes | 1,385 (7.6%) | 1,508 (8.5%) |
| 90 or more Minutes | 790 (4.3%) | 453 (2.5%) |
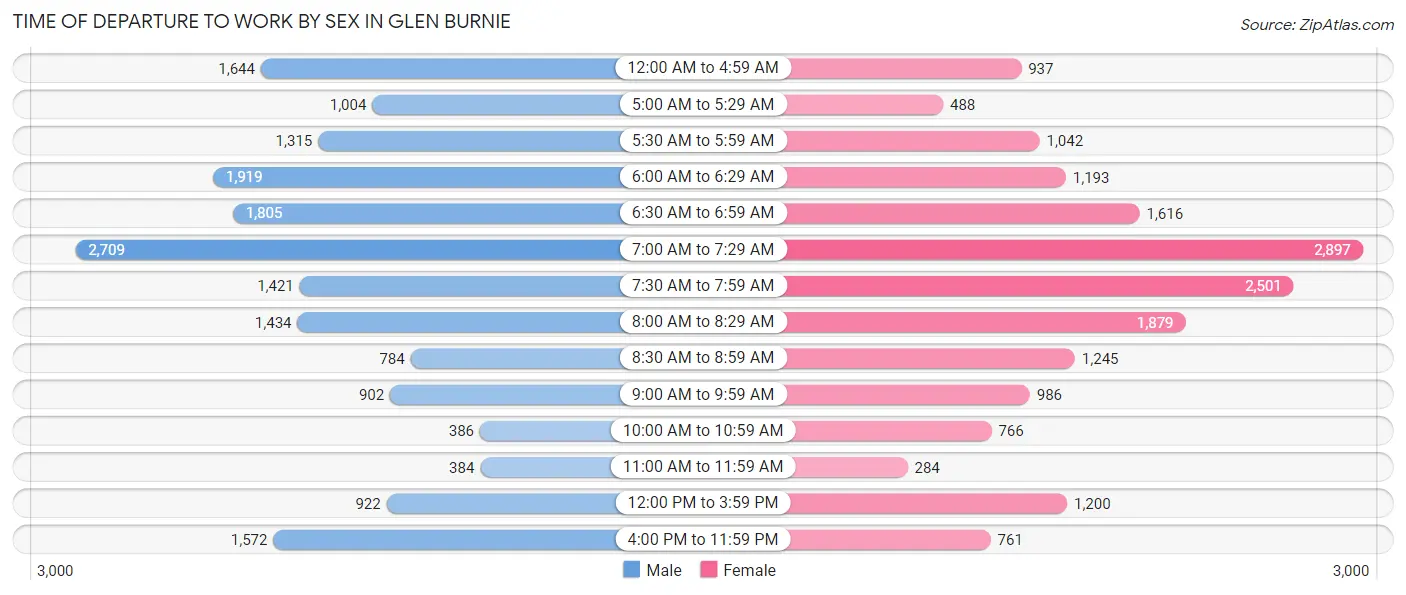
Time of Departure to Work by Sex in Glen Burnie
The most frequent times of departure to work in Glen Burnie are 7:00 AM to 7:29 AM (2,709, 14.9%) for males and 7:00 AM to 7:29 AM (2,897, 16.3%) for females.
| Time of Departure | Male | Female |
| 12:00 AM to 4:59 AM | 1,644 (9.0%) | 937 (5.3%) |
| 5:00 AM to 5:29 AM | 1,004 (5.5%) | 488 (2.7%) |
| 5:30 AM to 5:59 AM | 1,315 (7.2%) | 1,042 (5.9%) |
| 6:00 AM to 6:29 AM | 1,919 (10.5%) | 1,193 (6.7%) |
| 6:30 AM to 6:59 AM | 1,805 (9.9%) | 1,616 (9.1%) |
| 7:00 AM to 7:29 AM | 2,709 (14.9%) | 2,897 (16.3%) |
| 7:30 AM to 7:59 AM | 1,421 (7.8%) | 2,501 (14.1%) |
| 8:00 AM to 8:29 AM | 1,434 (7.9%) | 1,879 (10.6%) |
| 8:30 AM to 8:59 AM | 784 (4.3%) | 1,245 (7.0%) |
| 9:00 AM to 9:59 AM | 902 (5.0%) | 986 (5.5%) |
| 10:00 AM to 10:59 AM | 386 (2.1%) | 766 (4.3%) |
| 11:00 AM to 11:59 AM | 384 (2.1%) | 284 (1.6%) |
| 12:00 PM to 3:59 PM | 922 (5.1%) | 1,200 (6.7%) |
| 4:00 PM to 11:59 PM | 1,572 (8.6%) | 761 (4.3%) |
| Total | 18,201 (100.0%) | 17,795 (100.0%) |
Housing Occupancy in Glen Burnie
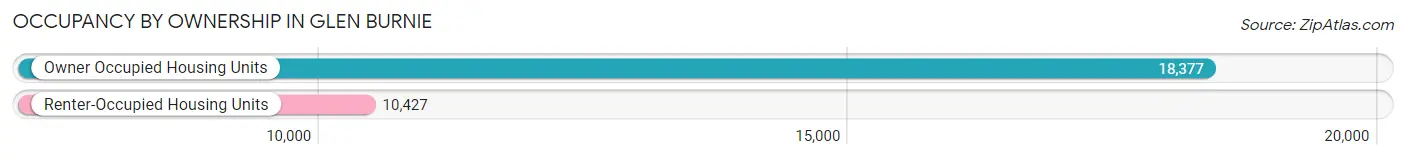
Occupancy by Ownership in Glen Burnie
Of the total 28,804 dwellings in Glen Burnie, owner-occupied units account for 18,377 (63.8%), while renter-occupied units make up 10,427 (36.2%).
| Occupancy | # Housing Units | % Housing Units |
| Owner Occupied Housing Units | 18,377 | 63.8% |
| Renter-Occupied Housing Units | 10,427 | 36.2% |
| Total Occupied Housing Units | 28,804 | 100.0% |
Occupancy by Household Size in Glen Burnie
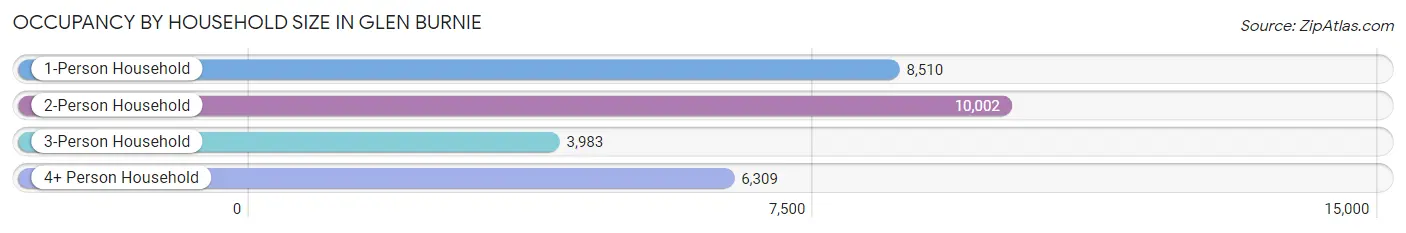
| Household Size | # Housing Units | % Housing Units |
| 1-Person Household | 8,510 | 29.5% |
| 2-Person Household | 10,002 | 34.7% |
| 3-Person Household | 3,983 | 13.8% |
| 4+ Person Household | 6,309 | 21.9% |
| Total Housing Units | 28,804 | 100.0% |
Occupancy by Ownership by Household Size in Glen Burnie
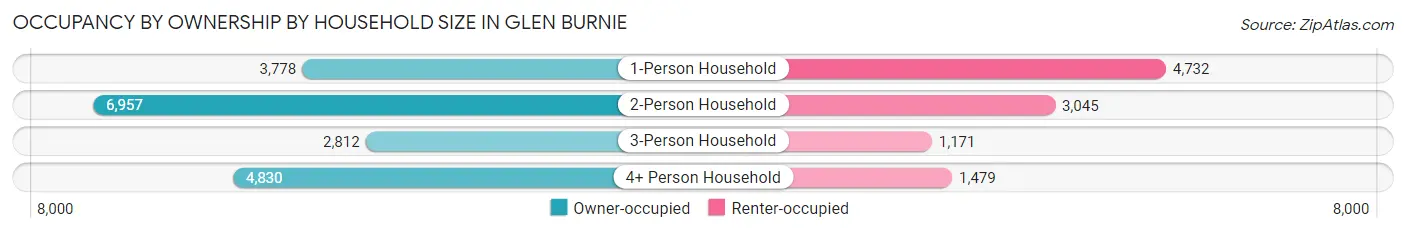
| Household Size | Owner-occupied | Renter-occupied |
| 1-Person Household | 3,778 (44.4%) | 4,732 (55.6%) |
| 2-Person Household | 6,957 (69.6%) | 3,045 (30.4%) |
| 3-Person Household | 2,812 (70.6%) | 1,171 (29.4%) |
| 4+ Person Household | 4,830 (76.6%) | 1,479 (23.4%) |
| Total Housing Units | 18,377 (63.8%) | 10,427 (36.2%) |
Occupancy by Educational Attainment in Glen Burnie
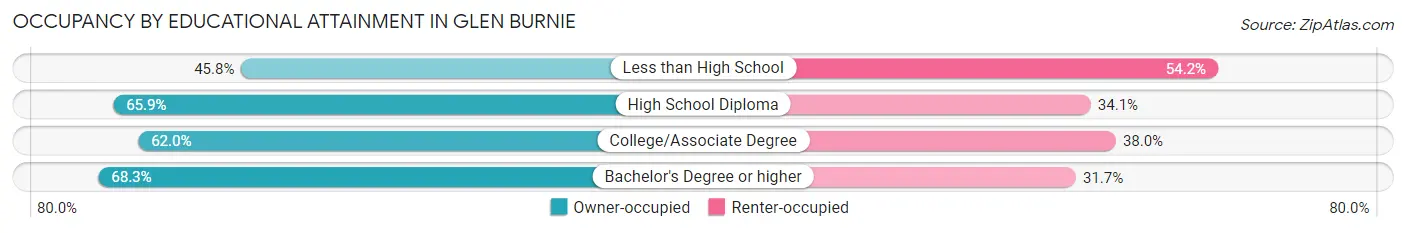
| Household Size | Owner-occupied | Renter-occupied |
| Less than High School | 975 (45.8%) | 1,154 (54.2%) |
| High School Diploma | 4,934 (65.9%) | 2,549 (34.1%) |
| College/Associate Degree | 6,256 (62.0%) | 3,839 (38.0%) |
| Bachelor's Degree or higher | 6,212 (68.3%) | 2,885 (31.7%) |
Occupancy by Age of Householder in Glen Burnie
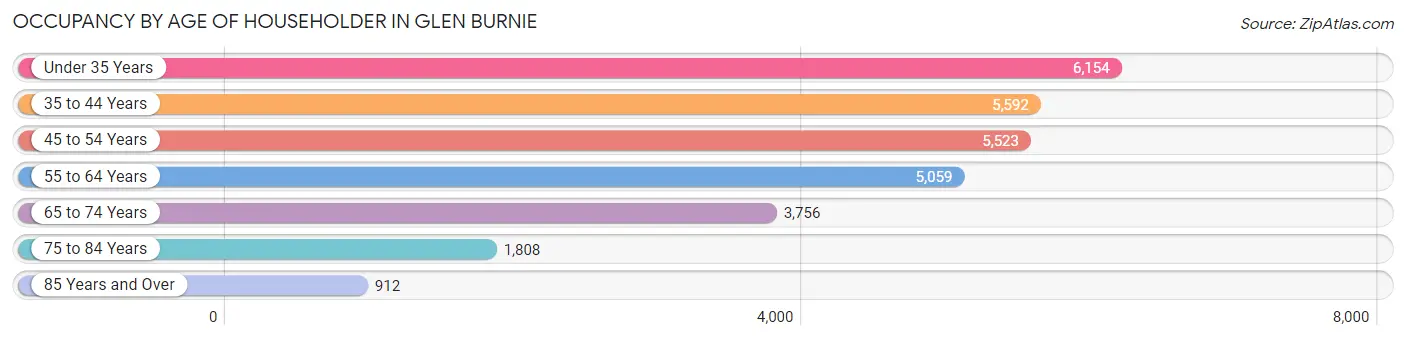
| Age Bracket | # Households | % Households |
| Under 35 Years | 6,154 | 21.4% |
| 35 to 44 Years | 5,592 | 19.4% |
| 45 to 54 Years | 5,523 | 19.2% |
| 55 to 64 Years | 5,059 | 17.6% |
| 65 to 74 Years | 3,756 | 13.0% |
| 75 to 84 Years | 1,808 | 6.3% |
| 85 Years and Over | 912 | 3.2% |
| Total | 28,804 | 100.0% |
Housing Finances in Glen Burnie
Median Income by Occupancy in Glen Burnie
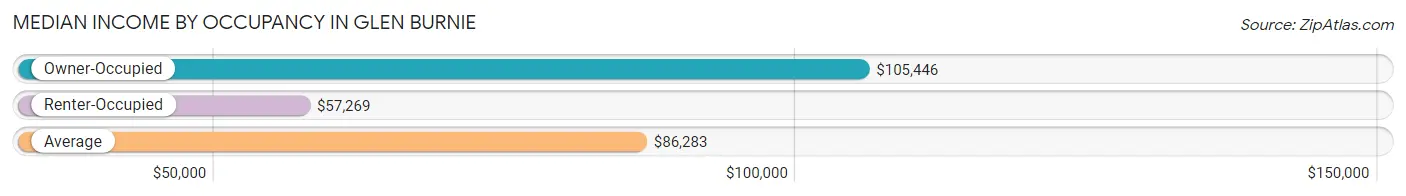
| Occupancy Type | # Households | Median Income |
| Owner-Occupied | 18,377 (63.8%) | $105,446 |
| Renter-Occupied | 10,427 (36.2%) | $57,269 |
| Average | 28,804 (100.0%) | $86,283 |
Occupancy by Householder Income Bracket in Glen Burnie
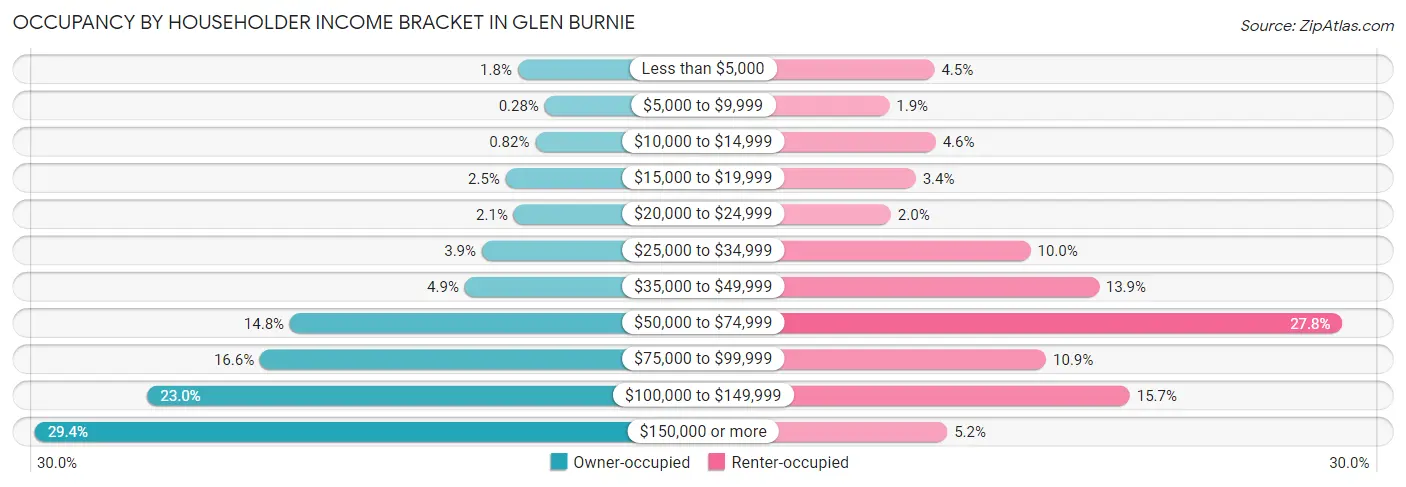
| Income Bracket | Owner-occupied | Renter-occupied |
| Less than $5,000 | 335 (1.8%) | 470 (4.5%) |
| $5,000 to $9,999 | 51 (0.3%) | 201 (1.9%) |
| $10,000 to $14,999 | 151 (0.8%) | 478 (4.6%) |
| $15,000 to $19,999 | 462 (2.5%) | 359 (3.4%) |
| $20,000 to $24,999 | 376 (2.1%) | 211 (2.0%) |
| $25,000 to $34,999 | 711 (3.9%) | 1,043 (10.0%) |
| $35,000 to $49,999 | 891 (4.9%) | 1,449 (13.9%) |
| $50,000 to $74,999 | 2,728 (14.8%) | 2,900 (27.8%) |
| $75,000 to $99,999 | 3,042 (16.6%) | 1,136 (10.9%) |
| $100,000 to $149,999 | 4,223 (23.0%) | 1,634 (15.7%) |
| $150,000 or more | 5,407 (29.4%) | 546 (5.2%) |
| Total | 18,377 (100.0%) | 10,427 (100.0%) |
Monthly Housing Cost Tiers in Glen Burnie
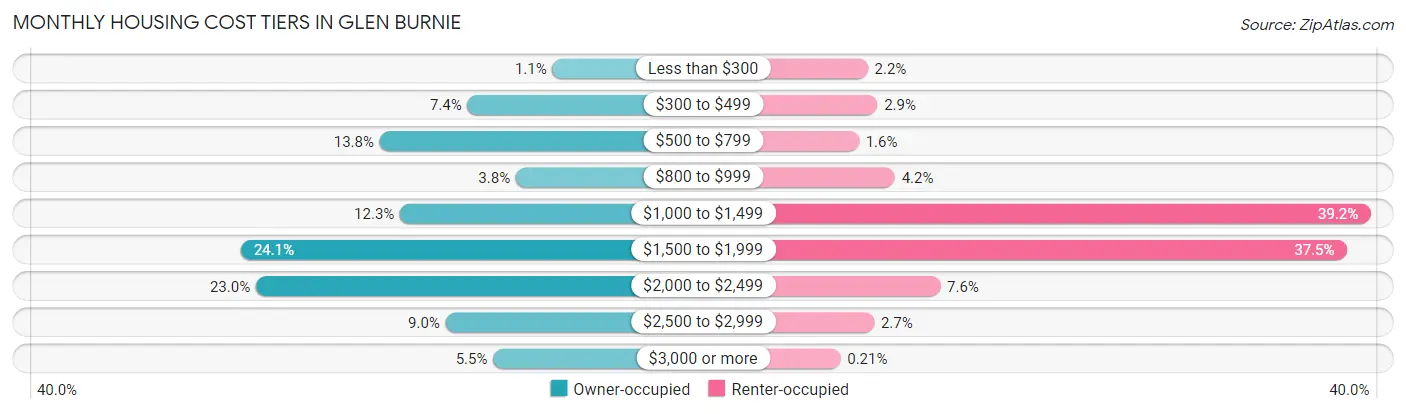
| Monthly Cost | Owner-occupied | Renter-occupied |
| Less than $300 | 205 (1.1%) | 231 (2.2%) |
| $300 to $499 | 1,356 (7.4%) | 306 (2.9%) |
| $500 to $799 | 2,544 (13.8%) | 164 (1.6%) |
| $800 to $999 | 701 (3.8%) | 440 (4.2%) |
| $1,000 to $1,499 | 2,267 (12.3%) | 4,091 (39.2%) |
| $1,500 to $1,999 | 4,425 (24.1%) | 3,908 (37.5%) |
| $2,000 to $2,499 | 4,220 (23.0%) | 788 (7.6%) |
| $2,500 to $2,999 | 1,652 (9.0%) | 281 (2.7%) |
| $3,000 or more | 1,007 (5.5%) | 22 (0.2%) |
| Total | 18,377 (100.0%) | 10,427 (100.0%) |
Physical Housing Characteristics in Glen Burnie
Housing Structures in Glen Burnie
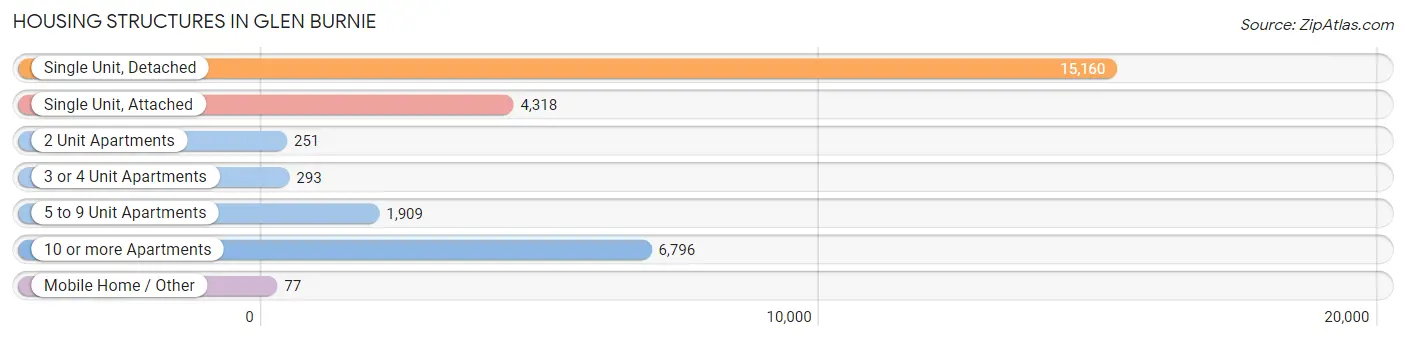
| Structure Type | # Housing Units | % Housing Units |
| Single Unit, Detached | 15,160 | 52.6% |
| Single Unit, Attached | 4,318 | 15.0% |
| 2 Unit Apartments | 251 | 0.9% |
| 3 or 4 Unit Apartments | 293 | 1.0% |
| 5 to 9 Unit Apartments | 1,909 | 6.6% |
| 10 or more Apartments | 6,796 | 23.6% |
| Mobile Home / Other | 77 | 0.3% |
| Total | 28,804 | 100.0% |
Housing Structures by Occupancy in Glen Burnie
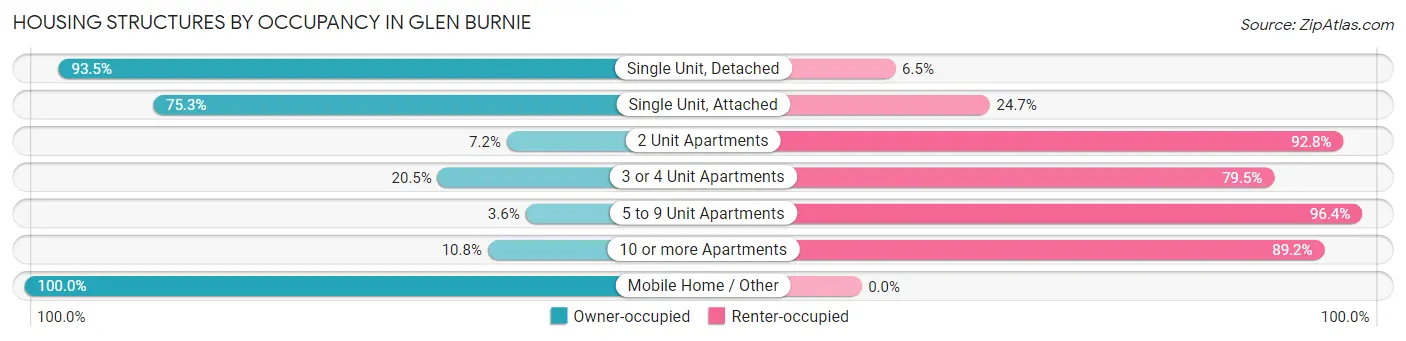
| Structure Type | Owner-occupied | Renter-occupied |
| Single Unit, Detached | 14,168 (93.5%) | 992 (6.5%) |
| Single Unit, Attached | 3,250 (75.3%) | 1,068 (24.7%) |
| 2 Unit Apartments | 18 (7.2%) | 233 (92.8%) |
| 3 or 4 Unit Apartments | 60 (20.5%) | 233 (79.5%) |
| 5 to 9 Unit Apartments | 68 (3.6%) | 1,841 (96.4%) |
| 10 or more Apartments | 736 (10.8%) | 6,060 (89.2%) |
| Mobile Home / Other | 77 (100.0%) | 0 (0.0%) |
| Total | 18,377 (63.8%) | 10,427 (36.2%) |
Housing Structures by Number of Rooms in Glen Burnie
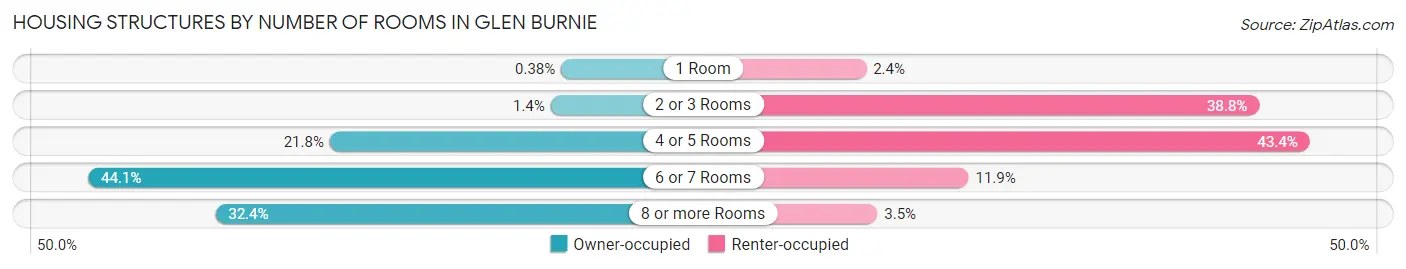
| Number of Rooms | Owner-occupied | Renter-occupied |
| 1 Room | 69 (0.4%) | 253 (2.4%) |
| 2 or 3 Rooms | 249 (1.3%) | 4,043 (38.8%) |
| 4 or 5 Rooms | 4,003 (21.8%) | 4,529 (43.4%) |
| 6 or 7 Rooms | 8,110 (44.1%) | 1,241 (11.9%) |
| 8 or more Rooms | 5,946 (32.4%) | 361 (3.5%) |
| Total | 18,377 (100.0%) | 10,427 (100.0%) |
Housing Structure by Heating Type in Glen Burnie
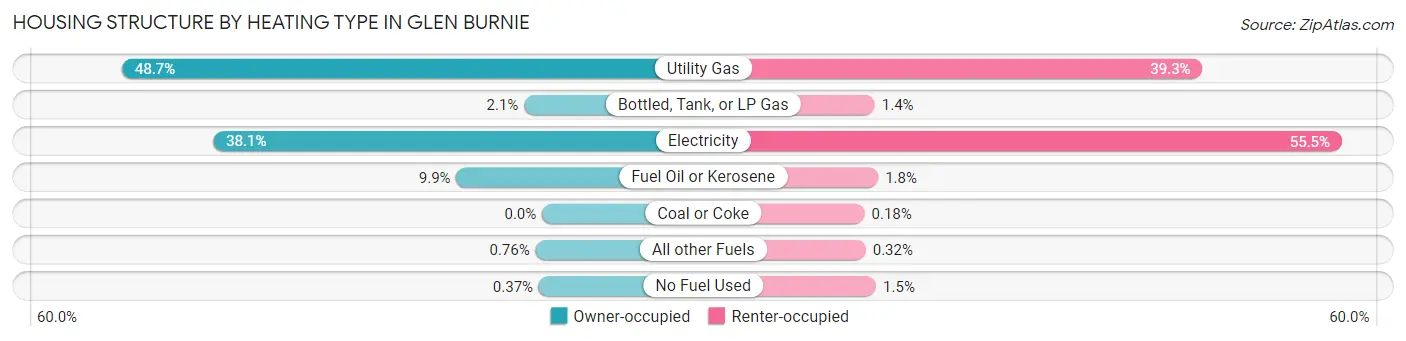
| Heating Type | Owner-occupied | Renter-occupied |
| Utility Gas | 8,954 (48.7%) | 4,102 (39.3%) |
| Bottled, Tank, or LP Gas | 382 (2.1%) | 143 (1.4%) |
| Electricity | 7,009 (38.1%) | 5,788 (55.5%) |
| Fuel Oil or Kerosene | 1,824 (9.9%) | 183 (1.8%) |
| Coal or Coke | 0 (0.0%) | 19 (0.2%) |
| All other Fuels | 140 (0.8%) | 33 (0.3%) |
| No Fuel Used | 68 (0.4%) | 159 (1.5%) |
| Total | 18,377 (100.0%) | 10,427 (100.0%) |
Household Vehicle Usage in Glen Burnie
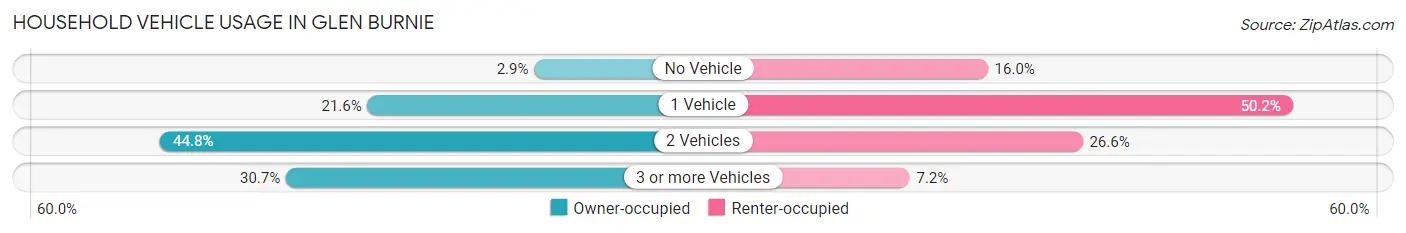
| Vehicles per Household | Owner-occupied | Renter-occupied |
| No Vehicle | 533 (2.9%) | 1,667 (16.0%) |
| 1 Vehicle | 3,966 (21.6%) | 5,230 (50.2%) |
| 2 Vehicles | 8,235 (44.8%) | 2,775 (26.6%) |
| 3 or more Vehicles | 5,643 (30.7%) | 755 (7.2%) |
| Total | 18,377 (100.0%) | 10,427 (100.0%) |
Real Estate & Mortgages in Glen Burnie
Real Estate and Mortgage Overview in Glen Burnie
| Characteristic | Without Mortgage | With Mortgage |
| Housing Units | 4,496 | 13,881 |
| Median Property Value | $306,500 | $313,500 |
| Median Household Income | $76,686 | $4,614 |
| Monthly Housing Costs | $584 | $975 |
| Real Estate Taxes | $2,573 | $217 |
Property Value by Mortgage Status in Glen Burnie
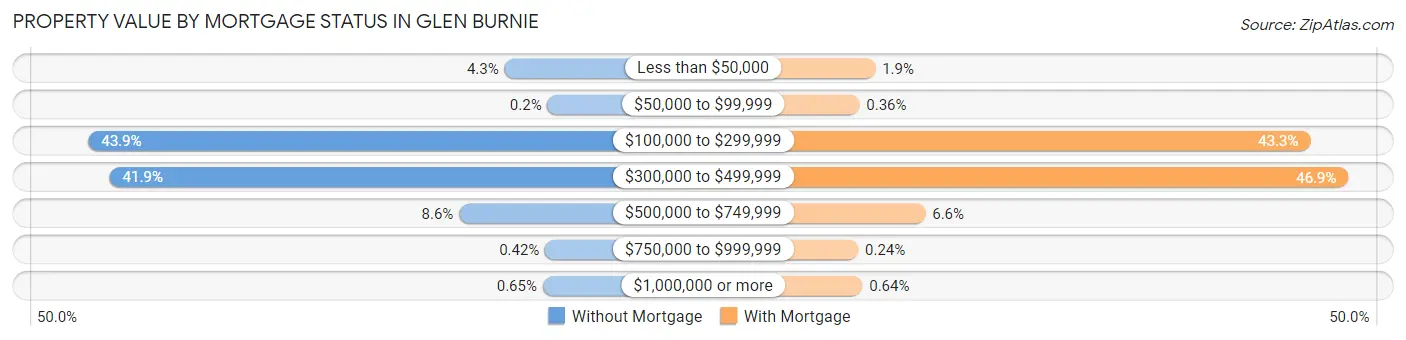
| Property Value | Without Mortgage | With Mortgage |
| Less than $50,000 | 193 (4.3%) | 260 (1.9%) |
| $50,000 to $99,999 | 9 (0.2%) | 50 (0.4%) |
| $100,000 to $299,999 | 1,975 (43.9%) | 6,012 (43.3%) |
| $300,000 to $499,999 | 1,884 (41.9%) | 6,514 (46.9%) |
| $500,000 to $749,999 | 387 (8.6%) | 922 (6.6%) |
| $750,000 to $999,999 | 19 (0.4%) | 34 (0.2%) |
| $1,000,000 or more | 29 (0.6%) | 89 (0.6%) |
| Total | 4,496 (100.0%) | 13,881 (100.0%) |
Household Income by Mortgage Status in Glen Burnie
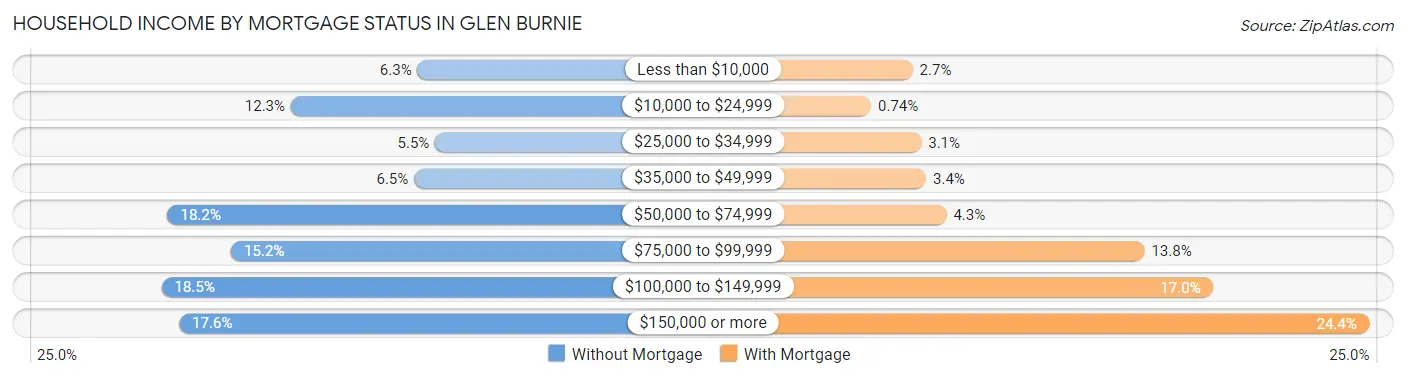
| Household Income | Without Mortgage | With Mortgage |
| Less than $10,000 | 283 (6.3%) | 377 (2.7%) |
| $10,000 to $24,999 | 554 (12.3%) | 103 (0.7%) |
| $25,000 to $34,999 | 245 (5.4%) | 435 (3.1%) |
| $35,000 to $49,999 | 290 (6.5%) | 466 (3.4%) |
| $50,000 to $74,999 | 818 (18.2%) | 601 (4.3%) |
| $75,000 to $99,999 | 682 (15.2%) | 1,910 (13.8%) |
| $100,000 to $149,999 | 831 (18.5%) | 2,360 (17.0%) |
| $150,000 or more | 793 (17.6%) | 3,392 (24.4%) |
| Total | 4,496 (100.0%) | 13,881 (100.0%) |
Property Value to Household Income Ratio in Glen Burnie
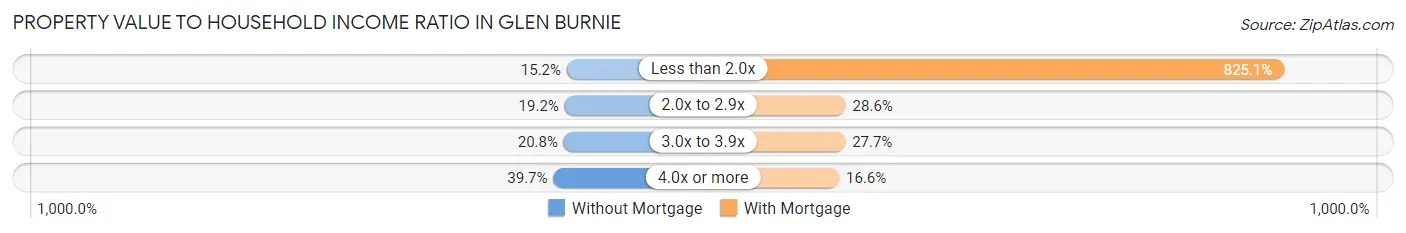
| Value-to-Income Ratio | Without Mortgage | With Mortgage |
| Less than 2.0x | 684 (15.2%) | 114,525 (825.1%) |
| 2.0x to 2.9x | 864 (19.2%) | 3,969 (28.6%) |
| 3.0x to 3.9x | 936 (20.8%) | 3,847 (27.7%) |
| 4.0x or more | 1,786 (39.7%) | 2,306 (16.6%) |
| Total | 4,496 (100.0%) | 13,881 (100.0%) |
Real Estate Taxes by Mortgage Status in Glen Burnie
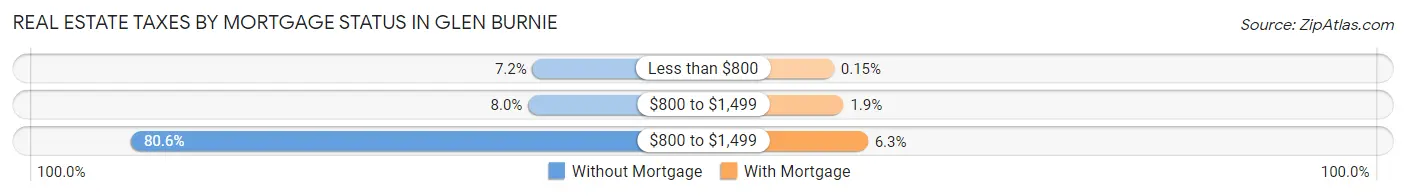
| Property Taxes | Without Mortgage | With Mortgage |
| Less than $800 | 325 (7.2%) | 21 (0.2%) |
| $800 to $1,499 | 361 (8.0%) | 265 (1.9%) |
| $800 to $1,499 | 3,622 (80.6%) | 878 (6.3%) |
| Total | 4,496 (100.0%) | 13,881 (100.0%) |
Health & Disability in Glen Burnie
Health Insurance Coverage by Age in Glen Burnie
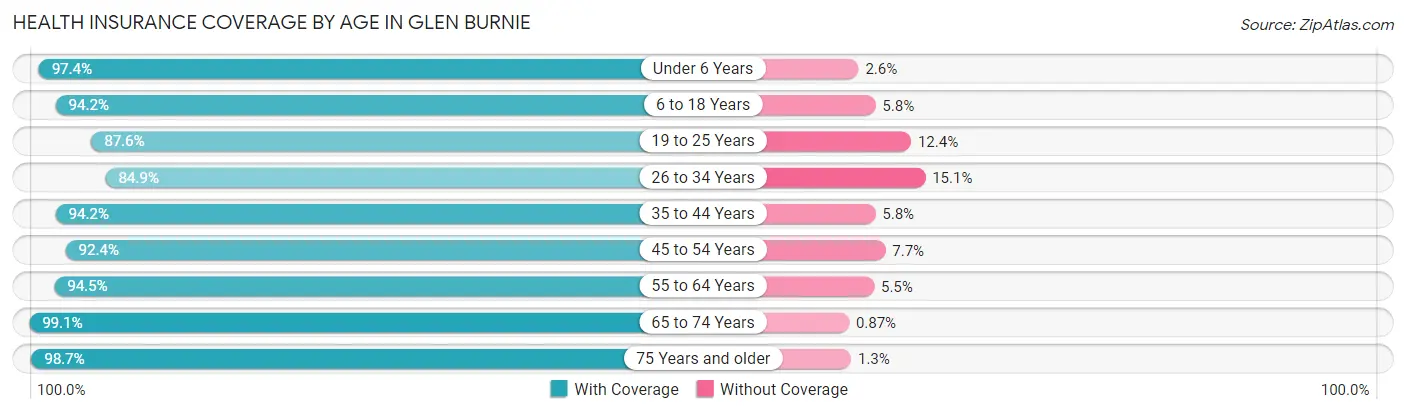
| Age Bracket | With Coverage | Without Coverage |
| Under 6 Years | 4,234 (97.4%) | 115 (2.6%) |
| 6 to 18 Years | 10,483 (94.2%) | 645 (5.8%) |
| 19 to 25 Years | 5,538 (87.6%) | 787 (12.4%) |
| 26 to 34 Years | 8,731 (84.9%) | 1,552 (15.1%) |
| 35 to 44 Years | 9,608 (94.2%) | 590 (5.8%) |
| 45 to 54 Years | 8,901 (92.3%) | 737 (7.6%) |
| 55 to 64 Years | 8,059 (94.5%) | 473 (5.5%) |
| 65 to 74 Years | 5,584 (99.1%) | 49 (0.9%) |
| 75 Years and older | 4,078 (98.7%) | 52 (1.3%) |
| Total | 65,216 (92.9%) | 5,000 (7.1%) |
Health Insurance Coverage by Citizenship Status in Glen Burnie
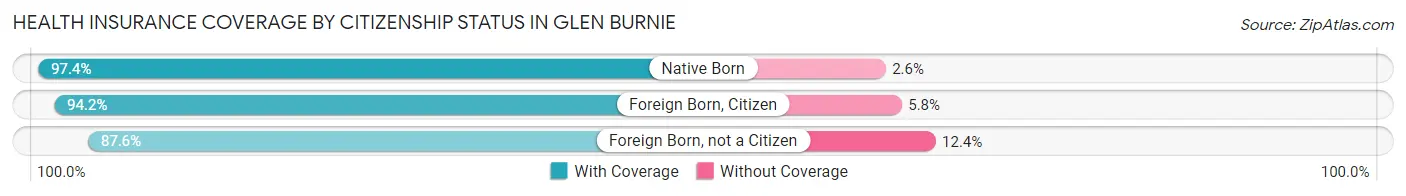
| Citizenship Status | With Coverage | Without Coverage |
| Native Born | 4,234 (97.4%) | 115 (2.6%) |
| Foreign Born, Citizen | 10,483 (94.2%) | 645 (5.8%) |
| Foreign Born, not a Citizen | 5,538 (87.6%) | 787 (12.4%) |
Health Insurance Coverage by Household Income in Glen Burnie
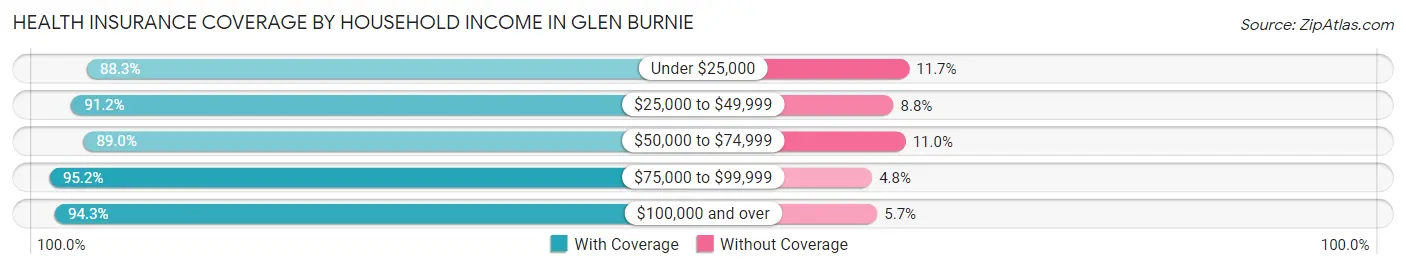
| Household Income | With Coverage | Without Coverage |
| Under $25,000 | 4,046 (88.3%) | 537 (11.7%) |
| $25,000 to $49,999 | 6,880 (91.2%) | 661 (8.8%) |
| $50,000 to $74,999 | 9,962 (89.0%) | 1,236 (11.0%) |
| $75,000 to $99,999 | 10,904 (95.2%) | 545 (4.8%) |
| $100,000 and over | 33,256 (94.3%) | 2,021 (5.7%) |
Public vs Private Health Insurance Coverage by Age in Glen Burnie
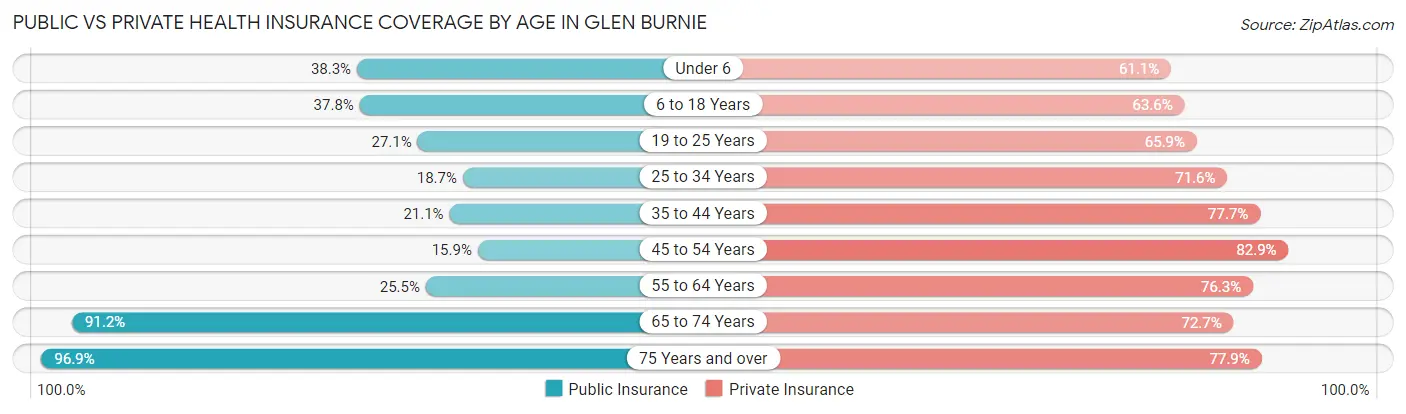
| Age Bracket | Public Insurance | Private Insurance |
| Under 6 | 1,666 (38.3%) | 2,658 (61.1%) |
| 6 to 18 Years | 4,207 (37.8%) | 7,080 (63.6%) |
| 19 to 25 Years | 1,712 (27.1%) | 4,168 (65.9%) |
| 25 to 34 Years | 1,920 (18.7%) | 7,358 (71.6%) |
| 35 to 44 Years | 2,156 (21.1%) | 7,919 (77.6%) |
| 45 to 54 Years | 1,531 (15.9%) | 7,990 (82.9%) |
| 55 to 64 Years | 2,178 (25.5%) | 6,512 (76.3%) |
| 65 to 74 Years | 5,138 (91.2%) | 4,096 (72.7%) |
| 75 Years and over | 4,001 (96.9%) | 3,218 (77.9%) |
| Total | 24,509 (34.9%) | 50,999 (72.6%) |
Disability Status by Sex by Age in Glen Burnie
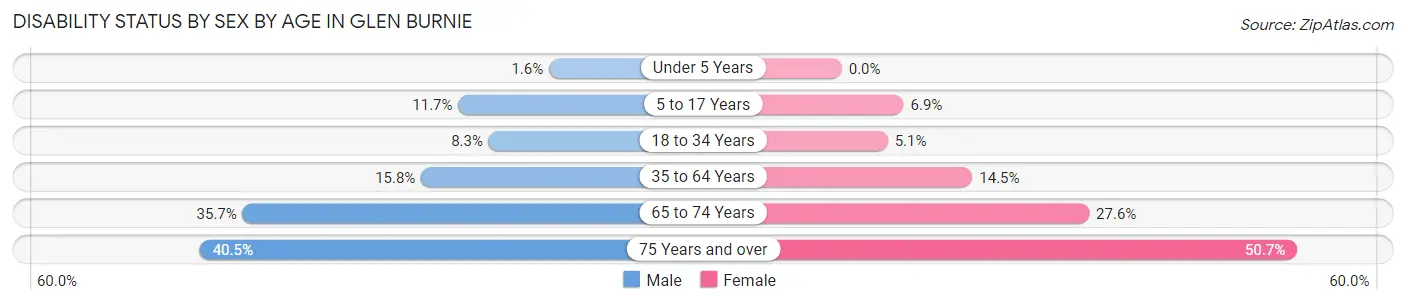
| Age Bracket | Male | Female |
| Under 5 Years | 32 (1.6%) | 0 (0.0%) |
| 5 to 17 Years | 660 (11.7%) | 358 (6.9%) |
| 18 to 34 Years | 723 (8.3%) | 458 (5.1%) |
| 35 to 64 Years | 2,153 (15.8%) | 2,147 (14.5%) |
| 65 to 74 Years | 923 (35.7%) | 840 (27.6%) |
| 75 Years and over | 624 (40.5%) | 1,313 (50.7%) |
Disability Class by Sex by Age in Glen Burnie
Disability Class: Hearing Difficulty
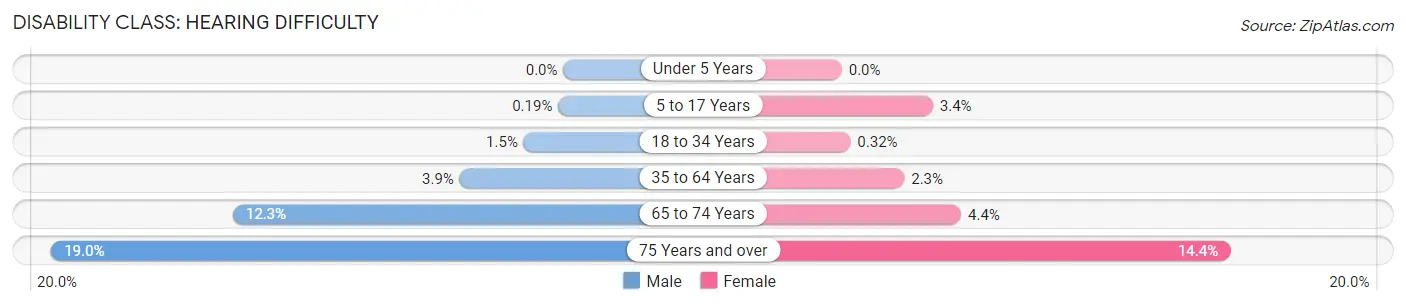
| Age Bracket | Male | Female |
| Under 5 Years | 0 (0.0%) | 0 (0.0%) |
| 5 to 17 Years | 11 (0.2%) | 176 (3.4%) |
| 18 to 34 Years | 128 (1.5%) | 29 (0.3%) |
| 35 to 64 Years | 524 (3.8%) | 343 (2.3%) |
| 65 to 74 Years | 317 (12.3%) | 135 (4.4%) |
| 75 Years and over | 293 (19.0%) | 373 (14.4%) |
Disability Class: Vision Difficulty
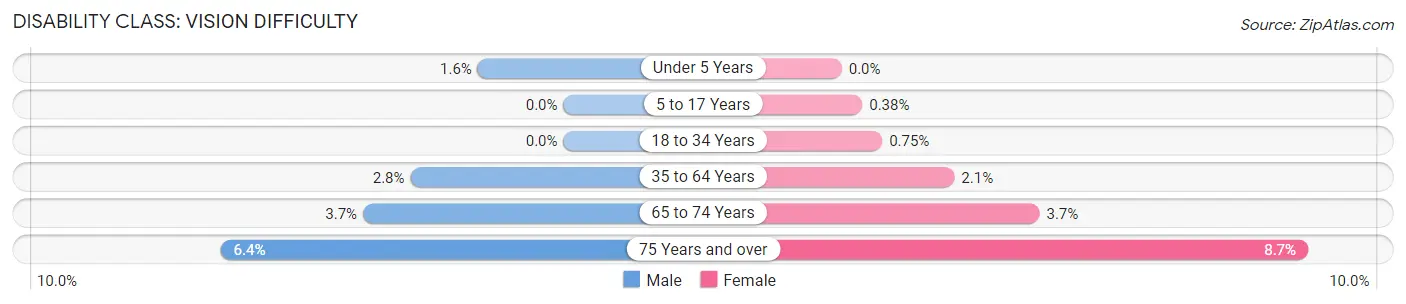
| Age Bracket | Male | Female |
| Under 5 Years | 32 (1.6%) | 0 (0.0%) |
| 5 to 17 Years | 0 (0.0%) | 20 (0.4%) |
| 18 to 34 Years | 0 (0.0%) | 67 (0.7%) |
| 35 to 64 Years | 387 (2.8%) | 309 (2.1%) |
| 65 to 74 Years | 96 (3.7%) | 112 (3.7%) |
| 75 Years and over | 98 (6.4%) | 224 (8.6%) |
Disability Class: Cognitive Difficulty
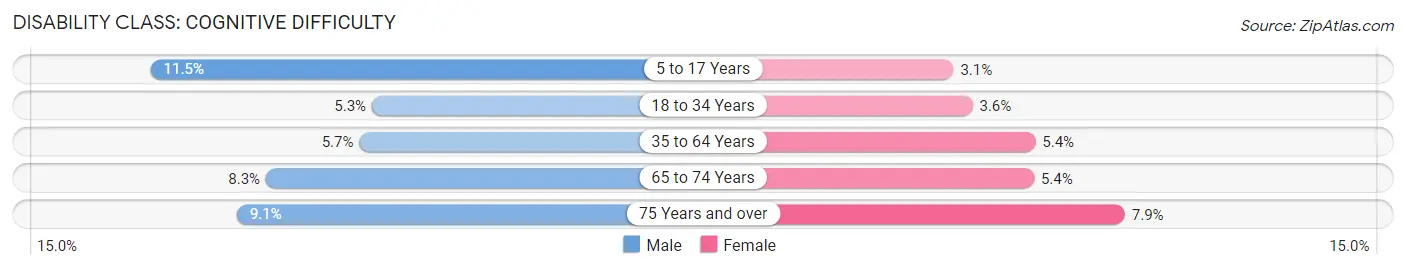
| Age Bracket | Male | Female |
| 5 to 17 Years | 649 (11.5%) | 162 (3.1%) |
| 18 to 34 Years | 464 (5.3%) | 326 (3.6%) |
| 35 to 64 Years | 773 (5.7%) | 796 (5.4%) |
| 65 to 74 Years | 214 (8.3%) | 163 (5.3%) |
| 75 Years and over | 140 (9.1%) | 204 (7.9%) |
Disability Class: Ambulatory Difficulty
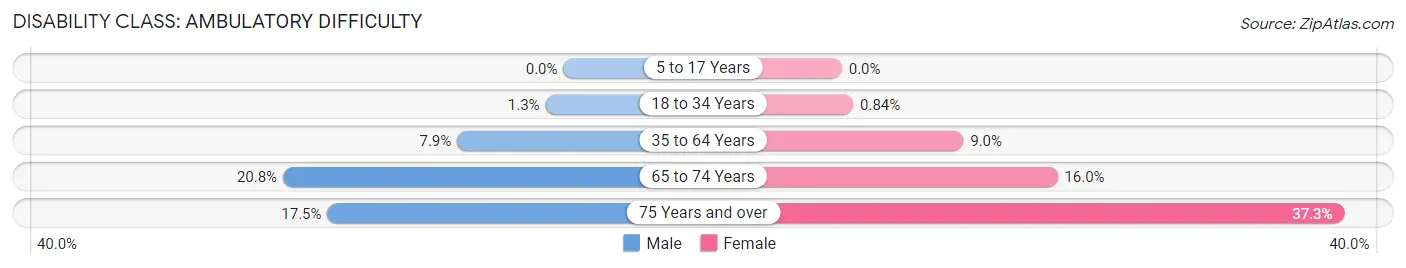
| Age Bracket | Male | Female |
| 5 to 17 Years | 0 (0.0%) | 0 (0.0%) |
| 18 to 34 Years | 116 (1.3%) | 75 (0.8%) |
| 35 to 64 Years | 1,073 (7.9%) | 1,331 (9.0%) |
| 65 to 74 Years | 538 (20.8%) | 488 (16.0%) |
| 75 Years and over | 270 (17.5%) | 966 (37.3%) |
Disability Class: Self-Care Difficulty
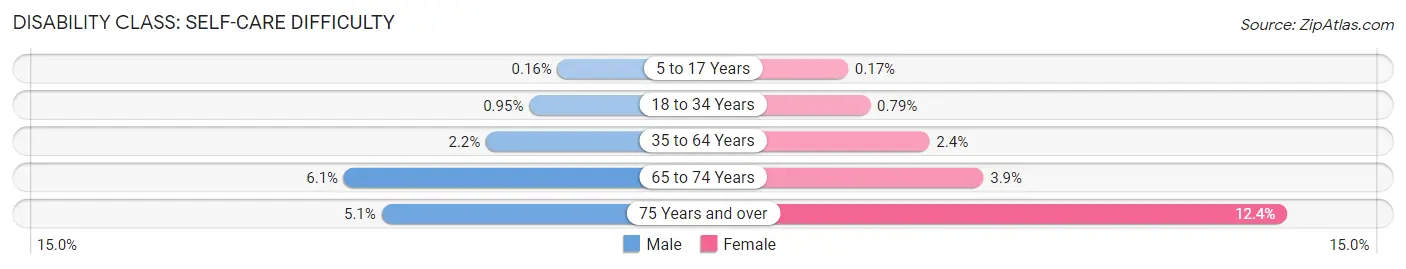
| Age Bracket | Male | Female |
| 5 to 17 Years | 9 (0.2%) | 9 (0.2%) |
| 18 to 34 Years | 83 (0.9%) | 71 (0.8%) |
| 35 to 64 Years | 292 (2.1%) | 360 (2.4%) |
| 65 to 74 Years | 158 (6.1%) | 120 (3.9%) |
| 75 Years and over | 78 (5.1%) | 321 (12.4%) |
Technology Access in Glen Burnie
Computing Device Access in Glen Burnie
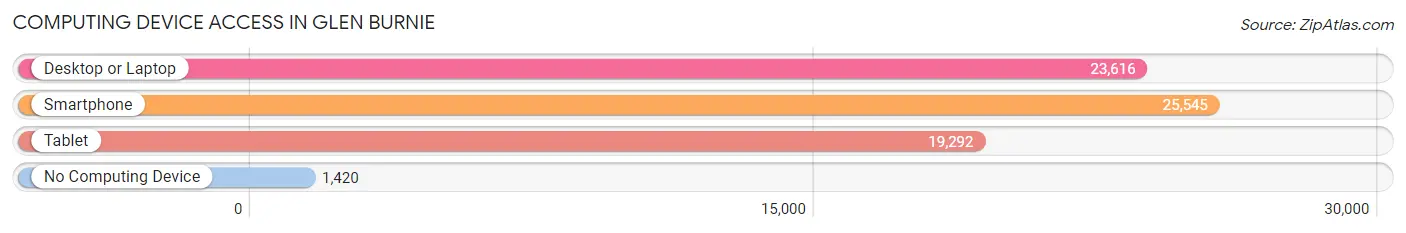
| Device Type | # Households | % Households |
| Desktop or Laptop | 23,616 | 82.0% |
| Smartphone | 25,545 | 88.7% |
| Tablet | 19,292 | 67.0% |
| No Computing Device | 1,420 | 4.9% |
| Total | 28,804 | 100.0% |
Internet Access in Glen Burnie
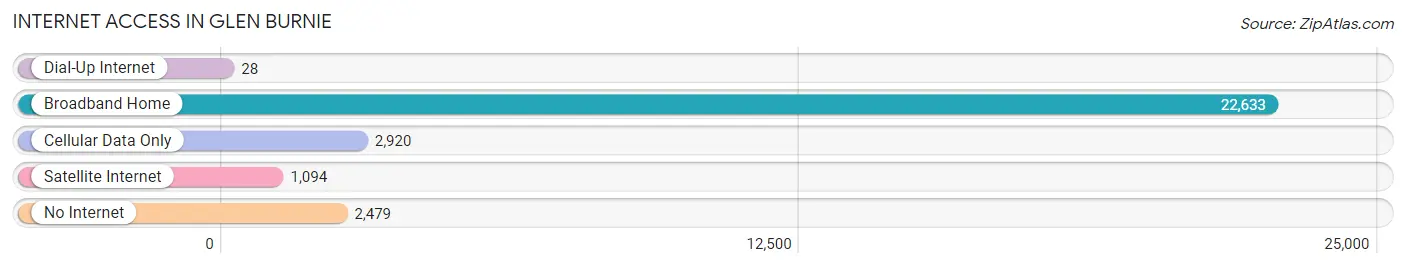
| Internet Type | # Households | % Households |
| Dial-Up Internet | 28 | 0.1% |
| Broadband Home | 22,633 | 78.6% |
| Cellular Data Only | 2,920 | 10.1% |
| Satellite Internet | 1,094 | 3.8% |
| No Internet | 2,479 | 8.6% |
| Total | 28,804 | 100.0% |
Glen Burnie Summary
Glen Burnie is a census-designated place (CDP) located in Anne Arundel County, Maryland, United States. It is a suburb of Baltimore and is located just north of the city of Baltimore. The population of Glen Burnie was 67,639 at the 2010 census.
History
Glen Burnie was founded in 1812 by Elias Glenn, a Baltimore lawyer, and was named after his grandfather, Dr. William Burnie, who was a Scottish physician. The area was originally known as “Glennsburne” and was a small agricultural community. In the late 19th century, the area began to grow as a summer resort for Baltimoreans. The area was incorporated as a town in 1895 and was later annexed by Baltimore City in 1918.
In the 1950s, the area began to experience rapid growth as a result of the post-World War II housing boom. The area was officially designated as a census-designated place in 1980.
Geography
Glen Burnie is located at 39°9′N 76°37′W (39.15, -76.62). According to the United States Census Bureau, the CDP has a total area of 16.2 square miles (41.8 km2), of which 16.1 square miles (41.6 km2) is land and 0.1 square miles (0.2 km2) (0.62%) is water.
Glen Burnie is located in the Piedmont region of Maryland, which is characterized by rolling hills and valleys. The area is located in the Chesapeake Bay watershed and is drained by the Patapsco River.
Economy
Glen Burnie is a major commercial and industrial center in the Baltimore metropolitan area. The area is home to a variety of businesses, including manufacturing, retail, and service industries. The area is also home to several large employers, including Northrop Grumman, Lockheed Martin, and the U.S. Naval Academy.
Demographics
As of the 2010 census, there were 67,639 people, 27,945 households, and 17,945 families residing in the CDP. The population density was 4,187.3 people per square mile (1,611.7/km2). There were 29,845 housing units at an average density of 1,845.3 per square mile (715.2/km2). The racial makeup of the CDP was 79.2% White, 11.3% African American, 0.3% Native American, 4.9% Asian, 0.1% Pacific Islander, 1.7% from other races, and 2.5% from two or more races. Hispanic or Latino of any race were 4.2% of the population.
There were 27,945 households, out of which 30.2% had children under the age of 18 living with them, 44.2% were married couples living together, 13.7% had a female householder with no husband present, and 36.7% were non-families. 28.9% of all households were made up of individuals, and 10.2% had someone living alone who was 65 years of age or older. The average household size was 2.41 and the average family size was 2.97.
In the CDP, the population was spread out, with 23.2% under the age of 18, 8.2% from 18 to 24, 32.2% from 25 to 44, 22.3% from 45 to 64, and 14.1% who were 65 years of age or older. The median age was 36 years. For every 100 females, there were 93.2 males. For every 100 females age 18 and over, there were 89.7 males.
The median income for a household in the CDP was $50,817, and the median income for a family was $60,817. Males had a median income of $41,817 versus $31,817 for females. The per capita income for the CDP was $24,817. About 4.2% of families and 6.2% of the population were below the poverty line, including 8.2% of those under age 18 and 6.2% of those age 65 or over.
Common Questions
What is Per Capita Income in Glen Burnie?
Per Capita income in Glen Burnie is $41,570.
What is the Median Family Income in Glen Burnie?
Median Family Income in Glen Burnie is $100,034.
What is the Median Household income in Glen Burnie?
Median Household Income in Glen Burnie is $86,283.
What is Income or Wage Gap in Glen Burnie?
Income or Wage Gap in Glen Burnie is 19.7%.
Women in Glen Burnie earn 80.3 cents for every dollar earned by a man.
What is Family Income Deficit in Glen Burnie?
Family Income Deficit in Glen Burnie is $11,146.
Families that are below poverty line in Glen Burnie earn $11,146 less on average than the poverty threshold level.
What is Inequality or Gini Index in Glen Burnie?
Inequality or Gini Index in Glen Burnie is 0.40.
What is the Total Population of Glen Burnie?
Total Population of Glen Burnie is 71,427.
What is the Total Male Population of Glen Burnie?
Total Male Population of Glen Burnie is 34,873.
What is the Total Female Population of Glen Burnie?
Total Female Population of Glen Burnie is 36,554.
What is the Ratio of Males per 100 Females in Glen Burnie?
There are 95.40 Males per 100 Females in Glen Burnie.
What is the Ratio of Females per 100 Males in Glen Burnie?
There are 104.82 Females per 100 Males in Glen Burnie.
What is the Median Population Age in Glen Burnie?
Median Population Age in Glen Burnie is 37.7 Years.
What is the Average Family Size in Glen Burnie
Average Family Size in Glen Burnie is 3.1 People.
What is the Average Household Size in Glen Burnie
Average Household Size in Glen Burnie is 2.5 People.
How Large is the Labor Force in Glen Burnie?
There are 41,363 People in the Labor Forcein in Glen Burnie.
What is the Percentage of People in the Labor Force in Glen Burnie?
70.5% of People are in the Labor Force in Glen Burnie.
What is the Unemployment Rate in Glen Burnie?
Unemployment Rate in Glen Burnie is 4.1%.