Zip Codes with the Highest Percentage of Population with a Degree in Science and Engineering in Warrenton, VA
RELATED REPORTS & OPTIONS
Science and Engineering
Warrenton
Compare Zip Codes
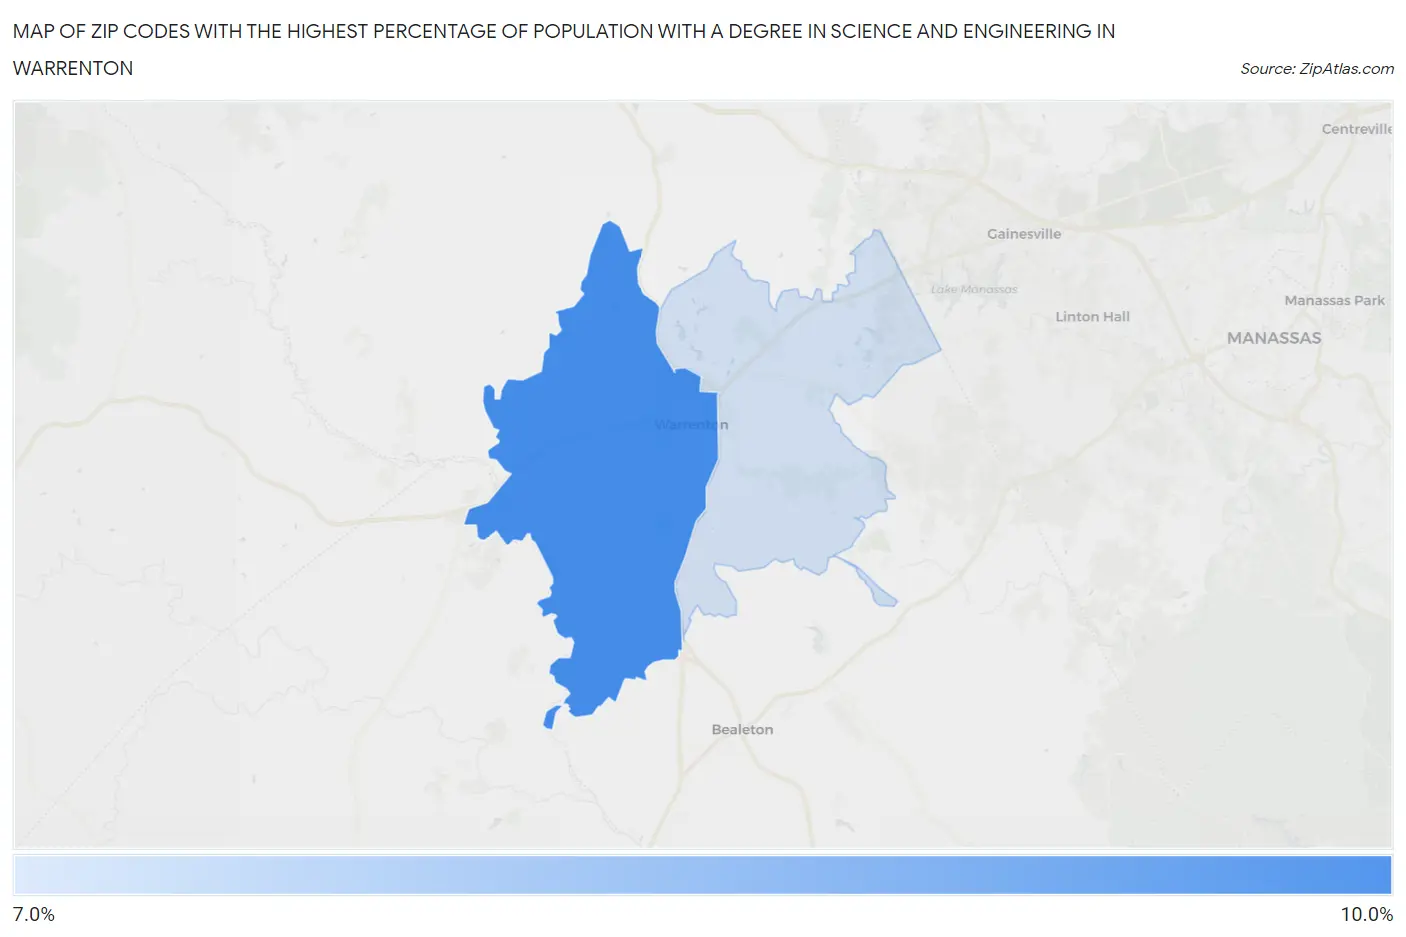
Map of Zip Codes with the Highest Percentage of Population with a Degree in Science and Engineering in Warrenton
7.5%
8.4%
Zip Codes with the Highest Percentage of Population with a Degree in Science and Engineering in Warrenton, VA
| Zip Code | % Graduates | vs State | vs National | |
| 1. | 20186 | 8.4% | 8.0%(+0.403)#389 | 9.8%(-1.42)#18,787 |
| 2. | 20187 | 7.5% | 8.0%(-0.424)#436 | 9.8%(-2.25)#20,647 |
1
Common Questions
What are the Top Zip Codes with the Highest Percentage of Population with a Degree in Science and Engineering in Warrenton, VA?
Top Zip Codes with the Highest Percentage of Population with a Degree in Science and Engineering in Warrenton, VA are:
What zip code has the Highest Percentage of Population with a Degree in Science and Engineering in Warrenton, VA?
20186 has the Highest Percentage of Population with a Degree in Science and Engineering in Warrenton, VA with 8.4%.
What is the Percentage of Population with a Degree in Science and Engineering in Warrenton, VA?
Percentage of Population with a Degree in Science and Engineering in Warrenton is 8.1%.
What is the Percentage of Population with a Degree in Science and Engineering in Virginia?
Percentage of Population with a Degree in Science and Engineering in Virginia is 8.0%.
What is the Percentage of Population with a Degree in Science and Engineering in the United States?
Percentage of Population with a Degree in Science and Engineering in the United States is 9.8%.