Zip Codes with the Highest Percentage of Population Employed in Arts, Media & Entertainment in Virginia
RELATED REPORTS & OPTIONS
Arts, Media & Entertainment
Virginia
Compare Zip Codes
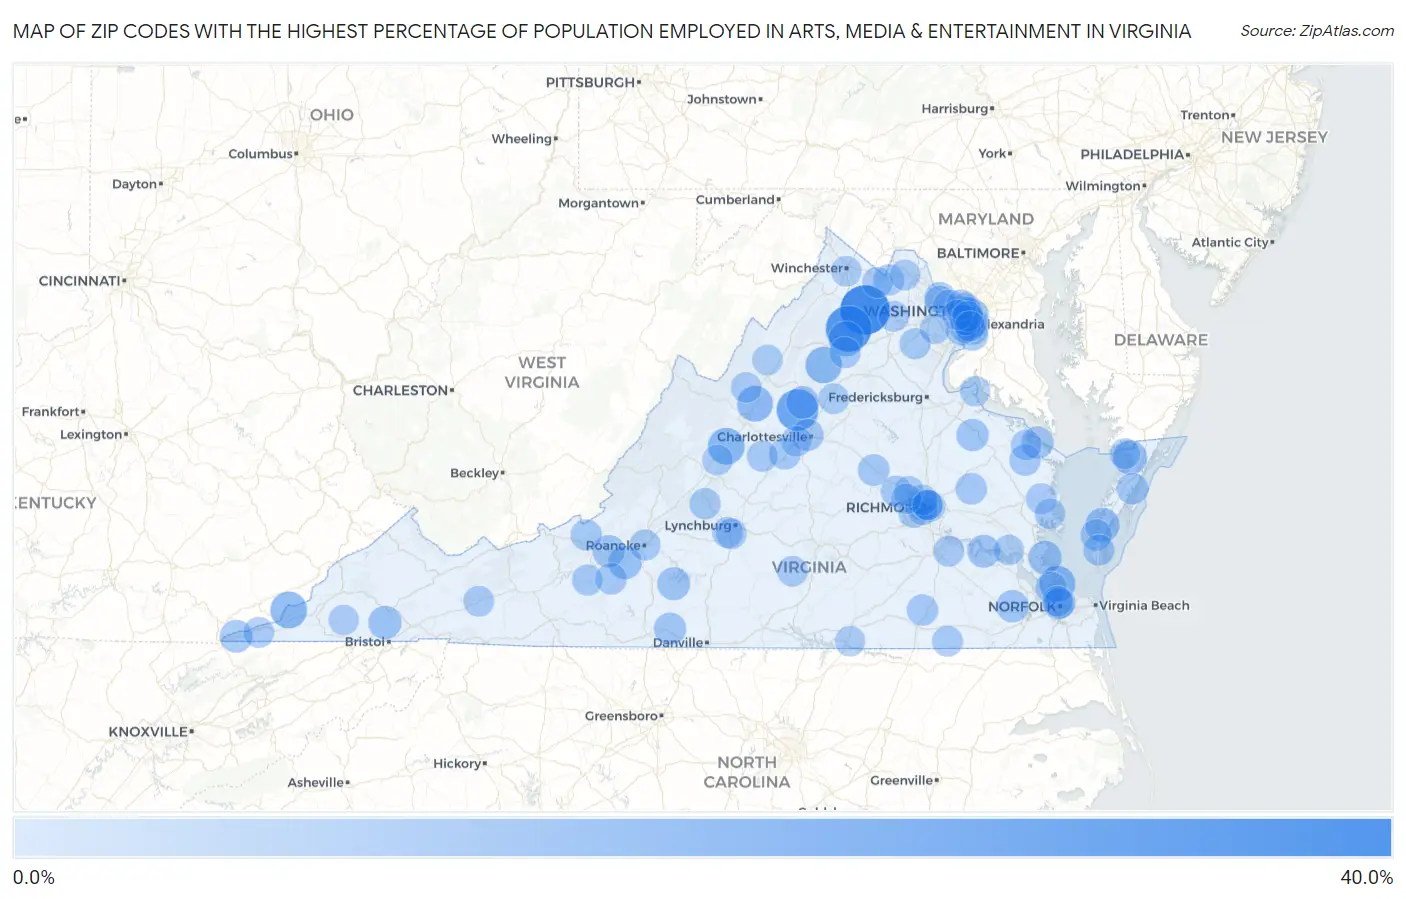
Map of Zip Codes with the Highest Percentage of Population Employed in Arts, Media & Entertainment in Virginia
0.0%
40.0%
Zip Codes with the Highest Percentage of Population Employed in Arts, Media & Entertainment in Virginia
| Zip Code | % Employed | vs State | vs National | |
| 1. | 22643 | 32.2% | 2.1%(+30.1)#1 | 2.1%(+30.1)#37 |
| 2. | 22627 | 26.6% | 2.1%(+24.5)#2 | 2.1%(+24.5)#54 |
| 3. | 22940 | 20.2% | 2.1%(+18.1)#3 | 2.1%(+18.1)#94 |
| 4. | 24476 | 12.8% | 2.1%(+10.7)#4 | 2.1%(+10.7)#221 |
| 5. | 24282 | 12.7% | 2.1%(+10.6)#5 | 2.1%(+10.6)#226 |
| 6. | 22743 | 12.4% | 2.1%(+10.3)#6 | 2.1%(+10.3)#241 |
| 7. | 23651 | 11.7% | 2.1%(+9.66)#7 | 2.1%(+9.67)#271 |
| 8. | 24467 | 11.4% | 2.1%(+9.38)#8 | 2.1%(+9.39)#283 |
| 9. | 22747 | 10.5% | 2.1%(+8.46)#9 | 2.1%(+8.47)#337 |
| 10. | 23405 | 9.3% | 2.1%(+7.21)#10 | 2.1%(+7.22)#430 |
| 11. | 23409 | 8.9% | 2.1%(+6.86)#11 | 2.1%(+6.87)#457 |
| 12. | 24059 | 8.0% | 2.1%(+5.98)#12 | 2.1%(+5.99)#548 |
| 13. | 23696 | 8.0% | 2.1%(+5.88)#13 | 2.1%(+5.89)#559 |
| 14. | 24270 | 7.6% | 2.1%(+5.52)#14 | 2.1%(+5.53)#630 |
| 15. | 24176 | 7.1% | 2.1%(+5.07)#15 | 2.1%(+5.08)#721 |
| 16. | 23899 | 7.1% | 2.1%(+5.07)#16 | 2.1%(+5.08)#722 |
| 17. | 22935 | 7.1% | 2.1%(+5.04)#17 | 2.1%(+5.05)#730 |
| 18. | 24248 | 6.8% | 2.1%(+4.73)#18 | 2.1%(+4.74)#803 |
| 19. | 24087 | 6.5% | 2.1%(+4.46)#19 | 2.1%(+4.47)#870 |
| 20. | 22511 | 6.4% | 2.1%(+4.37)#20 | 2.1%(+4.38)#890 |
| 21. | 23487 | 6.3% | 2.1%(+4.28)#21 | 2.1%(+4.29)#918 |
| 22. | 22904 | 6.3% | 2.1%(+4.24)#22 | 2.1%(+4.25)#925 |
| 23. | 22436 | 6.2% | 2.1%(+4.15)#23 | 2.1%(+4.16)#962 |
| 24. | 22202 | 6.2% | 2.1%(+4.15)#24 | 2.1%(+4.16)#963 |
| 25. | 24054 | 6.2% | 2.1%(+4.11)#25 | 2.1%(+4.12)#983 |
| 26. | 22206 | 6.0% | 2.1%(+3.89)#26 | 2.1%(+3.90)#1,050 |
| 27. | 22205 | 5.9% | 2.1%(+3.83)#27 | 2.1%(+3.84)#1,076 |
| 28. | 22301 | 5.8% | 2.1%(+3.72)#28 | 2.1%(+3.73)#1,119 |
| 29. | 22307 | 5.6% | 2.1%(+3.48)#29 | 2.1%(+3.49)#1,219 |
| 30. | 23065 | 5.3% | 2.1%(+3.19)#30 | 2.1%(+3.20)#1,362 |
| 31. | 22931 | 5.3% | 2.1%(+3.19)#31 | 2.1%(+3.20)#1,367 |
| 32. | 23086 | 5.1% | 2.1%(+3.07)#32 | 2.1%(+3.08)#1,427 |
| 33. | 22314 | 5.1% | 2.1%(+3.04)#33 | 2.1%(+3.05)#1,438 |
| 34. | 24072 | 5.1% | 2.1%(+3.01)#34 | 2.1%(+3.02)#1,458 |
| 35. | 23301 | 5.0% | 2.1%(+2.97)#35 | 2.1%(+2.98)#1,476 |
| 36. | 22207 | 4.9% | 2.1%(+2.87)#36 | 2.1%(+2.88)#1,539 |
| 37. | 23347 | 4.9% | 2.1%(+2.85)#37 | 2.1%(+2.86)#1,550 |
| 38. | 22460 | 4.9% | 2.1%(+2.84)#38 | 2.1%(+2.85)#1,554 |
| 39. | 23867 | 4.9% | 2.1%(+2.83)#39 | 2.1%(+2.84)#1,563 |
| 40. | 23517 | 4.9% | 2.1%(+2.82)#40 | 2.1%(+2.83)#1,564 |
| 41. | 22308 | 4.8% | 2.1%(+2.76)#41 | 2.1%(+2.77)#1,593 |
| 42. | 23661 | 4.8% | 2.1%(+2.72)#42 | 2.1%(+2.73)#1,628 |
| 43. | 22749 | 4.7% | 2.1%(+2.66)#43 | 2.1%(+2.67)#1,673 |
| 44. | 24128 | 4.6% | 2.1%(+2.57)#44 | 2.1%(+2.58)#1,742 |
| 45. | 24526 | 4.6% | 2.1%(+2.56)#45 | 2.1%(+2.57)#1,751 |
| 46. | 22201 | 4.6% | 2.1%(+2.50)#46 | 2.1%(+2.51)#1,798 |
| 47. | 22302 | 4.6% | 2.1%(+2.50)#47 | 2.1%(+2.51)#1,801 |
| 48. | 23103 | 4.5% | 2.1%(+2.46)#48 | 2.1%(+2.47)#1,823 |
| 49. | 23507 | 4.5% | 2.1%(+2.45)#49 | 2.1%(+2.46)#1,837 |
| 50. | 24011 | 4.5% | 2.1%(+2.45)#50 | 2.1%(+2.46)#1,838 |
| 51. | 23310 | 4.5% | 2.1%(+2.39)#51 | 2.1%(+2.40)#1,891 |
| 52. | 20194 | 4.4% | 2.1%(+2.33)#52 | 2.1%(+2.34)#1,940 |
| 53. | 20181 | 4.4% | 2.1%(+2.30)#53 | 2.1%(+2.31)#1,965 |
| 54. | 24149 | 4.4% | 2.1%(+2.28)#54 | 2.1%(+2.29)#1,981 |
| 55. | 20141 | 4.3% | 2.1%(+2.27)#55 | 2.1%(+2.28)#1,991 |
| 56. | 22958 | 4.3% | 2.1%(+2.21)#56 | 2.1%(+2.22)#2,056 |
| 57. | 23298 | 4.3% | 2.1%(+2.21)#57 | 2.1%(+2.22)#2,059 |
| 58. | 20190 | 4.2% | 2.1%(+2.16)#58 | 2.1%(+2.17)#2,112 |
| 59. | 23169 | 4.2% | 2.1%(+2.11)#59 | 2.1%(+2.12)#2,160 |
| 60. | 23875 | 4.1% | 2.1%(+2.07)#60 | 2.1%(+2.08)#2,195 |
| 61. | 20135 | 4.1% | 2.1%(+2.07)#61 | 2.1%(+2.08)#2,197 |
| 62. | 22315 | 4.1% | 2.1%(+2.07)#62 | 2.1%(+2.08)#2,207 |
| 63. | 24502 | 4.1% | 2.1%(+2.05)#63 | 2.1%(+2.06)#2,223 |
| 64. | 24515 | 4.1% | 2.1%(+2.03)#64 | 2.1%(+2.04)#2,253 |
| 65. | 23221 | 4.1% | 2.1%(+2.01)#65 | 2.1%(+2.02)#2,265 |
| 66. | 20158 | 4.1% | 2.1%(+2.00)#66 | 2.1%(+2.00)#2,287 |
| 67. | 23427 | 4.0% | 2.1%(+1.97)#67 | 2.1%(+1.98)#2,320 |
| 68. | 24281 | 4.0% | 2.1%(+1.97)#68 | 2.1%(+1.98)#2,322 |
| 69. | 23828 | 4.0% | 2.1%(+1.95)#69 | 2.1%(+1.96)#2,342 |
| 70. | 24435 | 4.0% | 2.1%(+1.90)#70 | 2.1%(+1.91)#2,396 |
| 71. | 22435 | 4.0% | 2.1%(+1.90)#71 | 2.1%(+1.91)#2,397 |
| 72. | 22182 | 4.0% | 2.1%(+1.88)#72 | 2.1%(+1.89)#2,428 |
| 73. | 23508 | 3.9% | 2.1%(+1.87)#73 | 2.1%(+1.88)#2,448 |
| 74. | 23235 | 3.9% | 2.1%(+1.86)#74 | 2.1%(+1.87)#2,459 |
| 75. | 23923 | 3.9% | 2.1%(+1.86)#75 | 2.1%(+1.87)#2,461 |
| 76. | 20198 | 3.9% | 2.1%(+1.85)#76 | 2.1%(+1.86)#2,465 |
| 77. | 22310 | 3.9% | 2.1%(+1.85)#77 | 2.1%(+1.86)#2,472 |
| 78. | 22311 | 3.9% | 2.1%(+1.82)#78 | 2.1%(+1.83)#2,508 |
| 79. | 24311 | 3.9% | 2.1%(+1.79)#79 | 2.1%(+1.80)#2,547 |
| 80. | 23220 | 3.8% | 2.1%(+1.76)#80 | 2.1%(+1.77)#2,581 |
| 81. | 22834 | 3.8% | 2.1%(+1.74)#81 | 2.1%(+1.75)#2,606 |
| 82. | 22738 | 3.8% | 2.1%(+1.72)#82 | 2.1%(+1.73)#2,632 |
| 83. | 22903 | 3.8% | 2.1%(+1.71)#83 | 2.1%(+1.72)#2,655 |
| 84. | 23035 | 3.8% | 2.1%(+1.71)#84 | 2.1%(+1.72)#2,659 |
| 85. | 22812 | 3.7% | 2.1%(+1.64)#85 | 2.1%(+1.65)#2,754 |
| 86. | 23225 | 3.7% | 2.1%(+1.60)#86 | 2.1%(+1.61)#2,806 |
| 87. | 22101 | 3.7% | 2.1%(+1.58)#87 | 2.1%(+1.59)#2,825 |
| 88. | 23230 | 3.6% | 2.1%(+1.57)#88 | 2.1%(+1.58)#2,841 |
| 89. | 22042 | 3.6% | 2.1%(+1.57)#89 | 2.1%(+1.58)#2,847 |
| 90. | 23233 | 3.6% | 2.1%(+1.57)#90 | 2.1%(+1.58)#2,849 |
| 91. | 22204 | 3.6% | 2.1%(+1.55)#91 | 2.1%(+1.56)#2,882 |
| 92. | 22601 | 3.6% | 2.1%(+1.54)#92 | 2.1%(+1.55)#2,902 |
| 93. | 23238 | 3.6% | 2.1%(+1.51)#93 | 2.1%(+1.52)#2,948 |
| 94. | 23185 | 3.5% | 2.1%(+1.46)#94 | 2.1%(+1.47)#3,028 |
| 95. | 22303 | 3.5% | 2.1%(+1.46)#95 | 2.1%(+1.47)#3,030 |
| 96. | 24250 | 3.4% | 2.1%(+1.38)#96 | 2.1%(+1.39)#3,137 |
| 97. | 20124 | 3.4% | 2.1%(+1.37)#97 | 2.1%(+1.38)#3,142 |
| 98. | 23919 | 3.4% | 2.1%(+1.36)#98 | 2.1%(+1.37)#3,181 |
| 99. | 22448 | 3.4% | 2.1%(+1.35)#99 | 2.1%(+1.36)#3,185 |
| 100. | 23284 | 3.4% | 2.1%(+1.35)#100 | 2.1%(+1.36)#3,203 |
Common Questions
What are the Top 10 Zip Codes with the Highest Percentage of Population Employed in Arts, Media & Entertainment in Virginia?
Top 10 Zip Codes with the Highest Percentage of Population Employed in Arts, Media & Entertainment in Virginia are:
What zip code has the Highest Percentage of Population Employed in Arts, Media & Entertainment in Virginia?
22643 has the Highest Percentage of Population Employed in Arts, Media & Entertainment in Virginia with 32.2%.
What is the Percentage of Population Employed in Arts, Media & Entertainment in the State of Virginia?
Percentage of Population Employed in Arts, Media & Entertainment in Virginia is 2.1%.
What is the Percentage of Population Employed in Arts, Media & Entertainment in the United States?
Percentage of Population Employed in Arts, Media & Entertainment in the United States is 2.1%.