Middletown, MI Map & Demographics
Middletown Map
Middletown Overview
$26,460
PER CAPITA INCOME
$52,857
AVG FAMILY INCOME
$43,850
AVG HOUSEHOLD INCOME
27.4%
WAGE / INCOME GAP [ % ]
72.6¢/ $1
WAGE / INCOME GAP [ $ ]
0.34
INEQUALITY / GINI INDEX
720
TOTAL POPULATION
381
MALE POPULATION
339
FEMALE POPULATION
112.39
MALES / 100 FEMALES
88.98
FEMALES / 100 MALES
51.8
MEDIAN AGE
2.5
AVG FAMILY SIZE
2.1
AVG HOUSEHOLD SIZE
385
LABOR FORCE [ PEOPLE ]
57.0%
PERCENT IN LABOR FORCE
4.4%
UNEMPLOYMENT RATE
Income in Middletown
Income Overview in Middletown
Per Capita Income in Middletown is $26,460, while median incomes of families and households are $52,857 and $43,850 respectively.
| Characteristic | Number | Measure |
| Per Capita Income | 720 | $26,460 |
| Median Family Income | 202 | $52,857 |
| Mean Family Income | 202 | $66,330 |
| Median Household Income | 347 | $43,850 |
| Mean Household Income | 347 | $54,634 |
| Income Deficit | 202 | $0 |
| Wage / Income Gap (%) | 720 | 27.43% |
| Wage / Income Gap ($) | 720 | 72.57¢ per $1 |
| Gini / Inequality Index | 720 | 0.34 |
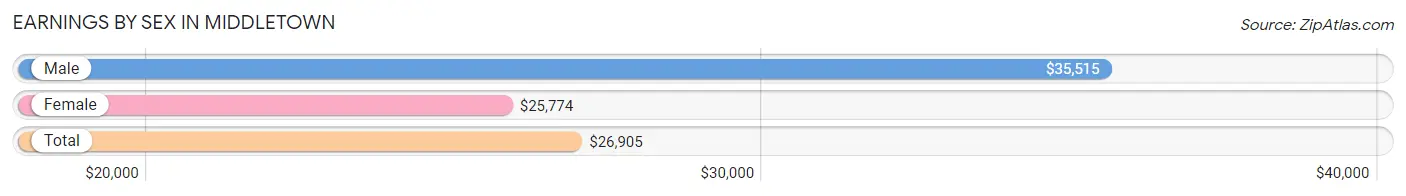
Earnings by Sex in Middletown
Average Earnings in Middletown are $26,905, $35,515 for men and $25,774 for women, a difference of 27.4%.
| Sex | Number | Average Earnings |
| Male | 209 (50.2%) | $35,515 |
| Female | 207 (49.8%) | $25,774 |
| Total | 416 (100.0%) | $26,905 |
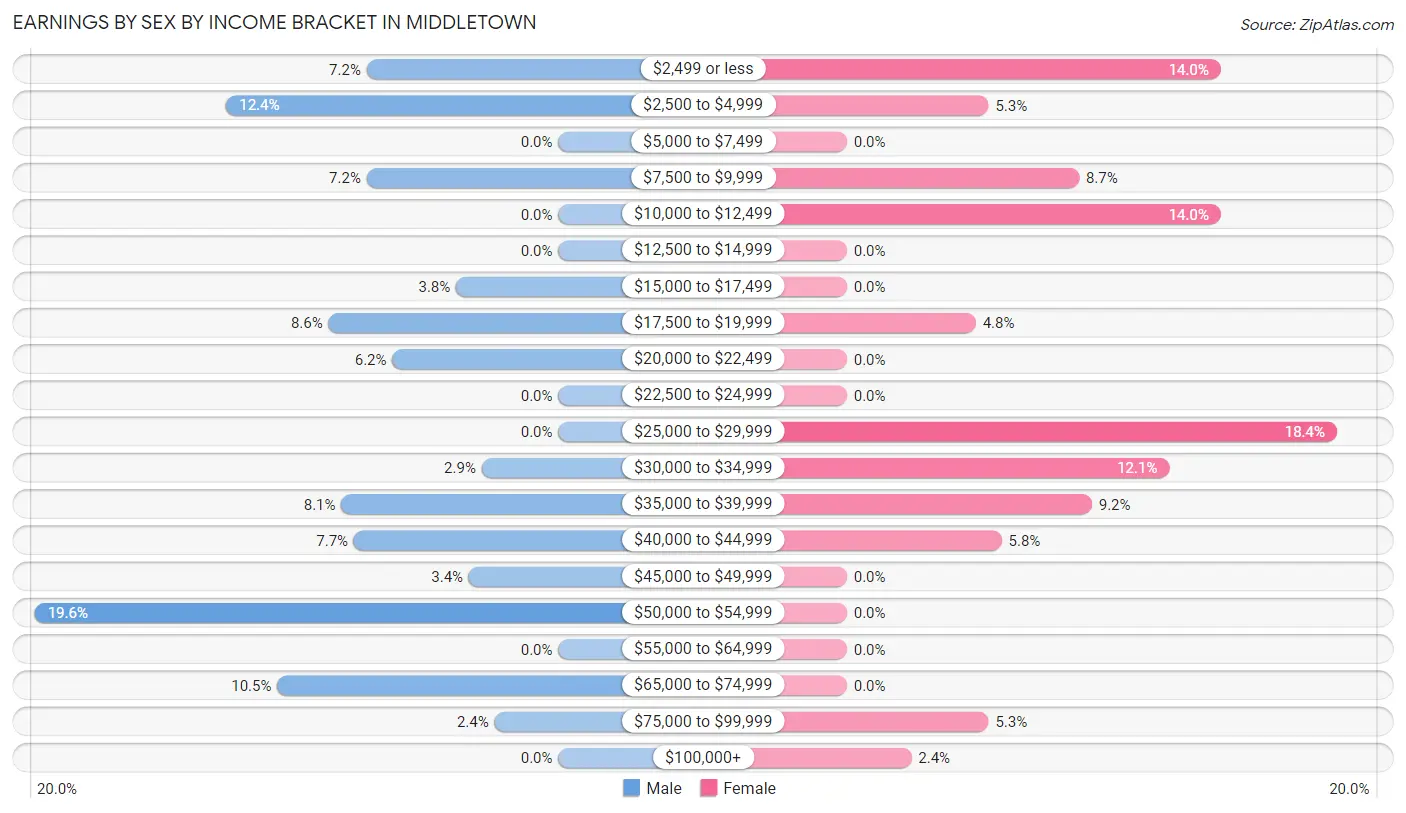
Earnings by Sex by Income Bracket in Middletown
The most common earnings brackets in Middletown are $50,000 to $54,999 for men (41 | 19.6%) and $25,000 to $29,999 for women (38 | 18.4%).
| Income | Male | Female |
| $2,499 or less | 15 (7.2%) | 29 (14.0%) |
| $2,500 to $4,999 | 26 (12.4%) | 11 (5.3%) |
| $5,000 to $7,499 | 0 (0.0%) | 0 (0.0%) |
| $7,500 to $9,999 | 15 (7.2%) | 18 (8.7%) |
| $10,000 to $12,499 | 0 (0.0%) | 29 (14.0%) |
| $12,500 to $14,999 | 0 (0.0%) | 0 (0.0%) |
| $15,000 to $17,499 | 8 (3.8%) | 0 (0.0%) |
| $17,500 to $19,999 | 18 (8.6%) | 10 (4.8%) |
| $20,000 to $22,499 | 13 (6.2%) | 0 (0.0%) |
| $22,500 to $24,999 | 0 (0.0%) | 0 (0.0%) |
| $25,000 to $29,999 | 0 (0.0%) | 38 (18.4%) |
| $30,000 to $34,999 | 6 (2.9%) | 25 (12.1%) |
| $35,000 to $39,999 | 17 (8.1%) | 19 (9.2%) |
| $40,000 to $44,999 | 16 (7.7%) | 12 (5.8%) |
| $45,000 to $49,999 | 7 (3.4%) | 0 (0.0%) |
| $50,000 to $54,999 | 41 (19.6%) | 0 (0.0%) |
| $55,000 to $64,999 | 0 (0.0%) | 0 (0.0%) |
| $65,000 to $74,999 | 22 (10.5%) | 0 (0.0%) |
| $75,000 to $99,999 | 5 (2.4%) | 11 (5.3%) |
| $100,000+ | 0 (0.0%) | 5 (2.4%) |
| Total | 209 (100.0%) | 207 (100.0%) |
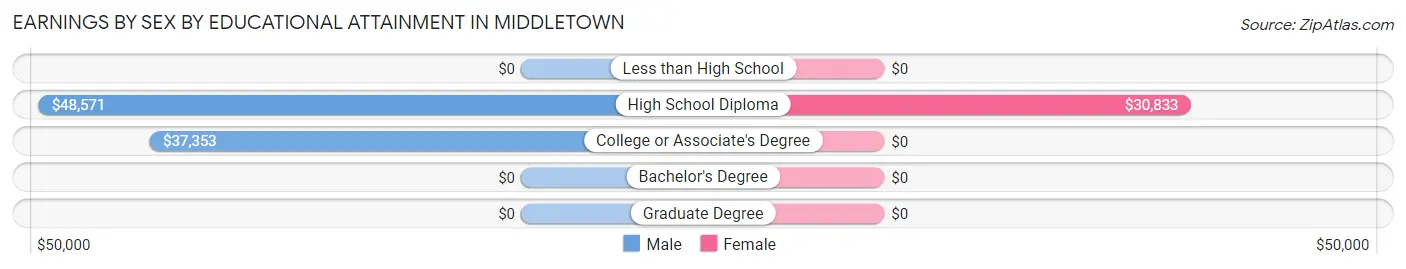
Earnings by Sex by Educational Attainment in Middletown
Average earnings in Middletown are $41,406 for men and $27,202 for women, a difference of 34.3%. Men with an educational attainment of high school diploma enjoy the highest average annual earnings of $48,571, while those with college or associate's degree education earn the least with $37,353. Women with an educational attainment of high school diploma earn the most with the average annual earnings of $30,833, while those with high school diploma education have the smallest earnings of $30,833.
| Educational Attainment | Male Income | Female Income |
| Less than High School | - | - |
| High School Diploma | $48,571 | $30,833 |
| College or Associate's Degree | $37,353 | $0 |
| Bachelor's Degree | - | - |
| Graduate Degree | - | - |
| Total | $41,406 | $27,202 |
Family Income in Middletown
Family Income Brackets in Middletown
According to the Middletown family income data, there are 78 families falling into the $35,000 to $49,999 income range, which is the most common income bracket and makes up 38.6% of all families.
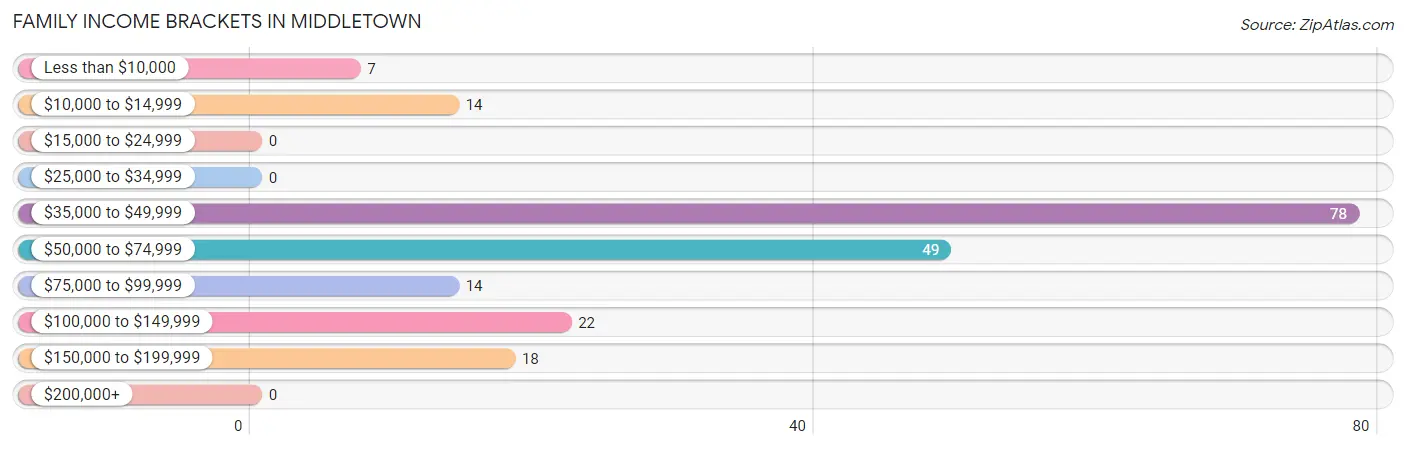
| Income Bracket | # Families | % Families |
| Less than $10,000 | 7 | 3.5% |
| $10,000 to $14,999 | 14 | 6.9% |
| $15,000 to $24,999 | 0 | 0.0% |
| $25,000 to $34,999 | 0 | 0.0% |
| $35,000 to $49,999 | 78 | 38.6% |
| $50,000 to $74,999 | 49 | 24.3% |
| $75,000 to $99,999 | 14 | 6.9% |
| $100,000 to $149,999 | 22 | 10.9% |
| $150,000 to $199,999 | 18 | 8.9% |
| $200,000+ | 0 | 0.0% |
Family Income by Famaliy Size in Middletown
5-person families (24 | 11.9%) account for the highest median family income in Middletown with $148,409 per family, while 5-person families (24 | 11.9%) have the highest median income of $29,682 per family member.
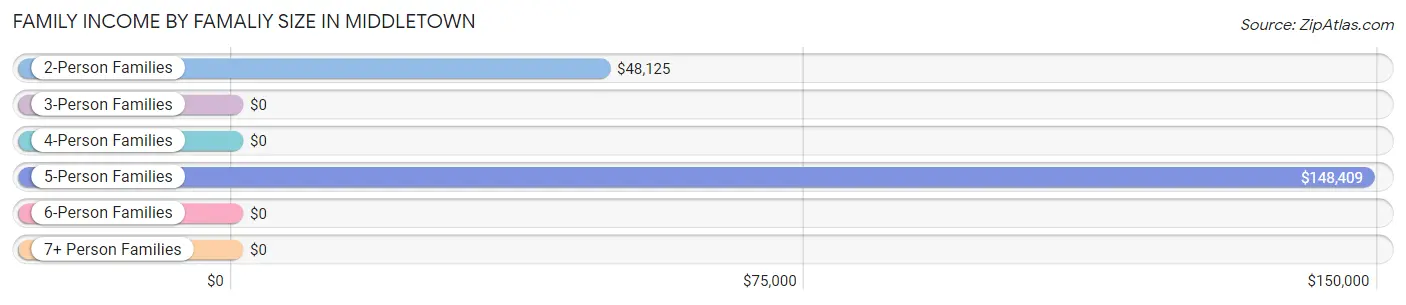
| Income Bracket | # Families | Median Income |
| 2-Person Families | 164 (81.2%) | $48,125 |
| 3-Person Families | 14 (6.9%) | $0 |
| 4-Person Families | 0 (0.0%) | $0 |
| 5-Person Families | 24 (11.9%) | $148,409 |
| 6-Person Families | 0 (0.0%) | $0 |
| 7+ Person Families | 0 (0.0%) | $0 |
| Total | 202 (100.0%) | $52,857 |
Family Income by Number of Earners in Middletown
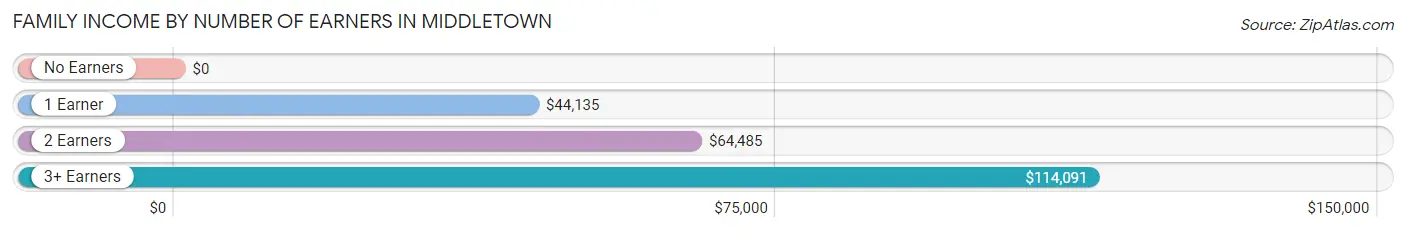
| Number of Earners | # Families | Median Income |
| No Earners | 72 (35.6%) | $0 |
| 1 Earner | 55 (27.2%) | $44,135 |
| 2 Earners | 45 (22.3%) | $64,485 |
| 3+ Earners | 30 (14.8%) | $114,091 |
| Total | 202 (100.0%) | $52,857 |
Household Income in Middletown
Household Income Brackets in Middletown
With 106 households falling in the category, the $35,000 to $49,999 income range is the most frequent in Middletown, accounting for 30.5% of all households.
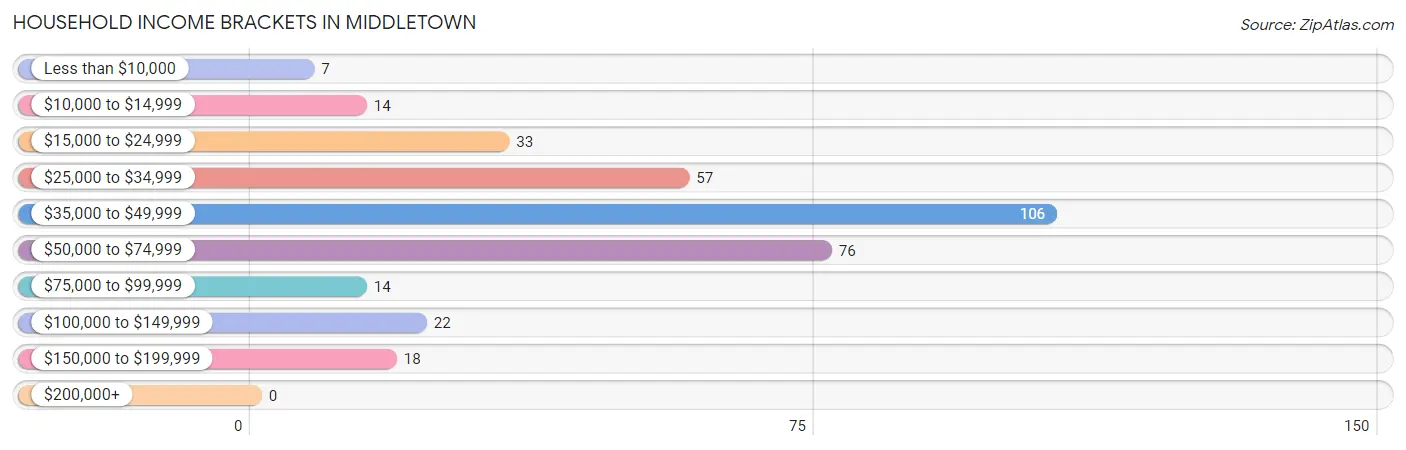
| Income Bracket | # Households | % Households |
| Less than $10,000 | 7 | 2.0% |
| $10,000 to $14,999 | 14 | 4.0% |
| $15,000 to $24,999 | 33 | 9.5% |
| $25,000 to $34,999 | 57 | 16.4% |
| $35,000 to $49,999 | 106 | 30.5% |
| $50,000 to $74,999 | 76 | 21.9% |
| $75,000 to $99,999 | 14 | 4.0% |
| $100,000 to $149,999 | 22 | 6.3% |
| $150,000 to $199,999 | 18 | 5.2% |
| $200,000+ | 0 | 0.0% |
Household Income by Householder Age in Middletown
The median household income in Middletown is $43,850, with the highest median household income of $43,173 found in the 65+ years age bracket for the primary householder. A total of 97 households (28.0%) fall into this category. Meanwhile, the 15 to 24 years age bracket for the primary householder has the lowest median household income of $0, with 18 households (5.2%) in this group.
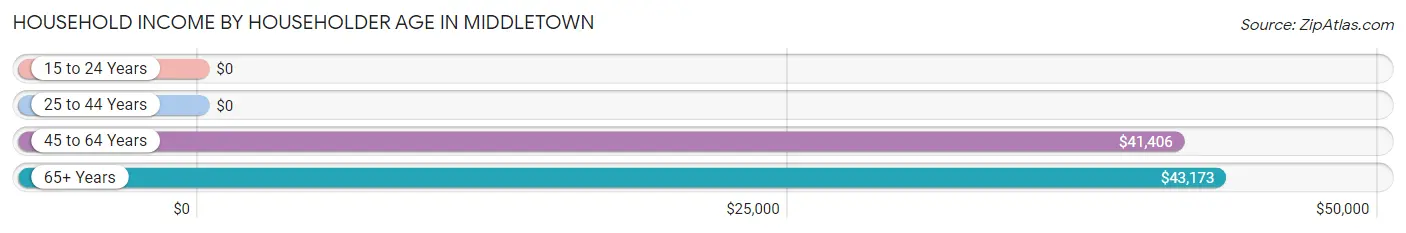
| Income Bracket | # Households | Median Income |
| 15 to 24 Years | 18 (5.2%) | $0 |
| 25 to 44 Years | 45 (13.0%) | $0 |
| 45 to 64 Years | 187 (53.9%) | $41,406 |
| 65+ Years | 97 (28.0%) | $43,173 |
| Total | 347 (100.0%) | $43,850 |
Poverty in Middletown
Income Below Poverty by Sex and Age in Middletown
With 10.0% poverty level for males and 17.7% for females among the residents of Middletown, 18 to 24 year old males and 15 year old females are the most vulnerable to poverty, with 17 males (56.7%) and 14 females (73.7%) in their respective age groups living below the poverty level.
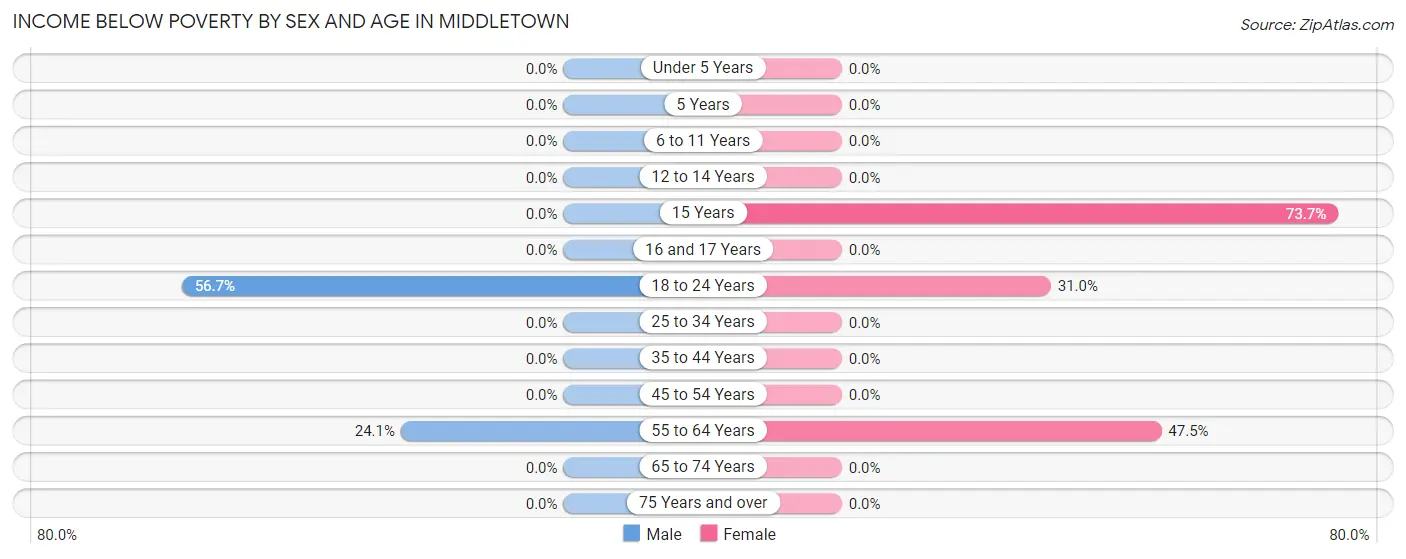
| Age Bracket | Male | Female |
| Under 5 Years | 0 (0.0%) | 0 (0.0%) |
| 5 Years | 0 (0.0%) | 0 (0.0%) |
| 6 to 11 Years | 0 (0.0%) | 0 (0.0%) |
| 12 to 14 Years | 0 (0.0%) | 0 (0.0%) |
| 15 Years | 0 (0.0%) | 14 (73.7%) |
| 16 and 17 Years | 0 (0.0%) | 0 (0.0%) |
| 18 to 24 Years | 17 (56.7%) | 18 (31.0%) |
| 25 to 34 Years | 0 (0.0%) | 0 (0.0%) |
| 35 to 44 Years | 0 (0.0%) | 0 (0.0%) |
| 45 to 54 Years | 0 (0.0%) | 0 (0.0%) |
| 55 to 64 Years | 21 (24.1%) | 28 (47.5%) |
| 65 to 74 Years | 0 (0.0%) | 0 (0.0%) |
| 75 Years and over | 0 (0.0%) | 0 (0.0%) |
| Total | 38 (10.0%) | 60 (17.7%) |
Income Above Poverty by Sex and Age in Middletown
According to the poverty statistics in Middletown, males aged 12 to 14 years and females aged 6 to 11 years are the age groups that are most secure financially, with 100.0% of males and 100.0% of females in these age groups living above the poverty line.
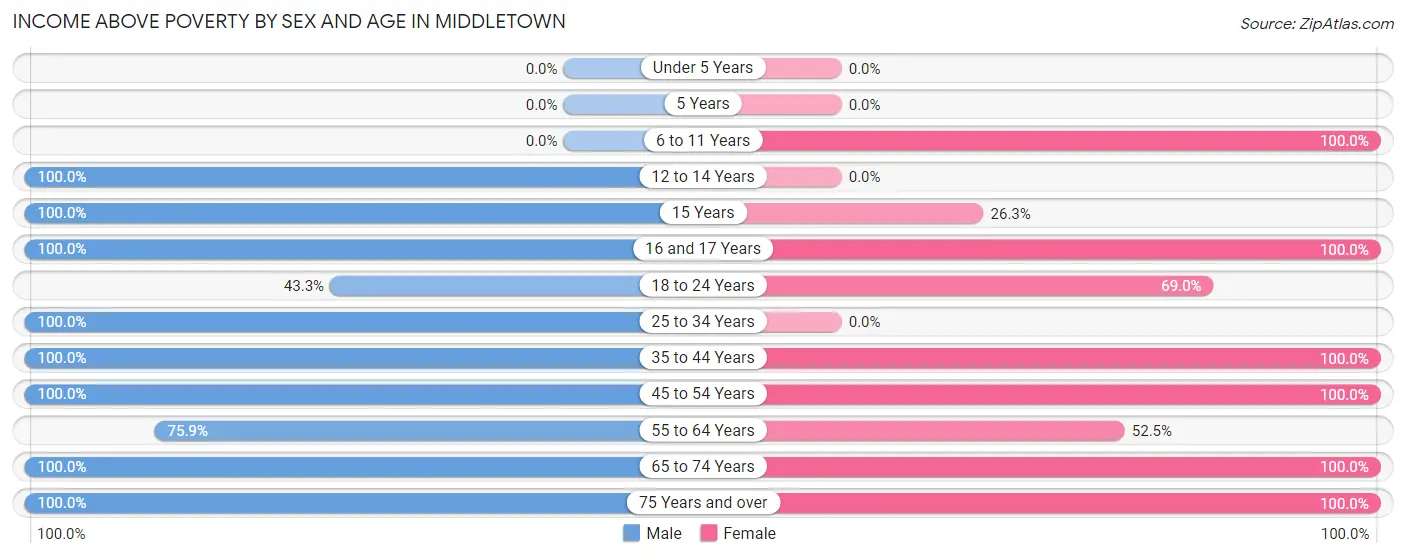
| Age Bracket | Male | Female |
| Under 5 Years | 0 (0.0%) | 0 (0.0%) |
| 5 Years | 0 (0.0%) | 0 (0.0%) |
| 6 to 11 Years | 0 (0.0%) | 3 (100.0%) |
| 12 to 14 Years | 9 (100.0%) | 0 (0.0%) |
| 15 Years | 14 (100.0%) | 5 (26.3%) |
| 16 and 17 Years | 15 (100.0%) | 18 (100.0%) |
| 18 to 24 Years | 13 (43.3%) | 40 (69.0%) |
| 25 to 34 Years | 35 (100.0%) | 0 (0.0%) |
| 35 to 44 Years | 28 (100.0%) | 36 (100.0%) |
| 45 to 54 Years | 82 (100.0%) | 57 (100.0%) |
| 55 to 64 Years | 66 (75.9%) | 31 (52.5%) |
| 65 to 74 Years | 44 (100.0%) | 54 (100.0%) |
| 75 Years and over | 37 (100.0%) | 35 (100.0%) |
| Total | 343 (90.0%) | 279 (82.3%) |
Income Below Poverty Among Married-Couple Families in Middletown
The poverty statistics for married-couple families in Middletown show that 4.0% or 7 of the total 175 families live below the poverty line. Families with no children have the highest poverty rate of 4.7%, comprising of 7 families. On the other hand, families with 1 or 2 children have the lowest poverty rate of 0.0%, which includes 0 families.
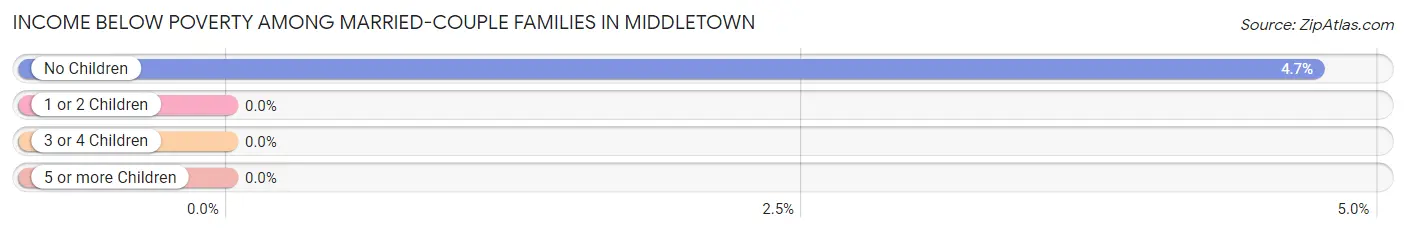
| Children | Above Poverty | Below Poverty |
| No Children | 141 (95.3%) | 7 (4.7%) |
| 1 or 2 Children | 22 (100.0%) | 0 (0.0%) |
| 3 or 4 Children | 5 (100.0%) | 0 (0.0%) |
| 5 or more Children | 0 (0.0%) | 0 (0.0%) |
| Total | 168 (96.0%) | 7 (4.0%) |
Income Below Poverty Among Single-Parent Households in Middletown
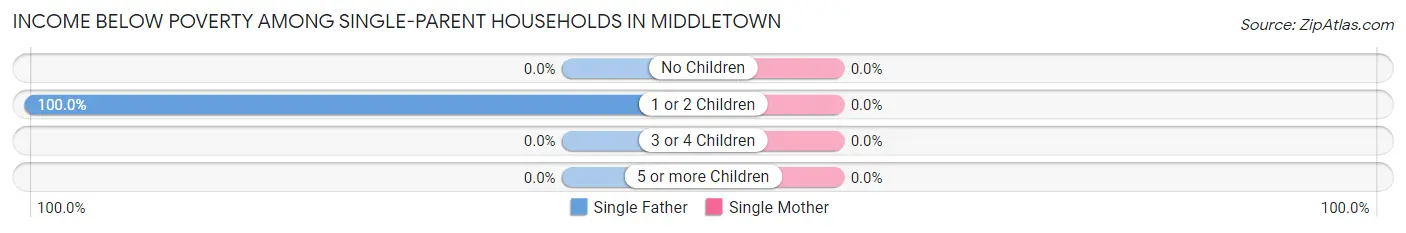
| Children | Single Father | Single Mother |
| No Children | 0 (0.0%) | 0 (0.0%) |
| 1 or 2 Children | 14 (100.0%) | 0 (0.0%) |
| 3 or 4 Children | 0 (0.0%) | 0 (0.0%) |
| 5 or more Children | 0 (0.0%) | 0 (0.0%) |
| Total | 14 (100.0%) | 0 (0.0%) |
Income Below Poverty Among Married-Couple vs Single-Parent Households in Middletown
The poverty data for Middletown shows that 7 of the married-couple family households (4.0%) and 14 of the single-parent households (51.8%) are living below the poverty level. Within the married-couple family households, those with no children have the highest poverty rate, with 7 households (4.7%) falling below the poverty line. Among the single-parent households, those with 1 or 2 children have the highest poverty rate, with 14 household (100.0%) living below poverty.
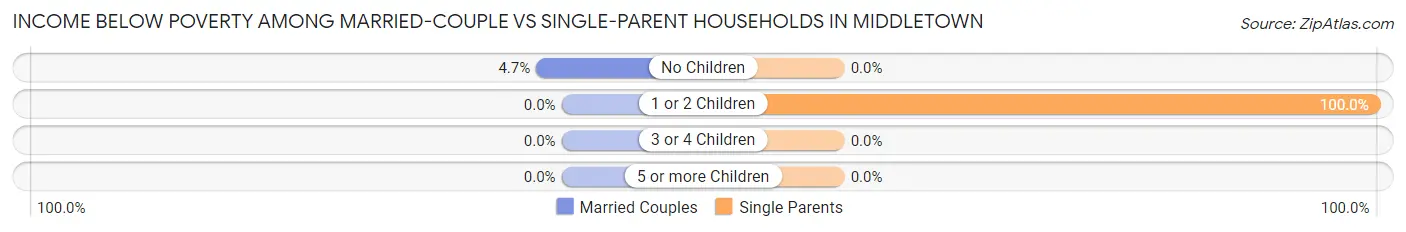
| Children | Married-Couple Families | Single-Parent Households |
| No Children | 7 (4.7%) | 0 (0.0%) |
| 1 or 2 Children | 0 (0.0%) | 14 (100.0%) |
| 3 or 4 Children | 0 (0.0%) | 0 (0.0%) |
| 5 or more Children | 0 (0.0%) | 0 (0.0%) |
| Total | 7 (4.0%) | 14 (51.8%) |
Race in Middletown
The most populous races in Middletown are White / Caucasian (703 | 97.6%), and Two or more Races (17 | 2.4%).
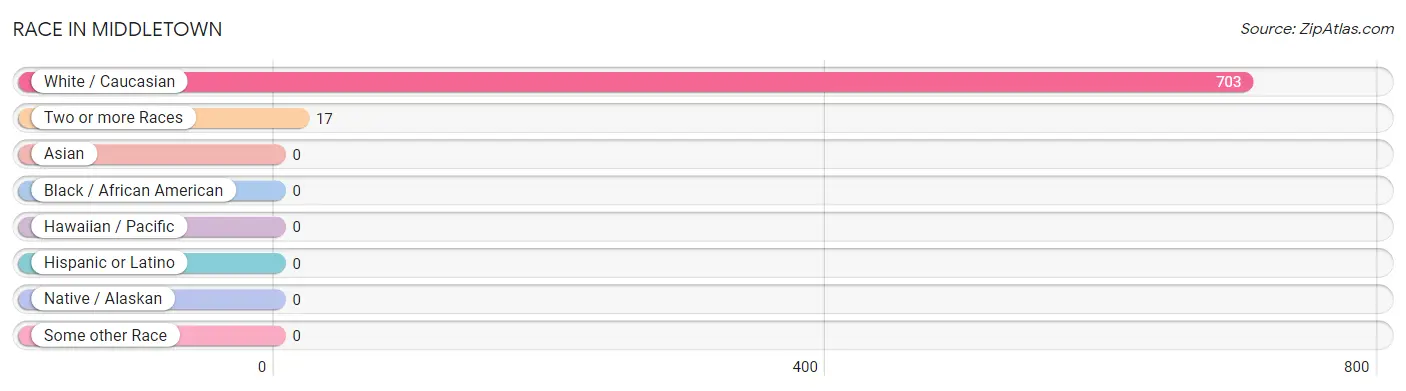
| Race | # Population | % Population |
| Asian | 0 | 0.0% |
| Black / African American | 0 | 0.0% |
| Hawaiian / Pacific | 0 | 0.0% |
| Hispanic or Latino | 0 | 0.0% |
| Native / Alaskan | 0 | 0.0% |
| White / Caucasian | 703 | 97.6% |
| Two or more Races | 17 | 2.4% |
| Some other Race | 0 | 0.0% |
| Total | 720 | 100.0% |
Ancestry in Middletown
The most populous ancestries reported in Middletown are German (190 | 26.4%), English (150 | 20.8%), Czech (72 | 10.0%), Irish (72 | 10.0%), and French (65 | 9.0%), together accounting for 76.3% of all Middletown residents.
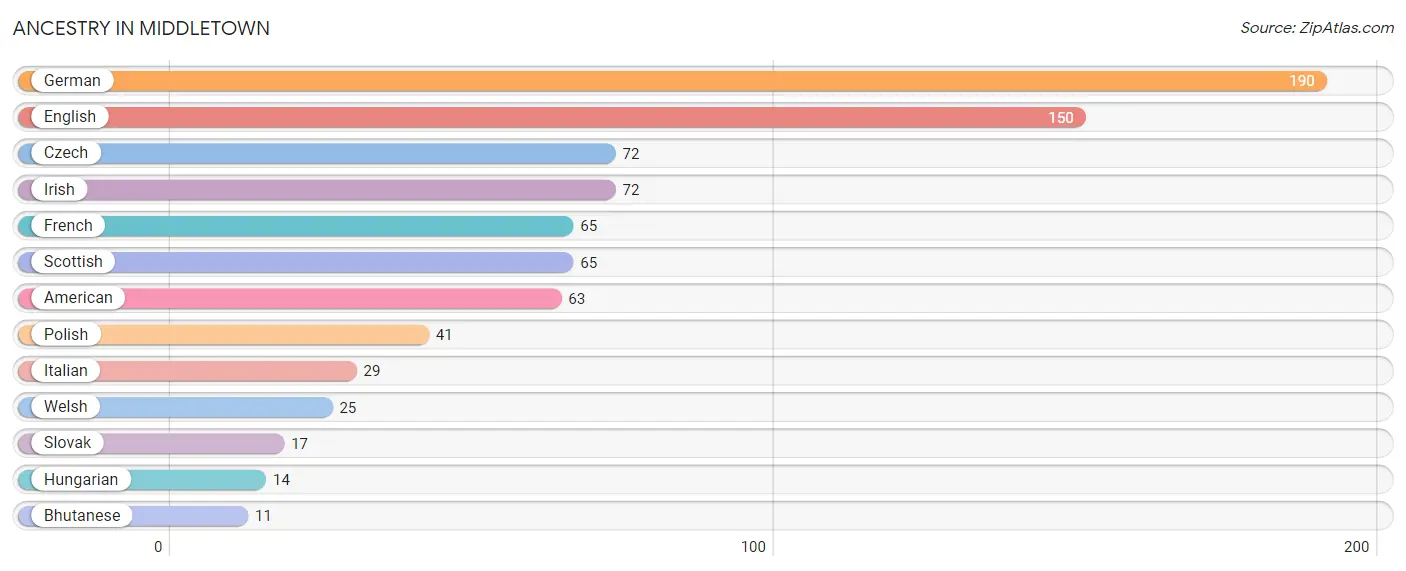
| Ancestry | # Population | % Population |
| American | 63 | 8.7% |
| Bhutanese | 11 | 1.5% |
| Czech | 72 | 10.0% |
| English | 150 | 20.8% |
| French | 65 | 9.0% |
| German | 190 | 26.4% |
| Hungarian | 14 | 1.9% |
| Irish | 72 | 10.0% |
| Italian | 29 | 4.0% |
| Polish | 41 | 5.7% |
| Scottish | 65 | 9.0% |
| Slovak | 17 | 2.4% |
| Welsh | 25 | 3.5% | View All 13 Rows |
Immigrants in Middletown
The most numerous immigrant groups reported in Middletown came from Asia (8 | 1.1%), Western Asia (8 | 1.1%), and Yemen (8 | 1.1%), together accounting for 3.3% of all Middletown residents.
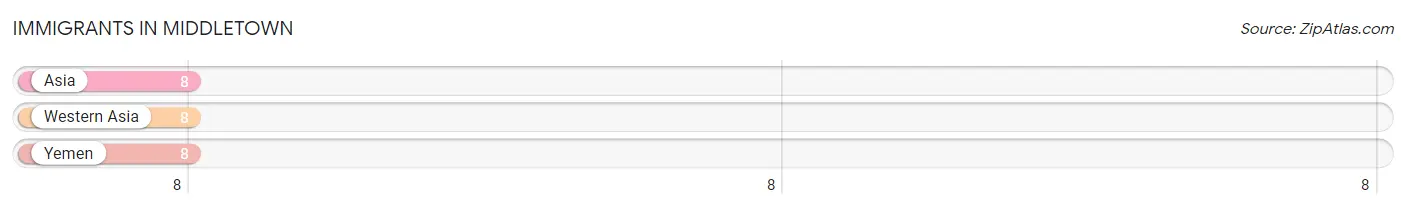
| Immigration Origin | # Population | % Population |
| Asia | 8 | 1.1% |
| Western Asia | 8 | 1.1% |
| Yemen | 8 | 1.1% | View All 3 Rows |
Sex and Age in Middletown
Sex and Age in Middletown
The most populous age groups in Middletown are 45 to 49 Years (60 | 15.8%) for men and 15 to 19 Years (50 | 14.7%) for women.
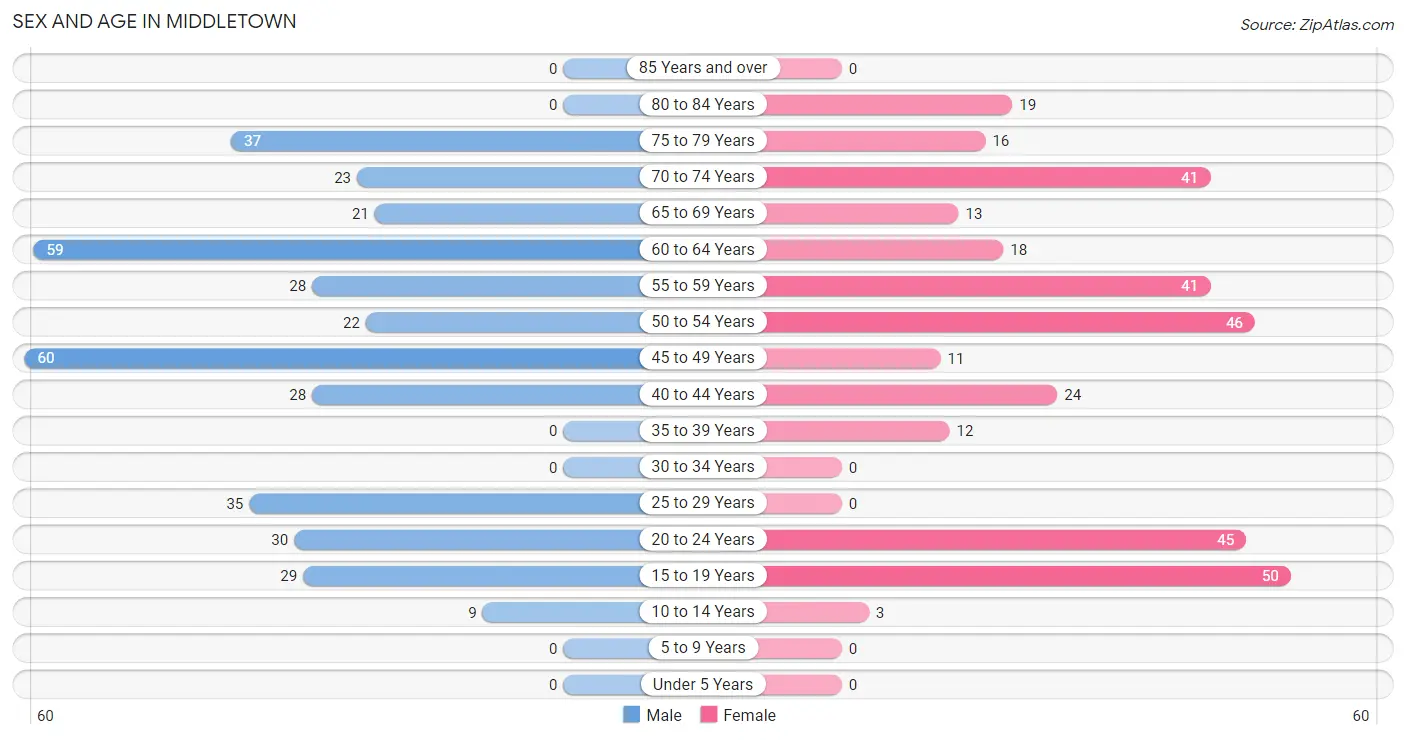
| Age Bracket | Male | Female |
| Under 5 Years | 0 (0.0%) | 0 (0.0%) |
| 5 to 9 Years | 0 (0.0%) | 0 (0.0%) |
| 10 to 14 Years | 9 (2.4%) | 3 (0.9%) |
| 15 to 19 Years | 29 (7.6%) | 50 (14.7%) |
| 20 to 24 Years | 30 (7.9%) | 45 (13.3%) |
| 25 to 29 Years | 35 (9.2%) | 0 (0.0%) |
| 30 to 34 Years | 0 (0.0%) | 0 (0.0%) |
| 35 to 39 Years | 0 (0.0%) | 12 (3.5%) |
| 40 to 44 Years | 28 (7.3%) | 24 (7.1%) |
| 45 to 49 Years | 60 (15.8%) | 11 (3.2%) |
| 50 to 54 Years | 22 (5.8%) | 46 (13.6%) |
| 55 to 59 Years | 28 (7.3%) | 41 (12.1%) |
| 60 to 64 Years | 59 (15.5%) | 18 (5.3%) |
| 65 to 69 Years | 21 (5.5%) | 13 (3.8%) |
| 70 to 74 Years | 23 (6.0%) | 41 (12.1%) |
| 75 to 79 Years | 37 (9.7%) | 16 (4.7%) |
| 80 to 84 Years | 0 (0.0%) | 19 (5.6%) |
| 85 Years and over | 0 (0.0%) | 0 (0.0%) |
| Total | 381 (100.0%) | 339 (100.0%) |
Families and Households in Middletown
Median Family Size in Middletown
The median family size in Middletown is 2.52 persons per family, with married-couple families (175 | 86.6%) accounting for the largest median family size of 2.57 persons per family. On the other hand, single male/father families (14 | 6.9%) represent the smallest median family size with 2.00 persons per family.
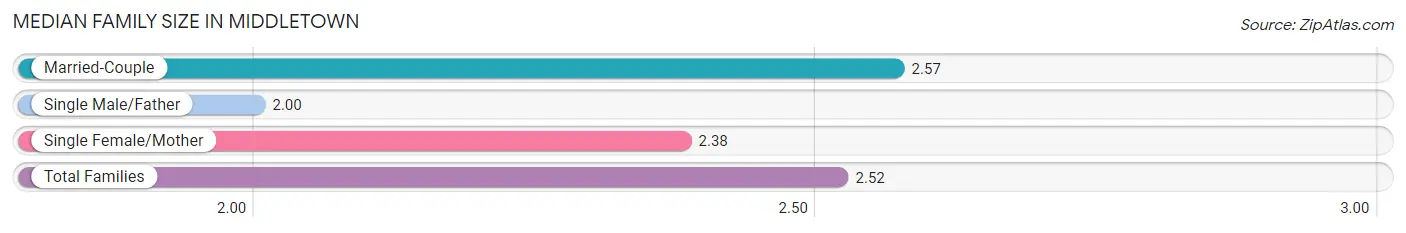
| Family Type | # Families | Family Size |
| Married-Couple | 175 (86.6%) | 2.57 |
| Single Male/Father | 14 (6.9%) | 2.00 |
| Single Female/Mother | 13 (6.4%) | 2.38 |
| Total Families | 202 (100.0%) | 2.52 |
Median Household Size in Middletown
The median household size in Middletown is 2.07 persons per household, with married-couple households (175 | 50.4%) accounting for the largest median household size of 2.57 persons per household. non-family households (145 | 41.8%) represent the smallest median household size with 1.46 persons per household.
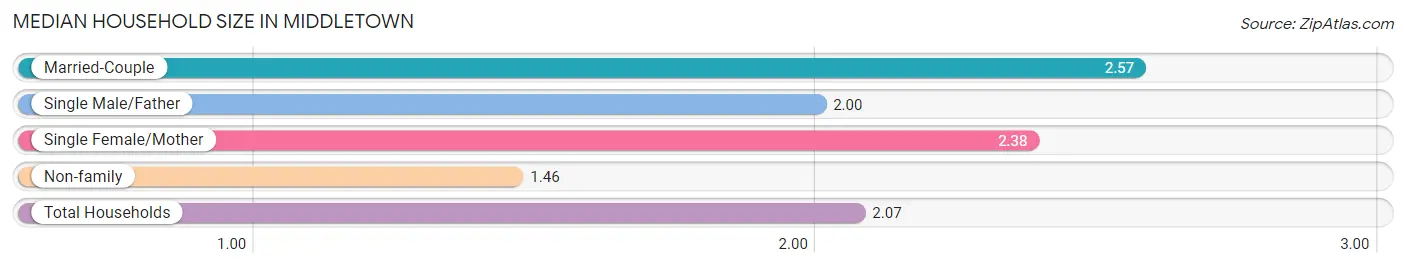
| Household Type | # Households | Household Size |
| Married-Couple | 175 (50.4%) | 2.57 |
| Single Male/Father | 14 (4.0%) | 2.00 |
| Single Female/Mother | 13 (3.7%) | 2.38 |
| Non-family | 145 (41.8%) | 1.46 |
| Total Households | 347 (100.0%) | 2.07 |
Household Size by Marriage Status in Middletown
Out of a total of 347 households in Middletown, 202 (58.2%) are family households, while 145 (41.8%) are nonfamily households. The most numerous type of family households are 2-person households, comprising 164, and the most common type of nonfamily households are 1-person households, comprising 74.
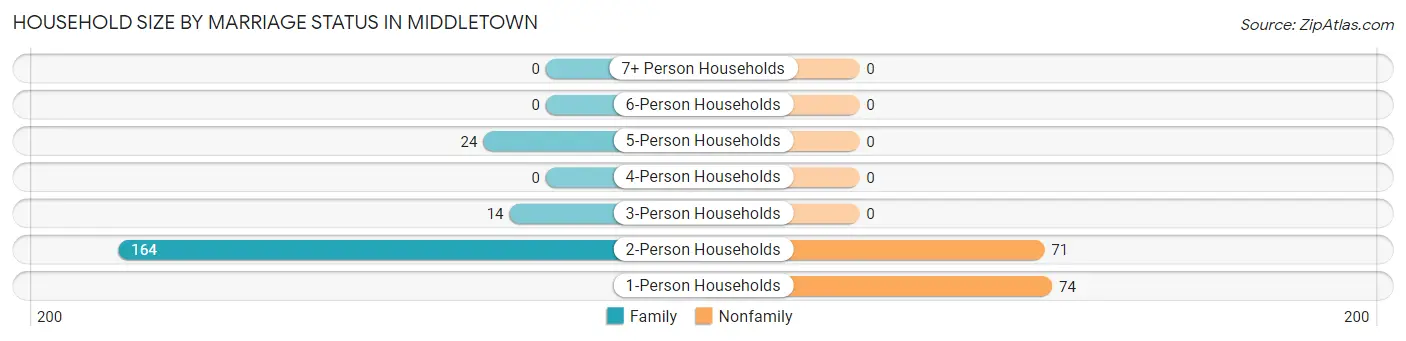
| Household Size | Family Households | Nonfamily Households |
| 1-Person Households | - | 74 (21.3%) |
| 2-Person Households | 164 (47.3%) | 71 (20.5%) |
| 3-Person Households | 14 (4.0%) | 0 (0.0%) |
| 4-Person Households | 0 (0.0%) | 0 (0.0%) |
| 5-Person Households | 24 (6.9%) | 0 (0.0%) |
| 6-Person Households | 0 (0.0%) | 0 (0.0%) |
| 7+ Person Households | 0 (0.0%) | 0 (0.0%) |
| Total | 202 (58.2%) | 145 (41.8%) |
Female Fertility in Middletown
Fertility by Age in Middletown
| Age Bracket | Women with Births | Births / 1,000 Women |
| 15 to 19 years | 0 (0.0%) | 0.0 |
| 20 to 34 years | 0 (0.0%) | 0.0 |
| 35 to 50 years | 0 (0.0%) | 0.0 |
| Total | 0 (0.0%) | 0.0 |
Fertility by Age by Marriage Status in Middletown
| Age Bracket | Married | Unmarried |
| 15 to 19 years | 0 (0.0%) | 0 (0.0%) |
| 20 to 34 years | 0 (0.0%) | 0 (0.0%) |
| 35 to 50 years | 0 (0.0%) | 0 (0.0%) |
| Total | 0 (0.0%) | 0 (0.0%) |
Fertility by Education in Middletown
| Educational Attainment | Women with Births | Births / 1,000 Women |
| Less than High School | 0 (0.0%) | 0.0 |
| High School Diploma | 0 (0.0%) | 0.0 |
| College or Associate's Degree | 0 (0.0%) | 0.0 |
| Bachelor's Degree | 0 (0.0%) | 0.0 |
| Graduate Degree | 0 (0.0%) | 0.0 |
| Total | 0 (0.0%) | 0.0 |
Fertility by Education by Marriage Status in Middletown
| Educational Attainment | Married | Unmarried |
| Less than High School | 0 (0.0%) | 0 (0.0%) |
| High School Diploma | 0 (0.0%) | 0 (0.0%) |
| College or Associate's Degree | 0 (0.0%) | 0 (0.0%) |
| Bachelor's Degree | 0 (0.0%) | 0 (0.0%) |
| Graduate Degree | 0 (0.0%) | 0 (0.0%) |
| Total | 0 (0.0%) | 0 (0.0%) |
Employment Characteristics in Middletown
Employment by Class of Employer in Middletown
Among the 354 employed individuals in Middletown, private company employees (295 | 83.3%), not-for-profit organizations (30 | 8.5%), and self-employed (not incorporated) (29 | 8.2%) make up the most common classes of employment.
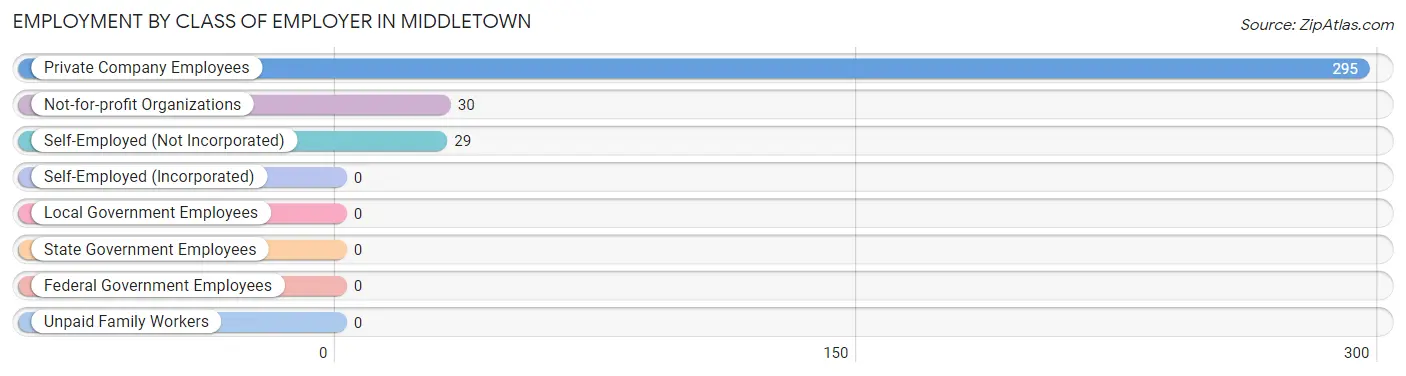
| Employer Class | # Employees | % Employees |
| Private Company Employees | 295 | 83.3% |
| Self-Employed (Incorporated) | 0 | 0.0% |
| Self-Employed (Not Incorporated) | 29 | 8.2% |
| Not-for-profit Organizations | 30 | 8.5% |
| Local Government Employees | 0 | 0.0% |
| State Government Employees | 0 | 0.0% |
| Federal Government Employees | 0 | 0.0% |
| Unpaid Family Workers | 0 | 0.0% |
| Total | 354 | 100.0% |
Employment Status by Age in Middletown
According to the labor force statistics for Middletown, out of the total population over 16 years of age (675), 57.0% or 385 individuals are in the labor force, with 4.4% or 17 of them unemployed. The age group with the highest labor force participation rate is 20 to 24 years, with 100.0% or 75 individuals in the labor force. Within the labor force, the 20 to 24 years age range has the highest percentage of unemployed individuals, with 22.7% or 17 of them being unemployed.
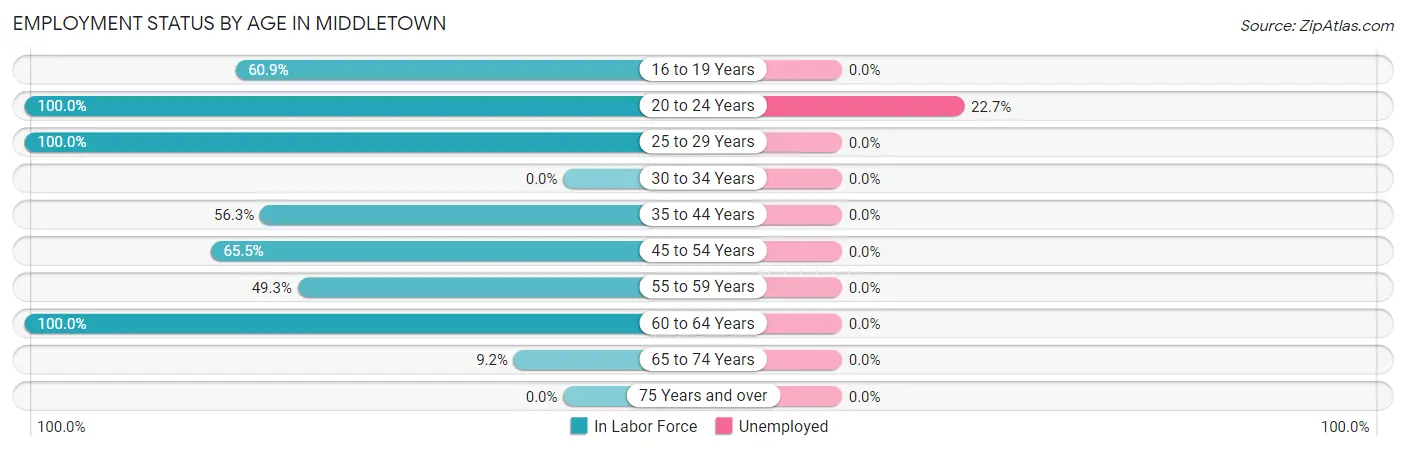
| Age Bracket | In Labor Force | Unemployed |
| 16 to 19 Years | 28 (60.9%) | 0 (0.0%) |
| 20 to 24 Years | 75 (100.0%) | 17 (22.7%) |
| 25 to 29 Years | 35 (100.0%) | 0 (0.0%) |
| 30 to 34 Years | 0 (0.0%) | 0 (0.0%) |
| 35 to 44 Years | 36 (56.3%) | 0 (0.0%) |
| 45 to 54 Years | 91 (65.5%) | 0 (0.0%) |
| 55 to 59 Years | 34 (49.3%) | 0 (0.0%) |
| 60 to 64 Years | 77 (100.0%) | 0 (0.0%) |
| 65 to 74 Years | 9 (9.2%) | 0 (0.0%) |
| 75 Years and over | 0 (0.0%) | 0 (0.0%) |
| Total | 385 (57.0%) | 17 (4.4%) |
Employment Status by Educational Attainment in Middletown
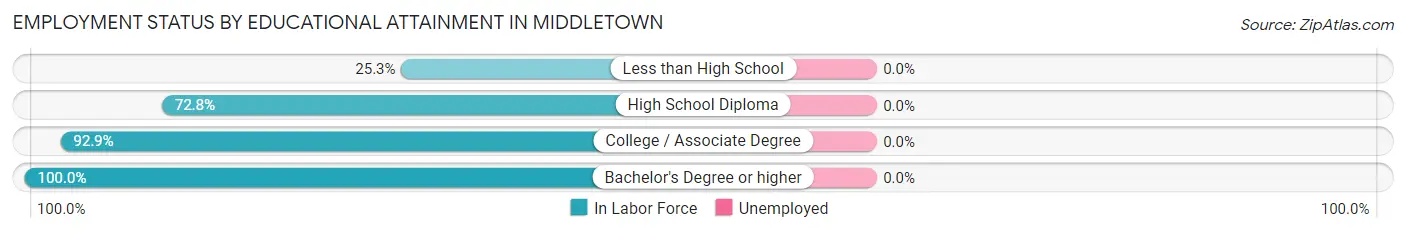
| Educational Attainment | In Labor Force | Unemployed |
| Less than High School | 25 (25.3%) | 0 (0.0%) |
| High School Diploma | 67 (72.8%) | 0 (0.0%) |
| College / Associate Degree | 157 (92.9%) | 0 (0.0%) |
| Bachelor's Degree or higher | 24 (100.0%) | 0 (0.0%) |
| Total | 273 (71.1%) | 0 (0.0%) |
Employment Occupations by Sex in Middletown
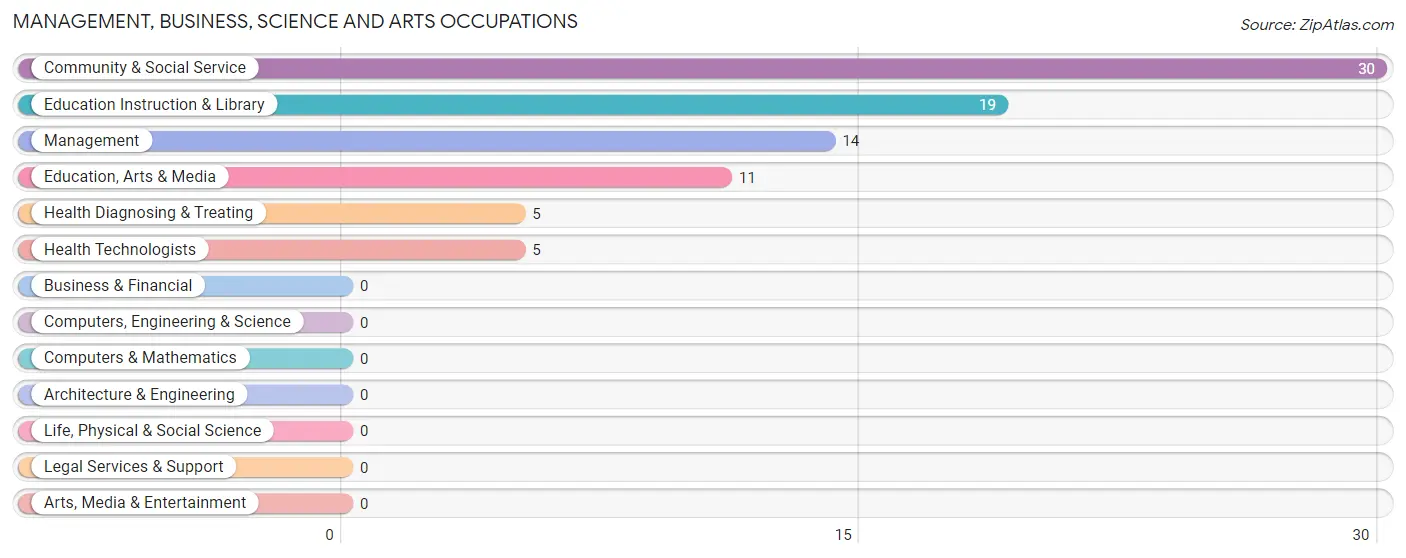
Management, Business, Science and Arts Occupations
The most common Management, Business, Science and Arts occupations in Middletown are Community & Social Service (30 | 8.2%), Education Instruction & Library (19 | 5.2%), Management (14 | 3.8%), Education, Arts & Media (11 | 3.0%), and Health Diagnosing & Treating (5 | 1.4%).
Management, Business, Science and Arts Occupations by Sex
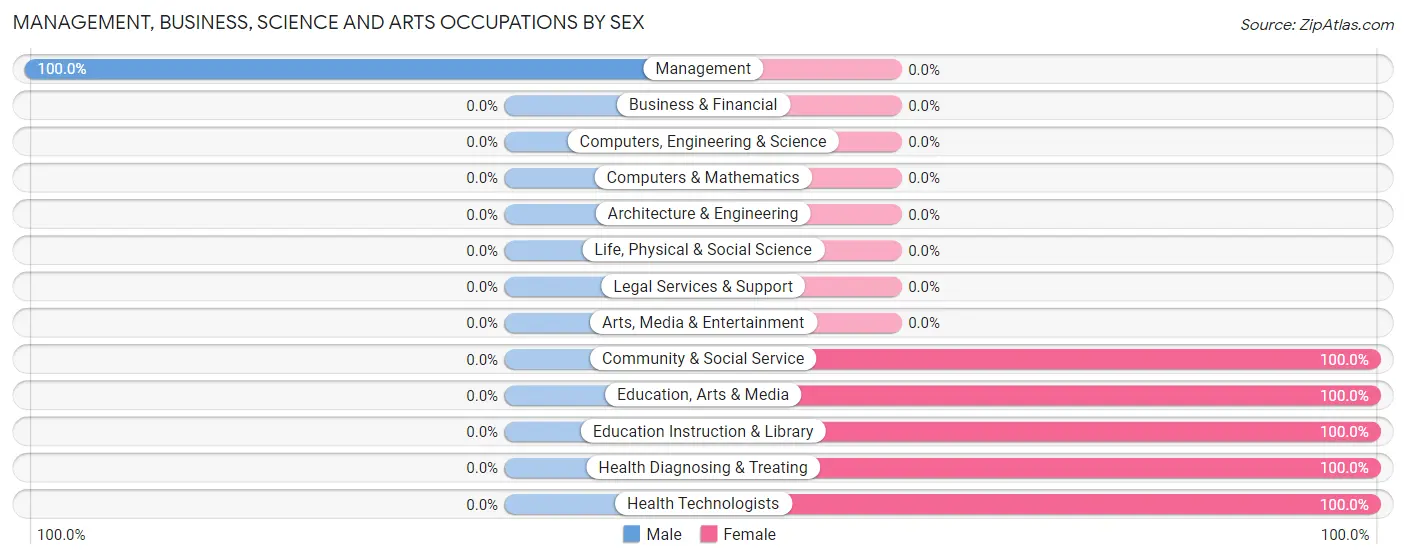
| Occupation | Male | Female |
| Management | 14 (100.0%) | 0 (0.0%) |
| Business & Financial | 0 (0.0%) | 0 (0.0%) |
| Computers, Engineering & Science | 0 (0.0%) | 0 (0.0%) |
| Computers & Mathematics | 0 (0.0%) | 0 (0.0%) |
| Architecture & Engineering | 0 (0.0%) | 0 (0.0%) |
| Life, Physical & Social Science | 0 (0.0%) | 0 (0.0%) |
| Community & Social Service | 0 (0.0%) | 30 (100.0%) |
| Education, Arts & Media | 0 (0.0%) | 11 (100.0%) |
| Legal Services & Support | 0 (0.0%) | 0 (0.0%) |
| Education Instruction & Library | 0 (0.0%) | 19 (100.0%) |
| Arts, Media & Entertainment | 0 (0.0%) | 0 (0.0%) |
| Health Diagnosing & Treating | 0 (0.0%) | 5 (100.0%) |
| Health Technologists | 0 (0.0%) | 5 (100.0%) |
| Total (Category) | 14 (28.6%) | 35 (71.4%) |
| Total (Overall) | 172 (46.7%) | 196 (53.3%) |
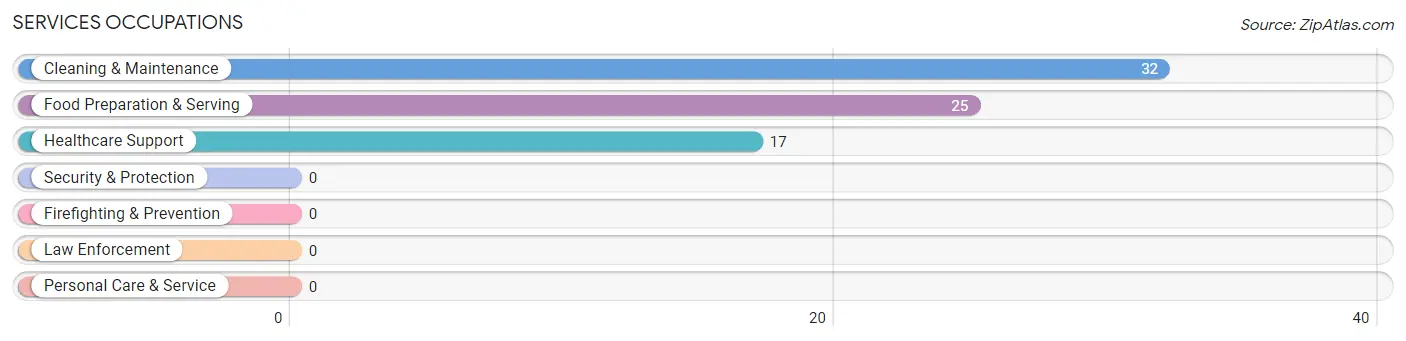
Services Occupations
The most common Services occupations in Middletown are Cleaning & Maintenance (32 | 8.7%), Food Preparation & Serving (25 | 6.8%), and Healthcare Support (17 | 4.6%).
Services Occupations by Sex
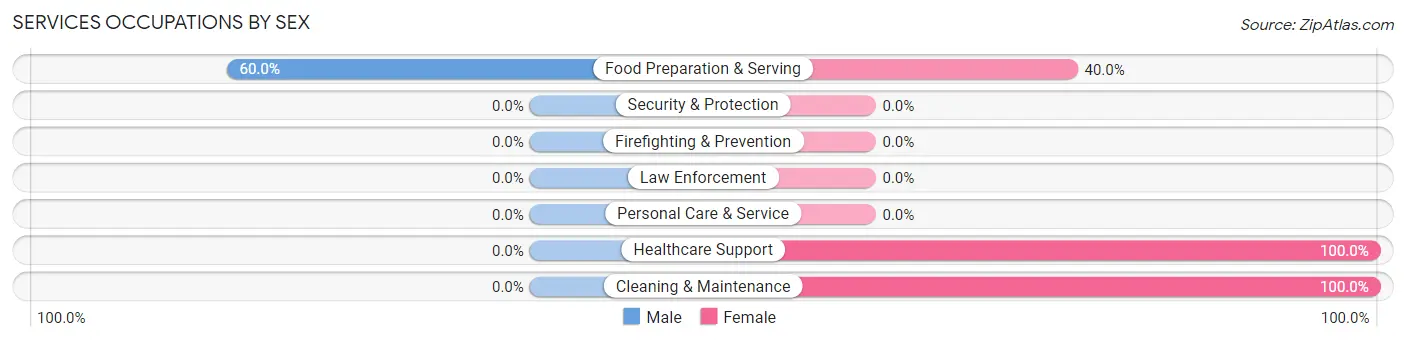
| Occupation | Male | Female |
| Healthcare Support | 0 (0.0%) | 17 (100.0%) |
| Security & Protection | 0 (0.0%) | 0 (0.0%) |
| Firefighting & Prevention | 0 (0.0%) | 0 (0.0%) |
| Law Enforcement | 0 (0.0%) | 0 (0.0%) |
| Food Preparation & Serving | 15 (60.0%) | 10 (40.0%) |
| Cleaning & Maintenance | 0 (0.0%) | 32 (100.0%) |
| Personal Care & Service | 0 (0.0%) | 0 (0.0%) |
| Total (Category) | 15 (20.3%) | 59 (79.7%) |
| Total (Overall) | 172 (46.7%) | 196 (53.3%) |
Sales and Office Occupations
The most common Sales and Office occupations in Middletown are Sales & Related (59 | 16.0%), and Office & Administration (44 | 12.0%).
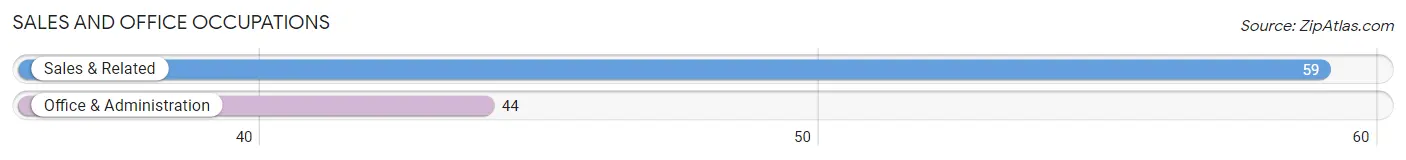
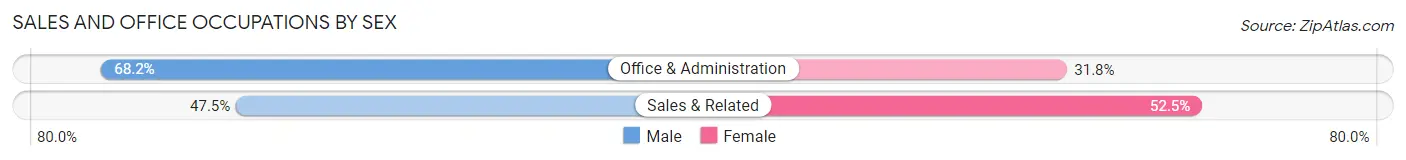
Sales and Office Occupations by Sex
| Occupation | Male | Female |
| Sales & Related | 28 (47.5%) | 31 (52.5%) |
| Office & Administration | 30 (68.2%) | 14 (31.8%) |
| Total (Category) | 58 (56.3%) | 45 (43.7%) |
| Total (Overall) | 172 (46.7%) | 196 (53.3%) |
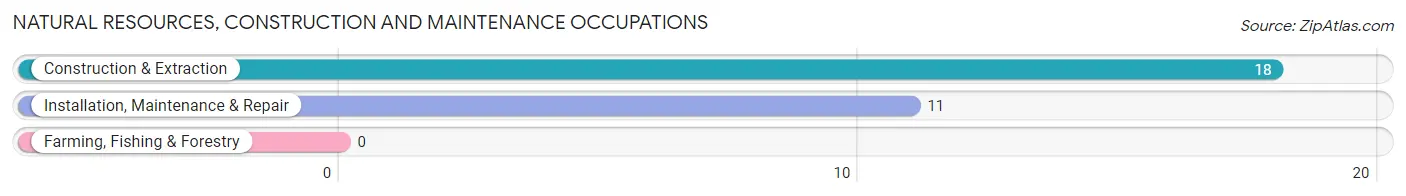
Natural Resources, Construction and Maintenance Occupations
The most common Natural Resources, Construction and Maintenance occupations in Middletown are Construction & Extraction (18 | 4.9%), and Installation, Maintenance & Repair (11 | 3.0%).
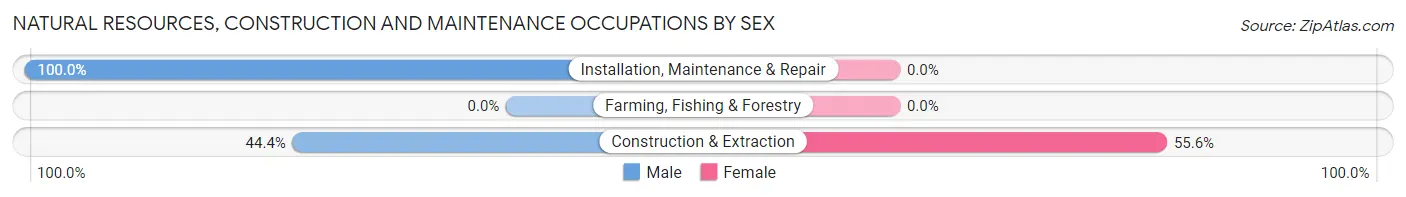
Natural Resources, Construction and Maintenance Occupations by Sex
| Occupation | Male | Female |
| Farming, Fishing & Forestry | 0 (0.0%) | 0 (0.0%) |
| Construction & Extraction | 8 (44.4%) | 10 (55.6%) |
| Installation, Maintenance & Repair | 11 (100.0%) | 0 (0.0%) |
| Total (Category) | 19 (65.5%) | 10 (34.5%) |
| Total (Overall) | 172 (46.7%) | 196 (53.3%) |
Production, Transportation and Moving Occupations
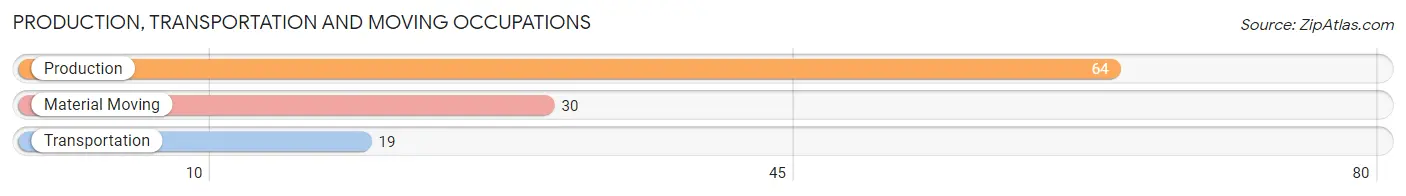
The most common Production, Transportation and Moving occupations in Middletown are Production (64 | 17.4%), Material Moving (30 | 8.2%), and Transportation (19 | 5.2%).
Production, Transportation and Moving Occupations by Sex
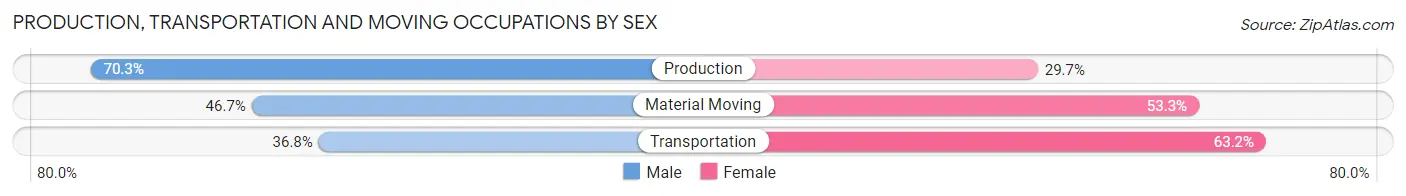
| Occupation | Male | Female |
| Production | 45 (70.3%) | 19 (29.7%) |
| Transportation | 7 (36.8%) | 12 (63.2%) |
| Material Moving | 14 (46.7%) | 16 (53.3%) |
| Total (Category) | 66 (58.4%) | 47 (41.6%) |
| Total (Overall) | 172 (46.7%) | 196 (53.3%) |
Employment Industries by Sex in Middletown
Employment Industries in Middletown
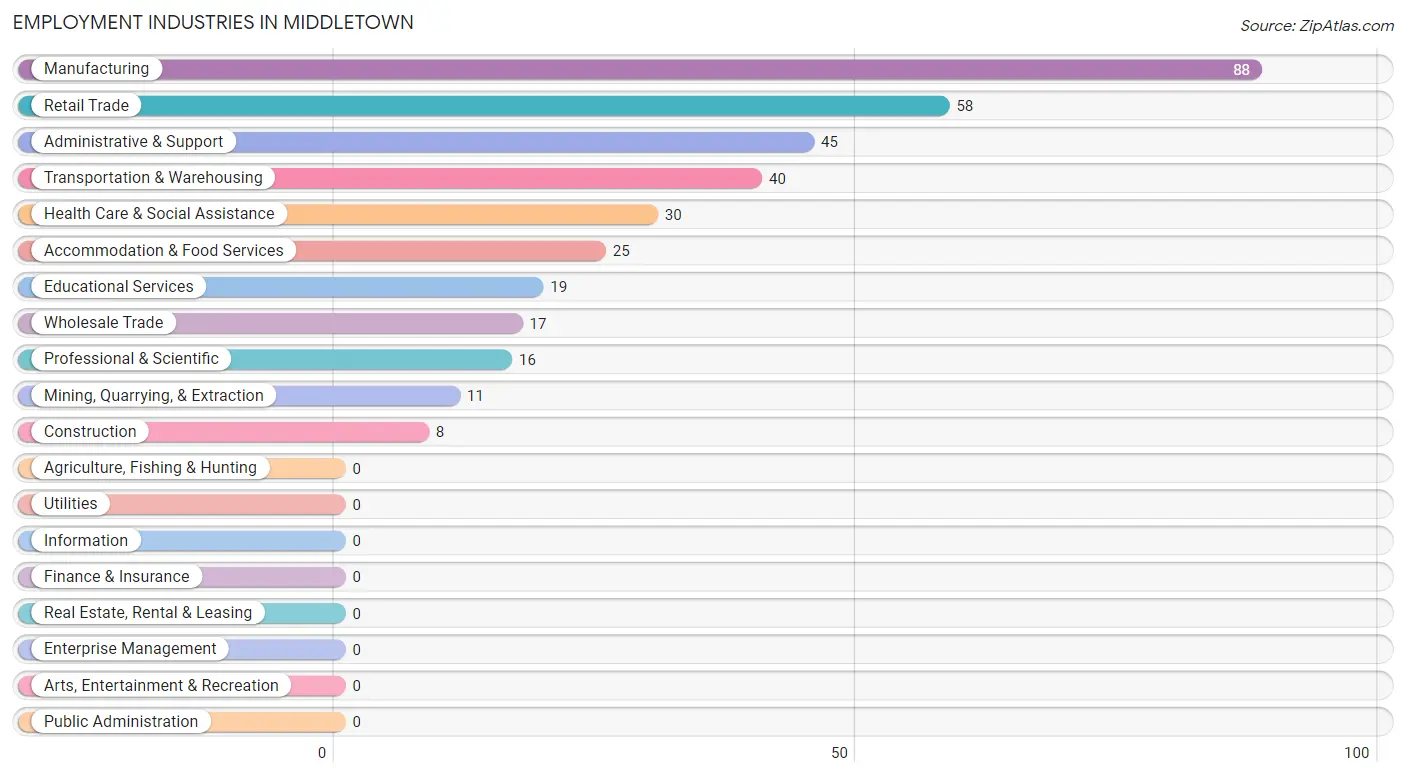
The major employment industries in Middletown include Manufacturing (88 | 23.9%), Retail Trade (58 | 15.8%), Administrative & Support (45 | 12.2%), Transportation & Warehousing (40 | 10.9%), and Health Care & Social Assistance (30 | 8.2%).
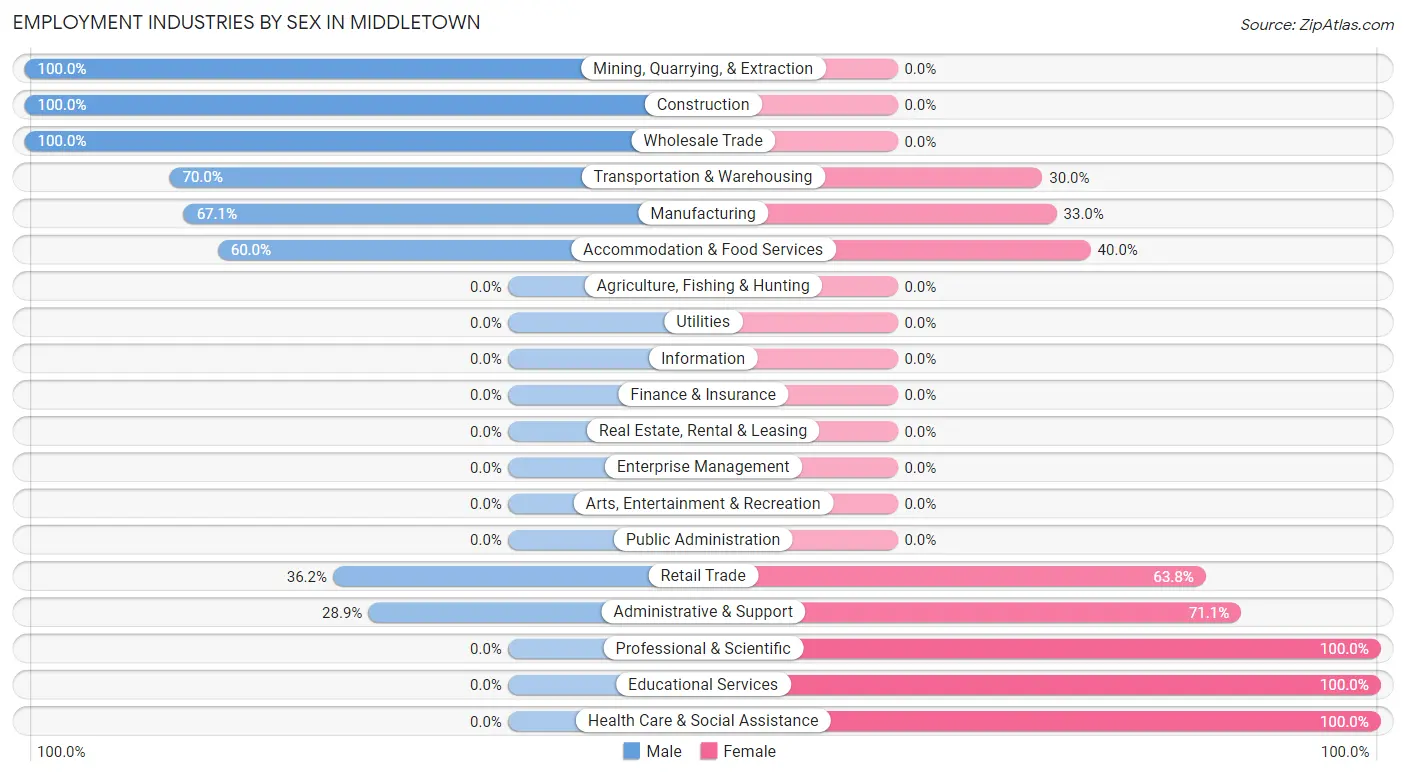
Employment Industries by Sex in Middletown
The Middletown industries that see more men than women are Mining, Quarrying, & Extraction (100.0%), Construction (100.0%), and Wholesale Trade (100.0%), whereas the industries that tend to have a higher number of women are Professional & Scientific (100.0%), Educational Services (100.0%), and Health Care & Social Assistance (100.0%).
| Industry | Male | Female |
| Agriculture, Fishing & Hunting | 0 (0.0%) | 0 (0.0%) |
| Mining, Quarrying, & Extraction | 11 (100.0%) | 0 (0.0%) |
| Construction | 8 (100.0%) | 0 (0.0%) |
| Manufacturing | 59 (67.0%) | 29 (33.0%) |
| Wholesale Trade | 17 (100.0%) | 0 (0.0%) |
| Retail Trade | 21 (36.2%) | 37 (63.8%) |
| Transportation & Warehousing | 28 (70.0%) | 12 (30.0%) |
| Utilities | 0 (0.0%) | 0 (0.0%) |
| Information | 0 (0.0%) | 0 (0.0%) |
| Finance & Insurance | 0 (0.0%) | 0 (0.0%) |
| Real Estate, Rental & Leasing | 0 (0.0%) | 0 (0.0%) |
| Professional & Scientific | 0 (0.0%) | 16 (100.0%) |
| Enterprise Management | 0 (0.0%) | 0 (0.0%) |
| Administrative & Support | 13 (28.9%) | 32 (71.1%) |
| Educational Services | 0 (0.0%) | 19 (100.0%) |
| Health Care & Social Assistance | 0 (0.0%) | 30 (100.0%) |
| Arts, Entertainment & Recreation | 0 (0.0%) | 0 (0.0%) |
| Accommodation & Food Services | 15 (60.0%) | 10 (40.0%) |
| Public Administration | 0 (0.0%) | 0 (0.0%) |
| Total | 172 (46.7%) | 196 (53.3%) |
Education in Middletown
School Enrollment in Middletown
The most common levels of schooling among the 116 students in Middletown are high school (75 | 64.7%), graduate / professional (25 | 21.5%), and college / undergraduate (13 | 11.2%).
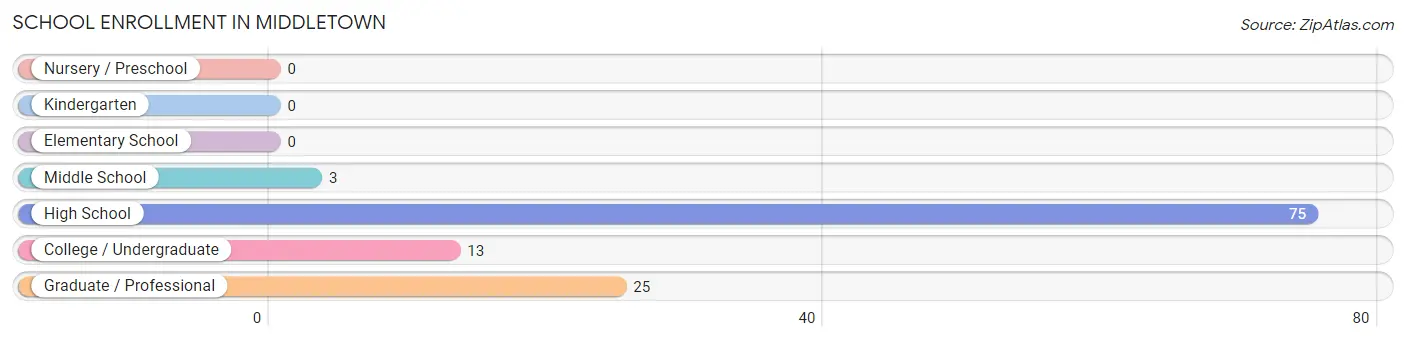
| School Level | # Students | % Students |
| Nursery / Preschool | 0 | 0.0% |
| Kindergarten | 0 | 0.0% |
| Elementary School | 0 | 0.0% |
| Middle School | 3 | 2.6% |
| High School | 75 | 64.7% |
| College / Undergraduate | 13 | 11.2% |
| Graduate / Professional | 25 | 21.5% |
| Total | 116 | 100.0% |
School Enrollment by Age by Funding Source in Middletown
Out of a total of 116 students who are enrolled in schools in Middletown, 34 (29.3%) attend a private institution, while the remaining 82 (70.7%) are enrolled in public schools. The age group of 20 to 24 year olds has the highest likelihood of being enrolled in private schools, with 17 (100.0% in the age bracket) enrolled. Conversely, the age group of 18 to 19 year olds has the lowest likelihood of being enrolled in a private school, with 13 (100.0% in the age bracket) attending a public institution.
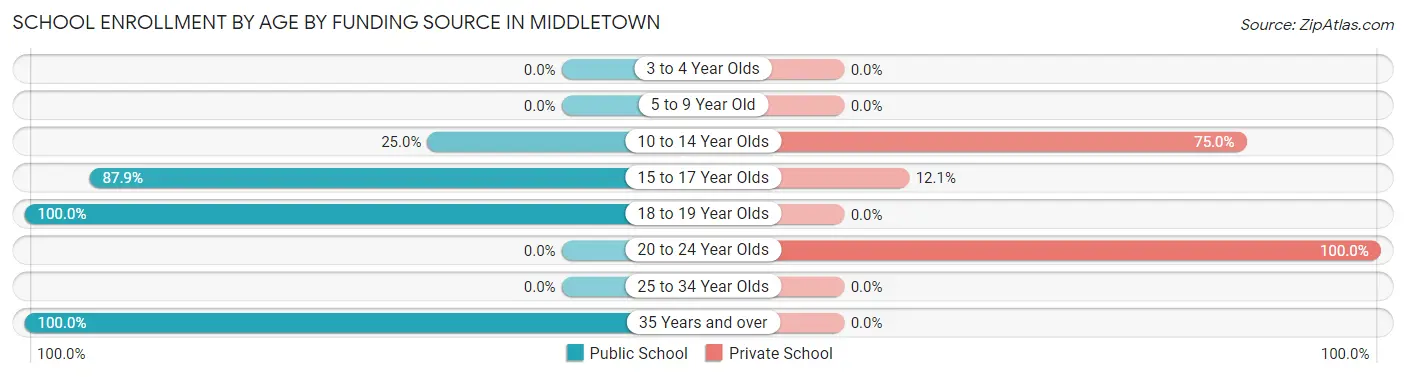
| Age Bracket | Public School | Private School |
| 3 to 4 Year Olds | 0 (0.0%) | 0 (0.0%) |
| 5 to 9 Year Old | 0 (0.0%) | 0 (0.0%) |
| 10 to 14 Year Olds | 3 (25.0%) | 9 (75.0%) |
| 15 to 17 Year Olds | 58 (87.9%) | 8 (12.1%) |
| 18 to 19 Year Olds | 13 (100.0%) | 0 (0.0%) |
| 20 to 24 Year Olds | 0 (0.0%) | 17 (100.0%) |
| 25 to 34 Year Olds | 0 (0.0%) | 0 (0.0%) |
| 35 Years and over | 8 (100.0%) | 0 (0.0%) |
| Total | 82 (70.7%) | 34 (29.3%) |
Educational Attainment by Field of Study in Middletown
Bio, nature & agricultural (13 | 35.1%), science & technology (13 | 35.1%), and education (11 | 29.7%) are the most common fields of study among 37 individuals in Middletown who have obtained a bachelor's degree or higher.
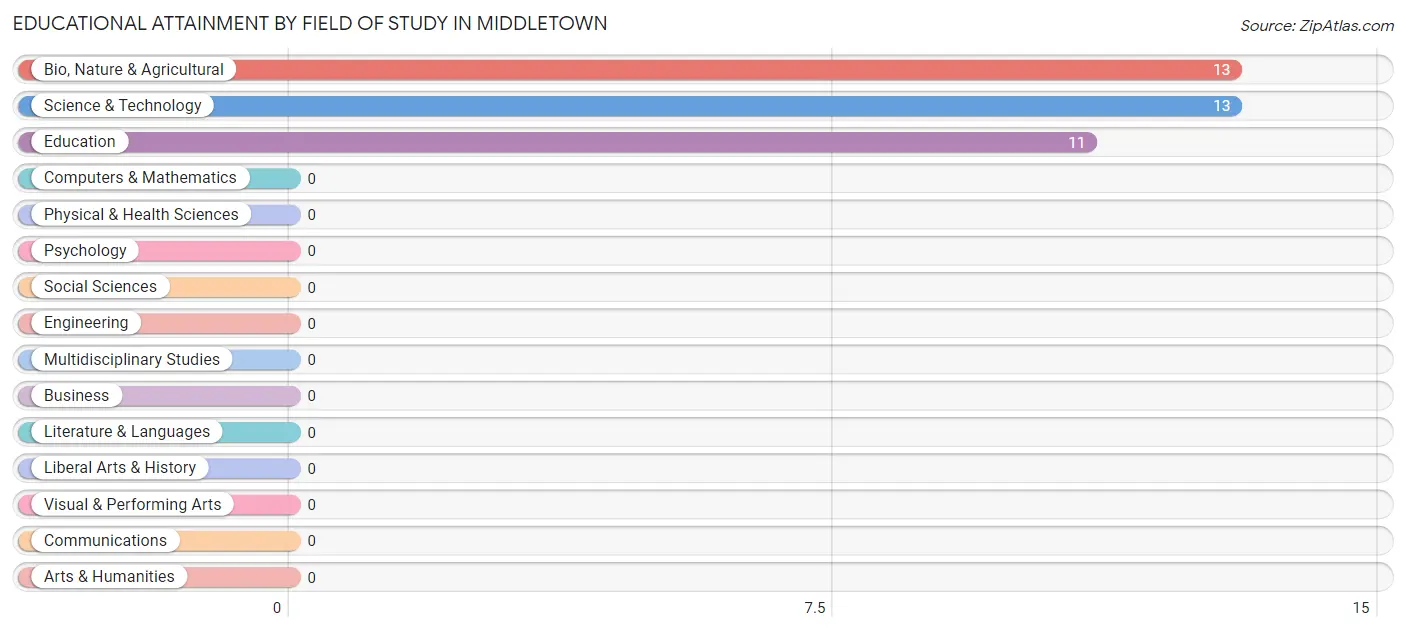
| Field of Study | # Graduates | % Graduates |
| Computers & Mathematics | 0 | 0.0% |
| Bio, Nature & Agricultural | 13 | 35.1% |
| Physical & Health Sciences | 0 | 0.0% |
| Psychology | 0 | 0.0% |
| Social Sciences | 0 | 0.0% |
| Engineering | 0 | 0.0% |
| Multidisciplinary Studies | 0 | 0.0% |
| Science & Technology | 13 | 35.1% |
| Business | 0 | 0.0% |
| Education | 11 | 29.7% |
| Literature & Languages | 0 | 0.0% |
| Liberal Arts & History | 0 | 0.0% |
| Visual & Performing Arts | 0 | 0.0% |
| Communications | 0 | 0.0% |
| Arts & Humanities | 0 | 0.0% |
| Total | 37 | 100.0% |
Transportation & Commute in Middletown
Vehicle Availability by Sex in Middletown
The most prevalent vehicle ownership categories in Middletown are males with 2 vehicles (80, accounting for 50.6%) and females with 2 vehicles (52, making up 40.8%).
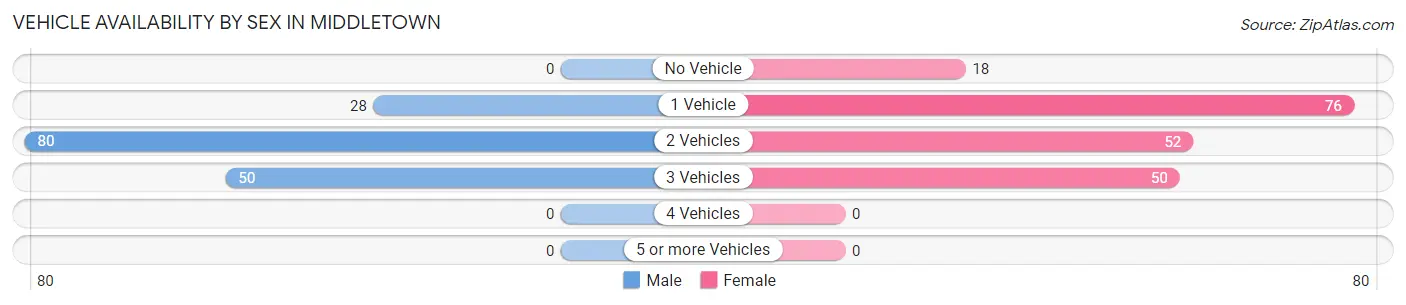
| Vehicles Available | Male | Female |
| No Vehicle | 0 (0.0%) | 18 (9.2%) |
| 1 Vehicle | 28 (17.7%) | 76 (38.8%) |
| 2 Vehicles | 80 (50.6%) | 52 (26.5%) |
| 3 Vehicles | 50 (31.7%) | 50 (25.5%) |
| 4 Vehicles | 0 (0.0%) | 0 (0.0%) |
| 5 or more Vehicles | 0 (0.0%) | 0 (0.0%) |
| Total | 158 (100.0%) | 196 (100.0%) |
Commute Time in Middletown
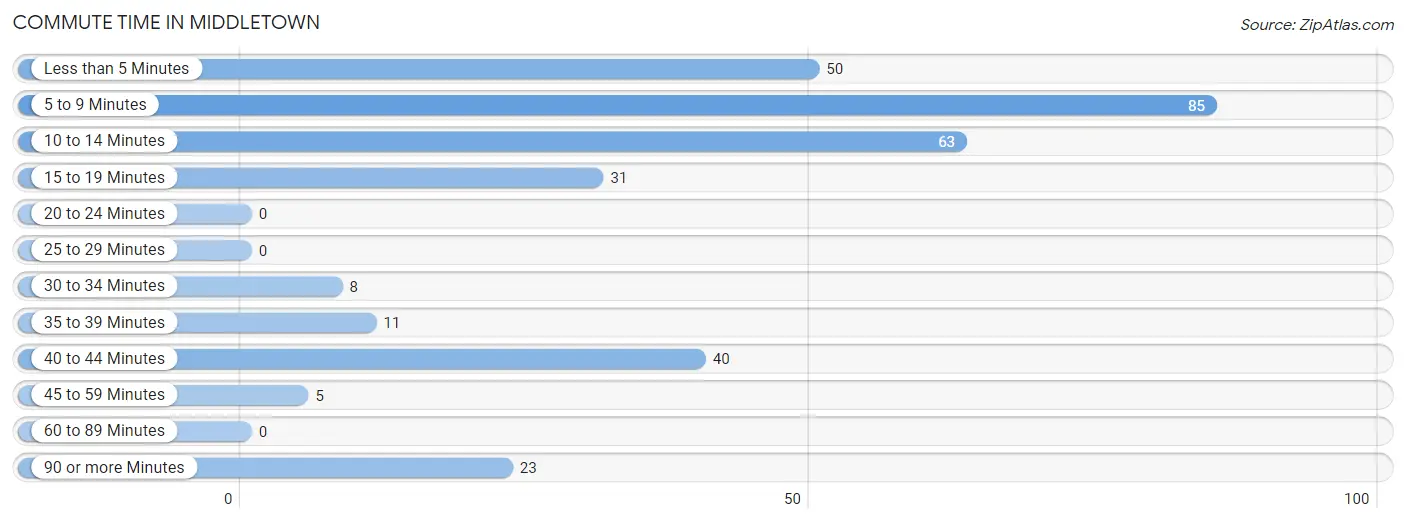
The most frequently occuring commute durations in Middletown are 5 to 9 minutes (85 commuters, 26.9%), 10 to 14 minutes (63 commuters, 19.9%), and less than 5 minutes (50 commuters, 15.8%).
| Commute Time | # Commuters | % Commuters |
| Less than 5 Minutes | 50 | 15.8% |
| 5 to 9 Minutes | 85 | 26.9% |
| 10 to 14 Minutes | 63 | 19.9% |
| 15 to 19 Minutes | 31 | 9.8% |
| 20 to 24 Minutes | 0 | 0.0% |
| 25 to 29 Minutes | 0 | 0.0% |
| 30 to 34 Minutes | 8 | 2.5% |
| 35 to 39 Minutes | 11 | 3.5% |
| 40 to 44 Minutes | 40 | 12.7% |
| 45 to 59 Minutes | 5 | 1.6% |
| 60 to 89 Minutes | 0 | 0.0% |
| 90 or more Minutes | 23 | 7.3% |
Commute Time by Sex in Middletown
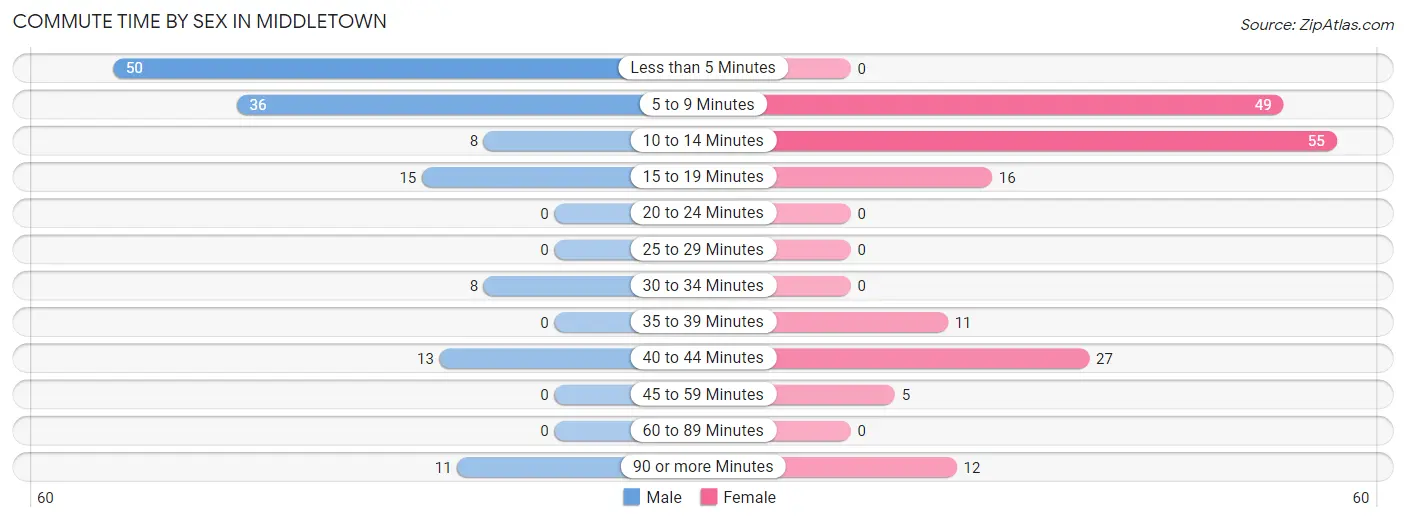
The most common commute times in Middletown are less than 5 minutes (50 commuters, 35.5%) for males and 10 to 14 minutes (55 commuters, 31.4%) for females.
| Commute Time | Male | Female |
| Less than 5 Minutes | 50 (35.5%) | 0 (0.0%) |
| 5 to 9 Minutes | 36 (25.5%) | 49 (28.0%) |
| 10 to 14 Minutes | 8 (5.7%) | 55 (31.4%) |
| 15 to 19 Minutes | 15 (10.6%) | 16 (9.1%) |
| 20 to 24 Minutes | 0 (0.0%) | 0 (0.0%) |
| 25 to 29 Minutes | 0 (0.0%) | 0 (0.0%) |
| 30 to 34 Minutes | 8 (5.7%) | 0 (0.0%) |
| 35 to 39 Minutes | 0 (0.0%) | 11 (6.3%) |
| 40 to 44 Minutes | 13 (9.2%) | 27 (15.4%) |
| 45 to 59 Minutes | 0 (0.0%) | 5 (2.9%) |
| 60 to 89 Minutes | 0 (0.0%) | 0 (0.0%) |
| 90 or more Minutes | 11 (7.8%) | 12 (6.9%) |
Time of Departure to Work by Sex in Middletown
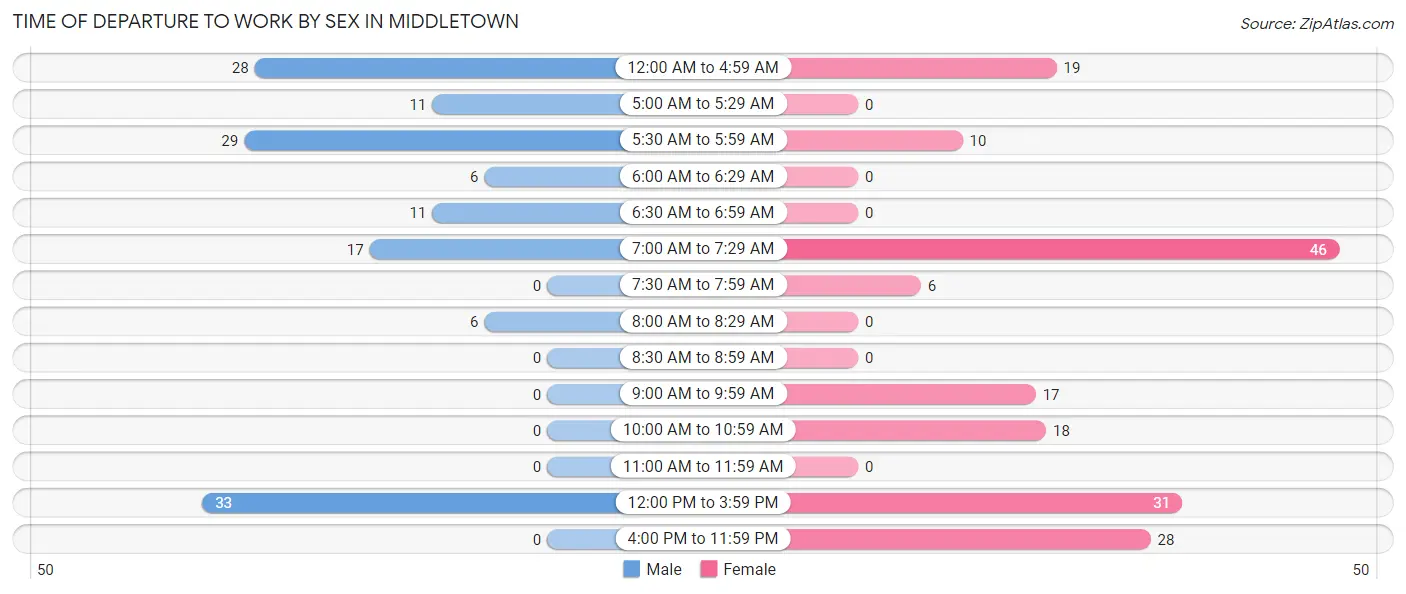
The most frequent times of departure to work in Middletown are 12:00 PM to 3:59 PM (33, 23.4%) for males and 7:00 AM to 7:29 AM (46, 26.3%) for females.
| Time of Departure | Male | Female |
| 12:00 AM to 4:59 AM | 28 (19.9%) | 19 (10.9%) |
| 5:00 AM to 5:29 AM | 11 (7.8%) | 0 (0.0%) |
| 5:30 AM to 5:59 AM | 29 (20.6%) | 10 (5.7%) |
| 6:00 AM to 6:29 AM | 6 (4.3%) | 0 (0.0%) |
| 6:30 AM to 6:59 AM | 11 (7.8%) | 0 (0.0%) |
| 7:00 AM to 7:29 AM | 17 (12.1%) | 46 (26.3%) |
| 7:30 AM to 7:59 AM | 0 (0.0%) | 6 (3.4%) |
| 8:00 AM to 8:29 AM | 6 (4.3%) | 0 (0.0%) |
| 8:30 AM to 8:59 AM | 0 (0.0%) | 0 (0.0%) |
| 9:00 AM to 9:59 AM | 0 (0.0%) | 17 (9.7%) |
| 10:00 AM to 10:59 AM | 0 (0.0%) | 18 (10.3%) |
| 11:00 AM to 11:59 AM | 0 (0.0%) | 0 (0.0%) |
| 12:00 PM to 3:59 PM | 33 (23.4%) | 31 (17.7%) |
| 4:00 PM to 11:59 PM | 0 (0.0%) | 28 (16.0%) |
| Total | 141 (100.0%) | 175 (100.0%) |
Housing Occupancy in Middletown
Occupancy by Ownership in Middletown
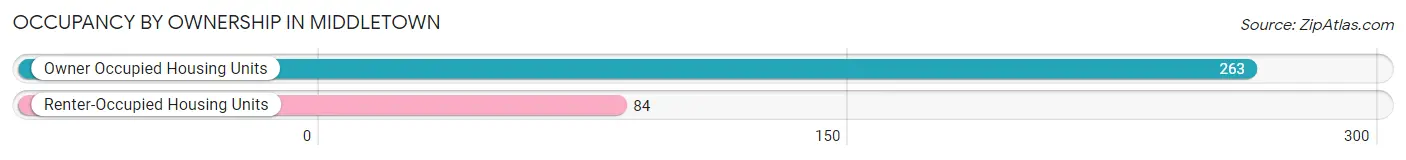
Of the total 347 dwellings in Middletown, owner-occupied units account for 263 (75.8%), while renter-occupied units make up 84 (24.2%).
| Occupancy | # Housing Units | % Housing Units |
| Owner Occupied Housing Units | 263 | 75.8% |
| Renter-Occupied Housing Units | 84 | 24.2% |
| Total Occupied Housing Units | 347 | 100.0% |
Occupancy by Household Size in Middletown
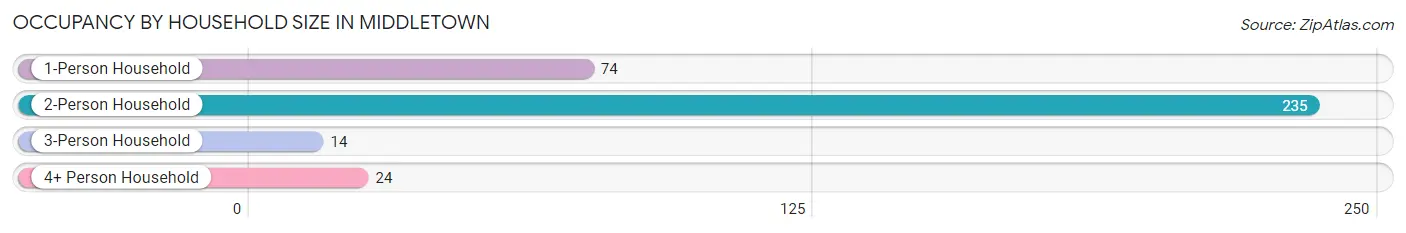
| Household Size | # Housing Units | % Housing Units |
| 1-Person Household | 74 | 21.3% |
| 2-Person Household | 235 | 67.7% |
| 3-Person Household | 14 | 4.0% |
| 4+ Person Household | 24 | 6.9% |
| Total Housing Units | 347 | 100.0% |
Occupancy by Ownership by Household Size in Middletown
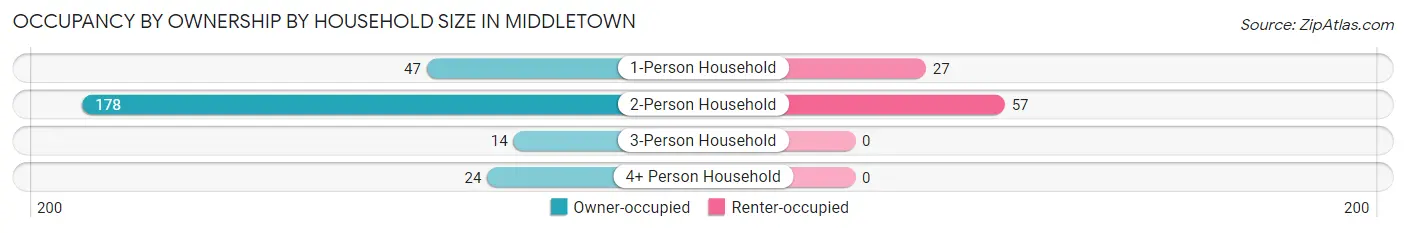
| Household Size | Owner-occupied | Renter-occupied |
| 1-Person Household | 47 (63.5%) | 27 (36.5%) |
| 2-Person Household | 178 (75.7%) | 57 (24.3%) |
| 3-Person Household | 14 (100.0%) | 0 (0.0%) |
| 4+ Person Household | 24 (100.0%) | 0 (0.0%) |
| Total Housing Units | 263 (75.8%) | 84 (24.2%) |
Occupancy by Educational Attainment in Middletown
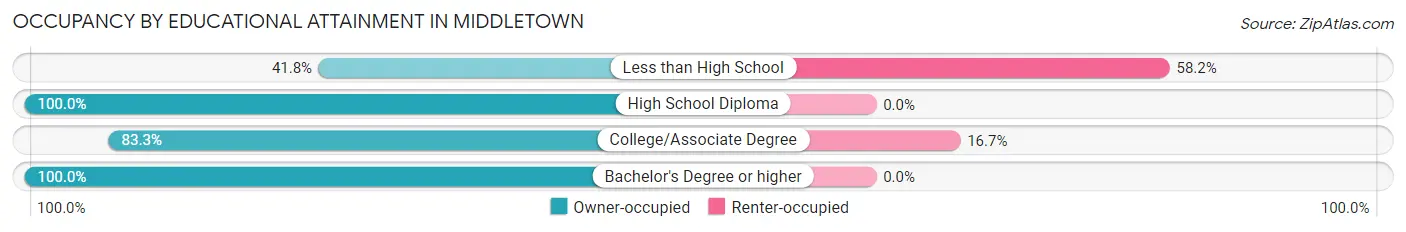
| Household Size | Owner-occupied | Renter-occupied |
| Less than High School | 41 (41.8%) | 57 (58.2%) |
| High School Diploma | 58 (100.0%) | 0 (0.0%) |
| College/Associate Degree | 135 (83.3%) | 27 (16.7%) |
| Bachelor's Degree or higher | 29 (100.0%) | 0 (0.0%) |
Occupancy by Age of Householder in Middletown
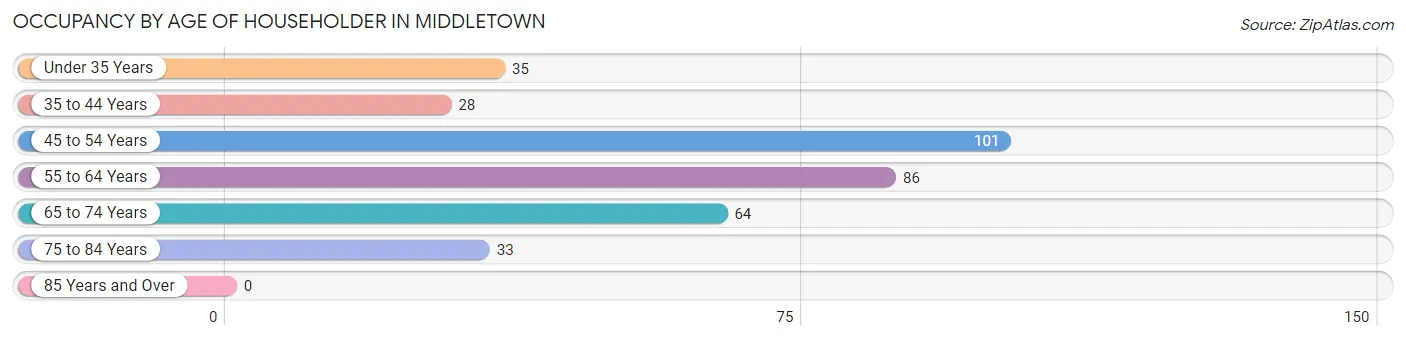
| Age Bracket | # Households | % Households |
| Under 35 Years | 35 | 10.1% |
| 35 to 44 Years | 28 | 8.1% |
| 45 to 54 Years | 101 | 29.1% |
| 55 to 64 Years | 86 | 24.8% |
| 65 to 74 Years | 64 | 18.4% |
| 75 to 84 Years | 33 | 9.5% |
| 85 Years and Over | 0 | 0.0% |
| Total | 347 | 100.0% |
Housing Finances in Middletown
Median Income by Occupancy in Middletown
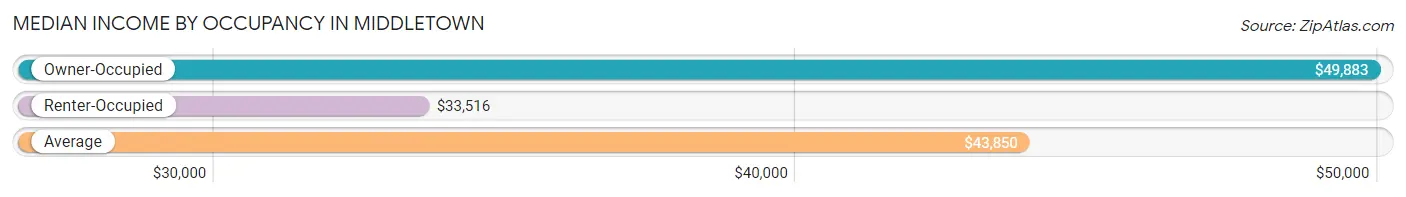
| Occupancy Type | # Households | Median Income |
| Owner-Occupied | 263 (75.8%) | $49,883 |
| Renter-Occupied | 84 (24.2%) | $33,516 |
| Average | 347 (100.0%) | $43,850 |
Occupancy by Householder Income Bracket in Middletown
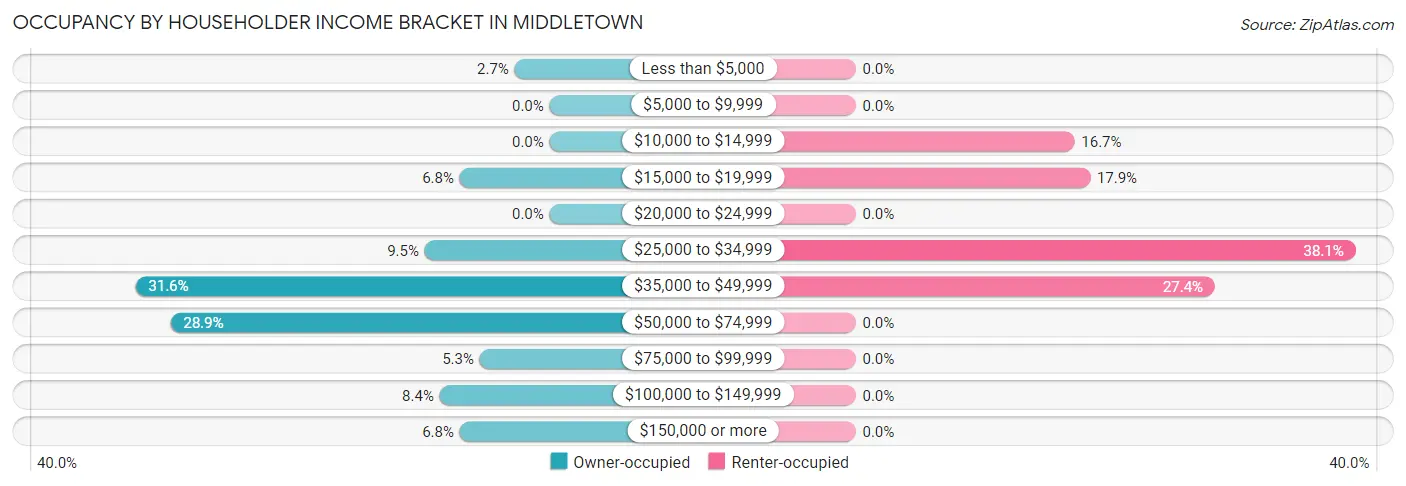
| Income Bracket | Owner-occupied | Renter-occupied |
| Less than $5,000 | 7 (2.7%) | 0 (0.0%) |
| $5,000 to $9,999 | 0 (0.0%) | 0 (0.0%) |
| $10,000 to $14,999 | 0 (0.0%) | 14 (16.7%) |
| $15,000 to $19,999 | 18 (6.8%) | 15 (17.9%) |
| $20,000 to $24,999 | 0 (0.0%) | 0 (0.0%) |
| $25,000 to $34,999 | 25 (9.5%) | 32 (38.1%) |
| $35,000 to $49,999 | 83 (31.6%) | 23 (27.4%) |
| $50,000 to $74,999 | 76 (28.9%) | 0 (0.0%) |
| $75,000 to $99,999 | 14 (5.3%) | 0 (0.0%) |
| $100,000 to $149,999 | 22 (8.4%) | 0 (0.0%) |
| $150,000 or more | 18 (6.8%) | 0 (0.0%) |
| Total | 263 (100.0%) | 84 (100.0%) |
Monthly Housing Cost Tiers in Middletown
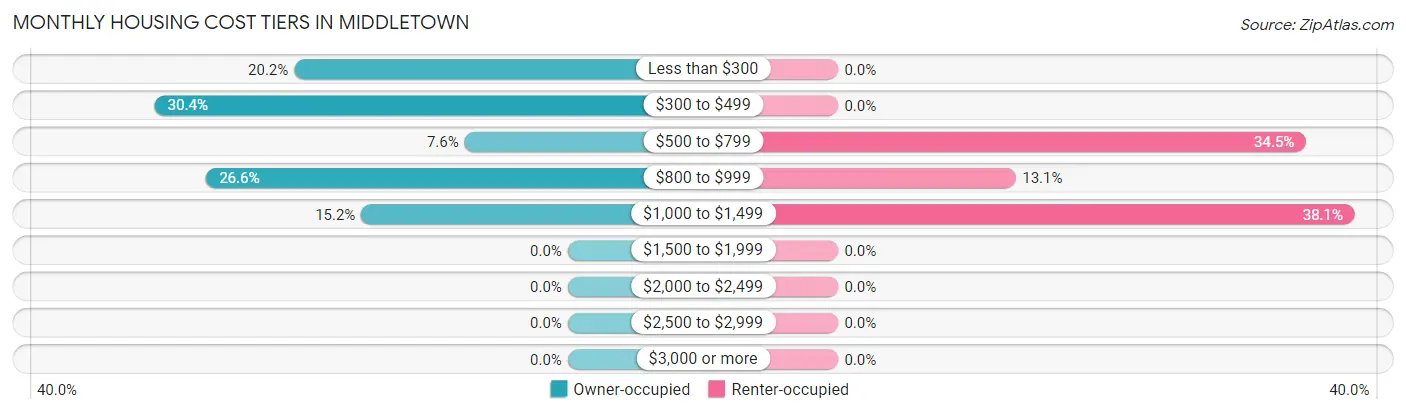
| Monthly Cost | Owner-occupied | Renter-occupied |
| Less than $300 | 53 (20.2%) | 0 (0.0%) |
| $300 to $499 | 80 (30.4%) | 0 (0.0%) |
| $500 to $799 | 20 (7.6%) | 29 (34.5%) |
| $800 to $999 | 70 (26.6%) | 11 (13.1%) |
| $1,000 to $1,499 | 40 (15.2%) | 32 (38.1%) |
| $1,500 to $1,999 | 0 (0.0%) | 0 (0.0%) |
| $2,000 to $2,499 | 0 (0.0%) | 0 (0.0%) |
| $2,500 to $2,999 | 0 (0.0%) | 0 (0.0%) |
| $3,000 or more | 0 (0.0%) | 0 (0.0%) |
| Total | 263 (100.0%) | 84 (100.0%) |
Physical Housing Characteristics in Middletown
Housing Structures in Middletown
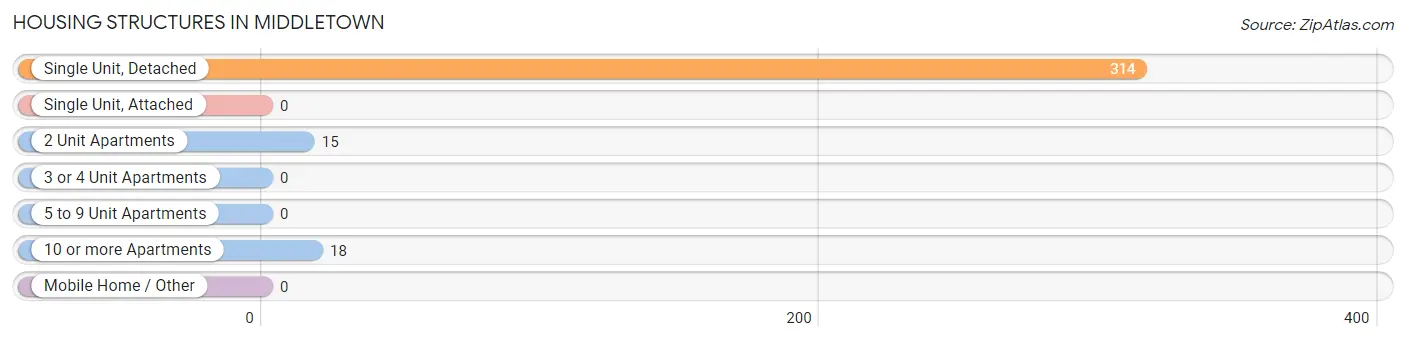
| Structure Type | # Housing Units | % Housing Units |
| Single Unit, Detached | 314 | 90.5% |
| Single Unit, Attached | 0 | 0.0% |
| 2 Unit Apartments | 15 | 4.3% |
| 3 or 4 Unit Apartments | 0 | 0.0% |
| 5 to 9 Unit Apartments | 0 | 0.0% |
| 10 or more Apartments | 18 | 5.2% |
| Mobile Home / Other | 0 | 0.0% |
| Total | 347 | 100.0% |
Housing Structures by Occupancy in Middletown
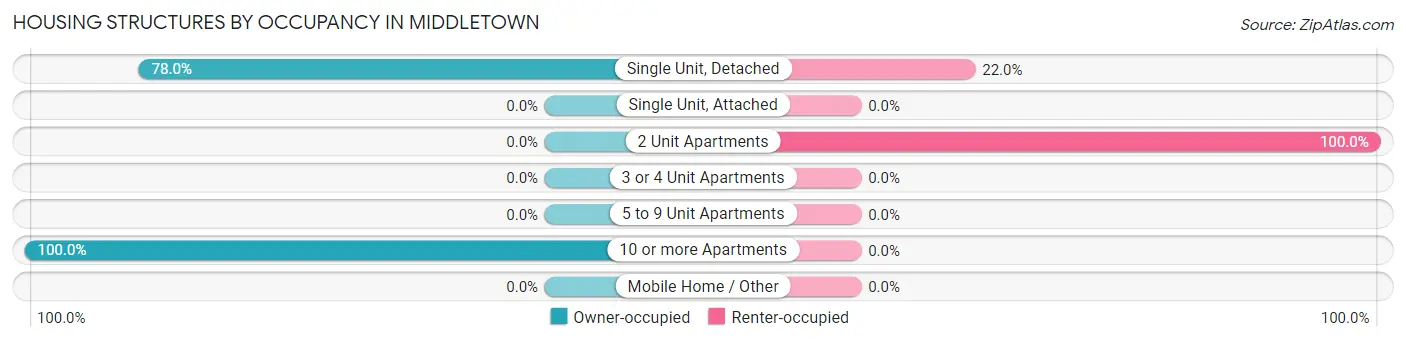
| Structure Type | Owner-occupied | Renter-occupied |
| Single Unit, Detached | 245 (78.0%) | 69 (22.0%) |
| Single Unit, Attached | 0 (0.0%) | 0 (0.0%) |
| 2 Unit Apartments | 0 (0.0%) | 15 (100.0%) |
| 3 or 4 Unit Apartments | 0 (0.0%) | 0 (0.0%) |
| 5 to 9 Unit Apartments | 0 (0.0%) | 0 (0.0%) |
| 10 or more Apartments | 18 (100.0%) | 0 (0.0%) |
| Mobile Home / Other | 0 (0.0%) | 0 (0.0%) |
| Total | 263 (75.8%) | 84 (24.2%) |
Housing Structures by Number of Rooms in Middletown
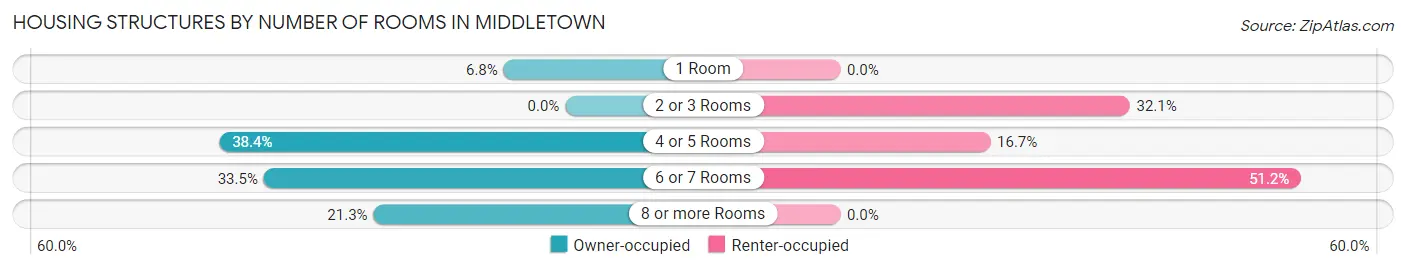
| Number of Rooms | Owner-occupied | Renter-occupied |
| 1 Room | 18 (6.8%) | 0 (0.0%) |
| 2 or 3 Rooms | 0 (0.0%) | 27 (32.1%) |
| 4 or 5 Rooms | 101 (38.4%) | 14 (16.7%) |
| 6 or 7 Rooms | 88 (33.5%) | 43 (51.2%) |
| 8 or more Rooms | 56 (21.3%) | 0 (0.0%) |
| Total | 263 (100.0%) | 84 (100.0%) |
Housing Structure by Heating Type in Middletown
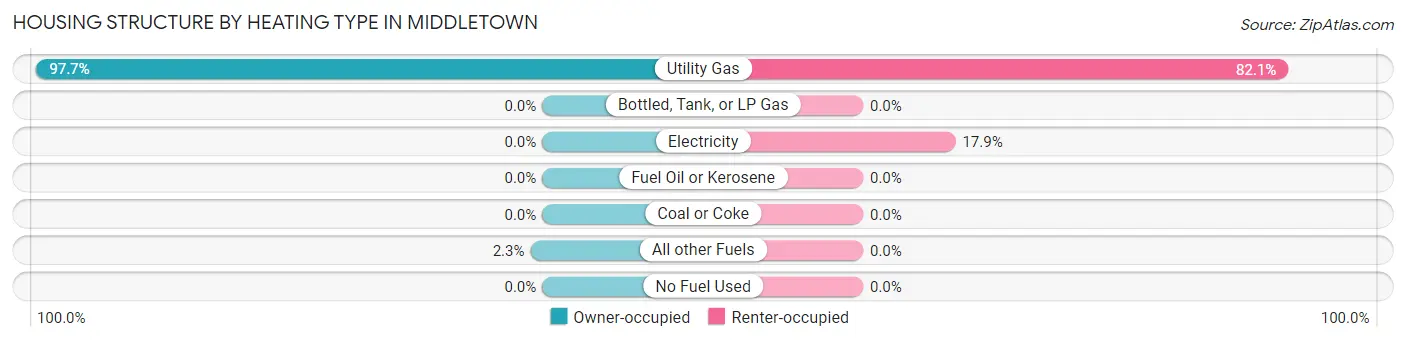
| Heating Type | Owner-occupied | Renter-occupied |
| Utility Gas | 257 (97.7%) | 69 (82.1%) |
| Bottled, Tank, or LP Gas | 0 (0.0%) | 0 (0.0%) |
| Electricity | 0 (0.0%) | 15 (17.9%) |
| Fuel Oil or Kerosene | 0 (0.0%) | 0 (0.0%) |
| Coal or Coke | 0 (0.0%) | 0 (0.0%) |
| All other Fuels | 6 (2.3%) | 0 (0.0%) |
| No Fuel Used | 0 (0.0%) | 0 (0.0%) |
| Total | 263 (100.0%) | 84 (100.0%) |
Household Vehicle Usage in Middletown
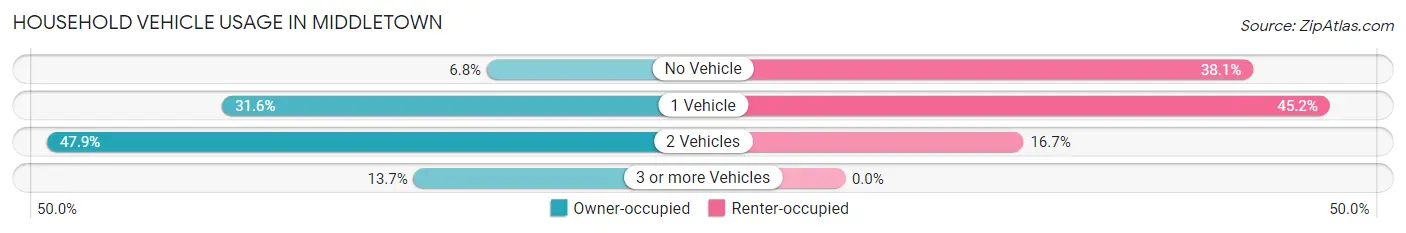
| Vehicles per Household | Owner-occupied | Renter-occupied |
| No Vehicle | 18 (6.8%) | 32 (38.1%) |
| 1 Vehicle | 83 (31.6%) | 38 (45.2%) |
| 2 Vehicles | 126 (47.9%) | 14 (16.7%) |
| 3 or more Vehicles | 36 (13.7%) | 0 (0.0%) |
| Total | 263 (100.0%) | 84 (100.0%) |
Real Estate & Mortgages in Middletown
Real Estate and Mortgage Overview in Middletown
| Characteristic | Without Mortgage | With Mortgage |
| Housing Units | 153 | 110 |
| Median Property Value | $76,100 | $83,600 |
| Median Household Income | $48,047 | $18 |
| Monthly Housing Costs | $371 | $0 |
| Real Estate Taxes | $927 | $0 |
Property Value by Mortgage Status in Middletown
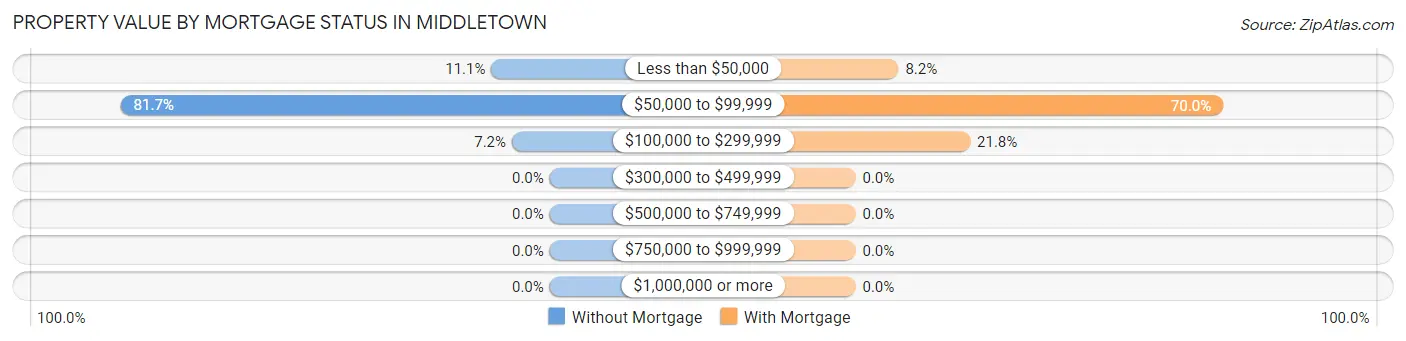
| Property Value | Without Mortgage | With Mortgage |
| Less than $50,000 | 17 (11.1%) | 9 (8.2%) |
| $50,000 to $99,999 | 125 (81.7%) | 77 (70.0%) |
| $100,000 to $299,999 | 11 (7.2%) | 24 (21.8%) |
| $300,000 to $499,999 | 0 (0.0%) | 0 (0.0%) |
| $500,000 to $749,999 | 0 (0.0%) | 0 (0.0%) |
| $750,000 to $999,999 | 0 (0.0%) | 0 (0.0%) |
| $1,000,000 or more | 0 (0.0%) | 0 (0.0%) |
| Total | 153 (100.0%) | 110 (100.0%) |
Household Income by Mortgage Status in Middletown
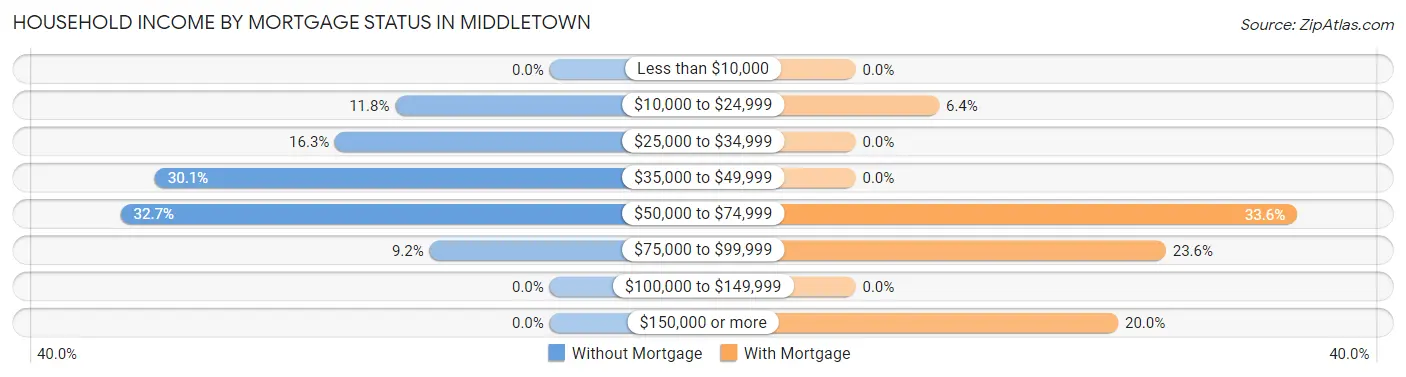
| Household Income | Without Mortgage | With Mortgage |
| Less than $10,000 | 0 (0.0%) | 0 (0.0%) |
| $10,000 to $24,999 | 18 (11.8%) | 7 (6.4%) |
| $25,000 to $34,999 | 25 (16.3%) | 0 (0.0%) |
| $35,000 to $49,999 | 46 (30.1%) | 0 (0.0%) |
| $50,000 to $74,999 | 50 (32.7%) | 37 (33.6%) |
| $75,000 to $99,999 | 14 (9.1%) | 26 (23.6%) |
| $100,000 to $149,999 | 0 (0.0%) | 0 (0.0%) |
| $150,000 or more | 0 (0.0%) | 22 (20.0%) |
| Total | 153 (100.0%) | 110 (100.0%) |
Property Value to Household Income Ratio in Middletown
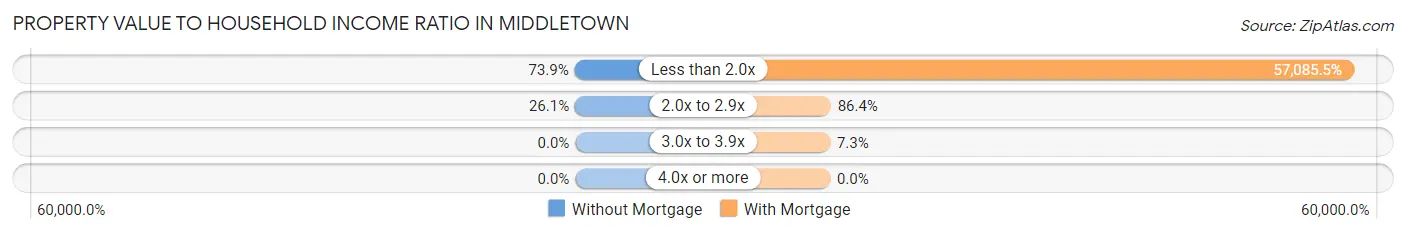
| Value-to-Income Ratio | Without Mortgage | With Mortgage |
| Less than 2.0x | 113 (73.9%) | 62,794 (57,085.5%) |
| 2.0x to 2.9x | 40 (26.1%) | 95 (86.4%) |
| 3.0x to 3.9x | 0 (0.0%) | 8 (7.3%) |
| 4.0x or more | 0 (0.0%) | 0 (0.0%) |
| Total | 153 (100.0%) | 110 (100.0%) |
Real Estate Taxes by Mortgage Status in Middletown
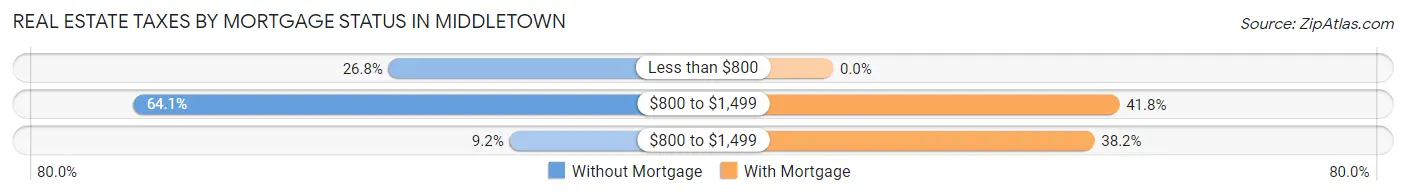
| Property Taxes | Without Mortgage | With Mortgage |
| Less than $800 | 41 (26.8%) | 0 (0.0%) |
| $800 to $1,499 | 98 (64.0%) | 46 (41.8%) |
| $800 to $1,499 | 14 (9.1%) | 42 (38.2%) |
| Total | 153 (100.0%) | 110 (100.0%) |
Health & Disability in Middletown
Health Insurance Coverage by Age in Middletown
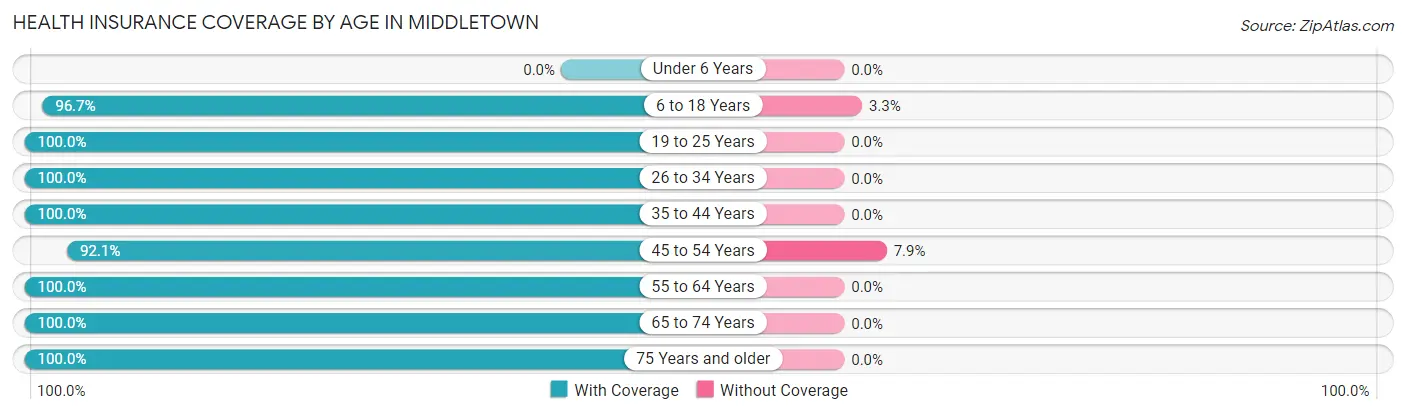
| Age Bracket | With Coverage | Without Coverage |
| Under 6 Years | 0 (0.0%) | 0 (0.0%) |
| 6 to 18 Years | 88 (96.7%) | 3 (3.3%) |
| 19 to 25 Years | 75 (100.0%) | 0 (0.0%) |
| 26 to 34 Years | 35 (100.0%) | 0 (0.0%) |
| 35 to 44 Years | 64 (100.0%) | 0 (0.0%) |
| 45 to 54 Years | 128 (92.1%) | 11 (7.9%) |
| 55 to 64 Years | 146 (100.0%) | 0 (0.0%) |
| 65 to 74 Years | 98 (100.0%) | 0 (0.0%) |
| 75 Years and older | 72 (100.0%) | 0 (0.0%) |
| Total | 706 (98.1%) | 14 (1.9%) |
Health Insurance Coverage by Citizenship Status in Middletown
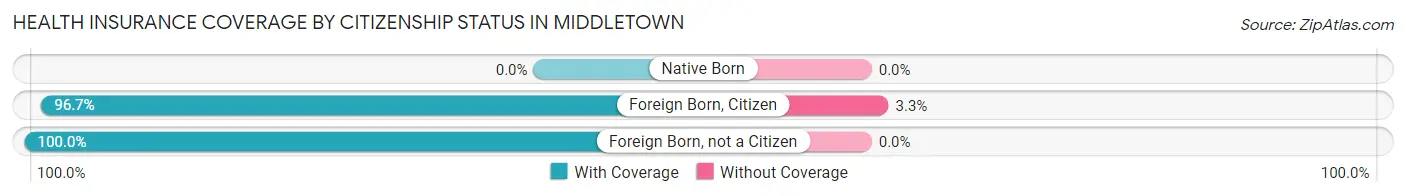
| Citizenship Status | With Coverage | Without Coverage |
| Native Born | 0 (0.0%) | 0 (0.0%) |
| Foreign Born, Citizen | 88 (96.7%) | 3 (3.3%) |
| Foreign Born, not a Citizen | 75 (100.0%) | 0 (0.0%) |
Health Insurance Coverage by Household Income in Middletown
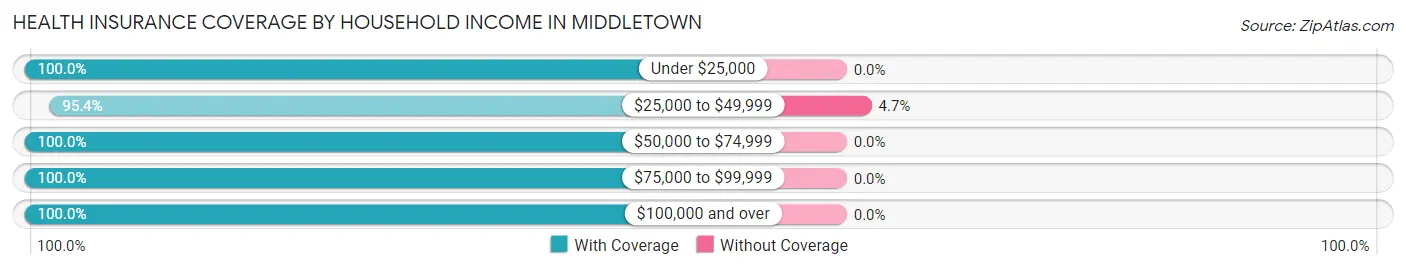
| Household Income | With Coverage | Without Coverage |
| Under $25,000 | 92 (100.0%) | 0 (0.0%) |
| $25,000 to $49,999 | 287 (95.4%) | 14 (4.6%) |
| $50,000 to $74,999 | 149 (100.0%) | 0 (0.0%) |
| $75,000 to $99,999 | 29 (100.0%) | 0 (0.0%) |
| $100,000 and over | 149 (100.0%) | 0 (0.0%) |
Public vs Private Health Insurance Coverage by Age in Middletown
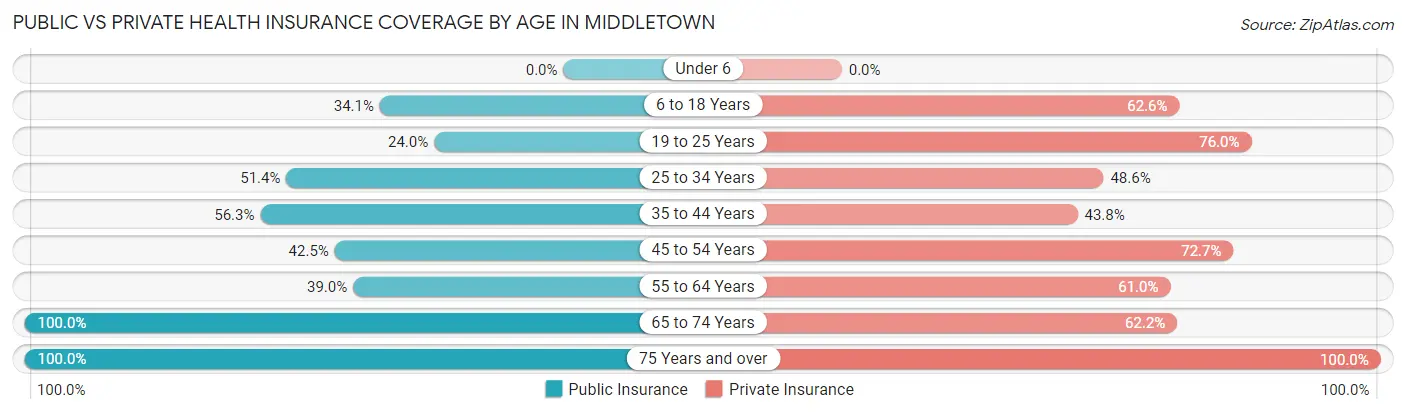
| Age Bracket | Public Insurance | Private Insurance |
| Under 6 | 0 (0.0%) | 0 (0.0%) |
| 6 to 18 Years | 31 (34.1%) | 57 (62.6%) |
| 19 to 25 Years | 18 (24.0%) | 57 (76.0%) |
| 25 to 34 Years | 18 (51.4%) | 17 (48.6%) |
| 35 to 44 Years | 36 (56.2%) | 28 (43.8%) |
| 45 to 54 Years | 59 (42.4%) | 101 (72.7%) |
| 55 to 64 Years | 57 (39.0%) | 89 (61.0%) |
| 65 to 74 Years | 98 (100.0%) | 61 (62.2%) |
| 75 Years and over | 72 (100.0%) | 72 (100.0%) |
| Total | 389 (54.0%) | 482 (66.9%) |
Disability Status by Sex by Age in Middletown
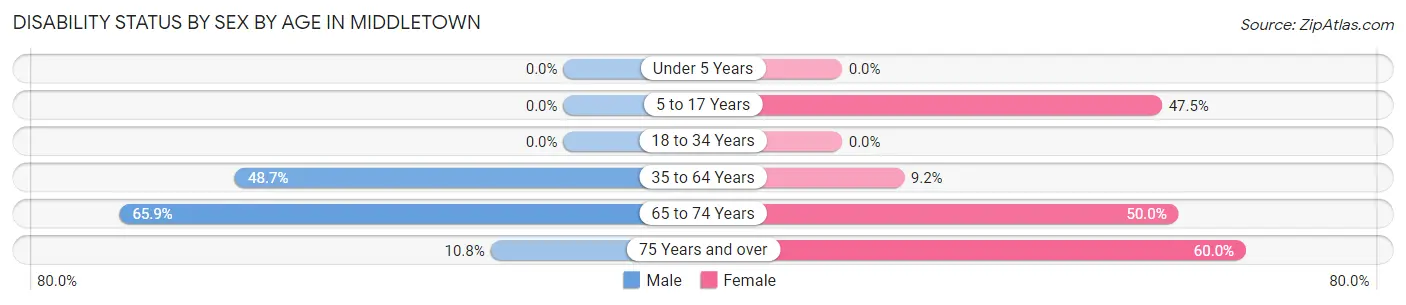
| Age Bracket | Male | Female |
| Under 5 Years | 0 (0.0%) | 0 (0.0%) |
| 5 to 17 Years | 0 (0.0%) | 19 (47.5%) |
| 18 to 34 Years | 0 (0.0%) | 0 (0.0%) |
| 35 to 64 Years | 96 (48.7%) | 14 (9.2%) |
| 65 to 74 Years | 29 (65.9%) | 27 (50.0%) |
| 75 Years and over | 4 (10.8%) | 21 (60.0%) |
Disability Class by Sex by Age in Middletown
Disability Class: Hearing Difficulty
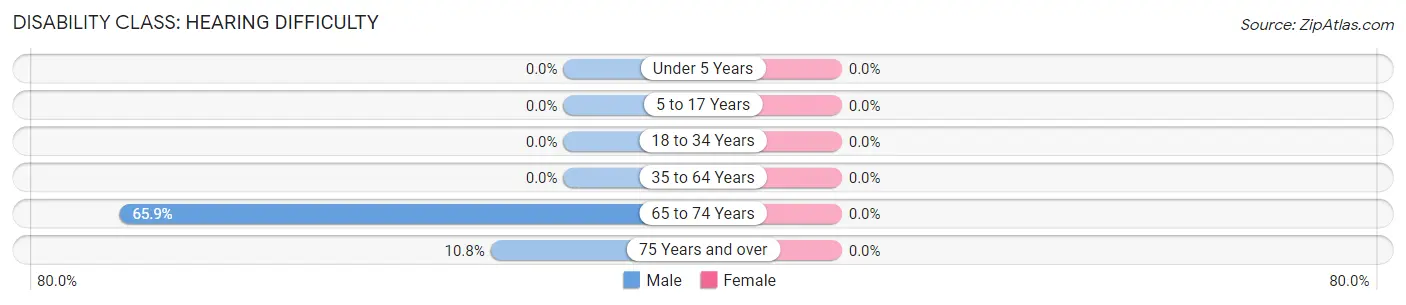
| Age Bracket | Male | Female |
| Under 5 Years | 0 (0.0%) | 0 (0.0%) |
| 5 to 17 Years | 0 (0.0%) | 0 (0.0%) |
| 18 to 34 Years | 0 (0.0%) | 0 (0.0%) |
| 35 to 64 Years | 0 (0.0%) | 0 (0.0%) |
| 65 to 74 Years | 29 (65.9%) | 0 (0.0%) |
| 75 Years and over | 4 (10.8%) | 0 (0.0%) |
Disability Class: Vision Difficulty
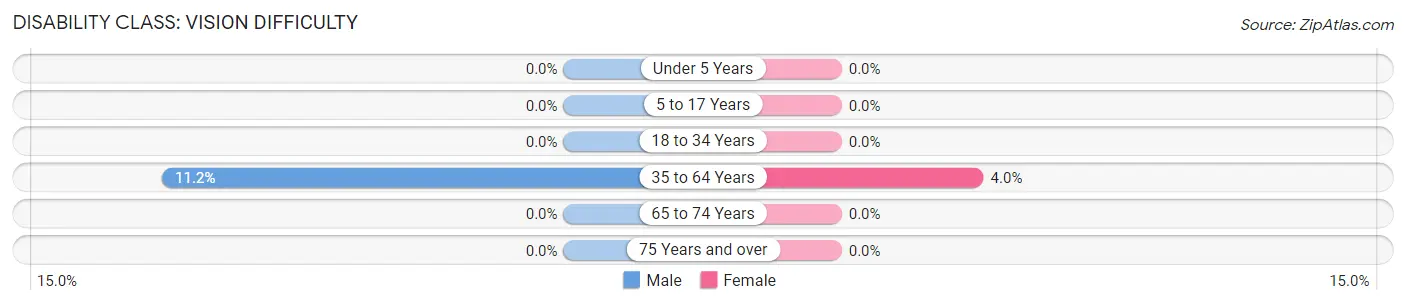
| Age Bracket | Male | Female |
| Under 5 Years | 0 (0.0%) | 0 (0.0%) |
| 5 to 17 Years | 0 (0.0%) | 0 (0.0%) |
| 18 to 34 Years | 0 (0.0%) | 0 (0.0%) |
| 35 to 64 Years | 22 (11.2%) | 6 (4.0%) |
| 65 to 74 Years | 0 (0.0%) | 0 (0.0%) |
| 75 Years and over | 0 (0.0%) | 0 (0.0%) |
Disability Class: Cognitive Difficulty
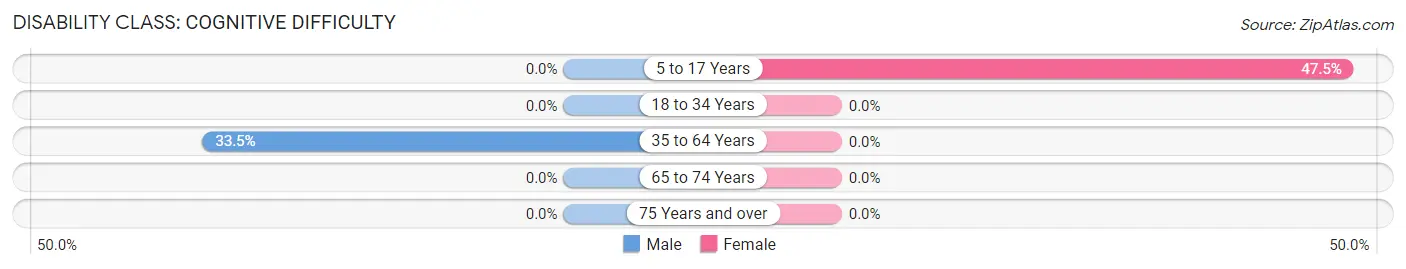
| Age Bracket | Male | Female |
| 5 to 17 Years | 0 (0.0%) | 19 (47.5%) |
| 18 to 34 Years | 0 (0.0%) | 0 (0.0%) |
| 35 to 64 Years | 66 (33.5%) | 0 (0.0%) |
| 65 to 74 Years | 0 (0.0%) | 0 (0.0%) |
| 75 Years and over | 0 (0.0%) | 0 (0.0%) |
Disability Class: Ambulatory Difficulty
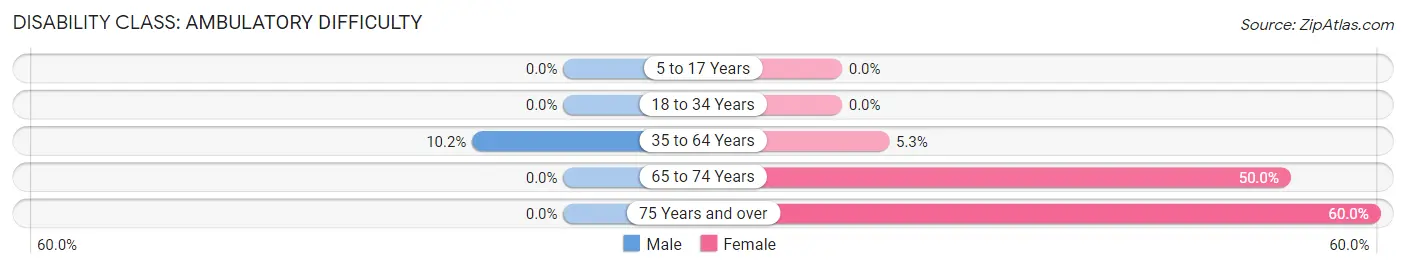
| Age Bracket | Male | Female |
| 5 to 17 Years | 0 (0.0%) | 0 (0.0%) |
| 18 to 34 Years | 0 (0.0%) | 0 (0.0%) |
| 35 to 64 Years | 20 (10.2%) | 8 (5.3%) |
| 65 to 74 Years | 0 (0.0%) | 27 (50.0%) |
| 75 Years and over | 0 (0.0%) | 21 (60.0%) |
Disability Class: Self-Care Difficulty
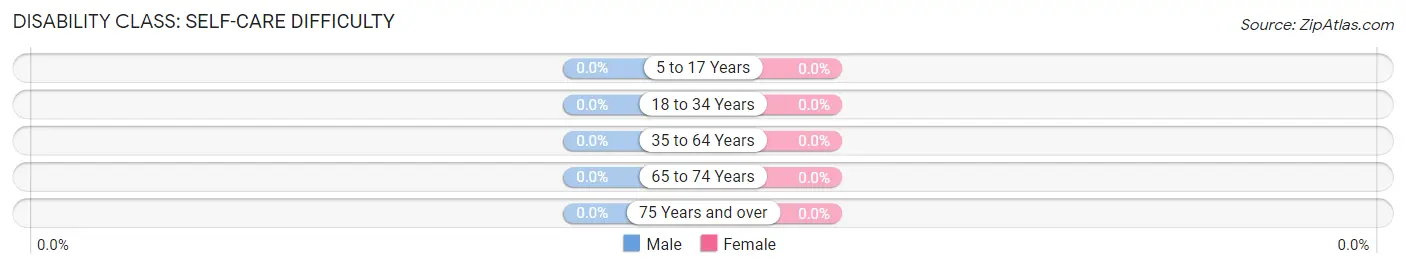
| Age Bracket | Male | Female |
| 5 to 17 Years | 0 (0.0%) | 0 (0.0%) |
| 18 to 34 Years | 0 (0.0%) | 0 (0.0%) |
| 35 to 64 Years | 0 (0.0%) | 0 (0.0%) |
| 65 to 74 Years | 0 (0.0%) | 0 (0.0%) |
| 75 Years and over | 0 (0.0%) | 0 (0.0%) |
Technology Access in Middletown
Computing Device Access in Middletown
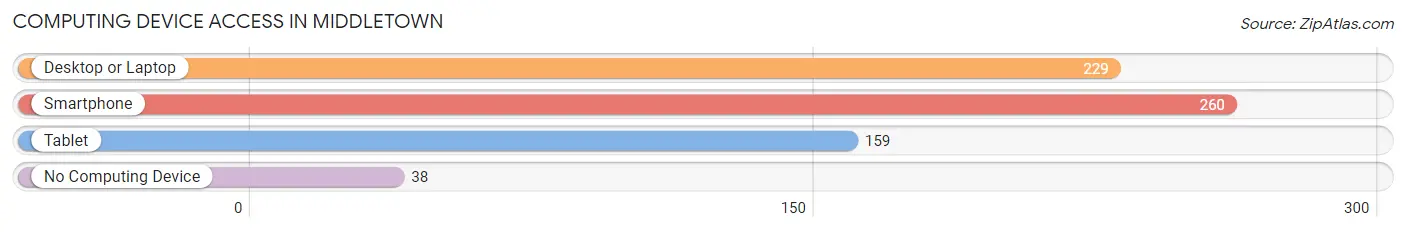
| Device Type | # Households | % Households |
| Desktop or Laptop | 229 | 66.0% |
| Smartphone | 260 | 74.9% |
| Tablet | 159 | 45.8% |
| No Computing Device | 38 | 11.0% |
| Total | 347 | 100.0% |
Internet Access in Middletown
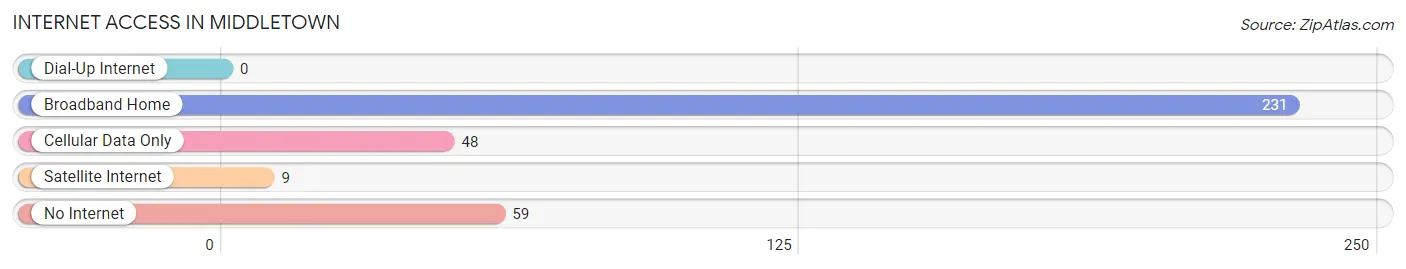
| Internet Type | # Households | % Households |
| Dial-Up Internet | 0 | 0.0% |
| Broadband Home | 231 | 66.6% |
| Cellular Data Only | 48 | 13.8% |
| Satellite Internet | 9 | 2.6% |
| No Internet | 59 | 17.0% |
| Total | 347 | 100.0% |
Middletown Summary
Middletown is a small town located in the state of Michigan in the United States. It is located in the southeastern part of the state, in the county of St. Clair. The town has a population of approximately 1,500 people, and is located on the banks of the St. Clair River.
History
Middletown was first settled in 1837 by a group of settlers from New York. The town was originally known as “Middleport”, and was later changed to Middletown. The town was incorporated in 1867, and has remained a small, rural community ever since.
The town was originally a farming community, and the main crops grown were wheat, corn, and oats. The town also had a number of small businesses, including a sawmill, a grist mill, and a blacksmith shop.
In the late 19th century, the town began to grow and develop. The railroad was built through the town in 1883, and this helped to spur economic growth. The town also had a number of factories, including a brickyard, a canning factory, and a furniture factory.
Geography
Middletown is located in the southeastern part of the state of Michigan. It is situated on the banks of the St. Clair River, and is bordered by the towns of Port Huron to the north, and Marine City to the south. The town is located approximately 40 miles north of Detroit, and is part of the Detroit metropolitan area.
The town has a total area of 1.2 square miles, all of which is land. The town is located at an elevation of 590 feet above sea level. The town has a humid continental climate, with cold winters and hot, humid summers.
Economy
Middletown’s economy is largely based on agriculture and manufacturing. The town has a number of small businesses, including a sawmill, a grist mill, and a blacksmith shop. The town also has a number of factories, including a brickyard, a canning factory, and a furniture factory.
The town also has a number of tourist attractions, including the Middletown Historical Museum, the Middletown Art Gallery, and the Middletown Nature Center. The town also has a number of parks and recreational areas, including the Middletown Park, the Middletown Nature Preserve, and the Middletown Riverwalk.
Demographics
As of the 2010 census, the town had a population of 1,500 people. The racial makeup of the town was 95.3% White, 0.7% African American, 0.3% Native American, 0.7% Asian, 0.3% from other races, and 2.7% from two or more races. Hispanic or Latino of any race were 1.3% of the population.
The median income for a household in the town was $37,500, and the median income for a family was $45,000. The per capita income for the town was $18,000. About 11.7% of families and 14.3% of the population were below the poverty line, including 18.2% of those under age 18 and 8.3% of those age 65 or over.
Common Questions
What is Per Capita Income in Middletown?
Per Capita income in Middletown is $26,460.
What is the Median Family Income in Middletown?
Median Family Income in Middletown is $52,857.
What is the Median Household income in Middletown?
Median Household Income in Middletown is $43,850.
What is Income or Wage Gap in Middletown?
Income or Wage Gap in Middletown is 27.4%.
Women in Middletown earn 72.6 cents for every dollar earned by a man.
What is Inequality or Gini Index in Middletown?
Inequality or Gini Index in Middletown is 0.34.
What is the Total Population of Middletown?
Total Population of Middletown is 720.
What is the Total Male Population of Middletown?
Total Male Population of Middletown is 381.
What is the Total Female Population of Middletown?
Total Female Population of Middletown is 339.
What is the Ratio of Males per 100 Females in Middletown?
There are 112.39 Males per 100 Females in Middletown.
What is the Ratio of Females per 100 Males in Middletown?
There are 88.98 Females per 100 Males in Middletown.
What is the Median Population Age in Middletown?
Median Population Age in Middletown is 51.8 Years.
What is the Average Family Size in Middletown
Average Family Size in Middletown is 2.5 People.
What is the Average Household Size in Middletown
Average Household Size in Middletown is 2.1 People.
How Large is the Labor Force in Middletown?
There are 385 People in the Labor Forcein in Middletown.
What is the Percentage of People in the Labor Force in Middletown?
57.0% of People are in the Labor Force in Middletown.
What is the Unemployment Rate in Middletown?
Unemployment Rate in Middletown is 4.4%.