Fair Plain, MI Map & Demographics
Fair Plain Map
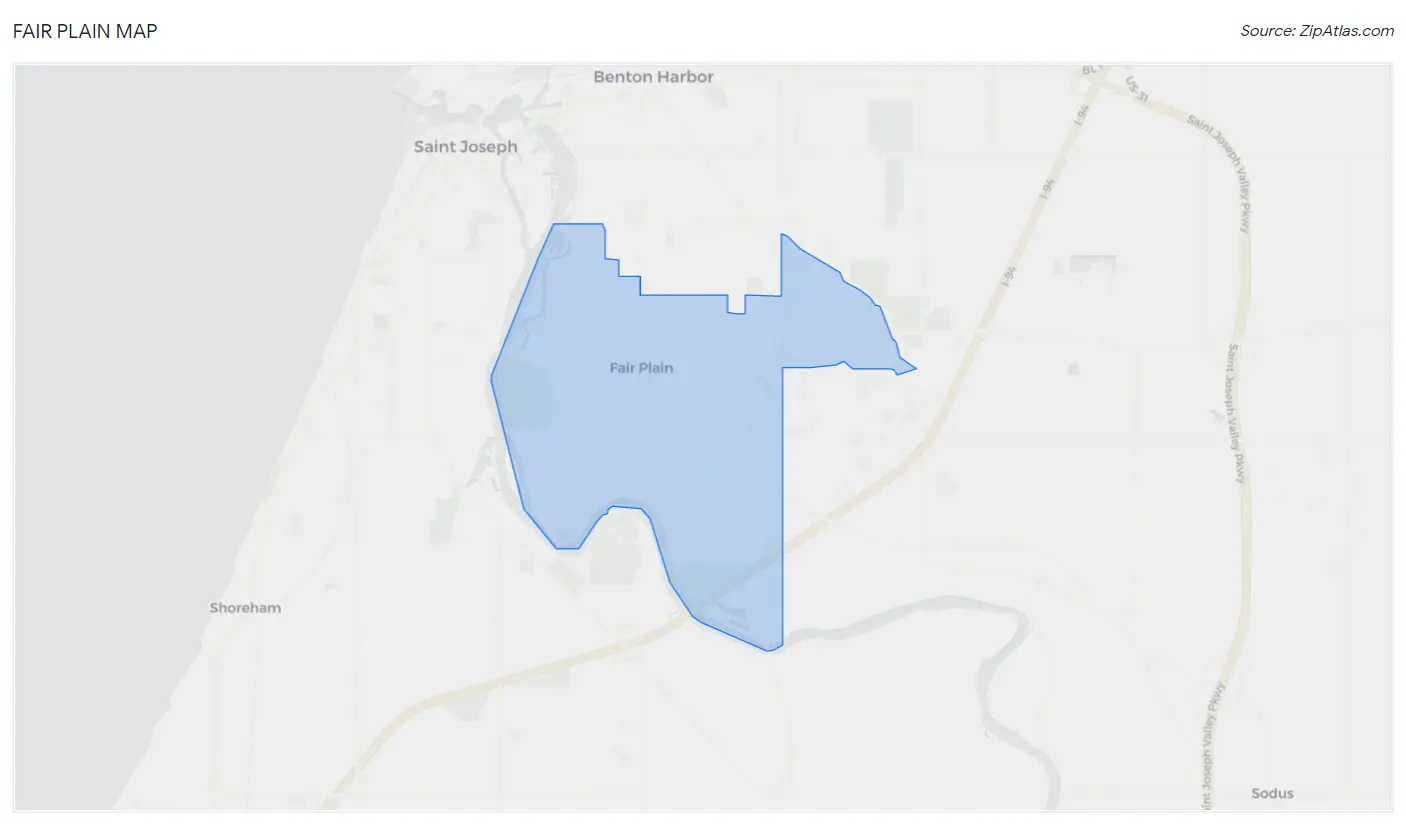
Fair Plain Overview
$27,648
PER CAPITA INCOME
$62,325
AVG FAMILY INCOME
$50,170
AVG HOUSEHOLD INCOME
42.7%
WAGE / INCOME GAP [ % ]
57.3¢/ $1
WAGE / INCOME GAP [ $ ]
0.44
INEQUALITY / GINI INDEX
6,882
TOTAL POPULATION
3,306
MALE POPULATION
3,576
FEMALE POPULATION
92.45
MALES / 100 FEMALES
108.17
FEMALES / 100 MALES
43.7
MEDIAN AGE
2.9
AVG FAMILY SIZE
2.3
AVG HOUSEHOLD SIZE
3,526
LABOR FORCE [ PEOPLE ]
61.1%
PERCENT IN LABOR FORCE
20.5%
UNEMPLOYMENT RATE
Income in Fair Plain
Income Overview in Fair Plain
Per Capita Income in Fair Plain is $27,648, while median incomes of families and households are $62,325 and $50,170 respectively.
| Characteristic | Number | Measure |
| Per Capita Income | 6,882 | $27,648 |
| Median Family Income | 1,813 | $62,325 |
| Mean Family Income | 1,813 | $75,472 |
| Median Household Income | 3,012 | $50,170 |
| Mean Household Income | 3,012 | $62,401 |
| Income Deficit | 1,813 | $0 |
| Wage / Income Gap (%) | 6,882 | 42.65% |
| Wage / Income Gap ($) | 6,882 | 57.35¢ per $1 |
| Gini / Inequality Index | 6,882 | 0.44 |
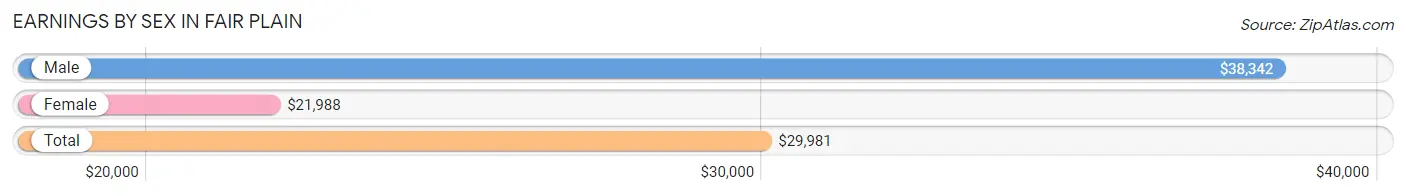
Earnings by Sex in Fair Plain
Average Earnings in Fair Plain are $29,981, $38,342 for men and $21,988 for women, a difference of 42.6%.
| Sex | Number | Average Earnings |
| Male | 1,763 (51.4%) | $38,342 |
| Female | 1,666 (48.6%) | $21,988 |
| Total | 3,429 (100.0%) | $29,981 |
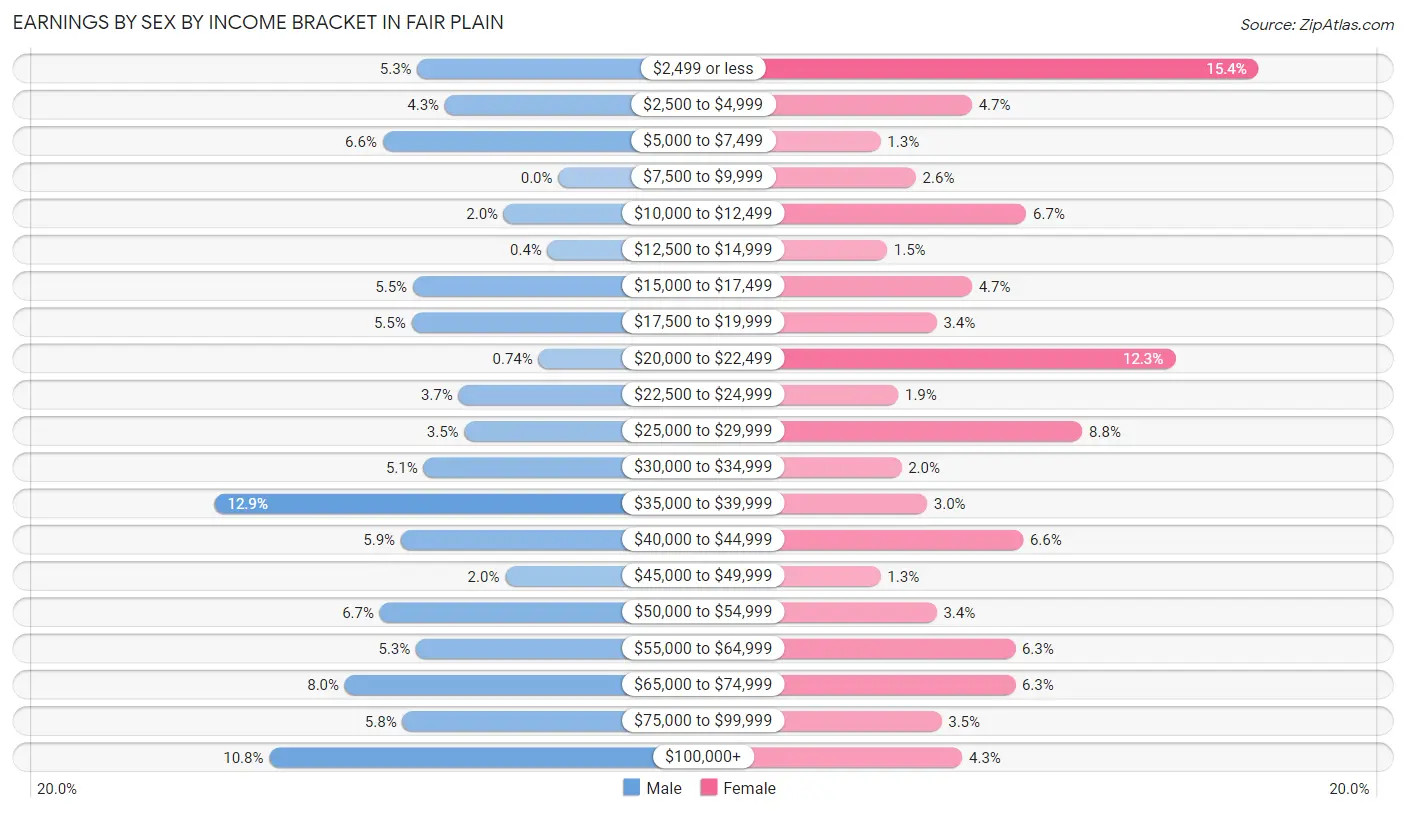
Earnings by Sex by Income Bracket in Fair Plain
The most common earnings brackets in Fair Plain are $35,000 to $39,999 for men (227 | 12.9%) and $2,499 or less for women (257 | 15.4%).
| Income | Male | Female |
| $2,499 or less | 93 (5.3%) | 257 (15.4%) |
| $2,500 to $4,999 | 75 (4.3%) | 78 (4.7%) |
| $5,000 to $7,499 | 116 (6.6%) | 21 (1.3%) |
| $7,500 to $9,999 | 0 (0.0%) | 43 (2.6%) |
| $10,000 to $12,499 | 36 (2.0%) | 112 (6.7%) |
| $12,500 to $14,999 | 7 (0.4%) | 25 (1.5%) |
| $15,000 to $17,499 | 96 (5.4%) | 78 (4.7%) |
| $17,500 to $19,999 | 97 (5.5%) | 56 (3.4%) |
| $20,000 to $22,499 | 13 (0.7%) | 205 (12.3%) |
| $22,500 to $24,999 | 66 (3.7%) | 32 (1.9%) |
| $25,000 to $29,999 | 62 (3.5%) | 147 (8.8%) |
| $30,000 to $34,999 | 89 (5.1%) | 34 (2.0%) |
| $35,000 to $39,999 | 227 (12.9%) | 50 (3.0%) |
| $40,000 to $44,999 | 104 (5.9%) | 110 (6.6%) |
| $45,000 to $49,999 | 35 (2.0%) | 21 (1.3%) |
| $50,000 to $54,999 | 118 (6.7%) | 56 (3.4%) |
| $55,000 to $64,999 | 94 (5.3%) | 105 (6.3%) |
| $65,000 to $74,999 | 141 (8.0%) | 105 (6.3%) |
| $75,000 to $99,999 | 103 (5.8%) | 59 (3.5%) |
| $100,000+ | 191 (10.8%) | 72 (4.3%) |
| Total | 1,763 (100.0%) | 1,666 (100.0%) |
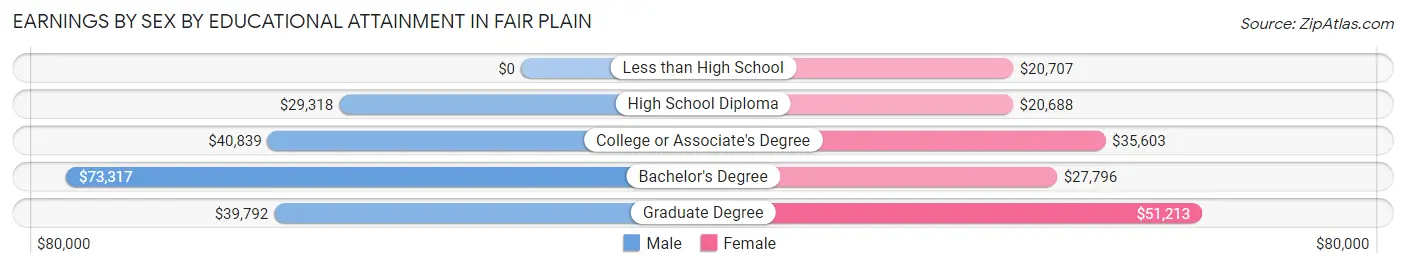
Earnings by Sex by Educational Attainment in Fair Plain
Average earnings in Fair Plain are $39,613 for men and $25,255 for women, a difference of 36.2%. Men with an educational attainment of bachelor's degree enjoy the highest average annual earnings of $73,317, while those with high school diploma education earn the least with $29,318. Women with an educational attainment of graduate degree earn the most with the average annual earnings of $51,213, while those with high school diploma education have the smallest earnings of $20,688.
| Educational Attainment | Male Income | Female Income |
| Less than High School | - | - |
| High School Diploma | $29,318 | $20,688 |
| College or Associate's Degree | $40,839 | $35,603 |
| Bachelor's Degree | $73,317 | $27,796 |
| Graduate Degree | $39,792 | $51,213 |
| Total | $39,613 | $25,255 |
Family Income in Fair Plain
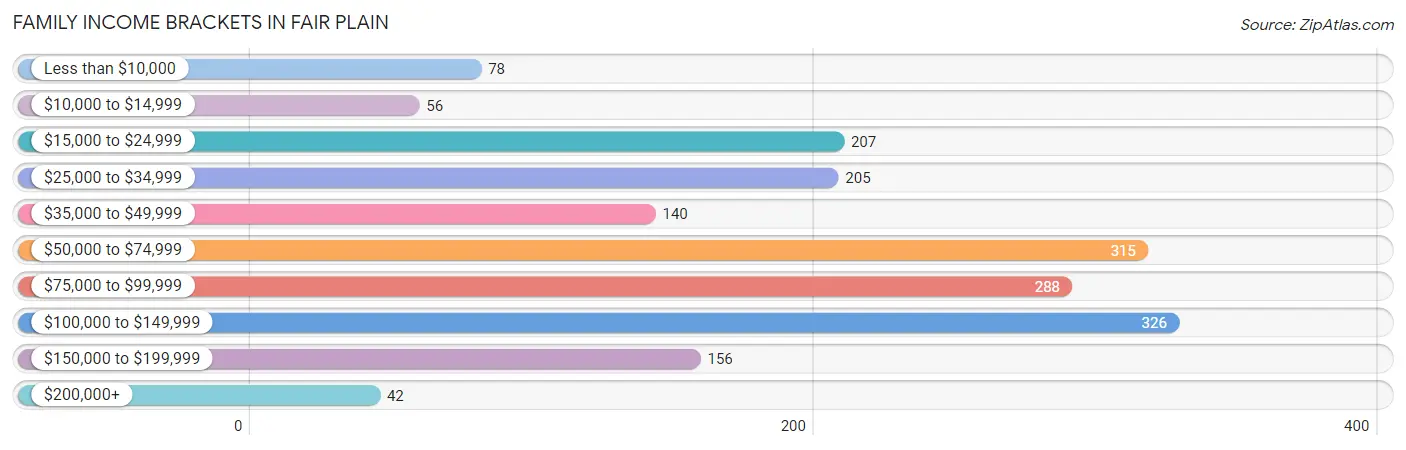
Family Income Brackets in Fair Plain
According to the Fair Plain family income data, there are 326 families falling into the $100,000 to $149,999 income range, which is the most common income bracket and makes up 18.0% of all families. Conversely, the $200,000+ income bracket is the least frequent group with only 42 families (2.3%) belonging to this category.
| Income Bracket | # Families | % Families |
| Less than $10,000 | 78 | 4.3% |
| $10,000 to $14,999 | 56 | 3.1% |
| $15,000 to $24,999 | 207 | 11.4% |
| $25,000 to $34,999 | 205 | 11.3% |
| $35,000 to $49,999 | 140 | 7.7% |
| $50,000 to $74,999 | 315 | 17.4% |
| $75,000 to $99,999 | 288 | 15.9% |
| $100,000 to $149,999 | 326 | 18.0% |
| $150,000 to $199,999 | 156 | 8.6% |
| $200,000+ | 42 | 2.3% |
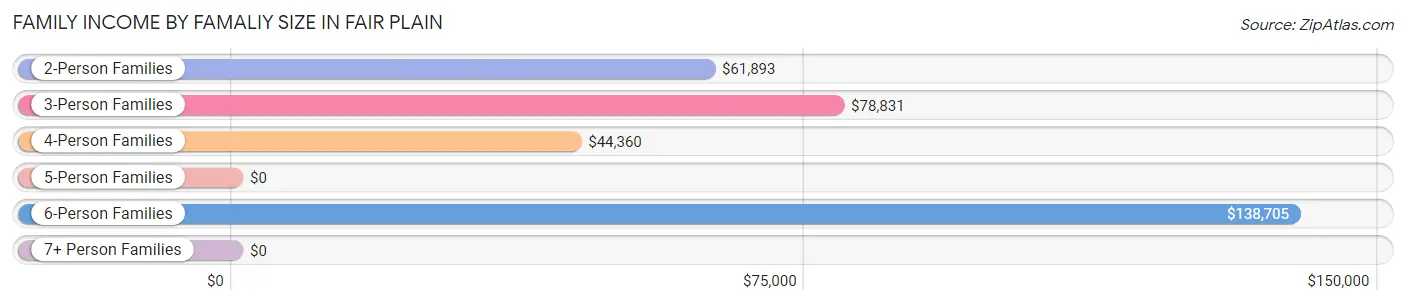
Family Income by Famaliy Size in Fair Plain
6-person families (39 | 2.1%) account for the highest median family income in Fair Plain with $138,705 per family, while 2-person families (940 | 51.8%) have the highest median income of $30,946 per family member.
| Income Bracket | # Families | Median Income |
| 2-Person Families | 940 (51.8%) | $61,893 |
| 3-Person Families | 457 (25.2%) | $78,831 |
| 4-Person Families | 299 (16.5%) | $44,360 |
| 5-Person Families | 51 (2.8%) | $0 |
| 6-Person Families | 39 (2.1%) | $138,705 |
| 7+ Person Families | 27 (1.5%) | $0 |
| Total | 1,813 (100.0%) | $62,325 |
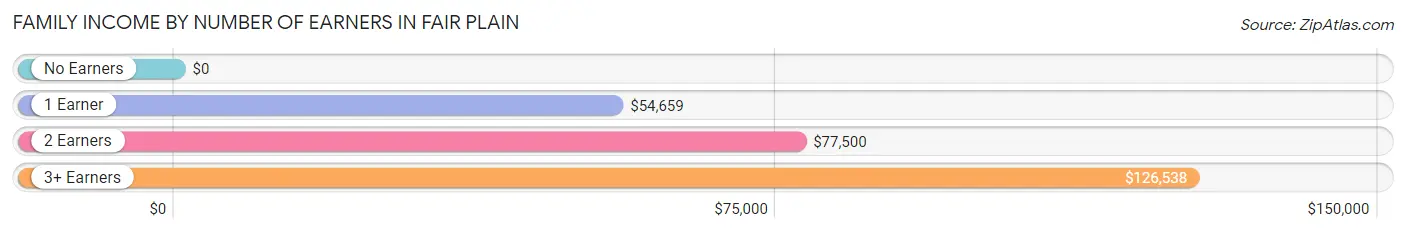
Family Income by Number of Earners in Fair Plain
| Number of Earners | # Families | Median Income |
| No Earners | 348 (19.2%) | $0 |
| 1 Earner | 559 (30.8%) | $54,659 |
| 2 Earners | 802 (44.2%) | $77,500 |
| 3+ Earners | 104 (5.7%) | $126,538 |
| Total | 1,813 (100.0%) | $62,325 |
Household Income in Fair Plain
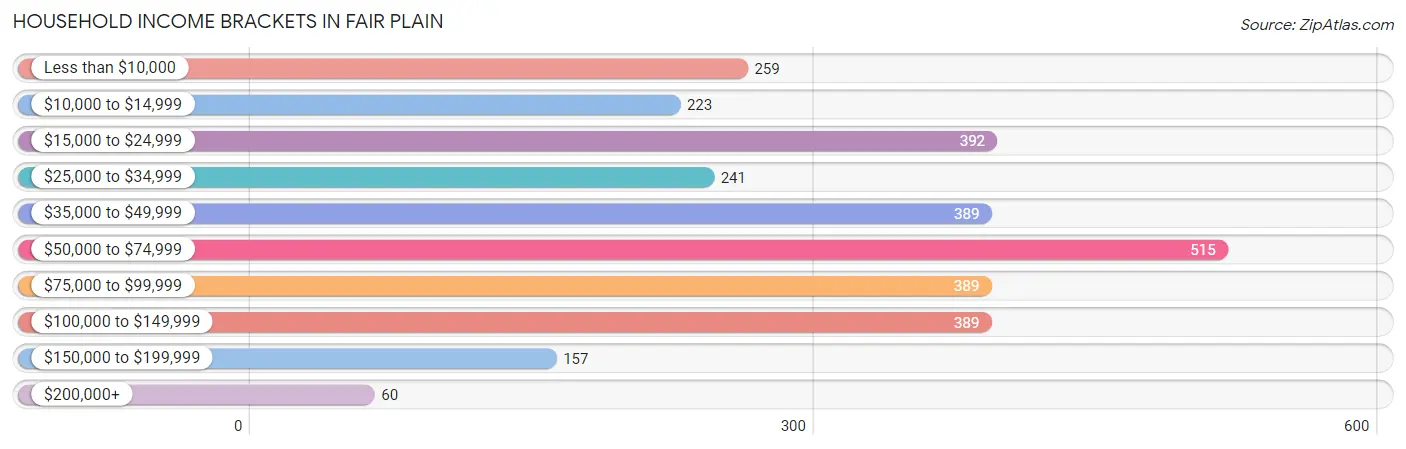
Household Income Brackets in Fair Plain
With 515 households falling in the category, the $50,000 to $74,999 income range is the most frequent in Fair Plain, accounting for 17.1% of all households. In contrast, only 60 households (2.0%) fall into the $200,000+ income bracket, making it the least populous group.
| Income Bracket | # Households | % Households |
| Less than $10,000 | 259 | 8.6% |
| $10,000 to $14,999 | 223 | 7.4% |
| $15,000 to $24,999 | 392 | 13.0% |
| $25,000 to $34,999 | 241 | 8.0% |
| $35,000 to $49,999 | 389 | 12.9% |
| $50,000 to $74,999 | 515 | 17.1% |
| $75,000 to $99,999 | 389 | 12.9% |
| $100,000 to $149,999 | 389 | 12.9% |
| $150,000 to $199,999 | 157 | 5.2% |
| $200,000+ | 60 | 2.0% |
Household Income by Householder Age in Fair Plain
The median household income in Fair Plain is $50,170, with the highest median household income of $61,893 found in the 25 to 44 years age bracket for the primary householder. A total of 864 households (28.7%) fall into this category. Meanwhile, the 15 to 24 years age bracket for the primary householder has the lowest median household income of $0, with 90 households (3.0%) in this group.
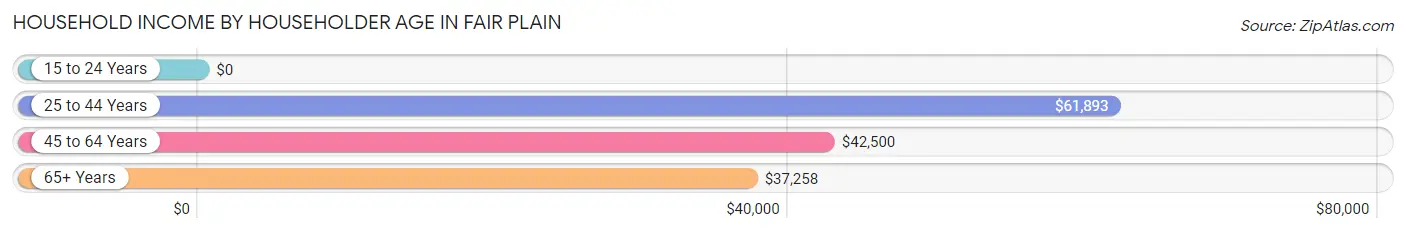
| Income Bracket | # Households | Median Income |
| 15 to 24 Years | 90 (3.0%) | $0 |
| 25 to 44 Years | 864 (28.7%) | $61,893 |
| 45 to 64 Years | 1,070 (35.5%) | $42,500 |
| 65+ Years | 988 (32.8%) | $37,258 |
| Total | 3,012 (100.0%) | $50,170 |
Poverty in Fair Plain
Income Below Poverty by Sex and Age in Fair Plain
With 23.5% poverty level for males and 29.3% for females among the residents of Fair Plain, 15 year old males and 18 to 24 year old females are the most vulnerable to poverty, with 16 males (100.0%) and 106 females (58.9%) in their respective age groups living below the poverty level.
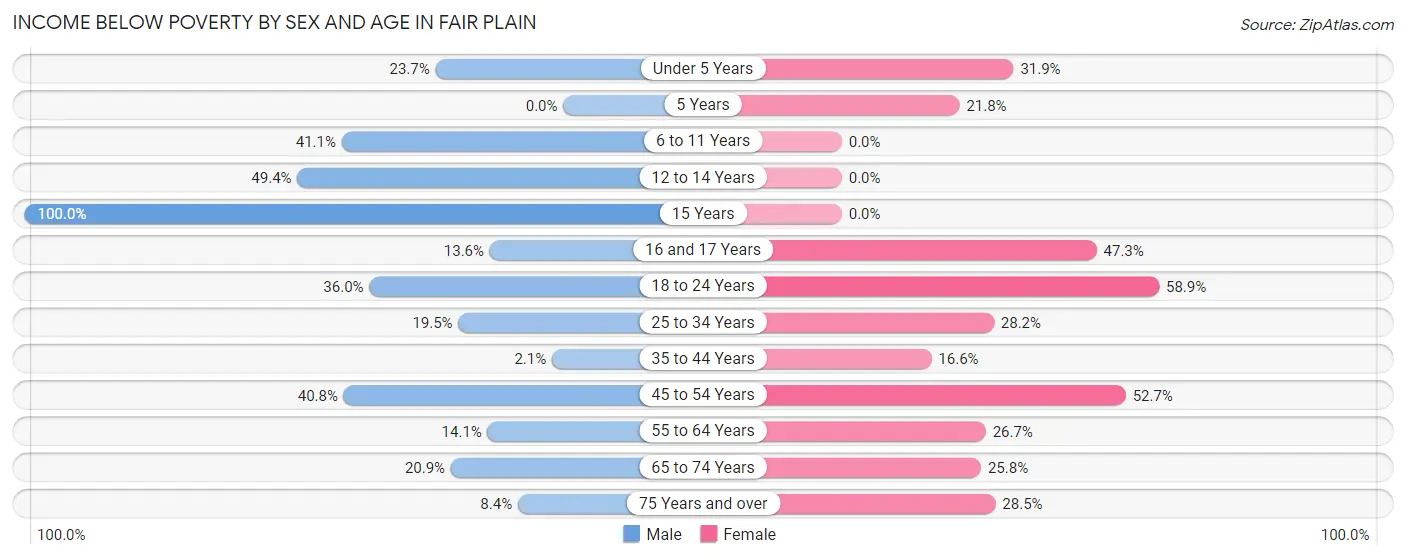
| Age Bracket | Male | Female |
| Under 5 Years | 51 (23.7%) | 72 (31.9%) |
| 5 Years | 0 (0.0%) | 19 (21.8%) |
| 6 to 11 Years | 58 (41.1%) | 0 (0.0%) |
| 12 to 14 Years | 77 (49.4%) | 0 (0.0%) |
| 15 Years | 16 (100.0%) | 0 (0.0%) |
| 16 and 17 Years | 9 (13.6%) | 35 (47.3%) |
| 18 to 24 Years | 99 (36.0%) | 106 (58.9%) |
| 25 to 34 Years | 110 (19.5%) | 125 (28.2%) |
| 35 to 44 Years | 7 (2.1%) | 83 (16.6%) |
| 45 to 54 Years | 174 (40.7%) | 244 (52.7%) |
| 55 to 64 Years | 51 (14.1%) | 160 (26.7%) |
| 65 to 74 Years | 107 (20.9%) | 138 (25.8%) |
| 75 Years and over | 17 (8.4%) | 67 (28.5%) |
| Total | 776 (23.5%) | 1,049 (29.3%) |
Income Above Poverty by Sex and Age in Fair Plain
According to the poverty statistics in Fair Plain, males aged 5 years and females aged 6 to 11 years are the age groups that are most secure financially, with 100.0% of males and 100.0% of females in these age groups living above the poverty line.
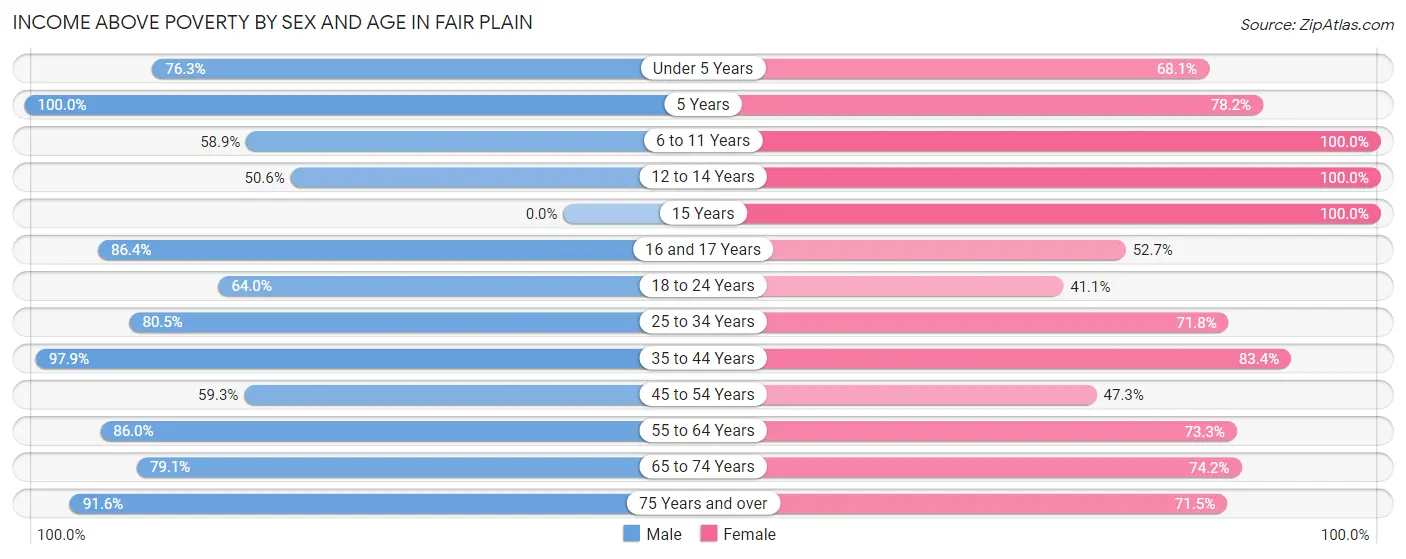
| Age Bracket | Male | Female |
| Under 5 Years | 164 (76.3%) | 154 (68.1%) |
| 5 Years | 34 (100.0%) | 68 (78.2%) |
| 6 to 11 Years | 83 (58.9%) | 102 (100.0%) |
| 12 to 14 Years | 79 (50.6%) | 80 (100.0%) |
| 15 Years | 0 (0.0%) | 54 (100.0%) |
| 16 and 17 Years | 57 (86.4%) | 39 (52.7%) |
| 18 to 24 Years | 176 (64.0%) | 74 (41.1%) |
| 25 to 34 Years | 455 (80.5%) | 318 (71.8%) |
| 35 to 44 Years | 326 (97.9%) | 416 (83.4%) |
| 45 to 54 Years | 253 (59.3%) | 219 (47.3%) |
| 55 to 64 Years | 312 (86.0%) | 439 (73.3%) |
| 65 to 74 Years | 406 (79.1%) | 396 (74.2%) |
| 75 Years and over | 185 (91.6%) | 168 (71.5%) |
| Total | 2,530 (76.5%) | 2,527 (70.7%) |
Income Below Poverty Among Married-Couple Families in Fair Plain
The poverty statistics for married-couple families in Fair Plain show that 12.9% or 148 of the total 1,151 families live below the poverty line. Families with 1 or 2 children have the highest poverty rate of 23.0%, comprising of 102 families. On the other hand, families with 3 or 4 children have the lowest poverty rate of 0.0%, which includes 0 families.
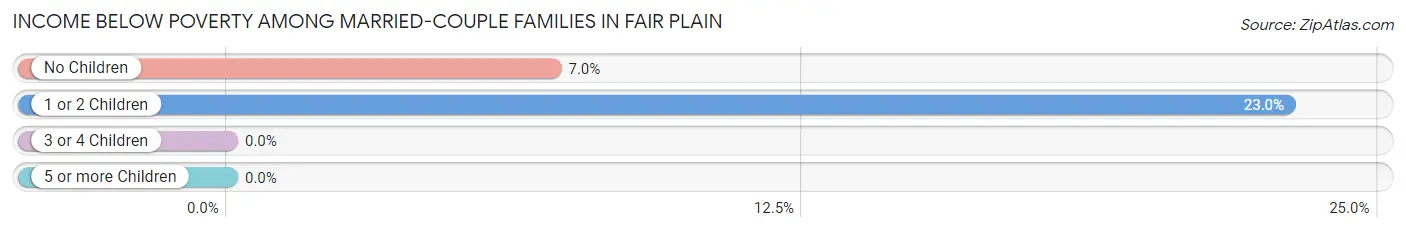
| Children | Above Poverty | Below Poverty |
| No Children | 607 (93.0%) | 46 (7.0%) |
| 1 or 2 Children | 341 (77.0%) | 102 (23.0%) |
| 3 or 4 Children | 55 (100.0%) | 0 (0.0%) |
| 5 or more Children | 0 (0.0%) | 0 (0.0%) |
| Total | 1,003 (87.1%) | 148 (12.9%) |
Income Below Poverty Among Single-Parent Households in Fair Plain
According to the poverty data in Fair Plain, 32.3% or 40 single-father households and 33.3% or 179 single-mother households are living below the poverty line. Among single-father households, those with 1 or 2 children have the highest poverty rate, with 33 households (63.5%) experiencing poverty. Likewise, among single-mother households, those with 3 or 4 children have the highest poverty rate, with 41 households (78.8%) falling below the poverty line.
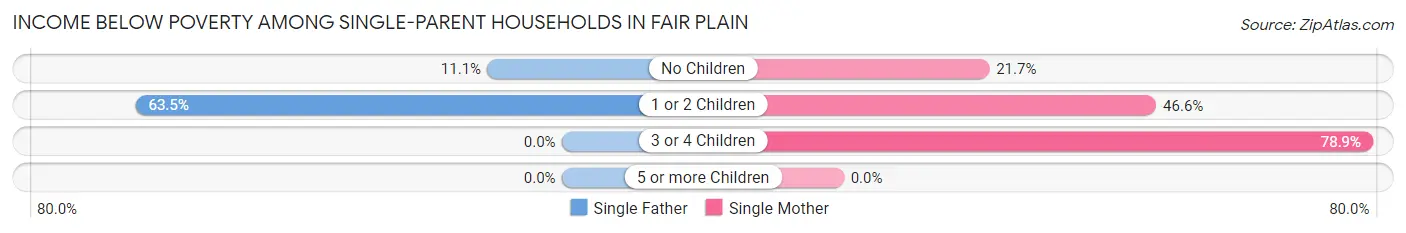
| Children | Single Father | Single Mother |
| No Children | 7 (11.1%) | 77 (21.7%) |
| 1 or 2 Children | 33 (63.5%) | 61 (46.6%) |
| 3 or 4 Children | 0 (0.0%) | 41 (78.8%) |
| 5 or more Children | 0 (0.0%) | 0 (0.0%) |
| Total | 40 (32.3%) | 179 (33.3%) |
Income Below Poverty Among Married-Couple vs Single-Parent Households in Fair Plain
The poverty data for Fair Plain shows that 148 of the married-couple family households (12.9%) and 219 of the single-parent households (33.1%) are living below the poverty level. Within the married-couple family households, those with 1 or 2 children have the highest poverty rate, with 102 households (23.0%) falling below the poverty line. Among the single-parent households, those with 3 or 4 children have the highest poverty rate, with 41 household (67.2%) living below poverty.
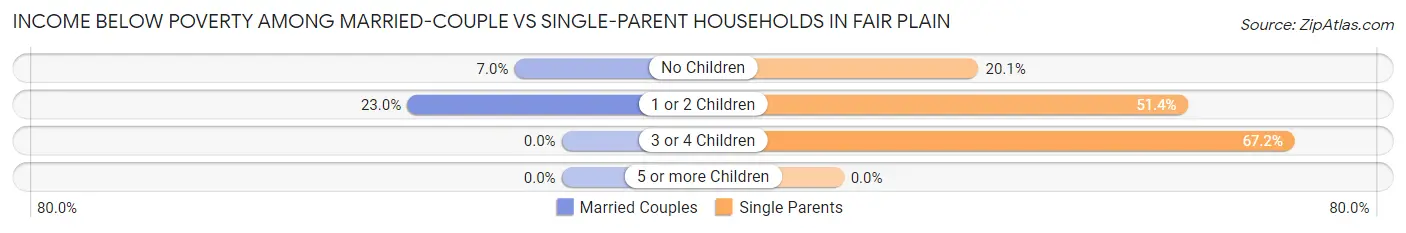
| Children | Married-Couple Families | Single-Parent Households |
| No Children | 46 (7.0%) | 84 (20.1%) |
| 1 or 2 Children | 102 (23.0%) | 94 (51.4%) |
| 3 or 4 Children | 0 (0.0%) | 41 (67.2%) |
| 5 or more Children | 0 (0.0%) | 0 (0.0%) |
| Total | 148 (12.9%) | 219 (33.1%) |
Race in Fair Plain
The most populous races in Fair Plain are White / Caucasian (3,479 | 50.5%), Black / African American (2,678 | 38.9%), and Two or more Races (479 | 7.0%).
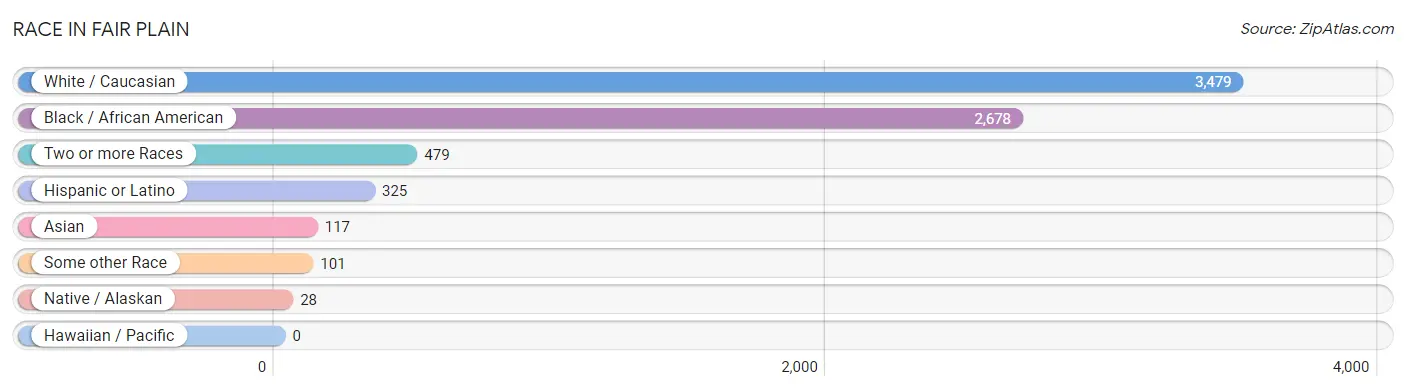
| Race | # Population | % Population |
| Asian | 117 | 1.7% |
| Black / African American | 2,678 | 38.9% |
| Hawaiian / Pacific | 0 | 0.0% |
| Hispanic or Latino | 325 | 4.7% |
| Native / Alaskan | 28 | 0.4% |
| White / Caucasian | 3,479 | 50.5% |
| Two or more Races | 479 | 7.0% |
| Some other Race | 101 | 1.5% |
| Total | 6,882 | 100.0% |
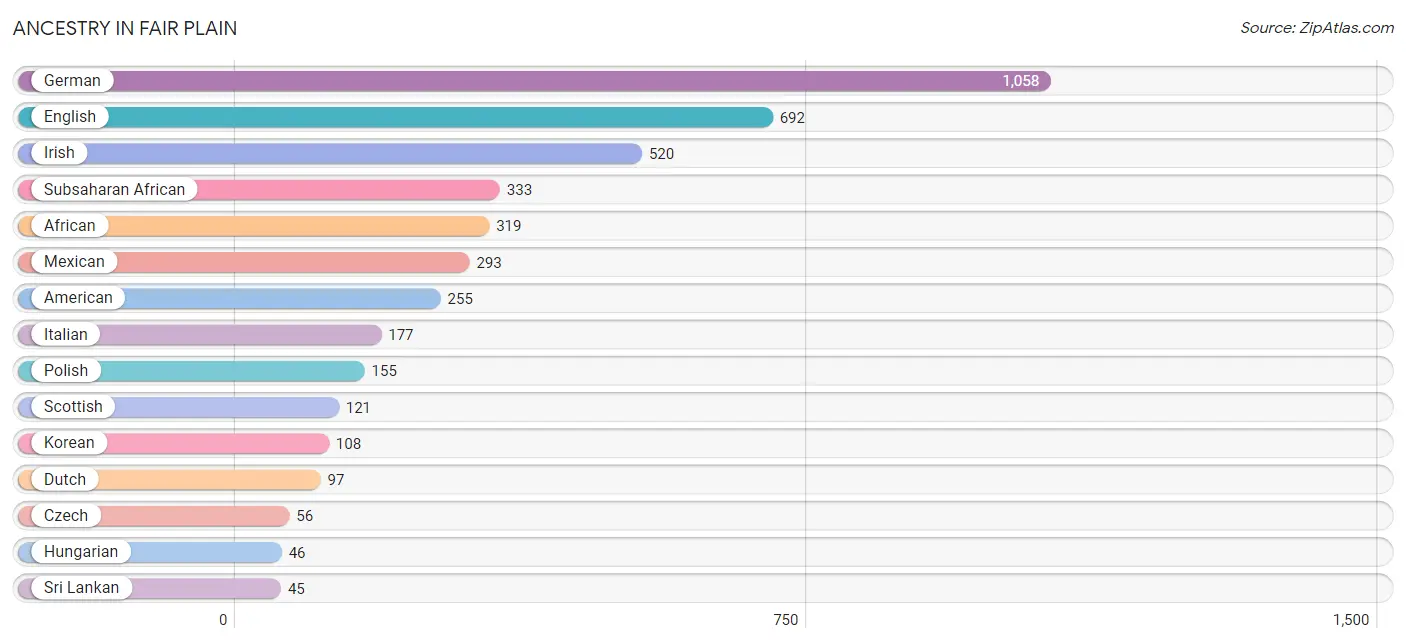
Ancestry in Fair Plain
The most populous ancestries reported in Fair Plain are German (1,058 | 15.4%), English (692 | 10.1%), Irish (520 | 7.6%), Subsaharan African (333 | 4.8%), and African (319 | 4.6%), together accounting for 42.5% of all Fair Plain residents.
| Ancestry | # Population | % Population |
| African | 319 | 4.6% |
| American | 255 | 3.7% |
| Arab | 26 | 0.4% |
| British | 11 | 0.2% |
| Burmese | 15 | 0.2% |
| Cherokee | 6 | 0.1% |
| Chippewa | 17 | 0.3% |
| Creek | 11 | 0.2% |
| Croatian | 9 | 0.1% |
| Czech | 56 | 0.8% |
| Danish | 16 | 0.2% |
| Dutch | 97 | 1.4% |
| Eastern European | 8 | 0.1% |
| English | 692 | 10.1% |
| European | 31 | 0.4% |
| French | 40 | 0.6% |
| French American Indian | 1 | 0.0% |
| German | 1,058 | 15.4% |
| Hungarian | 46 | 0.7% |
| Indian (Asian) | 23 | 0.3% |
| Irish | 520 | 7.6% |
| Italian | 177 | 2.6% |
| Korean | 108 | 1.6% |
| Lebanese | 18 | 0.3% |
| Mexican | 293 | 4.3% |
| Norwegian | 41 | 0.6% |
| Pennsylvania German | 32 | 0.5% |
| Polish | 155 | 2.2% |
| Potawatomi | 24 | 0.4% |
| Puerto Rican | 24 | 0.4% |
| Russian | 22 | 0.3% |
| Scotch-Irish | 12 | 0.2% |
| Scottish | 121 | 1.8% |
| Sri Lankan | 45 | 0.6% |
| Subsaharan African | 333 | 4.8% |
| Swedish | 45 | 0.6% |
| Thai | 37 | 0.5% |
| Ukrainian | 16 | 0.2% |
| Yugoslavian | 9 | 0.1% | View All 39 Rows |
Immigrants in Fair Plain
The most numerous immigrant groups reported in Fair Plain came from Asia (103 | 1.5%), Central America (86 | 1.3%), Latin America (86 | 1.3%), Mexico (86 | 1.3%), and South Eastern Asia (65 | 0.9%), together accounting for 6.2% of all Fair Plain residents.
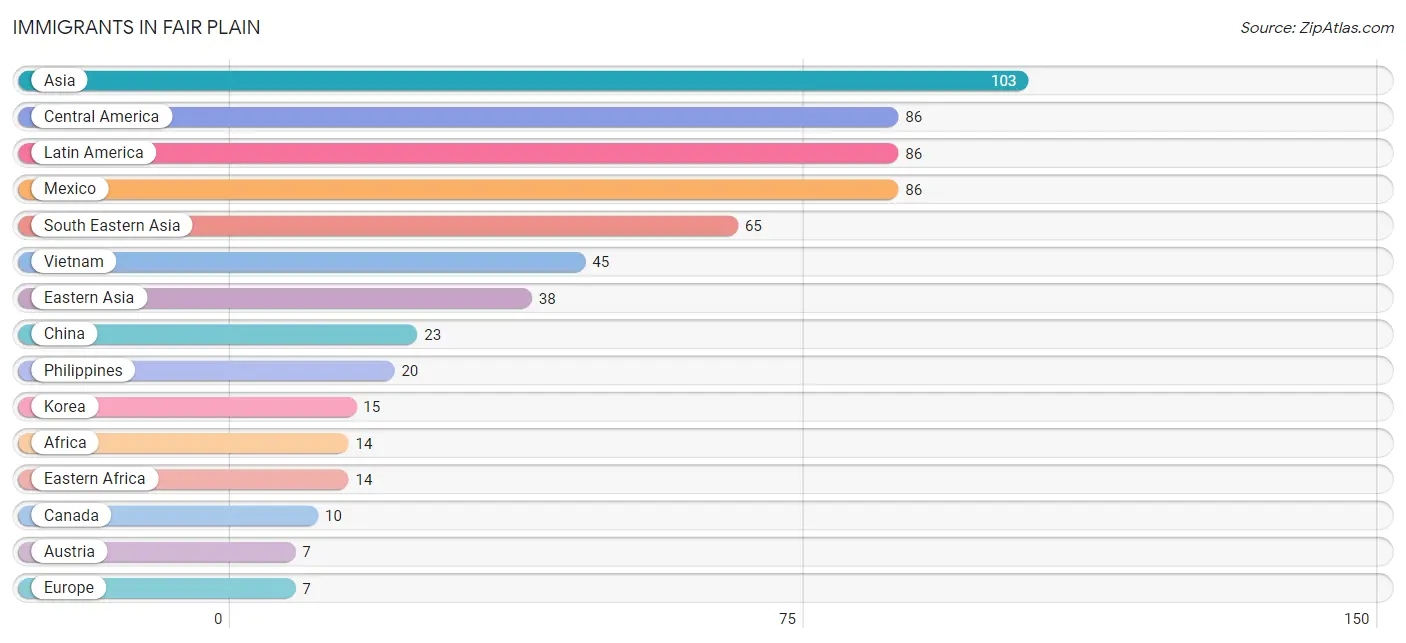
| Immigration Origin | # Population | % Population |
| Africa | 14 | 0.2% |
| Asia | 103 | 1.5% |
| Austria | 7 | 0.1% |
| Canada | 10 | 0.2% |
| Central America | 86 | 1.3% |
| China | 23 | 0.3% |
| Eastern Africa | 14 | 0.2% |
| Eastern Asia | 38 | 0.5% |
| Europe | 7 | 0.1% |
| Korea | 15 | 0.2% |
| Latin America | 86 | 1.3% |
| Mexico | 86 | 1.3% |
| Philippines | 20 | 0.3% |
| South Eastern Asia | 65 | 0.9% |
| Vietnam | 45 | 0.6% |
| Western Europe | 7 | 0.1% | View All 16 Rows |
Sex and Age in Fair Plain
Sex and Age in Fair Plain
The most populous age groups in Fair Plain are 30 to 34 Years (362 | 11.0%) for men and 60 to 64 Years (370 | 10.3%) for women.
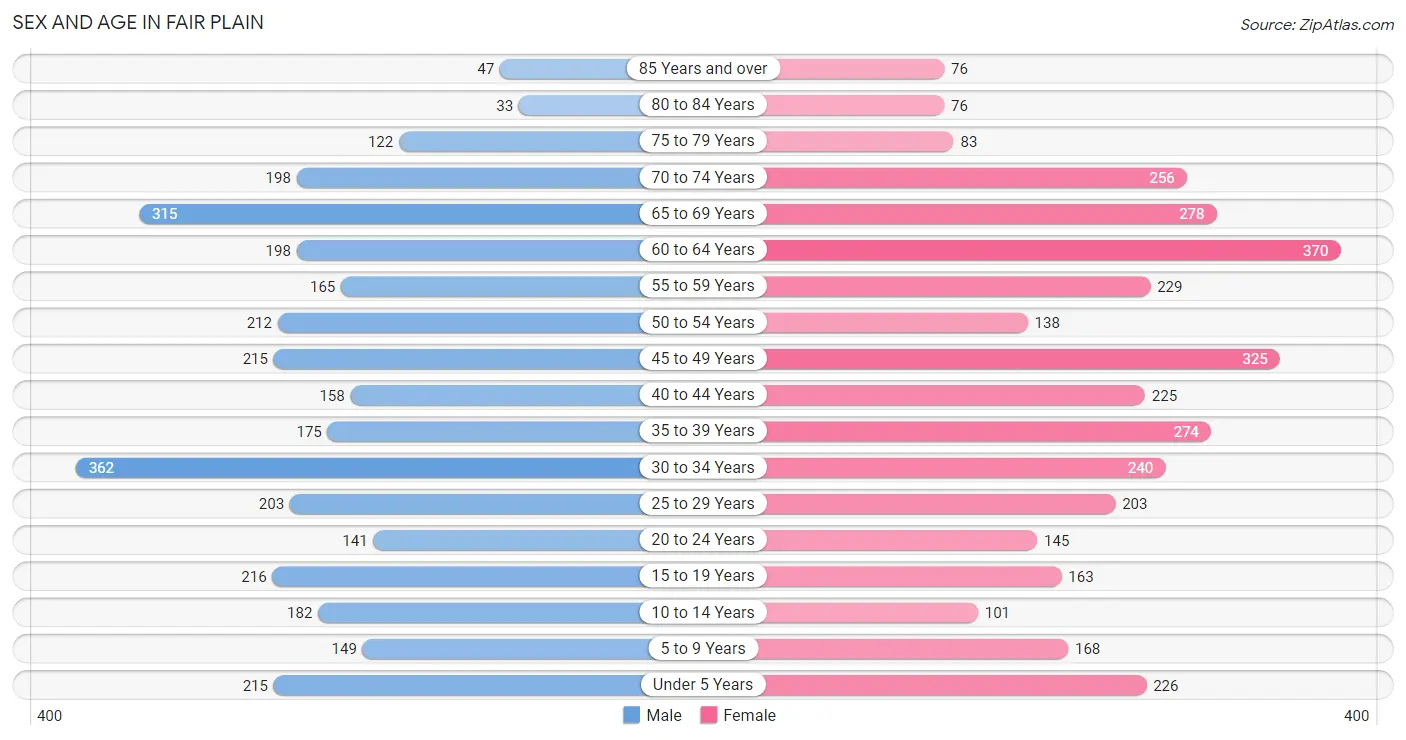
| Age Bracket | Male | Female |
| Under 5 Years | 215 (6.5%) | 226 (6.3%) |
| 5 to 9 Years | 149 (4.5%) | 168 (4.7%) |
| 10 to 14 Years | 182 (5.5%) | 101 (2.8%) |
| 15 to 19 Years | 216 (6.5%) | 163 (4.6%) |
| 20 to 24 Years | 141 (4.3%) | 145 (4.1%) |
| 25 to 29 Years | 203 (6.1%) | 203 (5.7%) |
| 30 to 34 Years | 362 (11.0%) | 240 (6.7%) |
| 35 to 39 Years | 175 (5.3%) | 274 (7.7%) |
| 40 to 44 Years | 158 (4.8%) | 225 (6.3%) |
| 45 to 49 Years | 215 (6.5%) | 325 (9.1%) |
| 50 to 54 Years | 212 (6.4%) | 138 (3.9%) |
| 55 to 59 Years | 165 (5.0%) | 229 (6.4%) |
| 60 to 64 Years | 198 (6.0%) | 370 (10.3%) |
| 65 to 69 Years | 315 (9.5%) | 278 (7.8%) |
| 70 to 74 Years | 198 (6.0%) | 256 (7.2%) |
| 75 to 79 Years | 122 (3.7%) | 83 (2.3%) |
| 80 to 84 Years | 33 (1.0%) | 76 (2.1%) |
| 85 Years and over | 47 (1.4%) | 76 (2.1%) |
| Total | 3,306 (100.0%) | 3,576 (100.0%) |
Families and Households in Fair Plain
Median Family Size in Fair Plain
The median family size in Fair Plain is 2.87 persons per family, with married-couple families (1,151 | 63.5%) accounting for the largest median family size of 3.02 persons per family. On the other hand, single female/mother families (538 | 29.7%) represent the smallest median family size with 2.58 persons per family.
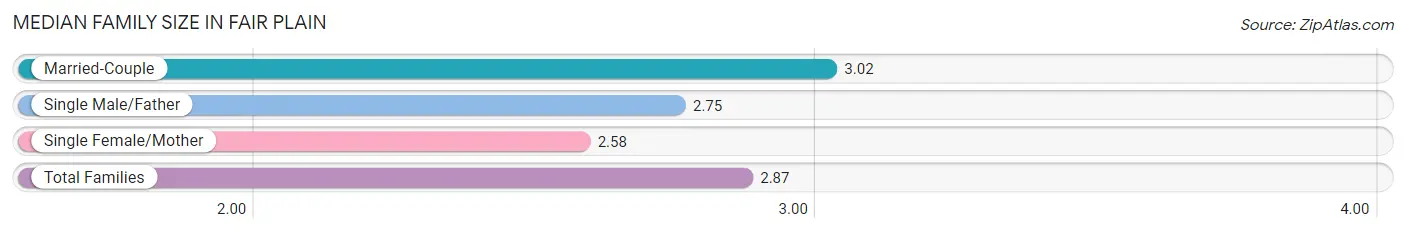
| Family Type | # Families | Family Size |
| Married-Couple | 1,151 (63.5%) | 3.02 |
| Single Male/Father | 124 (6.8%) | 2.75 |
| Single Female/Mother | 538 (29.7%) | 2.58 |
| Total Families | 1,813 (100.0%) | 2.87 |
Median Household Size in Fair Plain
The median household size in Fair Plain is 2.27 persons per household, with single male/father households (124 | 4.1%) accounting for the largest median household size of 3.04 persons per household. non-family households (1,199 | 39.8%) represent the smallest median household size with 1.32 persons per household.
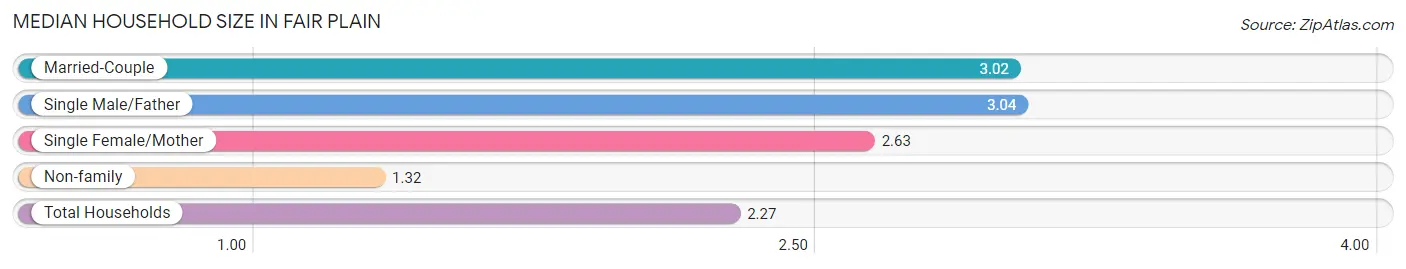
| Household Type | # Households | Household Size |
| Married-Couple | 1,151 (38.2%) | 3.02 |
| Single Male/Father | 124 (4.1%) | 3.04 |
| Single Female/Mother | 538 (17.9%) | 2.63 |
| Non-family | 1,199 (39.8%) | 1.32 |
| Total Households | 3,012 (100.0%) | 2.27 |
Household Size by Marriage Status in Fair Plain
Out of a total of 3,012 households in Fair Plain, 1,813 (60.2%) are family households, while 1,199 (39.8%) are nonfamily households. The most numerous type of family households are 2-person households, comprising 919, and the most common type of nonfamily households are 1-person households, comprising 916.
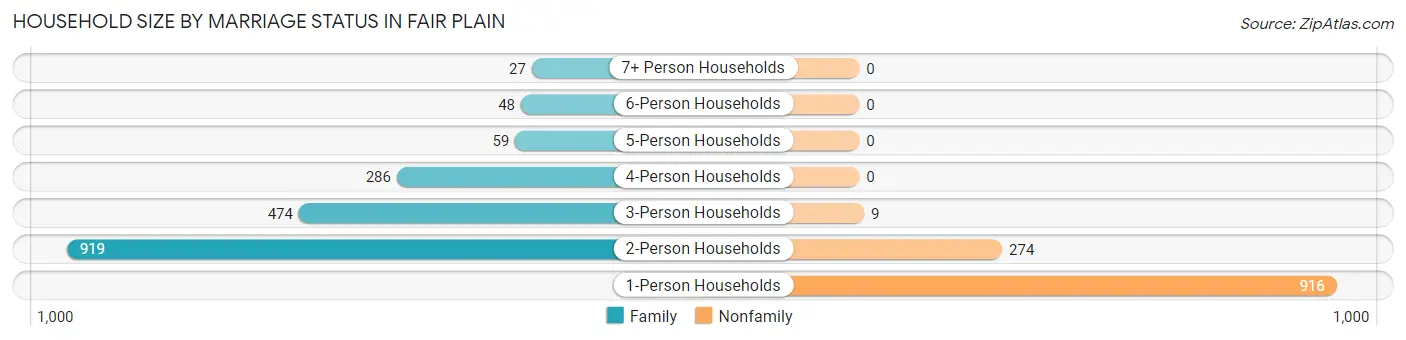
| Household Size | Family Households | Nonfamily Households |
| 1-Person Households | - | 916 (30.4%) |
| 2-Person Households | 919 (30.5%) | 274 (9.1%) |
| 3-Person Households | 474 (15.7%) | 9 (0.3%) |
| 4-Person Households | 286 (9.5%) | 0 (0.0%) |
| 5-Person Households | 59 (2.0%) | 0 (0.0%) |
| 6-Person Households | 48 (1.6%) | 0 (0.0%) |
| 7+ Person Households | 27 (0.9%) | 0 (0.0%) |
| Total | 1,813 (60.2%) | 1,199 (39.8%) |
Female Fertility in Fair Plain
Fertility by Age in Fair Plain
Average fertility rate in Fair Plain is 89.0 births per 1,000 women. Women in the age bracket of 20 to 34 years have the highest fertility rate with 201.0 births per 1,000 women. Women in the age bracket of 20 to 34 years acount for 82.5% of all women with births.
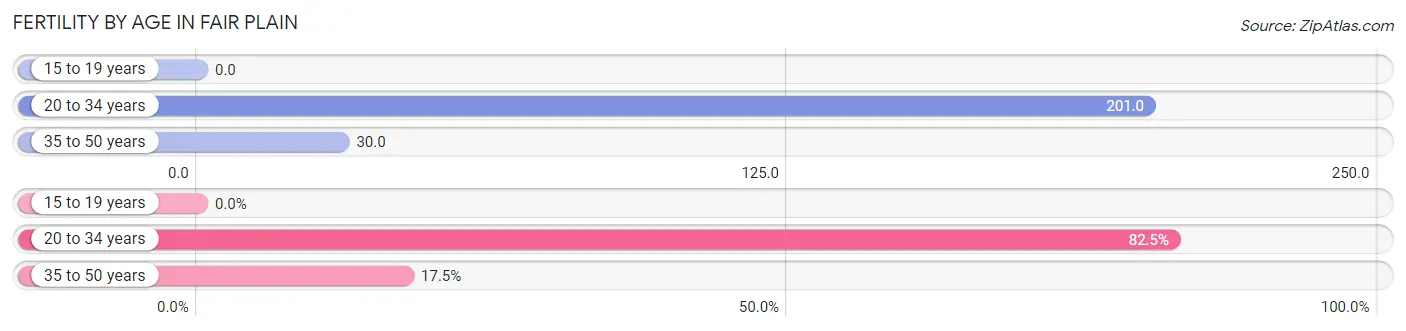
| Age Bracket | Women with Births | Births / 1,000 Women |
| 15 to 19 years | 0 (0.0%) | 0.0 |
| 20 to 34 years | 118 (82.5%) | 201.0 |
| 35 to 50 years | 25 (17.5%) | 30.0 |
| Total | 143 (100.0%) | 89.0 |
Fertility by Age by Marriage Status in Fair Plain
69.9% of women with births (143) in Fair Plain are married. The highest percentage of unmarried women with births falls into 35 to 50 years age bracket with 100.0% of them unmarried at the time of birth, while the lowest percentage of unmarried women with births belong to 20 to 34 years age bracket with 15.2% of them unmarried.
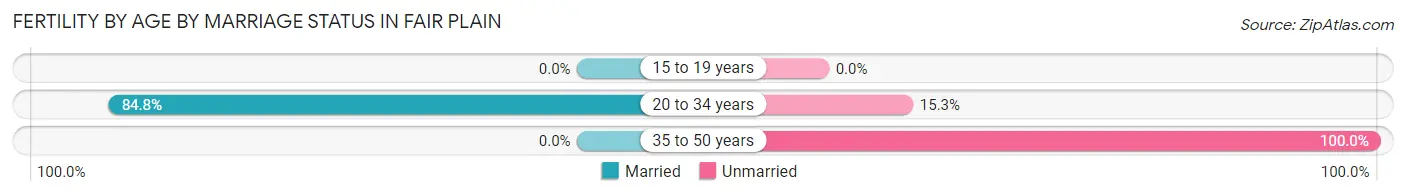
| Age Bracket | Married | Unmarried |
| 15 to 19 years | 0 (0.0%) | 0 (0.0%) |
| 20 to 34 years | 100 (84.8%) | 18 (15.2%) |
| 35 to 50 years | 0 (0.0%) | 25 (100.0%) |
| Total | 100 (69.9%) | 43 (30.1%) |
Fertility by Education in Fair Plain
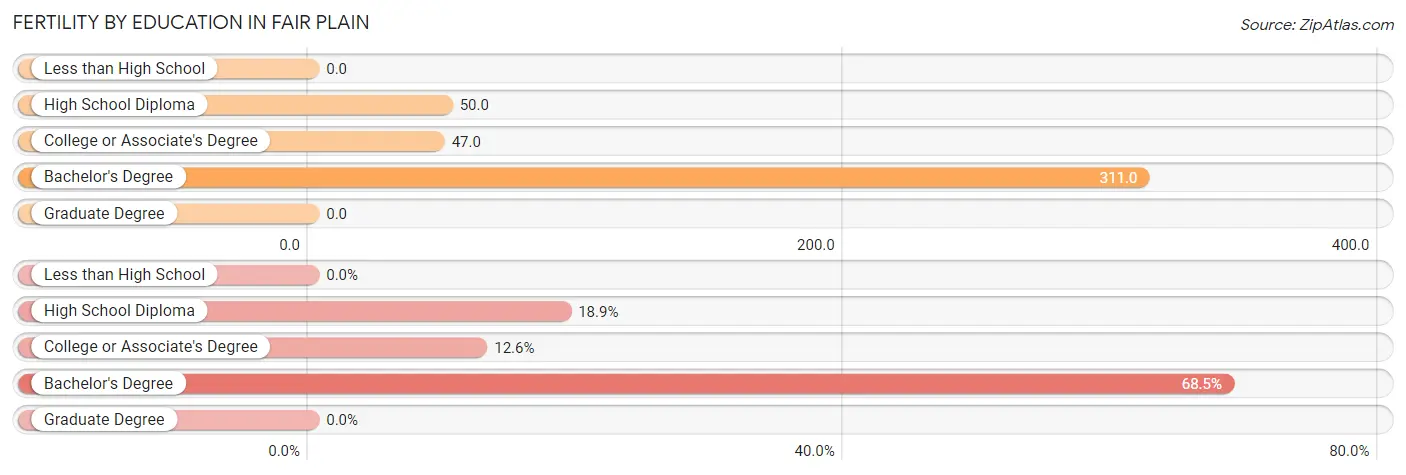
| Educational Attainment | Women with Births | Births / 1,000 Women |
| Less than High School | 0 (0.0%) | 0.0 |
| High School Diploma | 27 (18.9%) | 50.0 |
| College or Associate's Degree | 18 (12.6%) | 47.0 |
| Bachelor's Degree | 98 (68.5%) | 311.0 |
| Graduate Degree | 0 (0.0%) | 0.0 |
| Total | 143 (100.0%) | 89.0 |
Fertility by Education by Marriage Status in Fair Plain
30.1% of women with births in Fair Plain are unmarried. Women with the educational attainment of high school diploma are most likely to be married with 100.0% of them married at childbirth, while women with the educational attainment of college or associate's degree are least likely to be married with 100.0% of them unmarried at childbirth.
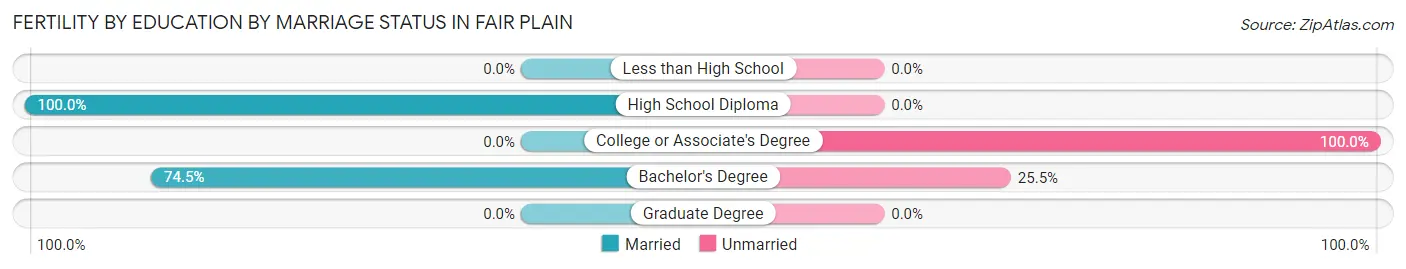
| Educational Attainment | Married | Unmarried |
| Less than High School | 0 (0.0%) | 0 (0.0%) |
| High School Diploma | 27 (100.0%) | 0 (0.0%) |
| College or Associate's Degree | 0 (0.0%) | 18 (100.0%) |
| Bachelor's Degree | 73 (74.5%) | 25 (25.5%) |
| Graduate Degree | 0 (0.0%) | 0 (0.0%) |
| Total | 100 (69.9%) | 43 (30.1%) |
Employment Characteristics in Fair Plain
Employment by Class of Employer in Fair Plain
Among the 2,664 employed individuals in Fair Plain, private company employees (2,022 | 75.9%), not-for-profit organizations (251 | 9.4%), and self-employed (incorporated) (107 | 4.0%) make up the most common classes of employment.
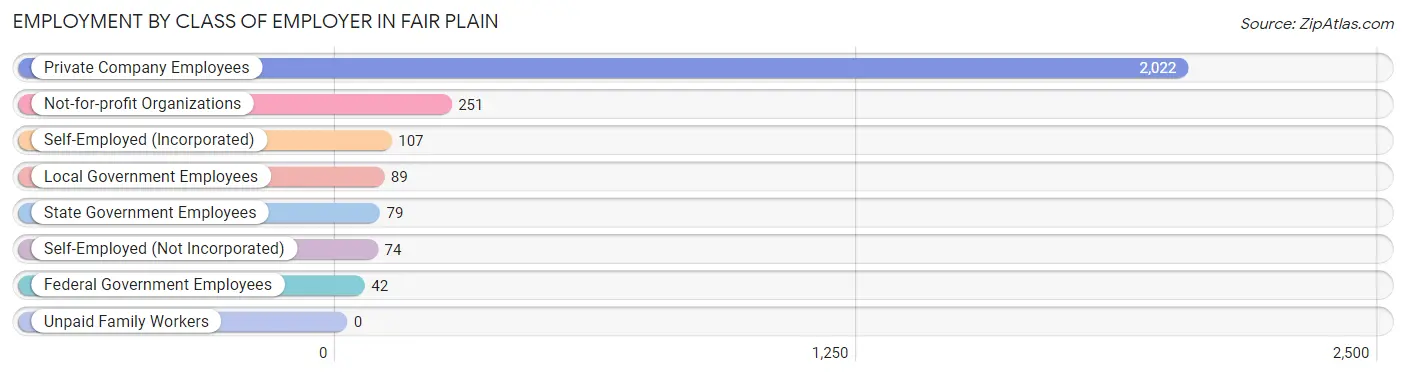
| Employer Class | # Employees | % Employees |
| Private Company Employees | 2,022 | 75.9% |
| Self-Employed (Incorporated) | 107 | 4.0% |
| Self-Employed (Not Incorporated) | 74 | 2.8% |
| Not-for-profit Organizations | 251 | 9.4% |
| Local Government Employees | 89 | 3.3% |
| State Government Employees | 79 | 3.0% |
| Federal Government Employees | 42 | 1.6% |
| Unpaid Family Workers | 0 | 0.0% |
| Total | 2,664 | 100.0% |
Employment Status by Age in Fair Plain
According to the labor force statistics for Fair Plain, out of the total population over 16 years of age (5,771), 61.1% or 3,526 individuals are in the labor force, with 20.5% or 723 of them unemployed. The age group with the highest labor force participation rate is 25 to 29 years, with 95.6% or 388 individuals in the labor force. Within the labor force, the 45 to 54 years age range has the highest percentage of unemployed individuals, with 35.7% or 264 of them being unemployed.
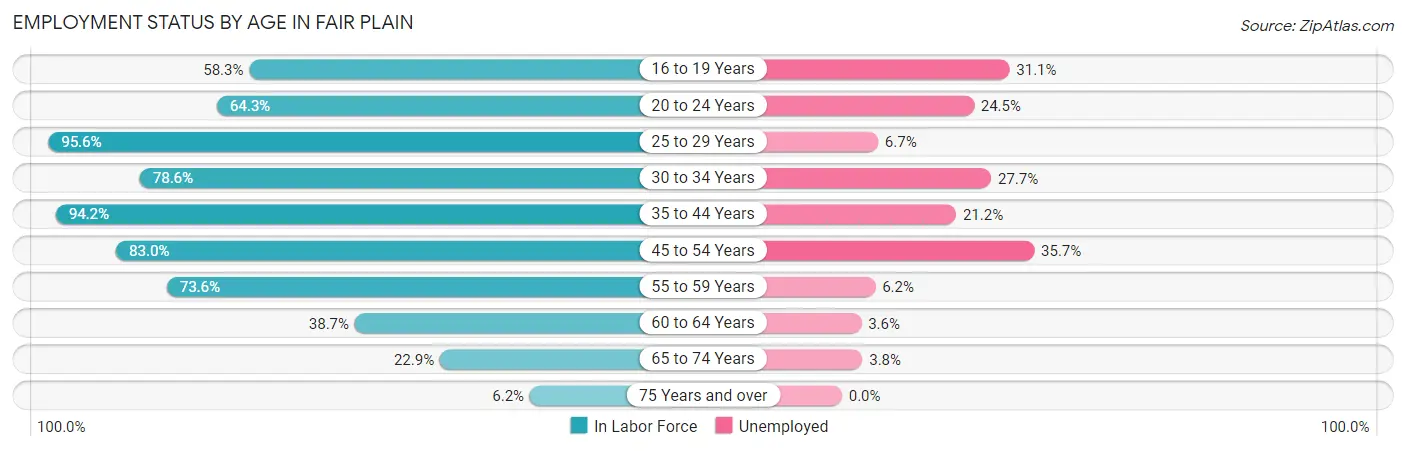
| Age Bracket | In Labor Force | Unemployed |
| 16 to 19 Years | 180 (58.3%) | 56 (31.1%) |
| 20 to 24 Years | 184 (64.3%) | 45 (24.5%) |
| 25 to 29 Years | 388 (95.6%) | 26 (6.7%) |
| 30 to 34 Years | 473 (78.6%) | 131 (27.7%) |
| 35 to 44 Years | 784 (94.2%) | 166 (21.2%) |
| 45 to 54 Years | 739 (83.0%) | 264 (35.7%) |
| 55 to 59 Years | 290 (73.6%) | 18 (6.2%) |
| 60 to 64 Years | 220 (38.7%) | 8 (3.6%) |
| 65 to 74 Years | 240 (22.9%) | 9 (3.8%) |
| 75 Years and over | 27 (6.2%) | 0 (0.0%) |
| Total | 3,526 (61.1%) | 723 (20.5%) |
Employment Status by Educational Attainment in Fair Plain
According to labor force statistics for Fair Plain, 78.4% of individuals (2,895) out of the total population between 25 and 64 years of age (3,692) are in the labor force, with 21.2% or 614 of them being unemployed. The group with the highest labor force participation rate are those with the educational attainment of bachelor's degree or higher, with 90.0% or 800 individuals in the labor force. Within the labor force, individuals with high school diploma education have the highest percentage of unemployment, with 46.3% or 358 of them being unemployed.
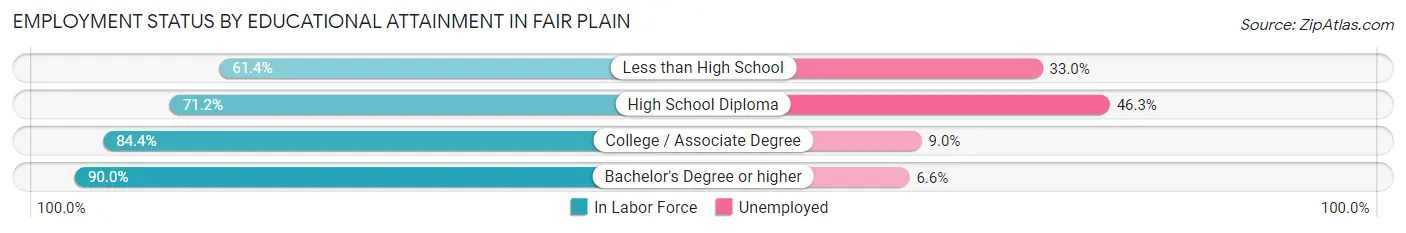
| Educational Attainment | In Labor Force | Unemployed |
| Less than High School | 345 (61.4%) | 185 (33.0%) |
| High School Diploma | 773 (71.2%) | 502 (46.3%) |
| College / Associate Degree | 976 (84.4%) | 104 (9.0%) |
| Bachelor's Degree or higher | 800 (90.0%) | 59 (6.6%) |
| Total | 2,895 (78.4%) | 783 (21.2%) |
Employment Occupations by Sex in Fair Plain
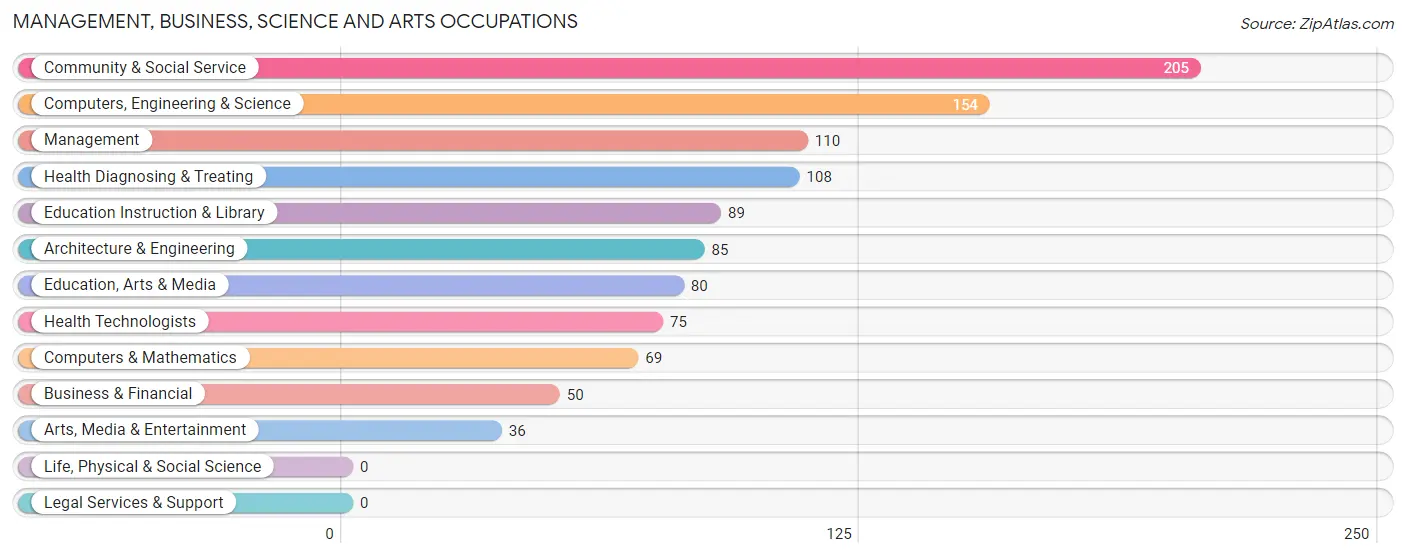
Management, Business, Science and Arts Occupations
The most common Management, Business, Science and Arts occupations in Fair Plain are Community & Social Service (205 | 7.3%), Computers, Engineering & Science (154 | 5.5%), Management (110 | 3.9%), Health Diagnosing & Treating (108 | 3.8%), and Education Instruction & Library (89 | 3.2%).
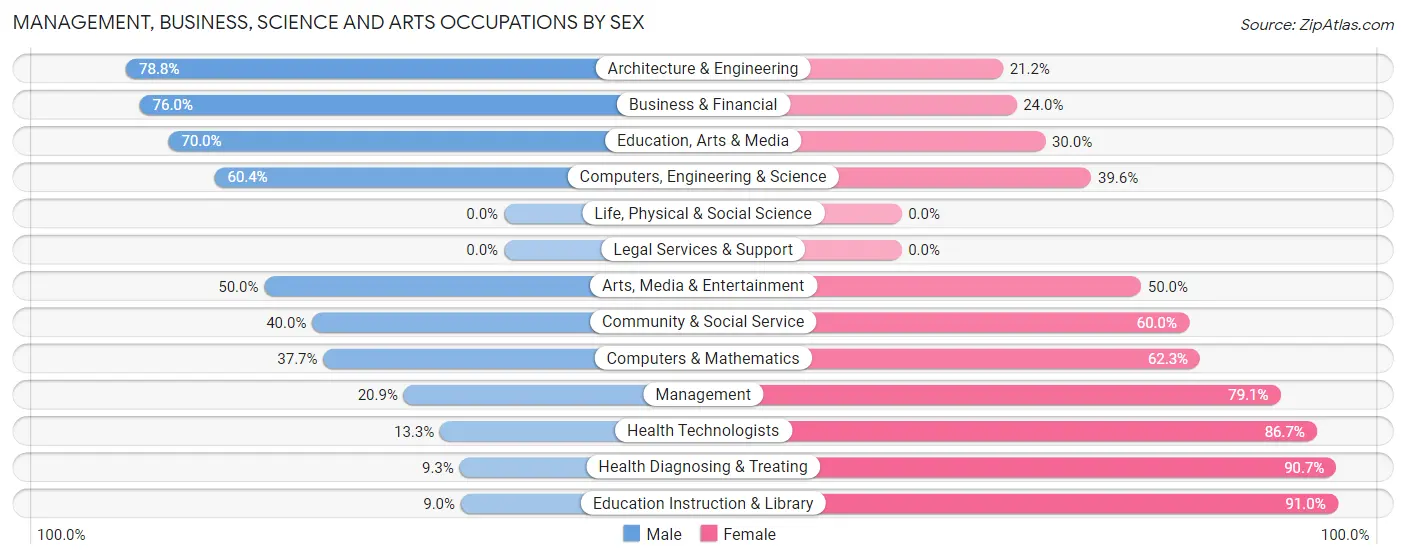
Management, Business, Science and Arts Occupations by Sex
Within the Management, Business, Science and Arts occupations in Fair Plain, the most male-oriented occupations are Architecture & Engineering (78.8%), Business & Financial (76.0%), and Education, Arts & Media (70.0%), while the most female-oriented occupations are Education Instruction & Library (91.0%), Health Diagnosing & Treating (90.7%), and Health Technologists (86.7%).
| Occupation | Male | Female |
| Management | 23 (20.9%) | 87 (79.1%) |
| Business & Financial | 38 (76.0%) | 12 (24.0%) |
| Computers, Engineering & Science | 93 (60.4%) | 61 (39.6%) |
| Computers & Mathematics | 26 (37.7%) | 43 (62.3%) |
| Architecture & Engineering | 67 (78.8%) | 18 (21.2%) |
| Life, Physical & Social Science | 0 (0.0%) | 0 (0.0%) |
| Community & Social Service | 82 (40.0%) | 123 (60.0%) |
| Education, Arts & Media | 56 (70.0%) | 24 (30.0%) |
| Legal Services & Support | 0 (0.0%) | 0 (0.0%) |
| Education Instruction & Library | 8 (9.0%) | 81 (91.0%) |
| Arts, Media & Entertainment | 18 (50.0%) | 18 (50.0%) |
| Health Diagnosing & Treating | 10 (9.3%) | 98 (90.7%) |
| Health Technologists | 10 (13.3%) | 65 (86.7%) |
| Total (Category) | 246 (39.2%) | 381 (60.8%) |
| Total (Overall) | 1,518 (54.2%) | 1,284 (45.8%) |
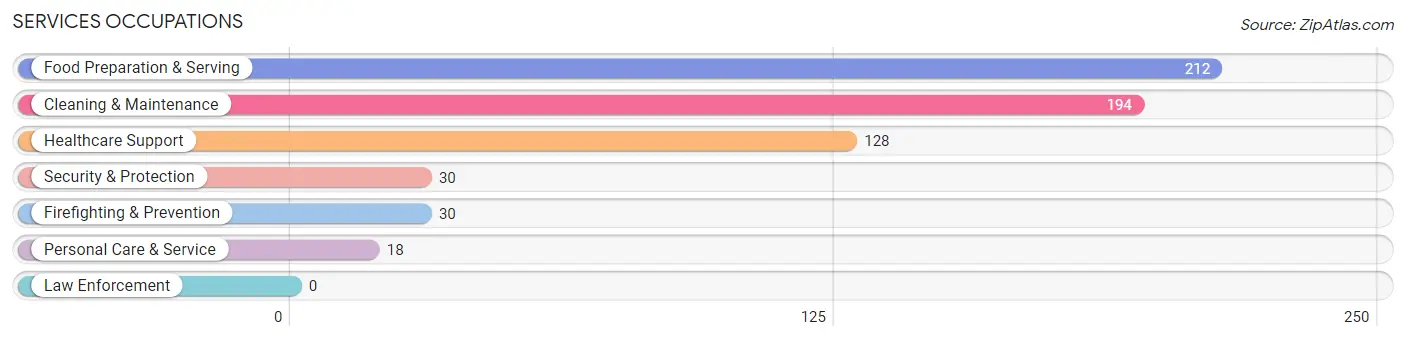
Services Occupations
The most common Services occupations in Fair Plain are Food Preparation & Serving (212 | 7.6%), Cleaning & Maintenance (194 | 6.9%), Healthcare Support (128 | 4.6%), Security & Protection (30 | 1.1%), and Firefighting & Prevention (30 | 1.1%).
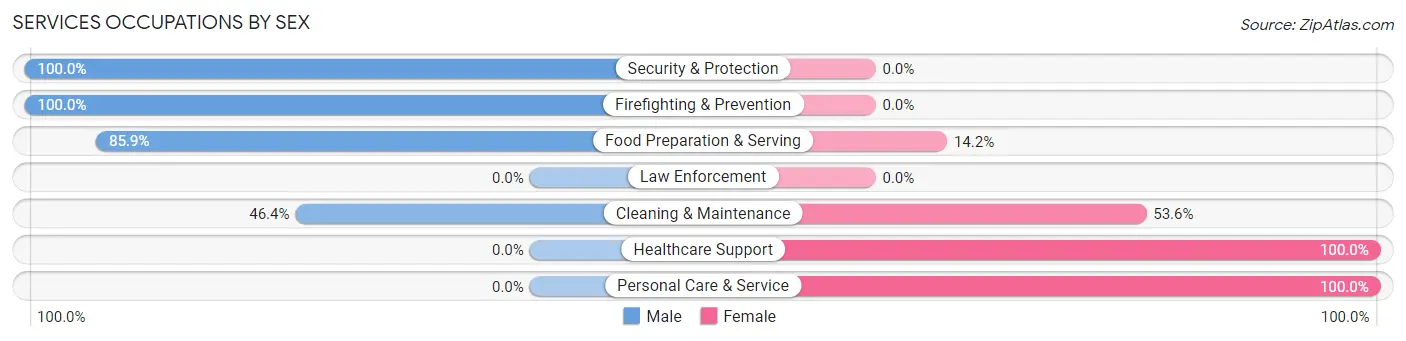
Services Occupations by Sex
Within the Services occupations in Fair Plain, the most male-oriented occupations are Security & Protection (100.0%), Firefighting & Prevention (100.0%), and Food Preparation & Serving (85.9%), while the most female-oriented occupations are Healthcare Support (100.0%), Personal Care & Service (100.0%), and Cleaning & Maintenance (53.6%).
| Occupation | Male | Female |
| Healthcare Support | 0 (0.0%) | 128 (100.0%) |
| Security & Protection | 30 (100.0%) | 0 (0.0%) |
| Firefighting & Prevention | 30 (100.0%) | 0 (0.0%) |
| Law Enforcement | 0 (0.0%) | 0 (0.0%) |
| Food Preparation & Serving | 182 (85.9%) | 30 (14.1%) |
| Cleaning & Maintenance | 90 (46.4%) | 104 (53.6%) |
| Personal Care & Service | 0 (0.0%) | 18 (100.0%) |
| Total (Category) | 302 (51.9%) | 280 (48.1%) |
| Total (Overall) | 1,518 (54.2%) | 1,284 (45.8%) |
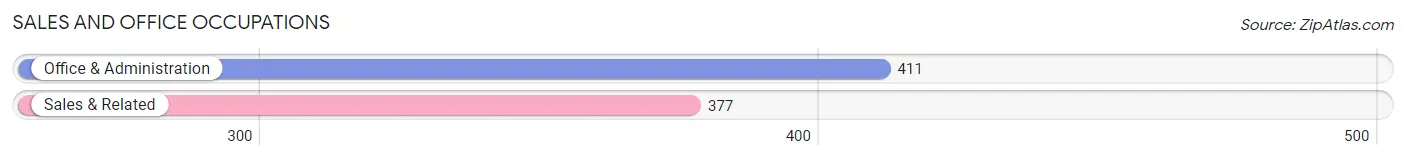
Sales and Office Occupations
The most common Sales and Office occupations in Fair Plain are Office & Administration (411 | 14.7%), and Sales & Related (377 | 13.5%).
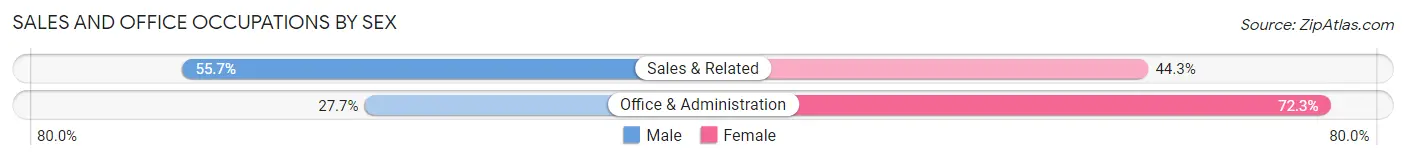
Sales and Office Occupations by Sex
| Occupation | Male | Female |
| Sales & Related | 210 (55.7%) | 167 (44.3%) |
| Office & Administration | 114 (27.7%) | 297 (72.3%) |
| Total (Category) | 324 (41.1%) | 464 (58.9%) |
| Total (Overall) | 1,518 (54.2%) | 1,284 (45.8%) |
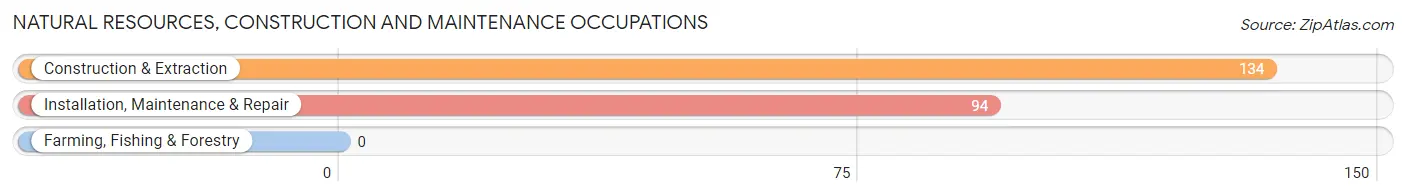
Natural Resources, Construction and Maintenance Occupations
The most common Natural Resources, Construction and Maintenance occupations in Fair Plain are Construction & Extraction (134 | 4.8%), and Installation, Maintenance & Repair (94 | 3.4%).
Natural Resources, Construction and Maintenance Occupations by Sex

| Occupation | Male | Female |
| Farming, Fishing & Forestry | 0 (0.0%) | 0 (0.0%) |
| Construction & Extraction | 134 (100.0%) | 0 (0.0%) |
| Installation, Maintenance & Repair | 83 (88.3%) | 11 (11.7%) |
| Total (Category) | 217 (95.2%) | 11 (4.8%) |
| Total (Overall) | 1,518 (54.2%) | 1,284 (45.8%) |
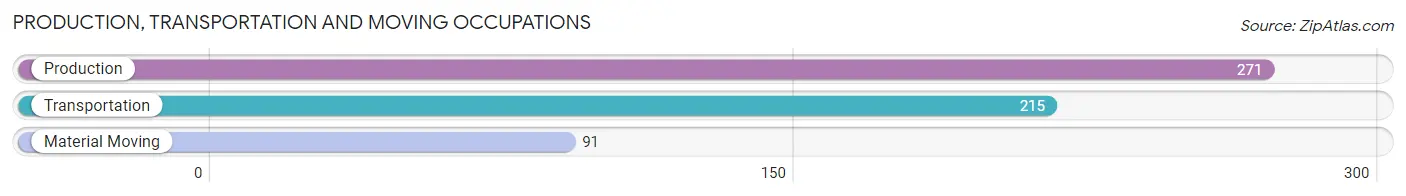
Production, Transportation and Moving Occupations
The most common Production, Transportation and Moving occupations in Fair Plain are Production (271 | 9.7%), Transportation (215 | 7.7%), and Material Moving (91 | 3.3%).
Production, Transportation and Moving Occupations by Sex
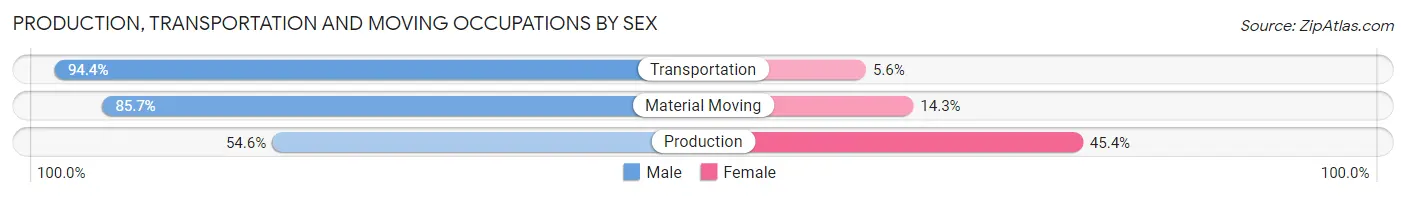
| Occupation | Male | Female |
| Production | 148 (54.6%) | 123 (45.4%) |
| Transportation | 203 (94.4%) | 12 (5.6%) |
| Material Moving | 78 (85.7%) | 13 (14.3%) |
| Total (Category) | 429 (74.4%) | 148 (25.7%) |
| Total (Overall) | 1,518 (54.2%) | 1,284 (45.8%) |
Employment Industries by Sex in Fair Plain
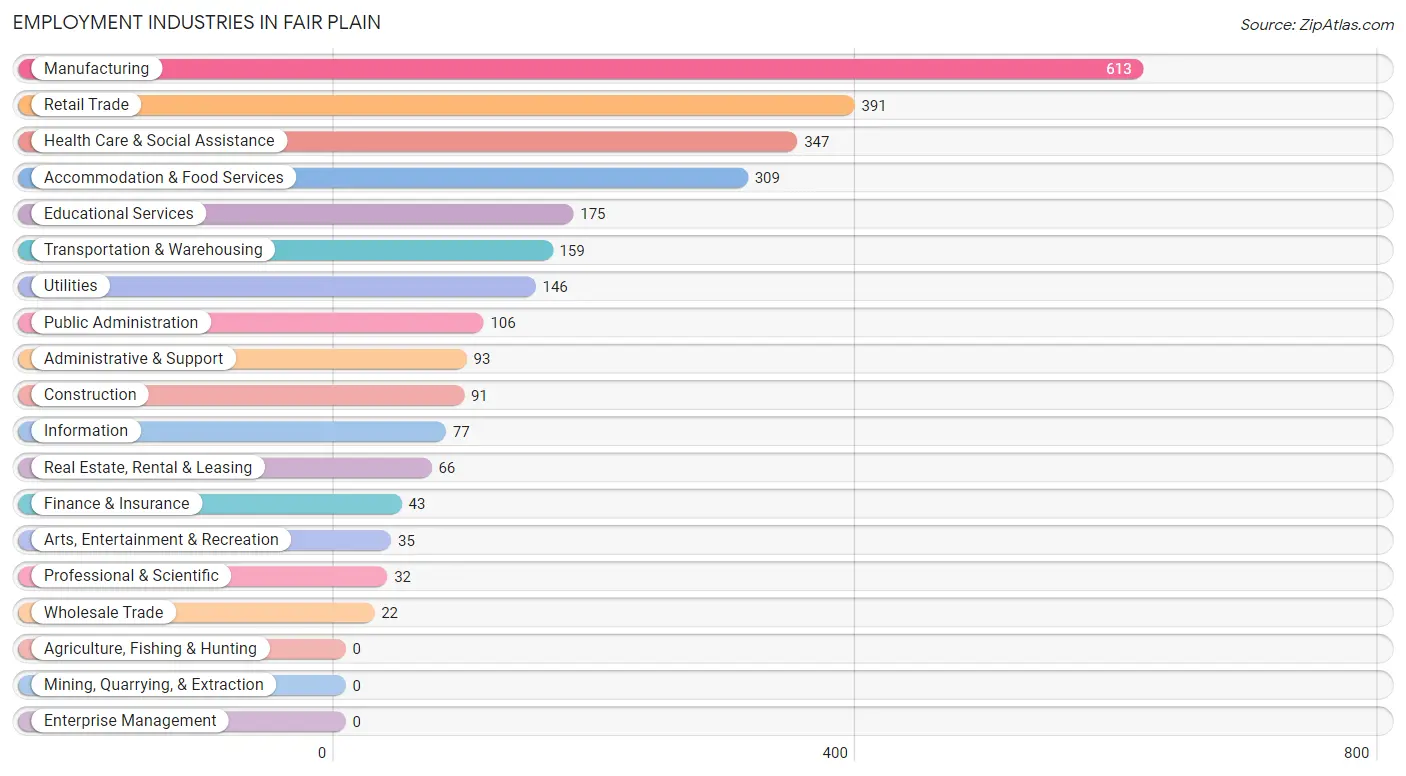
Employment Industries in Fair Plain
The major employment industries in Fair Plain include Manufacturing (613 | 21.9%), Retail Trade (391 | 14.0%), Health Care & Social Assistance (347 | 12.4%), Accommodation & Food Services (309 | 11.0%), and Educational Services (175 | 6.2%).
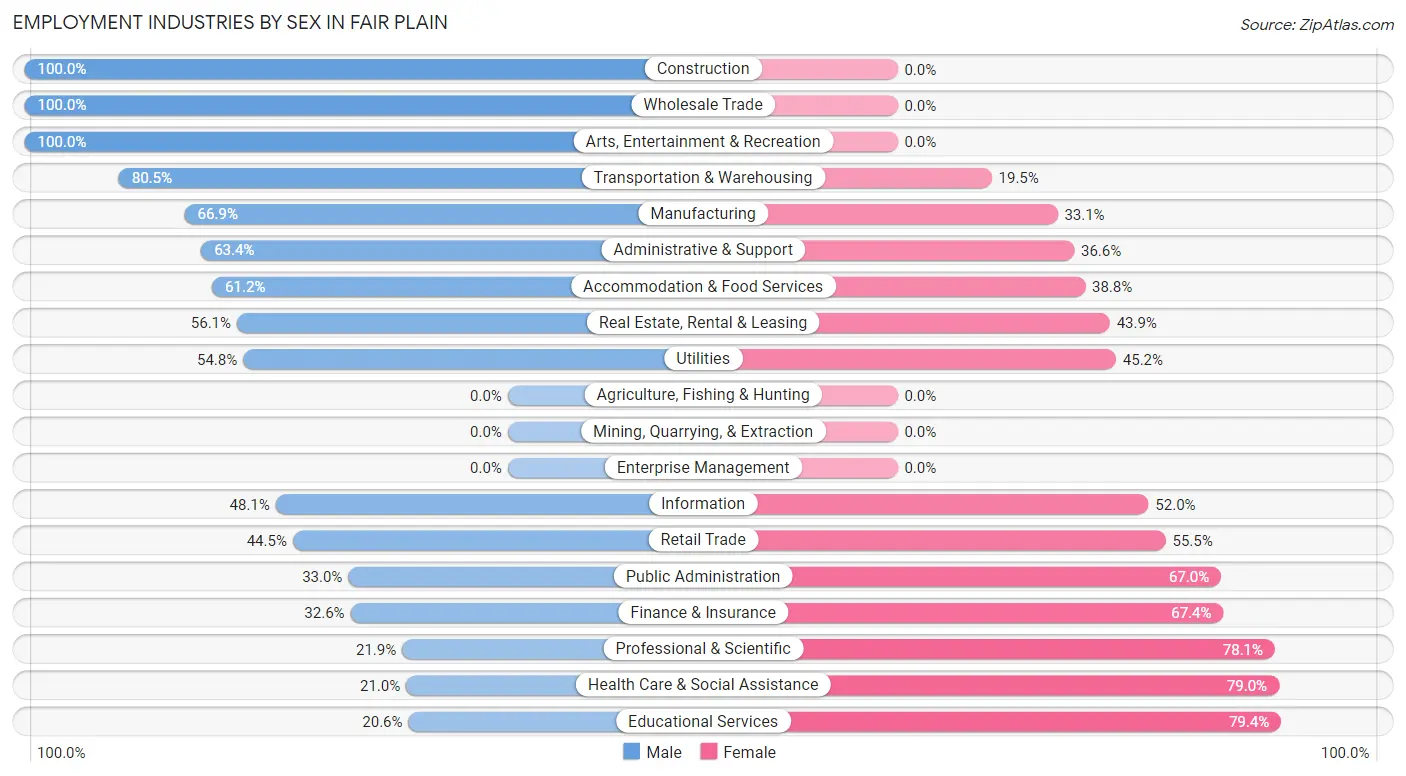
Employment Industries by Sex in Fair Plain
The Fair Plain industries that see more men than women are Construction (100.0%), Wholesale Trade (100.0%), and Arts, Entertainment & Recreation (100.0%), whereas the industries that tend to have a higher number of women are Educational Services (79.4%), Health Care & Social Assistance (79.0%), and Professional & Scientific (78.1%).
| Industry | Male | Female |
| Agriculture, Fishing & Hunting | 0 (0.0%) | 0 (0.0%) |
| Mining, Quarrying, & Extraction | 0 (0.0%) | 0 (0.0%) |
| Construction | 91 (100.0%) | 0 (0.0%) |
| Manufacturing | 410 (66.9%) | 203 (33.1%) |
| Wholesale Trade | 22 (100.0%) | 0 (0.0%) |
| Retail Trade | 174 (44.5%) | 217 (55.5%) |
| Transportation & Warehousing | 128 (80.5%) | 31 (19.5%) |
| Utilities | 80 (54.8%) | 66 (45.2%) |
| Information | 37 (48.0%) | 40 (51.9%) |
| Finance & Insurance | 14 (32.6%) | 29 (67.4%) |
| Real Estate, Rental & Leasing | 37 (56.1%) | 29 (43.9%) |
| Professional & Scientific | 7 (21.9%) | 25 (78.1%) |
| Enterprise Management | 0 (0.0%) | 0 (0.0%) |
| Administrative & Support | 59 (63.4%) | 34 (36.6%) |
| Educational Services | 36 (20.6%) | 139 (79.4%) |
| Health Care & Social Assistance | 73 (21.0%) | 274 (79.0%) |
| Arts, Entertainment & Recreation | 35 (100.0%) | 0 (0.0%) |
| Accommodation & Food Services | 189 (61.2%) | 120 (38.8%) |
| Public Administration | 35 (33.0%) | 71 (67.0%) |
| Total | 1,518 (54.2%) | 1,284 (45.8%) |
Education in Fair Plain
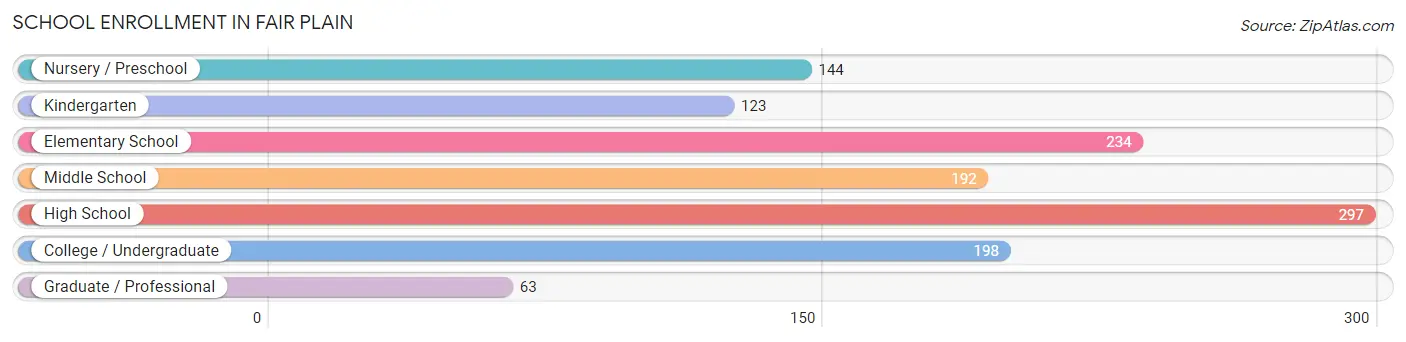
School Enrollment in Fair Plain
The most common levels of schooling among the 1,251 students in Fair Plain are high school (297 | 23.7%), elementary school (234 | 18.7%), and college / undergraduate (198 | 15.8%).
| School Level | # Students | % Students |
| Nursery / Preschool | 144 | 11.5% |
| Kindergarten | 123 | 9.8% |
| Elementary School | 234 | 18.7% |
| Middle School | 192 | 15.3% |
| High School | 297 | 23.7% |
| College / Undergraduate | 198 | 15.8% |
| Graduate / Professional | 63 | 5.0% |
| Total | 1,251 | 100.0% |
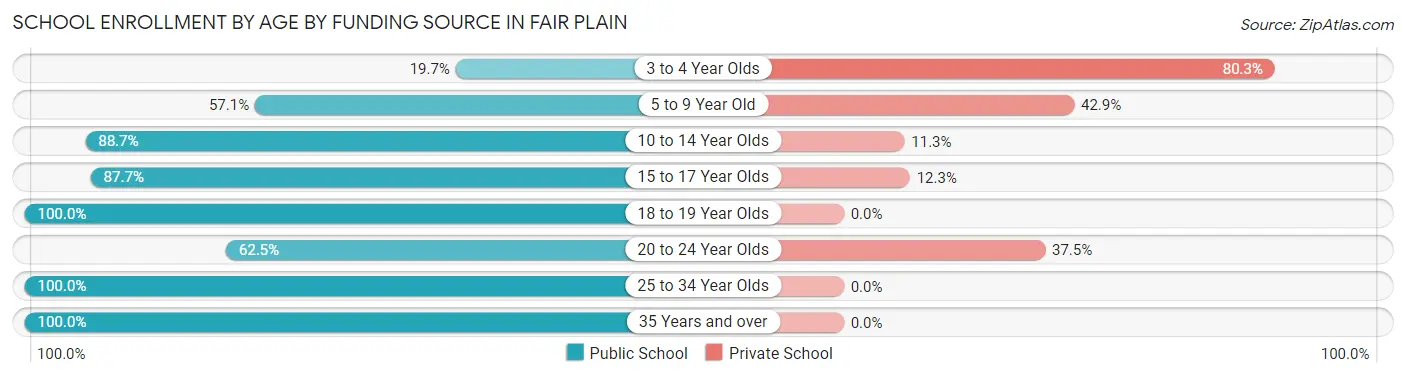
School Enrollment by Age by Funding Source in Fair Plain
Out of a total of 1,251 students who are enrolled in schools in Fair Plain, 348 (27.8%) attend a private institution, while the remaining 903 (72.2%) are enrolled in public schools. The age group of 3 to 4 year olds has the highest likelihood of being enrolled in private schools, with 163 (80.3% in the age bracket) enrolled. Conversely, the age group of 18 to 19 year olds has the lowest likelihood of being enrolled in a private school, with 53 (100.0% in the age bracket) attending a public institution.
| Age Bracket | Public School | Private School |
| 3 to 4 Year Olds | 40 (19.7%) | 163 (80.3%) |
| 5 to 9 Year Old | 153 (57.1%) | 115 (42.9%) |
| 10 to 14 Year Olds | 243 (88.7%) | 31 (11.3%) |
| 15 to 17 Year Olds | 171 (87.7%) | 24 (12.3%) |
| 18 to 19 Year Olds | 53 (100.0%) | 0 (0.0%) |
| 20 to 24 Year Olds | 25 (62.5%) | 15 (37.5%) |
| 25 to 34 Year Olds | 136 (100.0%) | 0 (0.0%) |
| 35 Years and over | 82 (100.0%) | 0 (0.0%) |
| Total | 903 (72.2%) | 348 (27.8%) |
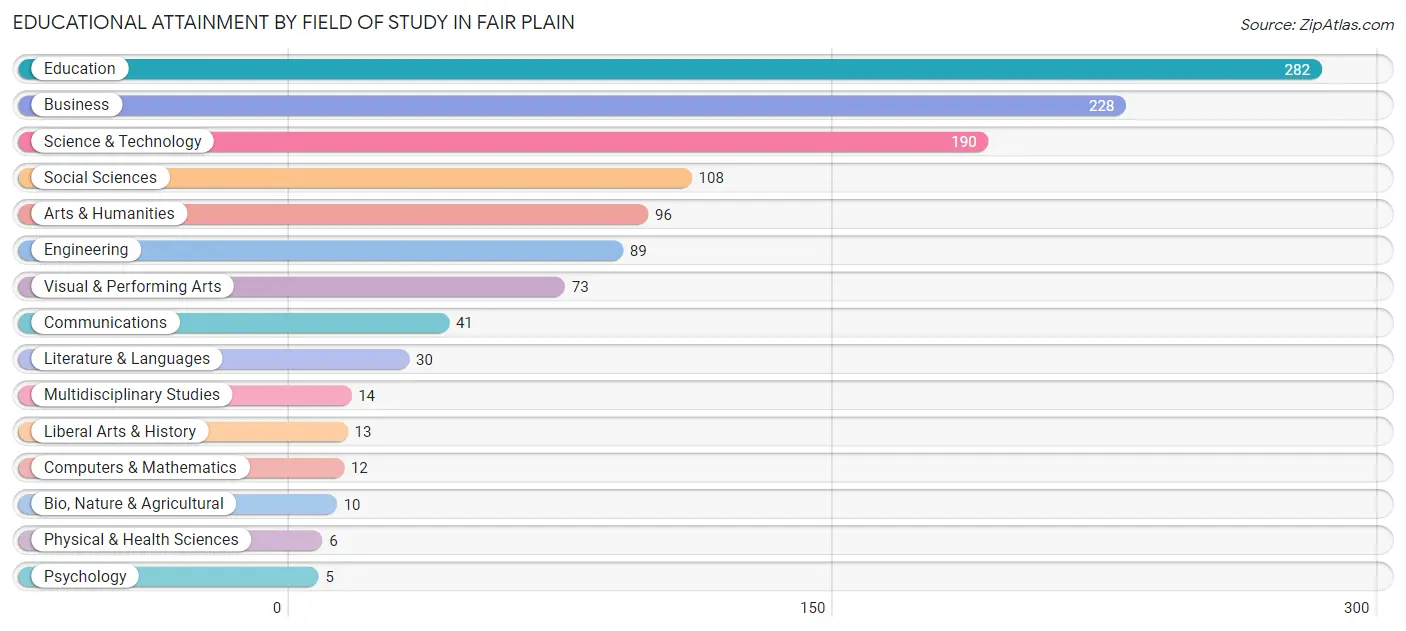
Educational Attainment by Field of Study in Fair Plain
Education (282 | 23.6%), business (228 | 19.1%), science & technology (190 | 15.9%), social sciences (108 | 9.0%), and arts & humanities (96 | 8.0%) are the most common fields of study among 1,197 individuals in Fair Plain who have obtained a bachelor's degree or higher.
| Field of Study | # Graduates | % Graduates |
| Computers & Mathematics | 12 | 1.0% |
| Bio, Nature & Agricultural | 10 | 0.8% |
| Physical & Health Sciences | 6 | 0.5% |
| Psychology | 5 | 0.4% |
| Social Sciences | 108 | 9.0% |
| Engineering | 89 | 7.4% |
| Multidisciplinary Studies | 14 | 1.2% |
| Science & Technology | 190 | 15.9% |
| Business | 228 | 19.1% |
| Education | 282 | 23.6% |
| Literature & Languages | 30 | 2.5% |
| Liberal Arts & History | 13 | 1.1% |
| Visual & Performing Arts | 73 | 6.1% |
| Communications | 41 | 3.4% |
| Arts & Humanities | 96 | 8.0% |
| Total | 1,197 | 100.0% |
Transportation & Commute in Fair Plain
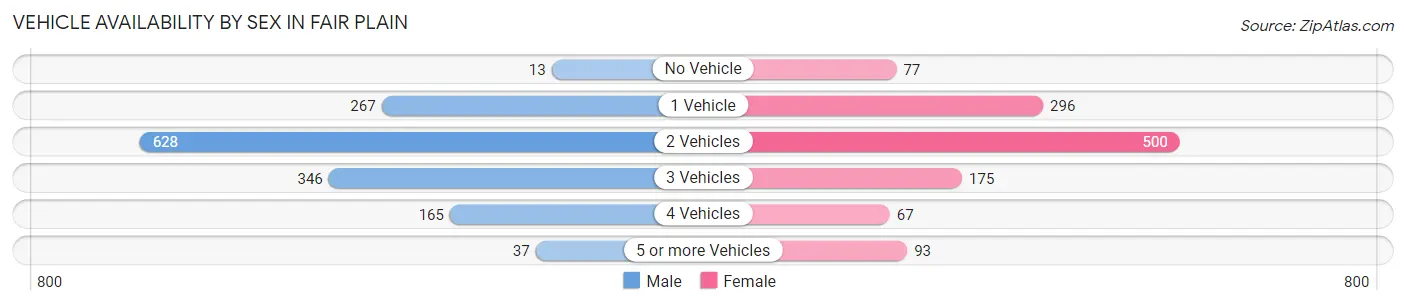
Vehicle Availability by Sex in Fair Plain
The most prevalent vehicle ownership categories in Fair Plain are males with 2 vehicles (628, accounting for 43.1%) and females with 2 vehicles (500, making up 52.0%).
| Vehicles Available | Male | Female |
| No Vehicle | 13 (0.9%) | 77 (6.4%) |
| 1 Vehicle | 267 (18.3%) | 296 (24.5%) |
| 2 Vehicles | 628 (43.1%) | 500 (41.4%) |
| 3 Vehicles | 346 (23.8%) | 175 (14.5%) |
| 4 Vehicles | 165 (11.3%) | 67 (5.6%) |
| 5 or more Vehicles | 37 (2.5%) | 93 (7.7%) |
| Total | 1,456 (100.0%) | 1,208 (100.0%) |
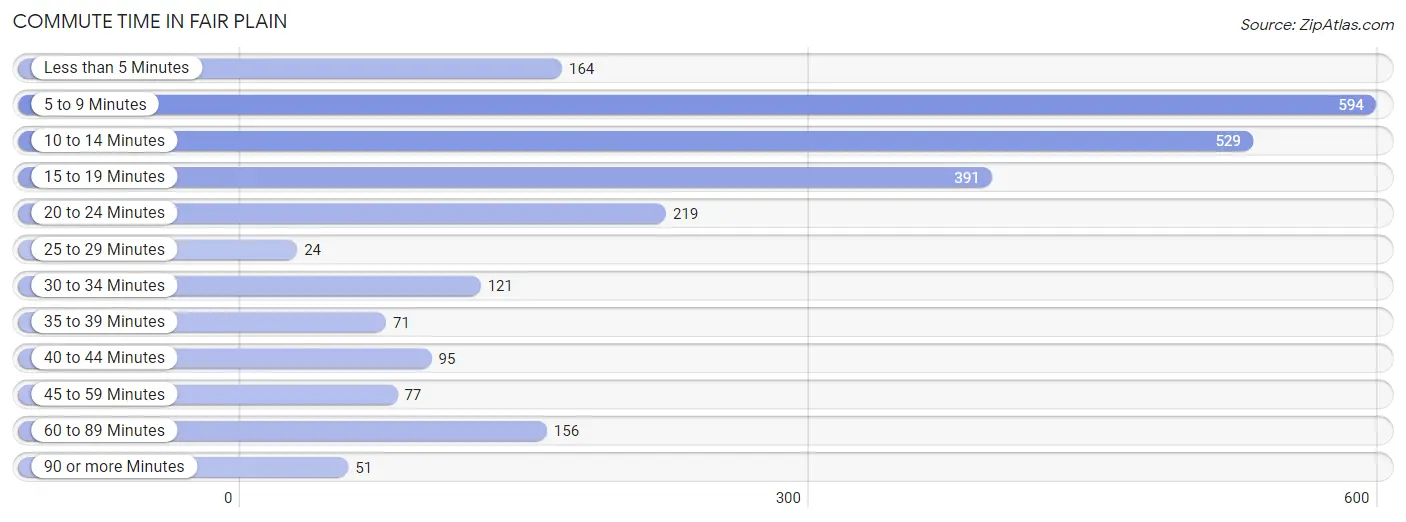
Commute Time in Fair Plain
The most frequently occuring commute durations in Fair Plain are 5 to 9 minutes (594 commuters, 23.8%), 10 to 14 minutes (529 commuters, 21.2%), and 15 to 19 minutes (391 commuters, 15.7%).
| Commute Time | # Commuters | % Commuters |
| Less than 5 Minutes | 164 | 6.6% |
| 5 to 9 Minutes | 594 | 23.8% |
| 10 to 14 Minutes | 529 | 21.2% |
| 15 to 19 Minutes | 391 | 15.7% |
| 20 to 24 Minutes | 219 | 8.8% |
| 25 to 29 Minutes | 24 | 1.0% |
| 30 to 34 Minutes | 121 | 4.9% |
| 35 to 39 Minutes | 71 | 2.9% |
| 40 to 44 Minutes | 95 | 3.8% |
| 45 to 59 Minutes | 77 | 3.1% |
| 60 to 89 Minutes | 156 | 6.3% |
| 90 or more Minutes | 51 | 2.1% |
Commute Time by Sex in Fair Plain
The most common commute times in Fair Plain are 10 to 14 minutes (386 commuters, 28.5%) for males and 5 to 9 minutes (367 commuters, 32.3%) for females.
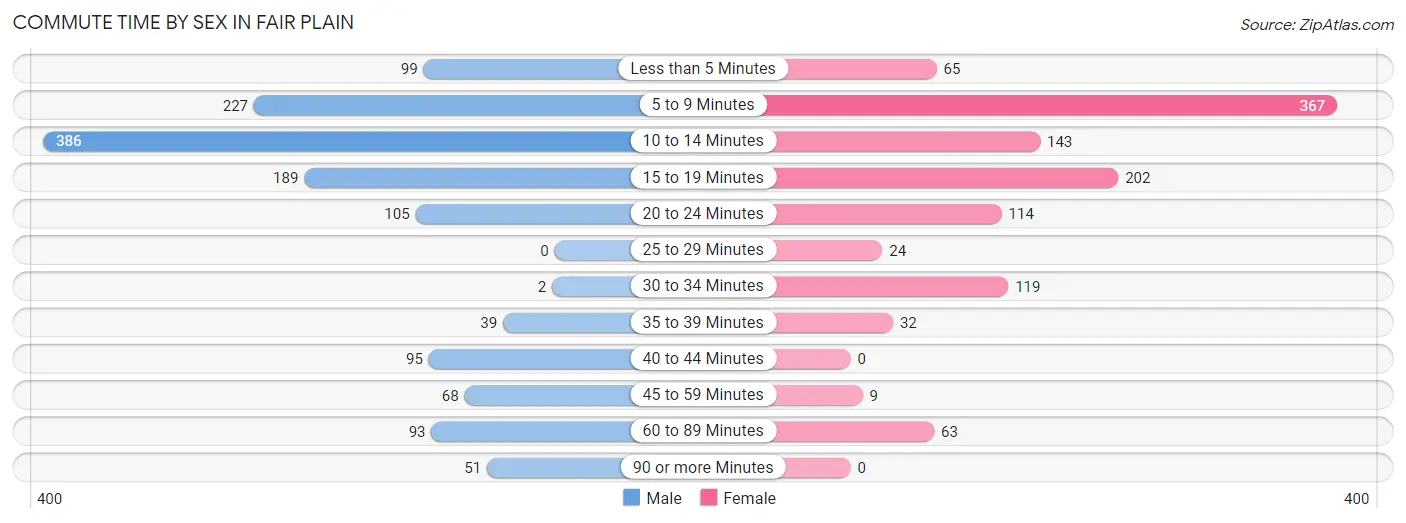
| Commute Time | Male | Female |
| Less than 5 Minutes | 99 (7.3%) | 65 (5.7%) |
| 5 to 9 Minutes | 227 (16.8%) | 367 (32.3%) |
| 10 to 14 Minutes | 386 (28.5%) | 143 (12.6%) |
| 15 to 19 Minutes | 189 (14.0%) | 202 (17.7%) |
| 20 to 24 Minutes | 105 (7.7%) | 114 (10.0%) |
| 25 to 29 Minutes | 0 (0.0%) | 24 (2.1%) |
| 30 to 34 Minutes | 2 (0.2%) | 119 (10.5%) |
| 35 to 39 Minutes | 39 (2.9%) | 32 (2.8%) |
| 40 to 44 Minutes | 95 (7.0%) | 0 (0.0%) |
| 45 to 59 Minutes | 68 (5.0%) | 9 (0.8%) |
| 60 to 89 Minutes | 93 (6.9%) | 63 (5.5%) |
| 90 or more Minutes | 51 (3.8%) | 0 (0.0%) |
Time of Departure to Work by Sex in Fair Plain
The most frequent times of departure to work in Fair Plain are 7:30 AM to 7:59 AM (191, 14.1%) for males and 7:30 AM to 7:59 AM (163, 14.3%) for females.
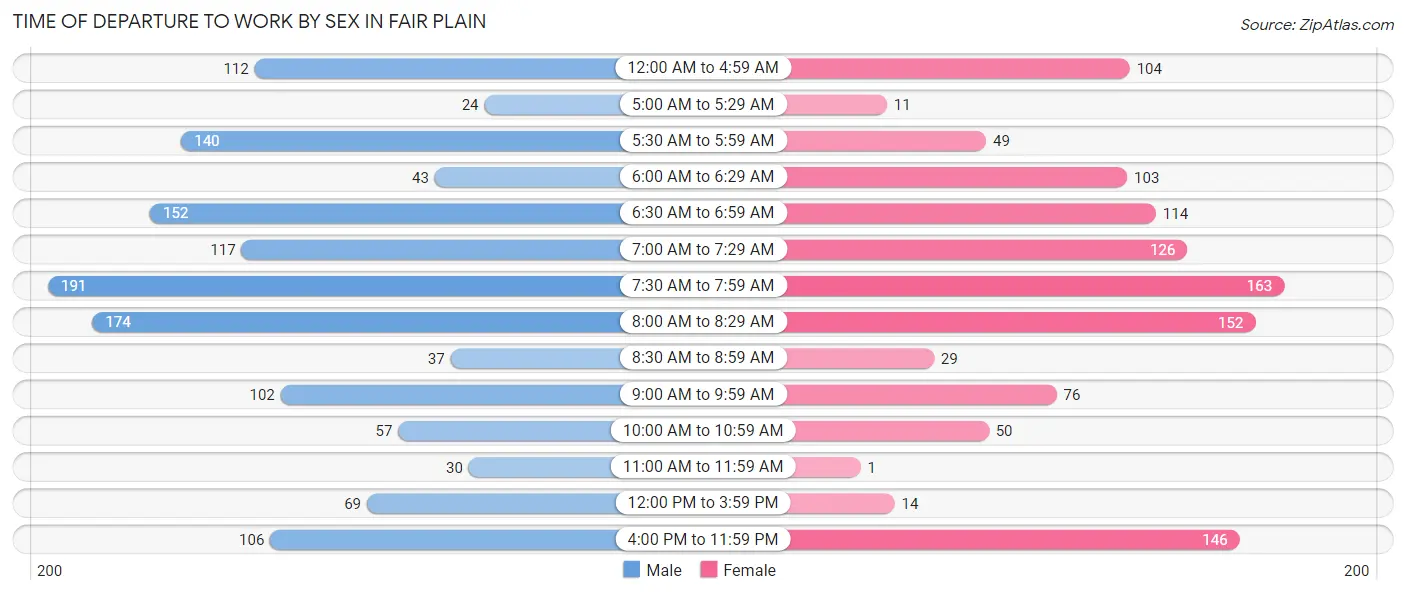
| Time of Departure | Male | Female |
| 12:00 AM to 4:59 AM | 112 (8.3%) | 104 (9.1%) |
| 5:00 AM to 5:29 AM | 24 (1.8%) | 11 (1.0%) |
| 5:30 AM to 5:59 AM | 140 (10.3%) | 49 (4.3%) |
| 6:00 AM to 6:29 AM | 43 (3.2%) | 103 (9.0%) |
| 6:30 AM to 6:59 AM | 152 (11.2%) | 114 (10.0%) |
| 7:00 AM to 7:29 AM | 117 (8.6%) | 126 (11.1%) |
| 7:30 AM to 7:59 AM | 191 (14.1%) | 163 (14.3%) |
| 8:00 AM to 8:29 AM | 174 (12.9%) | 152 (13.4%) |
| 8:30 AM to 8:59 AM | 37 (2.7%) | 29 (2.5%) |
| 9:00 AM to 9:59 AM | 102 (7.5%) | 76 (6.7%) |
| 10:00 AM to 10:59 AM | 57 (4.2%) | 50 (4.4%) |
| 11:00 AM to 11:59 AM | 30 (2.2%) | 1 (0.1%) |
| 12:00 PM to 3:59 PM | 69 (5.1%) | 14 (1.2%) |
| 4:00 PM to 11:59 PM | 106 (7.8%) | 146 (12.8%) |
| Total | 1,354 (100.0%) | 1,138 (100.0%) |
Housing Occupancy in Fair Plain
Occupancy by Ownership in Fair Plain
Of the total 3,012 dwellings in Fair Plain, owner-occupied units account for 2,177 (72.3%), while renter-occupied units make up 835 (27.7%).
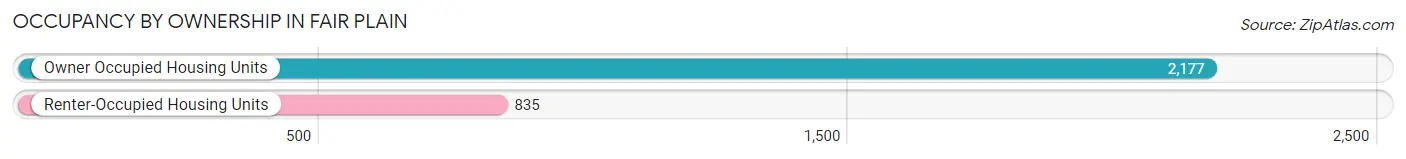
| Occupancy | # Housing Units | % Housing Units |
| Owner Occupied Housing Units | 2,177 | 72.3% |
| Renter-Occupied Housing Units | 835 | 27.7% |
| Total Occupied Housing Units | 3,012 | 100.0% |
Occupancy by Household Size in Fair Plain
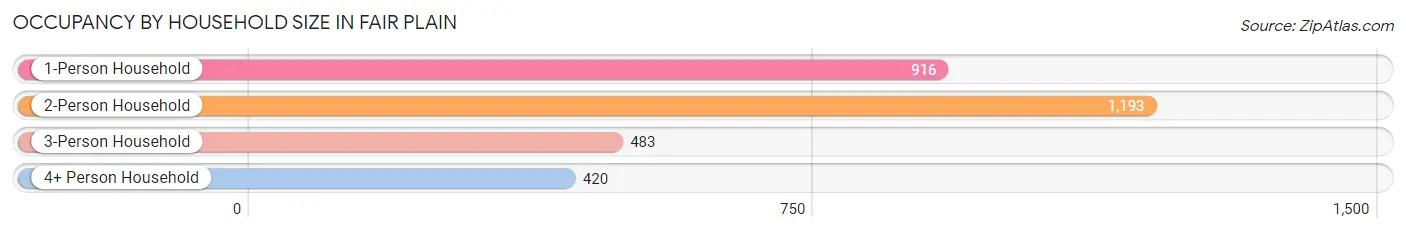
| Household Size | # Housing Units | % Housing Units |
| 1-Person Household | 916 | 30.4% |
| 2-Person Household | 1,193 | 39.6% |
| 3-Person Household | 483 | 16.0% |
| 4+ Person Household | 420 | 13.9% |
| Total Housing Units | 3,012 | 100.0% |
Occupancy by Ownership by Household Size in Fair Plain
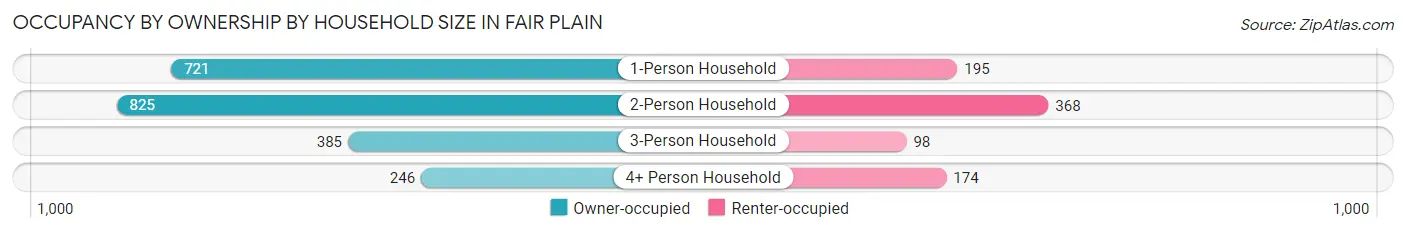
| Household Size | Owner-occupied | Renter-occupied |
| 1-Person Household | 721 (78.7%) | 195 (21.3%) |
| 2-Person Household | 825 (69.2%) | 368 (30.8%) |
| 3-Person Household | 385 (79.7%) | 98 (20.3%) |
| 4+ Person Household | 246 (58.6%) | 174 (41.4%) |
| Total Housing Units | 2,177 (72.3%) | 835 (27.7%) |
Occupancy by Educational Attainment in Fair Plain
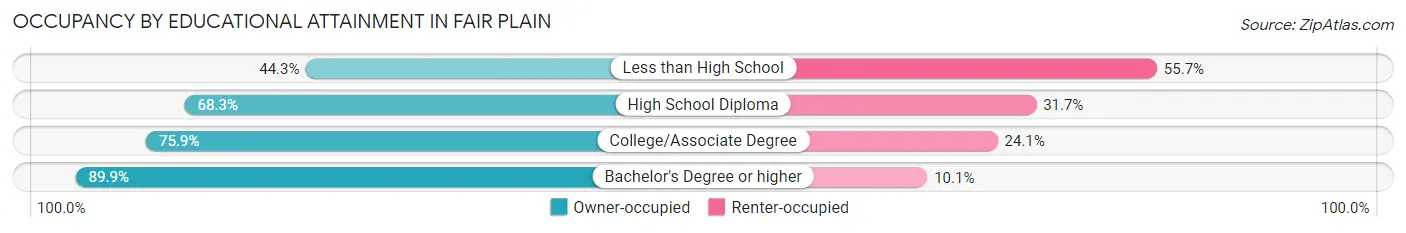
| Household Size | Owner-occupied | Renter-occupied |
| Less than High School | 196 (44.3%) | 246 (55.7%) |
| High School Diploma | 581 (68.3%) | 270 (31.7%) |
| College/Associate Degree | 788 (75.9%) | 250 (24.1%) |
| Bachelor's Degree or higher | 612 (89.9%) | 69 (10.1%) |
Occupancy by Age of Householder in Fair Plain
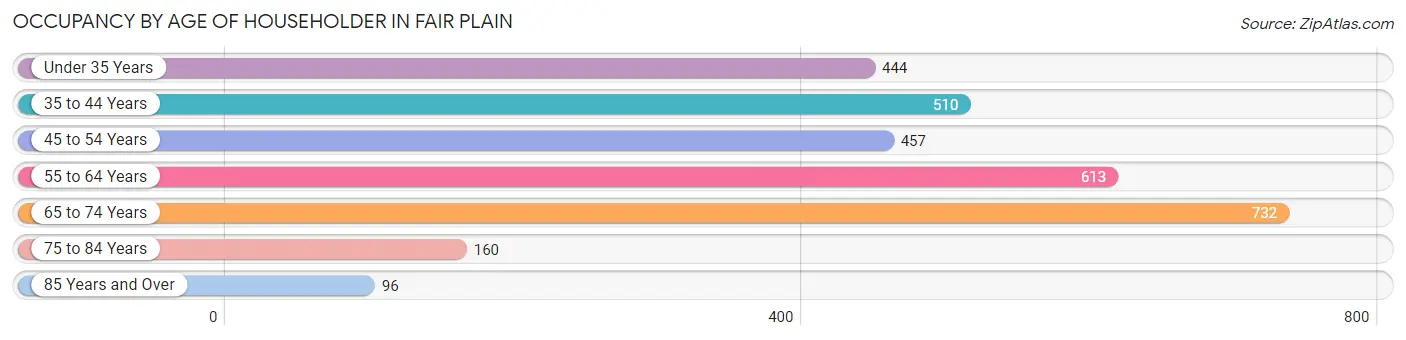
| Age Bracket | # Households | % Households |
| Under 35 Years | 444 | 14.7% |
| 35 to 44 Years | 510 | 16.9% |
| 45 to 54 Years | 457 | 15.2% |
| 55 to 64 Years | 613 | 20.3% |
| 65 to 74 Years | 732 | 24.3% |
| 75 to 84 Years | 160 | 5.3% |
| 85 Years and Over | 96 | 3.2% |
| Total | 3,012 | 100.0% |
Housing Finances in Fair Plain
Median Income by Occupancy in Fair Plain
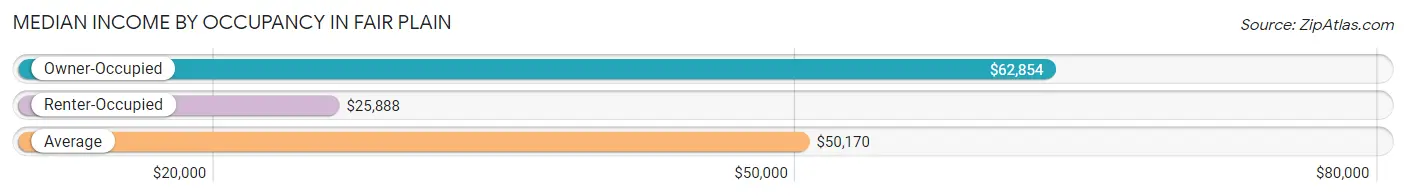
| Occupancy Type | # Households | Median Income |
| Owner-Occupied | 2,177 (72.3%) | $62,854 |
| Renter-Occupied | 835 (27.7%) | $25,888 |
| Average | 3,012 (100.0%) | $50,170 |
Occupancy by Householder Income Bracket in Fair Plain
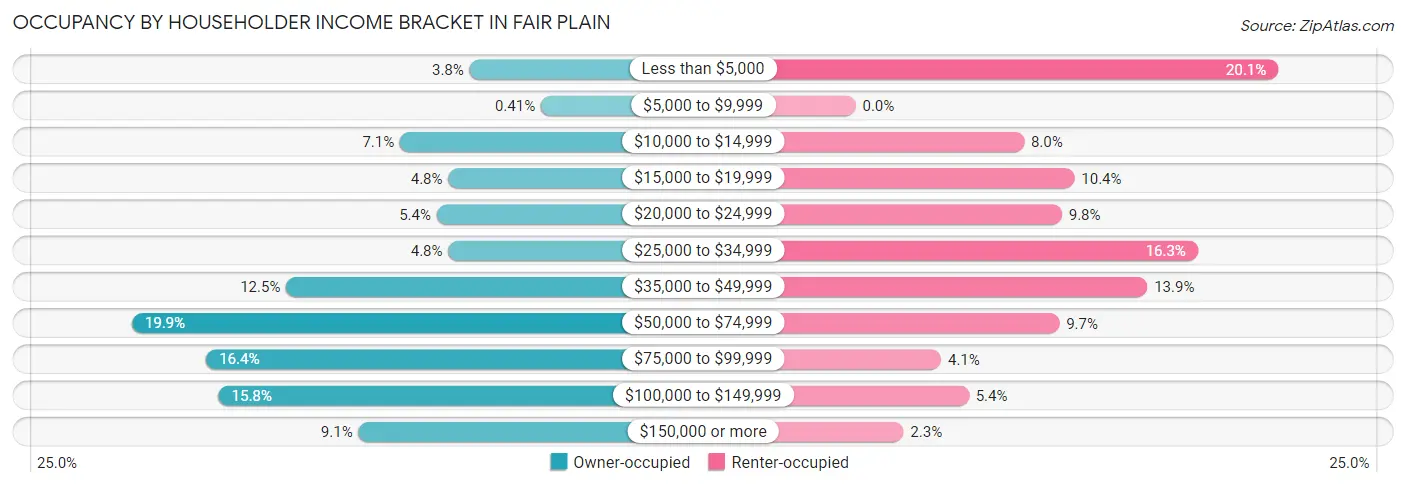
| Income Bracket | Owner-occupied | Renter-occupied |
| Less than $5,000 | 83 (3.8%) | 168 (20.1%) |
| $5,000 to $9,999 | 9 (0.4%) | 0 (0.0%) |
| $10,000 to $14,999 | 155 (7.1%) | 67 (8.0%) |
| $15,000 to $19,999 | 105 (4.8%) | 87 (10.4%) |
| $20,000 to $24,999 | 117 (5.4%) | 82 (9.8%) |
| $25,000 to $34,999 | 105 (4.8%) | 136 (16.3%) |
| $35,000 to $49,999 | 273 (12.5%) | 116 (13.9%) |
| $50,000 to $74,999 | 433 (19.9%) | 81 (9.7%) |
| $75,000 to $99,999 | 356 (16.4%) | 34 (4.1%) |
| $100,000 to $149,999 | 343 (15.8%) | 45 (5.4%) |
| $150,000 or more | 198 (9.1%) | 19 (2.3%) |
| Total | 2,177 (100.0%) | 835 (100.0%) |
Monthly Housing Cost Tiers in Fair Plain
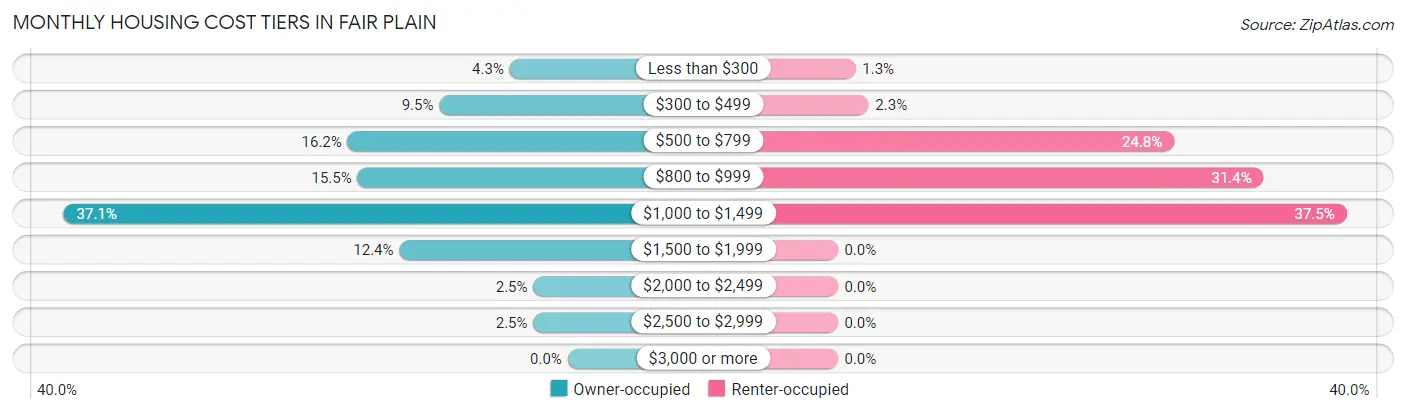
| Monthly Cost | Owner-occupied | Renter-occupied |
| Less than $300 | 93 (4.3%) | 11 (1.3%) |
| $300 to $499 | 206 (9.5%) | 19 (2.3%) |
| $500 to $799 | 353 (16.2%) | 207 (24.8%) |
| $800 to $999 | 337 (15.5%) | 262 (31.4%) |
| $1,000 to $1,499 | 808 (37.1%) | 313 (37.5%) |
| $1,500 to $1,999 | 270 (12.4%) | 0 (0.0%) |
| $2,000 to $2,499 | 55 (2.5%) | 0 (0.0%) |
| $2,500 to $2,999 | 55 (2.5%) | 0 (0.0%) |
| $3,000 or more | 0 (0.0%) | 0 (0.0%) |
| Total | 2,177 (100.0%) | 835 (100.0%) |
Physical Housing Characteristics in Fair Plain
Housing Structures in Fair Plain
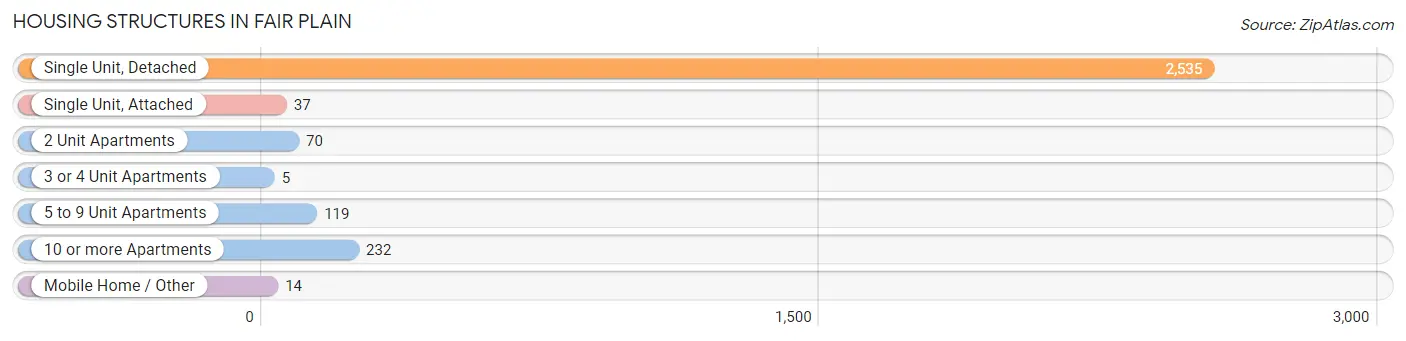
| Structure Type | # Housing Units | % Housing Units |
| Single Unit, Detached | 2,535 | 84.2% |
| Single Unit, Attached | 37 | 1.2% |
| 2 Unit Apartments | 70 | 2.3% |
| 3 or 4 Unit Apartments | 5 | 0.2% |
| 5 to 9 Unit Apartments | 119 | 4.0% |
| 10 or more Apartments | 232 | 7.7% |
| Mobile Home / Other | 14 | 0.5% |
| Total | 3,012 | 100.0% |
Housing Structures by Occupancy in Fair Plain
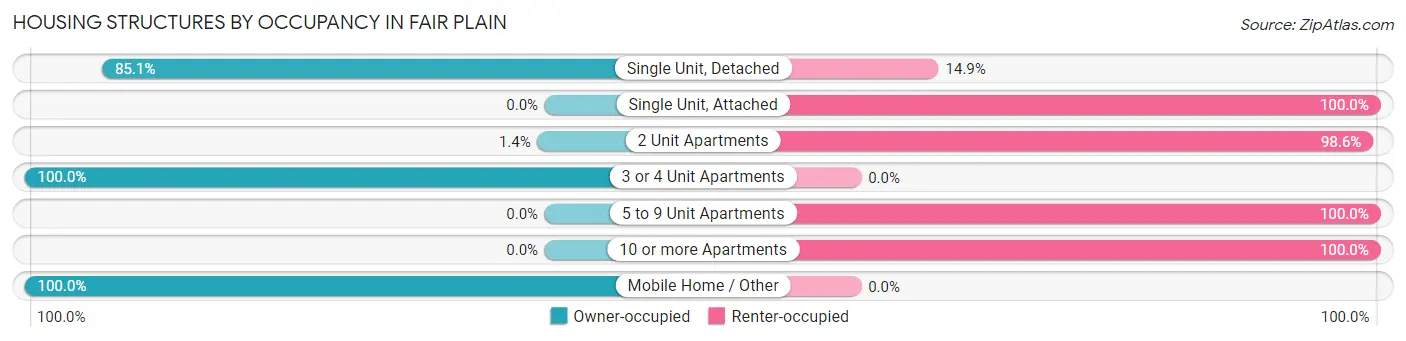
| Structure Type | Owner-occupied | Renter-occupied |
| Single Unit, Detached | 2,157 (85.1%) | 378 (14.9%) |
| Single Unit, Attached | 0 (0.0%) | 37 (100.0%) |
| 2 Unit Apartments | 1 (1.4%) | 69 (98.6%) |
| 3 or 4 Unit Apartments | 5 (100.0%) | 0 (0.0%) |
| 5 to 9 Unit Apartments | 0 (0.0%) | 119 (100.0%) |
| 10 or more Apartments | 0 (0.0%) | 232 (100.0%) |
| Mobile Home / Other | 14 (100.0%) | 0 (0.0%) |
| Total | 2,177 (72.3%) | 835 (27.7%) |
Housing Structures by Number of Rooms in Fair Plain
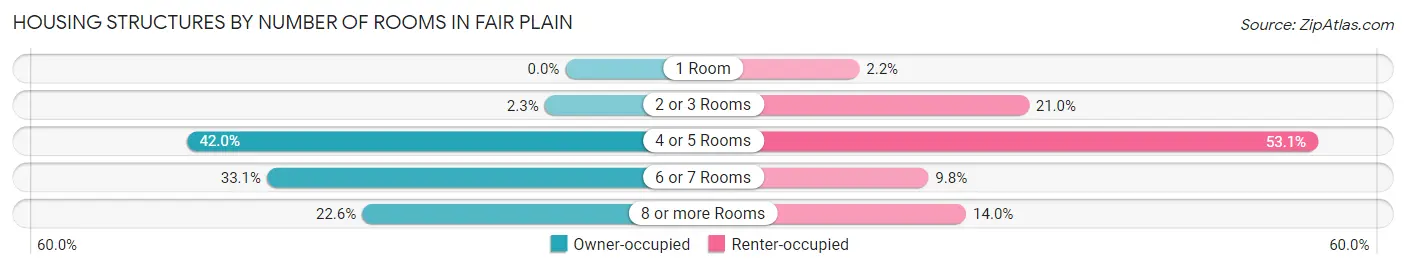
| Number of Rooms | Owner-occupied | Renter-occupied |
| 1 Room | 0 (0.0%) | 18 (2.2%) |
| 2 or 3 Rooms | 50 (2.3%) | 175 (21.0%) |
| 4 or 5 Rooms | 915 (42.0%) | 443 (53.0%) |
| 6 or 7 Rooms | 721 (33.1%) | 82 (9.8%) |
| 8 or more Rooms | 491 (22.6%) | 117 (14.0%) |
| Total | 2,177 (100.0%) | 835 (100.0%) |
Housing Structure by Heating Type in Fair Plain
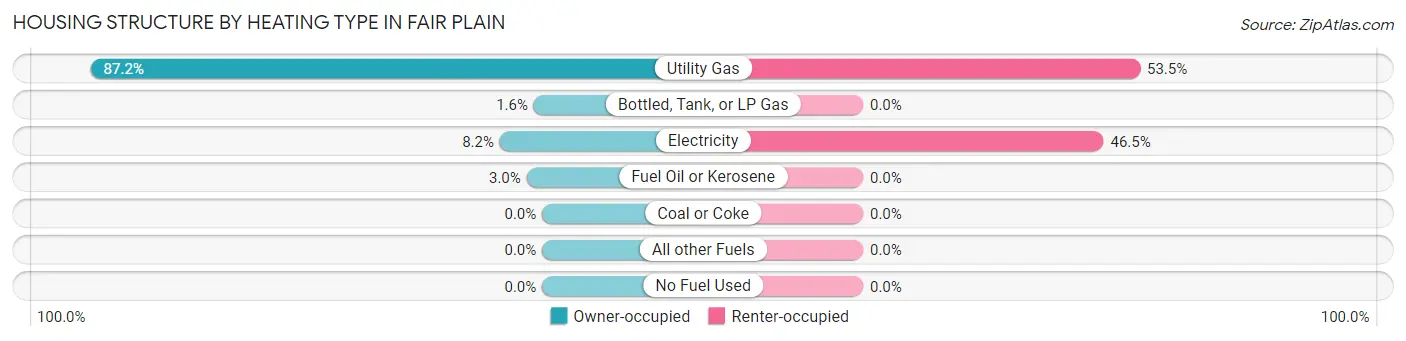
| Heating Type | Owner-occupied | Renter-occupied |
| Utility Gas | 1,899 (87.2%) | 447 (53.5%) |
| Bottled, Tank, or LP Gas | 35 (1.6%) | 0 (0.0%) |
| Electricity | 178 (8.2%) | 388 (46.5%) |
| Fuel Oil or Kerosene | 65 (3.0%) | 0 (0.0%) |
| Coal or Coke | 0 (0.0%) | 0 (0.0%) |
| All other Fuels | 0 (0.0%) | 0 (0.0%) |
| No Fuel Used | 0 (0.0%) | 0 (0.0%) |
| Total | 2,177 (100.0%) | 835 (100.0%) |
Household Vehicle Usage in Fair Plain
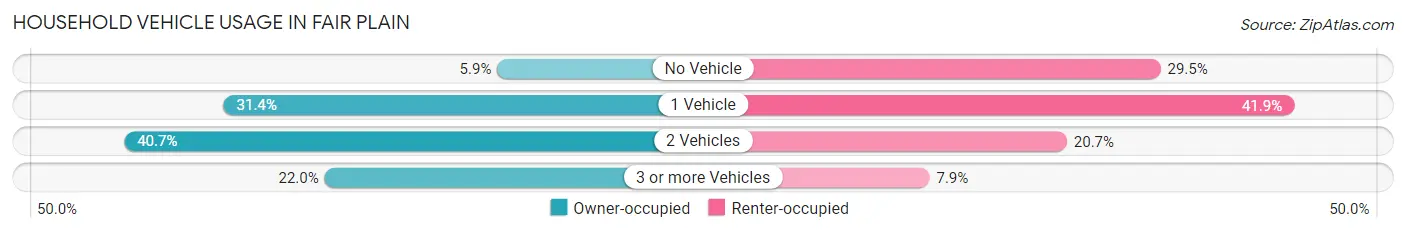
| Vehicles per Household | Owner-occupied | Renter-occupied |
| No Vehicle | 128 (5.9%) | 246 (29.5%) |
| 1 Vehicle | 684 (31.4%) | 350 (41.9%) |
| 2 Vehicles | 886 (40.7%) | 173 (20.7%) |
| 3 or more Vehicles | 479 (22.0%) | 66 (7.9%) |
| Total | 2,177 (100.0%) | 835 (100.0%) |
Real Estate & Mortgages in Fair Plain
Real Estate and Mortgage Overview in Fair Plain
| Characteristic | Without Mortgage | With Mortgage |
| Housing Units | 439 | 1,738 |
| Median Property Value | $106,000 | $146,800 |
| Median Household Income | $49,511 | $190 |
| Monthly Housing Costs | $415 | $0 |
| Real Estate Taxes | $1,674 | $61 |
Property Value by Mortgage Status in Fair Plain
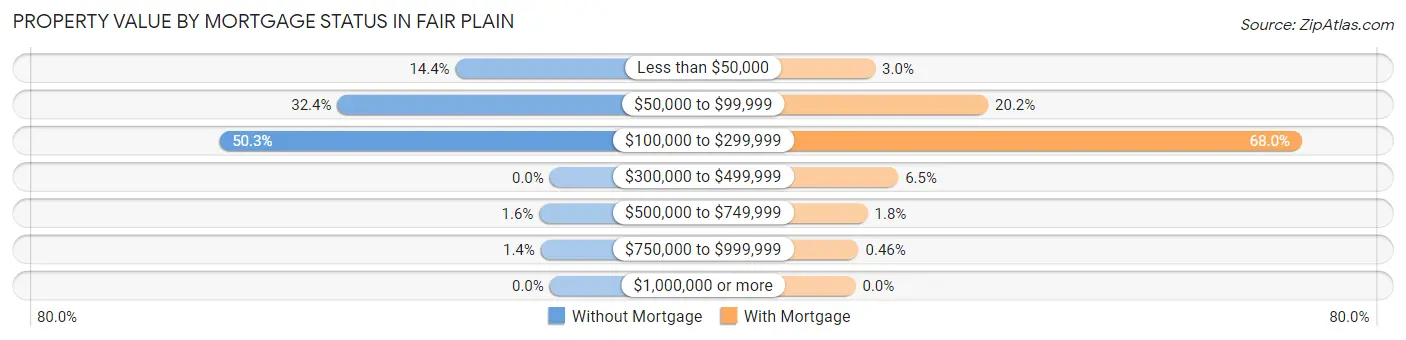
| Property Value | Without Mortgage | With Mortgage |
| Less than $50,000 | 63 (14.3%) | 52 (3.0%) |
| $50,000 to $99,999 | 142 (32.4%) | 351 (20.2%) |
| $100,000 to $299,999 | 221 (50.3%) | 1,182 (68.0%) |
| $300,000 to $499,999 | 0 (0.0%) | 113 (6.5%) |
| $500,000 to $749,999 | 7 (1.6%) | 32 (1.8%) |
| $750,000 to $999,999 | 6 (1.4%) | 8 (0.5%) |
| $1,000,000 or more | 0 (0.0%) | 0 (0.0%) |
| Total | 439 (100.0%) | 1,738 (100.0%) |
Household Income by Mortgage Status in Fair Plain
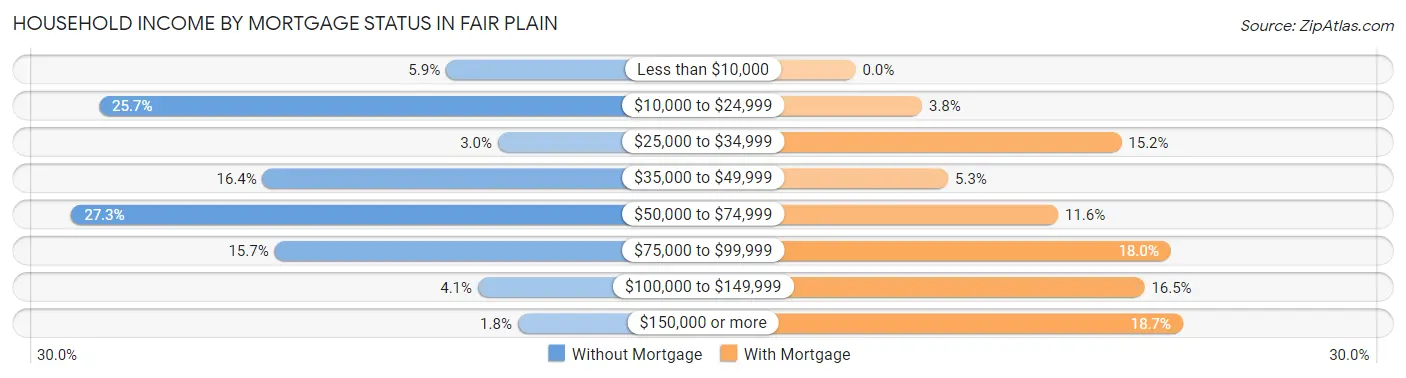
| Household Income | Without Mortgage | With Mortgage |
| Less than $10,000 | 26 (5.9%) | 0 (0.0%) |
| $10,000 to $24,999 | 113 (25.7%) | 66 (3.8%) |
| $25,000 to $34,999 | 13 (3.0%) | 264 (15.2%) |
| $35,000 to $49,999 | 72 (16.4%) | 92 (5.3%) |
| $50,000 to $74,999 | 120 (27.3%) | 201 (11.6%) |
| $75,000 to $99,999 | 69 (15.7%) | 313 (18.0%) |
| $100,000 to $149,999 | 18 (4.1%) | 287 (16.5%) |
| $150,000 or more | 8 (1.8%) | 325 (18.7%) |
| Total | 439 (100.0%) | 1,738 (100.0%) |
Property Value to Household Income Ratio in Fair Plain
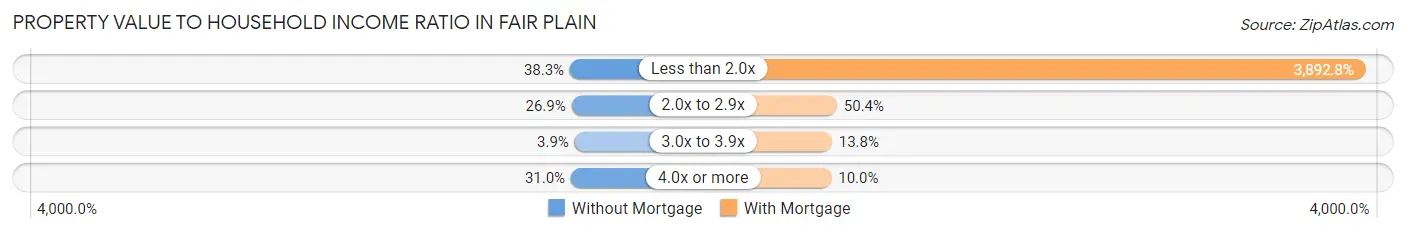
| Value-to-Income Ratio | Without Mortgage | With Mortgage |
| Less than 2.0x | 168 (38.3%) | 67,656 (3,892.8%) |
| 2.0x to 2.9x | 118 (26.9%) | 876 (50.4%) |
| 3.0x to 3.9x | 17 (3.9%) | 239 (13.8%) |
| 4.0x or more | 136 (31.0%) | 173 (10.0%) |
| Total | 439 (100.0%) | 1,738 (100.0%) |
Real Estate Taxes by Mortgage Status in Fair Plain
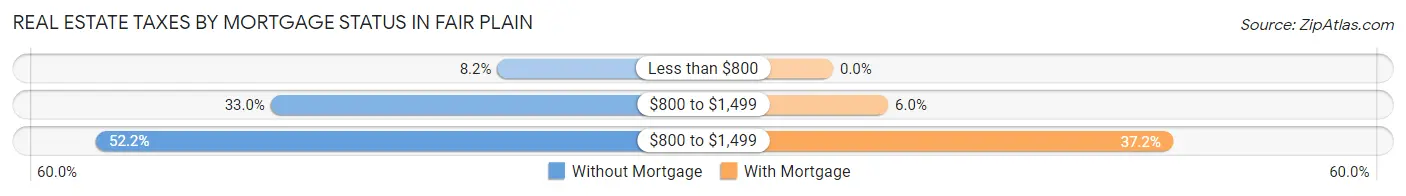
| Property Taxes | Without Mortgage | With Mortgage |
| Less than $800 | 36 (8.2%) | 0 (0.0%) |
| $800 to $1,499 | 145 (33.0%) | 105 (6.0%) |
| $800 to $1,499 | 229 (52.2%) | 647 (37.2%) |
| Total | 439 (100.0%) | 1,738 (100.0%) |
Health & Disability in Fair Plain
Health Insurance Coverage by Age in Fair Plain
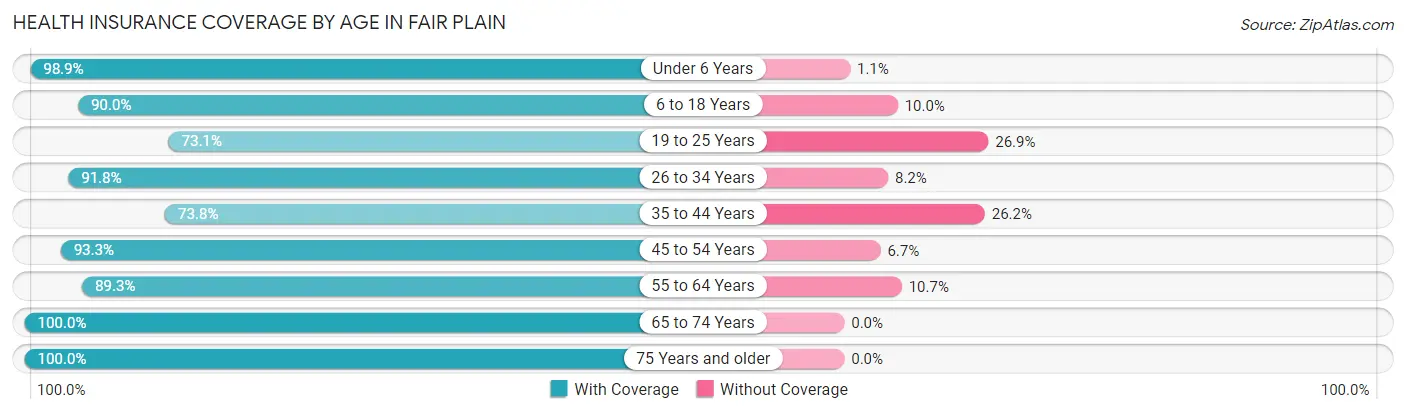
| Age Bracket | With Coverage | Without Coverage |
| Under 6 Years | 556 (98.9%) | 6 (1.1%) |
| 6 to 18 Years | 687 (90.0%) | 76 (10.0%) |
| 19 to 25 Years | 335 (73.1%) | 123 (26.9%) |
| 26 to 34 Years | 855 (91.8%) | 76 (8.2%) |
| 35 to 44 Years | 614 (73.8%) | 218 (26.2%) |
| 45 to 54 Years | 830 (93.3%) | 60 (6.7%) |
| 55 to 64 Years | 859 (89.3%) | 103 (10.7%) |
| 65 to 74 Years | 1,047 (100.0%) | 0 (0.0%) |
| 75 Years and older | 437 (100.0%) | 0 (0.0%) |
| Total | 6,220 (90.4%) | 662 (9.6%) |
Health Insurance Coverage by Citizenship Status in Fair Plain
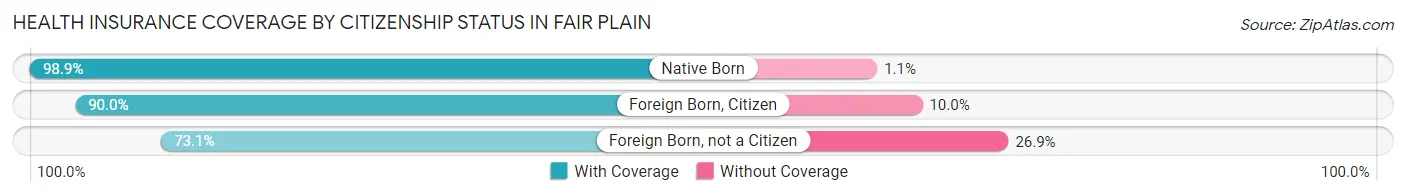
| Citizenship Status | With Coverage | Without Coverage |
| Native Born | 556 (98.9%) | 6 (1.1%) |
| Foreign Born, Citizen | 687 (90.0%) | 76 (10.0%) |
| Foreign Born, not a Citizen | 335 (73.1%) | 123 (26.9%) |
Health Insurance Coverage by Household Income in Fair Plain
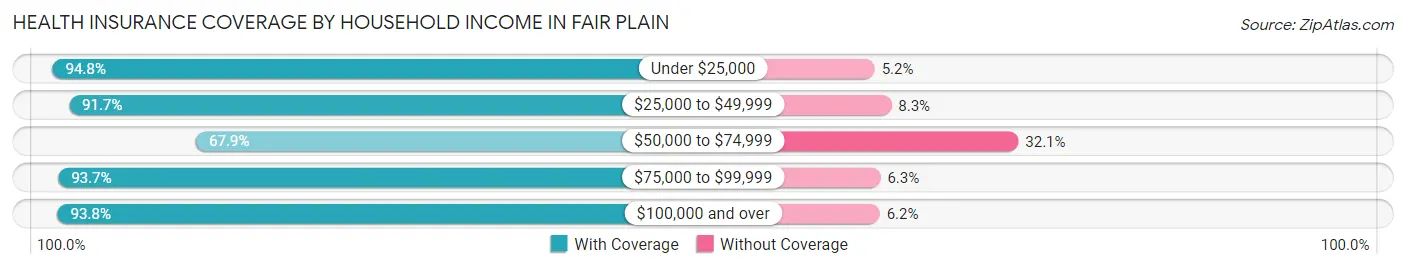
| Household Income | With Coverage | Without Coverage |
| Under $25,000 | 1,590 (94.8%) | 88 (5.2%) |
| $25,000 to $49,999 | 1,220 (91.7%) | 111 (8.3%) |
| $50,000 to $74,999 | 587 (67.9%) | 278 (32.1%) |
| $75,000 to $99,999 | 906 (93.7%) | 61 (6.3%) |
| $100,000 and over | 1,887 (93.8%) | 124 (6.2%) |
Public vs Private Health Insurance Coverage by Age in Fair Plain
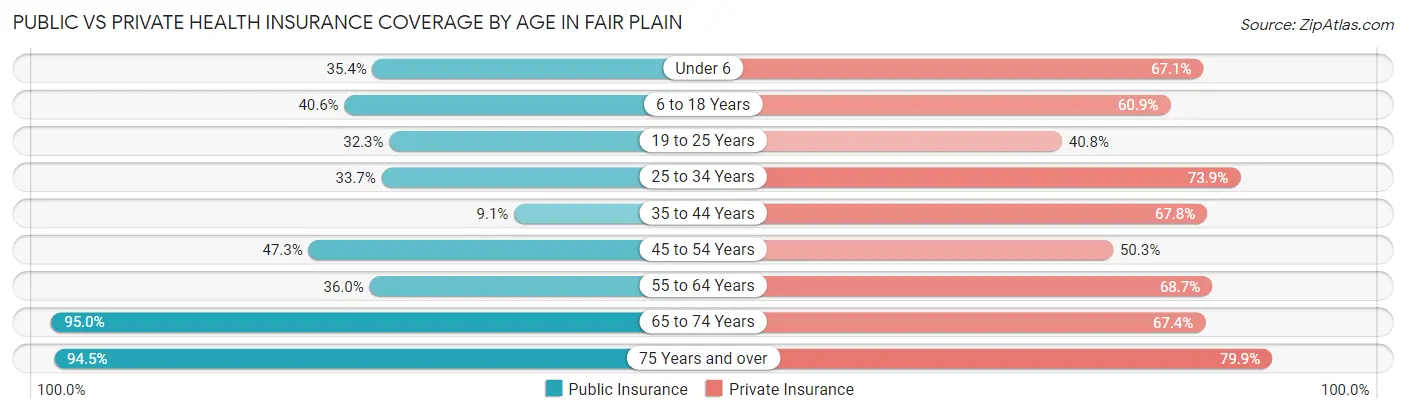
| Age Bracket | Public Insurance | Private Insurance |
| Under 6 | 199 (35.4%) | 377 (67.1%) |
| 6 to 18 Years | 310 (40.6%) | 465 (60.9%) |
| 19 to 25 Years | 148 (32.3%) | 187 (40.8%) |
| 25 to 34 Years | 314 (33.7%) | 688 (73.9%) |
| 35 to 44 Years | 76 (9.1%) | 564 (67.8%) |
| 45 to 54 Years | 421 (47.3%) | 448 (50.3%) |
| 55 to 64 Years | 346 (36.0%) | 661 (68.7%) |
| 65 to 74 Years | 995 (95.0%) | 706 (67.4%) |
| 75 Years and over | 413 (94.5%) | 349 (79.9%) |
| Total | 3,222 (46.8%) | 4,445 (64.6%) |
Disability Status by Sex by Age in Fair Plain
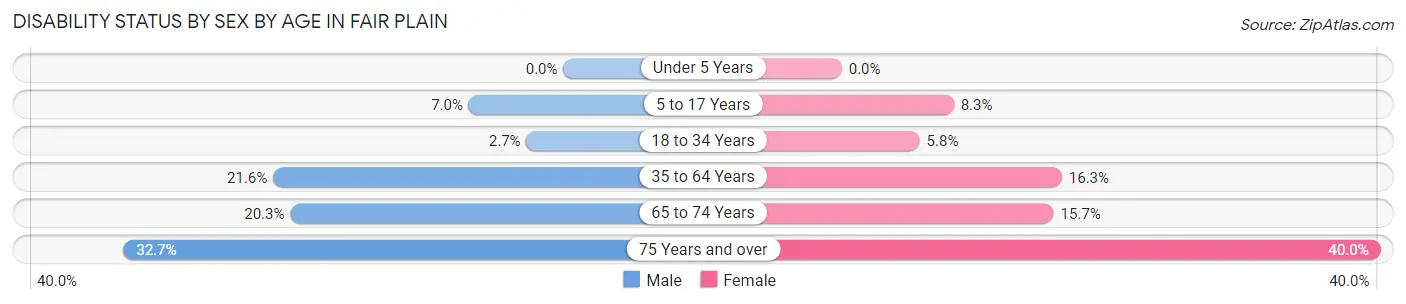
| Age Bracket | Male | Female |
| Under 5 Years | 0 (0.0%) | 0 (0.0%) |
| 5 to 17 Years | 29 (7.0%) | 33 (8.3%) |
| 18 to 34 Years | 23 (2.7%) | 36 (5.8%) |
| 35 to 64 Years | 242 (21.5%) | 255 (16.3%) |
| 65 to 74 Years | 104 (20.3%) | 84 (15.7%) |
| 75 Years and over | 66 (32.7%) | 94 (40.0%) |
Disability Class by Sex by Age in Fair Plain
Disability Class: Hearing Difficulty
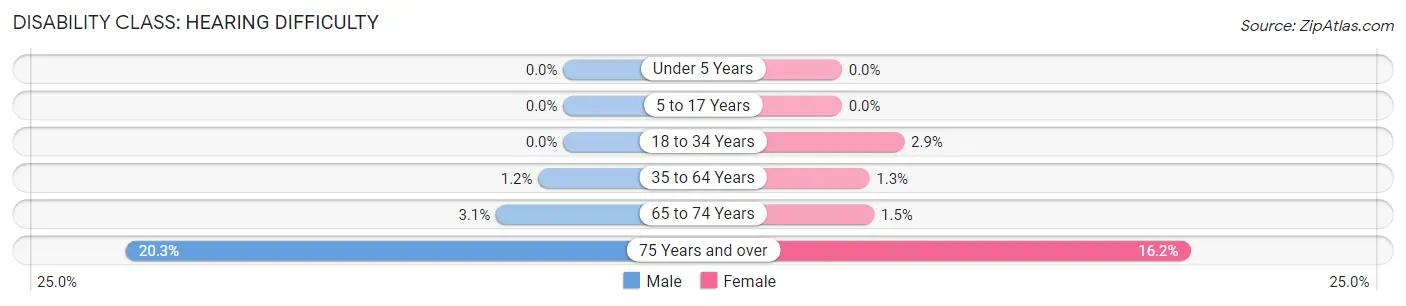
| Age Bracket | Male | Female |
| Under 5 Years | 0 (0.0%) | 0 (0.0%) |
| 5 to 17 Years | 0 (0.0%) | 0 (0.0%) |
| 18 to 34 Years | 0 (0.0%) | 18 (2.9%) |
| 35 to 64 Years | 13 (1.2%) | 20 (1.3%) |
| 65 to 74 Years | 16 (3.1%) | 8 (1.5%) |
| 75 Years and over | 41 (20.3%) | 38 (16.2%) |
Disability Class: Vision Difficulty
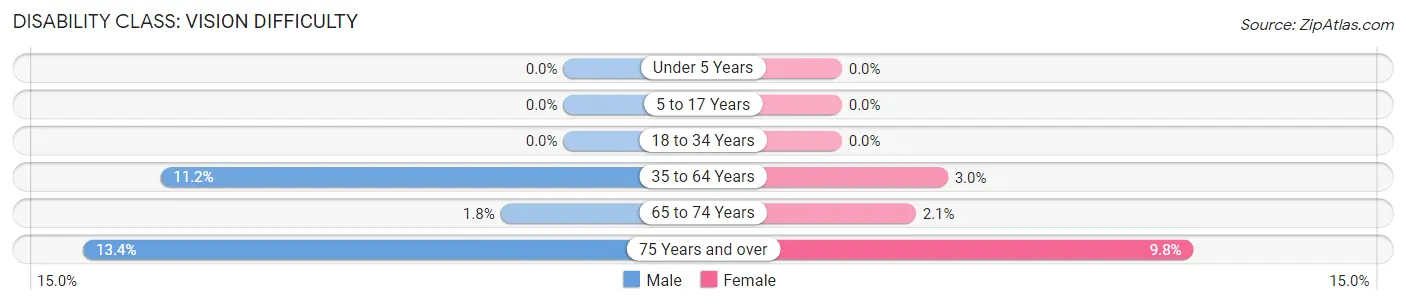
| Age Bracket | Male | Female |
| Under 5 Years | 0 (0.0%) | 0 (0.0%) |
| 5 to 17 Years | 0 (0.0%) | 0 (0.0%) |
| 18 to 34 Years | 0 (0.0%) | 0 (0.0%) |
| 35 to 64 Years | 126 (11.2%) | 46 (2.9%) |
| 65 to 74 Years | 9 (1.8%) | 11 (2.1%) |
| 75 Years and over | 27 (13.4%) | 23 (9.8%) |
Disability Class: Cognitive Difficulty
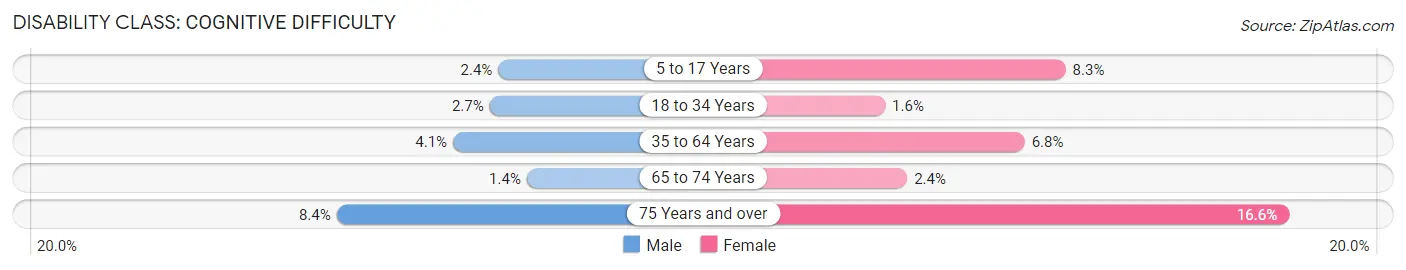
| Age Bracket | Male | Female |
| 5 to 17 Years | 10 (2.4%) | 33 (8.3%) |
| 18 to 34 Years | 23 (2.7%) | 10 (1.6%) |
| 35 to 64 Years | 46 (4.1%) | 106 (6.8%) |
| 65 to 74 Years | 7 (1.4%) | 13 (2.4%) |
| 75 Years and over | 17 (8.4%) | 39 (16.6%) |
Disability Class: Ambulatory Difficulty
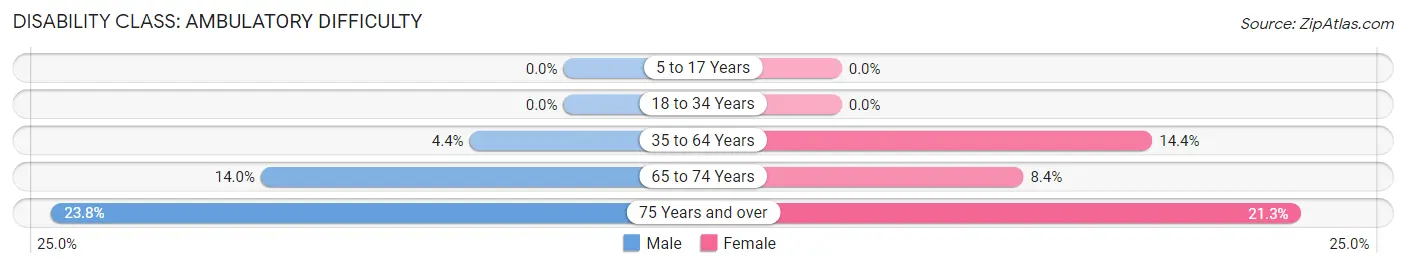
| Age Bracket | Male | Female |
| 5 to 17 Years | 0 (0.0%) | 0 (0.0%) |
| 18 to 34 Years | 0 (0.0%) | 0 (0.0%) |
| 35 to 64 Years | 49 (4.4%) | 225 (14.4%) |
| 65 to 74 Years | 72 (14.0%) | 45 (8.4%) |
| 75 Years and over | 48 (23.8%) | 50 (21.3%) |
Disability Class: Self-Care Difficulty
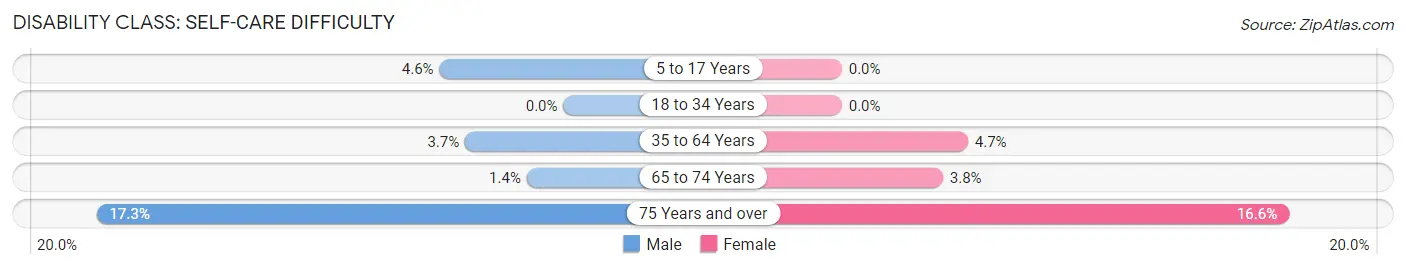
| Age Bracket | Male | Female |
| 5 to 17 Years | 19 (4.6%) | 0 (0.0%) |
| 18 to 34 Years | 0 (0.0%) | 0 (0.0%) |
| 35 to 64 Years | 41 (3.6%) | 73 (4.7%) |
| 65 to 74 Years | 7 (1.4%) | 20 (3.7%) |
| 75 Years and over | 35 (17.3%) | 39 (16.6%) |
Technology Access in Fair Plain
Computing Device Access in Fair Plain
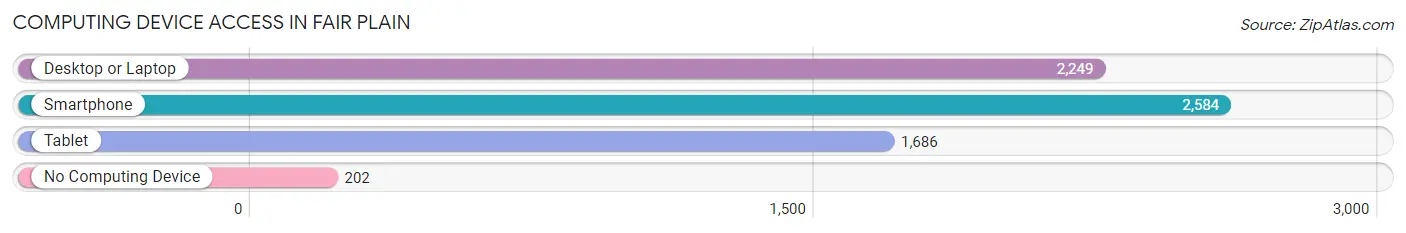
| Device Type | # Households | % Households |
| Desktop or Laptop | 2,249 | 74.7% |
| Smartphone | 2,584 | 85.8% |
| Tablet | 1,686 | 56.0% |
| No Computing Device | 202 | 6.7% |
| Total | 3,012 | 100.0% |
Internet Access in Fair Plain
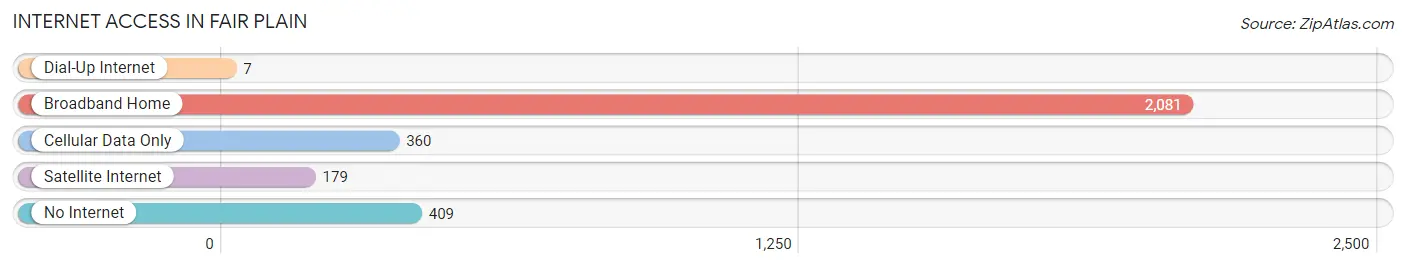
| Internet Type | # Households | % Households |
| Dial-Up Internet | 7 | 0.2% |
| Broadband Home | 2,081 | 69.1% |
| Cellular Data Only | 360 | 11.9% |
| Satellite Internet | 179 | 5.9% |
| No Internet | 409 | 13.6% |
| Total | 3,012 | 100.0% |
Fair Plain Summary
History
Fair Plain is a small unincorporated community located in Berrien County, Michigan. It is situated on the banks of the St. Joseph River, just south of the city of Benton Harbor. The area was first settled in the early 1800s by a group of French-Canadian fur traders. The settlement was originally known as “L’Anse à la Croix”, which translates to “Cross Bay”. The name was changed to Fair Plain in 1837, when the first post office was established.
The area was primarily agricultural in the early days, with the main crops being wheat, corn, and potatoes. The area was also known for its apple orchards, which were planted in the late 1800s. The area was also home to a number of small businesses, including a sawmill, a grist mill, and a blacksmith shop.
In the early 1900s, the area began to experience a period of growth and development. The first school was built in 1906, and the first church was built in 1908. The area also saw the construction of a number of homes, as well as a number of businesses, including a general store, a bank, and a hotel.
The area continued to grow and develop throughout the 20th century. In the 1950s, the area saw the construction of a number of new homes, as well as a number of new businesses. The area also saw the construction of a number of new churches, as well as a number of new schools.
Geography
Fair Plain is located in Berrien County, Michigan. It is situated on the banks of the St. Joseph River, just south of the city of Benton Harbor. The area is primarily flat, with some rolling hills in the area. The area is also home to a number of small lakes and ponds, as well as a number of creeks and streams.
The area is home to a number of parks and recreational areas, including the Fair Plain Nature Preserve, which is a protected area of wetlands and woodlands. The area is also home to a number of golf courses, as well as a number of public parks.
Economy
The economy of Fair Plain is primarily based on agriculture and tourism. The area is home to a number of farms, which produce a variety of crops, including wheat, corn, and potatoes. The area is also home to a number of apple orchards, which produce a variety of apples.
The area is also home to a number of small businesses, including a number of restaurants, retail stores, and service businesses. The area is also home to a number of manufacturing businesses, which produce a variety of products, including furniture, clothing, and automotive parts.
Demographics
As of the 2010 census, the population of Fair Plain was 1,845. The population is primarily white, with a small percentage of African Americans, Hispanics, and Asians. The median household income in the area is $37,000, and the median home value is $90,000. The area is served by a number of public schools, as well as a number of private schools.
Common Questions
What is Per Capita Income in Fair Plain?
Per Capita income in Fair Plain is $27,648.
What is the Median Family Income in Fair Plain?
Median Family Income in Fair Plain is $62,325.
What is the Median Household income in Fair Plain?
Median Household Income in Fair Plain is $50,170.
What is Income or Wage Gap in Fair Plain?
Income or Wage Gap in Fair Plain is 42.7%.
Women in Fair Plain earn 57.3 cents for every dollar earned by a man.
What is Inequality or Gini Index in Fair Plain?
Inequality or Gini Index in Fair Plain is 0.44.
What is the Total Population of Fair Plain?
Total Population of Fair Plain is 6,882.
What is the Total Male Population of Fair Plain?
Total Male Population of Fair Plain is 3,306.
What is the Total Female Population of Fair Plain?
Total Female Population of Fair Plain is 3,576.
What is the Ratio of Males per 100 Females in Fair Plain?
There are 92.45 Males per 100 Females in Fair Plain.
What is the Ratio of Females per 100 Males in Fair Plain?
There are 108.17 Females per 100 Males in Fair Plain.
What is the Median Population Age in Fair Plain?
Median Population Age in Fair Plain is 43.7 Years.
What is the Average Family Size in Fair Plain
Average Family Size in Fair Plain is 2.9 People.
What is the Average Household Size in Fair Plain
Average Household Size in Fair Plain is 2.3 People.
How Large is the Labor Force in Fair Plain?
There are 3,526 People in the Labor Forcein in Fair Plain.
What is the Percentage of People in the Labor Force in Fair Plain?
61.1% of People are in the Labor Force in Fair Plain.
What is the Unemployment Rate in Fair Plain?
Unemployment Rate in Fair Plain is 20.5%.