Zip Codes with the Highest Poverty Level Among Children Under the Age of 5 in Maryland
RELATED REPORTS & OPTIONS
Highest Poverty | Child 0-5
Maryland
Compare Zip Codes
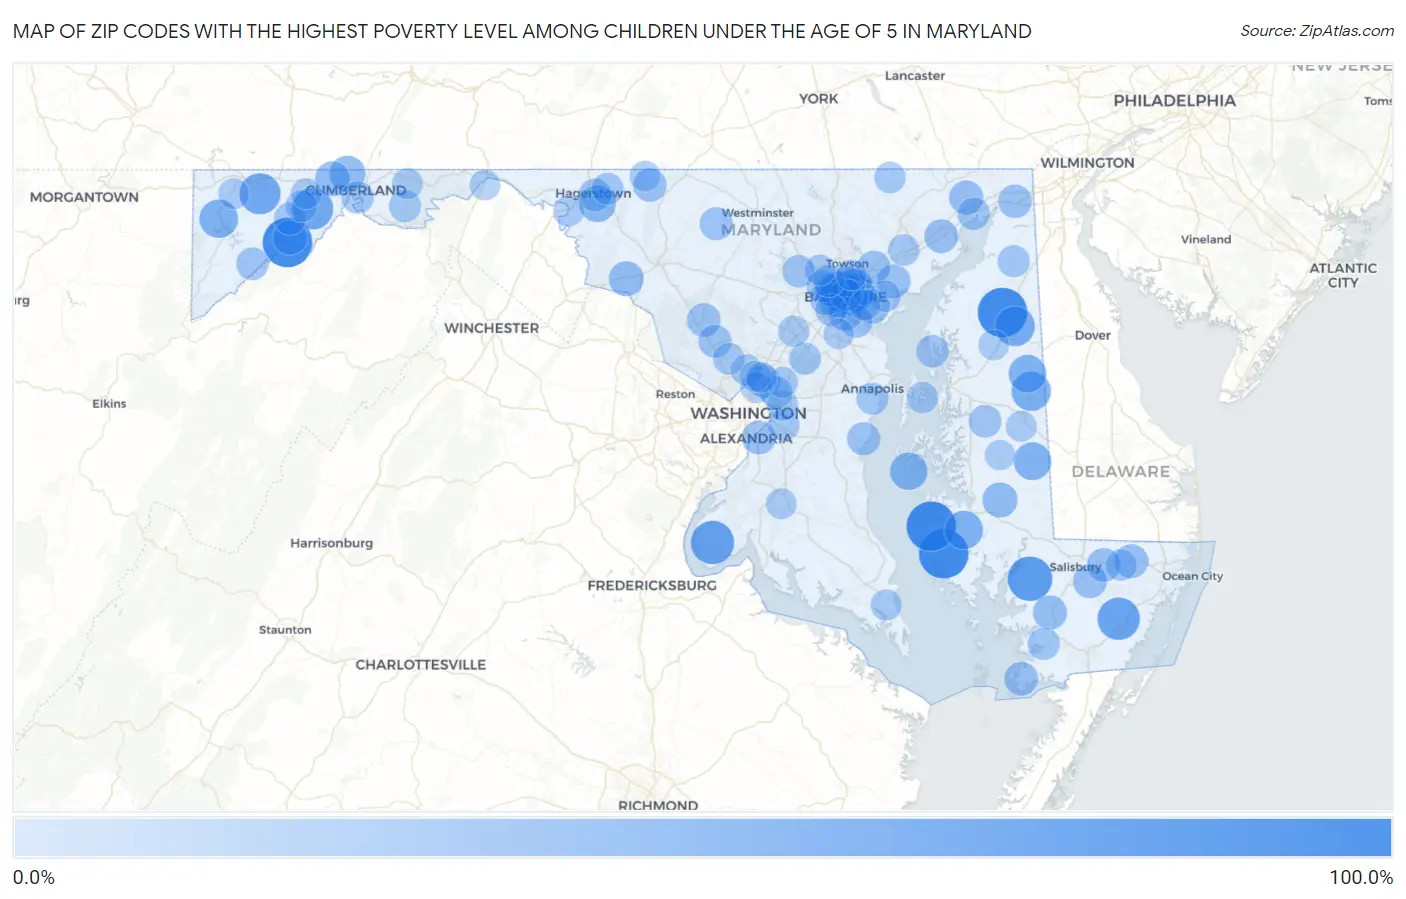
Map of Zip Codes with the Highest Poverty Level Among Children Under the Age of 5 in Maryland
0.0%
100.0%
Zip Codes with the Highest Poverty Level Among Children Under the Age of 5 in Maryland
| Zip Code | Child Poverty | vs State | vs National | |
| 1. | 21628 | 100.0% | 12.3%(+87.7)#1 | 18.1%(+81.9)#302 |
| 2. | 21622 | 100.0% | 12.3%(+87.7)#2 | 18.1%(+81.9)#309 |
| 3. | 21648 | 100.0% | 12.3%(+87.7)#3 | 18.1%(+81.9)#435 |
| 4. | 21540 | 100.0% | 12.3%(+87.7)#4 | 18.1%(+81.9)#514 |
| 5. | 21856 | 77.4% | 12.3%(+65.1)#5 | 18.1%(+59.3)#888 |
| 6. | 20662 | 71.1% | 12.3%(+58.8)#6 | 18.1%(+53.0)#1,112 |
| 7. | 21863 | 67.0% | 12.3%(+54.8)#7 | 18.1%(+49.0)#1,269 |
| 8. | 21542 | 63.2% | 12.3%(+50.9)#8 | 18.1%(+45.1)#1,496 |
| 9. | 21536 | 61.4% | 12.3%(+49.1)#9 | 18.1%(+43.3)#1,604 |
| 10. | 21217 | 57.2% | 12.3%(+45.0)#10 | 18.1%(+39.2)#1,879 |
| 11. | 21213 | 57.1% | 12.3%(+44.8)#11 | 18.1%(+39.0)#1,901 |
| 12. | 21668 | 55.6% | 12.3%(+43.3)#12 | 18.1%(+37.5)#2,025 |
| 13. | 21639 | 53.5% | 12.3%(+41.2)#13 | 18.1%(+35.4)#2,194 |
| 14. | 21613 | 50.0% | 12.3%(+37.7)#14 | 18.1%(+31.9)#2,517 |
| 15. | 21541 | 50.0% | 12.3%(+37.7)#15 | 18.1%(+31.9)#2,536 |
| 16. | 21205 | 47.7% | 12.3%(+35.4)#16 | 18.1%(+29.6)#2,845 |
| 17. | 21632 | 46.0% | 12.3%(+33.8)#17 | 18.1%(+28.0)#3,049 |
| 18. | 21636 | 46.0% | 12.3%(+33.7)#18 | 18.1%(+27.9)#3,050 |
| 19. | 21671 | 45.5% | 12.3%(+33.2)#19 | 18.1%(+27.4)#3,113 |
| 20. | 21734 | 42.1% | 12.3%(+29.8)#20 | 18.1%(+24.0)#3,643 |
| 21. | 21201 | 40.5% | 12.3%(+28.3)#21 | 18.1%(+22.5)#3,923 |
| 22. | 21218 | 40.2% | 12.3%(+28.0)#22 | 18.1%(+22.2)#3,973 |
| 23. | 21524 | 38.7% | 12.3%(+26.5)#23 | 18.1%(+20.6)#4,263 |
| 24. | 21631 | 34.6% | 12.3%(+22.3)#24 | 18.1%(+16.5)#5,167 |
| 25. | 21755 | 34.1% | 12.3%(+21.8)#25 | 18.1%(+16.0)#5,284 |
| 26. | 21231 | 33.9% | 12.3%(+21.6)#26 | 18.1%(+15.8)#5,325 |
| 27. | 21545 | 33.3% | 12.3%(+21.1)#27 | 18.1%(+15.3)#5,456 |
| 28. | 21223 | 32.9% | 12.3%(+20.6)#28 | 18.1%(+14.8)#5,629 |
| 29. | 21562 | 32.8% | 12.3%(+20.5)#29 | 18.1%(+14.7)#5,644 |
| 30. | 21222 | 31.1% | 12.3%(+18.9)#30 | 18.1%(+13.1)#6,049 |
| 31. | 21904 | 30.5% | 12.3%(+18.2)#31 | 18.1%(+12.4)#6,222 |
| 32. | 21853 | 30.4% | 12.3%(+18.1)#32 | 18.1%(+12.3)#6,247 |
| 33. | 21874 | 29.8% | 12.3%(+17.5)#33 | 18.1%(+11.7)#6,403 |
| 34. | 20745 | 29.1% | 12.3%(+16.9)#34 | 18.1%(+11.0)#6,618 |
| 35. | 21804 | 29.0% | 12.3%(+16.8)#35 | 18.1%(+10.9)#6,653 |
| 36. | 21817 | 28.8% | 12.3%(+16.6)#36 | 18.1%(+10.7)#6,707 |
| 37. | 21849 | 28.7% | 12.3%(+16.5)#37 | 18.1%(+10.7)#6,732 |
| 38. | 21225 | 28.6% | 12.3%(+16.3)#38 | 18.1%(+10.5)#6,770 |
| 39. | 21001 | 28.5% | 12.3%(+16.2)#39 | 18.1%(+10.4)#6,832 |
| 40. | 20876 | 28.4% | 12.3%(+16.1)#40 | 18.1%(+10.3)#6,861 |
| 41. | 21220 | 28.3% | 12.3%(+16.1)#41 | 18.1%(+10.3)#6,877 |
| 42. | 21236 | 27.8% | 12.3%(+15.6)#42 | 18.1%(+9.76)#7,016 |
| 43. | 21780 | 27.8% | 12.3%(+15.5)#43 | 18.1%(+9.71)#7,030 |
| 44. | 21921 | 27.6% | 12.3%(+15.3)#44 | 18.1%(+9.53)#7,095 |
| 45. | 20733 | 26.6% | 12.3%(+14.3)#45 | 18.1%(+8.53)#7,444 |
| 46. | 21791 | 25.9% | 12.3%(+13.6)#46 | 18.1%(+7.81)#7,687 |
| 47. | 20783 | 25.8% | 12.3%(+13.6)#47 | 18.1%(+7.75)#7,706 |
| 48. | 20877 | 25.6% | 12.3%(+13.3)#48 | 18.1%(+7.50)#7,791 |
| 49. | 21226 | 24.9% | 12.3%(+12.7)#49 | 18.1%(+6.88)#8,052 |
| 50. | 21229 | 24.8% | 12.3%(+12.5)#50 | 18.1%(+6.71)#8,094 |
| 51. | 21740 | 24.6% | 12.3%(+12.3)#51 | 18.1%(+6.52)#8,149 |
| 52. | 21216 | 24.0% | 12.3%(+11.7)#52 | 18.1%(+5.90)#8,362 |
| 53. | 21625 | 23.6% | 12.3%(+11.4)#53 | 18.1%(+5.58)#8,515 |
| 54. | 21538 | 23.5% | 12.3%(+11.3)#54 | 18.1%(+5.47)#8,574 |
| 55. | 21133 | 23.3% | 12.3%(+11.1)#55 | 18.1%(+5.28)#8,632 |
| 56. | 21661 | 23.3% | 12.3%(+11.0)#56 | 18.1%(+5.22)#8,650 |
| 57. | 21521 | 23.2% | 12.3%(+11.0)#57 | 18.1%(+5.15)#8,681 |
| 58. | 21903 | 23.2% | 12.3%(+10.9)#58 | 18.1%(+5.11)#8,699 |
| 59. | 21207 | 22.8% | 12.3%(+10.6)#59 | 18.1%(+4.76)#8,829 |
| 60. | 21502 | 22.3% | 12.3%(+10.0)#60 | 18.1%(+4.20)#9,064 |
| 61. | 20737 | 22.2% | 12.3%(+9.97)#61 | 18.1%(+4.16)#9,072 |
| 62. | 21871 | 22.0% | 12.3%(+9.74)#62 | 18.1%(+3.94)#9,196 |
| 63. | 21555 | 21.3% | 12.3%(+9.02)#63 | 18.1%(+3.21)#9,497 |
| 64. | 20724 | 21.0% | 12.3%(+8.73)#64 | 18.1%(+2.92)#9,608 |
| 65. | 21913 | 20.8% | 12.3%(+8.58)#65 | 18.1%(+2.77)#9,668 |
| 66. | 21742 | 20.7% | 12.3%(+8.41)#66 | 18.1%(+2.60)#9,736 |
| 67. | 21202 | 20.7% | 12.3%(+8.40)#67 | 18.1%(+2.60)#9,737 |
| 68. | 21403 | 20.6% | 12.3%(+8.32)#68 | 18.1%(+2.51)#9,777 |
| 69. | 21227 | 20.4% | 12.3%(+8.10)#69 | 18.1%(+2.30)#9,861 |
| 70. | 21215 | 20.2% | 12.3%(+7.93)#70 | 18.1%(+2.13)#9,947 |
| 71. | 21539 | 19.7% | 12.3%(+7.46)#71 | 18.1%(+1.66)#10,172 |
| 72. | 20851 | 19.4% | 12.3%(+7.14)#72 | 18.1%(+1.33)#10,313 |
| 73. | 20747 | 19.1% | 12.3%(+6.88)#73 | 18.1%(+1.07)#10,447 |
| 74. | 21221 | 18.9% | 12.3%(+6.65)#74 | 18.1%(+0.840)#10,545 |
| 75. | 21132 | 18.6% | 12.3%(+6.31)#75 | 18.1%(+0.503)#10,698 |
| 76. | 21850 | 18.5% | 12.3%(+6.29)#76 | 18.1%(+0.483)#10,710 |
| 77. | 21085 | 18.4% | 12.3%(+6.10)#77 | 18.1%(+0.292)#10,790 |
| 78. | 21619 | 18.3% | 12.3%(+6.01)#78 | 18.1%(+0.202)#10,820 |
| 79. | 21046 | 17.8% | 12.3%(+5.54)#79 | 18.1%(-0.268)#11,060 |
| 80. | 20902 | 17.7% | 12.3%(+5.45)#80 | 18.1%(-0.361)#11,105 |
| 81. | 20785 | 17.5% | 12.3%(+5.26)#81 | 18.1%(-0.542)#11,192 |
| 82. | 20912 | 17.5% | 12.3%(+5.25)#82 | 18.1%(-0.554)#11,194 |
| 83. | 20770 | 16.8% | 12.3%(+4.56)#83 | 18.1%(-1.25)#11,495 |
| 84. | 20653 | 16.7% | 12.3%(+4.49)#84 | 18.1%(-1.32)#11,513 |
| 85. | 21224 | 16.5% | 12.3%(+4.25)#85 | 18.1%(-1.56)#11,639 |
| 86. | 21208 | 16.5% | 12.3%(+4.23)#86 | 18.1%(-1.58)#11,653 |
| 87. | 21530 | 16.5% | 12.3%(+4.21)#87 | 18.1%(-1.59)#11,658 |
| 88. | 21532 | 16.4% | 12.3%(+4.15)#88 | 18.1%(-1.66)#11,693 |
| 89. | 21520 | 15.8% | 12.3%(+3.53)#89 | 18.1%(-2.27)#12,026 |
| 90. | 21719 | 15.8% | 12.3%(+3.53)#90 | 18.1%(-2.27)#12,031 |
| 91. | 20901 | 15.7% | 12.3%(+3.48)#91 | 18.1%(-2.33)#12,060 |
| 92. | 21629 | 15.7% | 12.3%(+3.43)#92 | 18.1%(-2.38)#12,079 |
| 93. | 21795 | 15.6% | 12.3%(+3.36)#93 | 18.1%(-2.45)#12,120 |
| 94. | 20602 | 15.3% | 12.3%(+3.02)#94 | 18.1%(-2.79)#12,297 |
| 95. | 20903 | 15.3% | 12.3%(+3.02)#95 | 18.1%(-2.79)#12,298 |
| 96. | 21239 | 15.1% | 12.3%(+2.84)#96 | 18.1%(-2.97)#12,400 |
| 97. | 21623 | 14.8% | 12.3%(+2.53)#97 | 18.1%(-3.28)#12,591 |
| 98. | 21750 | 14.3% | 12.3%(+2.03)#98 | 18.1%(-3.78)#12,833 |
| 99. | 21061 | 14.2% | 12.3%(+1.95)#99 | 18.1%(-3.85)#12,927 |
| 100. | 21655 | 13.8% | 12.3%(+1.56)#100 | 18.1%(-4.25)#13,149 |
Common Questions
What are the Top 10 Zip Codes with the Highest Poverty Level Among Children Under the Age of 5 in Maryland?
Top 10 Zip Codes with the Highest Poverty Level Among Children Under the Age of 5 in Maryland are:
What zip code has the Highest Poverty Level Among Children Under the Age of 5 in Maryland?
21628 has the Highest Poverty Level Among Children Under the Age of 5 in Maryland with 100.0%.
What is the Poverty Level Among Children Under the Age of 5 in the State of Maryland?
Poverty Level Among Children Under the Age of 5 in Maryland is 12.3%.
What is the Poverty Level Among Children Under the Age of 5 in the United States?
Poverty Level Among Children Under the Age of 5 in the United States is 18.1%.