Fulton, KY Map & Demographics
Fulton Map
Fulton Overview
$14,926
PER CAPITA INCOME
$31,685
AVG FAMILY INCOME
$33,090
AVG HOUSEHOLD INCOME
28.0%
WAGE / INCOME GAP [ % ]
72.0¢/ $1
WAGE / INCOME GAP [ $ ]
$13,257
FAMILY INCOME DEFICIT
0.35
INEQUALITY / GINI INDEX
2,693
TOTAL POPULATION
1,117
MALE POPULATION
1,576
FEMALE POPULATION
70.88
MALES / 100 FEMALES
141.09
FEMALES / 100 MALES
35.4
MEDIAN AGE
3.7
AVG FAMILY SIZE
2.8
AVG HOUSEHOLD SIZE
1,001
LABOR FORCE [ PEOPLE ]
50.4%
PERCENT IN LABOR FORCE
2.8%
UNEMPLOYMENT RATE
Fulton Zip Codes
Fulton Area Codes
Income in Fulton
Income Overview in Fulton
Per Capita Income in Fulton is $14,926, while median incomes of families and households are $31,685 and $33,090 respectively.
| Characteristic | Number | Measure |
| Per Capita Income | 2,693 | $14,926 |
| Median Family Income | 563 | $31,685 |
| Mean Family Income | 563 | $37,545 |
| Median Household Income | 955 | $33,090 |
| Mean Household Income | 955 | $35,589 |
| Income Deficit | 563 | $13,257 |
| Wage / Income Gap (%) | 2,693 | 27.98% |
| Wage / Income Gap ($) | 2,693 | 72.02¢ per $1 |
| Gini / Inequality Index | 2,693 | 0.35 |
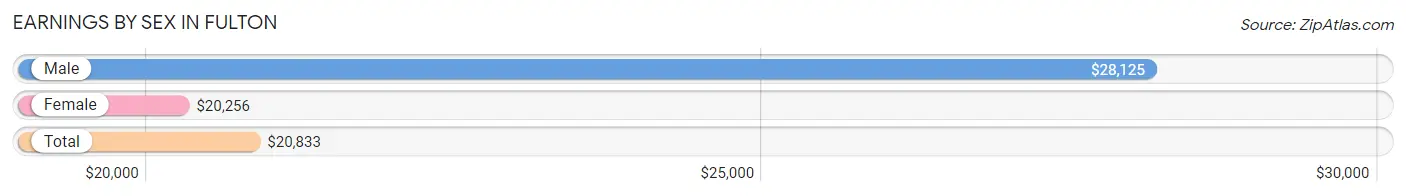
Earnings by Sex in Fulton
Average Earnings in Fulton are $20,833, $28,125 for men and $20,256 for women, a difference of 28.0%.
| Sex | Number | Average Earnings |
| Male | 439 (42.6%) | $28,125 |
| Female | 591 (57.4%) | $20,256 |
| Total | 1,030 (100.0%) | $20,833 |
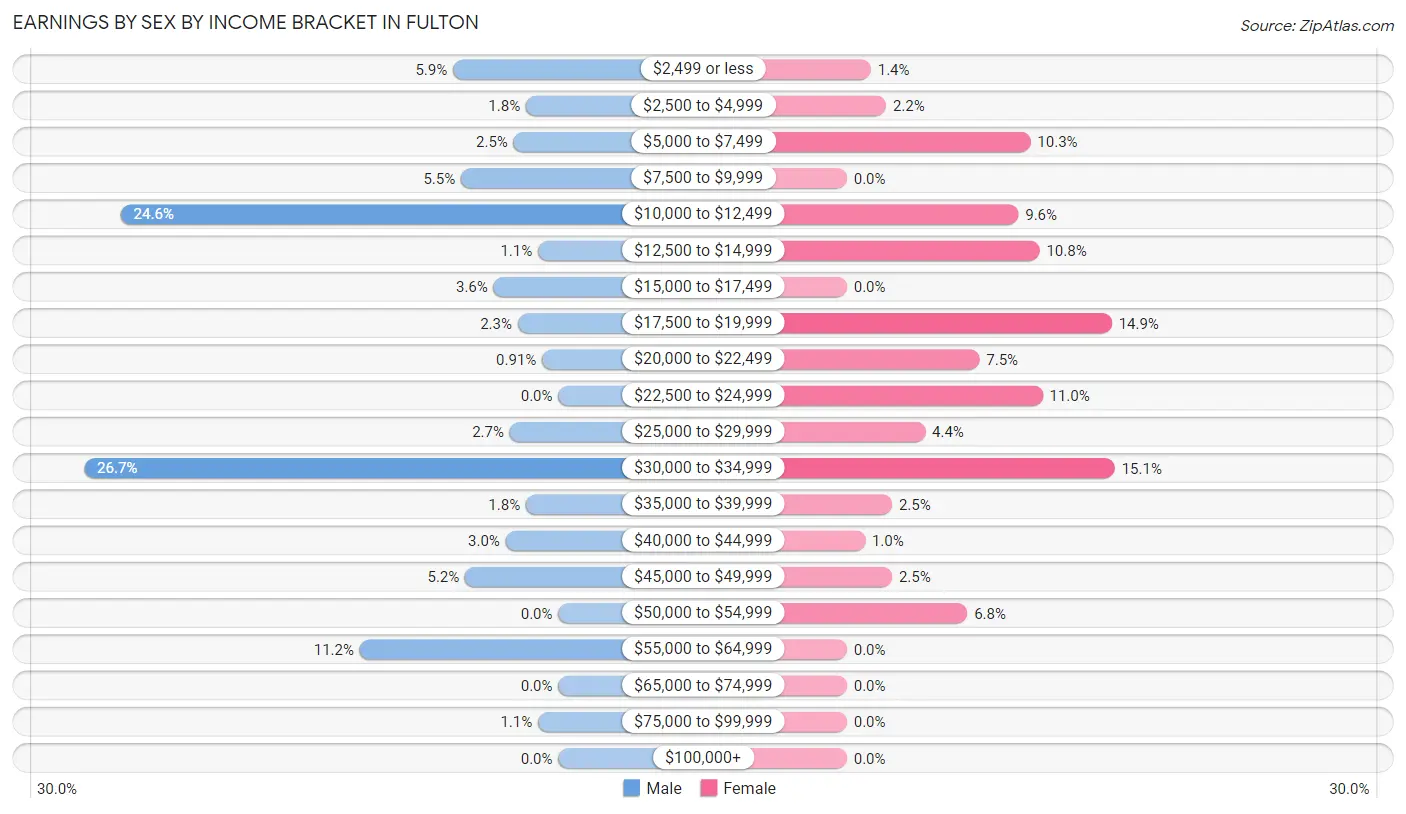
Earnings by Sex by Income Bracket in Fulton
The most common earnings brackets in Fulton are $30,000 to $34,999 for men (117 | 26.7%) and $30,000 to $34,999 for women (89 | 15.1%).
| Income | Male | Female |
| $2,499 or less | 26 (5.9%) | 8 (1.3%) |
| $2,500 to $4,999 | 8 (1.8%) | 13 (2.2%) |
| $5,000 to $7,499 | 11 (2.5%) | 61 (10.3%) |
| $7,500 to $9,999 | 24 (5.5%) | 0 (0.0%) |
| $10,000 to $12,499 | 108 (24.6%) | 57 (9.6%) |
| $12,500 to $14,999 | 5 (1.1%) | 64 (10.8%) |
| $15,000 to $17,499 | 16 (3.6%) | 0 (0.0%) |
| $17,500 to $19,999 | 10 (2.3%) | 88 (14.9%) |
| $20,000 to $22,499 | 4 (0.9%) | 44 (7.4%) |
| $22,500 to $24,999 | 0 (0.0%) | 65 (11.0%) |
| $25,000 to $29,999 | 12 (2.7%) | 26 (4.4%) |
| $30,000 to $34,999 | 117 (26.7%) | 89 (15.1%) |
| $35,000 to $39,999 | 8 (1.8%) | 15 (2.5%) |
| $40,000 to $44,999 | 13 (3.0%) | 6 (1.0%) |
| $45,000 to $49,999 | 23 (5.2%) | 15 (2.5%) |
| $50,000 to $54,999 | 0 (0.0%) | 40 (6.8%) |
| $55,000 to $64,999 | 49 (11.2%) | 0 (0.0%) |
| $65,000 to $74,999 | 0 (0.0%) | 0 (0.0%) |
| $75,000 to $99,999 | 5 (1.1%) | 0 (0.0%) |
| $100,000+ | 0 (0.0%) | 0 (0.0%) |
| Total | 439 (100.0%) | 591 (100.0%) |
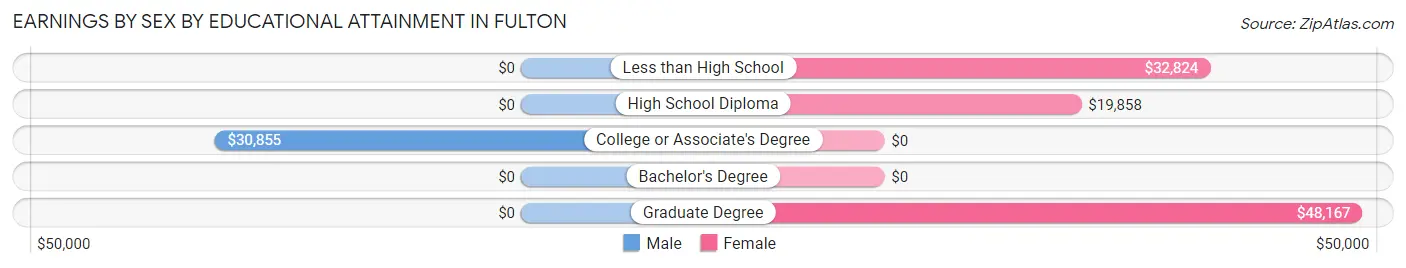
Earnings by Sex by Educational Attainment in Fulton
| Educational Attainment | Male Income | Female Income |
| Less than High School | - | - |
| High School Diploma | - | - |
| College or Associate's Degree | $30,855 | $0 |
| Bachelor's Degree | - | - |
| Graduate Degree | - | - |
| Total | - | - |
Family Income in Fulton
Family Income Brackets in Fulton
According to the Fulton family income data, there are 173 families falling into the $10,000 to $14,999 income range, which is the most common income bracket and makes up 30.7% of all families.
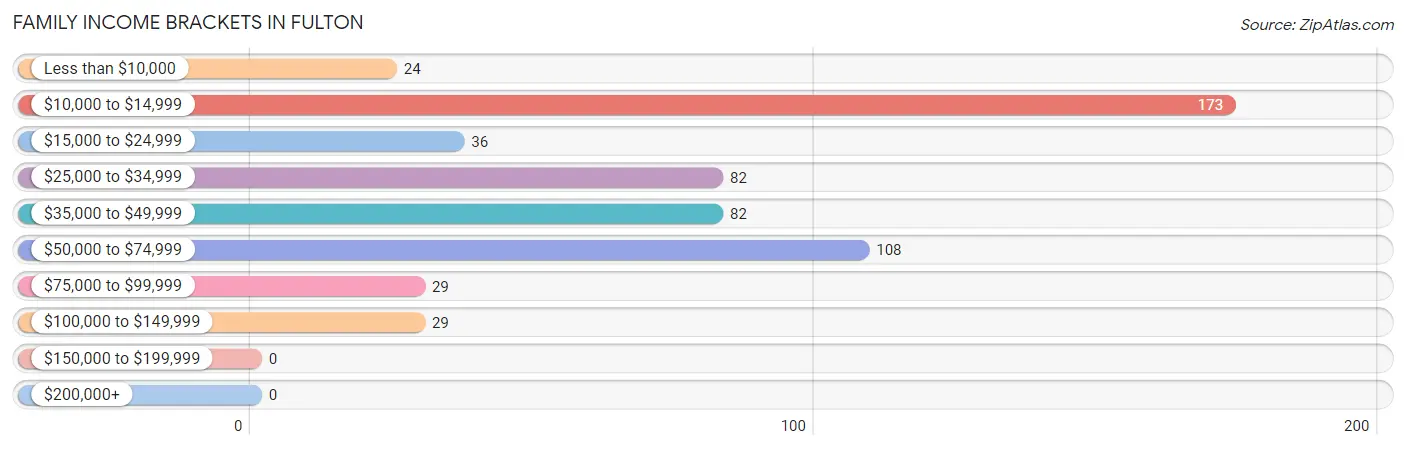
| Income Bracket | # Families | % Families |
| Less than $10,000 | 24 | 4.3% |
| $10,000 to $14,999 | 173 | 30.7% |
| $15,000 to $24,999 | 36 | 6.4% |
| $25,000 to $34,999 | 82 | 14.6% |
| $35,000 to $49,999 | 82 | 14.6% |
| $50,000 to $74,999 | 108 | 19.2% |
| $75,000 to $99,999 | 29 | 5.2% |
| $100,000 to $149,999 | 29 | 5.2% |
| $150,000 to $199,999 | 0 | 0.0% |
| $200,000+ | 0 | 0.0% |
Family Income by Famaliy Size in Fulton
2-person families (287 | 51.0%) account for the highest median family income in Fulton with $43,229 per family, while 2-person families (287 | 51.0%) have the highest median income of $21,614 per family member.
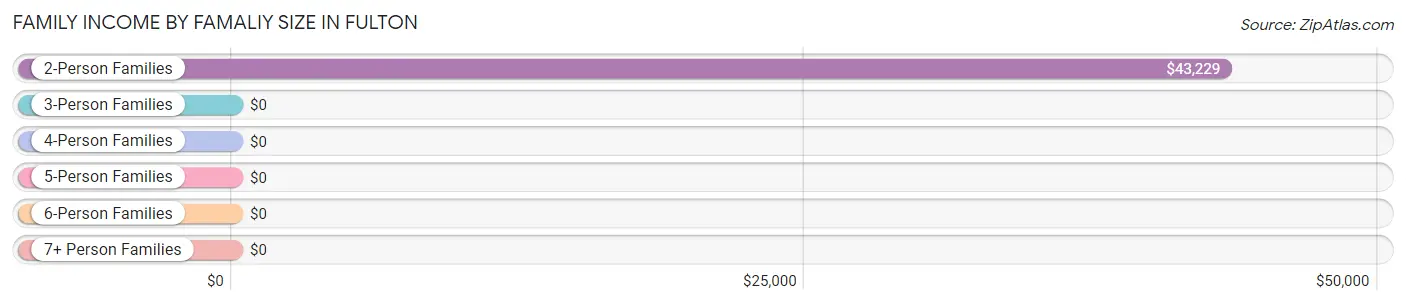
| Income Bracket | # Families | Median Income |
| 2-Person Families | 287 (51.0%) | $43,229 |
| 3-Person Families | 86 (15.3%) | $0 |
| 4-Person Families | 26 (4.6%) | $0 |
| 5-Person Families | 146 (25.9%) | $0 |
| 6-Person Families | 18 (3.2%) | $0 |
| 7+ Person Families | 0 (0.0%) | $0 |
| Total | 563 (100.0%) | $31,685 |
Family Income by Number of Earners in Fulton
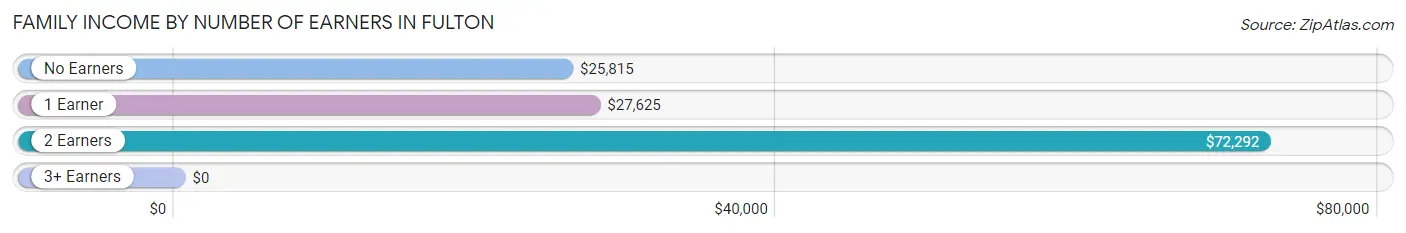
| Number of Earners | # Families | Median Income |
| No Earners | 117 (20.8%) | $25,815 |
| 1 Earner | 365 (64.8%) | $27,625 |
| 2 Earners | 81 (14.4%) | $72,292 |
| 3+ Earners | 0 (0.0%) | $0 |
| Total | 563 (100.0%) | $31,685 |
Household Income in Fulton
Household Income Brackets in Fulton
With 264 households falling in the category, the $25,000 to $34,999 income range is the most frequent in Fulton, accounting for 27.6% of all households.
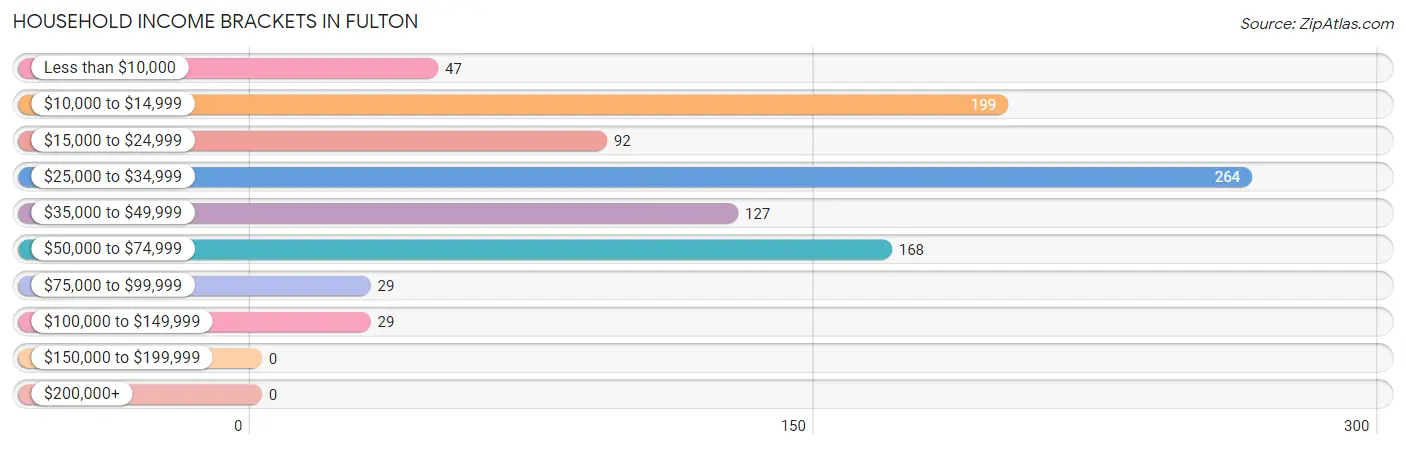
| Income Bracket | # Households | % Households |
| Less than $10,000 | 47 | 4.9% |
| $10,000 to $14,999 | 199 | 20.8% |
| $15,000 to $24,999 | 92 | 9.6% |
| $25,000 to $34,999 | 264 | 27.6% |
| $35,000 to $49,999 | 127 | 13.3% |
| $50,000 to $74,999 | 168 | 17.6% |
| $75,000 to $99,999 | 29 | 3.0% |
| $100,000 to $149,999 | 29 | 3.0% |
| $150,000 to $199,999 | 0 | 0.0% |
| $200,000+ | 0 | 0.0% |
Household Income by Householder Age in Fulton
The median household income in Fulton is $33,090, with the highest median household income of $34,688 found in the 65+ years age bracket for the primary householder. A total of 314 households (32.9%) fall into this category. Meanwhile, the 45 to 64 years age bracket for the primary householder has the lowest median household income of $31,094, with 233 households (24.4%) in this group.
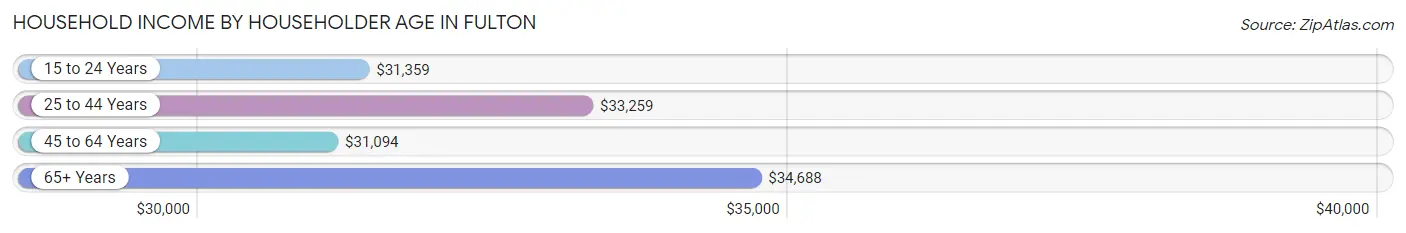
| Income Bracket | # Households | Median Income |
| 15 to 24 Years | 25 (2.6%) | $31,359 |
| 25 to 44 Years | 383 (40.1%) | $33,259 |
| 45 to 64 Years | 233 (24.4%) | $31,094 |
| 65+ Years | 314 (32.9%) | $34,688 |
| Total | 955 (100.0%) | $33,090 |
Poverty in Fulton
Income Below Poverty by Sex and Age in Fulton
With 44.3% poverty level for males and 33.6% for females among the residents of Fulton, 6 to 11 year old males and 5 year old females are the most vulnerable to poverty, with 158 males (94.6%) and 3 females (100.0%) in their respective age groups living below the poverty level.
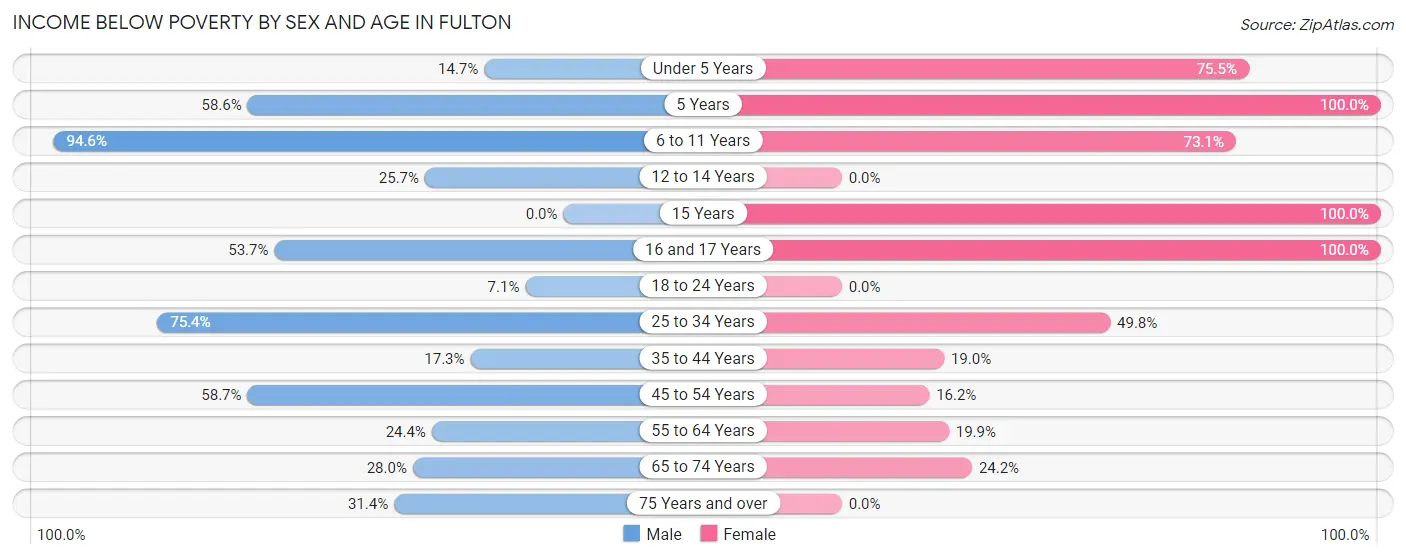
| Age Bracket | Male | Female |
| Under 5 Years | 10 (14.7%) | 71 (75.5%) |
| 5 Years | 17 (58.6%) | 3 (100.0%) |
| 6 to 11 Years | 158 (94.6%) | 136 (73.1%) |
| 12 to 14 Years | 9 (25.7%) | 0 (0.0%) |
| 15 Years | 0 (0.0%) | 13 (100.0%) |
| 16 and 17 Years | 22 (53.7%) | 13 (100.0%) |
| 18 to 24 Years | 7 (7.1%) | 0 (0.0%) |
| 25 to 34 Years | 107 (75.3%) | 126 (49.8%) |
| 35 to 44 Years | 29 (17.3%) | 33 (19.0%) |
| 45 to 54 Years | 61 (58.7%) | 18 (16.2%) |
| 55 to 64 Years | 11 (24.4%) | 55 (19.9%) |
| 65 to 74 Years | 26 (28.0%) | 43 (24.2%) |
| 75 Years and over | 22 (31.4%) | 0 (0.0%) |
| Total | 479 (44.3%) | 511 (33.6%) |
Income Above Poverty by Sex and Age in Fulton
According to the poverty statistics in Fulton, males aged 15 years and females aged 12 to 14 years are the age groups that are most secure financially, with 100.0% of males and 100.0% of females in these age groups living above the poverty line.
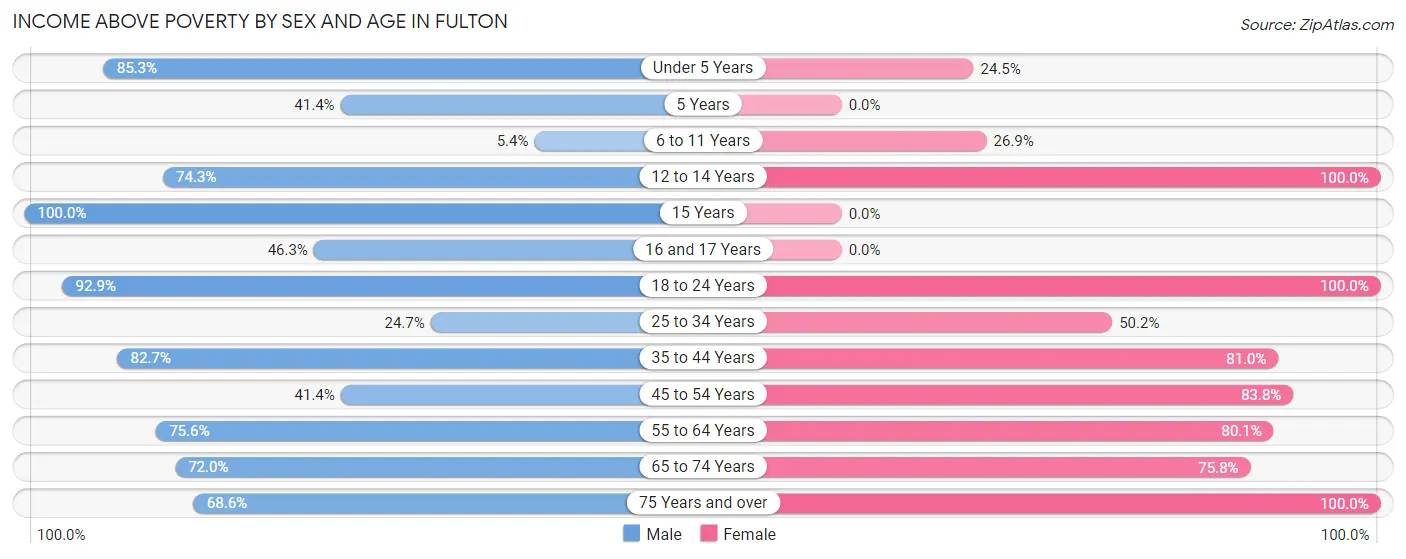
| Age Bracket | Male | Female |
| Under 5 Years | 58 (85.3%) | 23 (24.5%) |
| 5 Years | 12 (41.4%) | 0 (0.0%) |
| 6 to 11 Years | 9 (5.4%) | 50 (26.9%) |
| 12 to 14 Years | 26 (74.3%) | 55 (100.0%) |
| 15 Years | 20 (100.0%) | 0 (0.0%) |
| 16 and 17 Years | 19 (46.3%) | 0 (0.0%) |
| 18 to 24 Years | 92 (92.9%) | 53 (100.0%) |
| 25 to 34 Years | 35 (24.6%) | 127 (50.2%) |
| 35 to 44 Years | 139 (82.7%) | 141 (81.0%) |
| 45 to 54 Years | 43 (41.3%) | 93 (83.8%) |
| 55 to 64 Years | 34 (75.6%) | 222 (80.1%) |
| 65 to 74 Years | 67 (72.0%) | 135 (75.8%) |
| 75 Years and over | 48 (68.6%) | 112 (100.0%) |
| Total | 602 (55.7%) | 1,011 (66.4%) |
Income Below Poverty Among Married-Couple Families in Fulton
The poverty statistics for married-couple families in Fulton show that 13.2% or 30 of the total 228 families live below the poverty line. Families with 3 or 4 children have the highest poverty rate of 100.0%, comprising of 18 families. On the other hand, families with 1 or 2 children have the lowest poverty rate of 0.0%, which includes 0 families.
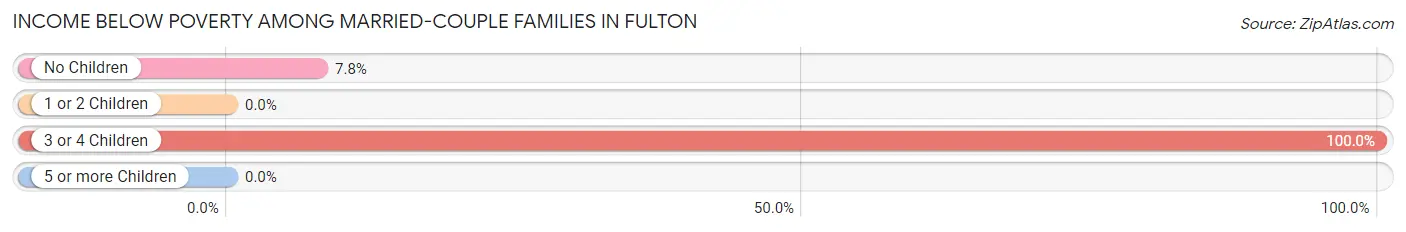
| Children | Above Poverty | Below Poverty |
| No Children | 141 (92.2%) | 12 (7.8%) |
| 1 or 2 Children | 57 (100.0%) | 0 (0.0%) |
| 3 or 4 Children | 0 (0.0%) | 18 (100.0%) |
| 5 or more Children | 0 (0.0%) | 0 (0.0%) |
| Total | 198 (86.8%) | 30 (13.2%) |
Income Below Poverty Among Single-Parent Households in Fulton
According to the poverty data in Fulton, 74.8% or 92 single-father households and 51.9% or 110 single-mother households are living below the poverty line. Among single-father households, those with 3 or 4 children have the highest poverty rate, with 85 households (100.0%) experiencing poverty. Likewise, among single-mother households, those with 1 or 2 children have the highest poverty rate, with 69 households (69.7%) falling below the poverty line.
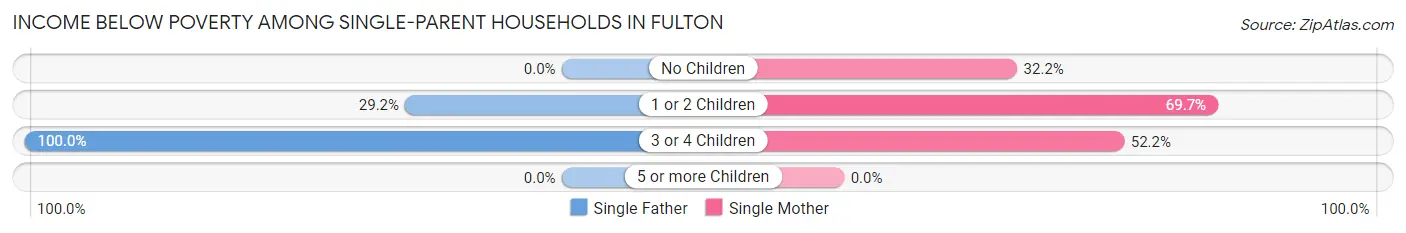
| Children | Single Father | Single Mother |
| No Children | 0 (0.0%) | 29 (32.2%) |
| 1 or 2 Children | 7 (29.2%) | 69 (69.7%) |
| 3 or 4 Children | 85 (100.0%) | 12 (52.2%) |
| 5 or more Children | 0 (0.0%) | 0 (0.0%) |
| Total | 92 (74.8%) | 110 (51.9%) |
Income Below Poverty Among Married-Couple vs Single-Parent Households in Fulton
The poverty data for Fulton shows that 30 of the married-couple family households (13.2%) and 202 of the single-parent households (60.3%) are living below the poverty level. Within the married-couple family households, those with 3 or 4 children have the highest poverty rate, with 18 households (100.0%) falling below the poverty line. Among the single-parent households, those with 3 or 4 children have the highest poverty rate, with 97 household (89.8%) living below poverty.
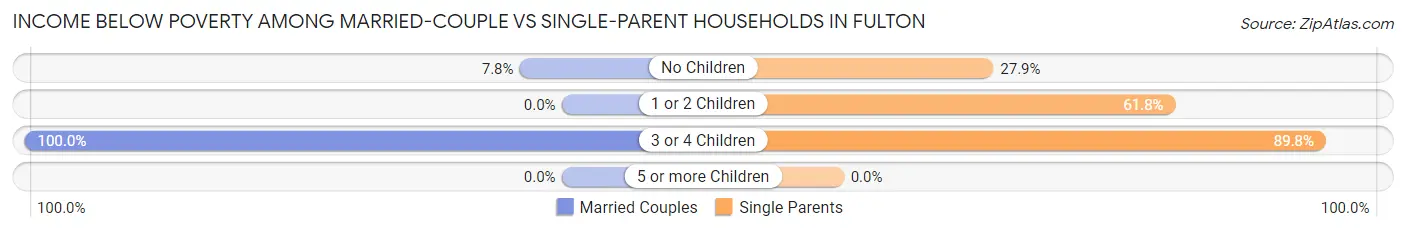
| Children | Married-Couple Families | Single-Parent Households |
| No Children | 12 (7.8%) | 29 (27.9%) |
| 1 or 2 Children | 0 (0.0%) | 76 (61.8%) |
| 3 or 4 Children | 18 (100.0%) | 97 (89.8%) |
| 5 or more Children | 0 (0.0%) | 0 (0.0%) |
| Total | 30 (13.2%) | 202 (60.3%) |
Race in Fulton
The most populous races in Fulton are White / Caucasian (1,527 | 56.7%), Black / African American (859 | 31.9%), and Two or more Races (225 | 8.4%).
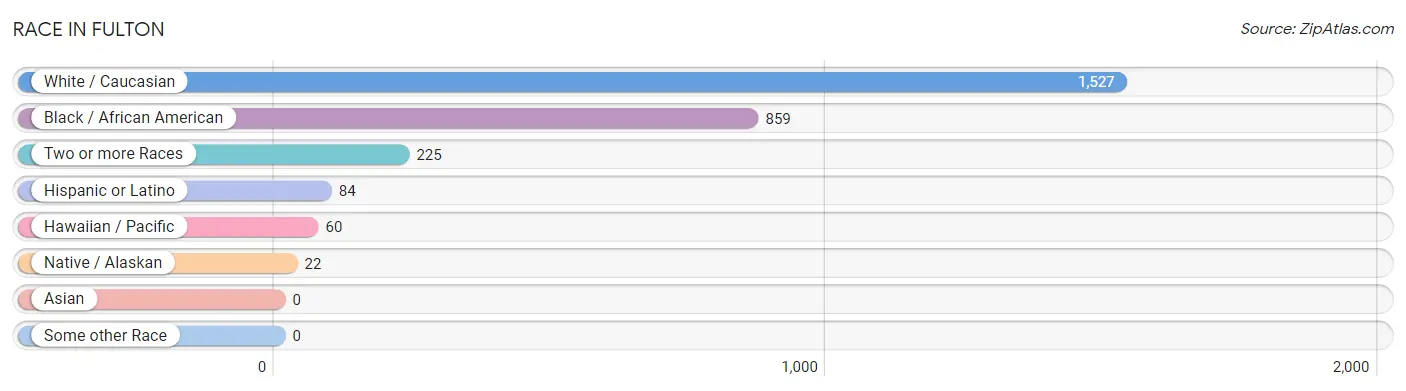
| Race | # Population | % Population |
| Asian | 0 | 0.0% |
| Black / African American | 859 | 31.9% |
| Hawaiian / Pacific | 60 | 2.2% |
| Hispanic or Latino | 84 | 3.1% |
| Native / Alaskan | 22 | 0.8% |
| White / Caucasian | 1,527 | 56.7% |
| Two or more Races | 225 | 8.4% |
| Some other Race | 0 | 0.0% |
| Total | 2,693 | 100.0% |
Ancestry in Fulton
The most populous ancestries reported in Fulton are African (504 | 18.7%), Subsaharan African (504 | 18.7%), English (405 | 15.0%), American (271 | 10.1%), and European (235 | 8.7%), together accounting for 71.3% of all Fulton residents.
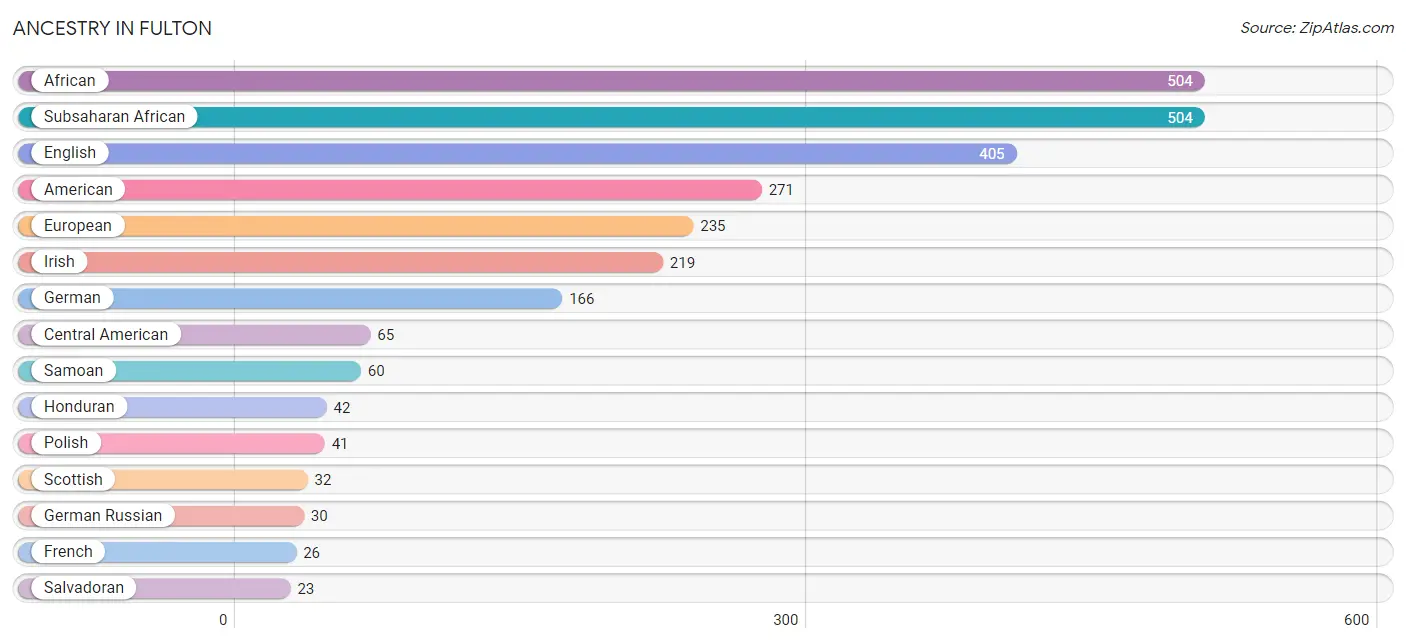
| Ancestry | # Population | % Population |
| African | 504 | 18.7% |
| American | 271 | 10.1% |
| Apache | 18 | 0.7% |
| Arab | 6 | 0.2% |
| Blackfeet | 13 | 0.5% |
| British | 5 | 0.2% |
| Central American | 65 | 2.4% |
| Cherokee | 2 | 0.1% |
| Dutch | 2 | 0.1% |
| English | 405 | 15.0% |
| European | 235 | 8.7% |
| French | 26 | 1.0% |
| German | 166 | 6.2% |
| German Russian | 30 | 1.1% |
| Honduran | 42 | 1.6% |
| Irish | 219 | 8.1% |
| Italian | 7 | 0.3% |
| Lebanese | 6 | 0.2% |
| Native Hawaiian | 13 | 0.5% |
| Navajo | 2 | 0.1% |
| Northern European | 3 | 0.1% |
| Norwegian | 21 | 0.8% |
| Polish | 41 | 1.5% |
| Portuguese | 13 | 0.5% |
| Puerto Rican | 13 | 0.5% |
| Russian | 4 | 0.2% |
| Salvadoran | 23 | 0.9% |
| Samoan | 60 | 2.2% |
| Scotch-Irish | 13 | 0.5% |
| Scottish | 32 | 1.2% |
| Subsaharan African | 504 | 18.7% |
| Swedish | 8 | 0.3% | View All 32 Rows |
Immigrants in Fulton
The most numerous immigrant groups reported in Fulton came from Africa (8 | 0.3%), Europe (8 | 0.3%), Germany (8 | 0.3%), Ghana (8 | 0.3%), and Western Africa (8 | 0.3%), together accounting for 1.5% of all Fulton residents.
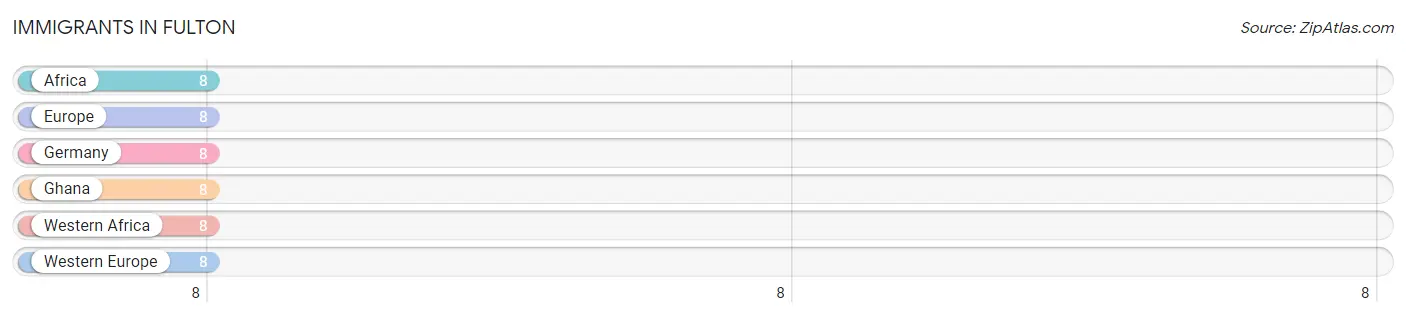
| Immigration Origin | # Population | % Population |
| Africa | 8 | 0.3% |
| Europe | 8 | 0.3% |
| Germany | 8 | 0.3% |
| Ghana | 8 | 0.3% |
| Western Africa | 8 | 0.3% |
| Western Europe | 8 | 0.3% | View All 6 Rows |
Sex and Age in Fulton
Sex and Age in Fulton
The most populous age groups in Fulton are 5 to 9 Years (134 | 12.0%) for men and 65 to 69 Years (183 | 11.6%) for women.
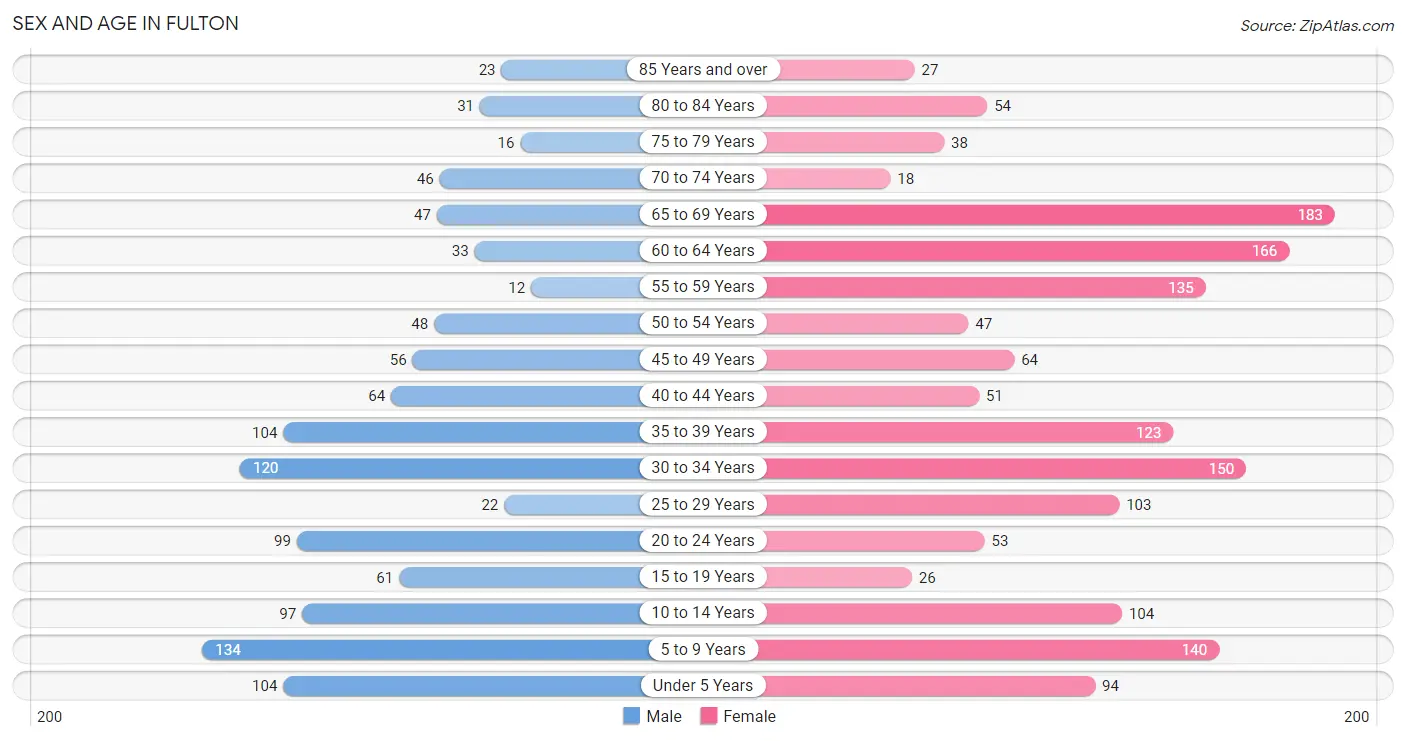
| Age Bracket | Male | Female |
| Under 5 Years | 104 (9.3%) | 94 (6.0%) |
| 5 to 9 Years | 134 (12.0%) | 140 (8.9%) |
| 10 to 14 Years | 97 (8.7%) | 104 (6.6%) |
| 15 to 19 Years | 61 (5.5%) | 26 (1.7%) |
| 20 to 24 Years | 99 (8.9%) | 53 (3.4%) |
| 25 to 29 Years | 22 (2.0%) | 103 (6.5%) |
| 30 to 34 Years | 120 (10.7%) | 150 (9.5%) |
| 35 to 39 Years | 104 (9.3%) | 123 (7.8%) |
| 40 to 44 Years | 64 (5.7%) | 51 (3.2%) |
| 45 to 49 Years | 56 (5.0%) | 64 (4.1%) |
| 50 to 54 Years | 48 (4.3%) | 47 (3.0%) |
| 55 to 59 Years | 12 (1.1%) | 135 (8.6%) |
| 60 to 64 Years | 33 (2.9%) | 166 (10.5%) |
| 65 to 69 Years | 47 (4.2%) | 183 (11.6%) |
| 70 to 74 Years | 46 (4.1%) | 18 (1.1%) |
| 75 to 79 Years | 16 (1.4%) | 38 (2.4%) |
| 80 to 84 Years | 31 (2.8%) | 54 (3.4%) |
| 85 Years and over | 23 (2.1%) | 27 (1.7%) |
| Total | 1,117 (100.0%) | 1,576 (100.0%) |
Families and Households in Fulton
Median Family Size in Fulton
The median family size in Fulton is 3.67 persons per family, with married-couple families (228 | 40.5%) accounting for the largest median family size of 3.92 persons per family. On the other hand, single male/father families (123 | 21.8%) represent the smallest median family size with 2.94 persons per family.
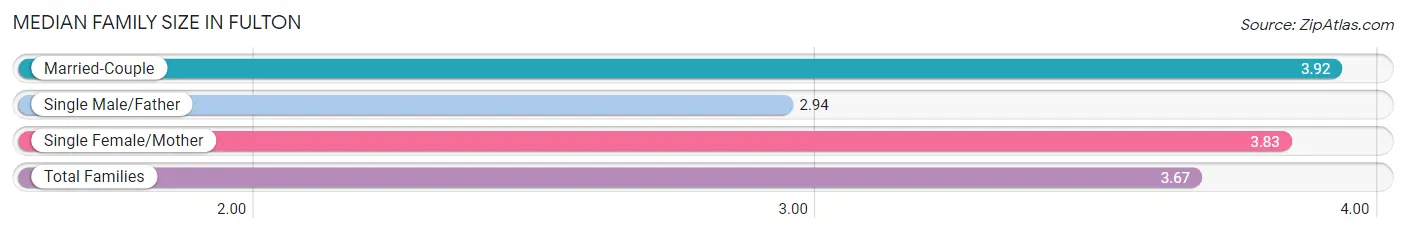
| Family Type | # Families | Family Size |
| Married-Couple | 228 (40.5%) | 3.92 |
| Single Male/Father | 123 (21.8%) | 2.94 |
| Single Female/Mother | 212 (37.7%) | 3.83 |
| Total Families | 563 (100.0%) | 3.67 |
Median Household Size in Fulton
The median household size in Fulton is 2.76 persons per household, with single female/mother households (212 | 22.2%) accounting for the largest median household size of 3.94 persons per household. non-family households (392 | 41.0%) represent the smallest median household size with 1.25 persons per household.
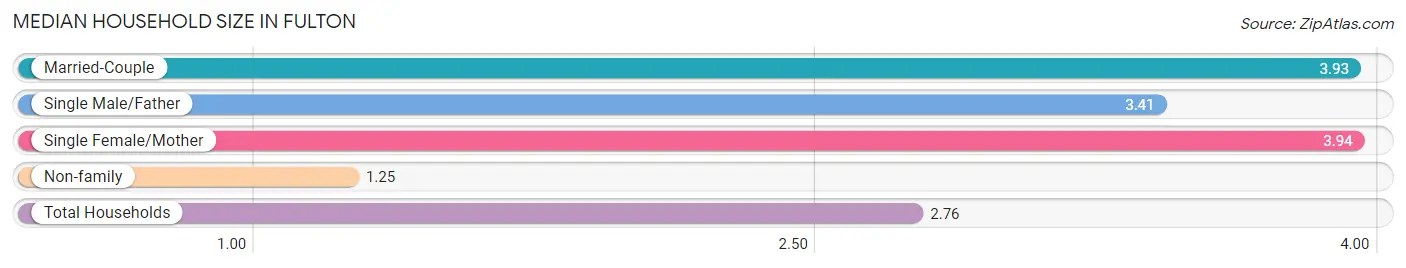
| Household Type | # Households | Household Size |
| Married-Couple | 228 (23.9%) | 3.93 |
| Single Male/Father | 123 (12.9%) | 3.41 |
| Single Female/Mother | 212 (22.2%) | 3.94 |
| Non-family | 392 (41.0%) | 1.25 |
| Total Households | 955 (100.0%) | 2.76 |
Household Size by Marriage Status in Fulton
Out of a total of 955 households in Fulton, 563 (59.0%) are family households, while 392 (41.0%) are nonfamily households. The most numerous type of family households are 2-person households, comprising 275, and the most common type of nonfamily households are 1-person households, comprising 297.
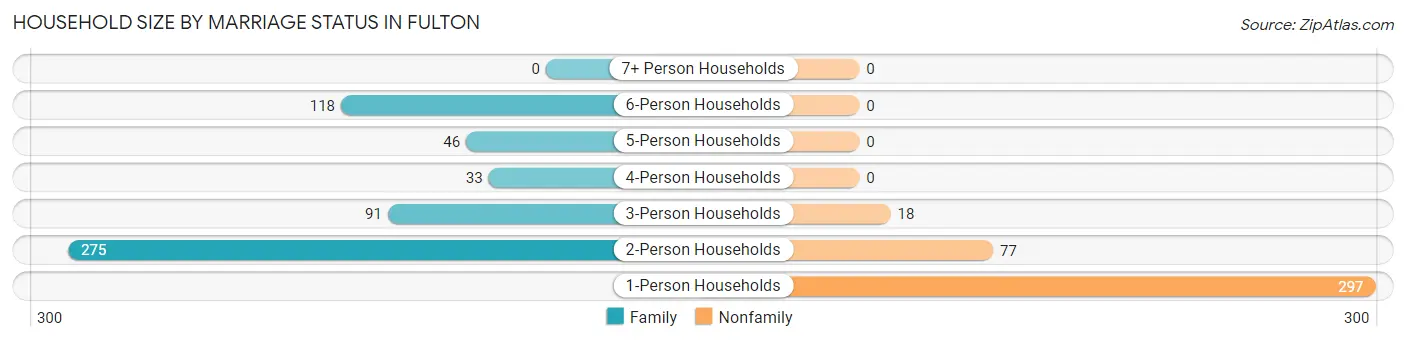
| Household Size | Family Households | Nonfamily Households |
| 1-Person Households | - | 297 (31.1%) |
| 2-Person Households | 275 (28.8%) | 77 (8.1%) |
| 3-Person Households | 91 (9.5%) | 18 (1.9%) |
| 4-Person Households | 33 (3.5%) | 0 (0.0%) |
| 5-Person Households | 46 (4.8%) | 0 (0.0%) |
| 6-Person Households | 118 (12.4%) | 0 (0.0%) |
| 7+ Person Households | 0 (0.0%) | 0 (0.0%) |
| Total | 563 (59.0%) | 392 (41.0%) |
Female Fertility in Fulton
Fertility by Age in Fulton
Average fertility rate in Fulton is 19.0 births per 1,000 women. Women in the age bracket of 20 to 34 years have the highest fertility rate with 36.0 births per 1,000 women. Women in the age bracket of 20 to 34 years acount for 100.0% of all women with births.
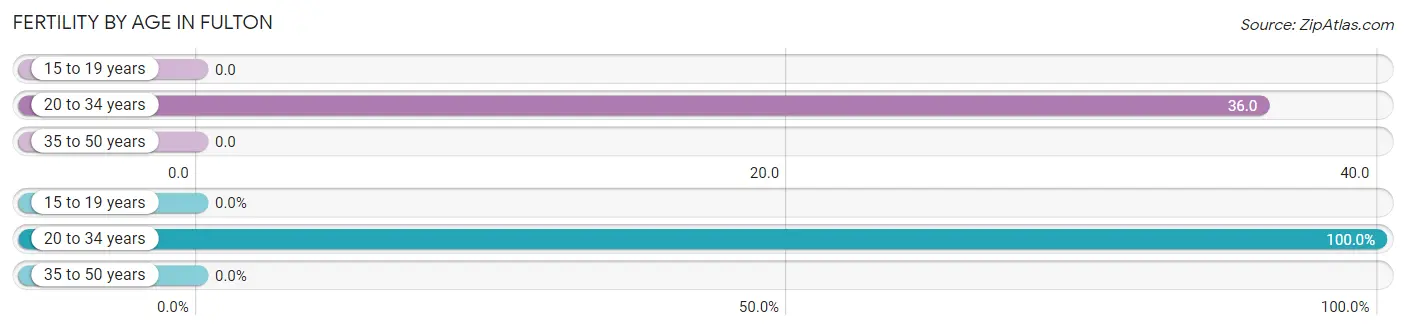
| Age Bracket | Women with Births | Births / 1,000 Women |
| 15 to 19 years | 0 (0.0%) | 0.0 |
| 20 to 34 years | 11 (100.0%) | 36.0 |
| 35 to 50 years | 0 (0.0%) | 0.0 |
| Total | 11 (100.0%) | 19.0 |
Fertility by Age by Marriage Status in Fulton
18.2% of women with births (11) in Fulton are married. The highest percentage of unmarried women with births falls into 20 to 34 years age bracket with 81.8% of them unmarried at the time of birth, while the lowest percentage of unmarried women with births belong to 20 to 34 years age bracket with 81.8% of them unmarried.
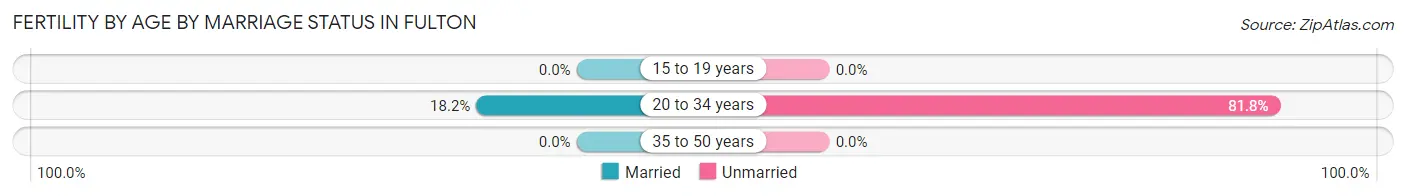
| Age Bracket | Married | Unmarried |
| 15 to 19 years | 0 (0.0%) | 0 (0.0%) |
| 20 to 34 years | 2 (18.2%) | 9 (81.8%) |
| 35 to 50 years | 0 (0.0%) | 0 (0.0%) |
| Total | 2 (18.2%) | 9 (81.8%) |
Fertility by Education in Fulton
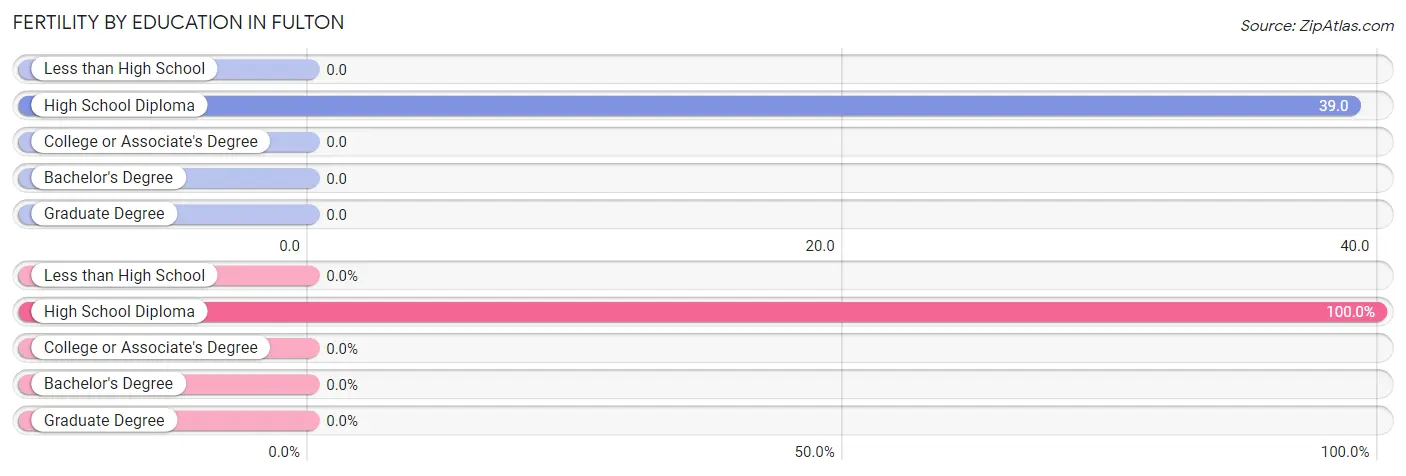
| Educational Attainment | Women with Births | Births / 1,000 Women |
| Less than High School | 0 (0.0%) | 0.0 |
| High School Diploma | 11 (100.0%) | 39.0 |
| College or Associate's Degree | 0 (0.0%) | 0.0 |
| Bachelor's Degree | 0 (0.0%) | 0.0 |
| Graduate Degree | 0 (0.0%) | 0.0 |
| Total | 11 (100.0%) | 19.0 |
Fertility by Education by Marriage Status in Fulton
81.8% of women with births in Fulton are unmarried. Women with the educational attainment of high school diploma are most likely to be married with 18.2% of them married at childbirth, while women with the educational attainment of high school diploma are least likely to be married with 81.8% of them unmarried at childbirth.
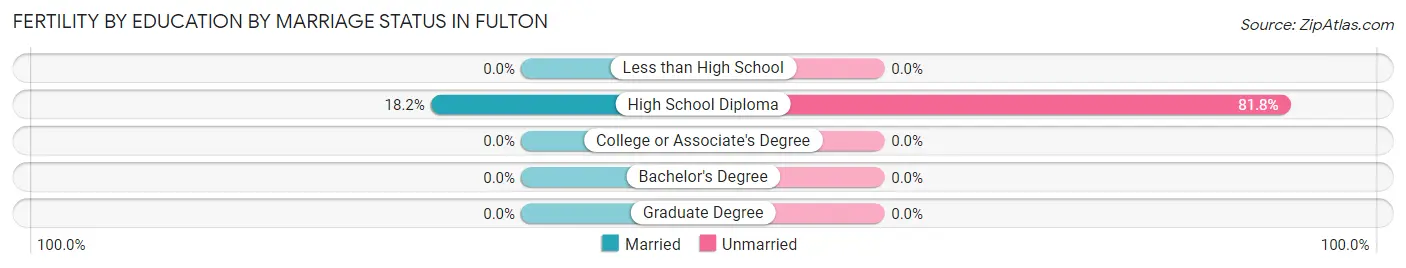
| Educational Attainment | Married | Unmarried |
| Less than High School | 0 (0.0%) | 0 (0.0%) |
| High School Diploma | 2 (18.2%) | 9 (81.8%) |
| College or Associate's Degree | 0 (0.0%) | 0 (0.0%) |
| Bachelor's Degree | 0 (0.0%) | 0 (0.0%) |
| Graduate Degree | 0 (0.0%) | 0 (0.0%) |
| Total | 2 (18.2%) | 9 (81.8%) |
Employment Characteristics in Fulton
Employment by Class of Employer in Fulton
Among the 916 employed individuals in Fulton, private company employees (741 | 80.9%), self-employed (not incorporated) (75 | 8.2%), and local government employees (37 | 4.0%) make up the most common classes of employment.
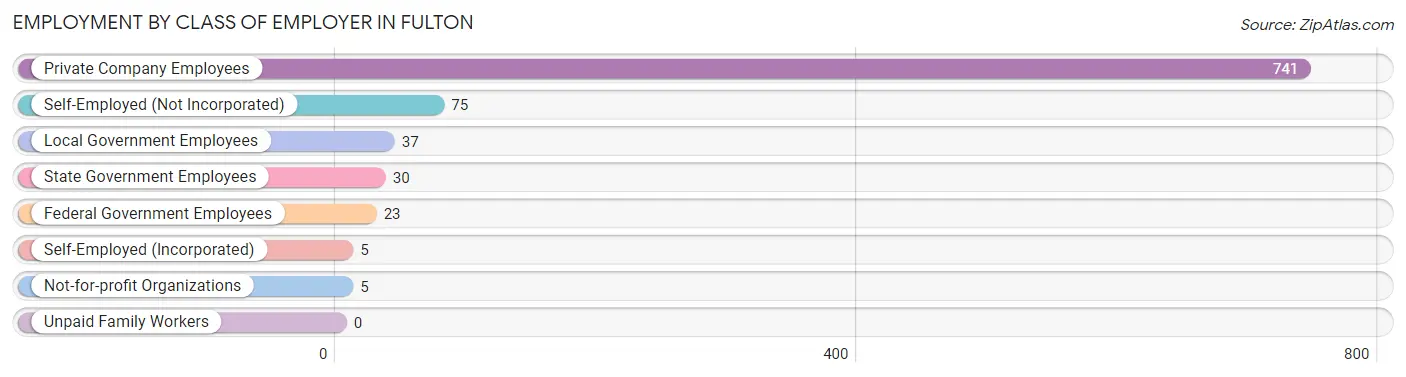
| Employer Class | # Employees | % Employees |
| Private Company Employees | 741 | 80.9% |
| Self-Employed (Incorporated) | 5 | 0.5% |
| Self-Employed (Not Incorporated) | 75 | 8.2% |
| Not-for-profit Organizations | 5 | 0.5% |
| Local Government Employees | 37 | 4.0% |
| State Government Employees | 30 | 3.3% |
| Federal Government Employees | 23 | 2.5% |
| Unpaid Family Workers | 0 | 0.0% |
| Total | 916 | 100.0% |
Employment Status by Age in Fulton
According to the labor force statistics for Fulton, out of the total population over 16 years of age (1,987), 50.4% or 1,001 individuals are in the labor force, with 2.8% or 28 of them unemployed. The age group with the highest labor force participation rate is 25 to 29 years, with 82.4% or 103 individuals in the labor force. Within the labor force, the 25 to 29 years age range has the highest percentage of unemployed individuals, with 18.4% or 19 of them being unemployed.
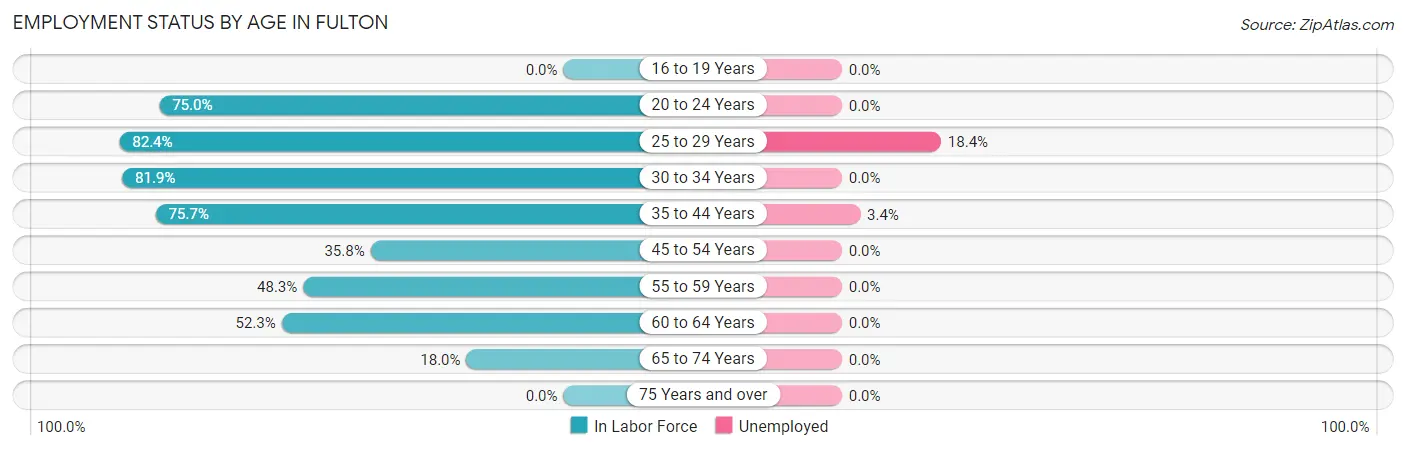
| Age Bracket | In Labor Force | Unemployed |
| 16 to 19 Years | 0 (0.0%) | 0 (0.0%) |
| 20 to 24 Years | 114 (75.0%) | 0 (0.0%) |
| 25 to 29 Years | 103 (82.4%) | 19 (18.4%) |
| 30 to 34 Years | 221 (81.9%) | 0 (0.0%) |
| 35 to 44 Years | 259 (75.7%) | 9 (3.4%) |
| 45 to 54 Years | 77 (35.8%) | 0 (0.0%) |
| 55 to 59 Years | 71 (48.3%) | 0 (0.0%) |
| 60 to 64 Years | 104 (52.3%) | 0 (0.0%) |
| 65 to 74 Years | 53 (18.0%) | 0 (0.0%) |
| 75 Years and over | 0 (0.0%) | 0 (0.0%) |
| Total | 1,001 (50.4%) | 28 (2.8%) |
Employment Status by Educational Attainment in Fulton
According to labor force statistics for Fulton, 64.3% of individuals (835) out of the total population between 25 and 64 years of age (1,298) are in the labor force, with 3.3% or 28 of them being unemployed. The group with the highest labor force participation rate are those with the educational attainment of high school diploma, with 76.2% or 481 individuals in the labor force. Within the labor force, individuals with bachelor's degree or higher education have the highest percentage of unemployment, with 6.3% or 8 of them being unemployed.
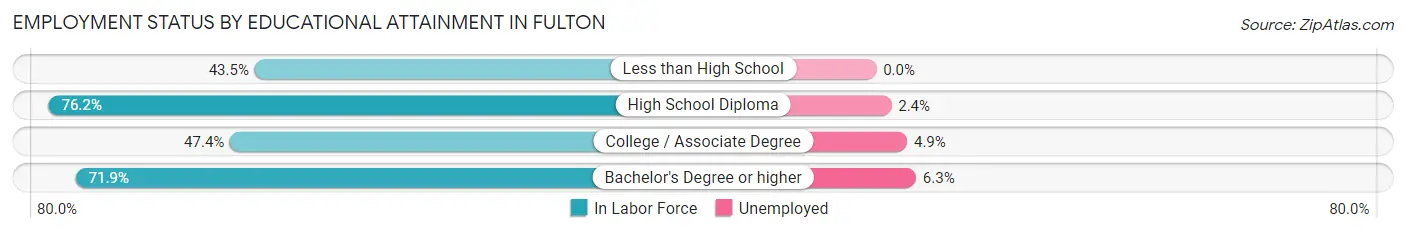
| Educational Attainment | In Labor Force | Unemployed |
| Less than High School | 64 (43.5%) | 0 (0.0%) |
| High School Diploma | 481 (76.2%) | 15 (2.4%) |
| College / Associate Degree | 162 (47.4%) | 17 (4.9%) |
| Bachelor's Degree or higher | 128 (71.9%) | 11 (6.3%) |
| Total | 835 (64.3%) | 43 (3.3%) |
Employment Occupations by Sex in Fulton
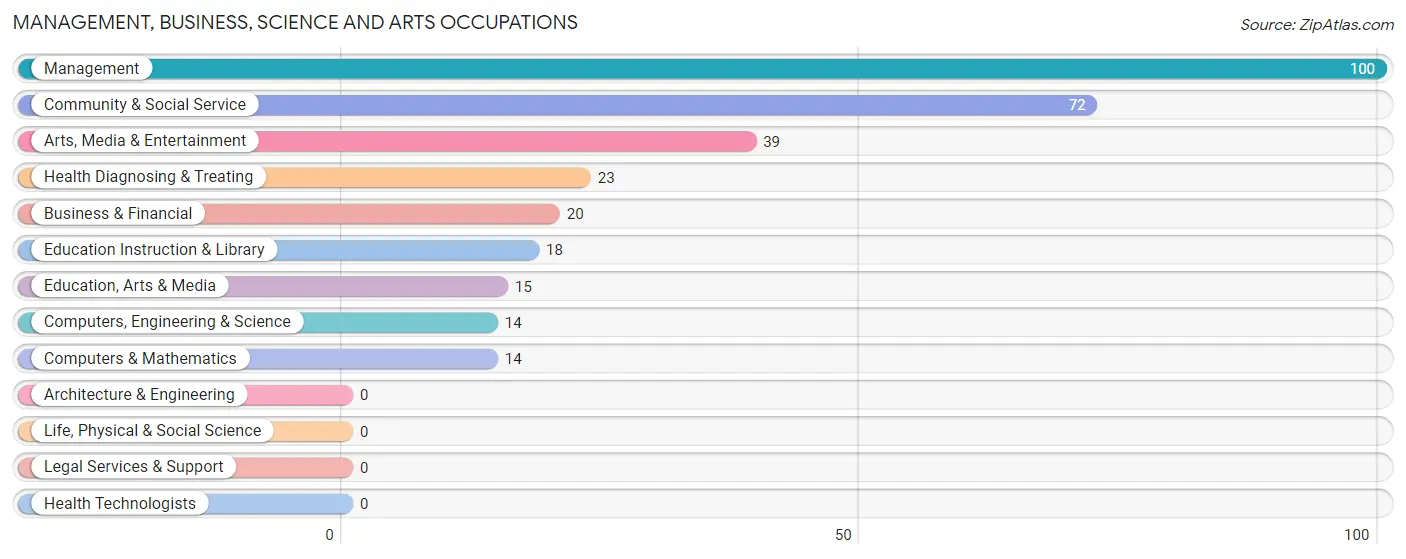
Management, Business, Science and Arts Occupations
The most common Management, Business, Science and Arts occupations in Fulton are Management (100 | 10.5%), Community & Social Service (72 | 7.6%), Arts, Media & Entertainment (39 | 4.1%), Health Diagnosing & Treating (23 | 2.4%), and Business & Financial (20 | 2.1%).
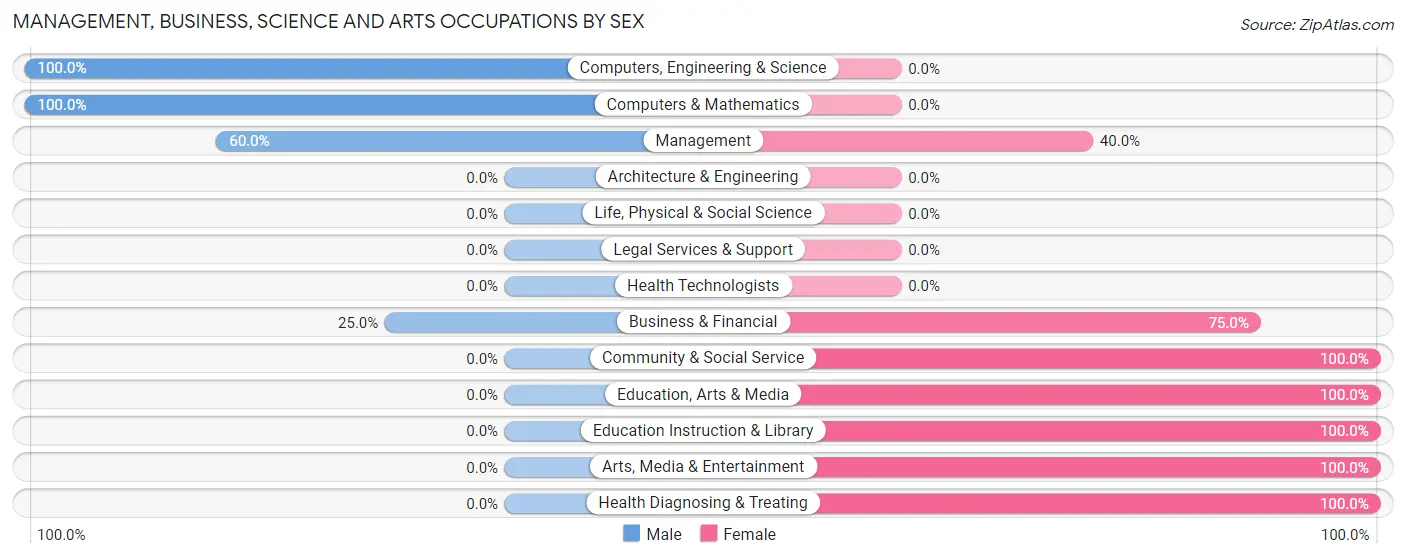
Management, Business, Science and Arts Occupations by Sex
Within the Management, Business, Science and Arts occupations in Fulton, the most male-oriented occupations are Computers, Engineering & Science (100.0%), Computers & Mathematics (100.0%), and Management (60.0%), while the most female-oriented occupations are Community & Social Service (100.0%), Education, Arts & Media (100.0%), and Education Instruction & Library (100.0%).
| Occupation | Male | Female |
| Management | 60 (60.0%) | 40 (40.0%) |
| Business & Financial | 5 (25.0%) | 15 (75.0%) |
| Computers, Engineering & Science | 14 (100.0%) | 0 (0.0%) |
| Computers & Mathematics | 14 (100.0%) | 0 (0.0%) |
| Architecture & Engineering | 0 (0.0%) | 0 (0.0%) |
| Life, Physical & Social Science | 0 (0.0%) | 0 (0.0%) |
| Community & Social Service | 0 (0.0%) | 72 (100.0%) |
| Education, Arts & Media | 0 (0.0%) | 15 (100.0%) |
| Legal Services & Support | 0 (0.0%) | 0 (0.0%) |
| Education Instruction & Library | 0 (0.0%) | 18 (100.0%) |
| Arts, Media & Entertainment | 0 (0.0%) | 39 (100.0%) |
| Health Diagnosing & Treating | 0 (0.0%) | 23 (100.0%) |
| Health Technologists | 0 (0.0%) | 0 (0.0%) |
| Total (Category) | 79 (34.5%) | 150 (65.5%) |
| Total (Overall) | 371 (39.0%) | 581 (61.0%) |
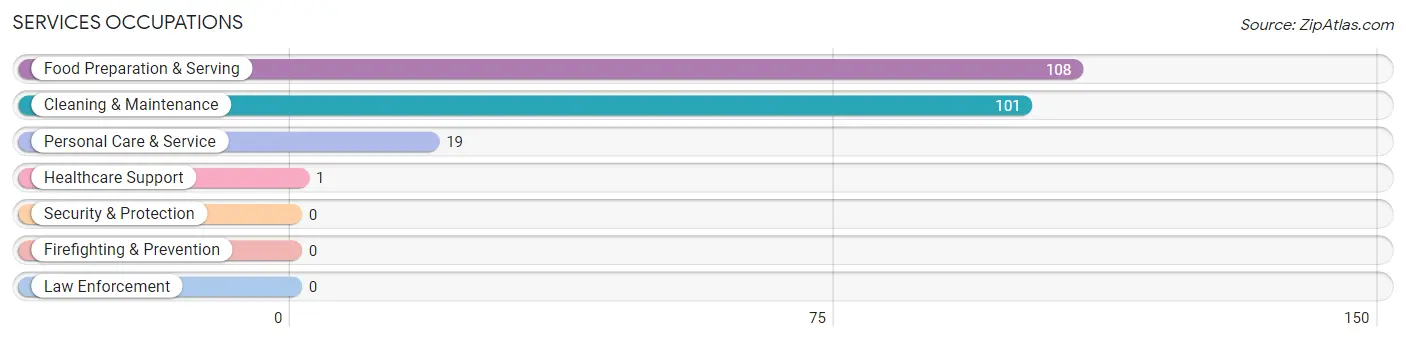
Services Occupations
The most common Services occupations in Fulton are Food Preparation & Serving (108 | 11.3%), Cleaning & Maintenance (101 | 10.6%), Personal Care & Service (19 | 2.0%), and Healthcare Support (1 | 0.1%).
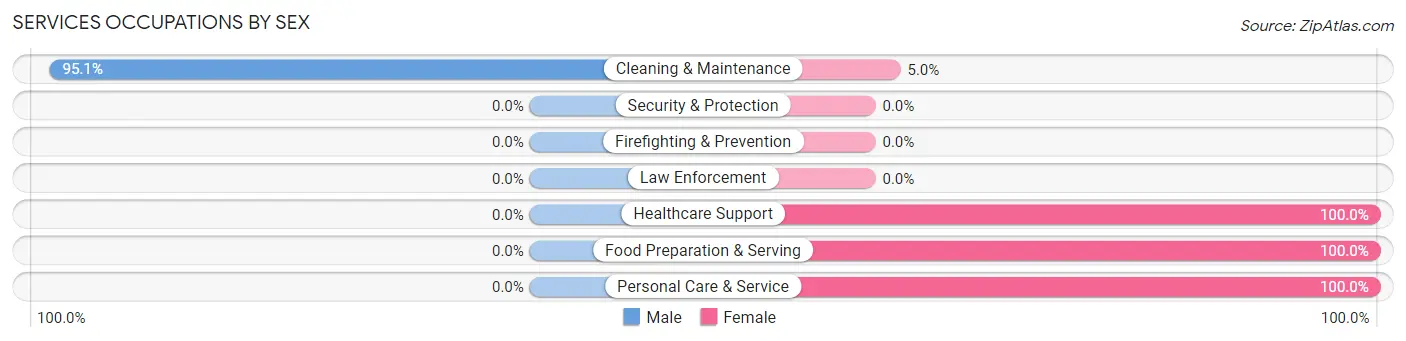
Services Occupations by Sex
| Occupation | Male | Female |
| Healthcare Support | 0 (0.0%) | 1 (100.0%) |
| Security & Protection | 0 (0.0%) | 0 (0.0%) |
| Firefighting & Prevention | 0 (0.0%) | 0 (0.0%) |
| Law Enforcement | 0 (0.0%) | 0 (0.0%) |
| Food Preparation & Serving | 0 (0.0%) | 108 (100.0%) |
| Cleaning & Maintenance | 96 (95.1%) | 5 (5.0%) |
| Personal Care & Service | 0 (0.0%) | 19 (100.0%) |
| Total (Category) | 96 (41.9%) | 133 (58.1%) |
| Total (Overall) | 371 (39.0%) | 581 (61.0%) |
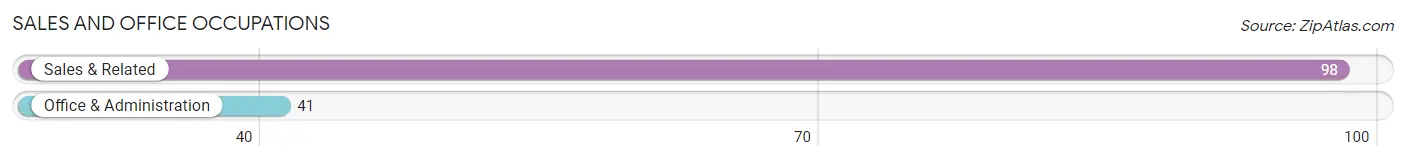
Sales and Office Occupations
The most common Sales and Office occupations in Fulton are Sales & Related (98 | 10.3%), and Office & Administration (41 | 4.3%).
Sales and Office Occupations by Sex
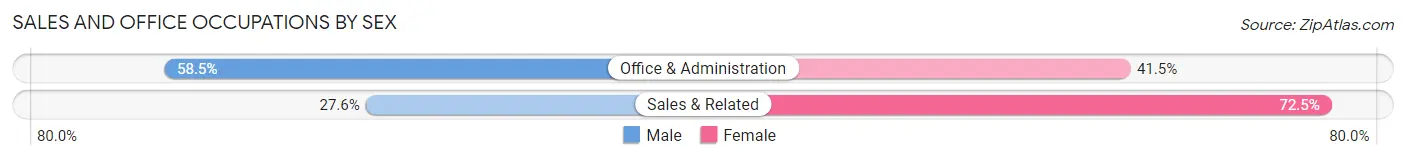
| Occupation | Male | Female |
| Sales & Related | 27 (27.6%) | 71 (72.5%) |
| Office & Administration | 24 (58.5%) | 17 (41.5%) |
| Total (Category) | 51 (36.7%) | 88 (63.3%) |
| Total (Overall) | 371 (39.0%) | 581 (61.0%) |
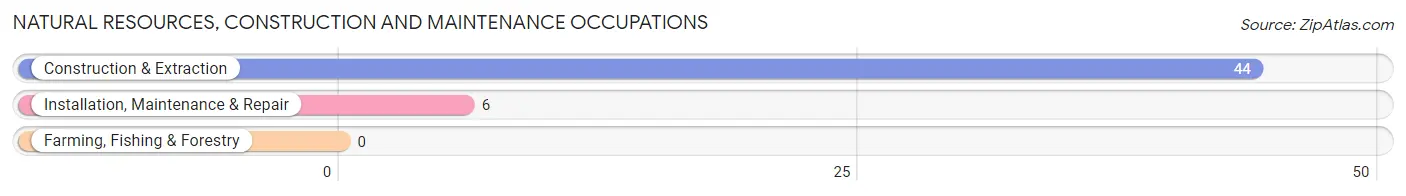
Natural Resources, Construction and Maintenance Occupations
The most common Natural Resources, Construction and Maintenance occupations in Fulton are Construction & Extraction (44 | 4.6%), and Installation, Maintenance & Repair (6 | 0.6%).
Natural Resources, Construction and Maintenance Occupations by Sex
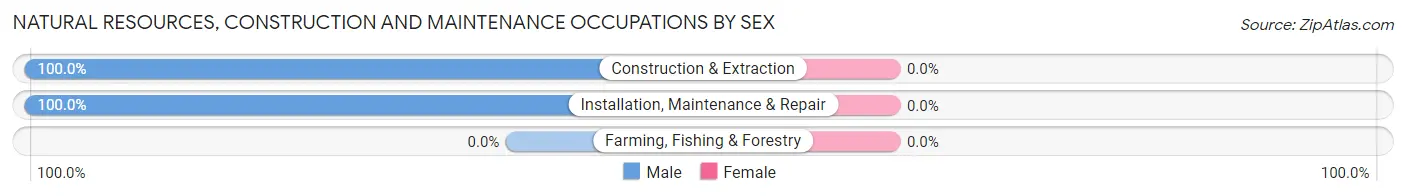
| Occupation | Male | Female |
| Farming, Fishing & Forestry | 0 (0.0%) | 0 (0.0%) |
| Construction & Extraction | 44 (100.0%) | 0 (0.0%) |
| Installation, Maintenance & Repair | 6 (100.0%) | 0 (0.0%) |
| Total (Category) | 50 (100.0%) | 0 (0.0%) |
| Total (Overall) | 371 (39.0%) | 581 (61.0%) |
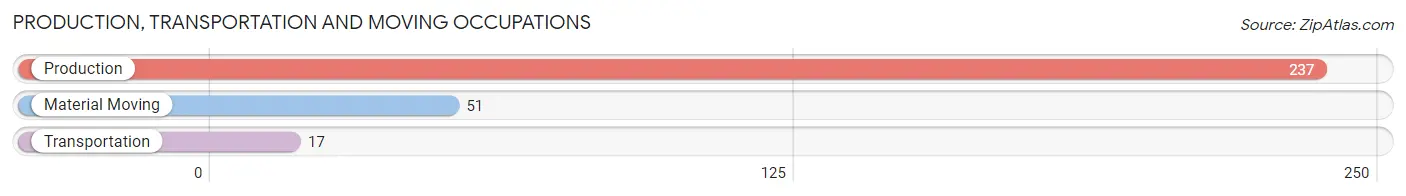
Production, Transportation and Moving Occupations
The most common Production, Transportation and Moving occupations in Fulton are Production (237 | 24.9%), Material Moving (51 | 5.4%), and Transportation (17 | 1.8%).
Production, Transportation and Moving Occupations by Sex
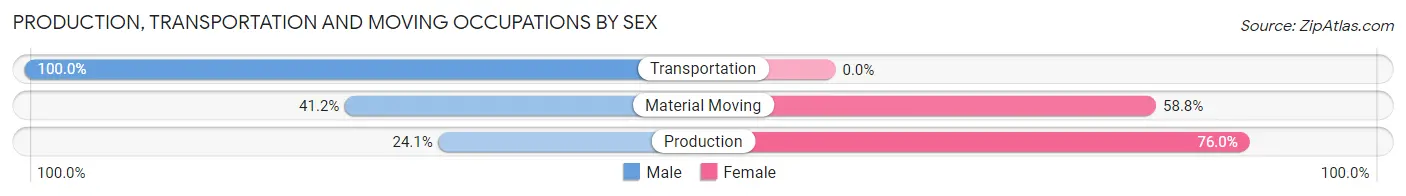
| Occupation | Male | Female |
| Production | 57 (24.0%) | 180 (75.9%) |
| Transportation | 17 (100.0%) | 0 (0.0%) |
| Material Moving | 21 (41.2%) | 30 (58.8%) |
| Total (Category) | 95 (31.1%) | 210 (68.9%) |
| Total (Overall) | 371 (39.0%) | 581 (61.0%) |
Employment Industries by Sex in Fulton
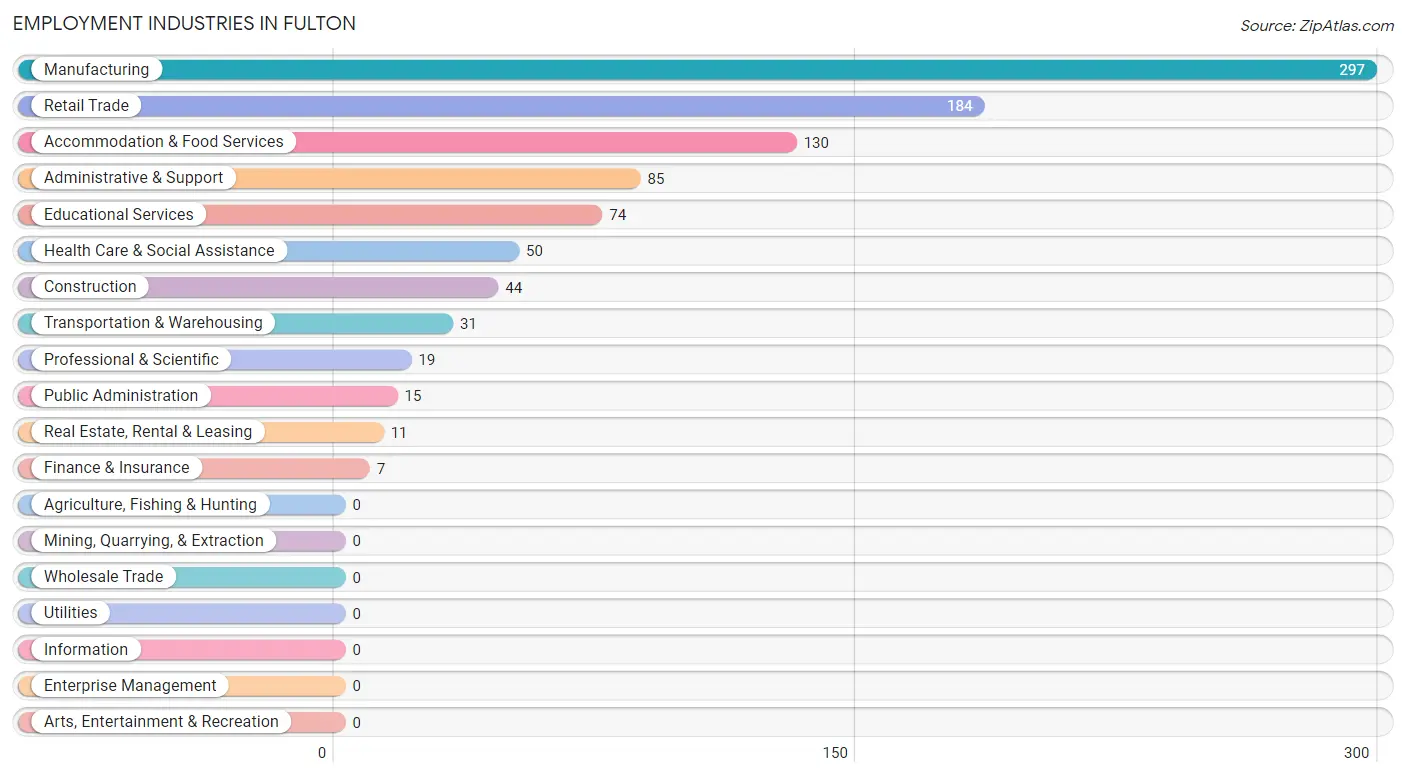
Employment Industries in Fulton
The major employment industries in Fulton include Manufacturing (297 | 31.2%), Retail Trade (184 | 19.3%), Accommodation & Food Services (130 | 13.7%), Administrative & Support (85 | 8.9%), and Educational Services (74 | 7.8%).
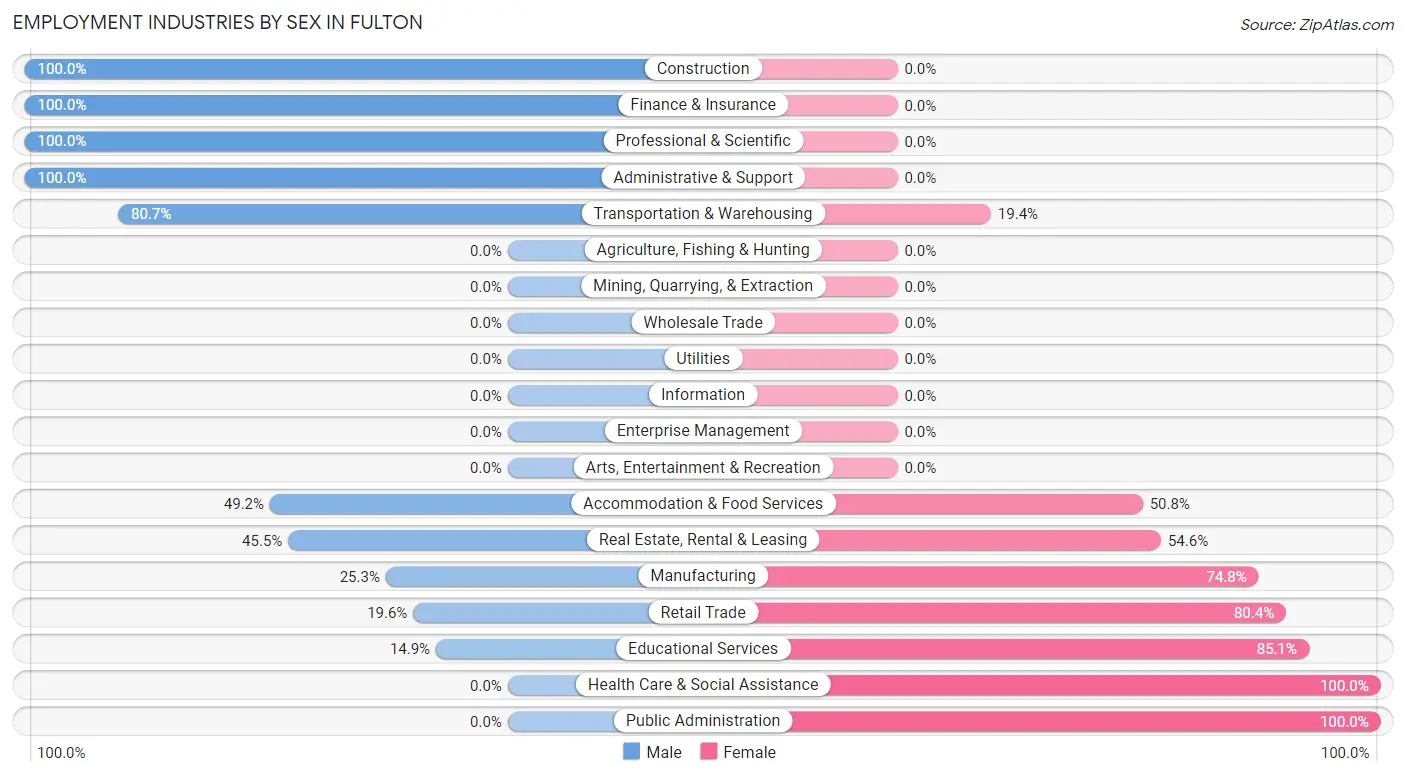
Employment Industries by Sex in Fulton
The Fulton industries that see more men than women are Construction (100.0%), Finance & Insurance (100.0%), and Professional & Scientific (100.0%), whereas the industries that tend to have a higher number of women are Health Care & Social Assistance (100.0%), Public Administration (100.0%), and Educational Services (85.1%).
| Industry | Male | Female |
| Agriculture, Fishing & Hunting | 0 (0.0%) | 0 (0.0%) |
| Mining, Quarrying, & Extraction | 0 (0.0%) | 0 (0.0%) |
| Construction | 44 (100.0%) | 0 (0.0%) |
| Manufacturing | 75 (25.3%) | 222 (74.8%) |
| Wholesale Trade | 0 (0.0%) | 0 (0.0%) |
| Retail Trade | 36 (19.6%) | 148 (80.4%) |
| Transportation & Warehousing | 25 (80.6%) | 6 (19.4%) |
| Utilities | 0 (0.0%) | 0 (0.0%) |
| Information | 0 (0.0%) | 0 (0.0%) |
| Finance & Insurance | 7 (100.0%) | 0 (0.0%) |
| Real Estate, Rental & Leasing | 5 (45.5%) | 6 (54.5%) |
| Professional & Scientific | 19 (100.0%) | 0 (0.0%) |
| Enterprise Management | 0 (0.0%) | 0 (0.0%) |
| Administrative & Support | 85 (100.0%) | 0 (0.0%) |
| Educational Services | 11 (14.9%) | 63 (85.1%) |
| Health Care & Social Assistance | 0 (0.0%) | 50 (100.0%) |
| Arts, Entertainment & Recreation | 0 (0.0%) | 0 (0.0%) |
| Accommodation & Food Services | 64 (49.2%) | 66 (50.8%) |
| Public Administration | 0 (0.0%) | 15 (100.0%) |
| Total | 371 (39.0%) | 581 (61.0%) |
Education in Fulton
School Enrollment in Fulton
The most common levels of schooling among the 651 students in Fulton are elementary school (282 | 43.3%), middle school (140 | 21.5%), and high school (87 | 13.4%).
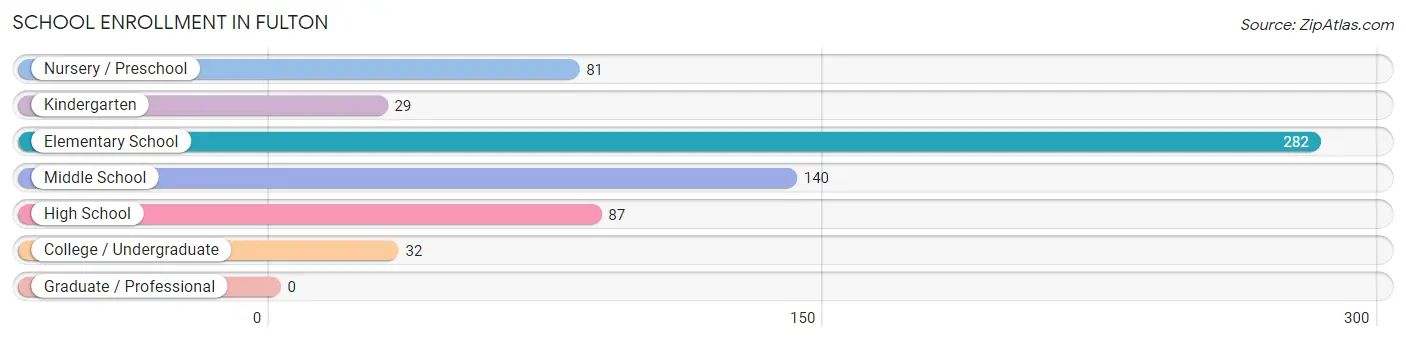
| School Level | # Students | % Students |
| Nursery / Preschool | 81 | 12.4% |
| Kindergarten | 29 | 4.4% |
| Elementary School | 282 | 43.3% |
| Middle School | 140 | 21.5% |
| High School | 87 | 13.4% |
| College / Undergraduate | 32 | 4.9% |
| Graduate / Professional | 0 | 0.0% |
| Total | 651 | 100.0% |
School Enrollment by Age by Funding Source in Fulton
Out of a total of 651 students who are enrolled in schools in Fulton, 40 (6.1%) attend a private institution, while the remaining 611 (93.9%) are enrolled in public schools. The age group of 15 to 17 year olds has the highest likelihood of being enrolled in private schools, with 26 (29.9% in the age bracket) enrolled. Conversely, the age group of 3 to 4 year olds has the lowest likelihood of being enrolled in a private school, with 81 (100.0% in the age bracket) attending a public institution.
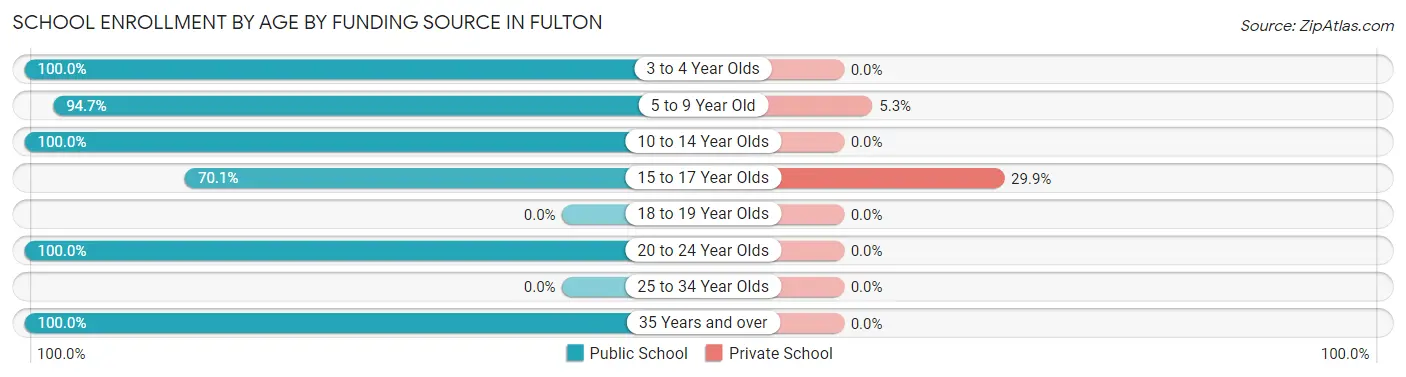
| Age Bracket | Public School | Private School |
| 3 to 4 Year Olds | 81 (100.0%) | 0 (0.0%) |
| 5 to 9 Year Old | 248 (94.7%) | 14 (5.3%) |
| 10 to 14 Year Olds | 189 (100.0%) | 0 (0.0%) |
| 15 to 17 Year Olds | 61 (70.1%) | 26 (29.9%) |
| 18 to 19 Year Olds | 0 (0.0%) | 0 (0.0%) |
| 20 to 24 Year Olds | 17 (100.0%) | 0 (0.0%) |
| 25 to 34 Year Olds | 0 (0.0%) | 0 (0.0%) |
| 35 Years and over | 15 (100.0%) | 0 (0.0%) |
| Total | 611 (93.9%) | 40 (6.1%) |
Educational Attainment by Field of Study in Fulton
Business (70 | 23.0%), arts & humanities (70 | 23.0%), communications (64 | 21.0%), education (42 | 13.8%), and social sciences (15 | 4.9%) are the most common fields of study among 305 individuals in Fulton who have obtained a bachelor's degree or higher.
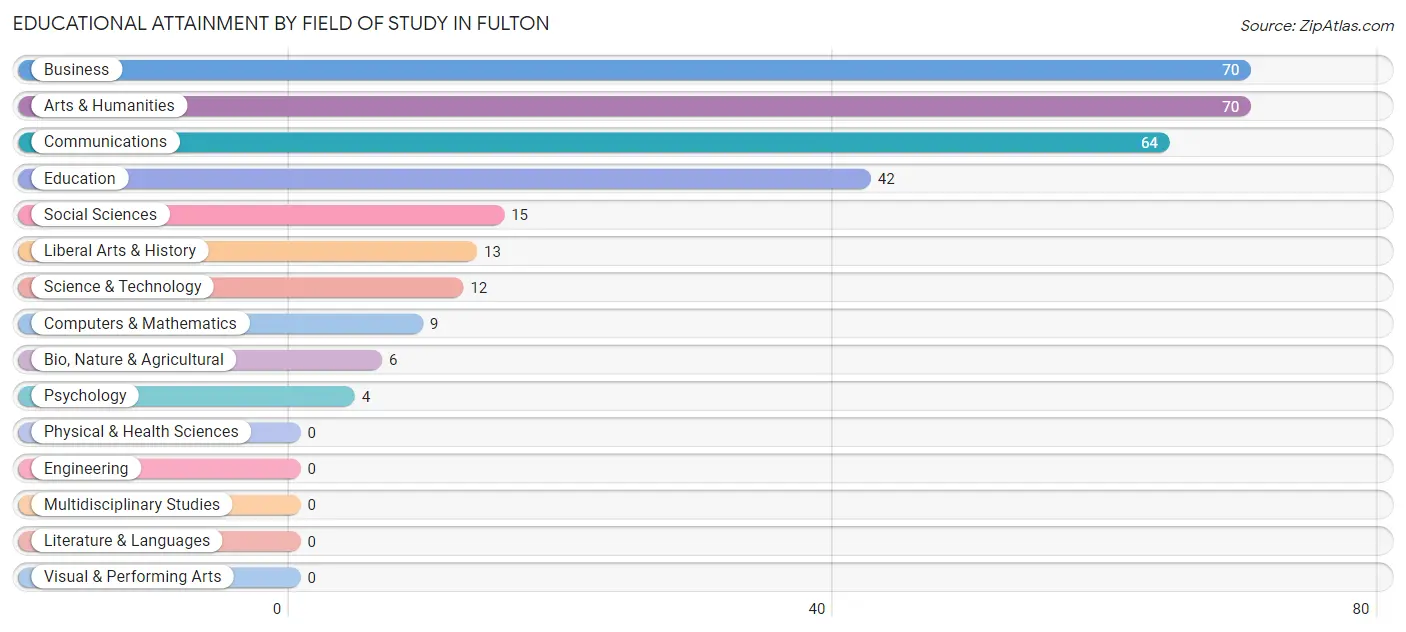
| Field of Study | # Graduates | % Graduates |
| Computers & Mathematics | 9 | 2.9% |
| Bio, Nature & Agricultural | 6 | 2.0% |
| Physical & Health Sciences | 0 | 0.0% |
| Psychology | 4 | 1.3% |
| Social Sciences | 15 | 4.9% |
| Engineering | 0 | 0.0% |
| Multidisciplinary Studies | 0 | 0.0% |
| Science & Technology | 12 | 3.9% |
| Business | 70 | 23.0% |
| Education | 42 | 13.8% |
| Literature & Languages | 0 | 0.0% |
| Liberal Arts & History | 13 | 4.3% |
| Visual & Performing Arts | 0 | 0.0% |
| Communications | 64 | 21.0% |
| Arts & Humanities | 70 | 23.0% |
| Total | 305 | 100.0% |
Transportation & Commute in Fulton
Vehicle Availability by Sex in Fulton
The most prevalent vehicle ownership categories in Fulton are males with 3 vehicles (147, accounting for 37.8%) and females with 3 vehicles (124, making up 27.9%).
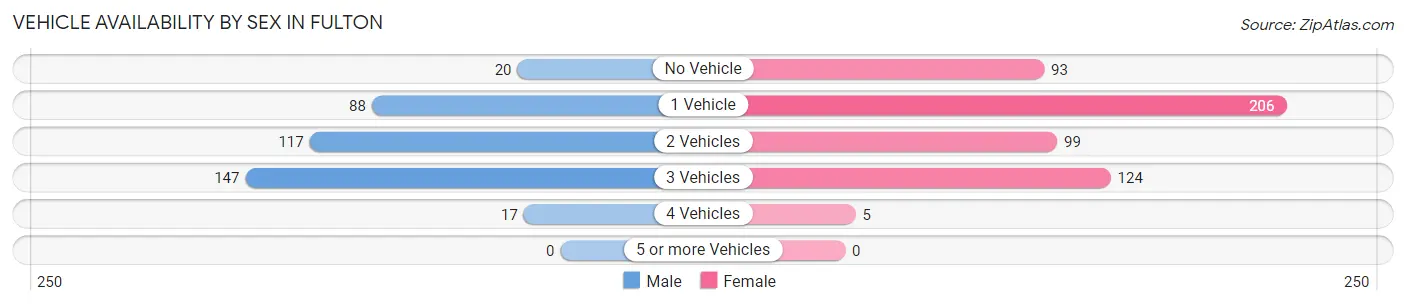
| Vehicles Available | Male | Female |
| No Vehicle | 20 (5.1%) | 93 (17.6%) |
| 1 Vehicle | 88 (22.6%) | 206 (39.1%) |
| 2 Vehicles | 117 (30.1%) | 99 (18.8%) |
| 3 Vehicles | 147 (37.8%) | 124 (23.5%) |
| 4 Vehicles | 17 (4.4%) | 5 (0.9%) |
| 5 or more Vehicles | 0 (0.0%) | 0 (0.0%) |
| Total | 389 (100.0%) | 527 (100.0%) |
Commute Time in Fulton
The most frequently occuring commute durations in Fulton are 10 to 14 minutes (260 commuters, 29.4%), 15 to 19 minutes (203 commuters, 23.0%), and 5 to 9 minutes (162 commuters, 18.3%).
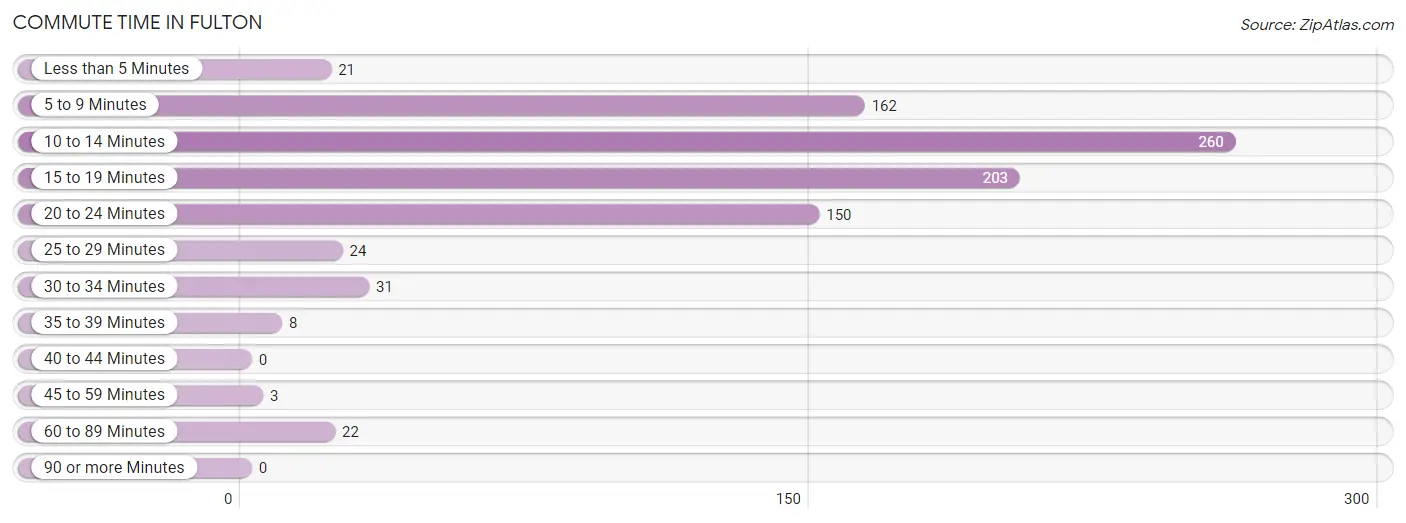
| Commute Time | # Commuters | % Commuters |
| Less than 5 Minutes | 21 | 2.4% |
| 5 to 9 Minutes | 162 | 18.3% |
| 10 to 14 Minutes | 260 | 29.4% |
| 15 to 19 Minutes | 203 | 23.0% |
| 20 to 24 Minutes | 150 | 17.0% |
| 25 to 29 Minutes | 24 | 2.7% |
| 30 to 34 Minutes | 31 | 3.5% |
| 35 to 39 Minutes | 8 | 0.9% |
| 40 to 44 Minutes | 0 | 0.0% |
| 45 to 59 Minutes | 3 | 0.3% |
| 60 to 89 Minutes | 22 | 2.5% |
| 90 or more Minutes | 0 | 0.0% |
Commute Time by Sex in Fulton
The most common commute times in Fulton are 15 to 19 minutes (162 commuters, 44.6%) for males and 10 to 14 minutes (137 commuters, 26.3%) for females.
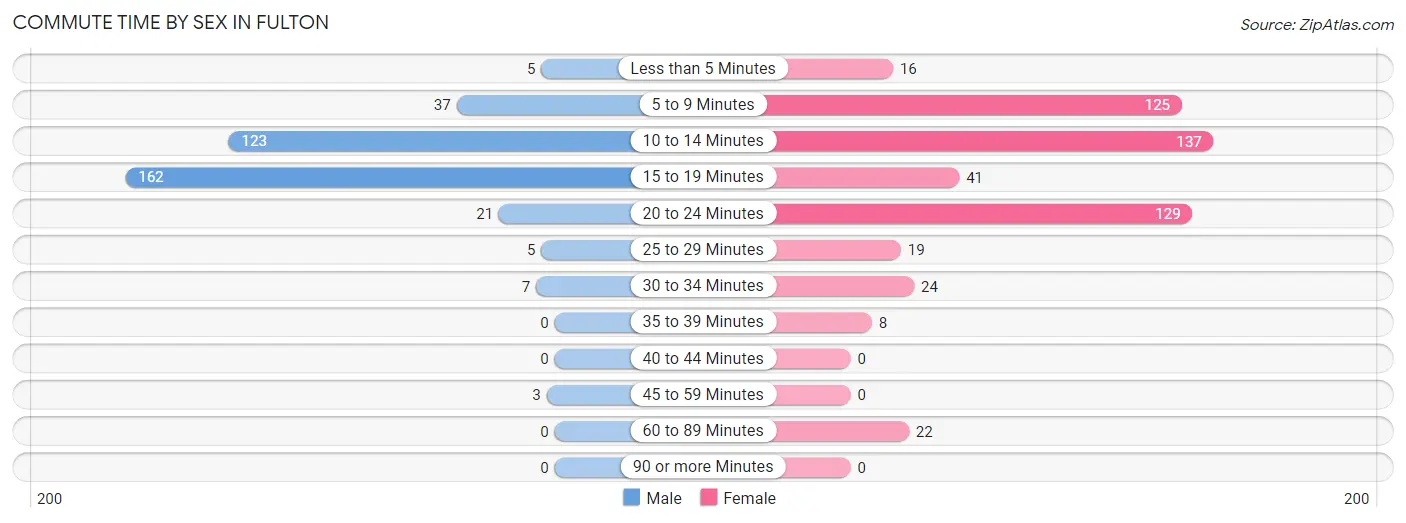
| Commute Time | Male | Female |
| Less than 5 Minutes | 5 (1.4%) | 16 (3.1%) |
| 5 to 9 Minutes | 37 (10.2%) | 125 (24.0%) |
| 10 to 14 Minutes | 123 (33.9%) | 137 (26.3%) |
| 15 to 19 Minutes | 162 (44.6%) | 41 (7.9%) |
| 20 to 24 Minutes | 21 (5.8%) | 129 (24.8%) |
| 25 to 29 Minutes | 5 (1.4%) | 19 (3.6%) |
| 30 to 34 Minutes | 7 (1.9%) | 24 (4.6%) |
| 35 to 39 Minutes | 0 (0.0%) | 8 (1.5%) |
| 40 to 44 Minutes | 0 (0.0%) | 0 (0.0%) |
| 45 to 59 Minutes | 3 (0.8%) | 0 (0.0%) |
| 60 to 89 Minutes | 0 (0.0%) | 22 (4.2%) |
| 90 or more Minutes | 0 (0.0%) | 0 (0.0%) |
Time of Departure to Work by Sex in Fulton
The most frequent times of departure to work in Fulton are 7:00 AM to 7:29 AM (148, 40.8%) for males and 7:00 AM to 7:29 AM (95, 18.2%) for females.
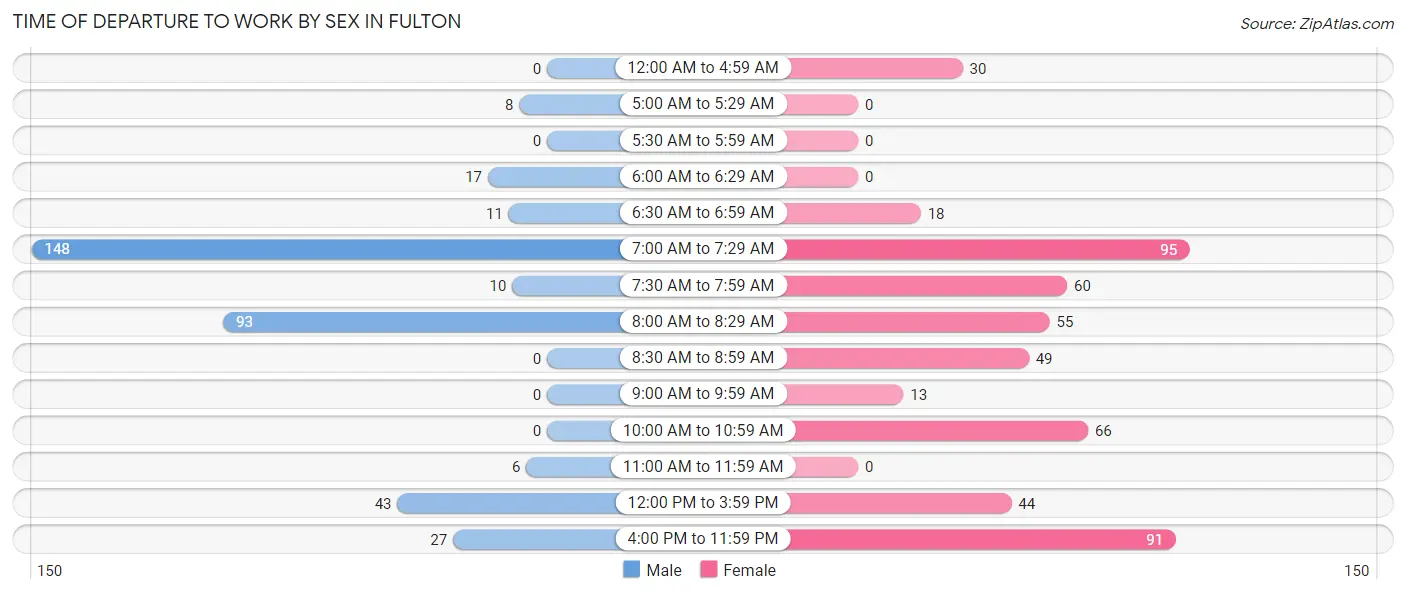
| Time of Departure | Male | Female |
| 12:00 AM to 4:59 AM | 0 (0.0%) | 30 (5.8%) |
| 5:00 AM to 5:29 AM | 8 (2.2%) | 0 (0.0%) |
| 5:30 AM to 5:59 AM | 0 (0.0%) | 0 (0.0%) |
| 6:00 AM to 6:29 AM | 17 (4.7%) | 0 (0.0%) |
| 6:30 AM to 6:59 AM | 11 (3.0%) | 18 (3.5%) |
| 7:00 AM to 7:29 AM | 148 (40.8%) | 95 (18.2%) |
| 7:30 AM to 7:59 AM | 10 (2.8%) | 60 (11.5%) |
| 8:00 AM to 8:29 AM | 93 (25.6%) | 55 (10.6%) |
| 8:30 AM to 8:59 AM | 0 (0.0%) | 49 (9.4%) |
| 9:00 AM to 9:59 AM | 0 (0.0%) | 13 (2.5%) |
| 10:00 AM to 10:59 AM | 0 (0.0%) | 66 (12.7%) |
| 11:00 AM to 11:59 AM | 6 (1.7%) | 0 (0.0%) |
| 12:00 PM to 3:59 PM | 43 (11.8%) | 44 (8.5%) |
| 4:00 PM to 11:59 PM | 27 (7.4%) | 91 (17.5%) |
| Total | 363 (100.0%) | 521 (100.0%) |
Housing Occupancy in Fulton
Occupancy by Ownership in Fulton
Of the total 955 dwellings in Fulton, owner-occupied units account for 533 (55.8%), while renter-occupied units make up 422 (44.2%).
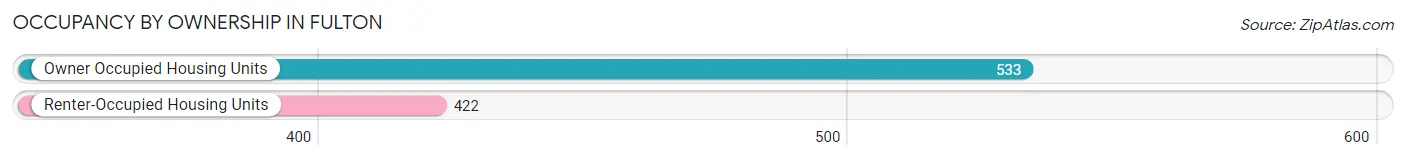
| Occupancy | # Housing Units | % Housing Units |
| Owner Occupied Housing Units | 533 | 55.8% |
| Renter-Occupied Housing Units | 422 | 44.2% |
| Total Occupied Housing Units | 955 | 100.0% |
Occupancy by Household Size in Fulton
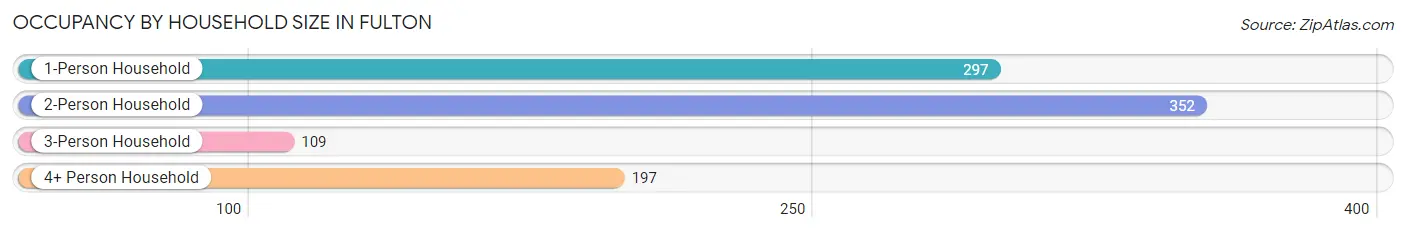
| Household Size | # Housing Units | % Housing Units |
| 1-Person Household | 297 | 31.1% |
| 2-Person Household | 352 | 36.9% |
| 3-Person Household | 109 | 11.4% |
| 4+ Person Household | 197 | 20.6% |
| Total Housing Units | 955 | 100.0% |
Occupancy by Ownership by Household Size in Fulton
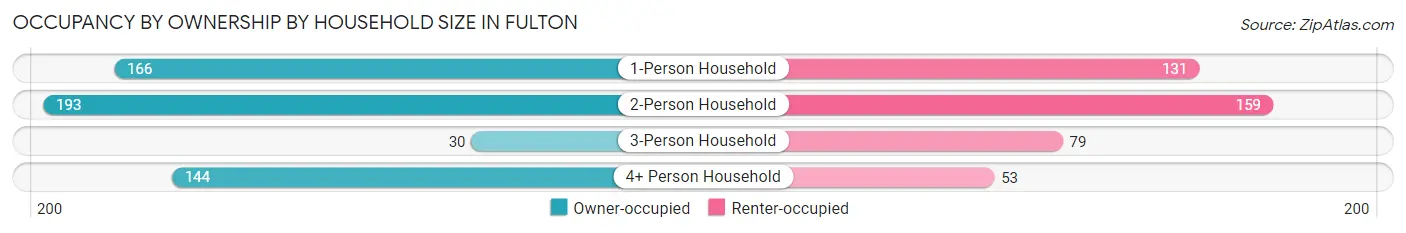
| Household Size | Owner-occupied | Renter-occupied |
| 1-Person Household | 166 (55.9%) | 131 (44.1%) |
| 2-Person Household | 193 (54.8%) | 159 (45.2%) |
| 3-Person Household | 30 (27.5%) | 79 (72.5%) |
| 4+ Person Household | 144 (73.1%) | 53 (26.9%) |
| Total Housing Units | 533 (55.8%) | 422 (44.2%) |
Occupancy by Educational Attainment in Fulton
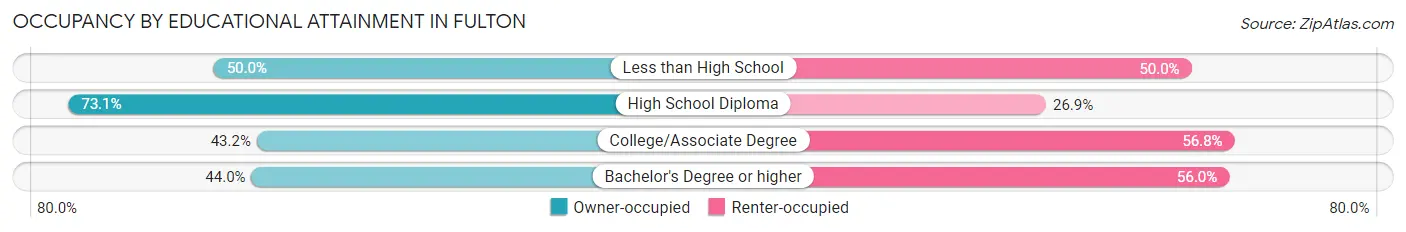
| Household Size | Owner-occupied | Renter-occupied |
| Less than High School | 86 (50.0%) | 86 (50.0%) |
| High School Diploma | 263 (73.1%) | 97 (26.9%) |
| College/Associate Degree | 114 (43.2%) | 150 (56.8%) |
| Bachelor's Degree or higher | 70 (44.0%) | 89 (56.0%) |
Occupancy by Age of Householder in Fulton
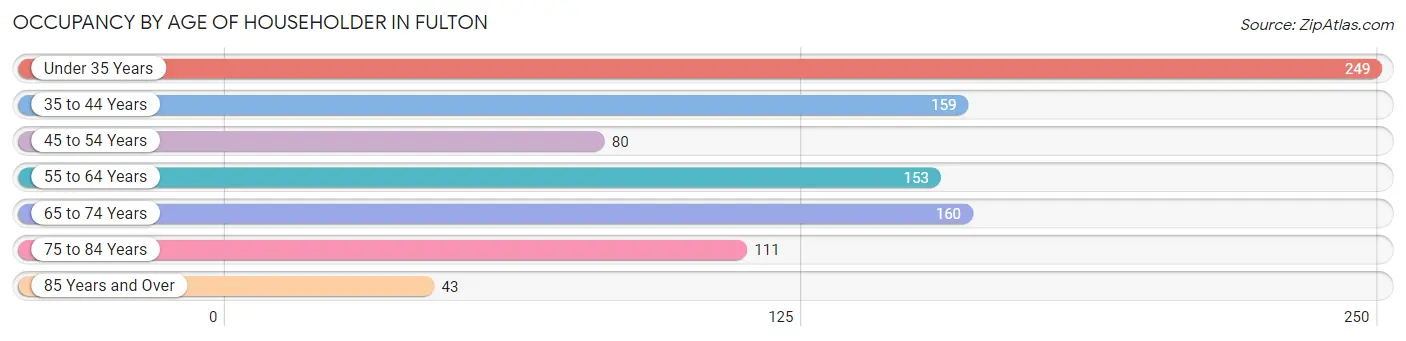
| Age Bracket | # Households | % Households |
| Under 35 Years | 249 | 26.1% |
| 35 to 44 Years | 159 | 16.7% |
| 45 to 54 Years | 80 | 8.4% |
| 55 to 64 Years | 153 | 16.0% |
| 65 to 74 Years | 160 | 16.8% |
| 75 to 84 Years | 111 | 11.6% |
| 85 Years and Over | 43 | 4.5% |
| Total | 955 | 100.0% |
Housing Finances in Fulton
Median Income by Occupancy in Fulton
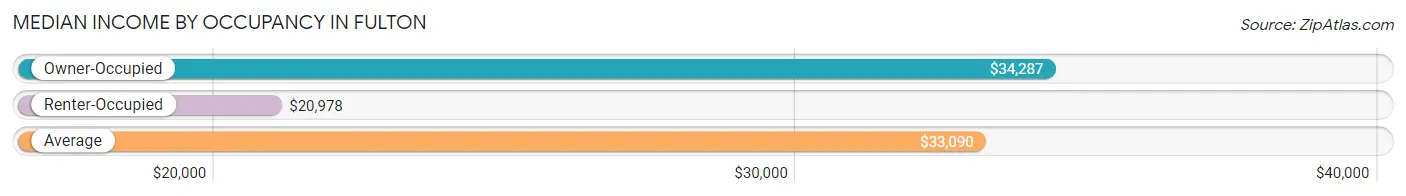
| Occupancy Type | # Households | Median Income |
| Owner-Occupied | 533 (55.8%) | $34,287 |
| Renter-Occupied | 422 (44.2%) | $20,978 |
| Average | 955 (100.0%) | $33,090 |
Occupancy by Householder Income Bracket in Fulton
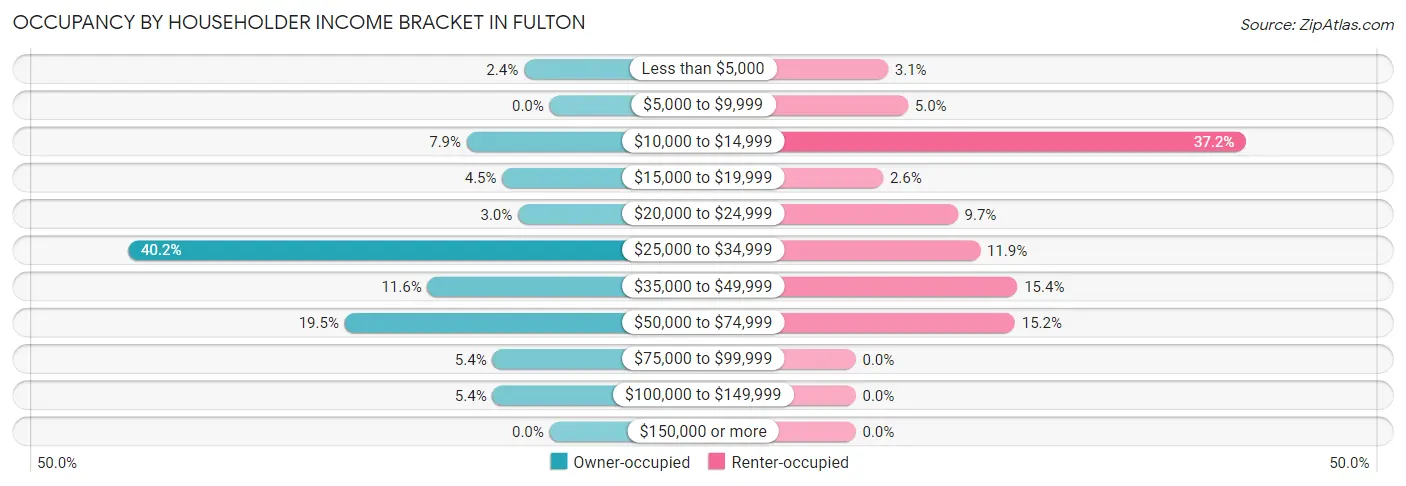
| Income Bracket | Owner-occupied | Renter-occupied |
| Less than $5,000 | 13 (2.4%) | 13 (3.1%) |
| $5,000 to $9,999 | 0 (0.0%) | 21 (5.0%) |
| $10,000 to $14,999 | 42 (7.9%) | 157 (37.2%) |
| $15,000 to $19,999 | 24 (4.5%) | 11 (2.6%) |
| $20,000 to $24,999 | 16 (3.0%) | 41 (9.7%) |
| $25,000 to $34,999 | 214 (40.2%) | 50 (11.8%) |
| $35,000 to $49,999 | 62 (11.6%) | 65 (15.4%) |
| $50,000 to $74,999 | 104 (19.5%) | 64 (15.2%) |
| $75,000 to $99,999 | 29 (5.4%) | 0 (0.0%) |
| $100,000 to $149,999 | 29 (5.4%) | 0 (0.0%) |
| $150,000 or more | 0 (0.0%) | 0 (0.0%) |
| Total | 533 (100.0%) | 422 (100.0%) |
Monthly Housing Cost Tiers in Fulton
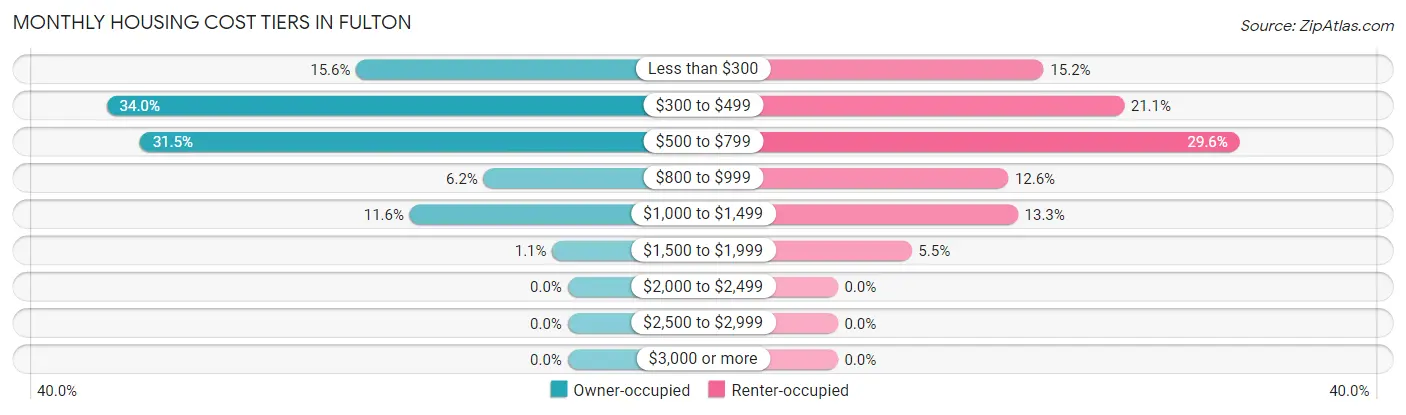
| Monthly Cost | Owner-occupied | Renter-occupied |
| Less than $300 | 83 (15.6%) | 64 (15.2%) |
| $300 to $499 | 181 (34.0%) | 89 (21.1%) |
| $500 to $799 | 168 (31.5%) | 125 (29.6%) |
| $800 to $999 | 33 (6.2%) | 53 (12.6%) |
| $1,000 to $1,499 | 62 (11.6%) | 56 (13.3%) |
| $1,500 to $1,999 | 6 (1.1%) | 23 (5.4%) |
| $2,000 to $2,499 | 0 (0.0%) | 0 (0.0%) |
| $2,500 to $2,999 | 0 (0.0%) | 0 (0.0%) |
| $3,000 or more | 0 (0.0%) | 0 (0.0%) |
| Total | 533 (100.0%) | 422 (100.0%) |
Physical Housing Characteristics in Fulton
Housing Structures in Fulton
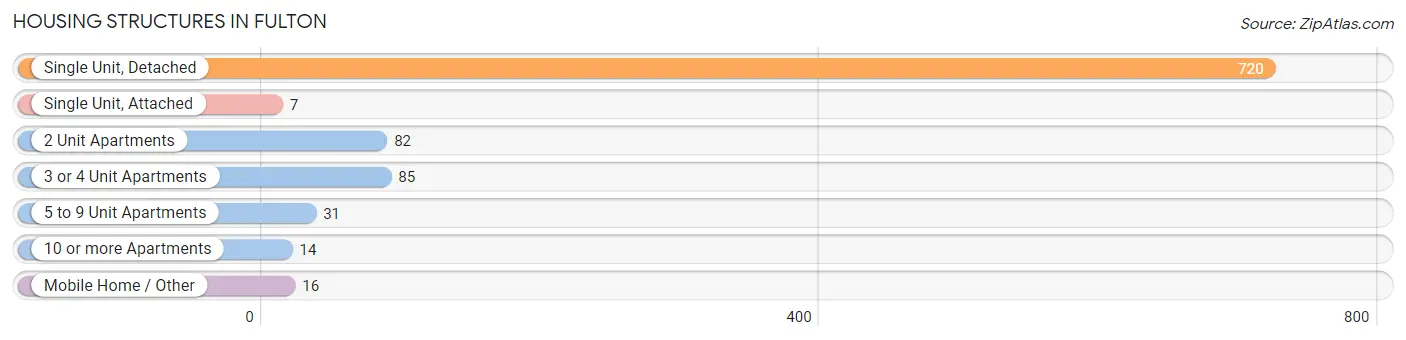
| Structure Type | # Housing Units | % Housing Units |
| Single Unit, Detached | 720 | 75.4% |
| Single Unit, Attached | 7 | 0.7% |
| 2 Unit Apartments | 82 | 8.6% |
| 3 or 4 Unit Apartments | 85 | 8.9% |
| 5 to 9 Unit Apartments | 31 | 3.3% |
| 10 or more Apartments | 14 | 1.5% |
| Mobile Home / Other | 16 | 1.7% |
| Total | 955 | 100.0% |
Housing Structures by Occupancy in Fulton
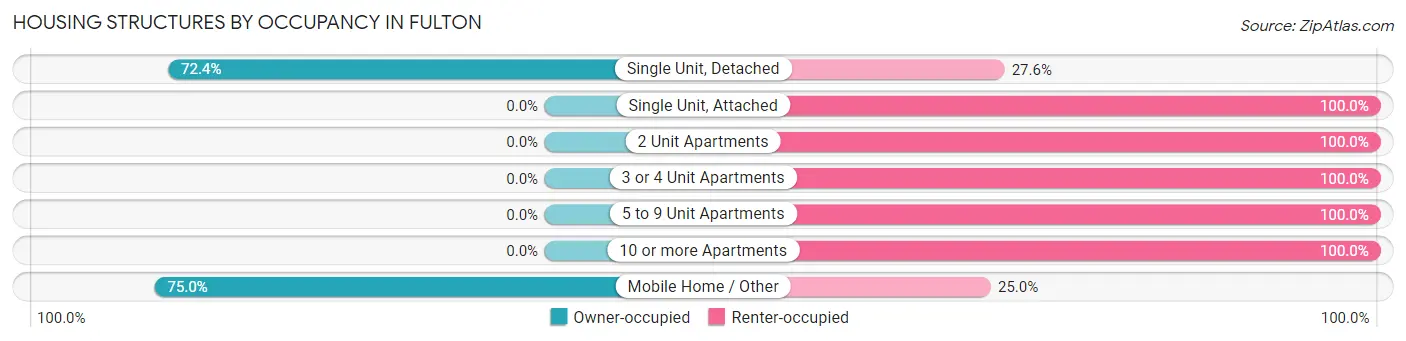
| Structure Type | Owner-occupied | Renter-occupied |
| Single Unit, Detached | 521 (72.4%) | 199 (27.6%) |
| Single Unit, Attached | 0 (0.0%) | 7 (100.0%) |
| 2 Unit Apartments | 0 (0.0%) | 82 (100.0%) |
| 3 or 4 Unit Apartments | 0 (0.0%) | 85 (100.0%) |
| 5 to 9 Unit Apartments | 0 (0.0%) | 31 (100.0%) |
| 10 or more Apartments | 0 (0.0%) | 14 (100.0%) |
| Mobile Home / Other | 12 (75.0%) | 4 (25.0%) |
| Total | 533 (55.8%) | 422 (44.2%) |
Housing Structures by Number of Rooms in Fulton
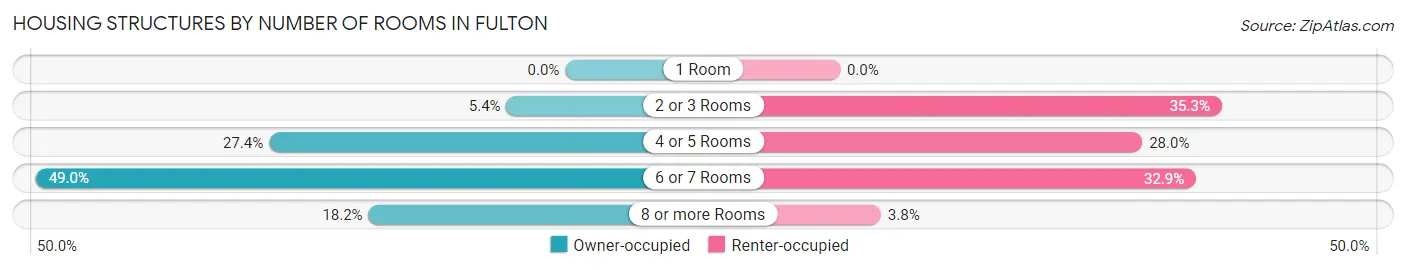
| Number of Rooms | Owner-occupied | Renter-occupied |
| 1 Room | 0 (0.0%) | 0 (0.0%) |
| 2 or 3 Rooms | 29 (5.4%) | 149 (35.3%) |
| 4 or 5 Rooms | 146 (27.4%) | 118 (28.0%) |
| 6 or 7 Rooms | 261 (49.0%) | 139 (32.9%) |
| 8 or more Rooms | 97 (18.2%) | 16 (3.8%) |
| Total | 533 (100.0%) | 422 (100.0%) |
Housing Structure by Heating Type in Fulton
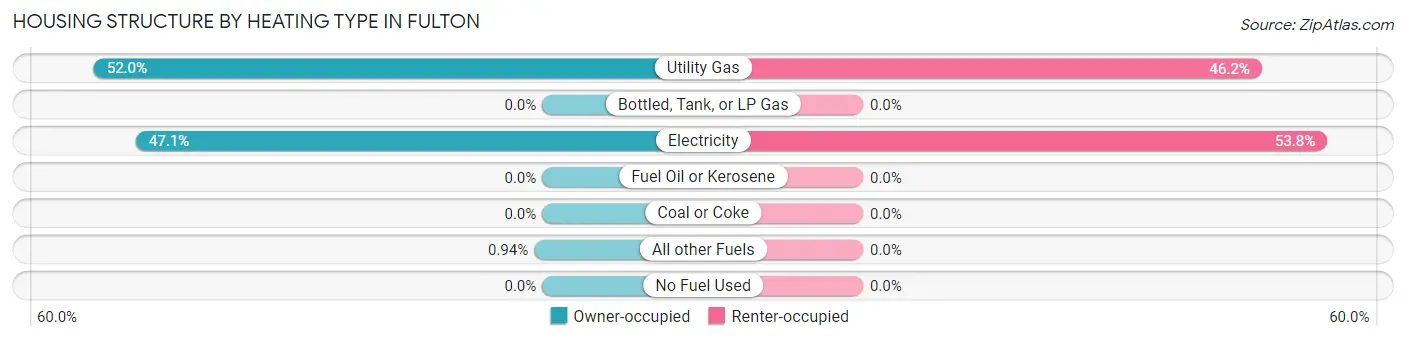
| Heating Type | Owner-occupied | Renter-occupied |
| Utility Gas | 277 (52.0%) | 195 (46.2%) |
| Bottled, Tank, or LP Gas | 0 (0.0%) | 0 (0.0%) |
| Electricity | 251 (47.1%) | 227 (53.8%) |
| Fuel Oil or Kerosene | 0 (0.0%) | 0 (0.0%) |
| Coal or Coke | 0 (0.0%) | 0 (0.0%) |
| All other Fuels | 5 (0.9%) | 0 (0.0%) |
| No Fuel Used | 0 (0.0%) | 0 (0.0%) |
| Total | 533 (100.0%) | 422 (100.0%) |
Household Vehicle Usage in Fulton
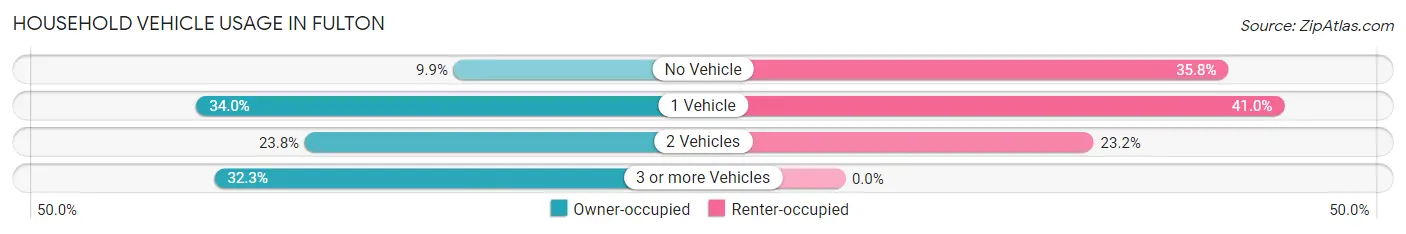
| Vehicles per Household | Owner-occupied | Renter-occupied |
| No Vehicle | 53 (9.9%) | 151 (35.8%) |
| 1 Vehicle | 181 (34.0%) | 173 (41.0%) |
| 2 Vehicles | 127 (23.8%) | 98 (23.2%) |
| 3 or more Vehicles | 172 (32.3%) | 0 (0.0%) |
| Total | 533 (100.0%) | 422 (100.0%) |
Real Estate & Mortgages in Fulton
Real Estate and Mortgage Overview in Fulton
| Characteristic | Without Mortgage | With Mortgage |
| Housing Units | 432 | 101 |
| Median Property Value | $37,300 | $157,700 |
| Median Household Income | $33,638 | $0 |
| Monthly Housing Costs | $398 | $0 |
| Real Estate Taxes | $493 | $0 |
Property Value by Mortgage Status in Fulton
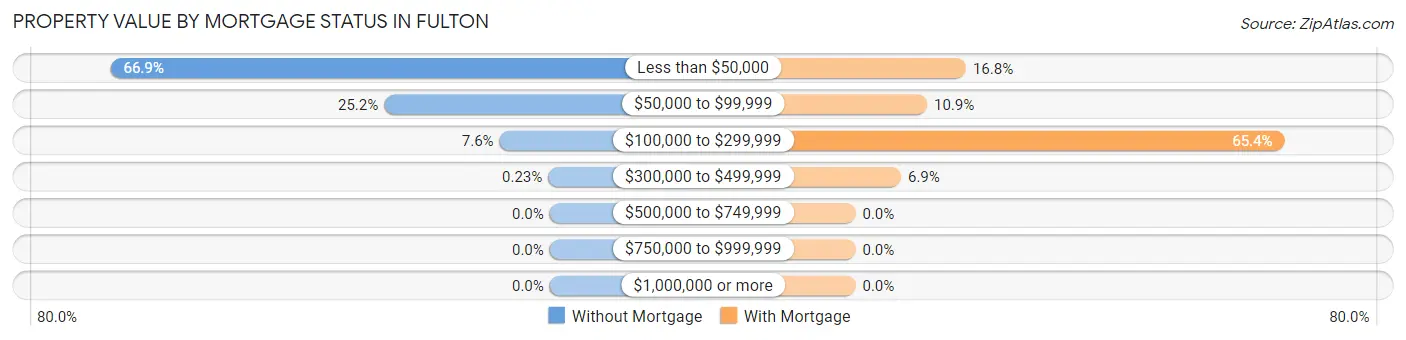
| Property Value | Without Mortgage | With Mortgage |
| Less than $50,000 | 289 (66.9%) | 17 (16.8%) |
| $50,000 to $99,999 | 109 (25.2%) | 11 (10.9%) |
| $100,000 to $299,999 | 33 (7.6%) | 66 (65.3%) |
| $300,000 to $499,999 | 1 (0.2%) | 7 (6.9%) |
| $500,000 to $749,999 | 0 (0.0%) | 0 (0.0%) |
| $750,000 to $999,999 | 0 (0.0%) | 0 (0.0%) |
| $1,000,000 or more | 0 (0.0%) | 0 (0.0%) |
| Total | 432 (100.0%) | 101 (100.0%) |
Household Income by Mortgage Status in Fulton
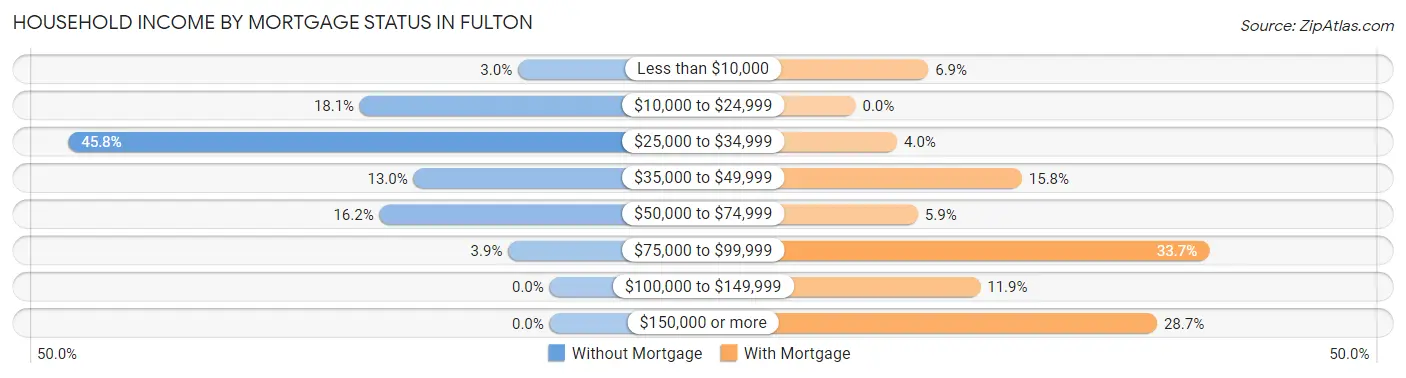
| Household Income | Without Mortgage | With Mortgage |
| Less than $10,000 | 13 (3.0%) | 7 (6.9%) |
| $10,000 to $24,999 | 78 (18.1%) | 0 (0.0%) |
| $25,000 to $34,999 | 198 (45.8%) | 4 (4.0%) |
| $35,000 to $49,999 | 56 (13.0%) | 16 (15.8%) |
| $50,000 to $74,999 | 70 (16.2%) | 6 (5.9%) |
| $75,000 to $99,999 | 17 (3.9%) | 34 (33.7%) |
| $100,000 to $149,999 | 0 (0.0%) | 12 (11.9%) |
| $150,000 or more | 0 (0.0%) | 29 (28.7%) |
| Total | 432 (100.0%) | 101 (100.0%) |
Property Value to Household Income Ratio in Fulton
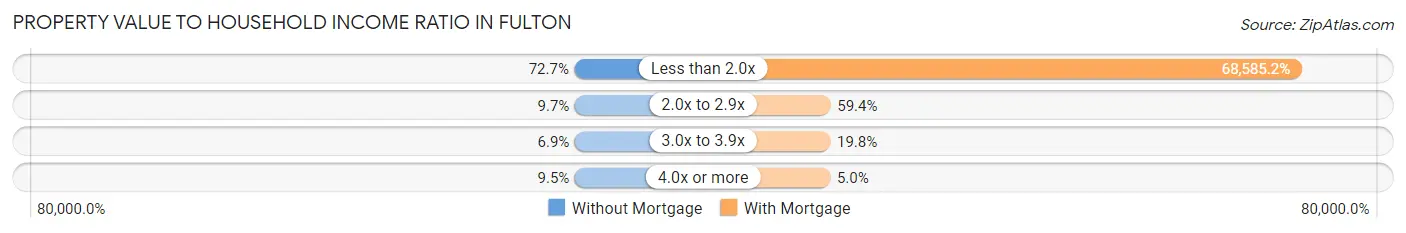
| Value-to-Income Ratio | Without Mortgage | With Mortgage |
| Less than 2.0x | 314 (72.7%) | 69,271 (68,585.1%) |
| 2.0x to 2.9x | 42 (9.7%) | 60 (59.4%) |
| 3.0x to 3.9x | 30 (6.9%) | 20 (19.8%) |
| 4.0x or more | 41 (9.5%) | 5 (5.0%) |
| Total | 432 (100.0%) | 101 (100.0%) |
Real Estate Taxes by Mortgage Status in Fulton
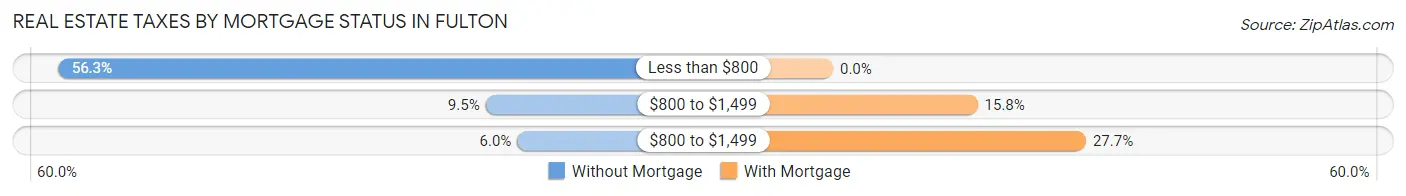
| Property Taxes | Without Mortgage | With Mortgage |
| Less than $800 | 243 (56.2%) | 0 (0.0%) |
| $800 to $1,499 | 41 (9.5%) | 16 (15.8%) |
| $800 to $1,499 | 26 (6.0%) | 28 (27.7%) |
| Total | 432 (100.0%) | 101 (100.0%) |
Health & Disability in Fulton
Health Insurance Coverage by Age in Fulton
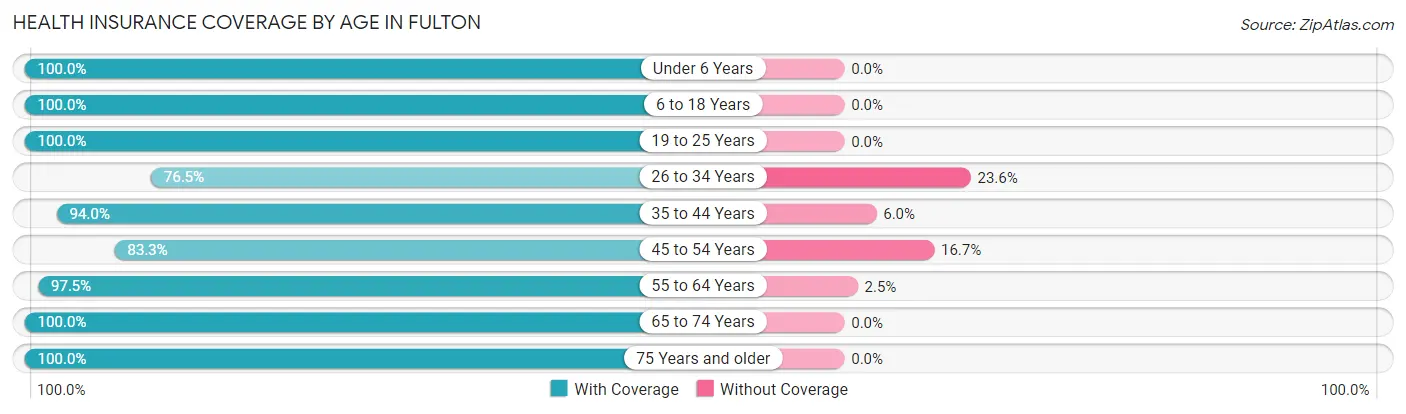
| Age Bracket | With Coverage | Without Coverage |
| Under 6 Years | 230 (100.0%) | 0 (0.0%) |
| 6 to 18 Years | 530 (100.0%) | 0 (0.0%) |
| 19 to 25 Years | 186 (100.0%) | 0 (0.0%) |
| 26 to 34 Years | 276 (76.4%) | 85 (23.5%) |
| 35 to 44 Years | 300 (94.0%) | 19 (6.0%) |
| 45 to 54 Years | 179 (83.3%) | 36 (16.7%) |
| 55 to 64 Years | 314 (97.5%) | 8 (2.5%) |
| 65 to 74 Years | 271 (100.0%) | 0 (0.0%) |
| 75 Years and older | 182 (100.0%) | 0 (0.0%) |
| Total | 2,468 (94.3%) | 148 (5.7%) |
Health Insurance Coverage by Citizenship Status in Fulton
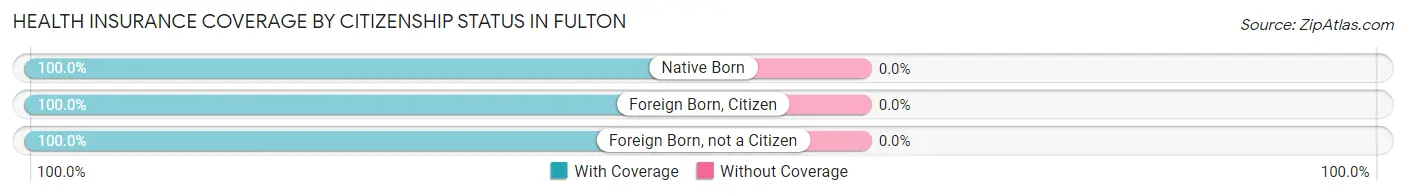
| Citizenship Status | With Coverage | Without Coverage |
| Native Born | 230 (100.0%) | 0 (0.0%) |
| Foreign Born, Citizen | 530 (100.0%) | 0 (0.0%) |
| Foreign Born, not a Citizen | 186 (100.0%) | 0 (0.0%) |
Health Insurance Coverage by Household Income in Fulton
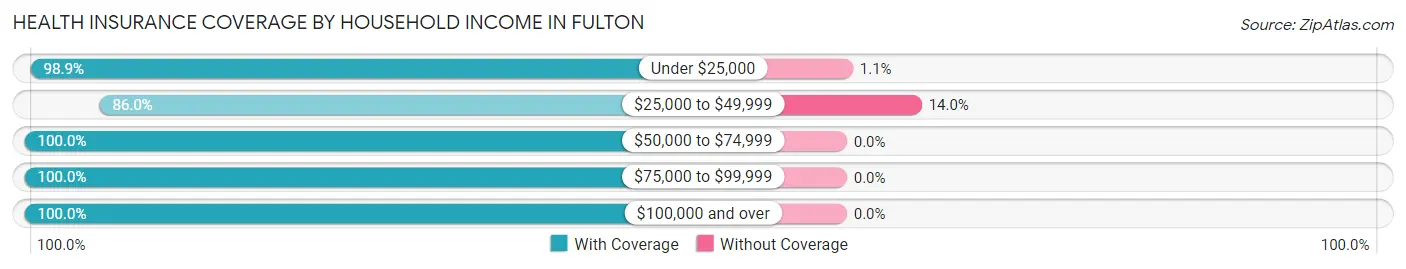
| Household Income | With Coverage | Without Coverage |
| Under $25,000 | 778 (98.9%) | 9 (1.1%) |
| $25,000 to $49,999 | 852 (86.0%) | 139 (14.0%) |
| $50,000 to $74,999 | 530 (100.0%) | 0 (0.0%) |
| $75,000 to $99,999 | 101 (100.0%) | 0 (0.0%) |
| $100,000 and over | 207 (100.0%) | 0 (0.0%) |
Public vs Private Health Insurance Coverage by Age in Fulton
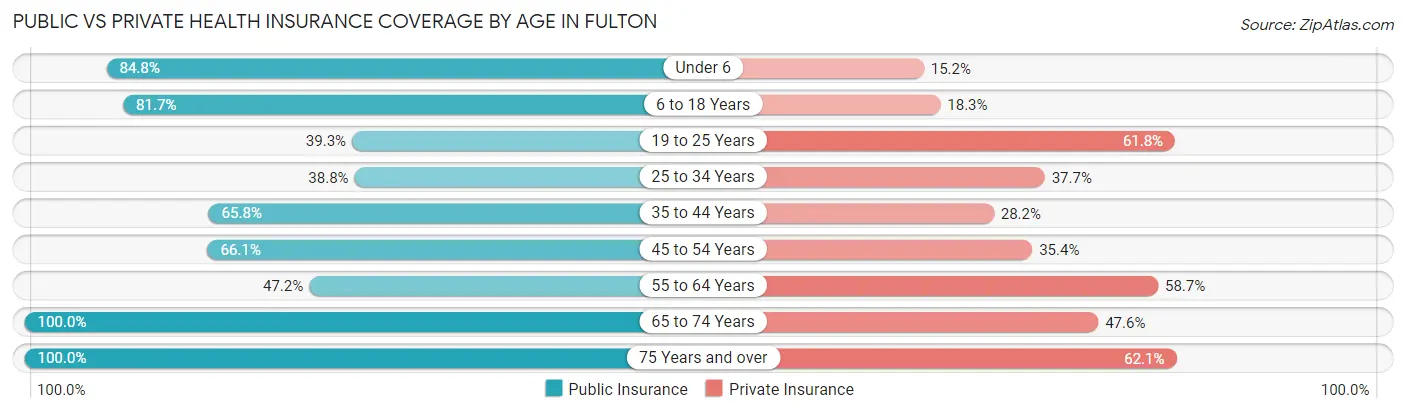
| Age Bracket | Public Insurance | Private Insurance |
| Under 6 | 195 (84.8%) | 35 (15.2%) |
| 6 to 18 Years | 433 (81.7%) | 97 (18.3%) |
| 19 to 25 Years | 73 (39.3%) | 115 (61.8%) |
| 25 to 34 Years | 140 (38.8%) | 136 (37.7%) |
| 35 to 44 Years | 210 (65.8%) | 90 (28.2%) |
| 45 to 54 Years | 142 (66.0%) | 76 (35.3%) |
| 55 to 64 Years | 152 (47.2%) | 189 (58.7%) |
| 65 to 74 Years | 271 (100.0%) | 129 (47.6%) |
| 75 Years and over | 182 (100.0%) | 113 (62.1%) |
| Total | 1,798 (68.7%) | 980 (37.5%) |
Disability Status by Sex by Age in Fulton
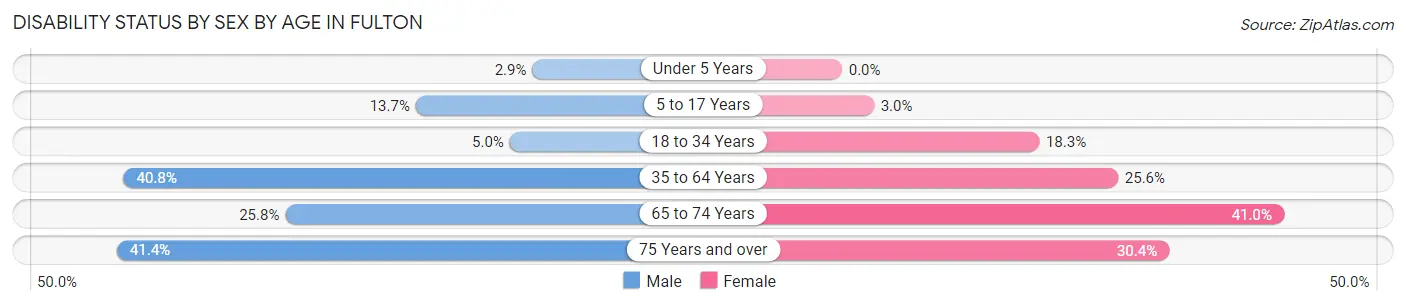
| Age Bracket | Male | Female |
| Under 5 Years | 3 (2.9%) | 0 (0.0%) |
| 5 to 17 Years | 40 (13.7%) | 8 (3.0%) |
| 18 to 34 Years | 12 (5.0%) | 56 (18.3%) |
| 35 to 64 Years | 120 (40.8%) | 144 (25.6%) |
| 65 to 74 Years | 24 (25.8%) | 73 (41.0%) |
| 75 Years and over | 29 (41.4%) | 34 (30.4%) |
Disability Class by Sex by Age in Fulton
Disability Class: Hearing Difficulty
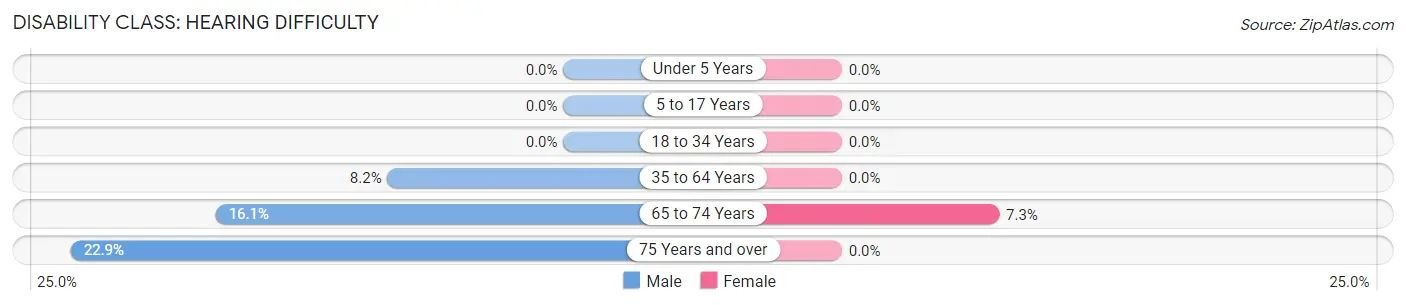
| Age Bracket | Male | Female |
| Under 5 Years | 0 (0.0%) | 0 (0.0%) |
| 5 to 17 Years | 0 (0.0%) | 0 (0.0%) |
| 18 to 34 Years | 0 (0.0%) | 0 (0.0%) |
| 35 to 64 Years | 24 (8.2%) | 0 (0.0%) |
| 65 to 74 Years | 15 (16.1%) | 13 (7.3%) |
| 75 Years and over | 16 (22.9%) | 0 (0.0%) |
Disability Class: Vision Difficulty
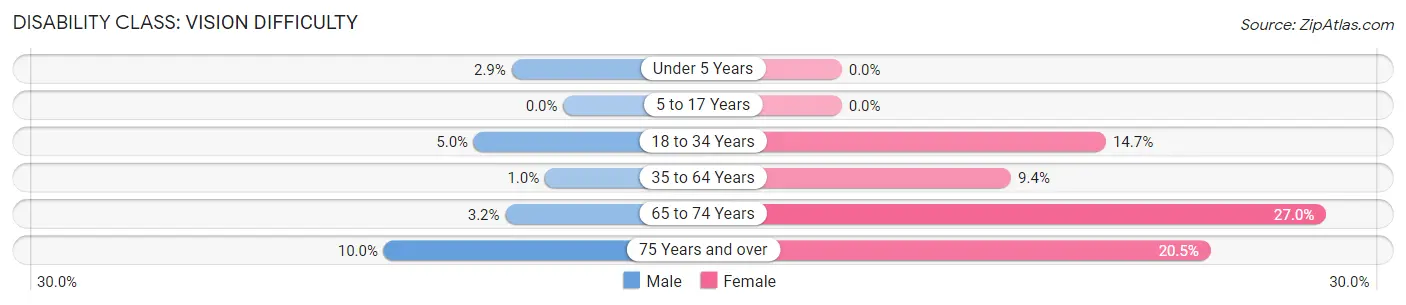
| Age Bracket | Male | Female |
| Under 5 Years | 3 (2.9%) | 0 (0.0%) |
| 5 to 17 Years | 0 (0.0%) | 0 (0.0%) |
| 18 to 34 Years | 12 (5.0%) | 45 (14.7%) |
| 35 to 64 Years | 3 (1.0%) | 53 (9.4%) |
| 65 to 74 Years | 3 (3.2%) | 48 (27.0%) |
| 75 Years and over | 7 (10.0%) | 23 (20.5%) |
Disability Class: Cognitive Difficulty
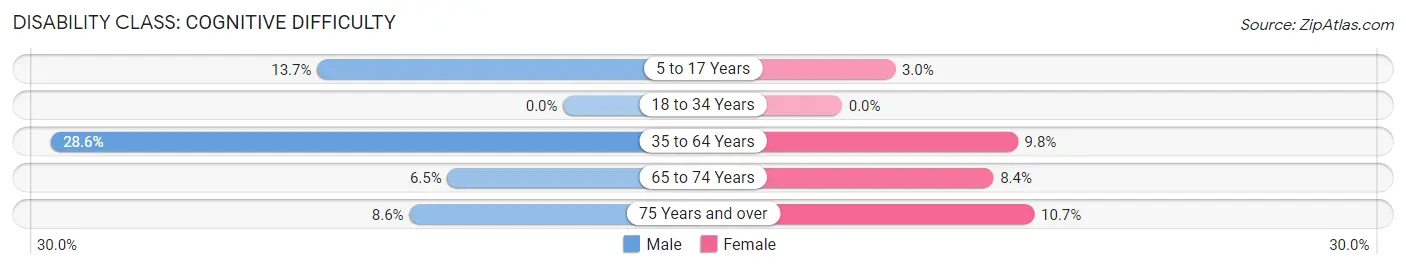
| Age Bracket | Male | Female |
| 5 to 17 Years | 40 (13.7%) | 8 (3.0%) |
| 18 to 34 Years | 0 (0.0%) | 0 (0.0%) |
| 35 to 64 Years | 84 (28.6%) | 55 (9.8%) |
| 65 to 74 Years | 6 (6.5%) | 15 (8.4%) |
| 75 Years and over | 6 (8.6%) | 12 (10.7%) |
Disability Class: Ambulatory Difficulty
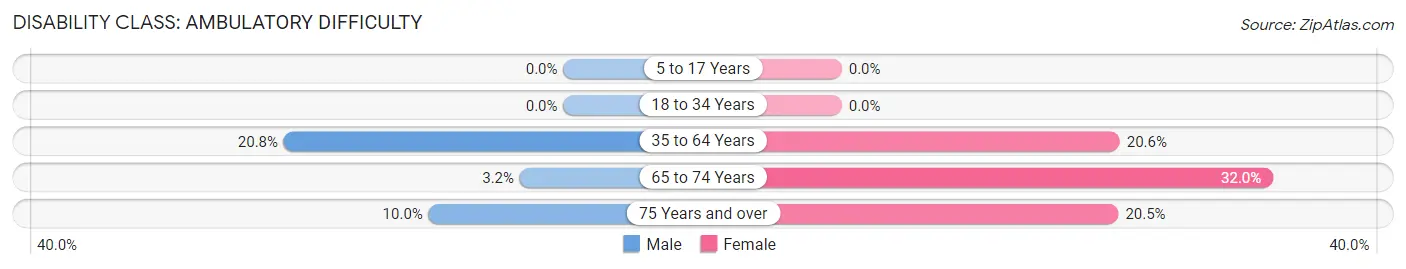
| Age Bracket | Male | Female |
| 5 to 17 Years | 0 (0.0%) | 0 (0.0%) |
| 18 to 34 Years | 0 (0.0%) | 0 (0.0%) |
| 35 to 64 Years | 61 (20.7%) | 116 (20.6%) |
| 65 to 74 Years | 3 (3.2%) | 57 (32.0%) |
| 75 Years and over | 7 (10.0%) | 23 (20.5%) |
Disability Class: Self-Care Difficulty
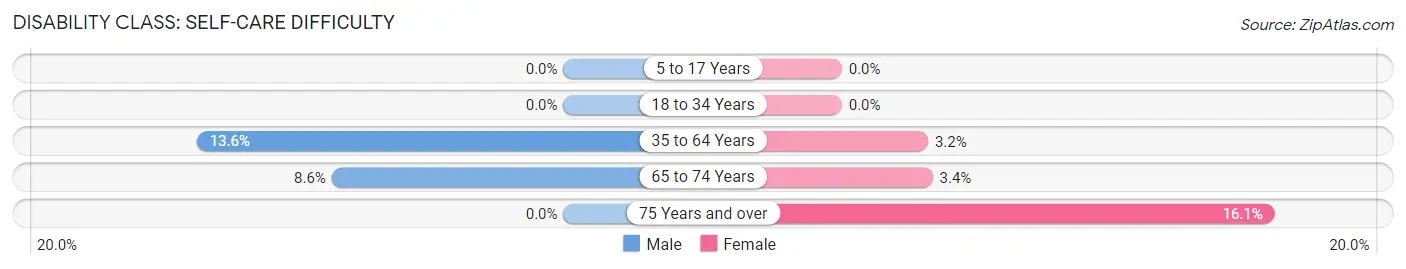
| Age Bracket | Male | Female |
| 5 to 17 Years | 0 (0.0%) | 0 (0.0%) |
| 18 to 34 Years | 0 (0.0%) | 0 (0.0%) |
| 35 to 64 Years | 40 (13.6%) | 18 (3.2%) |
| 65 to 74 Years | 8 (8.6%) | 6 (3.4%) |
| 75 Years and over | 0 (0.0%) | 18 (16.1%) |
Technology Access in Fulton
Computing Device Access in Fulton
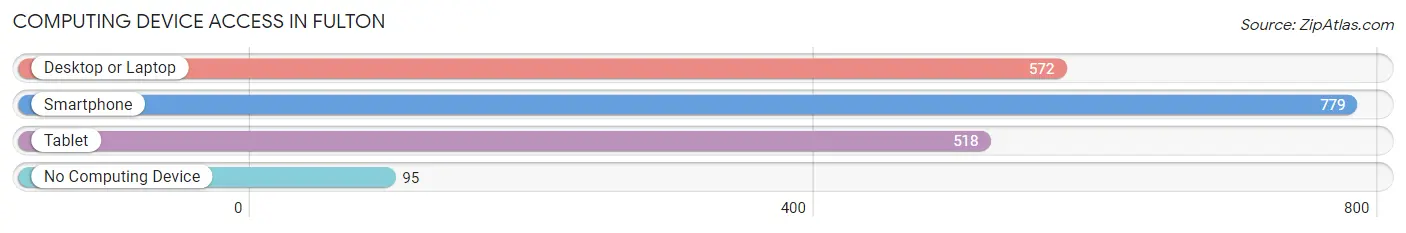
| Device Type | # Households | % Households |
| Desktop or Laptop | 572 | 59.9% |
| Smartphone | 779 | 81.6% |
| Tablet | 518 | 54.2% |
| No Computing Device | 95 | 10.0% |
| Total | 955 | 100.0% |
Internet Access in Fulton
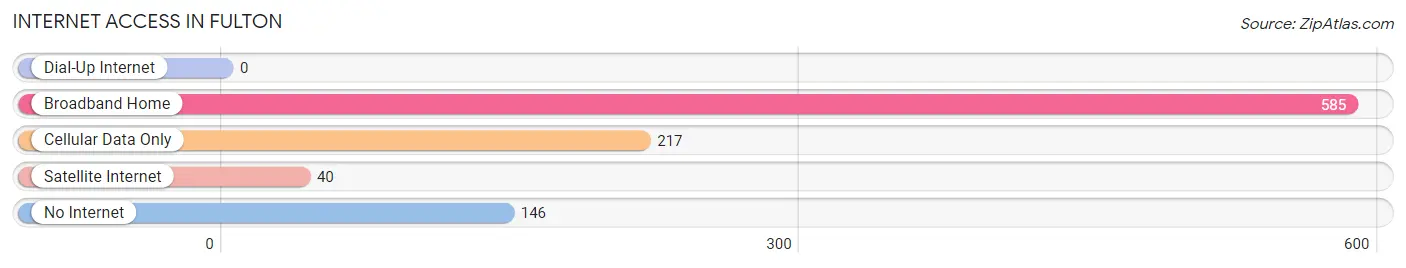
| Internet Type | # Households | % Households |
| Dial-Up Internet | 0 | 0.0% |
| Broadband Home | 585 | 61.3% |
| Cellular Data Only | 217 | 22.7% |
| Satellite Internet | 40 | 4.2% |
| No Internet | 146 | 15.3% |
| Total | 955 | 100.0% |
Fulton Summary
Fulton, Kentucky is a small city located in the western part of the state, in Fulton County. It is situated on the banks of the Mississippi River, and is the county seat of Fulton County. The city has a population of approximately 8,000 people, and is part of the Jackson Purchase region of Kentucky.
History
Fulton was founded in 1845 by a group of settlers from Tennessee. The city was named after Robert Fulton, the inventor of the steamboat. The city was incorporated in 1851, and the first post office was established in 1852.
Fulton was an important port city during the Civil War, and was the site of several battles. The city was also the site of the Battle of Island Number Ten, which was a major victory for the Union forces. After the war, the city experienced a period of growth and prosperity, and many of the buildings in the city date back to this period.
Geography
Fulton is located in the western part of Kentucky, in Fulton County. The city is situated on the banks of the Mississippi River, and is part of the Jackson Purchase region of Kentucky. The city has a total area of 4.2 square miles, all of which is land.
The climate in Fulton is humid subtropical, with hot, humid summers and mild winters. The average annual temperature is around 60 degrees Fahrenheit, and the average annual precipitation is around 45 inches.
Economy
The economy of Fulton is largely based on agriculture and manufacturing. The city is home to several large manufacturing plants, including a paper mill, a steel mill, and a chemical plant. Agriculture is also an important part of the local economy, with corn, soybeans, and wheat being the main crops.
Fulton is also home to several small businesses, including restaurants, retail stores, and service providers. The city is also home to a number of tourist attractions, including the Fulton County Museum and the Fulton County Historical Society.
Demographics
As of the 2010 census, the population of Fulton was 8,068. The racial makeup of the city was 87.3% White, 9.2% African American, 0.3% Native American, 0.5% Asian, 0.1% Pacific Islander, and 2.6% from other races. Hispanic or Latino of any race were 1.7% of the population.
The median household income in Fulton was $31,944, and the median family income was $41,944. The per capita income in the city was $17,845. About 17.3% of the population was below the poverty line.
Fulton is served by the Fulton County School District, which includes four elementary schools, one middle school, and one high school. The city is also home to a branch of the University of Kentucky.
Common Questions
What is Per Capita Income in Fulton?
Per Capita income in Fulton is $14,926.
What is the Median Family Income in Fulton?
Median Family Income in Fulton is $31,685.
What is the Median Household income in Fulton?
Median Household Income in Fulton is $33,090.
What is Income or Wage Gap in Fulton?
Income or Wage Gap in Fulton is 28.0%.
Women in Fulton earn 72.0 cents for every dollar earned by a man.
What is Family Income Deficit in Fulton?
Family Income Deficit in Fulton is $13,257.
Families that are below poverty line in Fulton earn $13,257 less on average than the poverty threshold level.
What is Inequality or Gini Index in Fulton?
Inequality or Gini Index in Fulton is 0.35.
What is the Total Population of Fulton?
Total Population of Fulton is 2,693.
What is the Total Male Population of Fulton?
Total Male Population of Fulton is 1,117.
What is the Total Female Population of Fulton?
Total Female Population of Fulton is 1,576.
What is the Ratio of Males per 100 Females in Fulton?
There are 70.88 Males per 100 Females in Fulton.
What is the Ratio of Females per 100 Males in Fulton?
There are 141.09 Females per 100 Males in Fulton.
What is the Median Population Age in Fulton?
Median Population Age in Fulton is 35.4 Years.
What is the Average Family Size in Fulton
Average Family Size in Fulton is 3.7 People.
What is the Average Household Size in Fulton
Average Household Size in Fulton is 2.8 People.
How Large is the Labor Force in Fulton?
There are 1,001 People in the Labor Forcein in Fulton.
What is the Percentage of People in the Labor Force in Fulton?
50.4% of People are in the Labor Force in Fulton.
What is the Unemployment Rate in Fulton?
Unemployment Rate in Fulton is 2.8%.