Raceland, KY Map & Demographics
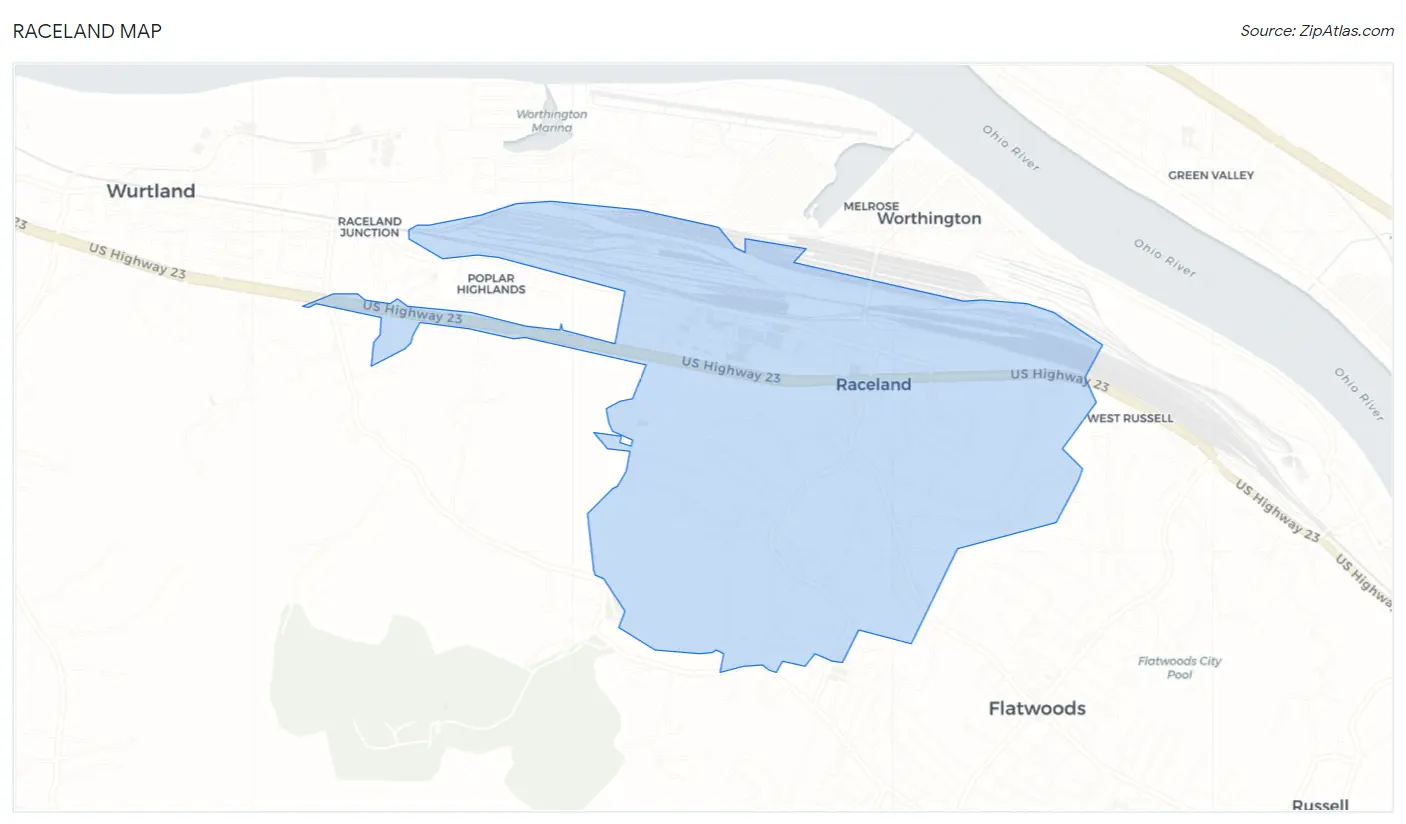
Raceland Map
Raceland Overview
$35,365
PER CAPITA INCOME
$62,500
AVG FAMILY INCOME
$60,398
AVG HOUSEHOLD INCOME
17.6%
WAGE / INCOME GAP [ % ]
82.4¢/ $1
WAGE / INCOME GAP [ $ ]
0.49
INEQUALITY / GINI INDEX
2,015
TOTAL POPULATION
876
MALE POPULATION
1,139
FEMALE POPULATION
76.91
MALES / 100 FEMALES
130.02
FEMALES / 100 MALES
54.0
MEDIAN AGE
2.7
AVG FAMILY SIZE
2.0
AVG HOUSEHOLD SIZE
740
LABOR FORCE [ PEOPLE ]
43.3%
PERCENT IN LABOR FORCE
7.2%
UNEMPLOYMENT RATE
Raceland Area Codes
Income in Raceland
Income Overview in Raceland
Per Capita Income in Raceland is $35,365, while median incomes of families and households are $62,500 and $60,398 respectively.
| Characteristic | Number | Measure |
| Per Capita Income | 2,015 | $35,365 |
| Median Family Income | 556 | $62,500 |
| Mean Family Income | 556 | $85,686 |
| Median Household Income | 1,018 | $60,398 |
| Mean Household Income | 1,018 | $69,608 |
| Income Deficit | 556 | $0 |
| Wage / Income Gap (%) | 2,015 | 17.61% |
| Wage / Income Gap ($) | 2,015 | 82.39¢ per $1 |
| Gini / Inequality Index | 2,015 | 0.49 |
Earnings by Sex in Raceland
Average Earnings in Raceland are $34,360, $38,534 for men and $31,750 for women, a difference of 17.6%.
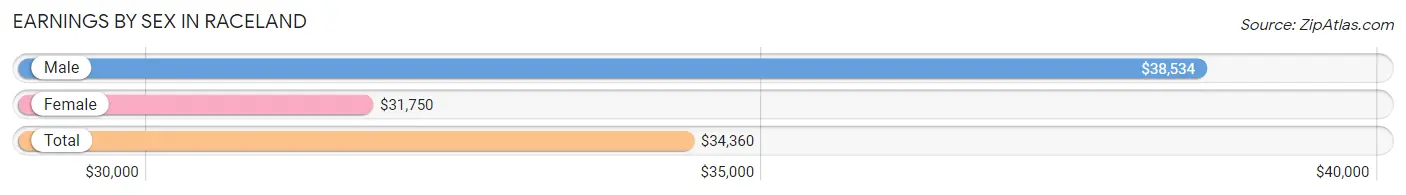
| Sex | Number | Average Earnings |
| Male | 358 (48.6%) | $38,534 |
| Female | 379 (51.4%) | $31,750 |
| Total | 737 (100.0%) | $34,360 |
Earnings by Sex by Income Bracket in Raceland
The most common earnings brackets in Raceland are $100,000+ for men (64 | 17.9%) and $7,500 to $9,999 for women (34 | 9.0%).
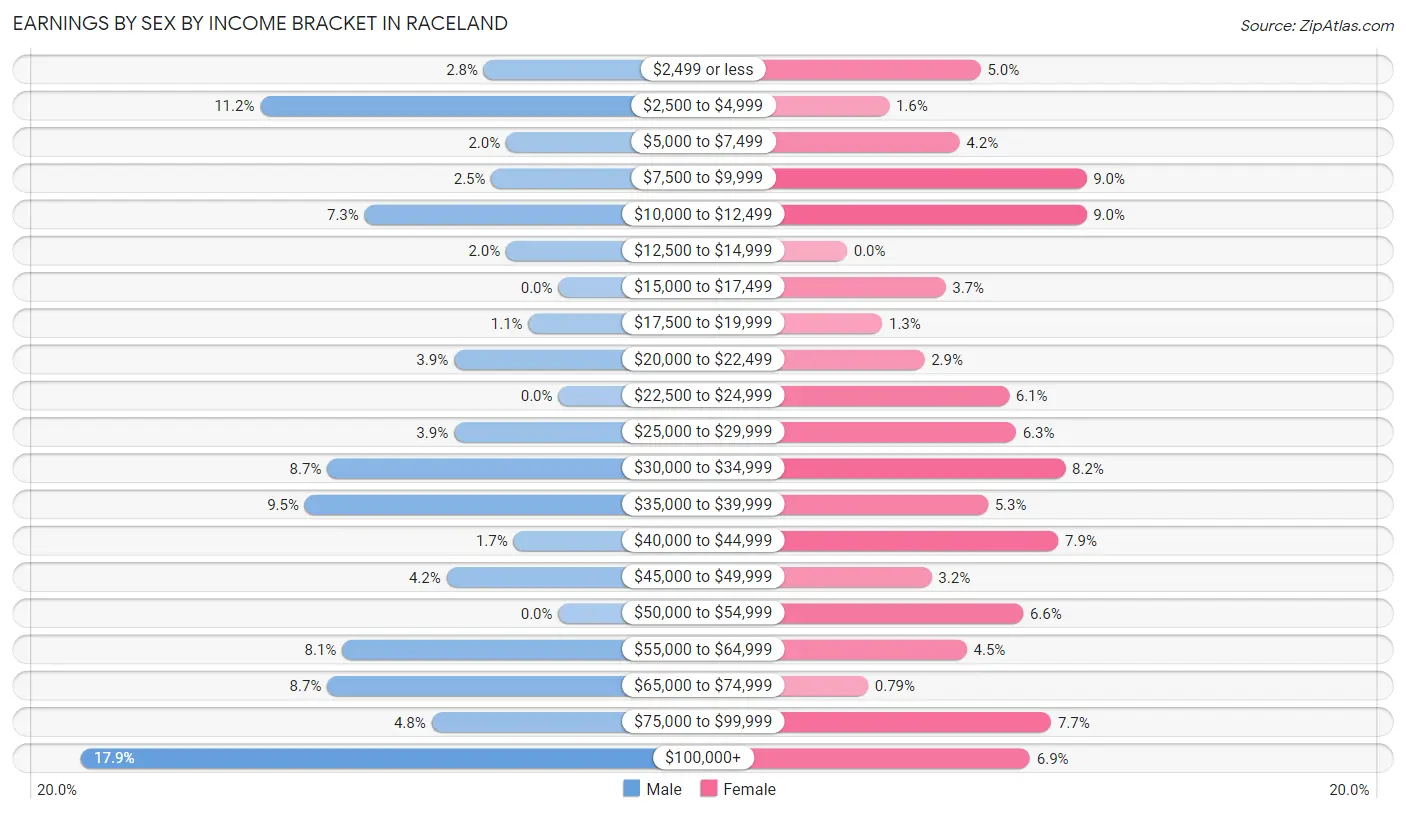
| Income | Male | Female |
| $2,499 or less | 10 (2.8%) | 19 (5.0%) |
| $2,500 to $4,999 | 40 (11.2%) | 6 (1.6%) |
| $5,000 to $7,499 | 7 (2.0%) | 16 (4.2%) |
| $7,500 to $9,999 | 9 (2.5%) | 34 (9.0%) |
| $10,000 to $12,499 | 26 (7.3%) | 34 (9.0%) |
| $12,500 to $14,999 | 7 (2.0%) | 0 (0.0%) |
| $15,000 to $17,499 | 0 (0.0%) | 14 (3.7%) |
| $17,500 to $19,999 | 4 (1.1%) | 5 (1.3%) |
| $20,000 to $22,499 | 14 (3.9%) | 11 (2.9%) |
| $22,500 to $24,999 | 0 (0.0%) | 23 (6.1%) |
| $25,000 to $29,999 | 14 (3.9%) | 24 (6.3%) |
| $30,000 to $34,999 | 31 (8.7%) | 31 (8.2%) |
| $35,000 to $39,999 | 34 (9.5%) | 20 (5.3%) |
| $40,000 to $44,999 | 6 (1.7%) | 30 (7.9%) |
| $45,000 to $49,999 | 15 (4.2%) | 12 (3.2%) |
| $50,000 to $54,999 | 0 (0.0%) | 25 (6.6%) |
| $55,000 to $64,999 | 29 (8.1%) | 17 (4.5%) |
| $65,000 to $74,999 | 31 (8.7%) | 3 (0.8%) |
| $75,000 to $99,999 | 17 (4.8%) | 29 (7.6%) |
| $100,000+ | 64 (17.9%) | 26 (6.9%) |
| Total | 358 (100.0%) | 379 (100.0%) |
Earnings by Sex by Educational Attainment in Raceland
Average earnings in Raceland are $40,000 for men and $34,135 for women, a difference of 14.7%. Men with an educational attainment of bachelor's degree enjoy the highest average annual earnings of $63,750, while those with high school diploma education earn the least with $37,679. Women with an educational attainment of bachelor's degree earn the most with the average annual earnings of $42,500, while those with college or associate's degree education have the smallest earnings of $23,047.
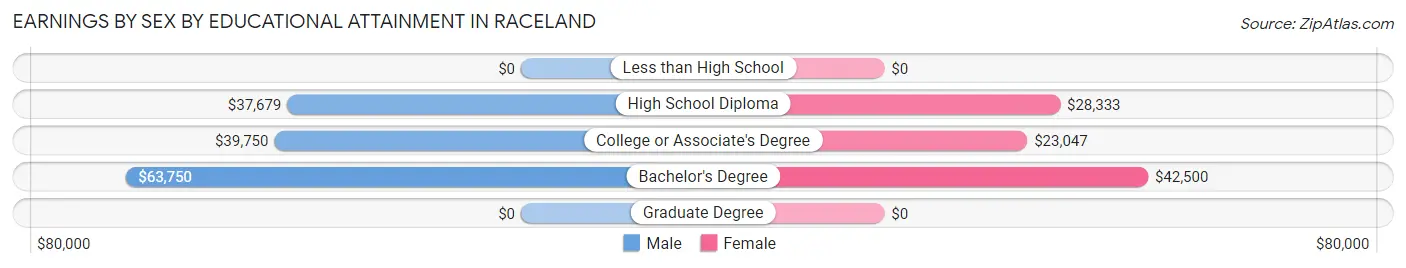
| Educational Attainment | Male Income | Female Income |
| Less than High School | - | - |
| High School Diploma | $37,679 | $28,333 |
| College or Associate's Degree | $39,750 | $23,047 |
| Bachelor's Degree | $63,750 | $42,500 |
| Graduate Degree | - | - |
| Total | $40,000 | $34,135 |
Family Income in Raceland
Family Income Brackets in Raceland
According to the Raceland family income data, there are 100 families falling into the $50,000 to $74,999 income range, which is the most common income bracket and makes up 18.0% of all families. Conversely, the $200,000+ income bracket is the least frequent group with only 22 families (4.0%) belonging to this category.
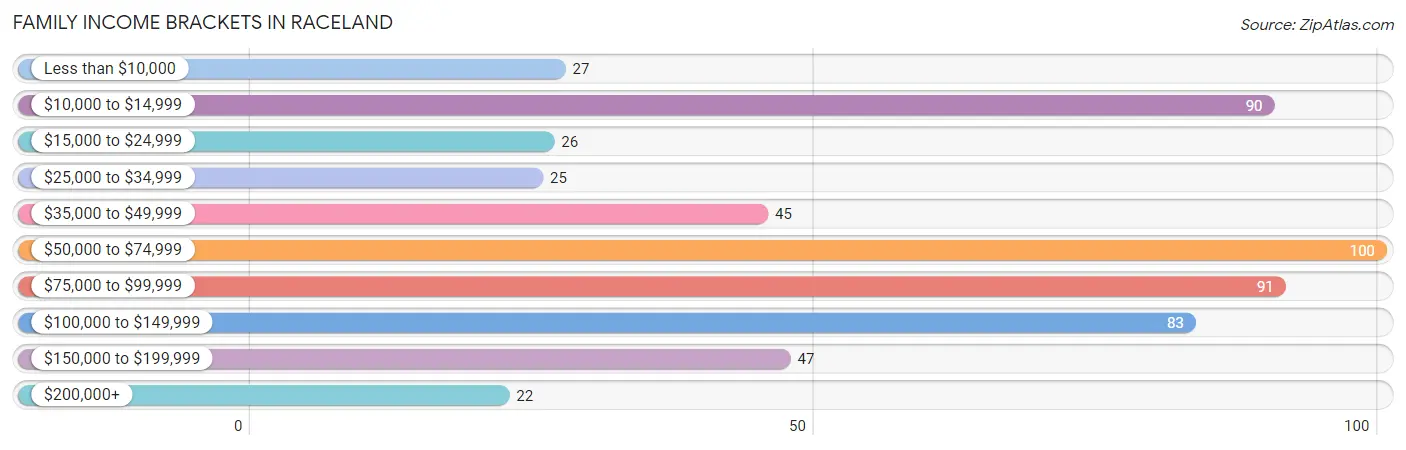
| Income Bracket | # Families | % Families |
| Less than $10,000 | 27 | 4.9% |
| $10,000 to $14,999 | 90 | 16.2% |
| $15,000 to $24,999 | 26 | 4.7% |
| $25,000 to $34,999 | 25 | 4.5% |
| $35,000 to $49,999 | 45 | 8.1% |
| $50,000 to $74,999 | 100 | 18.0% |
| $75,000 to $99,999 | 91 | 16.4% |
| $100,000 to $149,999 | 83 | 14.9% |
| $150,000 to $199,999 | 47 | 8.5% |
| $200,000+ | 22 | 4.0% |
Family Income by Famaliy Size in Raceland
3-person families (128 | 23.0%) account for the highest median family income in Raceland with $93,864 per family, while 3-person families (128 | 23.0%) have the highest median income of $31,288 per family member.
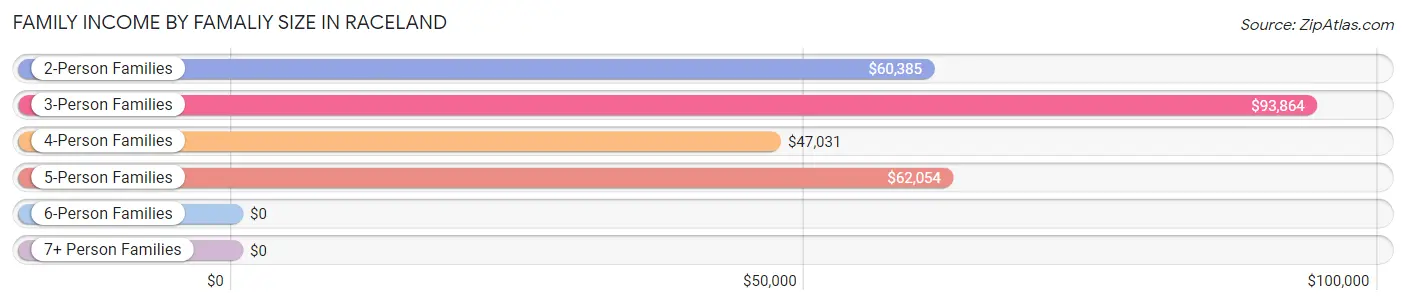
| Income Bracket | # Families | Median Income |
| 2-Person Families | 314 (56.5%) | $60,385 |
| 3-Person Families | 128 (23.0%) | $93,864 |
| 4-Person Families | 71 (12.8%) | $47,031 |
| 5-Person Families | 35 (6.3%) | $62,054 |
| 6-Person Families | 8 (1.4%) | $0 |
| 7+ Person Families | 0 (0.0%) | $0 |
| Total | 556 (100.0%) | $62,500 |
Family Income by Number of Earners in Raceland
The median family income in Raceland is $62,500, with families comprising 3+ earners (14) having the highest median family income of $180,556, while families with no earners (147) have the lowest median family income of $58,125, accounting for 2.5% and 26.4% of families, respectively.
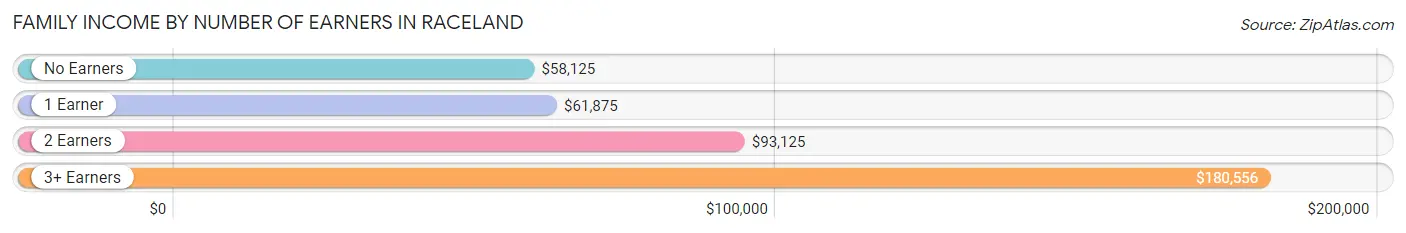
| Number of Earners | # Families | Median Income |
| No Earners | 147 (26.4%) | $58,125 |
| 1 Earner | 227 (40.8%) | $61,875 |
| 2 Earners | 168 (30.2%) | $93,125 |
| 3+ Earners | 14 (2.5%) | $180,556 |
| Total | 556 (100.0%) | $62,500 |
Household Income in Raceland
Household Income Brackets in Raceland
With 310 households falling in the category, the $50,000 to $74,999 income range is the most frequent in Raceland, accounting for 30.4% of all households. In contrast, only 38 households (3.7%) fall into the $200,000+ income bracket, making it the least populous group.
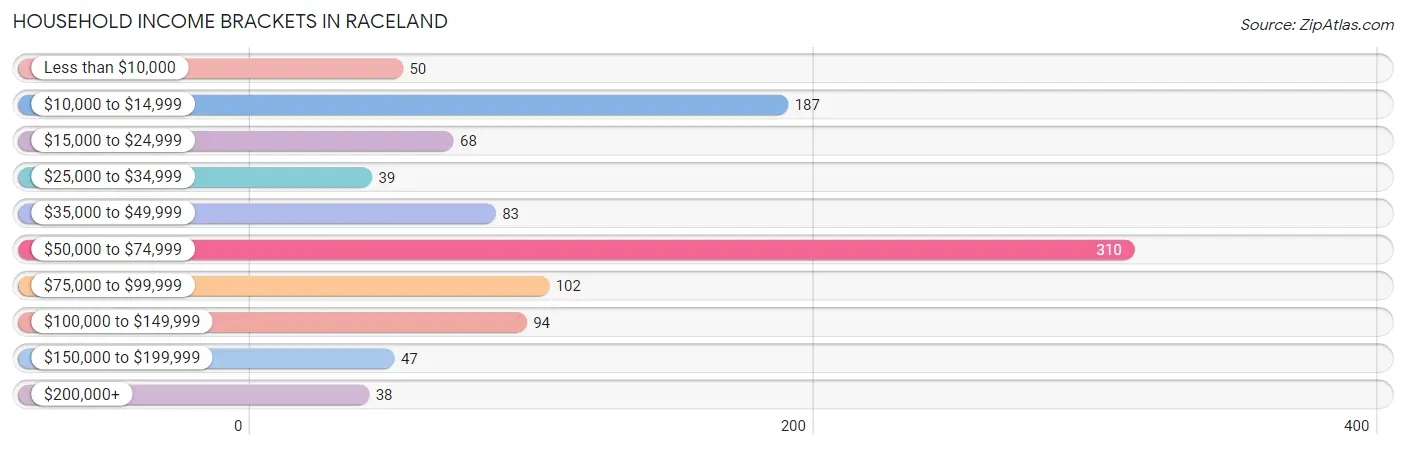
| Income Bracket | # Households | % Households |
| Less than $10,000 | 50 | 4.9% |
| $10,000 to $14,999 | 187 | 18.4% |
| $15,000 to $24,999 | 68 | 6.7% |
| $25,000 to $34,999 | 39 | 3.8% |
| $35,000 to $49,999 | 83 | 8.2% |
| $50,000 to $74,999 | 310 | 30.5% |
| $75,000 to $99,999 | 102 | 10.0% |
| $100,000 to $149,999 | 94 | 9.2% |
| $150,000 to $199,999 | 47 | 4.6% |
| $200,000+ | 38 | 3.7% |
Household Income by Householder Age in Raceland
The median household income in Raceland is $60,398, with the highest median household income of $63,172 found in the 45 to 64 years age bracket for the primary householder. A total of 399 households (39.2%) fall into this category. Meanwhile, the 15 to 24 years age bracket for the primary householder has the lowest median household income of $0, with 40 households (3.9%) in this group.
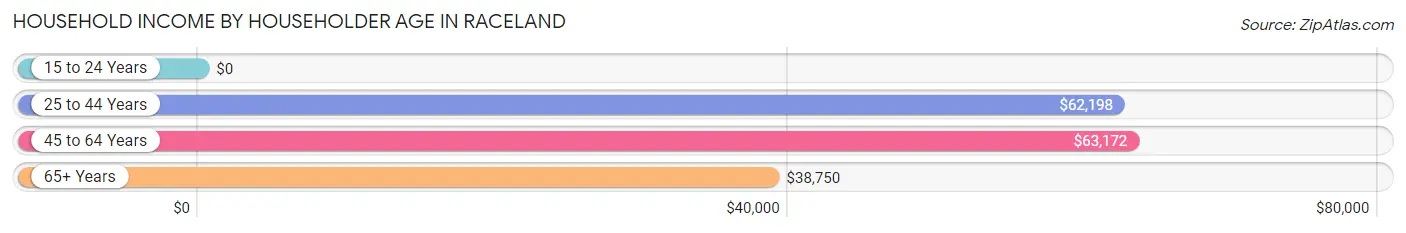
| Income Bracket | # Households | Median Income |
| 15 to 24 Years | 40 (3.9%) | $0 |
| 25 to 44 Years | 169 (16.6%) | $62,198 |
| 45 to 64 Years | 399 (39.2%) | $63,172 |
| 65+ Years | 410 (40.3%) | $38,750 |
| Total | 1,018 (100.0%) | $60,398 |
Poverty in Raceland
Income Below Poverty by Sex and Age in Raceland
With 26.9% poverty level for males and 20.3% for females among the residents of Raceland, 16 and 17 year old males and 5 year old females are the most vulnerable to poverty, with 15 males (100.0%) and 10 females (55.6%) in their respective age groups living below the poverty level.
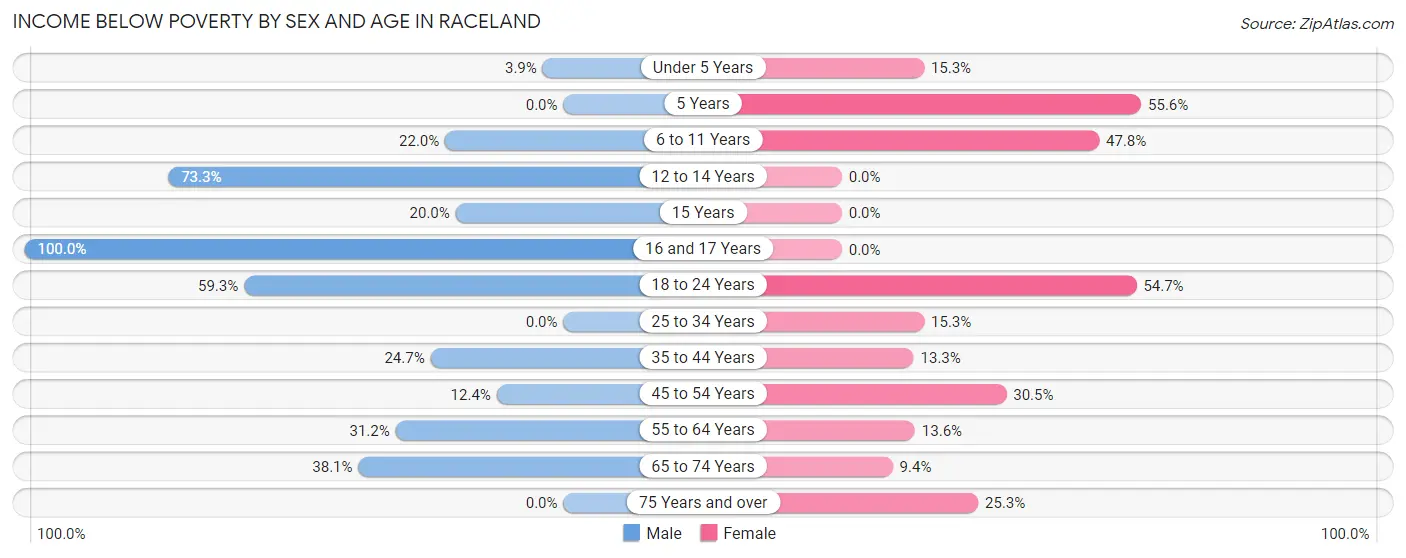
| Age Bracket | Male | Female |
| Under 5 Years | 1 (3.8%) | 9 (15.2%) |
| 5 Years | 0 (0.0%) | 10 (55.6%) |
| 6 to 11 Years | 9 (22.0%) | 32 (47.8%) |
| 12 to 14 Years | 22 (73.3%) | 0 (0.0%) |
| 15 Years | 2 (20.0%) | 0 (0.0%) |
| 16 and 17 Years | 15 (100.0%) | 0 (0.0%) |
| 18 to 24 Years | 32 (59.3%) | 35 (54.7%) |
| 25 to 34 Years | 0 (0.0%) | 22 (15.3%) |
| 35 to 44 Years | 18 (24.7%) | 10 (13.3%) |
| 45 to 54 Years | 13 (12.4%) | 40 (30.5%) |
| 55 to 64 Years | 38 (31.1%) | 35 (13.6%) |
| 65 to 74 Years | 86 (38.1%) | 17 (9.4%) |
| 75 Years and over | 0 (0.0%) | 21 (25.3%) |
| Total | 236 (26.9%) | 231 (20.3%) |
Income Above Poverty by Sex and Age in Raceland
According to the poverty statistics in Raceland, males aged 5 years and females aged 12 to 14 years are the age groups that are most secure financially, with 100.0% of males and 100.0% of females in these age groups living above the poverty line.
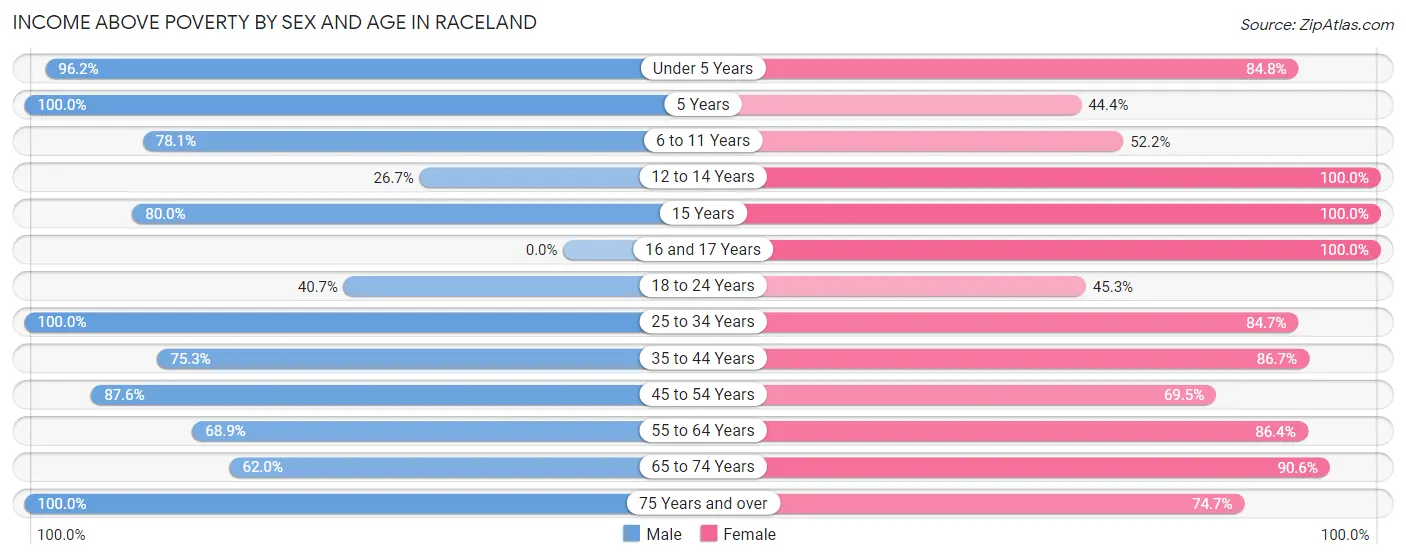
| Age Bracket | Male | Female |
| Under 5 Years | 25 (96.2%) | 50 (84.8%) |
| 5 Years | 13 (100.0%) | 8 (44.4%) |
| 6 to 11 Years | 32 (78.0%) | 35 (52.2%) |
| 12 to 14 Years | 8 (26.7%) | 26 (100.0%) |
| 15 Years | 8 (80.0%) | 11 (100.0%) |
| 16 and 17 Years | 0 (0.0%) | 19 (100.0%) |
| 18 to 24 Years | 22 (40.7%) | 29 (45.3%) |
| 25 to 34 Years | 80 (100.0%) | 122 (84.7%) |
| 35 to 44 Years | 55 (75.3%) | 65 (86.7%) |
| 45 to 54 Years | 92 (87.6%) | 91 (69.5%) |
| 55 to 64 Years | 84 (68.9%) | 223 (86.4%) |
| 65 to 74 Years | 140 (62.0%) | 163 (90.6%) |
| 75 Years and over | 81 (100.0%) | 62 (74.7%) |
| Total | 640 (73.1%) | 904 (79.6%) |
Income Below Poverty Among Married-Couple Families in Raceland
The poverty statistics for married-couple families in Raceland show that 18.9% or 84 of the total 444 families live below the poverty line. Families with 1 or 2 children have the highest poverty rate of 25.7%, comprising of 26 families. On the other hand, families with 3 or 4 children have the lowest poverty rate of 0.0%, which includes 0 families.
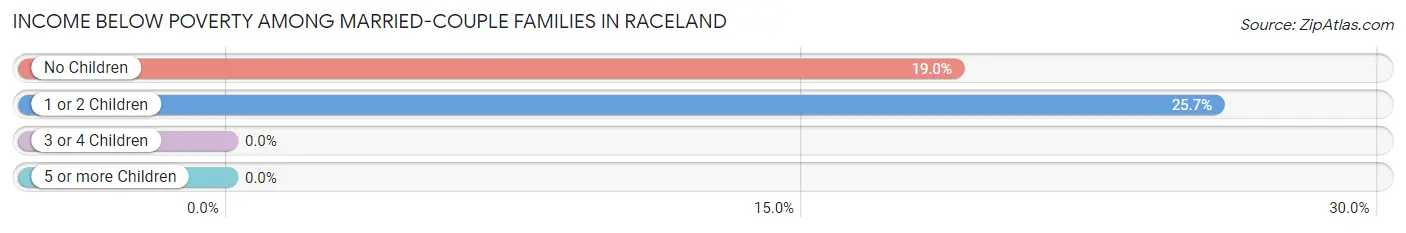
| Children | Above Poverty | Below Poverty |
| No Children | 248 (81.0%) | 58 (19.0%) |
| 1 or 2 Children | 75 (74.3%) | 26 (25.7%) |
| 3 or 4 Children | 37 (100.0%) | 0 (0.0%) |
| 5 or more Children | 0 (0.0%) | 0 (0.0%) |
| Total | 360 (81.1%) | 84 (18.9%) |
Income Below Poverty Among Single-Parent Households in Raceland
According to the poverty data in Raceland, 58.8% or 10 single-father households and 49.5% or 47 single-mother households are living below the poverty line. Among single-father households, those with 3 or 4 children have the highest poverty rate, with 10 households (100.0%) experiencing poverty. Likewise, among single-mother households, those with 3 or 4 children have the highest poverty rate, with 10 households (100.0%) falling below the poverty line.
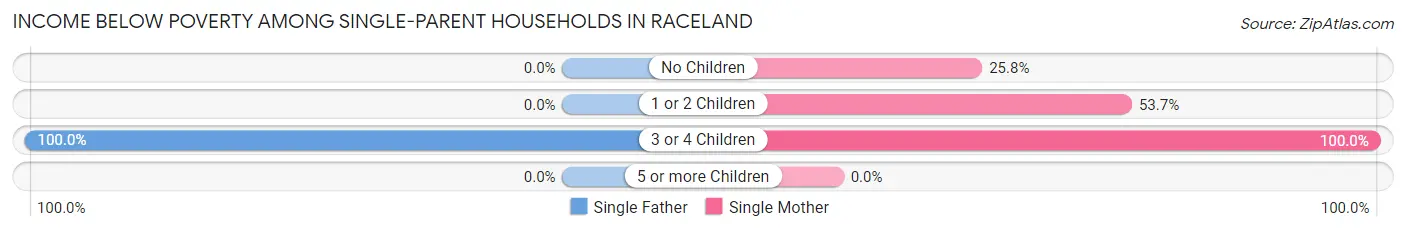
| Children | Single Father | Single Mother |
| No Children | 0 (0.0%) | 8 (25.8%) |
| 1 or 2 Children | 0 (0.0%) | 29 (53.7%) |
| 3 or 4 Children | 10 (100.0%) | 10 (100.0%) |
| 5 or more Children | 0 (0.0%) | 0 (0.0%) |
| Total | 10 (58.8%) | 47 (49.5%) |
Income Below Poverty Among Married-Couple vs Single-Parent Households in Raceland
The poverty data for Raceland shows that 84 of the married-couple family households (18.9%) and 57 of the single-parent households (50.9%) are living below the poverty level. Within the married-couple family households, those with 1 or 2 children have the highest poverty rate, with 26 households (25.7%) falling below the poverty line. Among the single-parent households, those with 3 or 4 children have the highest poverty rate, with 20 household (100.0%) living below poverty.
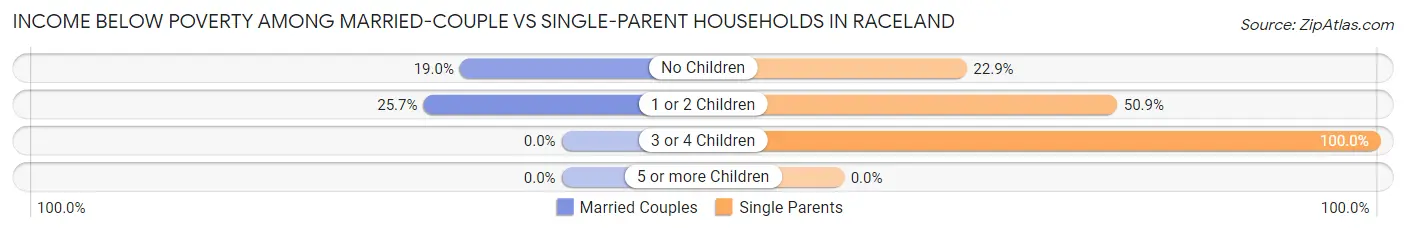
| Children | Married-Couple Families | Single-Parent Households |
| No Children | 58 (19.0%) | 8 (22.9%) |
| 1 or 2 Children | 26 (25.7%) | 29 (50.9%) |
| 3 or 4 Children | 0 (0.0%) | 20 (100.0%) |
| 5 or more Children | 0 (0.0%) | 0 (0.0%) |
| Total | 84 (18.9%) | 57 (50.9%) |
Race in Raceland
The most populous races in Raceland are White / Caucasian (1,968 | 97.7%), Black / African American (29 | 1.4%), and Two or more Races (10 | 0.5%).
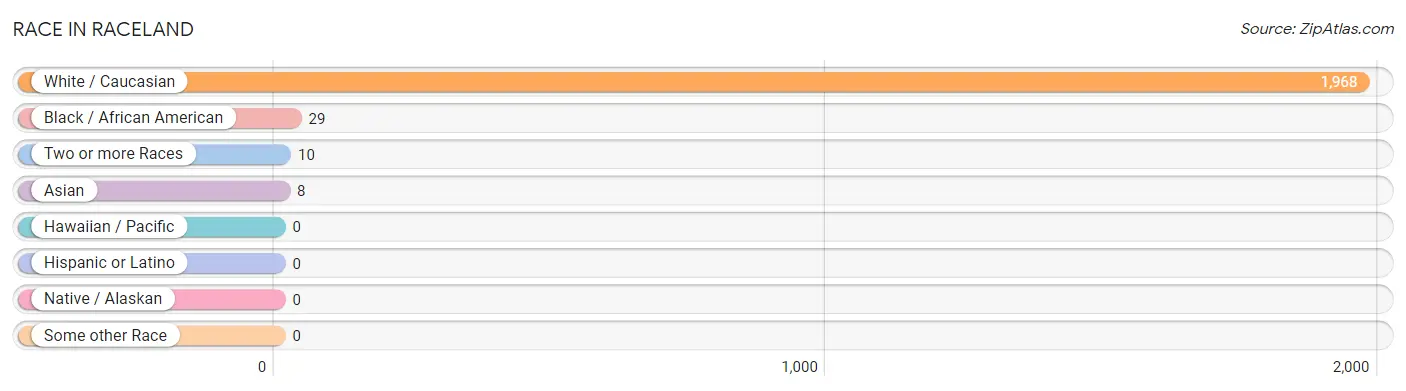
| Race | # Population | % Population |
| Asian | 8 | 0.4% |
| Black / African American | 29 | 1.4% |
| Hawaiian / Pacific | 0 | 0.0% |
| Hispanic or Latino | 0 | 0.0% |
| Native / Alaskan | 0 | 0.0% |
| White / Caucasian | 1,968 | 97.7% |
| Two or more Races | 10 | 0.5% |
| Some other Race | 0 | 0.0% |
| Total | 2,015 | 100.0% |
Ancestry in Raceland
The most populous ancestries reported in Raceland are American (439 | 21.8%), English (384 | 19.1%), Irish (145 | 7.2%), German (87 | 4.3%), and European (72 | 3.6%), together accounting for 55.9% of all Raceland residents.
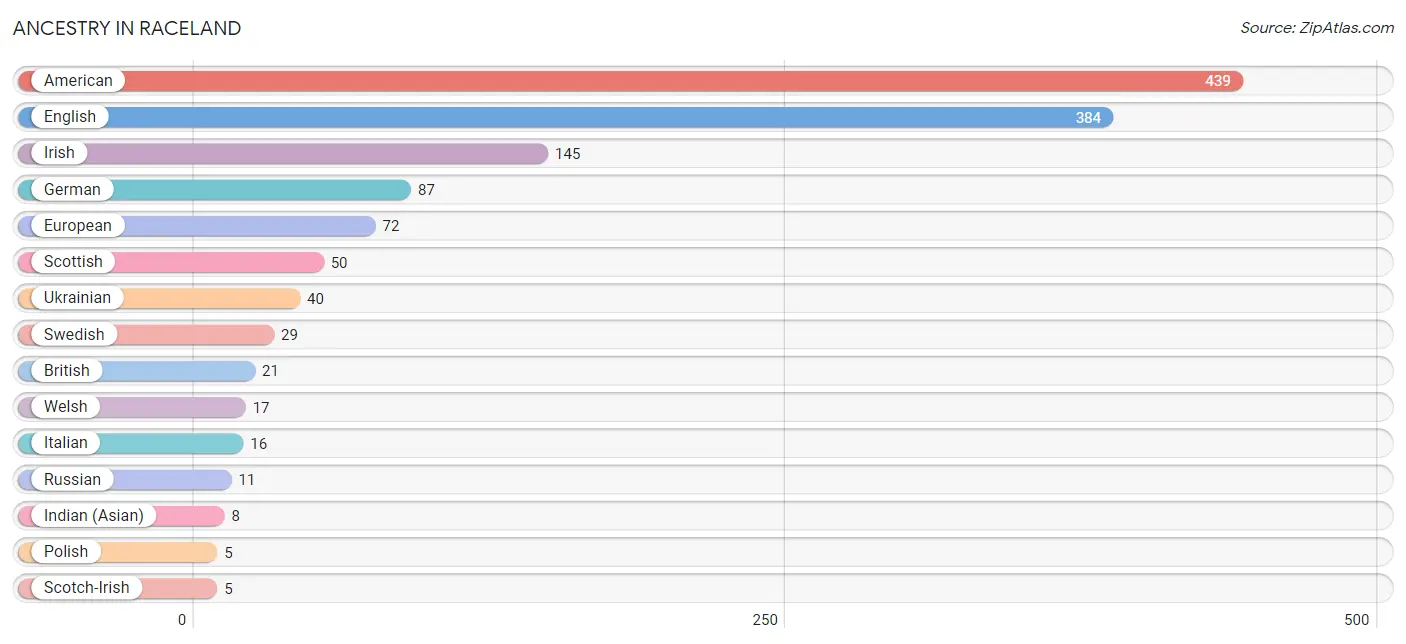
| Ancestry | # Population | % Population |
| American | 439 | 21.8% |
| British | 21 | 1.0% |
| English | 384 | 19.1% |
| European | 72 | 3.6% |
| German | 87 | 4.3% |
| Hungarian | 4 | 0.2% |
| Indian (Asian) | 8 | 0.4% |
| Irish | 145 | 7.2% |
| Italian | 16 | 0.8% |
| Northern European | 4 | 0.2% |
| Polish | 5 | 0.3% |
| Russian | 11 | 0.5% |
| Scotch-Irish | 5 | 0.3% |
| Scottish | 50 | 2.5% |
| Swedish | 29 | 1.4% |
| Ukrainian | 40 | 2.0% |
| Welsh | 17 | 0.8% | View All 17 Rows |
Immigrants in Raceland
The most numerous immigrant groups reported in Raceland came from Asia (8 | 0.4%), China (8 | 0.4%), and Eastern Asia (8 | 0.4%), together accounting for 1.2% of all Raceland residents.
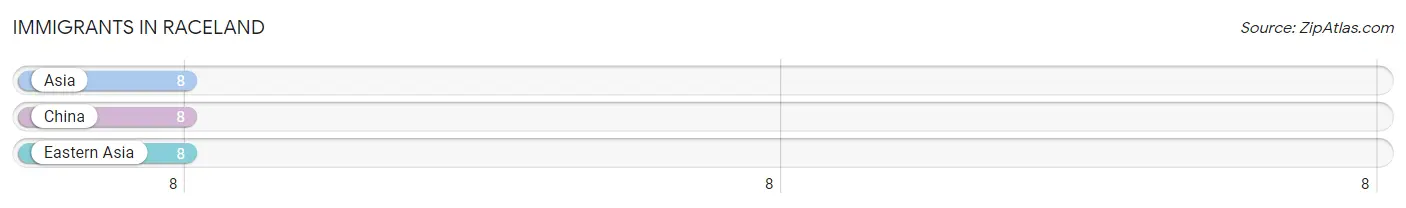
| Immigration Origin | # Population | % Population |
| Asia | 8 | 0.4% |
| China | 8 | 0.4% |
| Eastern Asia | 8 | 0.4% | View All 3 Rows |
Sex and Age in Raceland
Sex and Age in Raceland
The most populous age groups in Raceland are 65 to 69 Years (123 | 14.0%) for men and 60 to 64 Years (189 | 16.6%) for women.
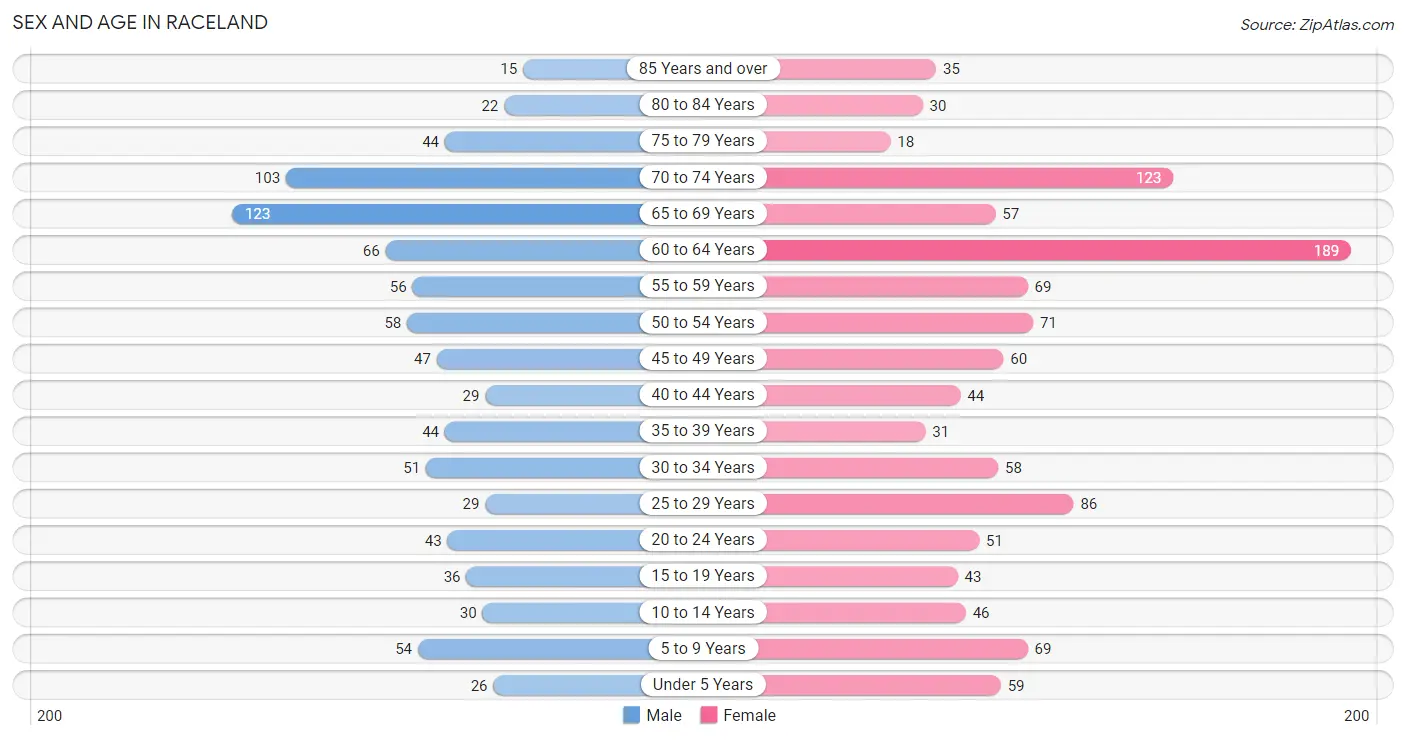
| Age Bracket | Male | Female |
| Under 5 Years | 26 (3.0%) | 59 (5.2%) |
| 5 to 9 Years | 54 (6.2%) | 69 (6.1%) |
| 10 to 14 Years | 30 (3.4%) | 46 (4.0%) |
| 15 to 19 Years | 36 (4.1%) | 43 (3.8%) |
| 20 to 24 Years | 43 (4.9%) | 51 (4.5%) |
| 25 to 29 Years | 29 (3.3%) | 86 (7.5%) |
| 30 to 34 Years | 51 (5.8%) | 58 (5.1%) |
| 35 to 39 Years | 44 (5.0%) | 31 (2.7%) |
| 40 to 44 Years | 29 (3.3%) | 44 (3.9%) |
| 45 to 49 Years | 47 (5.4%) | 60 (5.3%) |
| 50 to 54 Years | 58 (6.6%) | 71 (6.2%) |
| 55 to 59 Years | 56 (6.4%) | 69 (6.1%) |
| 60 to 64 Years | 66 (7.5%) | 189 (16.6%) |
| 65 to 69 Years | 123 (14.0%) | 57 (5.0%) |
| 70 to 74 Years | 103 (11.8%) | 123 (10.8%) |
| 75 to 79 Years | 44 (5.0%) | 18 (1.6%) |
| 80 to 84 Years | 22 (2.5%) | 30 (2.6%) |
| 85 Years and over | 15 (1.7%) | 35 (3.1%) |
| Total | 876 (100.0%) | 1,139 (100.0%) |
Families and Households in Raceland
Median Family Size in Raceland
The median family size in Raceland is 2.72 persons per family, with single male/father families (17 | 3.1%) accounting for the largest median family size of 3.24 persons per family. On the other hand, single female/mother families (95 | 17.1%) represent the smallest median family size with 2.38 persons per family.
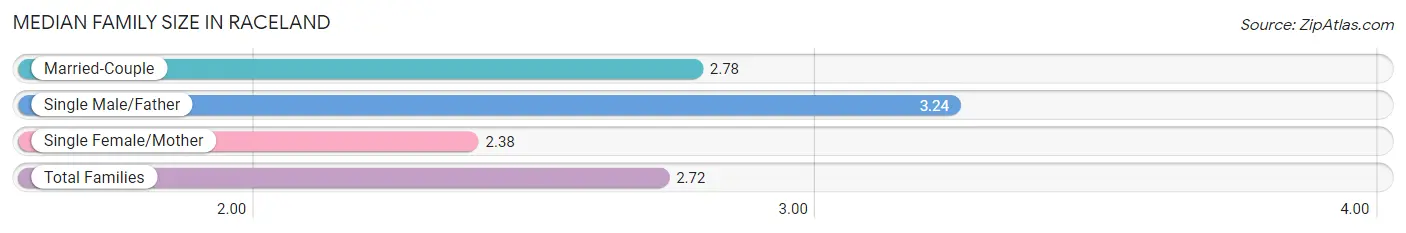
| Family Type | # Families | Family Size |
| Married-Couple | 444 (79.9%) | 2.78 |
| Single Male/Father | 17 (3.1%) | 3.24 |
| Single Female/Mother | 95 (17.1%) | 2.38 |
| Total Families | 556 (100.0%) | 2.72 |
Median Household Size in Raceland
The median household size in Raceland is 1.98 persons per household, with single male/father households (17 | 1.7%) accounting for the largest median household size of 3.88 persons per household. non-family households (462 | 45.4%) represent the smallest median household size with 1.05 persons per household.
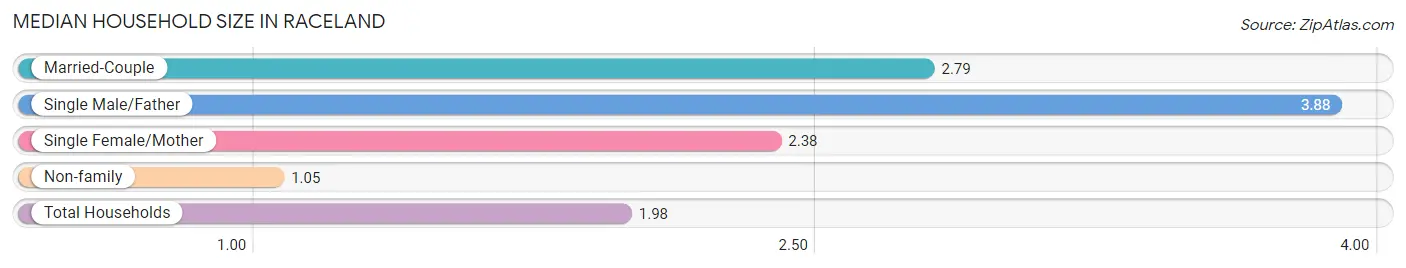
| Household Type | # Households | Household Size |
| Married-Couple | 444 (43.6%) | 2.79 |
| Single Male/Father | 17 (1.7%) | 3.88 |
| Single Female/Mother | 95 (9.3%) | 2.38 |
| Non-family | 462 (45.4%) | 1.05 |
| Total Households | 1,018 (100.0%) | 1.98 |
Household Size by Marriage Status in Raceland
Out of a total of 1,018 households in Raceland, 556 (54.6%) are family households, while 462 (45.4%) are nonfamily households. The most numerous type of family households are 2-person households, comprising 309, and the most common type of nonfamily households are 1-person households, comprising 441.
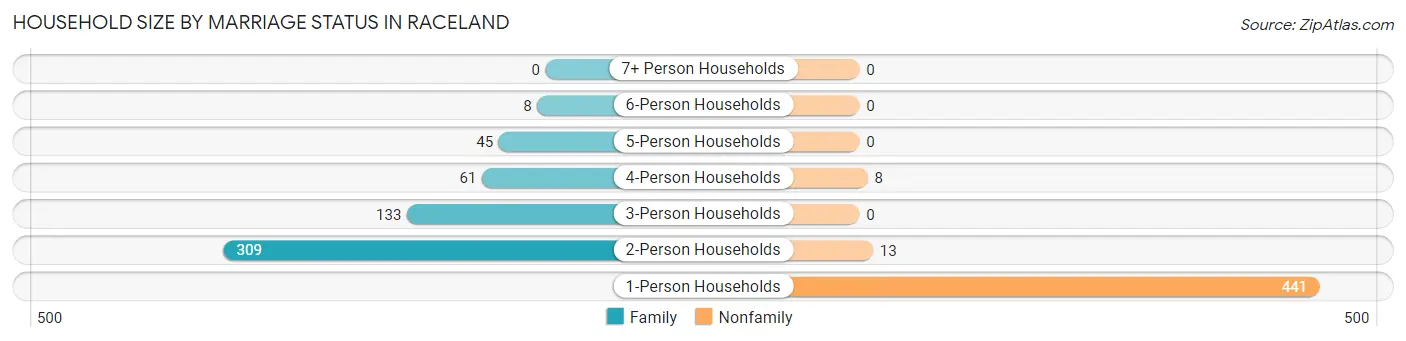
| Household Size | Family Households | Nonfamily Households |
| 1-Person Households | - | 441 (43.3%) |
| 2-Person Households | 309 (30.3%) | 13 (1.3%) |
| 3-Person Households | 133 (13.1%) | 0 (0.0%) |
| 4-Person Households | 61 (6.0%) | 8 (0.8%) |
| 5-Person Households | 45 (4.4%) | 0 (0.0%) |
| 6-Person Households | 8 (0.8%) | 0 (0.0%) |
| 7+ Person Households | 0 (0.0%) | 0 (0.0%) |
| Total | 556 (54.6%) | 462 (45.4%) |
Female Fertility in Raceland
Fertility by Age in Raceland
Average fertility rate in Raceland is 66.0 births per 1,000 women. Women in the age bracket of 20 to 34 years have the highest fertility rate with 128.0 births per 1,000 women. Women in the age bracket of 20 to 34 years acount for 100.0% of all women with births.
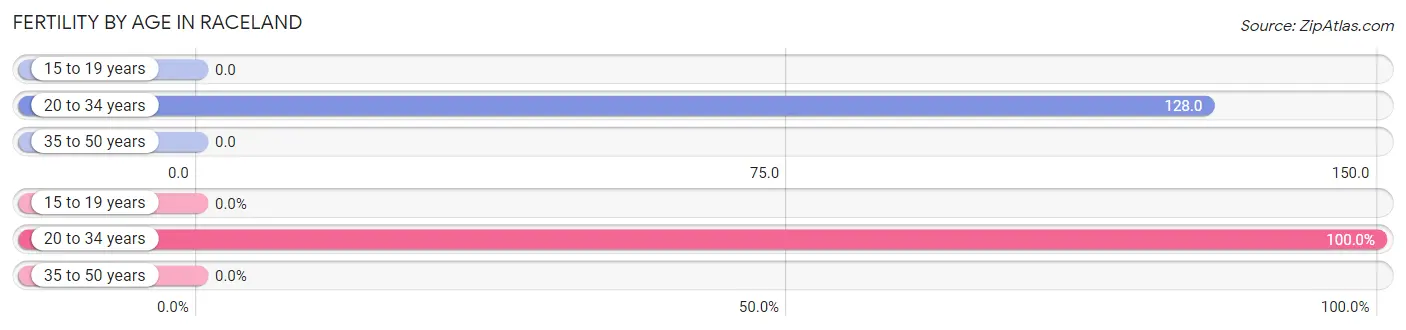
| Age Bracket | Women with Births | Births / 1,000 Women |
| 15 to 19 years | 0 (0.0%) | 0.0 |
| 20 to 34 years | 25 (100.0%) | 128.0 |
| 35 to 50 years | 0 (0.0%) | 0.0 |
| Total | 25 (100.0%) | 66.0 |
Fertility by Age by Marriage Status in Raceland
76.0% of women with births (25) in Raceland are married. The highest percentage of unmarried women with births falls into 20 to 34 years age bracket with 24.0% of them unmarried at the time of birth, while the lowest percentage of unmarried women with births belong to 20 to 34 years age bracket with 24.0% of them unmarried.
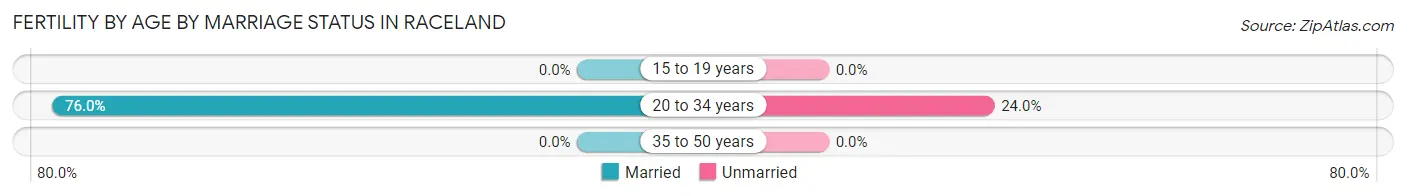
| Age Bracket | Married | Unmarried |
| 15 to 19 years | 0 (0.0%) | 0 (0.0%) |
| 20 to 34 years | 19 (76.0%) | 6 (24.0%) |
| 35 to 50 years | 0 (0.0%) | 0 (0.0%) |
| Total | 19 (76.0%) | 6 (24.0%) |
Fertility by Education in Raceland
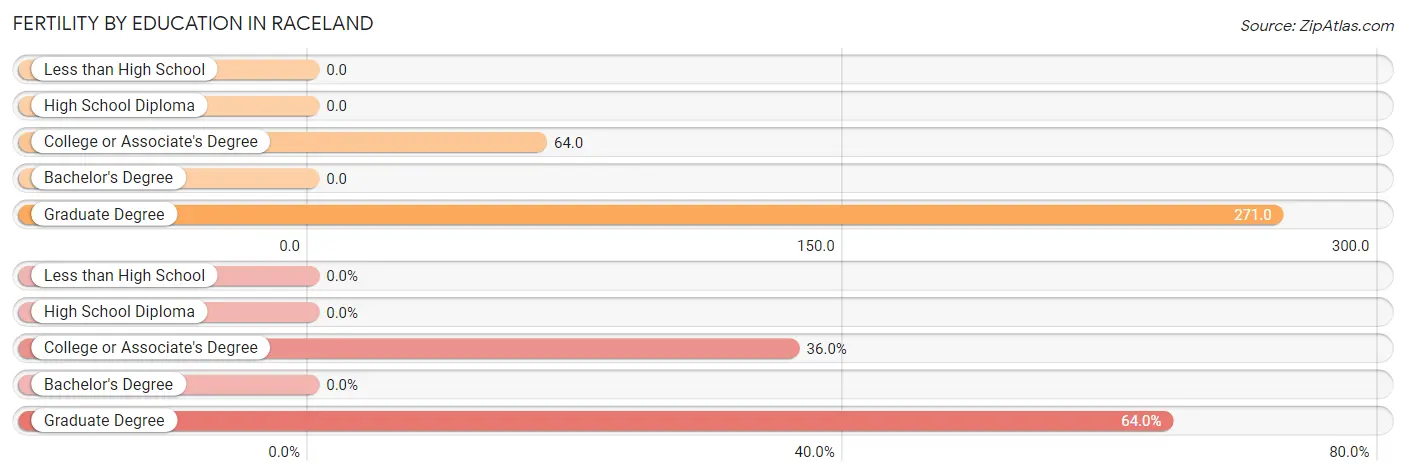
| Educational Attainment | Women with Births | Births / 1,000 Women |
| Less than High School | 0 (0.0%) | 0.0 |
| High School Diploma | 0 (0.0%) | 0.0 |
| College or Associate's Degree | 9 (36.0%) | 64.0 |
| Bachelor's Degree | 0 (0.0%) | 0.0 |
| Graduate Degree | 16 (64.0%) | 271.0 |
| Total | 25 (100.0%) | 66.0 |
Fertility by Education by Marriage Status in Raceland
24.0% of women with births in Raceland are unmarried. Women with the educational attainment of graduate degree are most likely to be married with 100.0% of them married at childbirth, while women with the educational attainment of college or associate's degree are least likely to be married with 66.7% of them unmarried at childbirth.
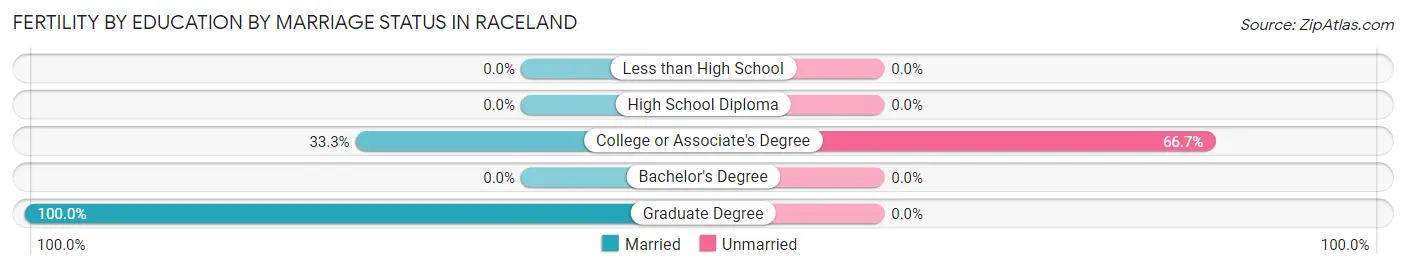
| Educational Attainment | Married | Unmarried |
| Less than High School | 0 (0.0%) | 0 (0.0%) |
| High School Diploma | 0 (0.0%) | 0 (0.0%) |
| College or Associate's Degree | 3 (33.3%) | 6 (66.7%) |
| Bachelor's Degree | 0 (0.0%) | 0 (0.0%) |
| Graduate Degree | 16 (100.0%) | 0 (0.0%) |
| Total | 19 (76.0%) | 6 (24.0%) |
Employment Characteristics in Raceland
Employment by Class of Employer in Raceland
Among the 680 employed individuals in Raceland, private company employees (415 | 61.0%), not-for-profit organizations (104 | 15.3%), and state government employees (39 | 5.7%) make up the most common classes of employment.
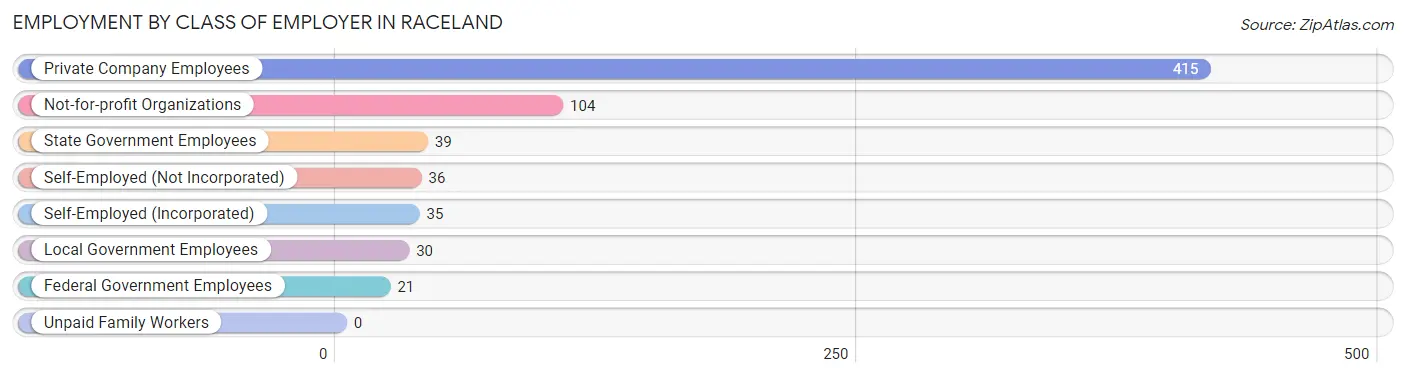
| Employer Class | # Employees | % Employees |
| Private Company Employees | 415 | 61.0% |
| Self-Employed (Incorporated) | 35 | 5.1% |
| Self-Employed (Not Incorporated) | 36 | 5.3% |
| Not-for-profit Organizations | 104 | 15.3% |
| Local Government Employees | 30 | 4.4% |
| State Government Employees | 39 | 5.7% |
| Federal Government Employees | 21 | 3.1% |
| Unpaid Family Workers | 0 | 0.0% |
| Total | 680 | 100.0% |
Employment Status by Age in Raceland
According to the labor force statistics for Raceland, out of the total population over 16 years of age (1,710), 43.3% or 740 individuals are in the labor force, with 7.2% or 53 of them unemployed. The age group with the highest labor force participation rate is 25 to 29 years, with 94.8% or 109 individuals in the labor force. Within the labor force, the 16 to 19 years age range has the highest percentage of unemployed individuals, with 54.2% or 13 of them being unemployed.
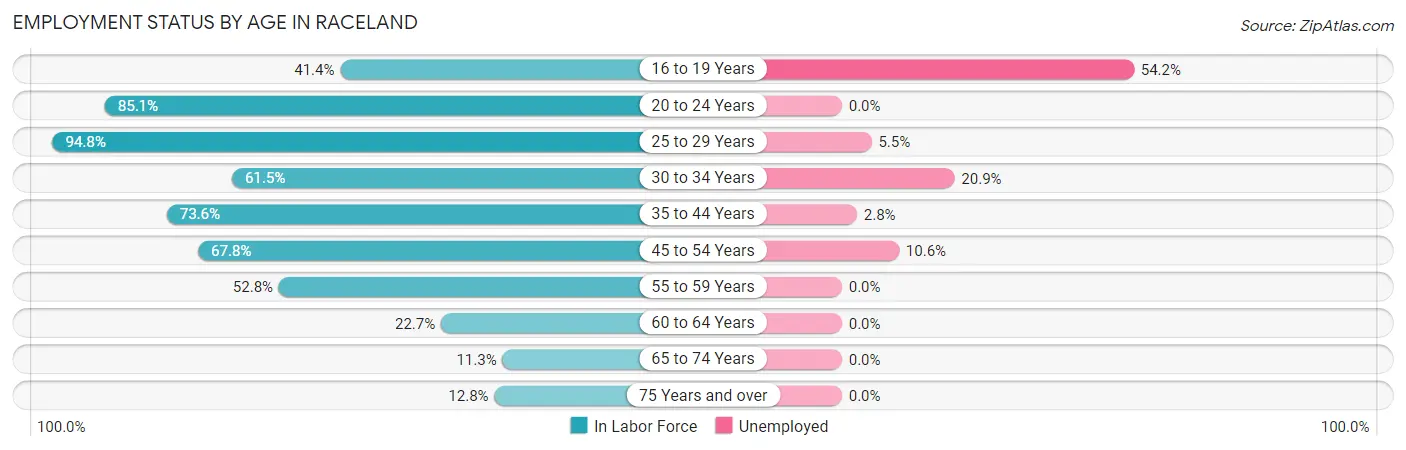
| Age Bracket | In Labor Force | Unemployed |
| 16 to 19 Years | 24 (41.4%) | 13 (54.2%) |
| 20 to 24 Years | 80 (85.1%) | 0 (0.0%) |
| 25 to 29 Years | 109 (94.8%) | 6 (5.5%) |
| 30 to 34 Years | 67 (61.5%) | 14 (20.9%) |
| 35 to 44 Years | 109 (73.6%) | 3 (2.8%) |
| 45 to 54 Years | 160 (67.8%) | 17 (10.6%) |
| 55 to 59 Years | 66 (52.8%) | 0 (0.0%) |
| 60 to 64 Years | 58 (22.7%) | 0 (0.0%) |
| 65 to 74 Years | 46 (11.3%) | 0 (0.0%) |
| 75 Years and over | 21 (12.8%) | 0 (0.0%) |
| Total | 740 (43.3%) | 53 (7.2%) |
Employment Status by Educational Attainment in Raceland
According to labor force statistics for Raceland, 57.6% of individuals (569) out of the total population between 25 and 64 years of age (988) are in the labor force, with 7.0% or 40 of them being unemployed. The group with the highest labor force participation rate are those with the educational attainment of bachelor's degree or higher, with 82.2% or 231 individuals in the labor force. Within the labor force, individuals with high school diploma education have the highest percentage of unemployment, with 16.1% or 19 of them being unemployed.
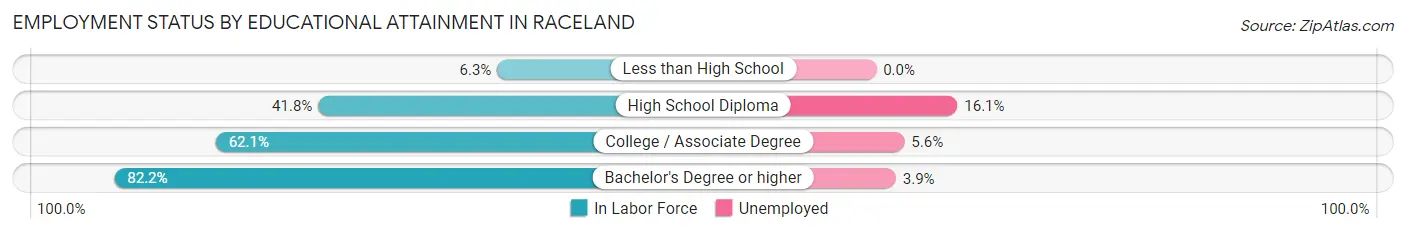
| Educational Attainment | In Labor Force | Unemployed |
| Less than High School | 5 (6.3%) | 0 (0.0%) |
| High School Diploma | 118 (41.8%) | 45 (16.1%) |
| College / Associate Degree | 215 (62.1%) | 19 (5.6%) |
| Bachelor's Degree or higher | 231 (82.2%) | 11 (3.9%) |
| Total | 569 (57.6%) | 69 (7.0%) |
Employment Occupations by Sex in Raceland
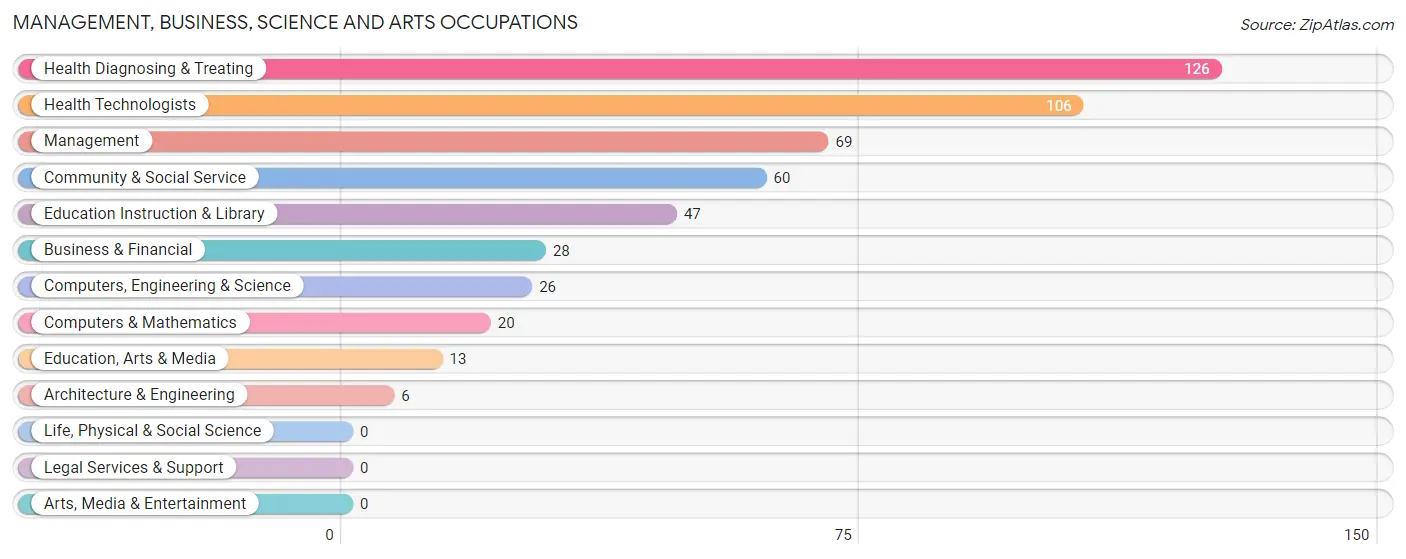
Management, Business, Science and Arts Occupations
The most common Management, Business, Science and Arts occupations in Raceland are Health Diagnosing & Treating (126 | 18.3%), Health Technologists (106 | 15.4%), Management (69 | 10.0%), Community & Social Service (60 | 8.7%), and Education Instruction & Library (47 | 6.8%).
Management, Business, Science and Arts Occupations by Sex
Within the Management, Business, Science and Arts occupations in Raceland, the most male-oriented occupations are Computers, Engineering & Science (100.0%), Computers & Mathematics (100.0%), and Architecture & Engineering (100.0%), while the most female-oriented occupations are Education Instruction & Library (91.5%), Health Technologists (80.2%), and Health Diagnosing & Treating (78.6%).
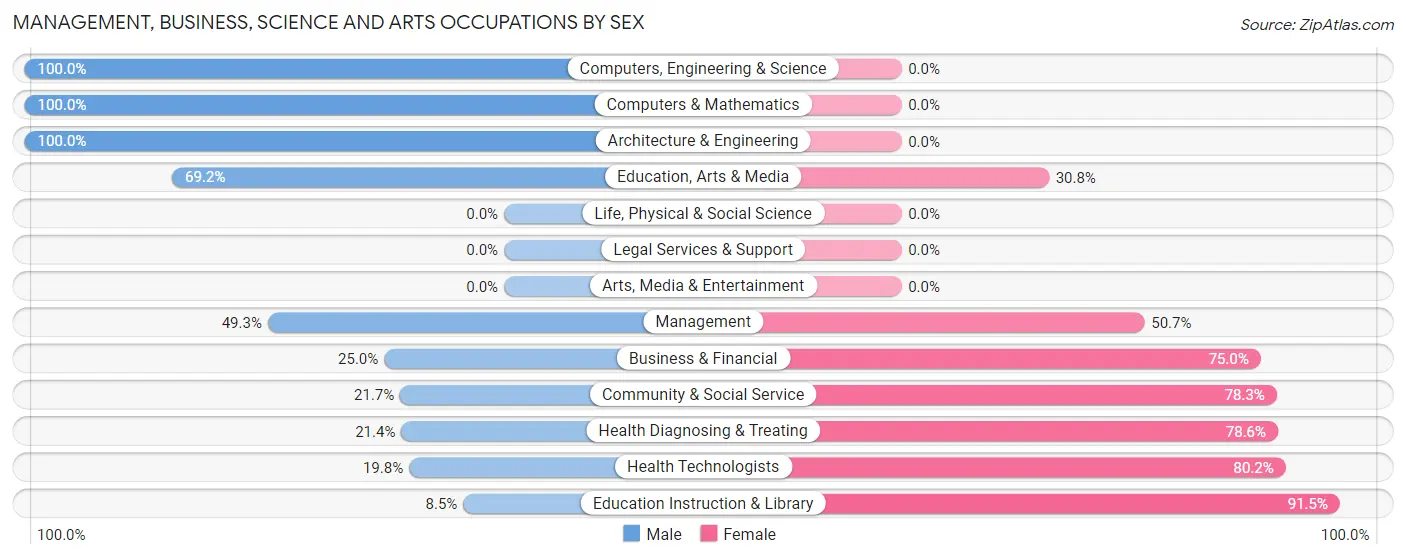
| Occupation | Male | Female |
| Management | 34 (49.3%) | 35 (50.7%) |
| Business & Financial | 7 (25.0%) | 21 (75.0%) |
| Computers, Engineering & Science | 26 (100.0%) | 0 (0.0%) |
| Computers & Mathematics | 20 (100.0%) | 0 (0.0%) |
| Architecture & Engineering | 6 (100.0%) | 0 (0.0%) |
| Life, Physical & Social Science | 0 (0.0%) | 0 (0.0%) |
| Community & Social Service | 13 (21.7%) | 47 (78.3%) |
| Education, Arts & Media | 9 (69.2%) | 4 (30.8%) |
| Legal Services & Support | 0 (0.0%) | 0 (0.0%) |
| Education Instruction & Library | 4 (8.5%) | 43 (91.5%) |
| Arts, Media & Entertainment | 0 (0.0%) | 0 (0.0%) |
| Health Diagnosing & Treating | 27 (21.4%) | 99 (78.6%) |
| Health Technologists | 21 (19.8%) | 85 (80.2%) |
| Total (Category) | 107 (34.6%) | 202 (65.4%) |
| Total (Overall) | 322 (46.9%) | 365 (53.1%) |
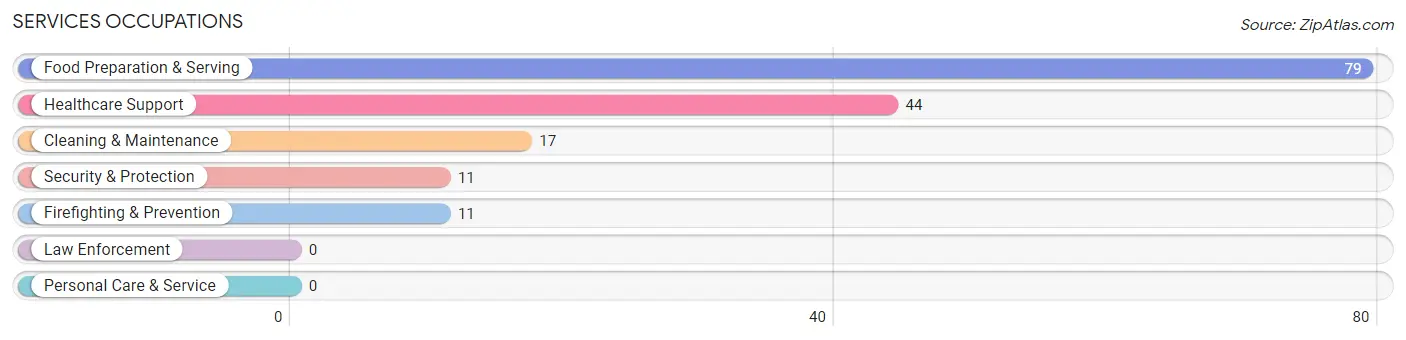
Services Occupations
The most common Services occupations in Raceland are Food Preparation & Serving (79 | 11.5%), Healthcare Support (44 | 6.4%), Cleaning & Maintenance (17 | 2.5%), Security & Protection (11 | 1.6%), and Firefighting & Prevention (11 | 1.6%).
Services Occupations by Sex
Within the Services occupations in Raceland, the most male-oriented occupations are Security & Protection (100.0%), Firefighting & Prevention (100.0%), and Food Preparation & Serving (53.2%), while the most female-oriented occupations are Healthcare Support (86.4%), Cleaning & Maintenance (64.7%), and Food Preparation & Serving (46.8%).
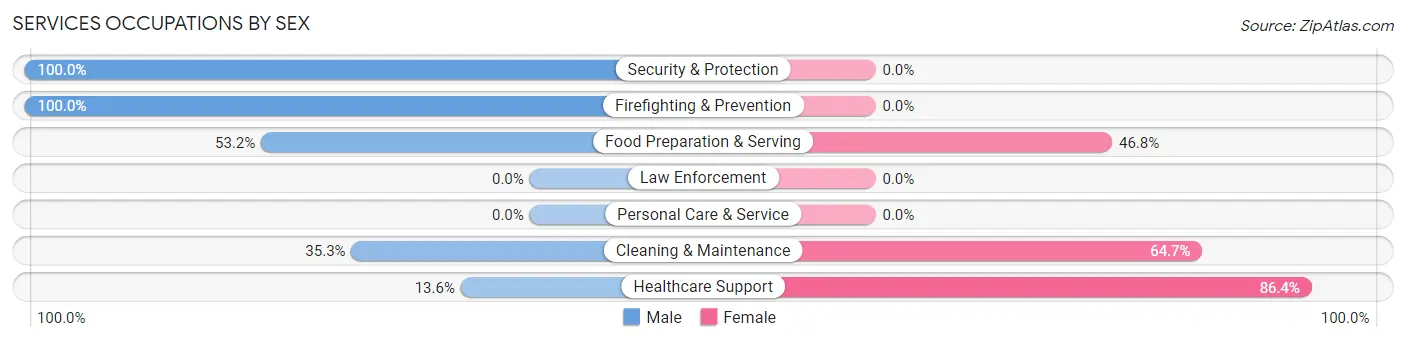
| Occupation | Male | Female |
| Healthcare Support | 6 (13.6%) | 38 (86.4%) |
| Security & Protection | 11 (100.0%) | 0 (0.0%) |
| Firefighting & Prevention | 11 (100.0%) | 0 (0.0%) |
| Law Enforcement | 0 (0.0%) | 0 (0.0%) |
| Food Preparation & Serving | 42 (53.2%) | 37 (46.8%) |
| Cleaning & Maintenance | 6 (35.3%) | 11 (64.7%) |
| Personal Care & Service | 0 (0.0%) | 0 (0.0%) |
| Total (Category) | 65 (43.0%) | 86 (57.0%) |
| Total (Overall) | 322 (46.9%) | 365 (53.1%) |
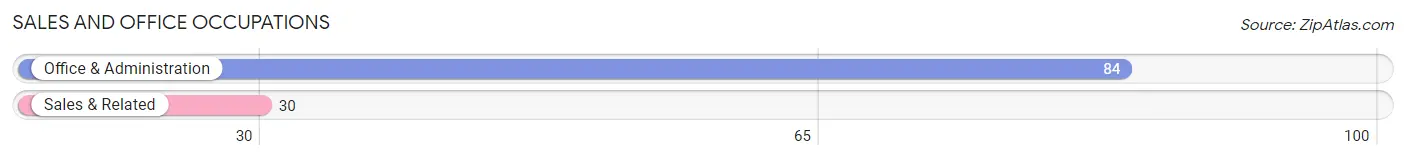
Sales and Office Occupations
The most common Sales and Office occupations in Raceland are Office & Administration (84 | 12.2%), and Sales & Related (30 | 4.4%).
Sales and Office Occupations by Sex
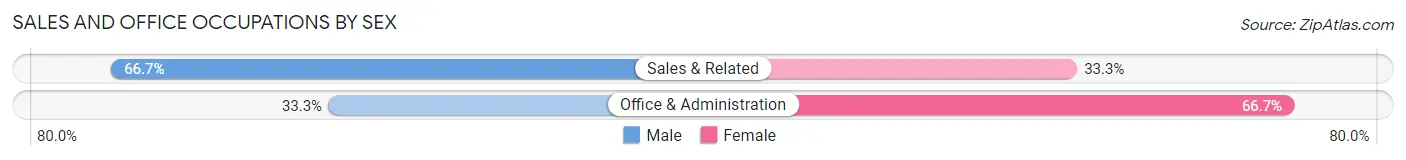
| Occupation | Male | Female |
| Sales & Related | 20 (66.7%) | 10 (33.3%) |
| Office & Administration | 28 (33.3%) | 56 (66.7%) |
| Total (Category) | 48 (42.1%) | 66 (57.9%) |
| Total (Overall) | 322 (46.9%) | 365 (53.1%) |
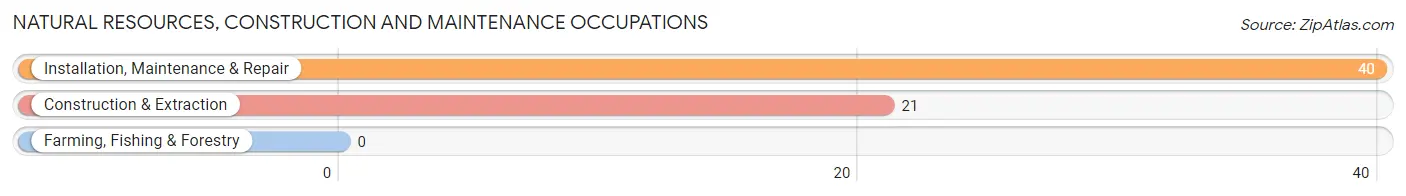
Natural Resources, Construction and Maintenance Occupations
The most common Natural Resources, Construction and Maintenance occupations in Raceland are Installation, Maintenance & Repair (40 | 5.8%), and Construction & Extraction (21 | 3.1%).
Natural Resources, Construction and Maintenance Occupations by Sex
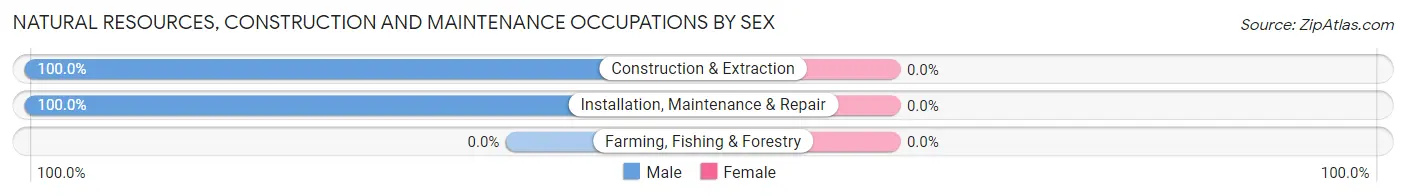
| Occupation | Male | Female |
| Farming, Fishing & Forestry | 0 (0.0%) | 0 (0.0%) |
| Construction & Extraction | 21 (100.0%) | 0 (0.0%) |
| Installation, Maintenance & Repair | 40 (100.0%) | 0 (0.0%) |
| Total (Category) | 61 (100.0%) | 0 (0.0%) |
| Total (Overall) | 322 (46.9%) | 365 (53.1%) |
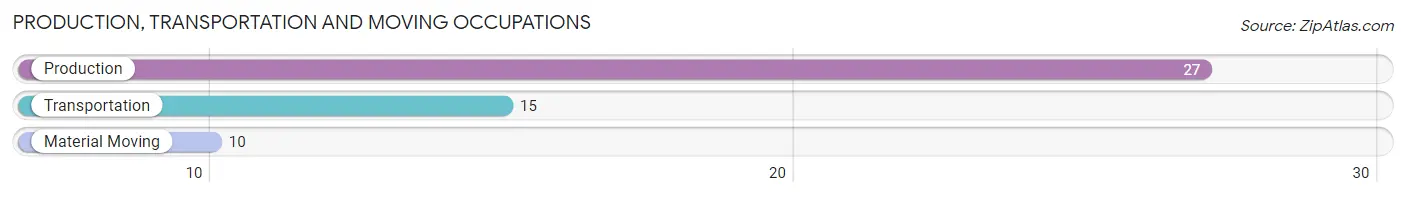
Production, Transportation and Moving Occupations
The most common Production, Transportation and Moving occupations in Raceland are Production (27 | 3.9%), Transportation (15 | 2.2%), and Material Moving (10 | 1.5%).
Production, Transportation and Moving Occupations by Sex
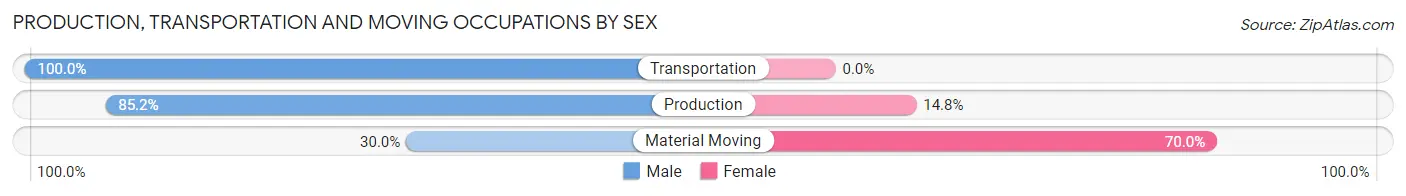
| Occupation | Male | Female |
| Production | 23 (85.2%) | 4 (14.8%) |
| Transportation | 15 (100.0%) | 0 (0.0%) |
| Material Moving | 3 (30.0%) | 7 (70.0%) |
| Total (Category) | 41 (78.8%) | 11 (21.1%) |
| Total (Overall) | 322 (46.9%) | 365 (53.1%) |
Employment Industries by Sex in Raceland
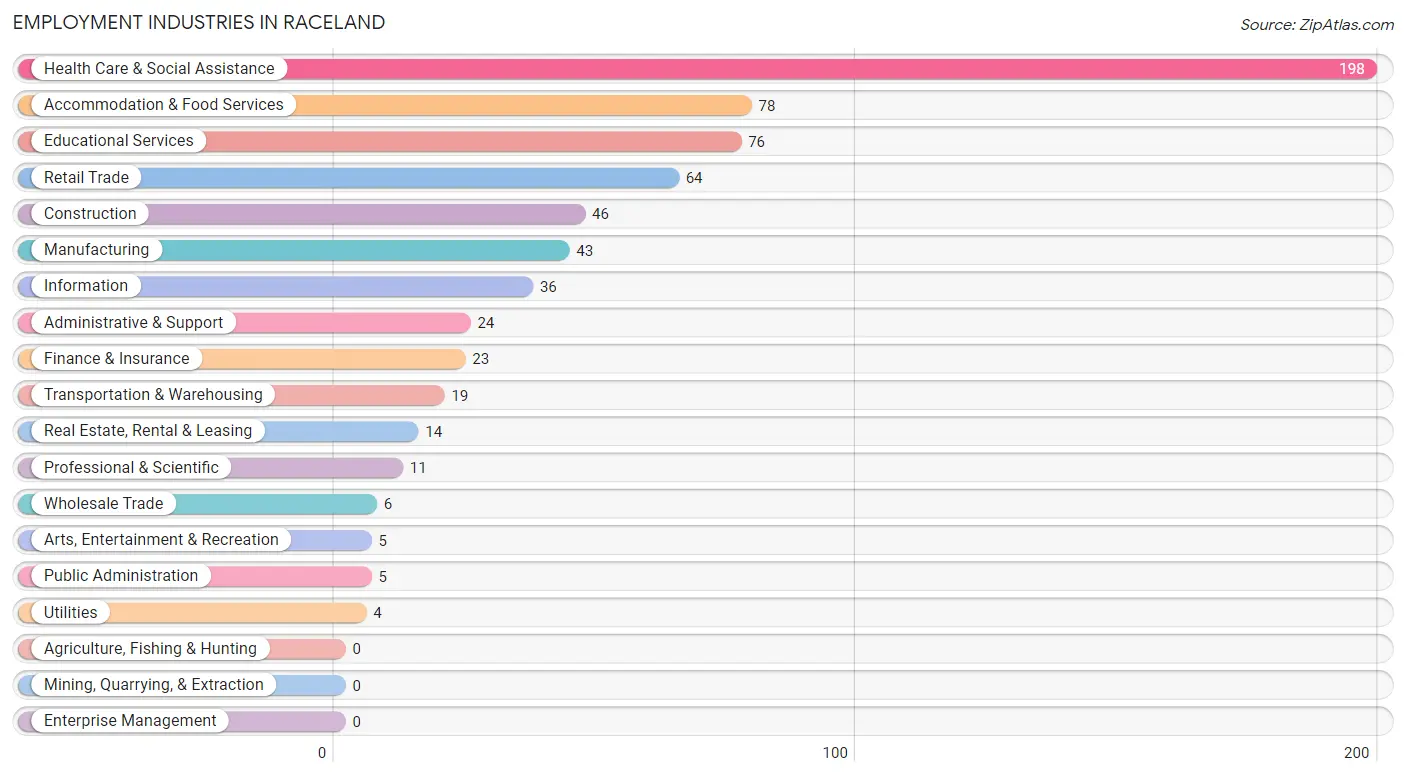
Employment Industries in Raceland
The major employment industries in Raceland include Health Care & Social Assistance (198 | 28.8%), Accommodation & Food Services (78 | 11.4%), Educational Services (76 | 11.1%), Retail Trade (64 | 9.3%), and Construction (46 | 6.7%).
Employment Industries by Sex in Raceland
The Raceland industries that see more men than women are Construction (100.0%), Wholesale Trade (100.0%), and Transportation & Warehousing (100.0%), whereas the industries that tend to have a higher number of women are Public Administration (100.0%), Finance & Insurance (87.0%), and Health Care & Social Assistance (80.8%).
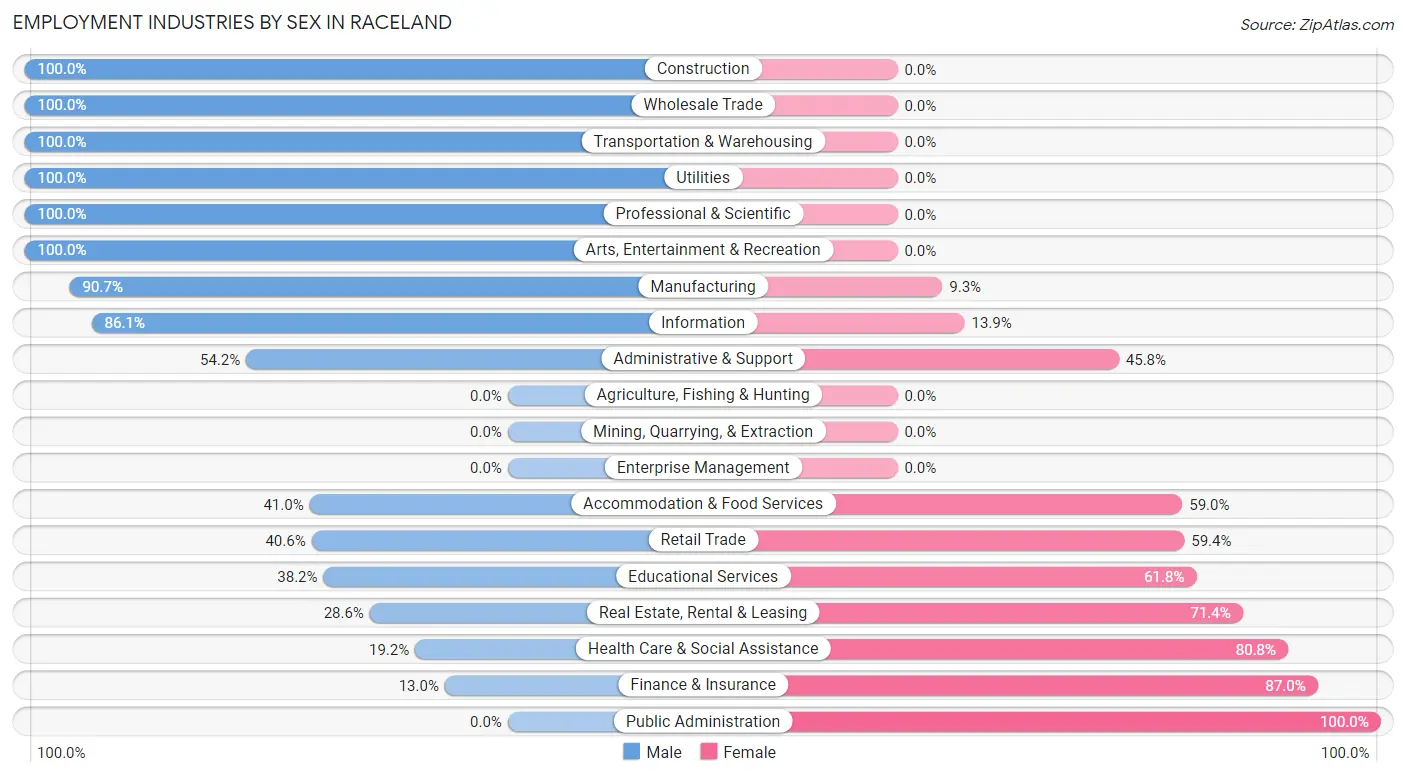
| Industry | Male | Female |
| Agriculture, Fishing & Hunting | 0 (0.0%) | 0 (0.0%) |
| Mining, Quarrying, & Extraction | 0 (0.0%) | 0 (0.0%) |
| Construction | 46 (100.0%) | 0 (0.0%) |
| Manufacturing | 39 (90.7%) | 4 (9.3%) |
| Wholesale Trade | 6 (100.0%) | 0 (0.0%) |
| Retail Trade | 26 (40.6%) | 38 (59.4%) |
| Transportation & Warehousing | 19 (100.0%) | 0 (0.0%) |
| Utilities | 4 (100.0%) | 0 (0.0%) |
| Information | 31 (86.1%) | 5 (13.9%) |
| Finance & Insurance | 3 (13.0%) | 20 (87.0%) |
| Real Estate, Rental & Leasing | 4 (28.6%) | 10 (71.4%) |
| Professional & Scientific | 11 (100.0%) | 0 (0.0%) |
| Enterprise Management | 0 (0.0%) | 0 (0.0%) |
| Administrative & Support | 13 (54.2%) | 11 (45.8%) |
| Educational Services | 29 (38.2%) | 47 (61.8%) |
| Health Care & Social Assistance | 38 (19.2%) | 160 (80.8%) |
| Arts, Entertainment & Recreation | 5 (100.0%) | 0 (0.0%) |
| Accommodation & Food Services | 32 (41.0%) | 46 (59.0%) |
| Public Administration | 0 (0.0%) | 5 (100.0%) |
| Total | 322 (46.9%) | 365 (53.1%) |
Education in Raceland
School Enrollment in Raceland
The most common levels of schooling among the 450 students in Raceland are college / undergraduate (132 | 29.3%), elementary school (87 | 19.3%), and high school (62 | 13.8%).
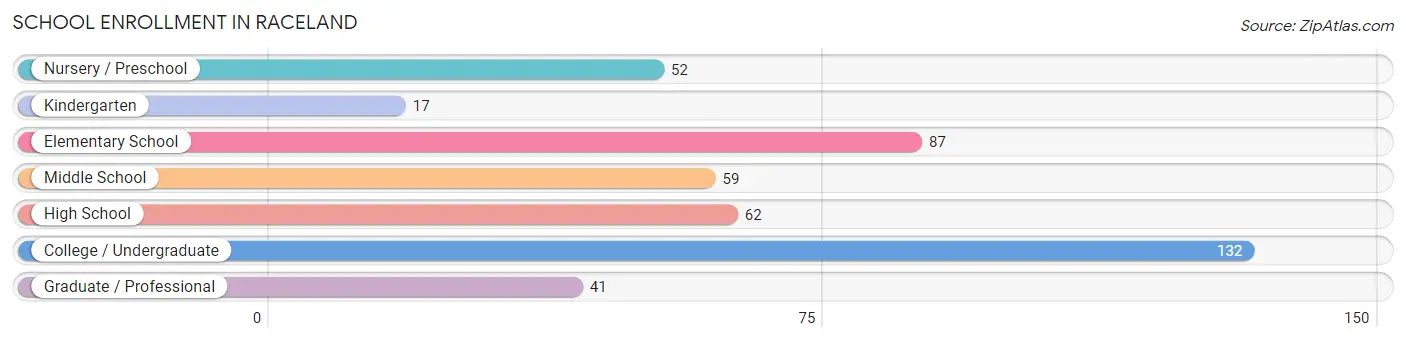
| School Level | # Students | % Students |
| Nursery / Preschool | 52 | 11.6% |
| Kindergarten | 17 | 3.8% |
| Elementary School | 87 | 19.3% |
| Middle School | 59 | 13.1% |
| High School | 62 | 13.8% |
| College / Undergraduate | 132 | 29.3% |
| Graduate / Professional | 41 | 9.1% |
| Total | 450 | 100.0% |
School Enrollment by Age by Funding Source in Raceland
Out of a total of 450 students who are enrolled in schools in Raceland, 54 (12.0%) attend a private institution, while the remaining 396 (88.0%) are enrolled in public schools. The age group of 18 to 19 year olds has the highest likelihood of being enrolled in private schools, with 11 (45.8% in the age bracket) enrolled. Conversely, the age group of 3 to 4 year olds has the lowest likelihood of being enrolled in a private school, with 42 (100.0% in the age bracket) attending a public institution.
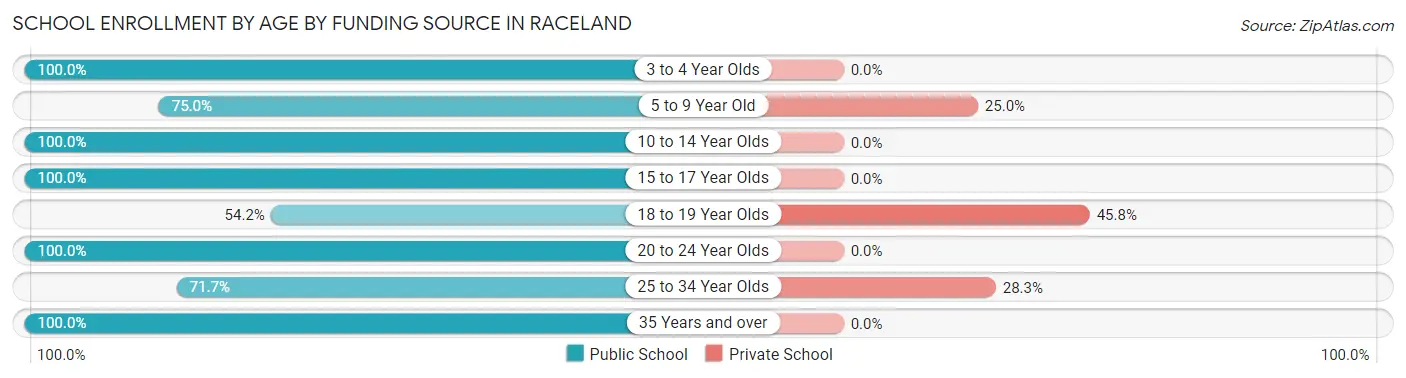
| Age Bracket | Public School | Private School |
| 3 to 4 Year Olds | 42 (100.0%) | 0 (0.0%) |
| 5 to 9 Year Old | 78 (75.0%) | 26 (25.0%) |
| 10 to 14 Year Olds | 76 (100.0%) | 0 (0.0%) |
| 15 to 17 Year Olds | 55 (100.0%) | 0 (0.0%) |
| 18 to 19 Year Olds | 13 (54.2%) | 11 (45.8%) |
| 20 to 24 Year Olds | 62 (100.0%) | 0 (0.0%) |
| 25 to 34 Year Olds | 43 (71.7%) | 17 (28.3%) |
| 35 Years and over | 27 (100.0%) | 0 (0.0%) |
| Total | 396 (88.0%) | 54 (12.0%) |
Educational Attainment by Field of Study in Raceland
Science & technology (122 | 29.1%), education (76 | 18.1%), business (66 | 15.8%), liberal arts & history (40 | 9.6%), and bio, nature & agricultural (38 | 9.1%) are the most common fields of study among 419 individuals in Raceland who have obtained a bachelor's degree or higher.
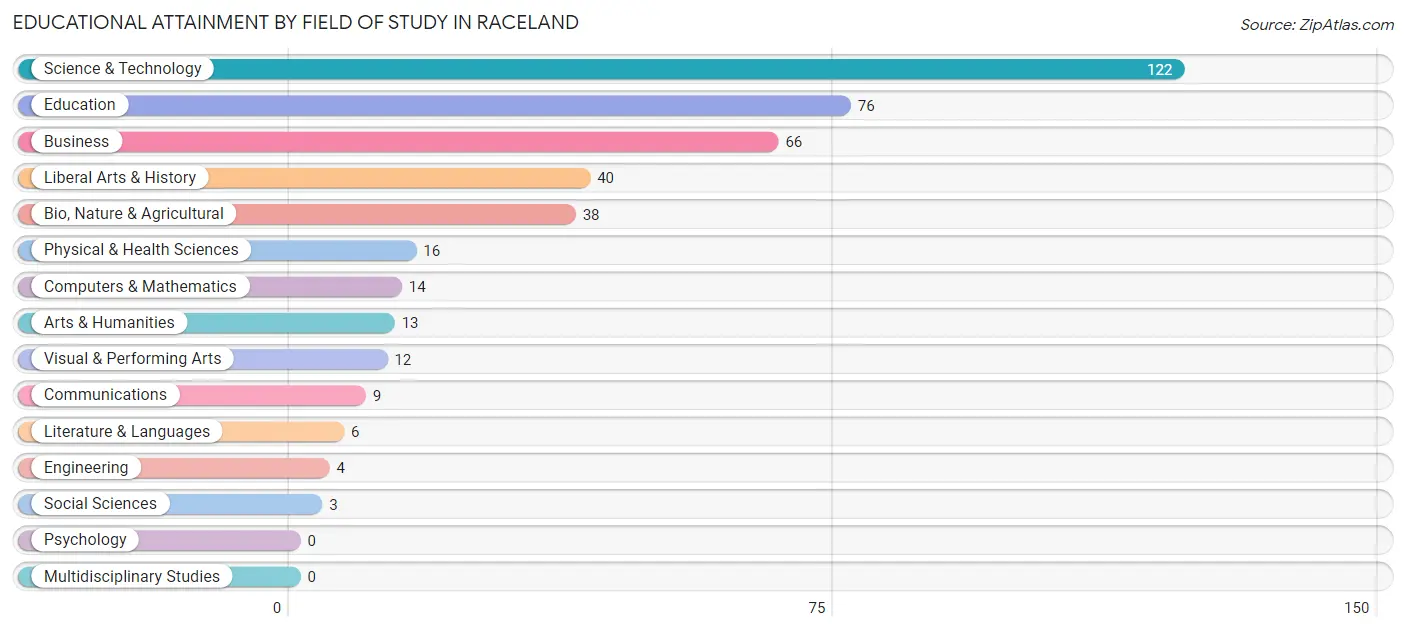
| Field of Study | # Graduates | % Graduates |
| Computers & Mathematics | 14 | 3.3% |
| Bio, Nature & Agricultural | 38 | 9.1% |
| Physical & Health Sciences | 16 | 3.8% |
| Psychology | 0 | 0.0% |
| Social Sciences | 3 | 0.7% |
| Engineering | 4 | 0.9% |
| Multidisciplinary Studies | 0 | 0.0% |
| Science & Technology | 122 | 29.1% |
| Business | 66 | 15.8% |
| Education | 76 | 18.1% |
| Literature & Languages | 6 | 1.4% |
| Liberal Arts & History | 40 | 9.6% |
| Visual & Performing Arts | 12 | 2.9% |
| Communications | 9 | 2.1% |
| Arts & Humanities | 13 | 3.1% |
| Total | 419 | 100.0% |
Transportation & Commute in Raceland
Vehicle Availability by Sex in Raceland
The most prevalent vehicle ownership categories in Raceland are males with 2 vehicles (216, accounting for 67.1%) and females with 2 vehicles (178, making up 60.3%).
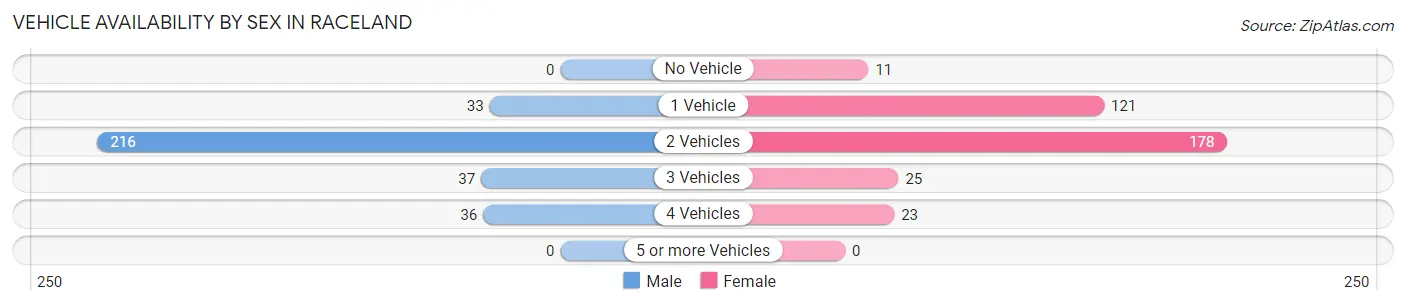
| Vehicles Available | Male | Female |
| No Vehicle | 0 (0.0%) | 11 (3.1%) |
| 1 Vehicle | 33 (10.2%) | 121 (33.8%) |
| 2 Vehicles | 216 (67.1%) | 178 (49.7%) |
| 3 Vehicles | 37 (11.5%) | 25 (7.0%) |
| 4 Vehicles | 36 (11.2%) | 23 (6.4%) |
| 5 or more Vehicles | 0 (0.0%) | 0 (0.0%) |
| Total | 322 (100.0%) | 358 (100.0%) |
Commute Time in Raceland
The most frequently occuring commute durations in Raceland are 15 to 19 minutes (112 commuters, 17.8%), 20 to 24 minutes (105 commuters, 16.7%), and 5 to 9 minutes (89 commuters, 14.1%).
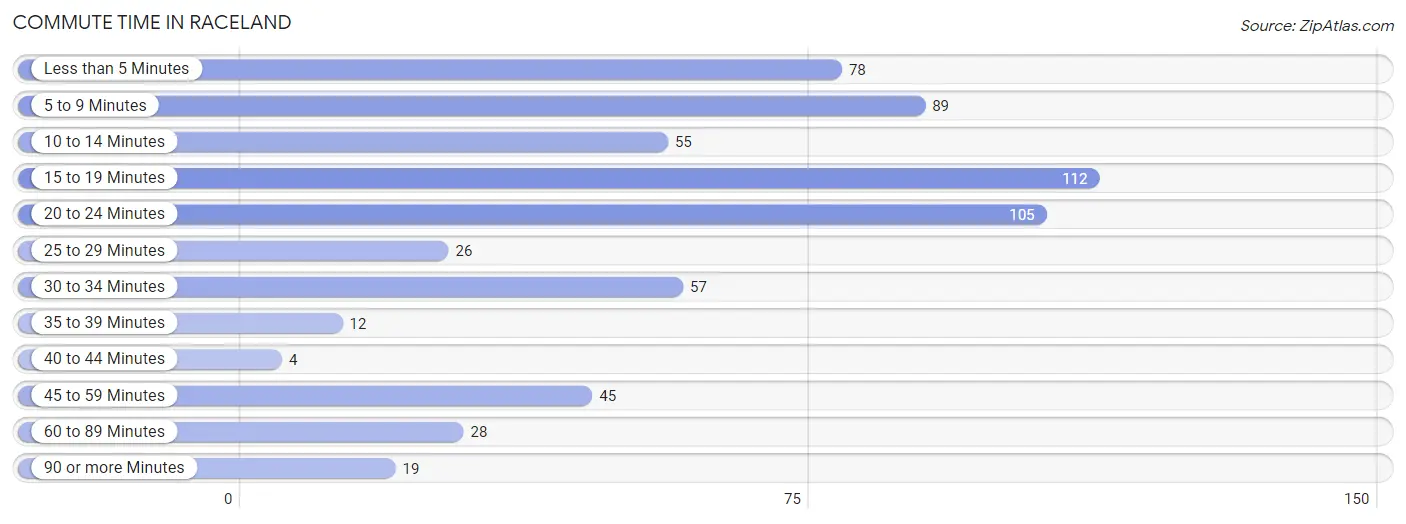
| Commute Time | # Commuters | % Commuters |
| Less than 5 Minutes | 78 | 12.4% |
| 5 to 9 Minutes | 89 | 14.1% |
| 10 to 14 Minutes | 55 | 8.7% |
| 15 to 19 Minutes | 112 | 17.8% |
| 20 to 24 Minutes | 105 | 16.7% |
| 25 to 29 Minutes | 26 | 4.1% |
| 30 to 34 Minutes | 57 | 9.0% |
| 35 to 39 Minutes | 12 | 1.9% |
| 40 to 44 Minutes | 4 | 0.6% |
| 45 to 59 Minutes | 45 | 7.1% |
| 60 to 89 Minutes | 28 | 4.4% |
| 90 or more Minutes | 19 | 3.0% |
Commute Time by Sex in Raceland
The most common commute times in Raceland are 15 to 19 minutes (52 commuters, 18.0%) for males and 20 to 24 minutes (71 commuters, 20.8%) for females.
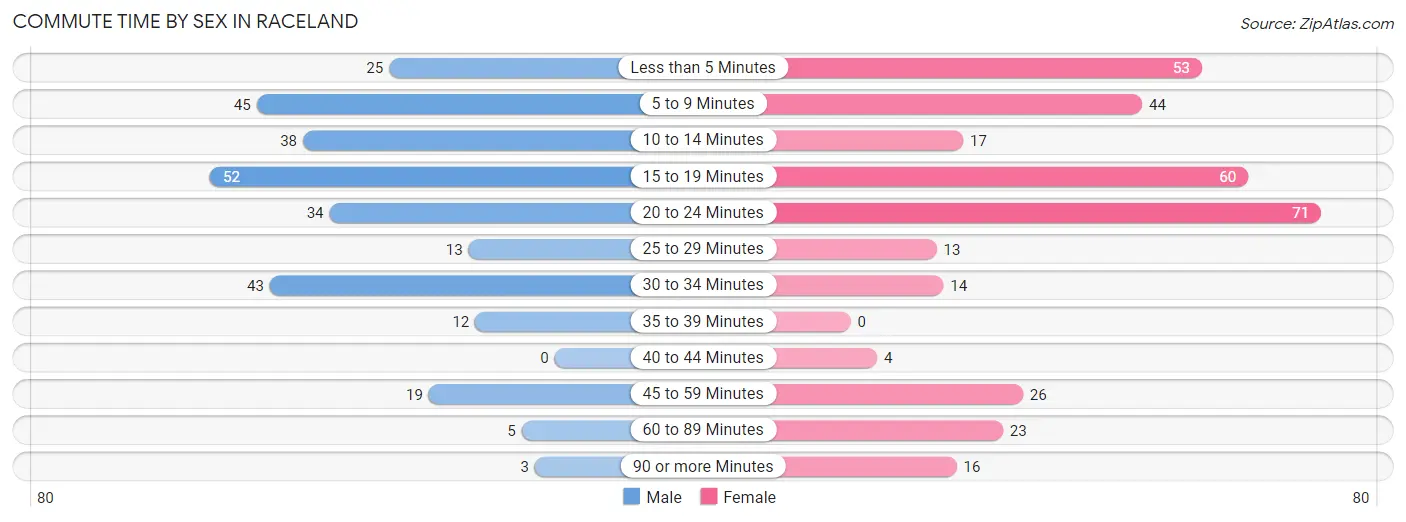
| Commute Time | Male | Female |
| Less than 5 Minutes | 25 (8.6%) | 53 (15.5%) |
| 5 to 9 Minutes | 45 (15.6%) | 44 (12.9%) |
| 10 to 14 Minutes | 38 (13.2%) | 17 (5.0%) |
| 15 to 19 Minutes | 52 (18.0%) | 60 (17.6%) |
| 20 to 24 Minutes | 34 (11.8%) | 71 (20.8%) |
| 25 to 29 Minutes | 13 (4.5%) | 13 (3.8%) |
| 30 to 34 Minutes | 43 (14.9%) | 14 (4.1%) |
| 35 to 39 Minutes | 12 (4.2%) | 0 (0.0%) |
| 40 to 44 Minutes | 0 (0.0%) | 4 (1.2%) |
| 45 to 59 Minutes | 19 (6.6%) | 26 (7.6%) |
| 60 to 89 Minutes | 5 (1.7%) | 23 (6.7%) |
| 90 or more Minutes | 3 (1.0%) | 16 (4.7%) |
Time of Departure to Work by Sex in Raceland
The most frequent times of departure to work in Raceland are 12:00 PM to 3:59 PM (69, 23.9%) for males and 4:00 PM to 11:59 PM (66, 19.4%) for females.
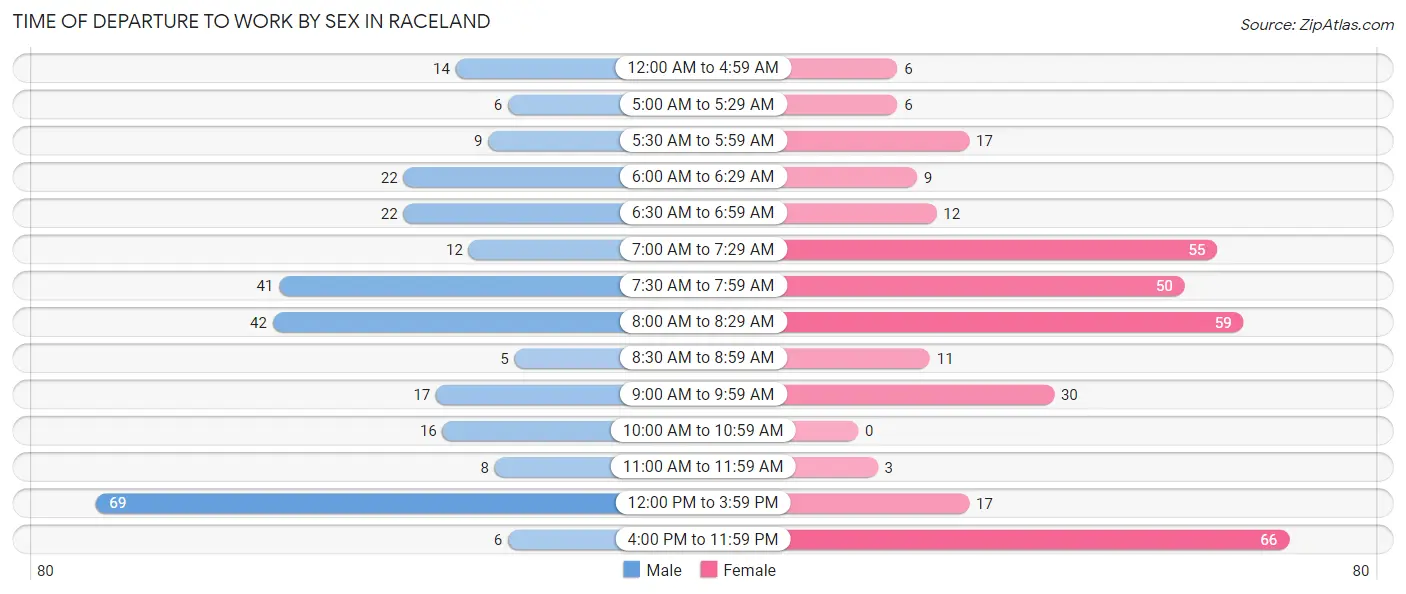
| Time of Departure | Male | Female |
| 12:00 AM to 4:59 AM | 14 (4.8%) | 6 (1.8%) |
| 5:00 AM to 5:29 AM | 6 (2.1%) | 6 (1.8%) |
| 5:30 AM to 5:59 AM | 9 (3.1%) | 17 (5.0%) |
| 6:00 AM to 6:29 AM | 22 (7.6%) | 9 (2.6%) |
| 6:30 AM to 6:59 AM | 22 (7.6%) | 12 (3.5%) |
| 7:00 AM to 7:29 AM | 12 (4.2%) | 55 (16.1%) |
| 7:30 AM to 7:59 AM | 41 (14.2%) | 50 (14.7%) |
| 8:00 AM to 8:29 AM | 42 (14.5%) | 59 (17.3%) |
| 8:30 AM to 8:59 AM | 5 (1.7%) | 11 (3.2%) |
| 9:00 AM to 9:59 AM | 17 (5.9%) | 30 (8.8%) |
| 10:00 AM to 10:59 AM | 16 (5.5%) | 0 (0.0%) |
| 11:00 AM to 11:59 AM | 8 (2.8%) | 3 (0.9%) |
| 12:00 PM to 3:59 PM | 69 (23.9%) | 17 (5.0%) |
| 4:00 PM to 11:59 PM | 6 (2.1%) | 66 (19.4%) |
| Total | 289 (100.0%) | 341 (100.0%) |
Housing Occupancy in Raceland
Occupancy by Ownership in Raceland
Of the total 1,018 dwellings in Raceland, owner-occupied units account for 716 (70.3%), while renter-occupied units make up 302 (29.7%).
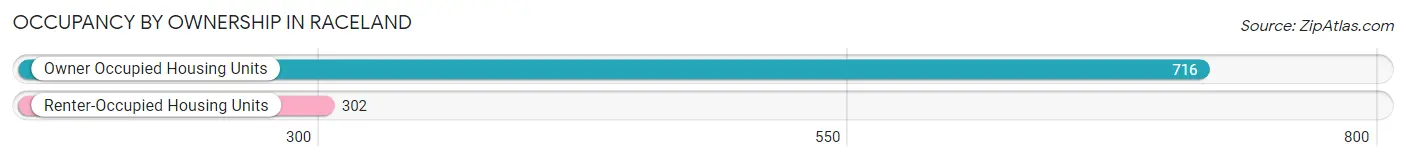
| Occupancy | # Housing Units | % Housing Units |
| Owner Occupied Housing Units | 716 | 70.3% |
| Renter-Occupied Housing Units | 302 | 29.7% |
| Total Occupied Housing Units | 1,018 | 100.0% |
Occupancy by Household Size in Raceland
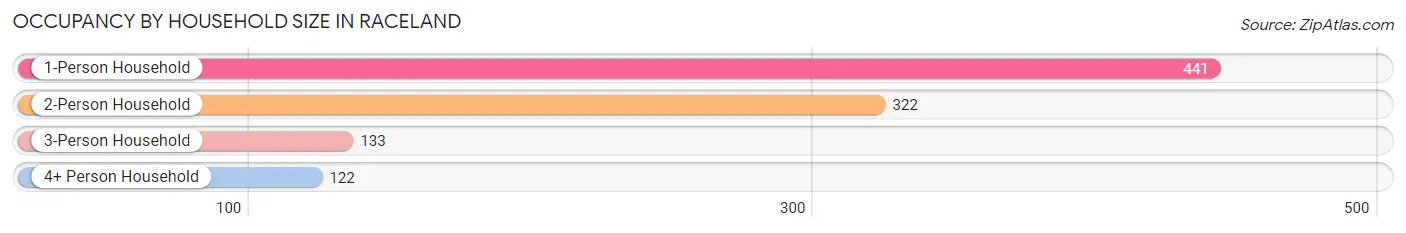
| Household Size | # Housing Units | % Housing Units |
| 1-Person Household | 441 | 43.3% |
| 2-Person Household | 322 | 31.6% |
| 3-Person Household | 133 | 13.1% |
| 4+ Person Household | 122 | 12.0% |
| Total Housing Units | 1,018 | 100.0% |
Occupancy by Ownership by Household Size in Raceland
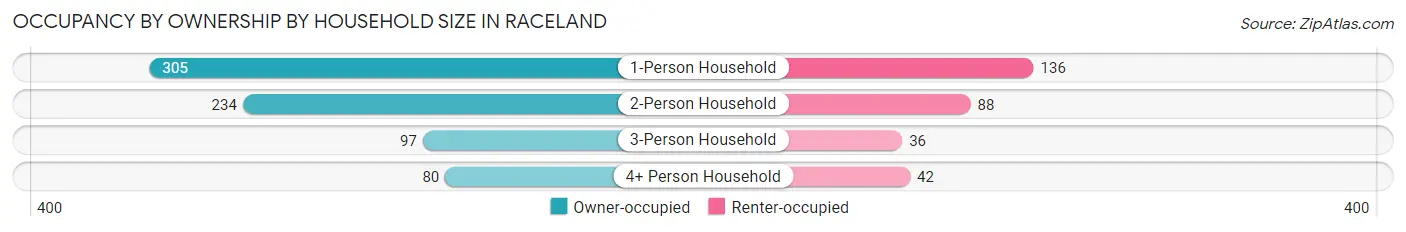
| Household Size | Owner-occupied | Renter-occupied |
| 1-Person Household | 305 (69.2%) | 136 (30.8%) |
| 2-Person Household | 234 (72.7%) | 88 (27.3%) |
| 3-Person Household | 97 (72.9%) | 36 (27.1%) |
| 4+ Person Household | 80 (65.6%) | 42 (34.4%) |
| Total Housing Units | 716 (70.3%) | 302 (29.7%) |
Occupancy by Educational Attainment in Raceland
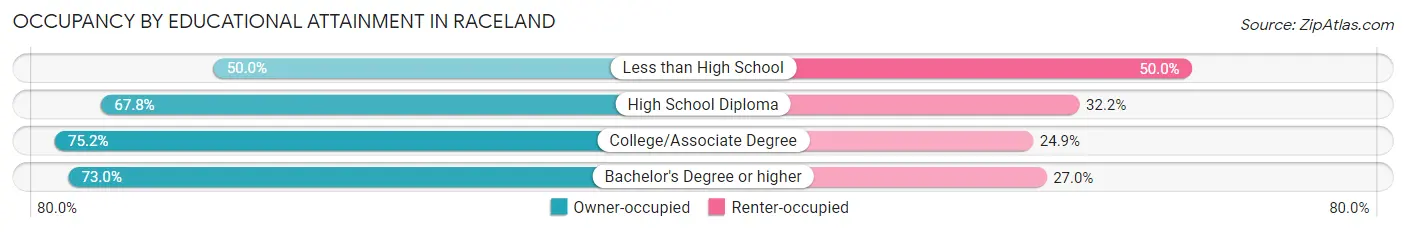
| Household Size | Owner-occupied | Renter-occupied |
| Less than High School | 32 (50.0%) | 32 (50.0%) |
| High School Diploma | 257 (67.8%) | 122 (32.2%) |
| College/Associate Degree | 251 (75.1%) | 83 (24.8%) |
| Bachelor's Degree or higher | 176 (73.0%) | 65 (27.0%) |
Occupancy by Age of Householder in Raceland
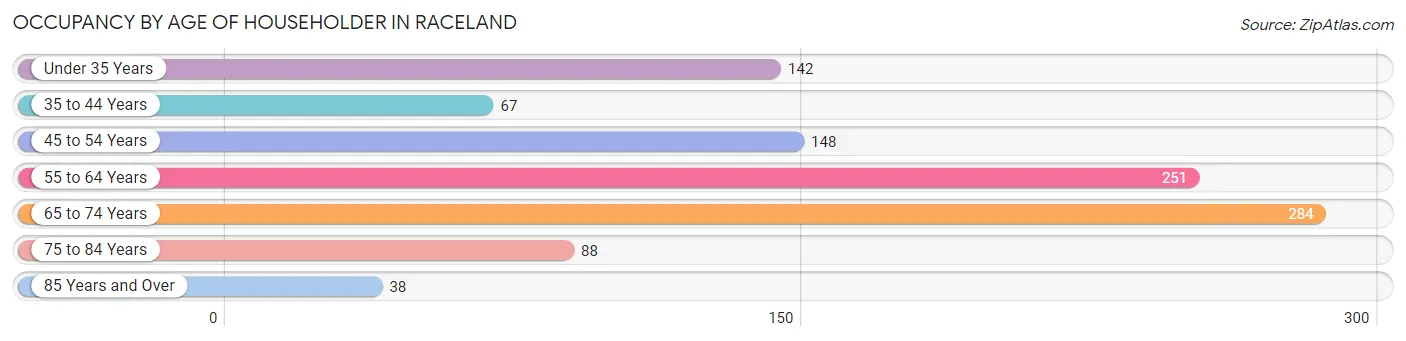
| Age Bracket | # Households | % Households |
| Under 35 Years | 142 | 14.0% |
| 35 to 44 Years | 67 | 6.6% |
| 45 to 54 Years | 148 | 14.5% |
| 55 to 64 Years | 251 | 24.7% |
| 65 to 74 Years | 284 | 27.9% |
| 75 to 84 Years | 88 | 8.6% |
| 85 Years and Over | 38 | 3.7% |
| Total | 1,018 | 100.0% |
Housing Finances in Raceland
Median Income by Occupancy in Raceland
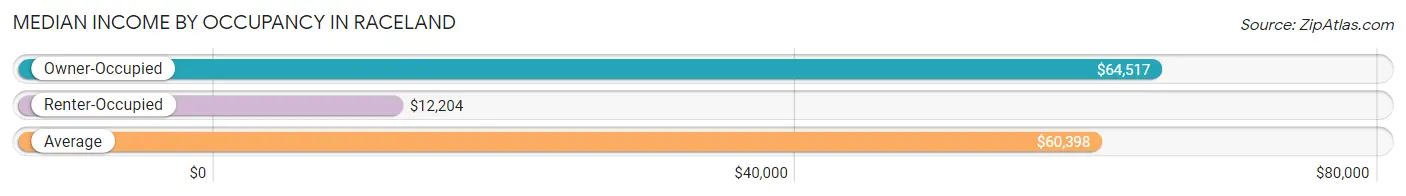
| Occupancy Type | # Households | Median Income |
| Owner-Occupied | 716 (70.3%) | $64,517 |
| Renter-Occupied | 302 (29.7%) | $12,204 |
| Average | 1,018 (100.0%) | $60,398 |
Occupancy by Householder Income Bracket in Raceland
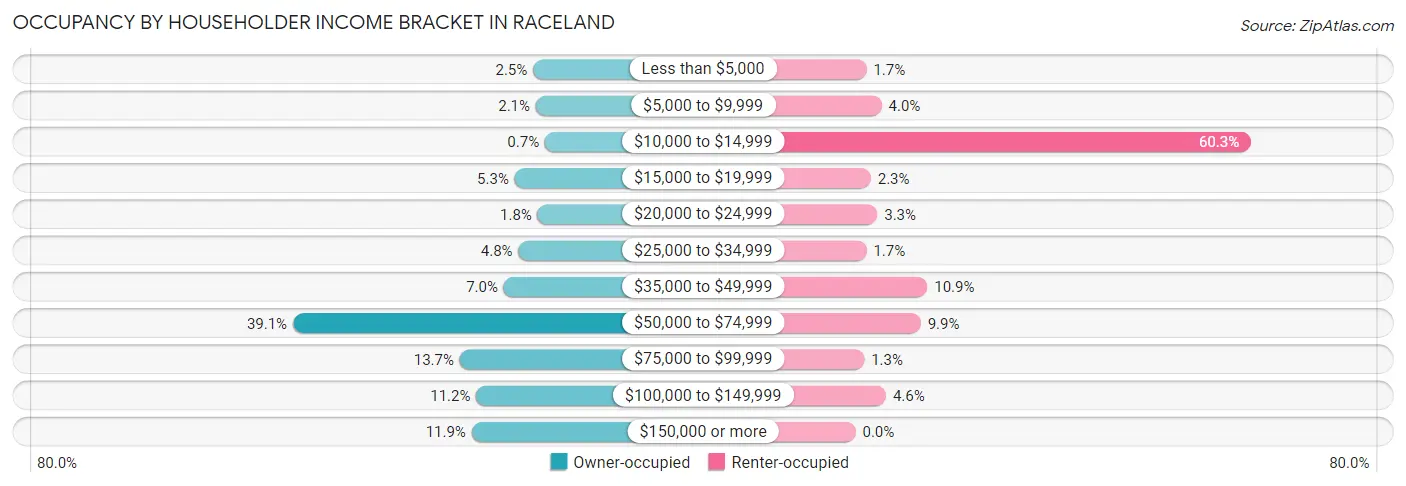
| Income Bracket | Owner-occupied | Renter-occupied |
| Less than $5,000 | 18 (2.5%) | 5 (1.7%) |
| $5,000 to $9,999 | 15 (2.1%) | 12 (4.0%) |
| $10,000 to $14,999 | 5 (0.7%) | 182 (60.3%) |
| $15,000 to $19,999 | 38 (5.3%) | 7 (2.3%) |
| $20,000 to $24,999 | 13 (1.8%) | 10 (3.3%) |
| $25,000 to $34,999 | 34 (4.8%) | 5 (1.7%) |
| $35,000 to $49,999 | 50 (7.0%) | 33 (10.9%) |
| $50,000 to $74,999 | 280 (39.1%) | 30 (9.9%) |
| $75,000 to $99,999 | 98 (13.7%) | 4 (1.3%) |
| $100,000 to $149,999 | 80 (11.2%) | 14 (4.6%) |
| $150,000 or more | 85 (11.9%) | 0 (0.0%) |
| Total | 716 (100.0%) | 302 (100.0%) |
Monthly Housing Cost Tiers in Raceland
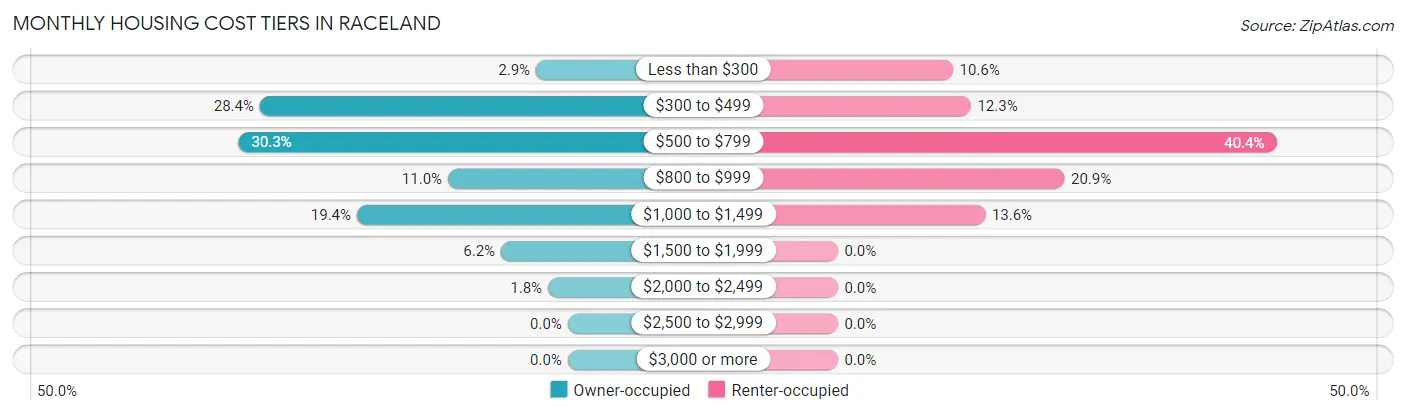
| Monthly Cost | Owner-occupied | Renter-occupied |
| Less than $300 | 21 (2.9%) | 32 (10.6%) |
| $300 to $499 | 203 (28.3%) | 37 (12.2%) |
| $500 to $799 | 217 (30.3%) | 122 (40.4%) |
| $800 to $999 | 79 (11.0%) | 63 (20.9%) |
| $1,000 to $1,499 | 139 (19.4%) | 41 (13.6%) |
| $1,500 to $1,999 | 44 (6.1%) | 0 (0.0%) |
| $2,000 to $2,499 | 13 (1.8%) | 0 (0.0%) |
| $2,500 to $2,999 | 0 (0.0%) | 0 (0.0%) |
| $3,000 or more | 0 (0.0%) | 0 (0.0%) |
| Total | 716 (100.0%) | 302 (100.0%) |
Physical Housing Characteristics in Raceland
Housing Structures in Raceland
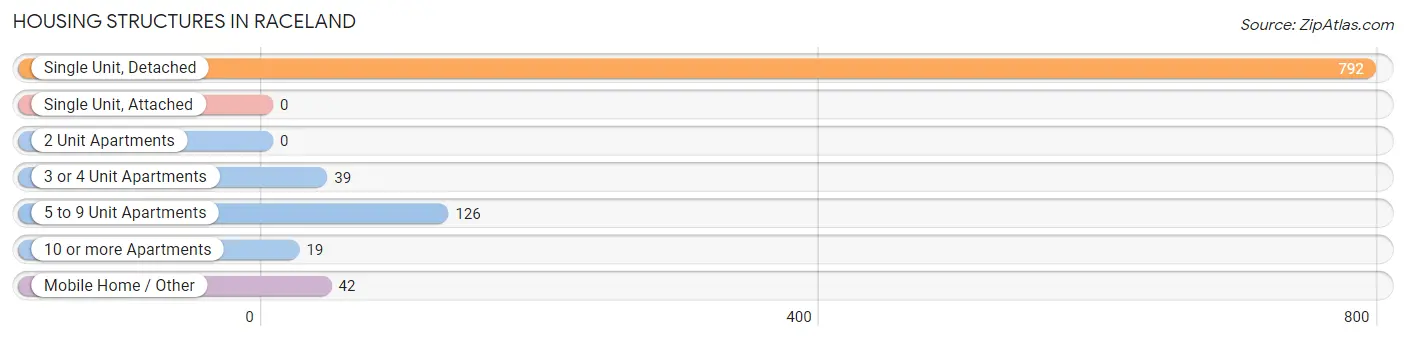
| Structure Type | # Housing Units | % Housing Units |
| Single Unit, Detached | 792 | 77.8% |
| Single Unit, Attached | 0 | 0.0% |
| 2 Unit Apartments | 0 | 0.0% |
| 3 or 4 Unit Apartments | 39 | 3.8% |
| 5 to 9 Unit Apartments | 126 | 12.4% |
| 10 or more Apartments | 19 | 1.9% |
| Mobile Home / Other | 42 | 4.1% |
| Total | 1,018 | 100.0% |
Housing Structures by Occupancy in Raceland
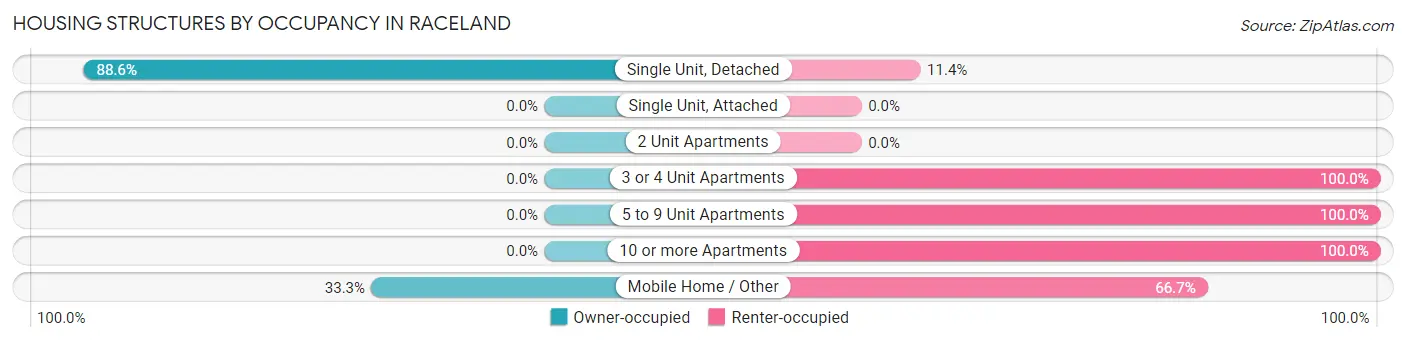
| Structure Type | Owner-occupied | Renter-occupied |
| Single Unit, Detached | 702 (88.6%) | 90 (11.4%) |
| Single Unit, Attached | 0 (0.0%) | 0 (0.0%) |
| 2 Unit Apartments | 0 (0.0%) | 0 (0.0%) |
| 3 or 4 Unit Apartments | 0 (0.0%) | 39 (100.0%) |
| 5 to 9 Unit Apartments | 0 (0.0%) | 126 (100.0%) |
| 10 or more Apartments | 0 (0.0%) | 19 (100.0%) |
| Mobile Home / Other | 14 (33.3%) | 28 (66.7%) |
| Total | 716 (70.3%) | 302 (29.7%) |
Housing Structures by Number of Rooms in Raceland
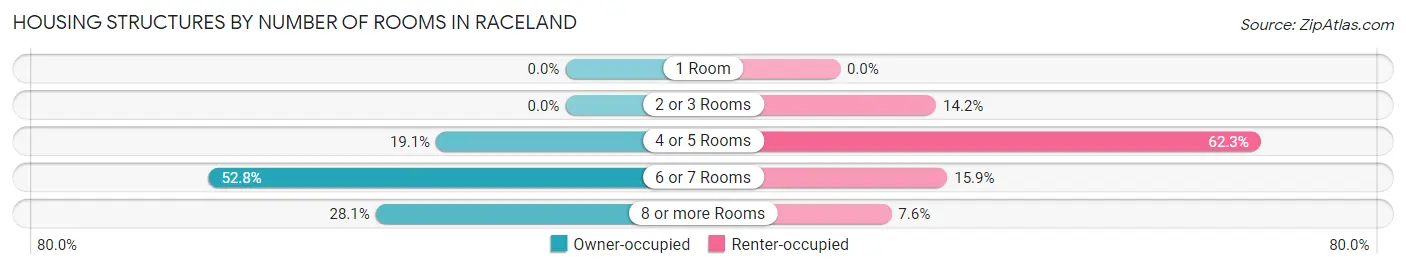
| Number of Rooms | Owner-occupied | Renter-occupied |
| 1 Room | 0 (0.0%) | 0 (0.0%) |
| 2 or 3 Rooms | 0 (0.0%) | 43 (14.2%) |
| 4 or 5 Rooms | 137 (19.1%) | 188 (62.3%) |
| 6 or 7 Rooms | 378 (52.8%) | 48 (15.9%) |
| 8 or more Rooms | 201 (28.1%) | 23 (7.6%) |
| Total | 716 (100.0%) | 302 (100.0%) |
Housing Structure by Heating Type in Raceland
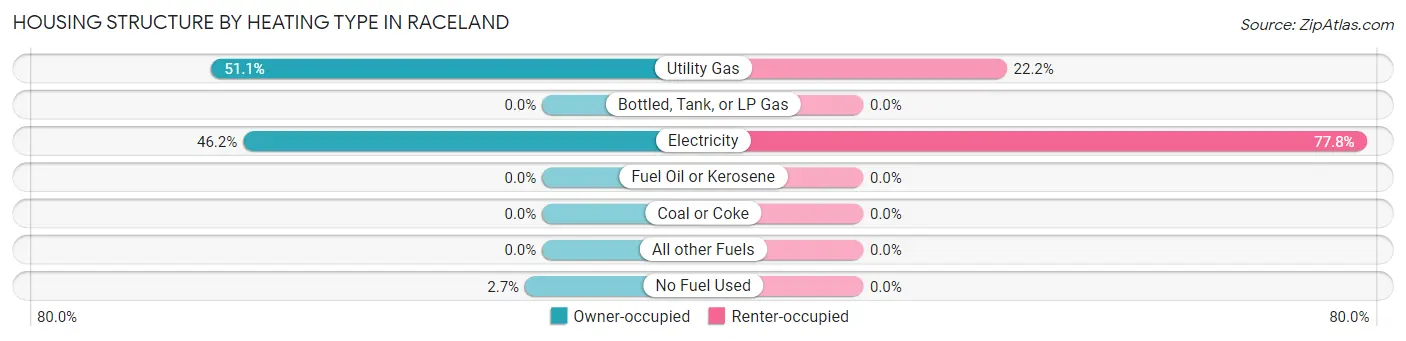
| Heating Type | Owner-occupied | Renter-occupied |
| Utility Gas | 366 (51.1%) | 67 (22.2%) |
| Bottled, Tank, or LP Gas | 0 (0.0%) | 0 (0.0%) |
| Electricity | 331 (46.2%) | 235 (77.8%) |
| Fuel Oil or Kerosene | 0 (0.0%) | 0 (0.0%) |
| Coal or Coke | 0 (0.0%) | 0 (0.0%) |
| All other Fuels | 0 (0.0%) | 0 (0.0%) |
| No Fuel Used | 19 (2.6%) | 0 (0.0%) |
| Total | 716 (100.0%) | 302 (100.0%) |
Household Vehicle Usage in Raceland
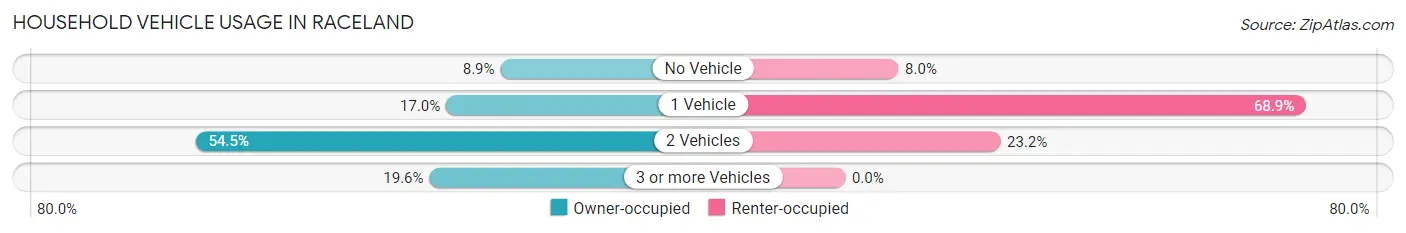
| Vehicles per Household | Owner-occupied | Renter-occupied |
| No Vehicle | 64 (8.9%) | 24 (8.0%) |
| 1 Vehicle | 122 (17.0%) | 208 (68.9%) |
| 2 Vehicles | 390 (54.5%) | 70 (23.2%) |
| 3 or more Vehicles | 140 (19.6%) | 0 (0.0%) |
| Total | 716 (100.0%) | 302 (100.0%) |
Real Estate & Mortgages in Raceland
Real Estate and Mortgage Overview in Raceland
| Characteristic | Without Mortgage | With Mortgage |
| Housing Units | 388 | 328 |
| Median Property Value | $98,900 | $129,200 |
| Median Household Income | $62,773 | $60 |
| Monthly Housing Costs | $460 | $0 |
| Real Estate Taxes | $782 | $5 |
Property Value by Mortgage Status in Raceland
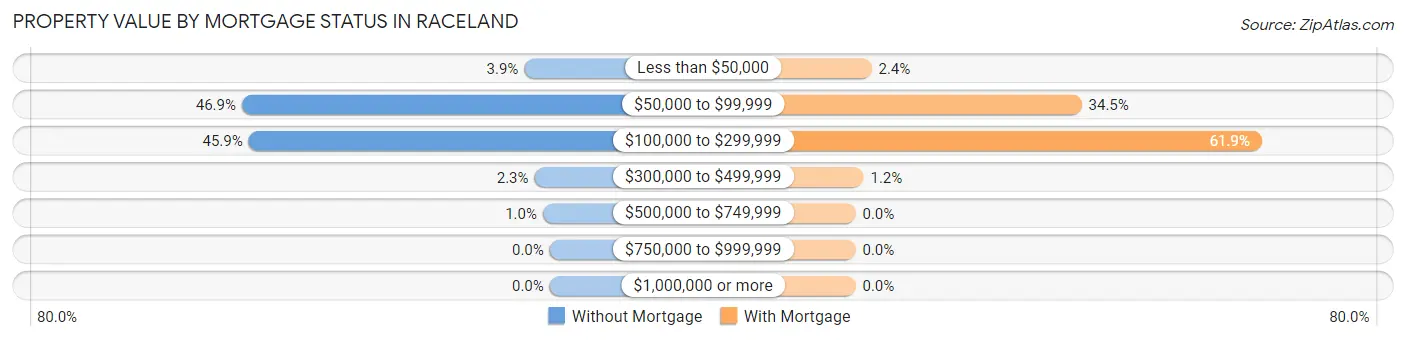
| Property Value | Without Mortgage | With Mortgage |
| Less than $50,000 | 15 (3.9%) | 8 (2.4%) |
| $50,000 to $99,999 | 182 (46.9%) | 113 (34.4%) |
| $100,000 to $299,999 | 178 (45.9%) | 203 (61.9%) |
| $300,000 to $499,999 | 9 (2.3%) | 4 (1.2%) |
| $500,000 to $749,999 | 4 (1.0%) | 0 (0.0%) |
| $750,000 to $999,999 | 0 (0.0%) | 0 (0.0%) |
| $1,000,000 or more | 0 (0.0%) | 0 (0.0%) |
| Total | 388 (100.0%) | 328 (100.0%) |
Household Income by Mortgage Status in Raceland
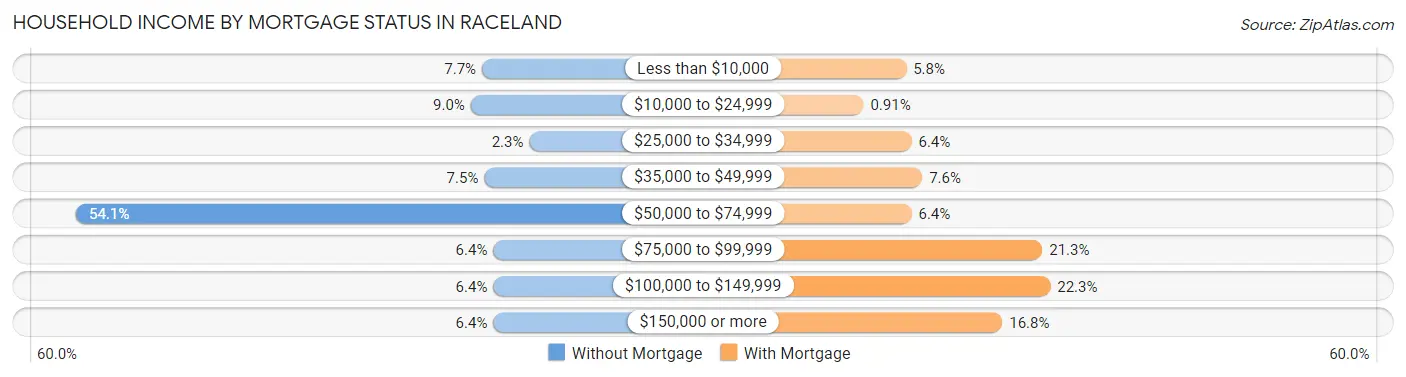
| Household Income | Without Mortgage | With Mortgage |
| Less than $10,000 | 30 (7.7%) | 19 (5.8%) |
| $10,000 to $24,999 | 35 (9.0%) | 3 (0.9%) |
| $25,000 to $34,999 | 9 (2.3%) | 21 (6.4%) |
| $35,000 to $49,999 | 29 (7.5%) | 25 (7.6%) |
| $50,000 to $74,999 | 210 (54.1%) | 21 (6.4%) |
| $75,000 to $99,999 | 25 (6.4%) | 70 (21.3%) |
| $100,000 to $149,999 | 25 (6.4%) | 73 (22.3%) |
| $150,000 or more | 25 (6.4%) | 55 (16.8%) |
| Total | 388 (100.0%) | 328 (100.0%) |
Property Value to Household Income Ratio in Raceland
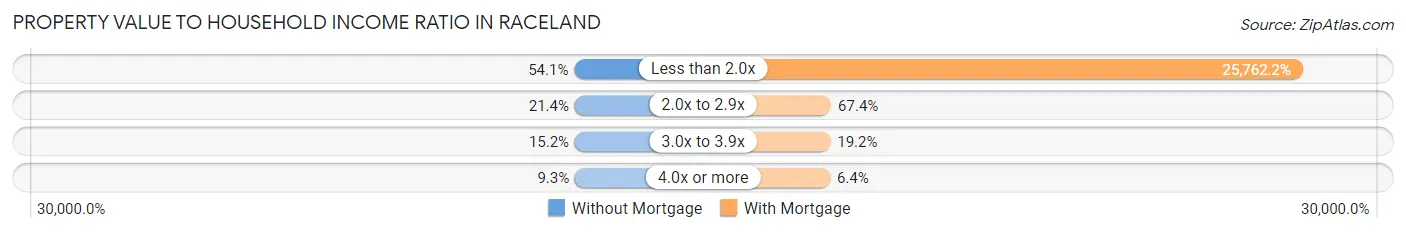
| Value-to-Income Ratio | Without Mortgage | With Mortgage |
| Less than 2.0x | 210 (54.1%) | 84,500 (25,762.2%) |
| 2.0x to 2.9x | 83 (21.4%) | 221 (67.4%) |
| 3.0x to 3.9x | 59 (15.2%) | 63 (19.2%) |
| 4.0x or more | 36 (9.3%) | 21 (6.4%) |
| Total | 388 (100.0%) | 328 (100.0%) |
Real Estate Taxes by Mortgage Status in Raceland
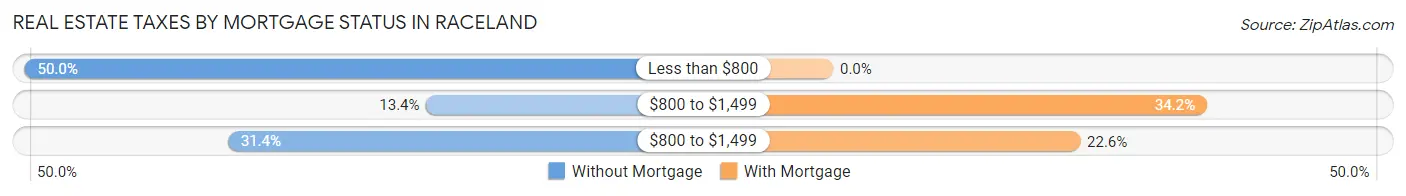
| Property Taxes | Without Mortgage | With Mortgage |
| Less than $800 | 194 (50.0%) | 0 (0.0%) |
| $800 to $1,499 | 52 (13.4%) | 112 (34.2%) |
| $800 to $1,499 | 122 (31.4%) | 74 (22.6%) |
| Total | 388 (100.0%) | 328 (100.0%) |
Health & Disability in Raceland
Health Insurance Coverage by Age in Raceland
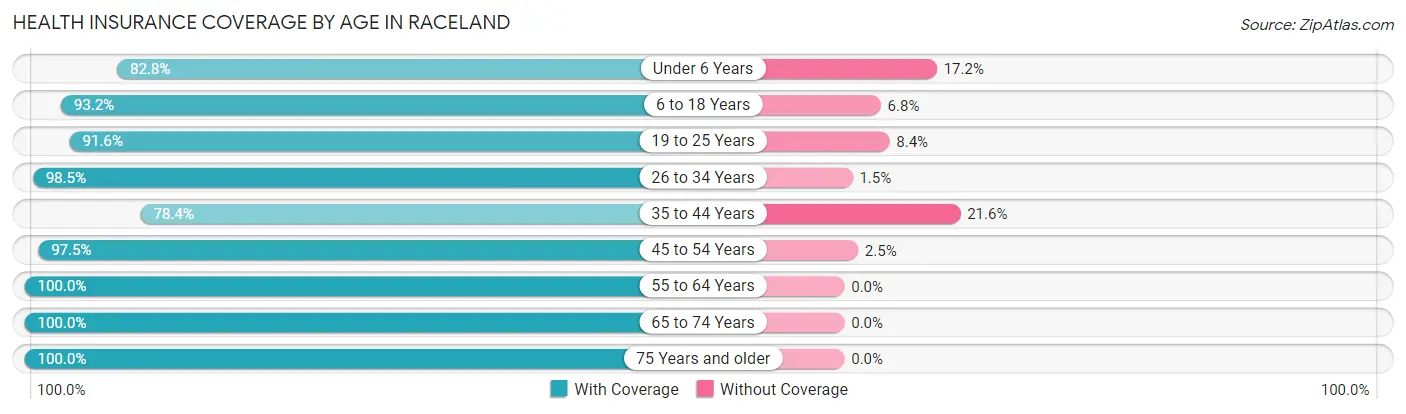
| Age Bracket | With Coverage | Without Coverage |
| Under 6 Years | 96 (82.8%) | 20 (17.2%) |
| 6 to 18 Years | 220 (93.2%) | 16 (6.8%) |
| 19 to 25 Years | 120 (91.6%) | 11 (8.4%) |
| 26 to 34 Years | 195 (98.5%) | 3 (1.5%) |
| 35 to 44 Years | 116 (78.4%) | 32 (21.6%) |
| 45 to 54 Years | 230 (97.5%) | 6 (2.5%) |
| 55 to 64 Years | 380 (100.0%) | 0 (0.0%) |
| 65 to 74 Years | 406 (100.0%) | 0 (0.0%) |
| 75 Years and older | 164 (100.0%) | 0 (0.0%) |
| Total | 1,927 (95.6%) | 88 (4.4%) |
Health Insurance Coverage by Citizenship Status in Raceland
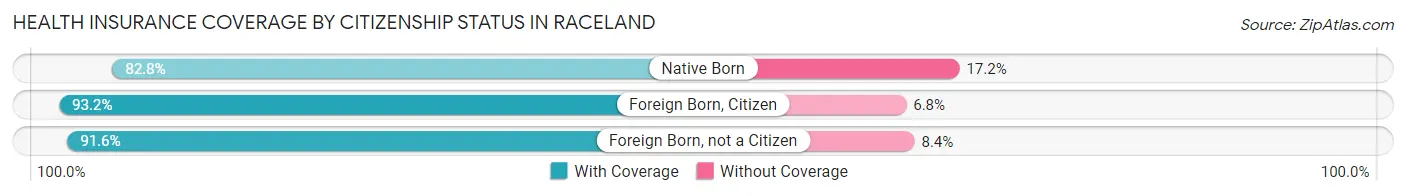
| Citizenship Status | With Coverage | Without Coverage |
| Native Born | 96 (82.8%) | 20 (17.2%) |
| Foreign Born, Citizen | 220 (93.2%) | 16 (6.8%) |
| Foreign Born, not a Citizen | 120 (91.6%) | 11 (8.4%) |
Health Insurance Coverage by Household Income in Raceland
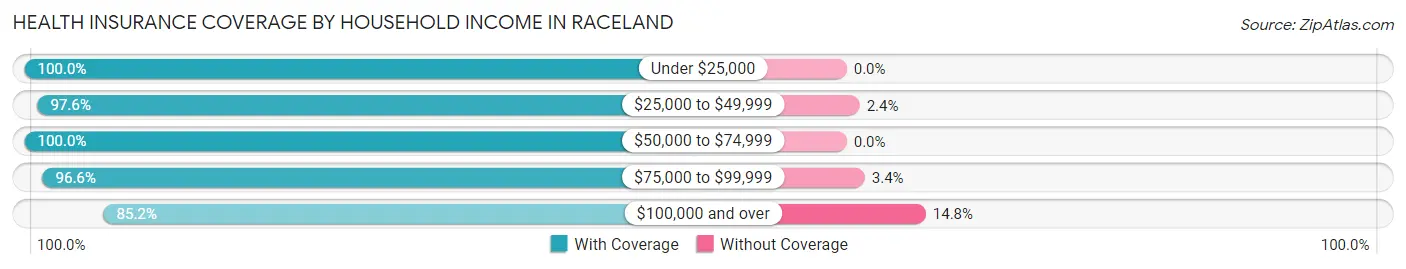
| Household Income | With Coverage | Without Coverage |
| Under $25,000 | 494 (100.0%) | 0 (0.0%) |
| $25,000 to $49,999 | 242 (97.6%) | 6 (2.4%) |
| $50,000 to $74,999 | 491 (100.0%) | 0 (0.0%) |
| $75,000 to $99,999 | 286 (96.6%) | 10 (3.4%) |
| $100,000 and over | 414 (85.2%) | 72 (14.8%) |
Public vs Private Health Insurance Coverage by Age in Raceland
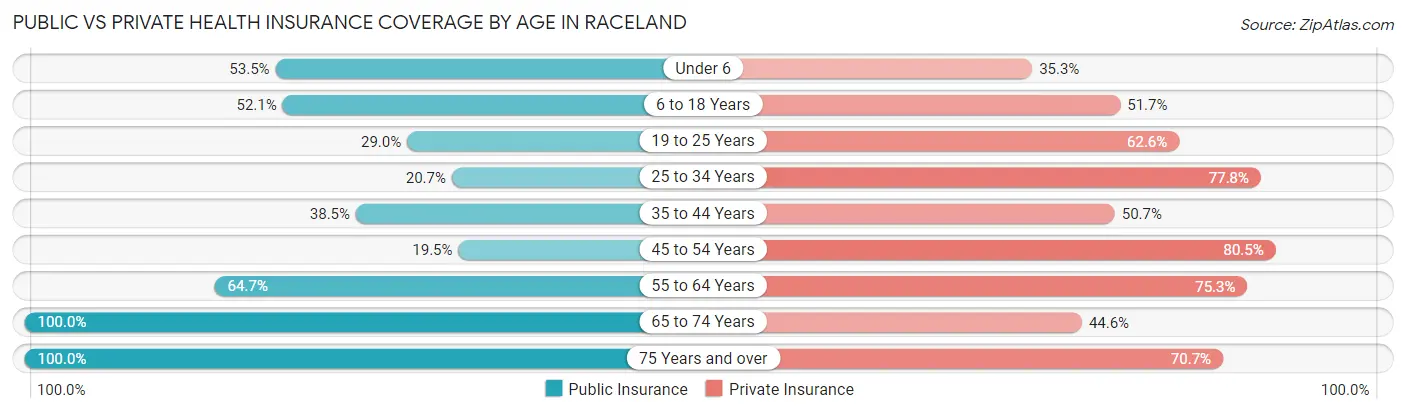
| Age Bracket | Public Insurance | Private Insurance |
| Under 6 | 62 (53.4%) | 41 (35.3%) |
| 6 to 18 Years | 123 (52.1%) | 122 (51.7%) |
| 19 to 25 Years | 38 (29.0%) | 82 (62.6%) |
| 25 to 34 Years | 41 (20.7%) | 154 (77.8%) |
| 35 to 44 Years | 57 (38.5%) | 75 (50.7%) |
| 45 to 54 Years | 46 (19.5%) | 190 (80.5%) |
| 55 to 64 Years | 246 (64.7%) | 286 (75.3%) |
| 65 to 74 Years | 406 (100.0%) | 181 (44.6%) |
| 75 Years and over | 164 (100.0%) | 116 (70.7%) |
| Total | 1,183 (58.7%) | 1,247 (61.9%) |
Disability Status by Sex by Age in Raceland
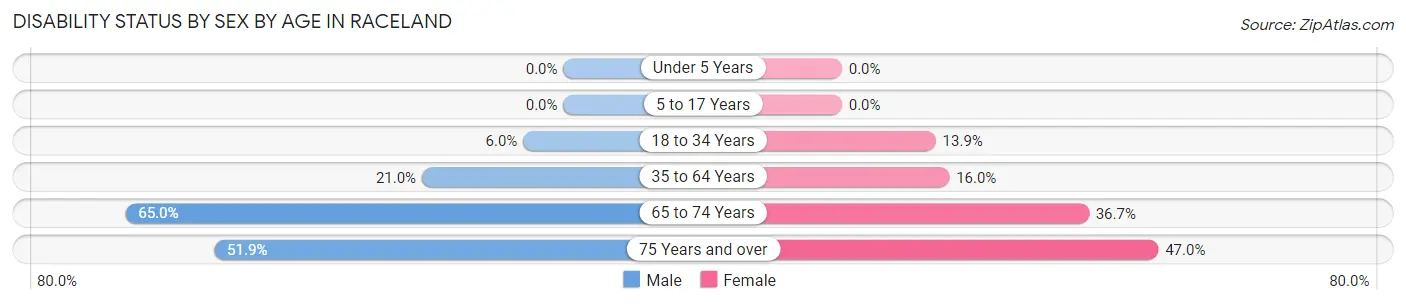
| Age Bracket | Male | Female |
| Under 5 Years | 0 (0.0%) | 0 (0.0%) |
| 5 to 17 Years | 0 (0.0%) | 0 (0.0%) |
| 18 to 34 Years | 8 (6.0%) | 29 (13.9%) |
| 35 to 64 Years | 63 (21.0%) | 74 (16.0%) |
| 65 to 74 Years | 147 (65.0%) | 66 (36.7%) |
| 75 Years and over | 42 (51.8%) | 39 (47.0%) |
Disability Class by Sex by Age in Raceland
Disability Class: Hearing Difficulty
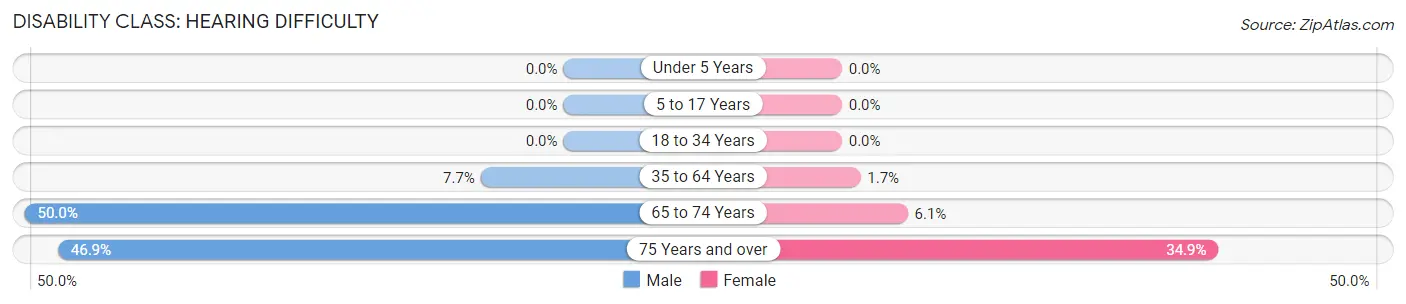
| Age Bracket | Male | Female |
| Under 5 Years | 0 (0.0%) | 0 (0.0%) |
| 5 to 17 Years | 0 (0.0%) | 0 (0.0%) |
| 18 to 34 Years | 0 (0.0%) | 0 (0.0%) |
| 35 to 64 Years | 23 (7.7%) | 8 (1.7%) |
| 65 to 74 Years | 113 (50.0%) | 11 (6.1%) |
| 75 Years and over | 38 (46.9%) | 29 (34.9%) |
Disability Class: Vision Difficulty
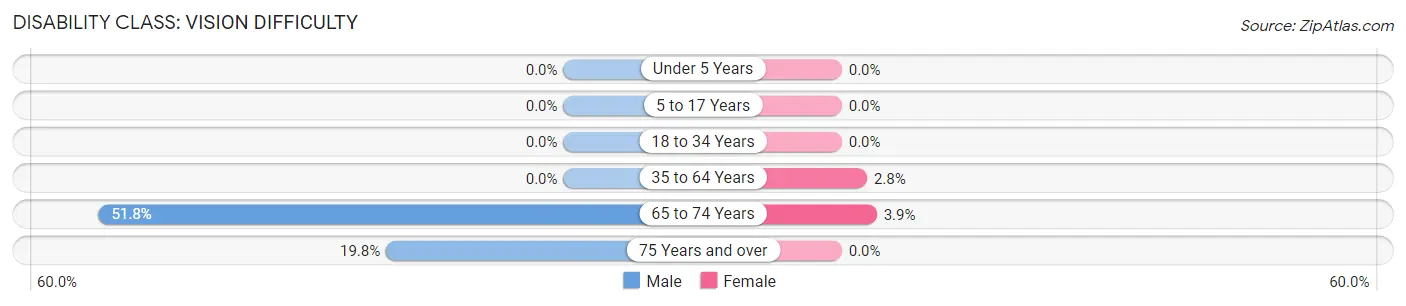
| Age Bracket | Male | Female |
| Under 5 Years | 0 (0.0%) | 0 (0.0%) |
| 5 to 17 Years | 0 (0.0%) | 0 (0.0%) |
| 18 to 34 Years | 0 (0.0%) | 0 (0.0%) |
| 35 to 64 Years | 0 (0.0%) | 13 (2.8%) |
| 65 to 74 Years | 117 (51.8%) | 7 (3.9%) |
| 75 Years and over | 16 (19.8%) | 0 (0.0%) |
Disability Class: Cognitive Difficulty
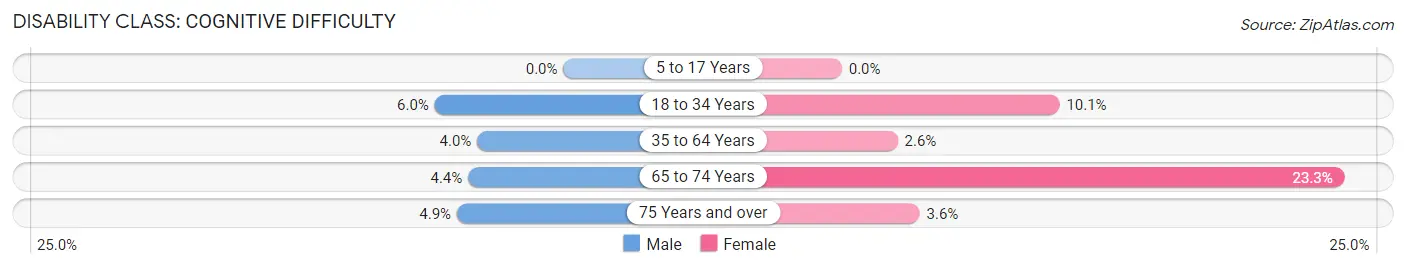
| Age Bracket | Male | Female |
| 5 to 17 Years | 0 (0.0%) | 0 (0.0%) |
| 18 to 34 Years | 8 (6.0%) | 21 (10.1%) |
| 35 to 64 Years | 12 (4.0%) | 12 (2.6%) |
| 65 to 74 Years | 10 (4.4%) | 42 (23.3%) |
| 75 Years and over | 4 (4.9%) | 3 (3.6%) |
Disability Class: Ambulatory Difficulty
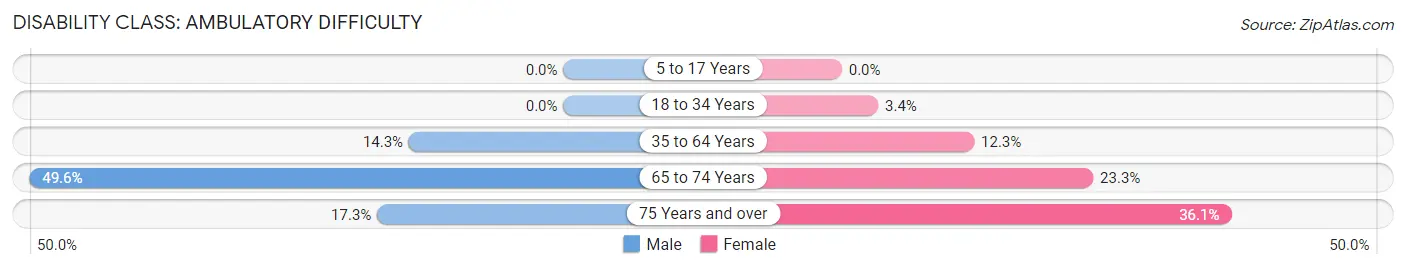
| Age Bracket | Male | Female |
| 5 to 17 Years | 0 (0.0%) | 0 (0.0%) |
| 18 to 34 Years | 0 (0.0%) | 7 (3.4%) |
| 35 to 64 Years | 43 (14.3%) | 57 (12.3%) |
| 65 to 74 Years | 112 (49.6%) | 42 (23.3%) |
| 75 Years and over | 14 (17.3%) | 30 (36.1%) |
Disability Class: Self-Care Difficulty
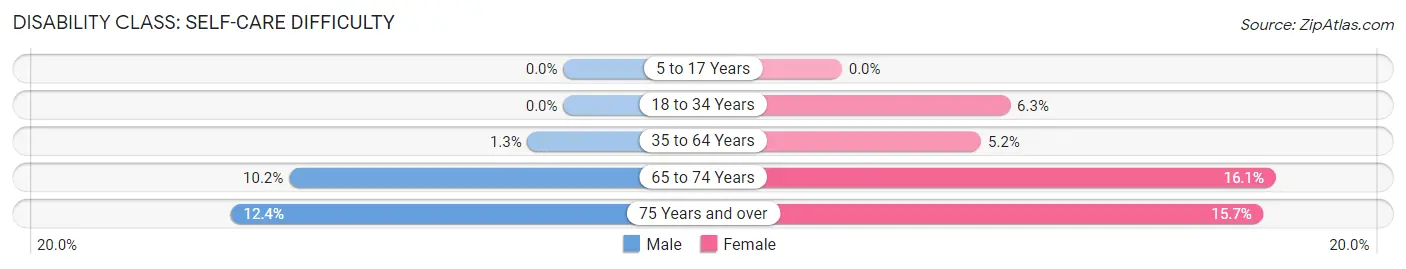
| Age Bracket | Male | Female |
| 5 to 17 Years | 0 (0.0%) | 0 (0.0%) |
| 18 to 34 Years | 0 (0.0%) | 13 (6.2%) |
| 35 to 64 Years | 4 (1.3%) | 24 (5.2%) |
| 65 to 74 Years | 23 (10.2%) | 29 (16.1%) |
| 75 Years and over | 10 (12.3%) | 13 (15.7%) |
Technology Access in Raceland
Computing Device Access in Raceland
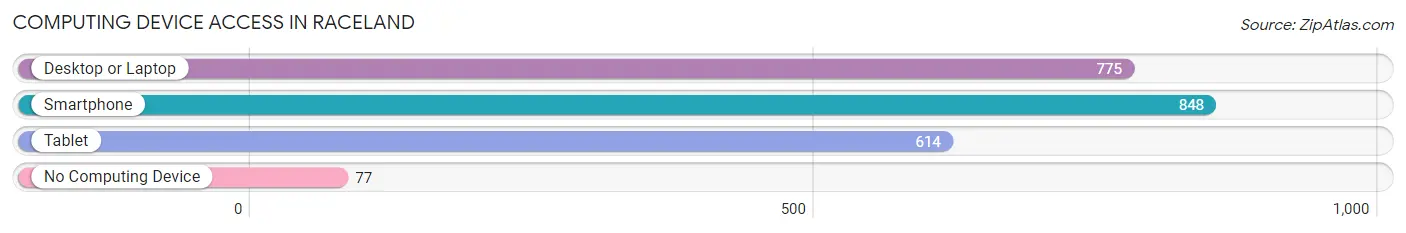
| Device Type | # Households | % Households |
| Desktop or Laptop | 775 | 76.1% |
| Smartphone | 848 | 83.3% |
| Tablet | 614 | 60.3% |
| No Computing Device | 77 | 7.6% |
| Total | 1,018 | 100.0% |
Internet Access in Raceland
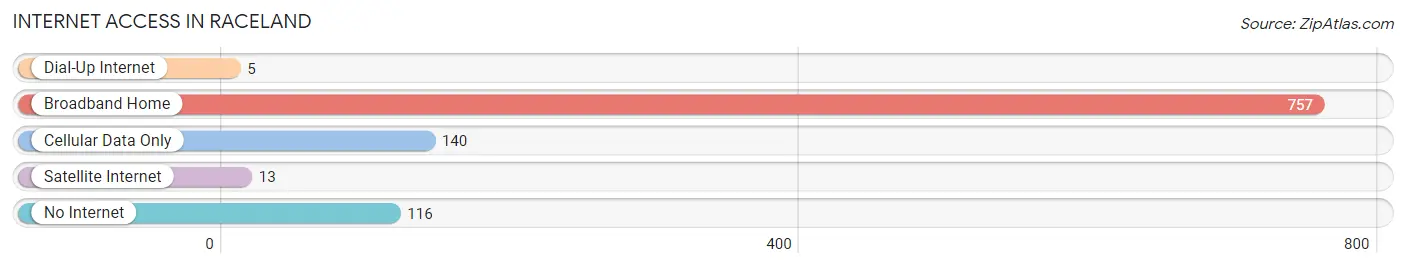
| Internet Type | # Households | % Households |
| Dial-Up Internet | 5 | 0.5% |
| Broadband Home | 757 | 74.4% |
| Cellular Data Only | 140 | 13.8% |
| Satellite Internet | 13 | 1.3% |
| No Internet | 116 | 11.4% |
| Total | 1,018 | 100.0% |
Raceland Summary
Raceland, Kentucky is a small city located in Greenup County, Kentucky. It is situated on the banks of the Ohio River, and is part of the Huntington-Ashland metropolitan area. The city has a population of approximately 2,500 people, and is the county seat of Greenup County.
History
Raceland was founded in 1820 by a group of settlers from Virginia. The town was named after the racetrack that was located nearby. The racetrack was used for horse racing, and was a popular destination for many of the settlers. The town was incorporated in 1837, and the first post office was established in 1845.
In the late 19th century, Raceland was a major center for the coal mining industry. The town was home to several coal mines, and the coal industry provided many jobs for the local residents. The coal industry declined in the early 20th century, and the town began to focus more on agriculture and tourism.
Geography
Raceland is located in the eastern part of Greenup County, Kentucky. It is situated on the banks of the Ohio River, and is part of the Huntington-Ashland metropolitan area. The city has a total area of 1.3 square miles, all of which is land. The terrain is mostly flat, with some rolling hills in the surrounding area.
The climate in Raceland is humid subtropical, with hot and humid summers and mild winters. The average annual temperature is around 57 degrees Fahrenheit, and the average annual precipitation is around 44 inches.
Economy
The economy of Raceland is largely based on agriculture and tourism. The town is home to several farms, and the surrounding area is known for its production of corn, soybeans, and hay. The town is also a popular destination for tourists, and there are several attractions in the area, including the Raceland Racetrack, the Raceland Historical Museum, and the Raceland Country Club.
In addition to agriculture and tourism, Raceland is also home to several small businesses, including restaurants, retail stores, and service providers. The town is also home to a few manufacturing companies, including a furniture factory and a plastics factory.
Demographics
As of the 2010 census, the population of Raceland was 2,500. The racial makeup of the city was 97.2% White, 0.8% African American, 0.4% Native American, 0.2% Asian, and 1.4% from other races. The median household income was $31,250, and the median family income was $37,500.
Raceland is a small city with a rich history and a diverse economy. The town is home to several farms, and is a popular destination for tourists. The town is also home to several small businesses, and is a great place to live and work.
Common Questions
What is Per Capita Income in Raceland?
Per Capita income in Raceland is $35,365.
What is the Median Family Income in Raceland?
Median Family Income in Raceland is $62,500.
What is the Median Household income in Raceland?
Median Household Income in Raceland is $60,398.
What is Income or Wage Gap in Raceland?
Income or Wage Gap in Raceland is 17.6%.
Women in Raceland earn 82.4 cents for every dollar earned by a man.
What is Inequality or Gini Index in Raceland?
Inequality or Gini Index in Raceland is 0.49.
What is the Total Population of Raceland?
Total Population of Raceland is 2,015.
What is the Total Male Population of Raceland?
Total Male Population of Raceland is 876.
What is the Total Female Population of Raceland?
Total Female Population of Raceland is 1,139.
What is the Ratio of Males per 100 Females in Raceland?
There are 76.91 Males per 100 Females in Raceland.
What is the Ratio of Females per 100 Males in Raceland?
There are 130.02 Females per 100 Males in Raceland.
What is the Median Population Age in Raceland?
Median Population Age in Raceland is 54.0 Years.
What is the Average Family Size in Raceland
Average Family Size in Raceland is 2.7 People.
What is the Average Household Size in Raceland
Average Household Size in Raceland is 2.0 People.
How Large is the Labor Force in Raceland?
There are 740 People in the Labor Forcein in Raceland.
What is the Percentage of People in the Labor Force in Raceland?
43.3% of People are in the Labor Force in Raceland.
What is the Unemployment Rate in Raceland?
Unemployment Rate in Raceland is 7.2%.