Zip Codes with the Highest Percentage of Population Employed in Food Preparation & Serving in Kentucky
RELATED REPORTS & OPTIONS
Food Preparation & Serving
Kentucky
Compare Zip Codes
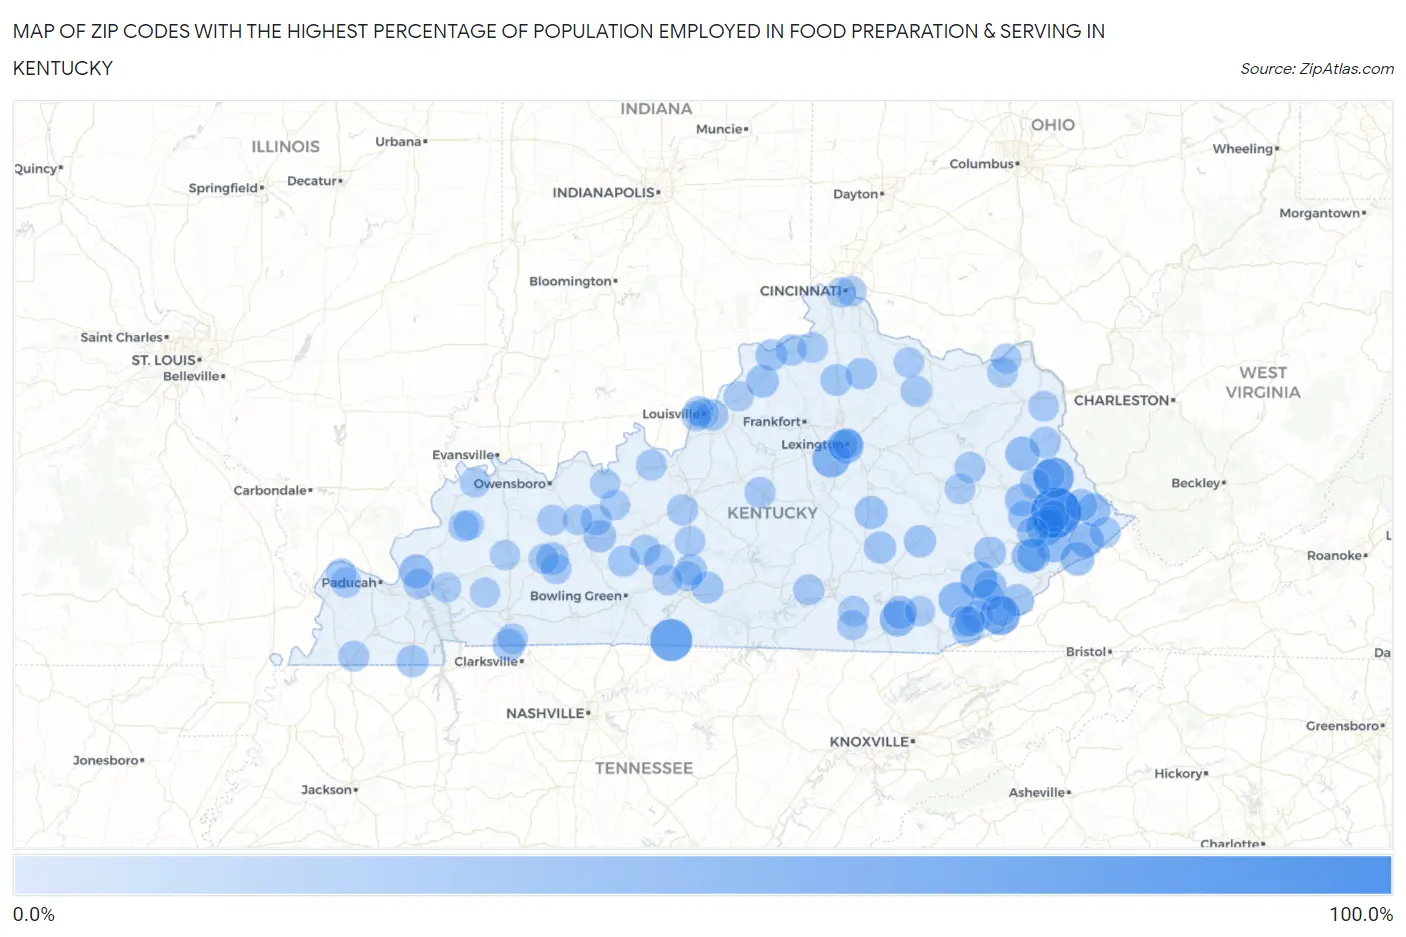
Map of Zip Codes with the Highest Percentage of Population Employed in Food Preparation & Serving in Kentucky
0.0%
100.0%
Zip Codes with the Highest Percentage of Population Employed in Food Preparation & Serving in Kentucky
| Zip Code | % Employed | vs State | vs National | |
| 1. | 41663 | 82.9% | 5.1%(+77.8)#1 | 5.3%(+77.6)#17 |
| 2. | 42153 | 53.5% | 5.1%(+48.4)#2 | 5.3%(+48.2)#44 |
| 3. | 41204 | 45.9% | 5.1%(+40.8)#3 | 5.3%(+40.6)#71 |
| 4. | 40847 | 45.2% | 5.1%(+40.1)#4 | 5.3%(+39.9)#74 |
| 5. | 40339 | 35.9% | 5.1%(+30.8)#5 | 5.3%(+30.6)#141 |
| 6. | 41775 | 32.9% | 5.1%(+27.8)#6 | 5.3%(+27.6)#174 |
| 7. | 41651 | 32.4% | 5.1%(+27.3)#7 | 5.3%(+27.1)#181 |
| 8. | 40913 | 28.3% | 5.1%(+23.2)#8 | 5.3%(+23.0)#242 |
| 9. | 40759 | 28.2% | 5.1%(+23.1)#9 | 5.3%(+22.9)#244 |
| 10. | 41650 | 25.7% | 5.1%(+20.7)#10 | 5.3%(+20.5)#294 |
| 11. | 40526 | 25.7% | 5.1%(+20.6)#11 | 5.3%(+20.4)#296 |
| 12. | 41559 | 25.0% | 5.1%(+19.9)#12 | 5.3%(+19.7)#314 |
| 13. | 41226 | 23.7% | 5.1%(+18.6)#13 | 5.3%(+18.4)#356 |
| 14. | 41836 | 23.3% | 5.1%(+18.2)#14 | 5.3%(+18.0)#376 |
| 15. | 41512 | 22.6% | 5.1%(+17.5)#15 | 5.3%(+17.3)#399 |
| 16. | 42083 | 21.8% | 5.1%(+16.7)#16 | 5.3%(+16.5)#429 |
| 17. | 41519 | 20.2% | 5.1%(+15.1)#17 | 5.3%(+14.9)#496 |
| 18. | 41843 | 19.8% | 5.1%(+14.8)#18 | 5.3%(+14.6)#516 |
| 19. | 40771 | 19.6% | 5.1%(+14.5)#19 | 5.3%(+14.3)#529 |
| 20. | 40404 | 19.3% | 5.1%(+14.2)#20 | 5.3%(+14.0)#548 |
| 21. | 41464 | 18.3% | 5.1%(+13.2)#21 | 5.3%(+13.0)#630 |
| 22. | 40070 | 18.1% | 5.1%(+13.0)#22 | 5.3%(+12.8)#647 |
| 23. | 41777 | 17.2% | 5.1%(+12.1)#23 | 5.3%(+11.9)#726 |
| 24. | 42349 | 17.1% | 5.1%(+12.0)#24 | 5.3%(+11.8)#741 |
| 25. | 42332 | 17.0% | 5.1%(+11.9)#25 | 5.3%(+11.7)#753 |
| 26. | 41655 | 16.5% | 5.1%(+11.5)#26 | 5.3%(+11.3)#794 |
| 27. | 40445 | 16.5% | 5.1%(+11.4)#27 | 5.3%(+11.2)#800 |
| 28. | 41615 | 16.4% | 5.1%(+11.3)#28 | 5.3%(+11.1)#808 |
| 29. | 40486 | 16.1% | 5.1%(+11.0)#29 | 5.3%(+10.8)#846 |
| 30. | 41719 | 16.1% | 5.1%(+11.0)#30 | 5.3%(+10.8)#850 |
| 31. | 42223 | 16.1% | 5.1%(+11.0)#31 | 5.3%(+10.8)#853 |
| 32. | 42049 | 16.0% | 5.1%(+10.9)#32 | 5.3%(+10.7)#867 |
| 33. | 40808 | 15.4% | 5.1%(+10.3)#33 | 5.3%(+10.1)#935 |
| 34. | 41571 | 15.2% | 5.1%(+10.1)#34 | 5.3%(+9.87)#963 |
| 35. | 40854 | 14.5% | 5.1%(+9.44)#35 | 5.3%(+9.24)#1,055 |
| 36. | 42154 | 14.4% | 5.1%(+9.35)#36 | 5.3%(+9.15)#1,074 |
| 37. | 41010 | 14.4% | 5.1%(+9.31)#37 | 5.3%(+9.10)#1,081 |
| 38. | 40823 | 14.4% | 5.1%(+9.27)#38 | 5.3%(+9.07)#1,086 |
| 39. | 40819 | 14.1% | 5.1%(+8.99)#39 | 5.3%(+8.79)#1,147 |
| 40. | 41008 | 14.1% | 5.1%(+8.98)#40 | 5.3%(+8.78)#1,149 |
| 41. | 41003 | 13.8% | 5.1%(+8.75)#41 | 5.3%(+8.55)#1,196 |
| 42. | 41201 | 13.6% | 5.1%(+8.55)#42 | 5.3%(+8.35)#1,245 |
| 43. | 42749 | 13.6% | 5.1%(+8.47)#43 | 5.3%(+8.27)#1,260 |
| 44. | 40280 | 13.3% | 5.1%(+8.21)#44 | 5.3%(+8.01)#1,321 |
| 45. | 41271 | 13.1% | 5.1%(+8.01)#45 | 5.3%(+7.81)#1,370 |
| 46. | 42275 | 12.8% | 5.1%(+7.76)#46 | 5.3%(+7.56)#1,431 |
| 47. | 41632 | 12.7% | 5.1%(+7.64)#47 | 5.3%(+7.44)#1,460 |
| 48. | 41839 | 12.6% | 5.1%(+7.53)#48 | 5.3%(+7.33)#1,488 |
| 49. | 41083 | 12.3% | 5.1%(+7.25)#49 | 5.3%(+7.05)#1,559 |
| 50. | 40863 | 12.3% | 5.1%(+7.23)#50 | 5.3%(+7.03)#1,563 |
| 51. | 41039 | 12.3% | 5.1%(+7.18)#51 | 5.3%(+6.98)#1,578 |
| 52. | 41524 | 12.2% | 5.1%(+7.11)#52 | 5.3%(+6.91)#1,597 |
| 53. | 42361 | 12.2% | 5.1%(+7.07)#53 | 5.3%(+6.87)#1,611 |
| 54. | 42740 | 12.0% | 5.1%(+6.89)#54 | 5.3%(+6.69)#1,675 |
| 55. | 40061 | 11.8% | 5.1%(+6.68)#55 | 5.3%(+6.48)#1,753 |
| 56. | 41425 | 11.5% | 5.1%(+6.45)#56 | 5.3%(+6.25)#1,832 |
| 57. | 42544 | 11.4% | 5.1%(+6.29)#57 | 5.3%(+6.09)#1,886 |
| 58. | 40142 | 11.1% | 5.1%(+6.01)#58 | 5.3%(+5.81)#2,016 |
| 59. | 42207 | 11.0% | 5.1%(+5.88)#59 | 5.3%(+5.68)#2,070 |
| 60. | 42463 | 10.9% | 5.1%(+5.82)#60 | 5.3%(+5.62)#2,100 |
| 61. | 42041 | 10.9% | 5.1%(+5.82)#61 | 5.3%(+5.62)#2,103 |
| 62. | 41301 | 10.8% | 5.1%(+5.69)#62 | 5.3%(+5.49)#2,166 |
| 63. | 42634 | 10.7% | 5.1%(+5.64)#63 | 5.3%(+5.44)#2,188 |
| 64. | 41046 | 10.7% | 5.1%(+5.58)#64 | 5.3%(+5.38)#2,225 |
| 65. | 42321 | 10.6% | 5.1%(+5.48)#65 | 5.3%(+5.28)#2,294 |
| 66. | 42262 | 10.4% | 5.1%(+5.35)#66 | 5.3%(+5.15)#2,355 |
| 67. | 41168 | 10.2% | 5.1%(+5.15)#67 | 5.3%(+4.95)#2,461 |
| 68. | 42713 | 10.2% | 5.1%(+5.14)#68 | 5.3%(+4.93)#2,471 |
| 69. | 42053 | 10.2% | 5.1%(+5.10)#69 | 5.3%(+4.90)#2,492 |
| 70. | 42045 | 10.1% | 5.1%(+5.04)#70 | 5.3%(+4.84)#2,539 |
| 71. | 41074 | 10.1% | 5.1%(+5.03)#71 | 5.3%(+4.83)#2,547 |
| 72. | 40873 | 10.0% | 5.1%(+4.92)#72 | 5.3%(+4.71)#2,627 |
| 73. | 42259 | 9.9% | 5.1%(+4.78)#73 | 5.3%(+4.58)#2,740 |
| 74. | 41141 | 9.9% | 5.1%(+4.77)#74 | 5.3%(+4.57)#2,750 |
| 75. | 42653 | 9.8% | 5.1%(+4.76)#75 | 5.3%(+4.55)#2,759 |
| 76. | 41166 | 9.8% | 5.1%(+4.74)#76 | 5.3%(+4.54)#2,776 |
| 77. | 42352 | 9.8% | 5.1%(+4.71)#77 | 5.3%(+4.51)#2,804 |
| 78. | 41044 | 9.6% | 5.1%(+4.55)#78 | 5.3%(+4.35)#2,942 |
| 79. | 42022 | 9.6% | 5.1%(+4.50)#79 | 5.3%(+4.30)#2,988 |
| 80. | 42127 | 9.4% | 5.1%(+4.27)#80 | 5.3%(+4.07)#3,178 |
| 81. | 42160 | 9.3% | 5.1%(+4.26)#81 | 5.3%(+4.05)#3,200 |
| 82. | 40504 | 9.3% | 5.1%(+4.18)#82 | 5.3%(+3.98)#3,263 |
| 83. | 42038 | 9.3% | 5.1%(+4.17)#83 | 5.3%(+3.97)#3,278 |
| 84. | 40507 | 9.1% | 5.1%(+4.06)#84 | 5.3%(+3.86)#3,376 |
| 85. | 40202 | 9.1% | 5.1%(+4.05)#85 | 5.3%(+3.85)#3,377 |
| 86. | 42367 | 9.1% | 5.1%(+4.01)#86 | 5.3%(+3.80)#3,425 |
| 87. | 40119 | 9.1% | 5.1%(+3.99)#87 | 5.3%(+3.79)#3,446 |
| 88. | 40828 | 9.1% | 5.1%(+3.98)#88 | 5.3%(+3.78)#3,456 |
| 89. | 40212 | 9.1% | 5.1%(+3.97)#89 | 5.3%(+3.77)#3,468 |
| 90. | 42404 | 9.0% | 5.1%(+3.91)#90 | 5.3%(+3.71)#3,532 |
| 91. | 40211 | 8.9% | 5.1%(+3.84)#91 | 5.3%(+3.64)#3,592 |
| 92. | 42410 | 8.9% | 5.1%(+3.80)#92 | 5.3%(+3.60)#3,630 |
| 93. | 40010 | 8.8% | 5.1%(+3.74)#93 | 5.3%(+3.54)#3,699 |
| 94. | 42215 | 8.8% | 5.1%(+3.68)#94 | 5.3%(+3.48)#3,760 |
| 95. | 40906 | 8.7% | 5.1%(+3.64)#95 | 5.3%(+3.44)#3,815 |
| 96. | 41016 | 8.7% | 5.1%(+3.61)#96 | 5.3%(+3.40)#3,865 |
| 97. | 40111 | 8.7% | 5.1%(+3.58)#97 | 5.3%(+3.38)#3,903 |
| 98. | 42347 | 8.6% | 5.1%(+3.55)#98 | 5.3%(+3.34)#3,926 |
| 99. | 41222 | 8.6% | 5.1%(+3.54)#99 | 5.3%(+3.34)#3,932 |
| 100. | 42406 | 8.6% | 5.1%(+3.51)#100 | 5.3%(+3.31)#3,977 |
Common Questions
What are the Top 10 Zip Codes with the Highest Percentage of Population Employed in Food Preparation & Serving in Kentucky?
Top 10 Zip Codes with the Highest Percentage of Population Employed in Food Preparation & Serving in Kentucky are:
What zip code has the Highest Percentage of Population Employed in Food Preparation & Serving in Kentucky?
41663 has the Highest Percentage of Population Employed in Food Preparation & Serving in Kentucky with 82.9%.
What is the Percentage of Population Employed in Food Preparation & Serving in the State of Kentucky?
Percentage of Population Employed in Food Preparation & Serving in Kentucky is 5.1%.
What is the Percentage of Population Employed in Food Preparation & Serving in the United States?
Percentage of Population Employed in Food Preparation & Serving in the United States is 5.3%.