Farley, KY Map & Demographics
Farley Map
Farley Overview
$21,514
PER CAPITA INCOME
$53,750
AVG FAMILY INCOME
$45,257
AVG HOUSEHOLD INCOME
37.1%
WAGE / INCOME GAP [ % ]
62.9¢/ $1
WAGE / INCOME GAP [ $ ]
$11,056
FAMILY INCOME DEFICIT
0.38
INEQUALITY / GINI INDEX
4,559
TOTAL POPULATION
2,224
MALE POPULATION
2,335
FEMALE POPULATION
95.25
MALES / 100 FEMALES
104.99
FEMALES / 100 MALES
37.5
MEDIAN AGE
3.3
AVG FAMILY SIZE
2.9
AVG HOUSEHOLD SIZE
1,829
LABOR FORCE [ PEOPLE ]
51.9%
PERCENT IN LABOR FORCE
3.9%
UNEMPLOYMENT RATE
Income in Farley
Income Overview in Farley
Per Capita Income in Farley is $21,514, while median incomes of families and households are $53,750 and $45,257 respectively.
| Characteristic | Number | Measure |
| Per Capita Income | 4,559 | $21,514 |
| Median Family Income | 1,079 | $53,750 |
| Mean Family Income | 1,079 | $59,756 |
| Median Household Income | 1,593 | $45,257 |
| Mean Household Income | 1,593 | $56,462 |
| Income Deficit | 1,079 | $11,056 |
| Wage / Income Gap (%) | 4,559 | 37.07% |
| Wage / Income Gap ($) | 4,559 | 62.93¢ per $1 |
| Gini / Inequality Index | 4,559 | 0.38 |
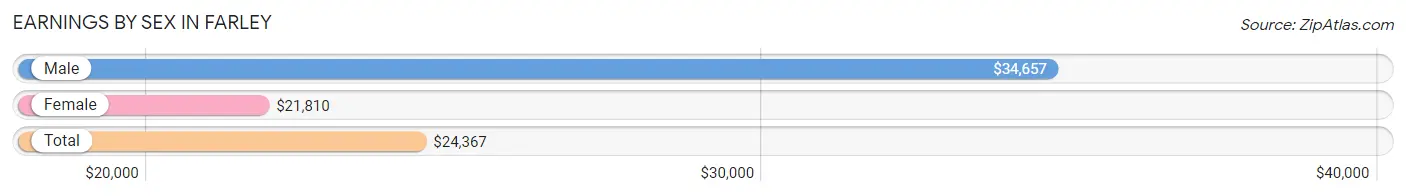
Earnings by Sex in Farley
Average Earnings in Farley are $24,367, $34,657 for men and $21,810 for women, a difference of 37.1%.
| Sex | Number | Average Earnings |
| Male | 1,054 (53.6%) | $34,657 |
| Female | 914 (46.4%) | $21,810 |
| Total | 1,968 (100.0%) | $24,367 |
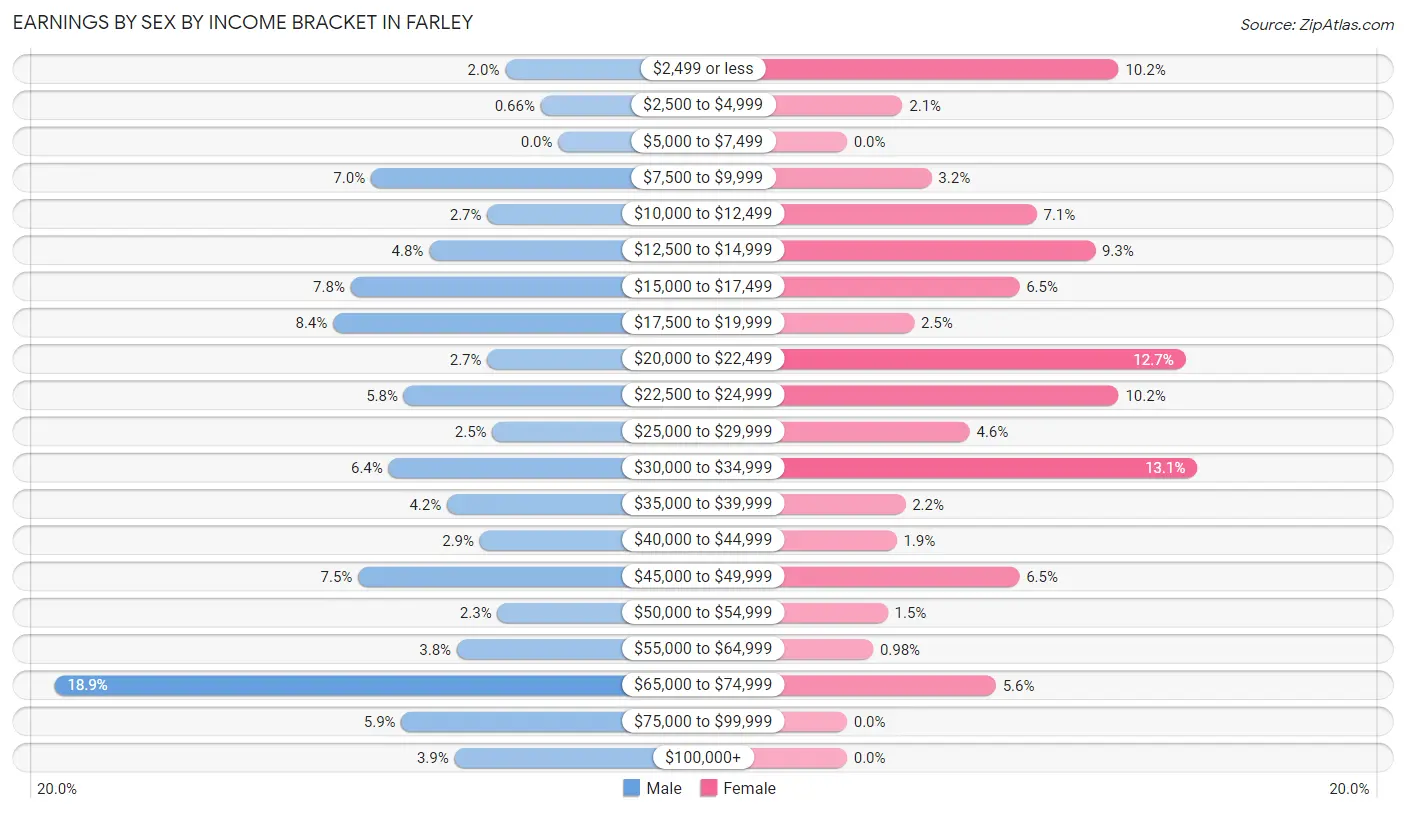
Earnings by Sex by Income Bracket in Farley
The most common earnings brackets in Farley are $65,000 to $74,999 for men (199 | 18.9%) and $30,000 to $34,999 for women (120 | 13.1%).
| Income | Male | Female |
| $2,499 or less | 21 (2.0%) | 93 (10.2%) |
| $2,500 to $4,999 | 7 (0.7%) | 19 (2.1%) |
| $5,000 to $7,499 | 0 (0.0%) | 0 (0.0%) |
| $7,500 to $9,999 | 74 (7.0%) | 29 (3.2%) |
| $10,000 to $12,499 | 28 (2.7%) | 65 (7.1%) |
| $12,500 to $14,999 | 51 (4.8%) | 85 (9.3%) |
| $15,000 to $17,499 | 82 (7.8%) | 59 (6.5%) |
| $17,500 to $19,999 | 89 (8.4%) | 23 (2.5%) |
| $20,000 to $22,499 | 28 (2.7%) | 116 (12.7%) |
| $22,500 to $24,999 | 61 (5.8%) | 93 (10.2%) |
| $25,000 to $29,999 | 26 (2.5%) | 42 (4.6%) |
| $30,000 to $34,999 | 67 (6.4%) | 120 (13.1%) |
| $35,000 to $39,999 | 44 (4.2%) | 20 (2.2%) |
| $40,000 to $44,999 | 31 (2.9%) | 17 (1.9%) |
| $45,000 to $49,999 | 79 (7.5%) | 59 (6.5%) |
| $50,000 to $54,999 | 24 (2.3%) | 14 (1.5%) |
| $55,000 to $64,999 | 40 (3.8%) | 9 (1.0%) |
| $65,000 to $74,999 | 199 (18.9%) | 51 (5.6%) |
| $75,000 to $99,999 | 62 (5.9%) | 0 (0.0%) |
| $100,000+ | 41 (3.9%) | 0 (0.0%) |
| Total | 1,054 (100.0%) | 914 (100.0%) |
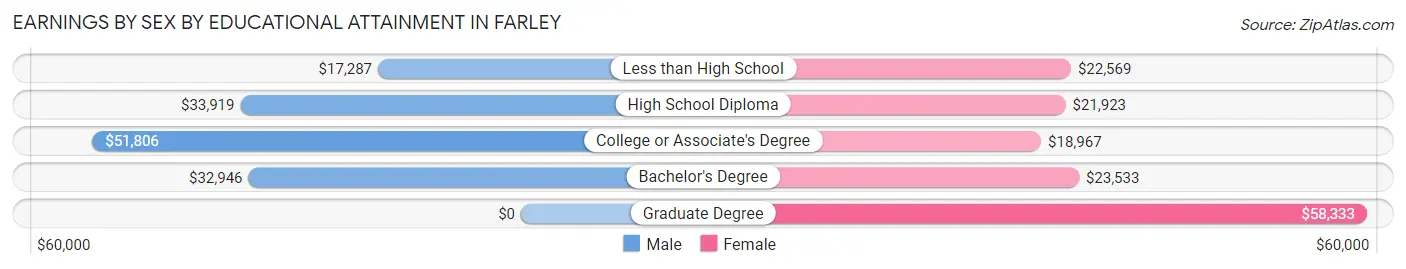
Earnings by Sex by Educational Attainment in Farley
Average earnings in Farley are $34,706 for men and $22,581 for women, a difference of 34.9%. Men with an educational attainment of college or associate's degree enjoy the highest average annual earnings of $51,806, while those with less than high school education earn the least with $17,287. Women with an educational attainment of graduate degree earn the most with the average annual earnings of $58,333, while those with college or associate's degree education have the smallest earnings of $18,967.
| Educational Attainment | Male Income | Female Income |
| Less than High School | $17,287 | $22,569 |
| High School Diploma | $33,919 | $21,923 |
| College or Associate's Degree | $51,806 | $18,967 |
| Bachelor's Degree | $32,946 | $23,533 |
| Graduate Degree | - | - |
| Total | $34,706 | $22,581 |
Family Income in Farley
Family Income Brackets in Farley
According to the Farley family income data, there are 217 families falling into the $15,000 to $24,999 income range, which is the most common income bracket and makes up 20.1% of all families.
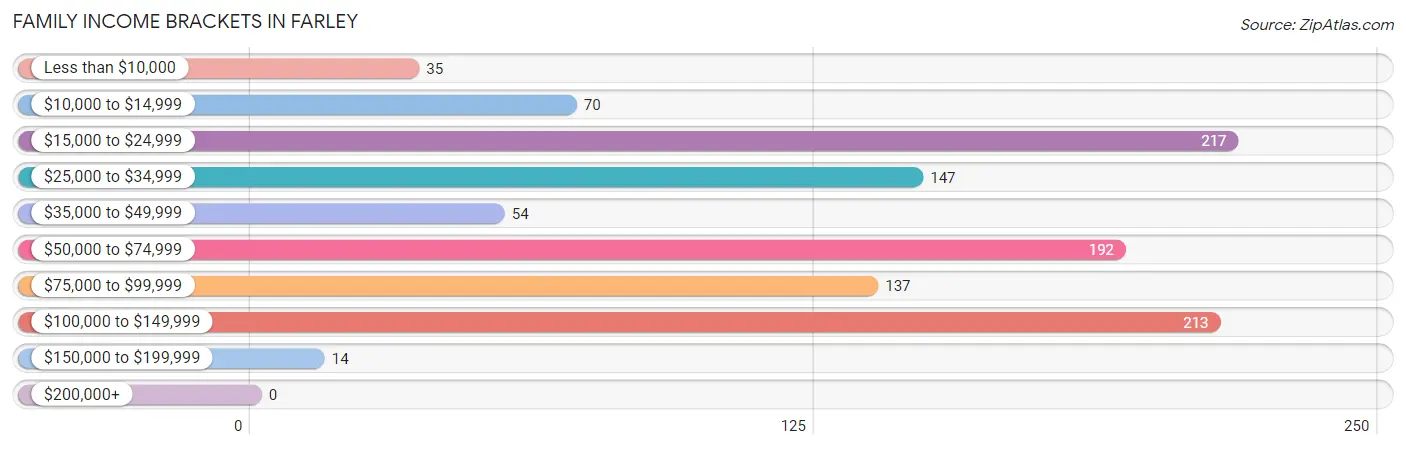
| Income Bracket | # Families | % Families |
| Less than $10,000 | 35 | 3.2% |
| $10,000 to $14,999 | 70 | 6.5% |
| $15,000 to $24,999 | 217 | 20.1% |
| $25,000 to $34,999 | 147 | 13.6% |
| $35,000 to $49,999 | 54 | 5.0% |
| $50,000 to $74,999 | 192 | 17.8% |
| $75,000 to $99,999 | 137 | 12.7% |
| $100,000 to $149,999 | 213 | 19.7% |
| $150,000 to $199,999 | 14 | 1.3% |
| $200,000+ | 0 | 0.0% |
Family Income by Famaliy Size in Farley
4-person families (282 | 26.1%) account for the highest median family income in Farley with $59,828 per family, while 3-person families (168 | 15.6%) have the highest median income of $18,750 per family member.
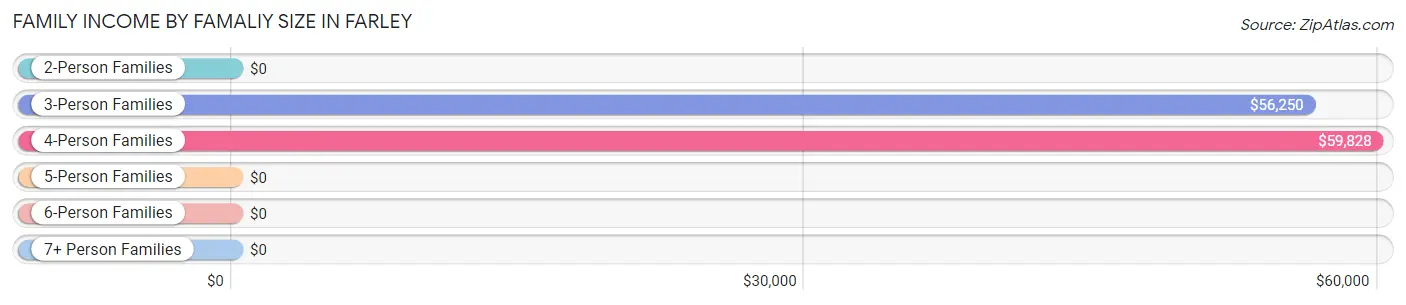
| Income Bracket | # Families | Median Income |
| 2-Person Families | 533 (49.4%) | $0 |
| 3-Person Families | 168 (15.6%) | $56,250 |
| 4-Person Families | 282 (26.1%) | $59,828 |
| 5-Person Families | 43 (4.0%) | $0 |
| 6-Person Families | 45 (4.2%) | $0 |
| 7+ Person Families | 8 (0.7%) | $0 |
| Total | 1,079 (100.0%) | $53,750 |
Family Income by Number of Earners in Farley
The median family income in Farley is $53,750, with families comprising 2 earners (318) having the highest median family income of $87,353, while families with no earners (262) have the lowest median family income of $24,167, accounting for 29.5% and 24.3% of families, respectively.
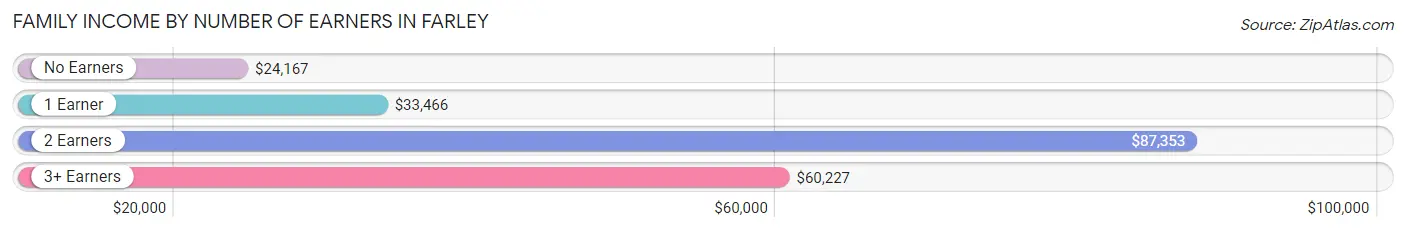
| Number of Earners | # Families | Median Income |
| No Earners | 262 (24.3%) | $24,167 |
| 1 Earner | 427 (39.6%) | $33,466 |
| 2 Earners | 318 (29.5%) | $87,353 |
| 3+ Earners | 72 (6.7%) | $60,227 |
| Total | 1,079 (100.0%) | $53,750 |
Household Income in Farley
Household Income Brackets in Farley
With 301 households falling in the category, the $50,000 to $74,999 income range is the most frequent in Farley, accounting for 18.9% of all households.
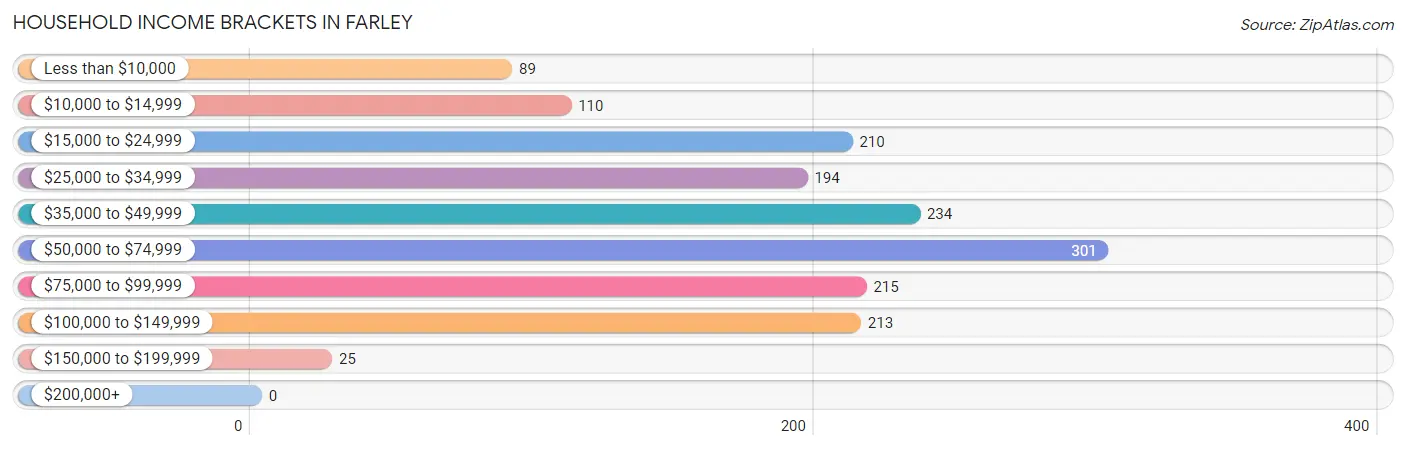
| Income Bracket | # Households | % Households |
| Less than $10,000 | 89 | 5.6% |
| $10,000 to $14,999 | 110 | 6.9% |
| $15,000 to $24,999 | 210 | 13.2% |
| $25,000 to $34,999 | 194 | 12.2% |
| $35,000 to $49,999 | 234 | 14.7% |
| $50,000 to $74,999 | 301 | 18.9% |
| $75,000 to $99,999 | 215 | 13.5% |
| $100,000 to $149,999 | 213 | 13.4% |
| $150,000 to $199,999 | 25 | 1.6% |
| $200,000+ | 0 | 0.0% |
Household Income by Householder Age in Farley
The median household income in Farley is $45,257, with the highest median household income of $59,095 found in the 25 to 44 years age bracket for the primary householder. A total of 543 households (34.1%) fall into this category.
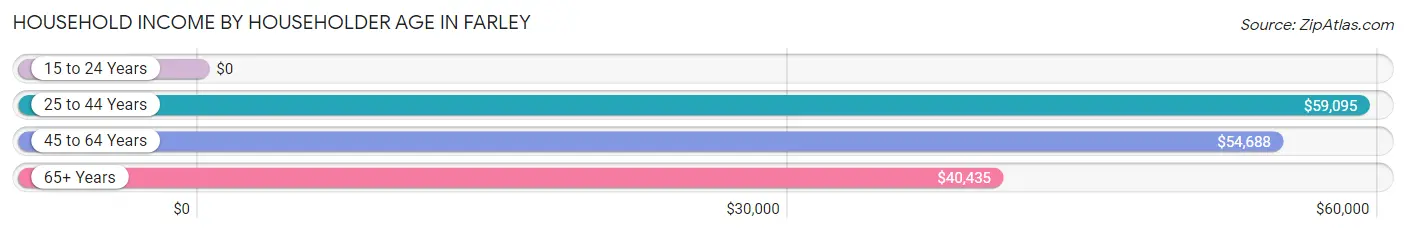
| Income Bracket | # Households | Median Income |
| 15 to 24 Years | 0 (0.0%) | $0 |
| 25 to 44 Years | 543 (34.1%) | $59,095 |
| 45 to 64 Years | 478 (30.0%) | $54,688 |
| 65+ Years | 572 (35.9%) | $40,435 |
| Total | 1,593 (100.0%) | $45,257 |
Poverty in Farley
Income Below Poverty by Sex and Age in Farley
With 21.2% poverty level for males and 33.5% for females among the residents of Farley, under 5 year old males and 5 year old females are the most vulnerable to poverty, with 94 males (59.1%) and 9 females (100.0%) in their respective age groups living below the poverty level.
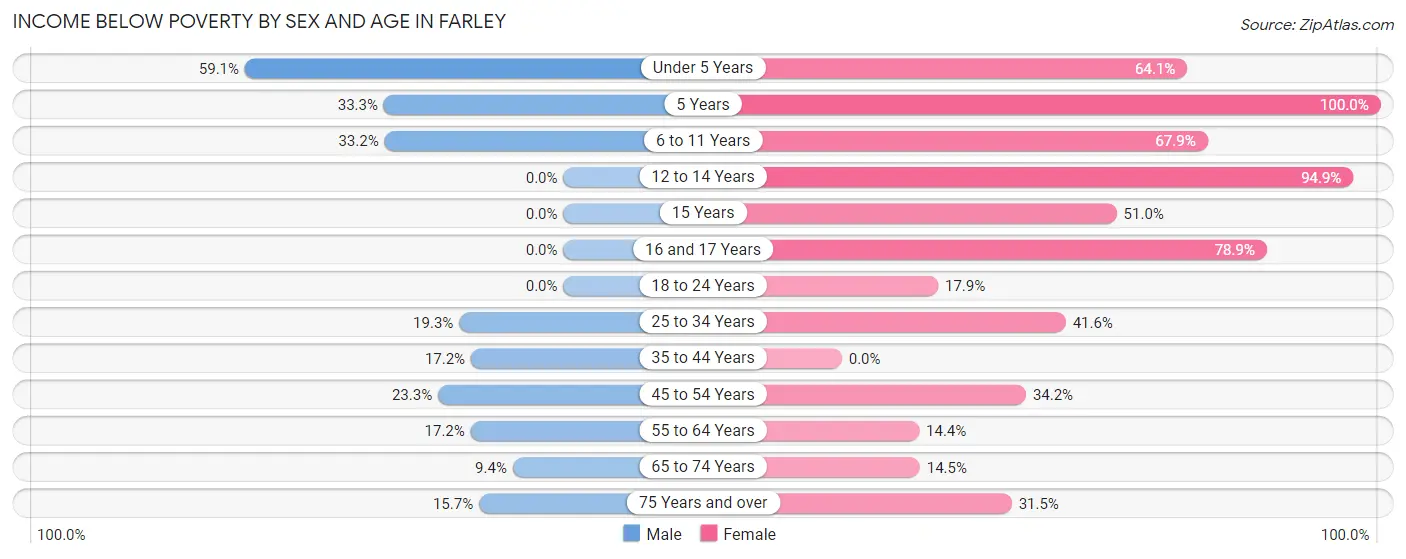
| Age Bracket | Male | Female |
| Under 5 Years | 94 (59.1%) | 50 (64.1%) |
| 5 Years | 36 (33.3%) | 9 (100.0%) |
| 6 to 11 Years | 80 (33.2%) | 150 (67.9%) |
| 12 to 14 Years | 0 (0.0%) | 56 (94.9%) |
| 15 Years | 0 (0.0%) | 25 (51.0%) |
| 16 and 17 Years | 0 (0.0%) | 56 (78.9%) |
| 18 to 24 Years | 0 (0.0%) | 25 (17.9%) |
| 25 to 34 Years | 59 (19.3%) | 165 (41.6%) |
| 35 to 44 Years | 53 (17.2%) | 0 (0.0%) |
| 45 to 54 Years | 84 (23.3%) | 67 (34.2%) |
| 55 to 64 Years | 26 (17.2%) | 32 (14.3%) |
| 65 to 74 Years | 26 (9.4%) | 42 (14.5%) |
| 75 Years and over | 13 (15.7%) | 88 (31.5%) |
| Total | 471 (21.2%) | 765 (33.5%) |
Income Above Poverty by Sex and Age in Farley
According to the poverty statistics in Farley, males aged 12 to 14 years and females aged 35 to 44 years are the age groups that are most secure financially, with 100.0% of males and 100.0% of females in these age groups living above the poverty line.
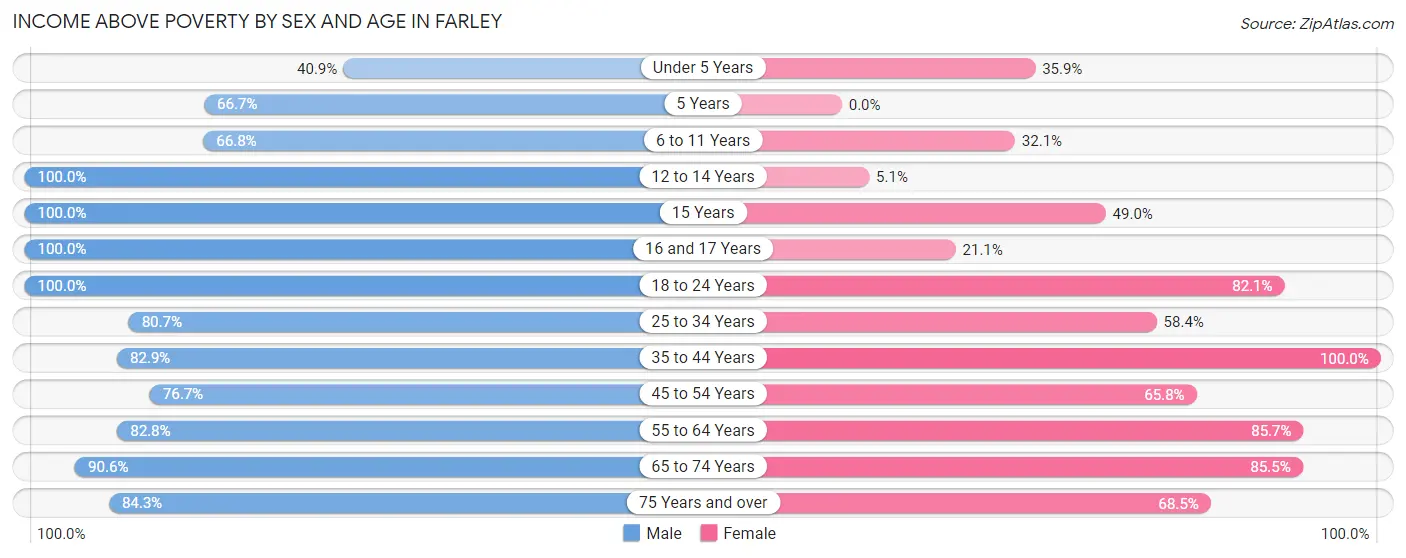
| Age Bracket | Male | Female |
| Under 5 Years | 65 (40.9%) | 28 (35.9%) |
| 5 Years | 72 (66.7%) | 0 (0.0%) |
| 6 to 11 Years | 161 (66.8%) | 71 (32.1%) |
| 12 to 14 Years | 28 (100.0%) | 3 (5.1%) |
| 15 Years | 23 (100.0%) | 24 (49.0%) |
| 16 and 17 Years | 78 (100.0%) | 15 (21.1%) |
| 18 to 24 Years | 95 (100.0%) | 115 (82.1%) |
| 25 to 34 Years | 246 (80.7%) | 232 (58.4%) |
| 35 to 44 Years | 256 (82.9%) | 270 (100.0%) |
| 45 to 54 Years | 277 (76.7%) | 129 (65.8%) |
| 55 to 64 Years | 125 (82.8%) | 191 (85.7%) |
| 65 to 74 Years | 251 (90.6%) | 248 (85.5%) |
| 75 Years and over | 70 (84.3%) | 191 (68.5%) |
| Total | 1,747 (78.8%) | 1,517 (66.5%) |
Income Below Poverty Among Married-Couple Families in Farley
The poverty statistics for married-couple families in Farley show that 8.6% or 63 of the total 732 families live below the poverty line. Families with 3 or 4 children have the highest poverty rate of 58.1%, comprising of 25 families. On the other hand, families with 5 or more children have the lowest poverty rate of 0.0%, which includes 0 families.
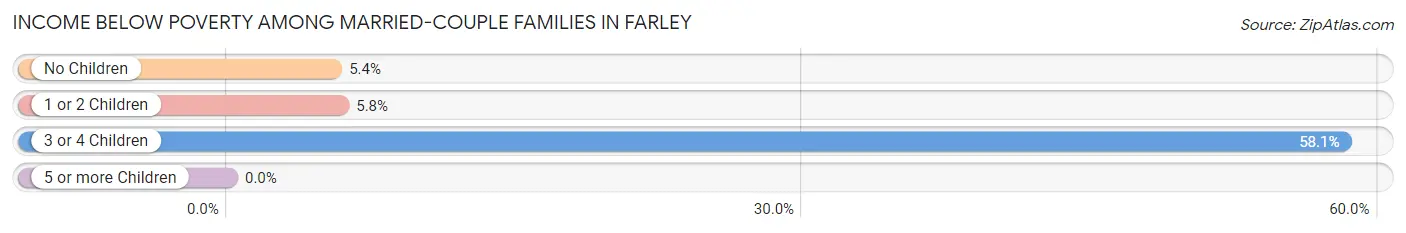
| Children | Above Poverty | Below Poverty |
| No Children | 400 (94.6%) | 23 (5.4%) |
| 1 or 2 Children | 243 (94.2%) | 15 (5.8%) |
| 3 or 4 Children | 18 (41.9%) | 25 (58.1%) |
| 5 or more Children | 8 (100.0%) | 0 (0.0%) |
| Total | 669 (91.4%) | 63 (8.6%) |
Income Below Poverty Among Single-Parent Households in Farley
According to the poverty data in Farley, 89.9% or 89 single-father households and 35.9% or 89 single-mother households are living below the poverty line. Among single-father households, those with no children have the highest poverty rate, with 32 households (100.0%) experiencing poverty. Likewise, among single-mother households, those with 3 or 4 children have the highest poverty rate, with 44 households (100.0%) falling below the poverty line.
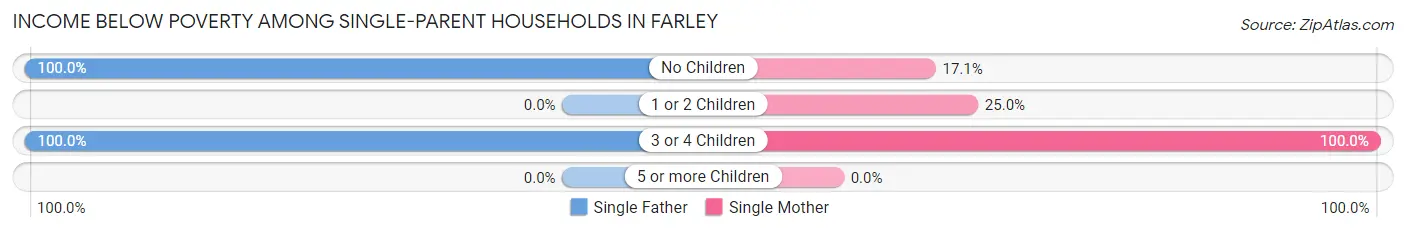
| Children | Single Father | Single Mother |
| No Children | 32 (100.0%) | 13 (17.1%) |
| 1 or 2 Children | 0 (0.0%) | 32 (25.0%) |
| 3 or 4 Children | 57 (100.0%) | 44 (100.0%) |
| 5 or more Children | 0 (0.0%) | 0 (0.0%) |
| Total | 89 (89.9%) | 89 (35.9%) |
Income Below Poverty Among Married-Couple vs Single-Parent Households in Farley
The poverty data for Farley shows that 63 of the married-couple family households (8.6%) and 178 of the single-parent households (51.3%) are living below the poverty level. Within the married-couple family households, those with 3 or 4 children have the highest poverty rate, with 25 households (58.1%) falling below the poverty line. Among the single-parent households, those with 3 or 4 children have the highest poverty rate, with 101 household (100.0%) living below poverty.
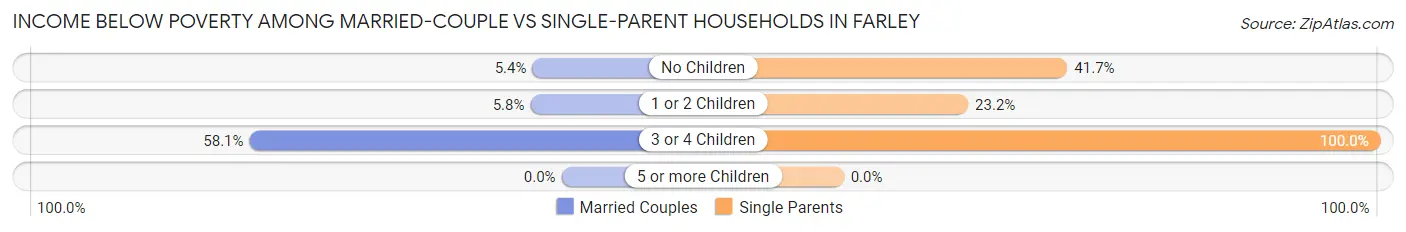
| Children | Married-Couple Families | Single-Parent Households |
| No Children | 23 (5.4%) | 45 (41.7%) |
| 1 or 2 Children | 15 (5.8%) | 32 (23.2%) |
| 3 or 4 Children | 25 (58.1%) | 101 (100.0%) |
| 5 or more Children | 0 (0.0%) | 0 (0.0%) |
| Total | 63 (8.6%) | 178 (51.3%) |
Race in Farley
The most populous races in Farley are White / Caucasian (3,965 | 87.0%), Black / African American (295 | 6.5%), and Hispanic or Latino (241 | 5.3%).
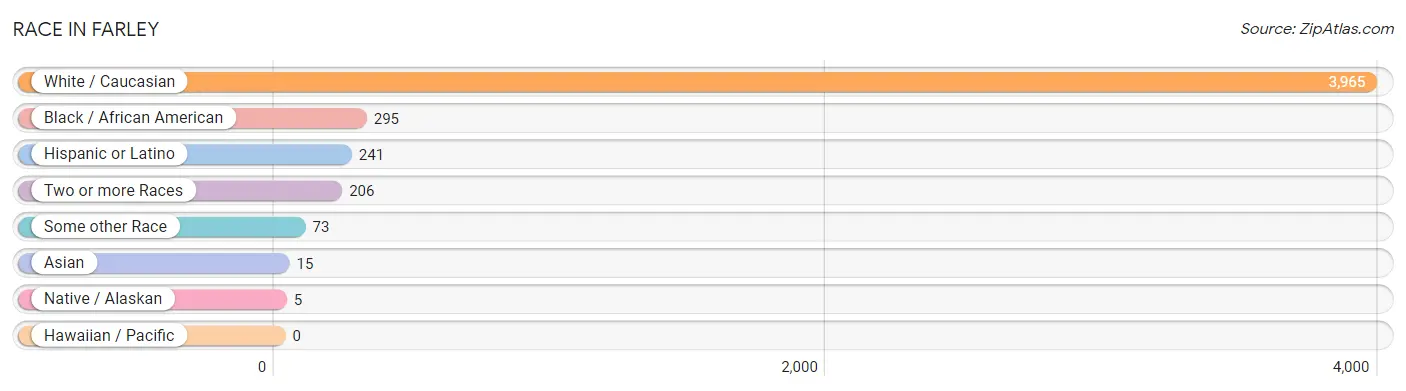
| Race | # Population | % Population |
| Asian | 15 | 0.3% |
| Black / African American | 295 | 6.5% |
| Hawaiian / Pacific | 0 | 0.0% |
| Hispanic or Latino | 241 | 5.3% |
| Native / Alaskan | 5 | 0.1% |
| White / Caucasian | 3,965 | 87.0% |
| Two or more Races | 206 | 4.5% |
| Some other Race | 73 | 1.6% |
| Total | 4,559 | 100.0% |
Ancestry in Farley
The most populous ancestries reported in Farley are English (1,250 | 27.4%), German (441 | 9.7%), Irish (294 | 6.5%), Scottish (271 | 5.9%), and American (248 | 5.4%), together accounting for 54.9% of all Farley residents.
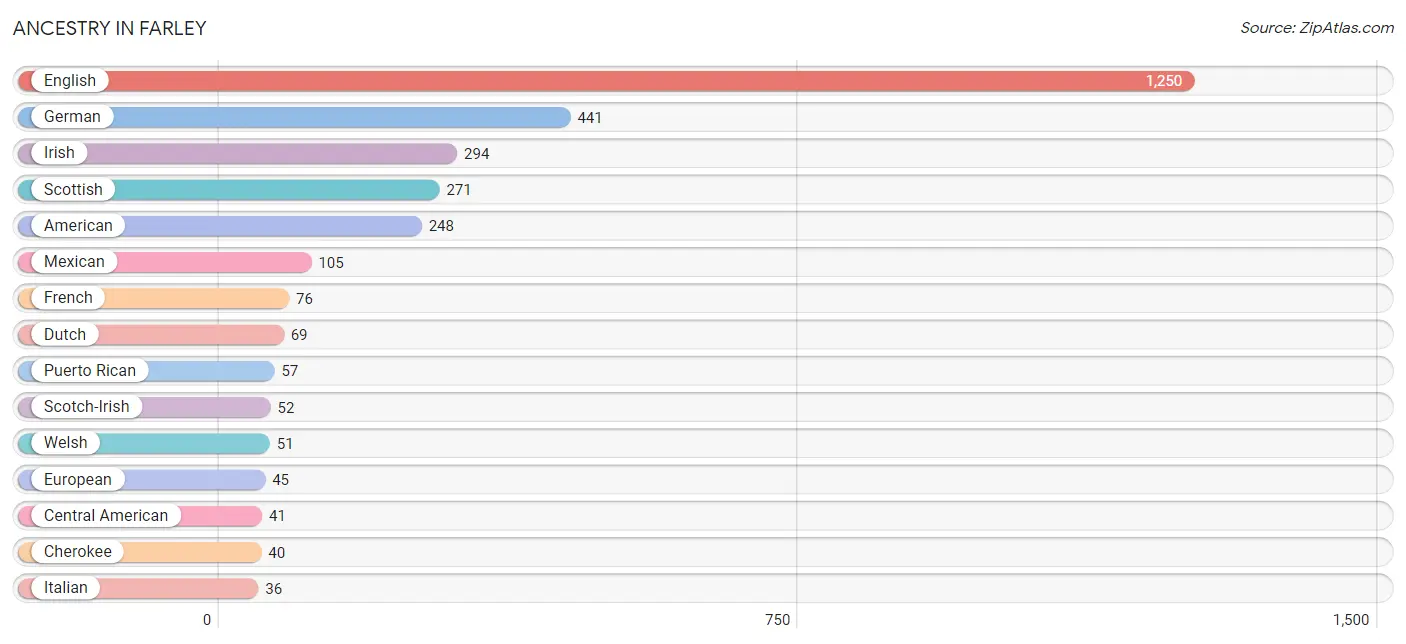
| Ancestry | # Population | % Population |
| African | 14 | 0.3% |
| American | 248 | 5.4% |
| Armenian | 8 | 0.2% |
| Australian | 11 | 0.2% |
| Blackfeet | 9 | 0.2% |
| Canadian | 9 | 0.2% |
| Central American | 41 | 0.9% |
| Cherokee | 40 | 0.9% |
| Chickasaw | 25 | 0.5% |
| Choctaw | 20 | 0.4% |
| Dominican | 13 | 0.3% |
| Dutch | 69 | 1.5% |
| English | 1,250 | 27.4% |
| European | 45 | 1.0% |
| French | 76 | 1.7% |
| French Canadian | 4 | 0.1% |
| German | 441 | 9.7% |
| Ghanaian | 12 | 0.3% |
| Guatemalan | 22 | 0.5% |
| Honduran | 19 | 0.4% |
| Hungarian | 9 | 0.2% |
| Irish | 294 | 6.5% |
| Italian | 36 | 0.8% |
| Mexican | 105 | 2.3% |
| Norwegian | 22 | 0.5% |
| Polish | 9 | 0.2% |
| Puerto Rican | 57 | 1.3% |
| Scotch-Irish | 52 | 1.1% |
| Scottish | 271 | 5.9% |
| Sri Lankan | 15 | 0.3% |
| Subsaharan African | 26 | 0.6% |
| Swedish | 27 | 0.6% |
| Welsh | 51 | 1.1% | View All 33 Rows |
Immigrants in Farley
The most numerous immigrant groups reported in Farley came from Latin America (55 | 1.2%), Central America (42 | 0.9%), Mexico (29 | 0.6%), Caribbean (13 | 0.3%), and Dominican Republic (13 | 0.3%), together accounting for 3.4% of all Farley residents.
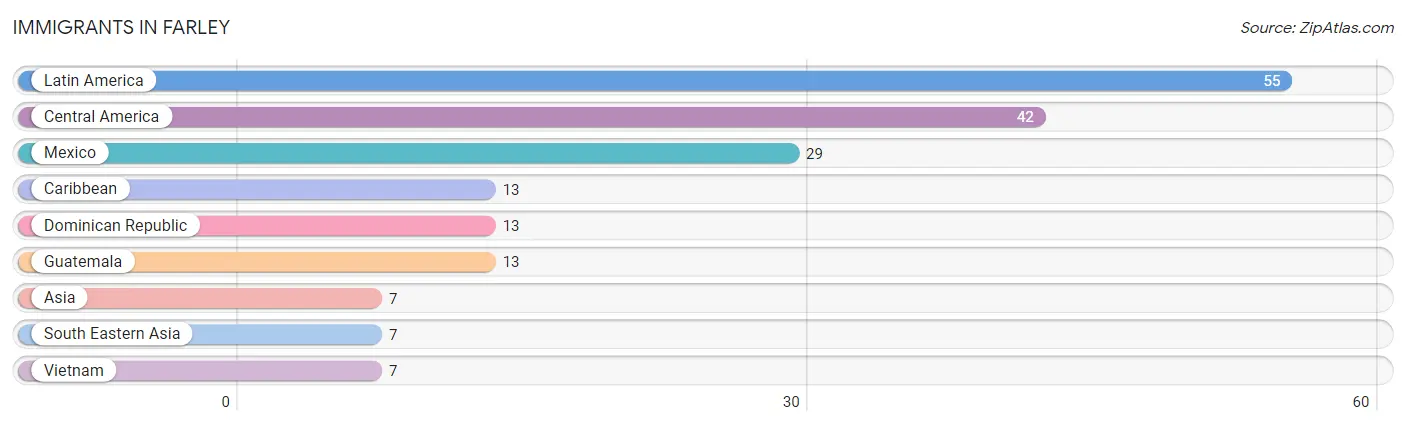
| Immigration Origin | # Population | % Population |
| Asia | 7 | 0.2% |
| Caribbean | 13 | 0.3% |
| Central America | 42 | 0.9% |
| Dominican Republic | 13 | 0.3% |
| Guatemala | 13 | 0.3% |
| Latin America | 55 | 1.2% |
| Mexico | 29 | 0.6% |
| South Eastern Asia | 7 | 0.2% |
| Vietnam | 7 | 0.2% | View All 9 Rows |
Sex and Age in Farley
Sex and Age in Farley
The most populous age groups in Farley are 5 to 9 Years (252 | 11.3%) for men and 25 to 29 Years (204 | 8.7%) for women.
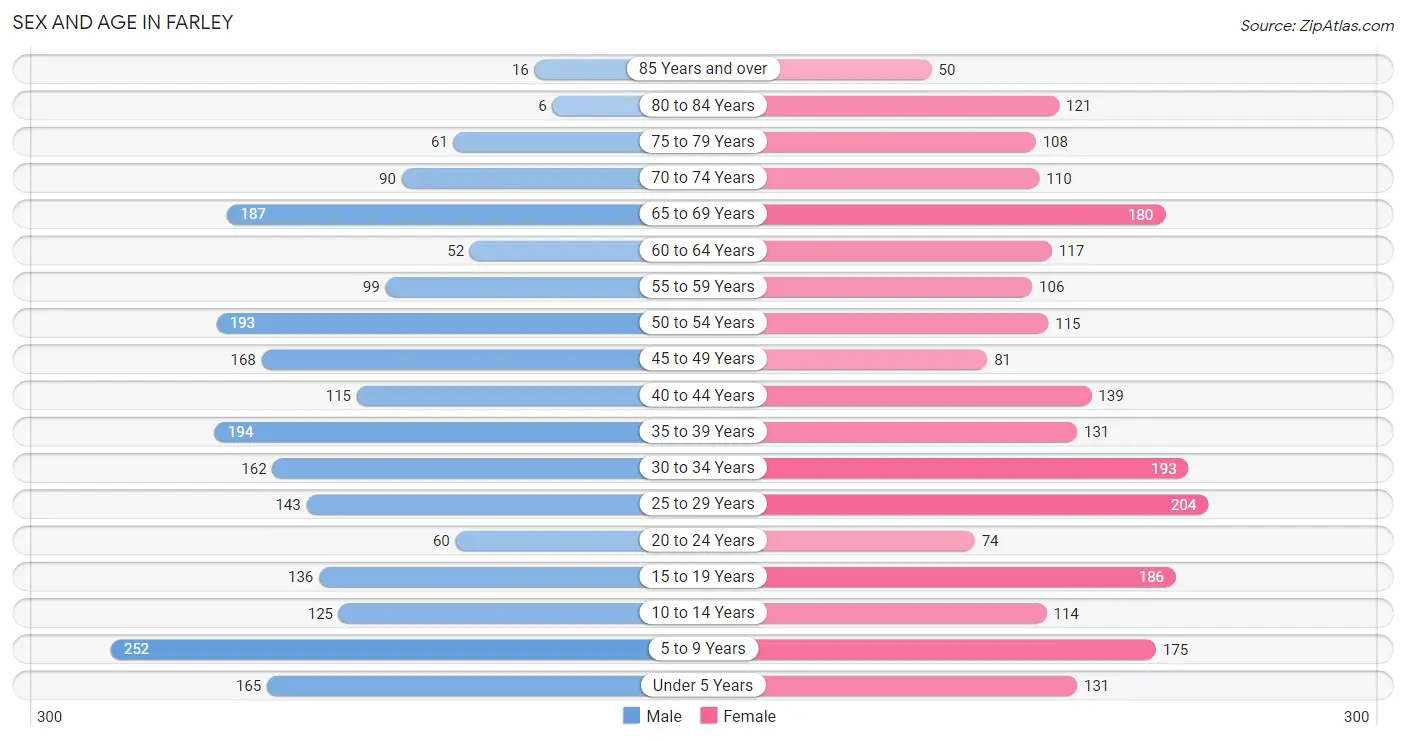
| Age Bracket | Male | Female |
| Under 5 Years | 165 (7.4%) | 131 (5.6%) |
| 5 to 9 Years | 252 (11.3%) | 175 (7.5%) |
| 10 to 14 Years | 125 (5.6%) | 114 (4.9%) |
| 15 to 19 Years | 136 (6.1%) | 186 (8.0%) |
| 20 to 24 Years | 60 (2.7%) | 74 (3.2%) |
| 25 to 29 Years | 143 (6.4%) | 204 (8.7%) |
| 30 to 34 Years | 162 (7.3%) | 193 (8.3%) |
| 35 to 39 Years | 194 (8.7%) | 131 (5.6%) |
| 40 to 44 Years | 115 (5.2%) | 139 (5.9%) |
| 45 to 49 Years | 168 (7.5%) | 81 (3.5%) |
| 50 to 54 Years | 193 (8.7%) | 115 (4.9%) |
| 55 to 59 Years | 99 (4.4%) | 106 (4.5%) |
| 60 to 64 Years | 52 (2.3%) | 117 (5.0%) |
| 65 to 69 Years | 187 (8.4%) | 180 (7.7%) |
| 70 to 74 Years | 90 (4.1%) | 110 (4.7%) |
| 75 to 79 Years | 61 (2.7%) | 108 (4.6%) |
| 80 to 84 Years | 6 (0.3%) | 121 (5.2%) |
| 85 Years and over | 16 (0.7%) | 50 (2.1%) |
| Total | 2,224 (100.0%) | 2,335 (100.0%) |
Families and Households in Farley
Median Family Size in Farley
The median family size in Farley is 3.30 persons per family, with single male/father families (99 | 9.2%) accounting for the largest median family size of 3.76 persons per family. On the other hand, single female/mother families (248 | 23.0%) represent the smallest median family size with 2.89 persons per family.
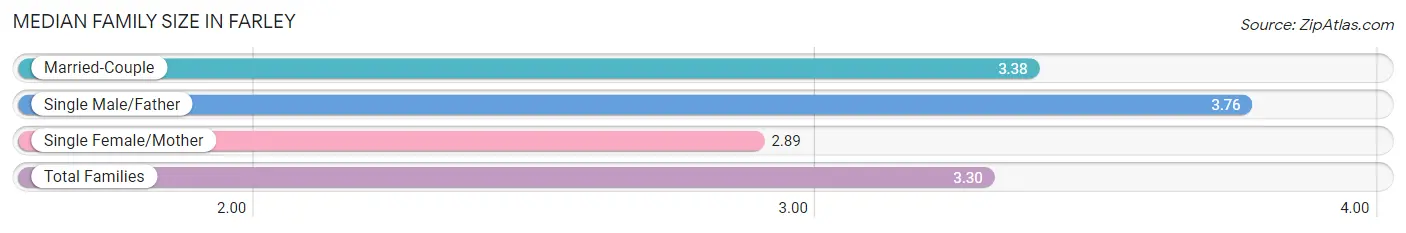
| Family Type | # Families | Family Size |
| Married-Couple | 732 (67.8%) | 3.38 |
| Single Male/Father | 99 (9.2%) | 3.76 |
| Single Female/Mother | 248 (23.0%) | 2.89 |
| Total Families | 1,079 (100.0%) | 3.30 |
Median Household Size in Farley
The median household size in Farley is 2.86 persons per household, with single male/father households (99 | 6.2%) accounting for the largest median household size of 4.71 persons per household. non-family households (514 | 32.3%) represent the smallest median household size with 1.36 persons per household.
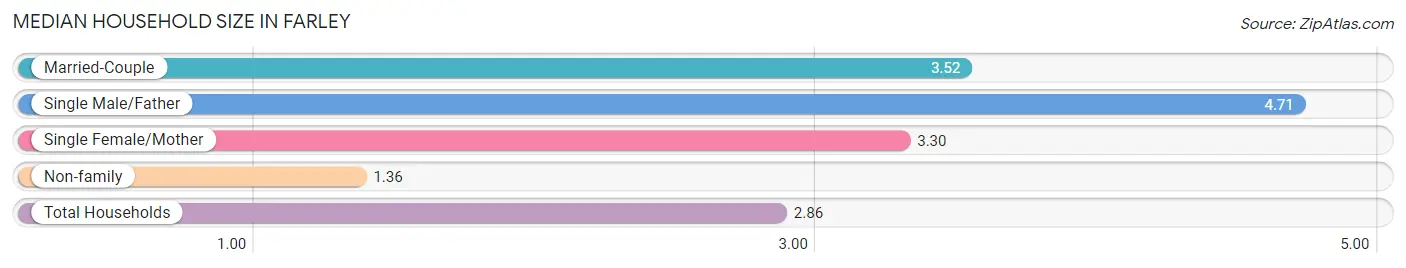
| Household Type | # Households | Household Size |
| Married-Couple | 732 (46.0%) | 3.52 |
| Single Male/Father | 99 (6.2%) | 4.71 |
| Single Female/Mother | 248 (15.6%) | 3.30 |
| Non-family | 514 (32.3%) | 1.36 |
| Total Households | 1,593 (100.0%) | 2.86 |
Household Size by Marriage Status in Farley
Out of a total of 1,593 households in Farley, 1,079 (67.7%) are family households, while 514 (32.3%) are nonfamily households. The most numerous type of family households are 2-person households, comprising 448, and the most common type of nonfamily households are 1-person households, comprising 406.
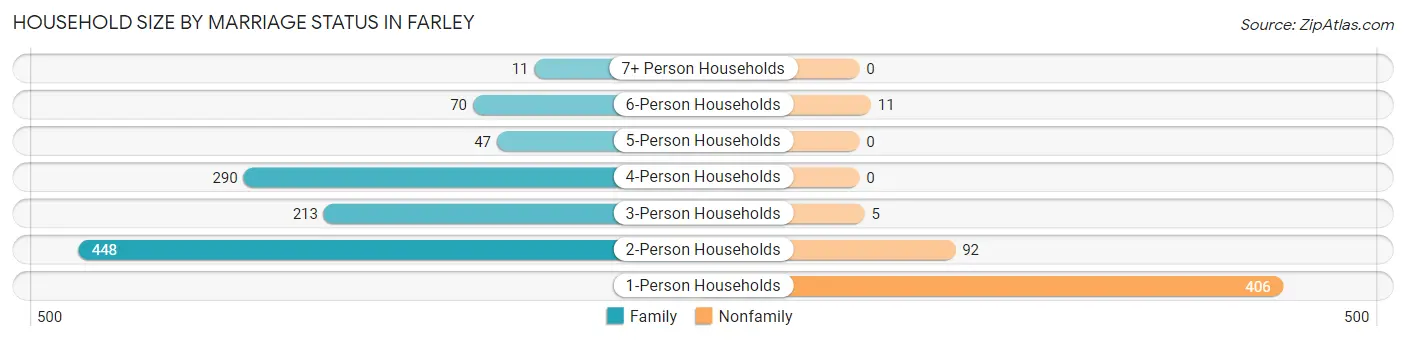
| Household Size | Family Households | Nonfamily Households |
| 1-Person Households | - | 406 (25.5%) |
| 2-Person Households | 448 (28.1%) | 92 (5.8%) |
| 3-Person Households | 213 (13.4%) | 5 (0.3%) |
| 4-Person Households | 290 (18.2%) | 0 (0.0%) |
| 5-Person Households | 47 (2.9%) | 0 (0.0%) |
| 6-Person Households | 70 (4.4%) | 11 (0.7%) |
| 7+ Person Households | 11 (0.7%) | 0 (0.0%) |
| Total | 1,079 (67.7%) | 514 (32.3%) |
Female Fertility in Farley
Fertility by Age in Farley
Average fertility rate in Farley is 37.0 births per 1,000 women. Women in the age bracket of 15 to 19 years have the highest fertility rate with 134.0 births per 1,000 women. Women in the age bracket of 15 to 19 years acount for 65.8% of all women with births.
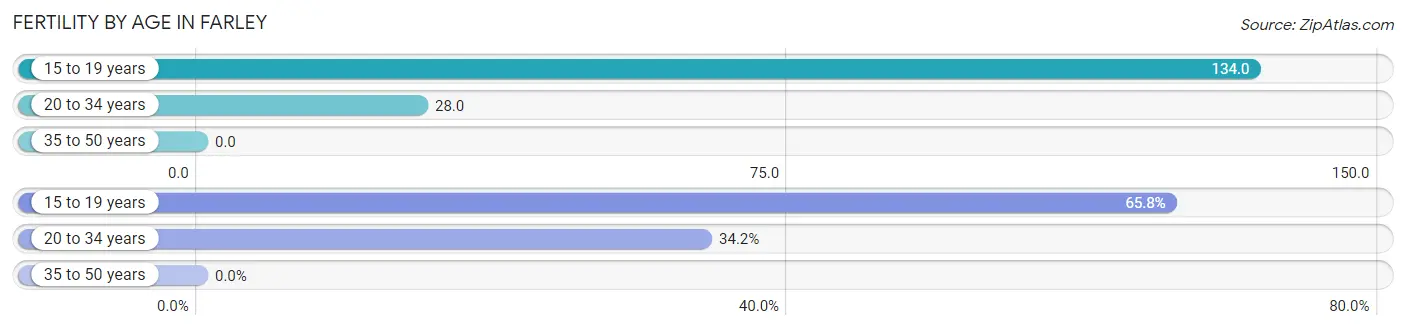
| Age Bracket | Women with Births | Births / 1,000 Women |
| 15 to 19 years | 25 (65.8%) | 134.0 |
| 20 to 34 years | 13 (34.2%) | 28.0 |
| 35 to 50 years | 0 (0.0%) | 0.0 |
| Total | 38 (100.0%) | 37.0 |
Fertility by Age by Marriage Status in Farley
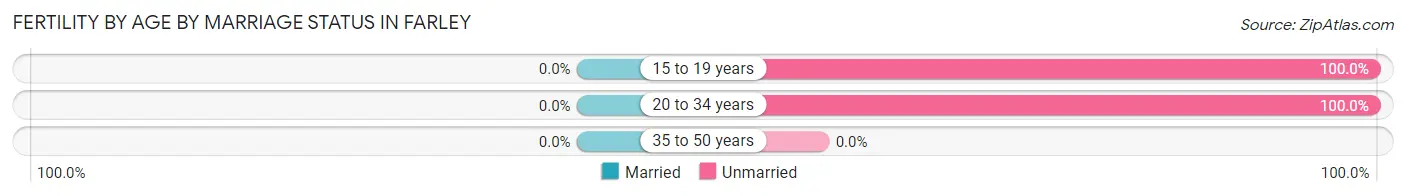
| Age Bracket | Married | Unmarried |
| 15 to 19 years | 0 (0.0%) | 25 (100.0%) |
| 20 to 34 years | 0 (0.0%) | 13 (100.0%) |
| 35 to 50 years | 0 (0.0%) | 0 (0.0%) |
| Total | 0 (0.0%) | 38 (100.0%) |
Fertility by Education in Farley
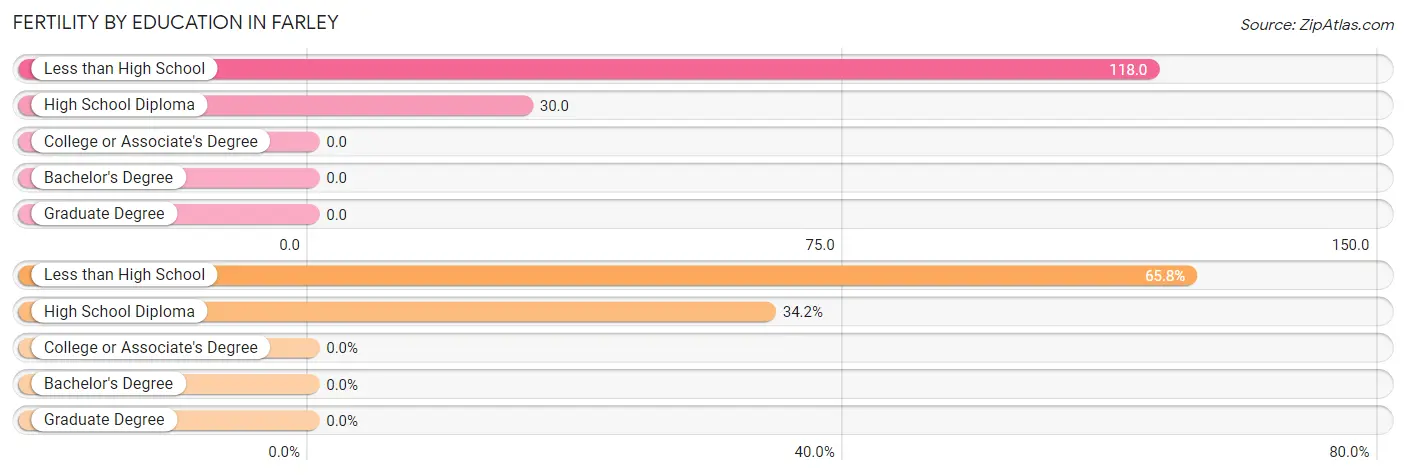
| Educational Attainment | Women with Births | Births / 1,000 Women |
| Less than High School | 25 (65.8%) | 118.0 |
| High School Diploma | 13 (34.2%) | 30.0 |
| College or Associate's Degree | 0 (0.0%) | 0.0 |
| Bachelor's Degree | 0 (0.0%) | 0.0 |
| Graduate Degree | 0 (0.0%) | 0.0 |
| Total | 38 (100.0%) | 37.0 |
Fertility by Education by Marriage Status in Farley
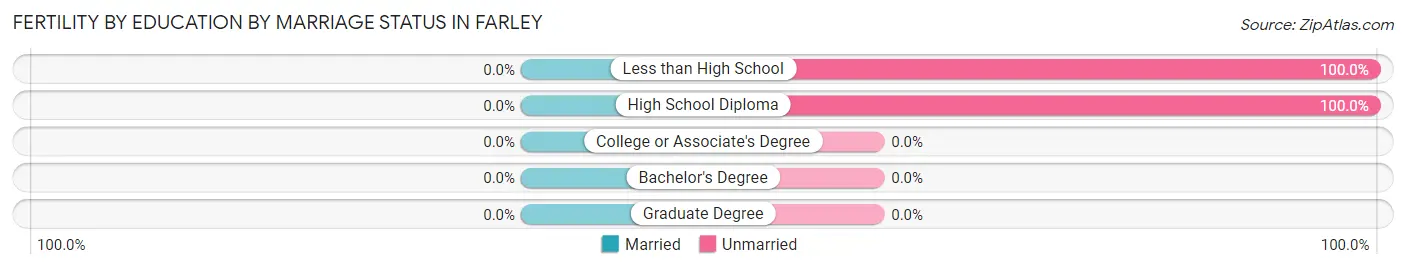
| Educational Attainment | Married | Unmarried |
| Less than High School | 0 (0.0%) | 25 (100.0%) |
| High School Diploma | 0 (0.0%) | 13 (100.0%) |
| College or Associate's Degree | 0 (0.0%) | 0 (0.0%) |
| Bachelor's Degree | 0 (0.0%) | 0 (0.0%) |
| Graduate Degree | 0 (0.0%) | 0 (0.0%) |
| Total | 0 (0.0%) | 38 (100.0%) |
Employment Characteristics in Farley
Employment by Class of Employer in Farley
Among the 1,737 employed individuals in Farley, private company employees (1,423 | 81.9%), self-employed (not incorporated) (88 | 5.1%), and local government employees (79 | 4.5%) make up the most common classes of employment.
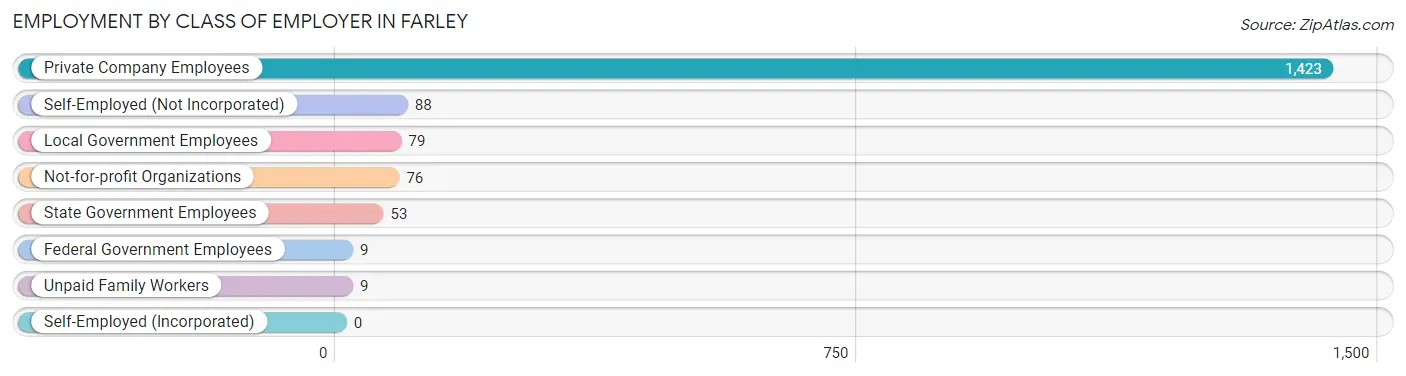
| Employer Class | # Employees | % Employees |
| Private Company Employees | 1,423 | 81.9% |
| Self-Employed (Incorporated) | 0 | 0.0% |
| Self-Employed (Not Incorporated) | 88 | 5.1% |
| Not-for-profit Organizations | 76 | 4.4% |
| Local Government Employees | 79 | 4.5% |
| State Government Employees | 53 | 3.0% |
| Federal Government Employees | 9 | 0.5% |
| Unpaid Family Workers | 9 | 0.5% |
| Total | 1,737 | 100.0% |
Employment Status by Age in Farley
According to the labor force statistics for Farley, out of the total population over 16 years of age (3,525), 51.9% or 1,829 individuals are in the labor force, with 3.9% or 71 of them unemployed. The age group with the highest labor force participation rate is 20 to 24 years, with 89.6% or 120 individuals in the labor force. Within the labor force, the 45 to 54 years age range has the highest percentage of unemployed individuals, with 9.0% or 19 of them being unemployed.
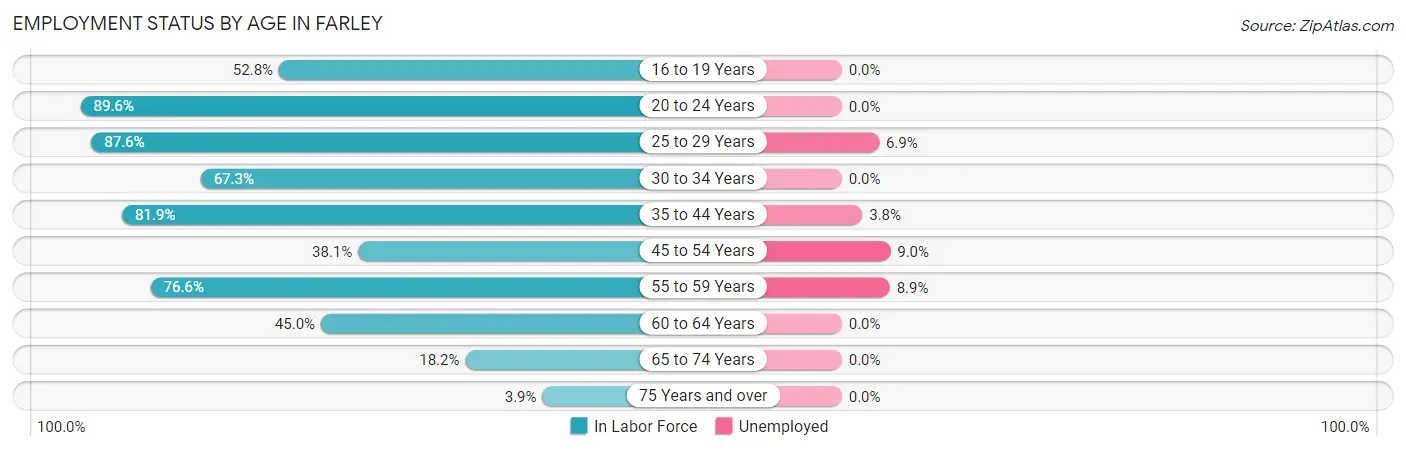
| Age Bracket | In Labor Force | Unemployed |
| 16 to 19 Years | 132 (52.8%) | 0 (0.0%) |
| 20 to 24 Years | 120 (89.6%) | 0 (0.0%) |
| 25 to 29 Years | 304 (87.6%) | 21 (6.9%) |
| 30 to 34 Years | 239 (67.3%) | 0 (0.0%) |
| 35 to 44 Years | 474 (81.9%) | 18 (3.8%) |
| 45 to 54 Years | 212 (38.1%) | 19 (9.0%) |
| 55 to 59 Years | 157 (76.6%) | 14 (8.9%) |
| 60 to 64 Years | 76 (45.0%) | 0 (0.0%) |
| 65 to 74 Years | 103 (18.2%) | 0 (0.0%) |
| 75 Years and over | 14 (3.9%) | 0 (0.0%) |
| Total | 1,829 (51.9%) | 71 (3.9%) |
Employment Status by Educational Attainment in Farley
According to labor force statistics for Farley, 66.1% of individuals (1,462) out of the total population between 25 and 64 years of age (2,212) are in the labor force, with 4.9% or 72 of them being unemployed. The group with the highest labor force participation rate are those with the educational attainment of bachelor's degree or higher, with 83.5% or 227 individuals in the labor force. Within the labor force, individuals with college / associate degree education have the highest percentage of unemployment, with 10.7% or 42 of them being unemployed.
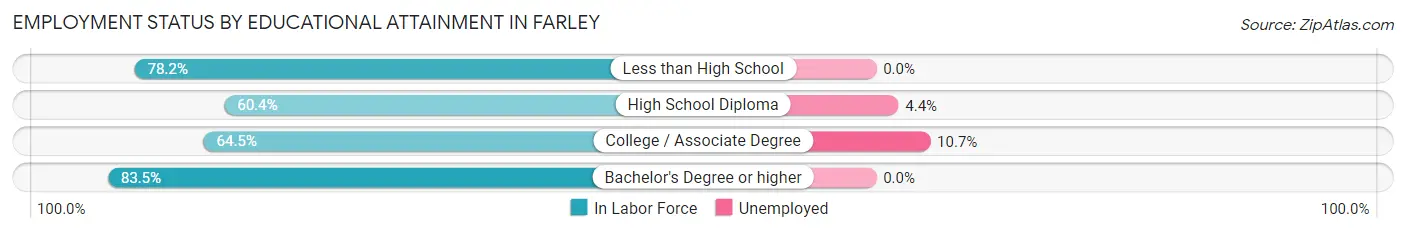
| Educational Attainment | In Labor Force | Unemployed |
| Less than High School | 165 (78.2%) | 0 (0.0%) |
| High School Diploma | 676 (60.4%) | 49 (4.4%) |
| College / Associate Degree | 393 (64.5%) | 65 (10.7%) |
| Bachelor's Degree or higher | 227 (83.5%) | 0 (0.0%) |
| Total | 1,462 (66.1%) | 108 (4.9%) |
Employment Occupations by Sex in Farley
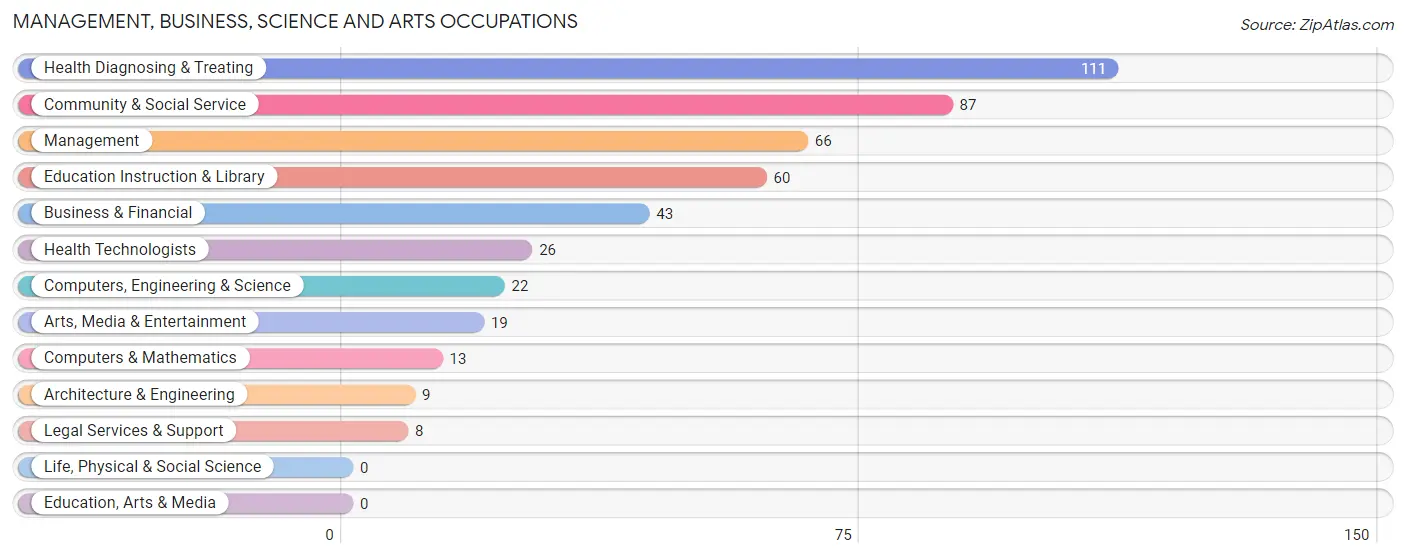
Management, Business, Science and Arts Occupations
The most common Management, Business, Science and Arts occupations in Farley are Health Diagnosing & Treating (111 | 6.3%), Community & Social Service (87 | 5.0%), Management (66 | 3.7%), Education Instruction & Library (60 | 3.4%), and Business & Financial (43 | 2.4%).
Management, Business, Science and Arts Occupations by Sex
Within the Management, Business, Science and Arts occupations in Farley, the most male-oriented occupations are Computers, Engineering & Science (100.0%), Computers & Mathematics (100.0%), and Architecture & Engineering (100.0%), while the most female-oriented occupations are Legal Services & Support (100.0%), Arts, Media & Entertainment (100.0%), and Community & Social Service (87.4%).
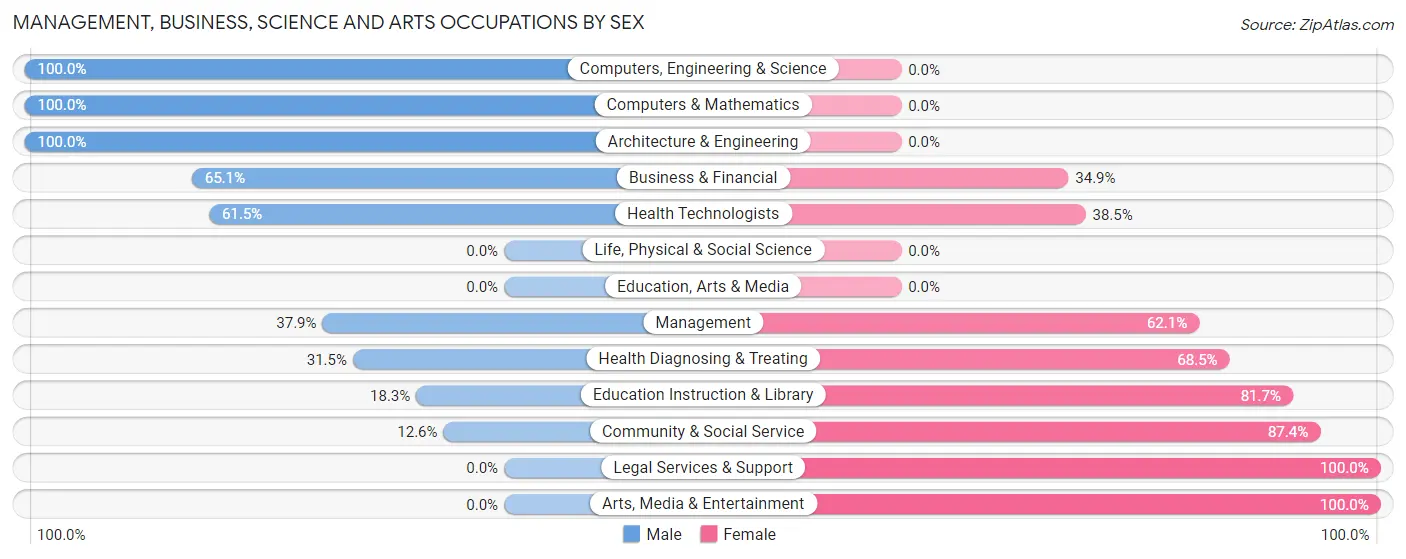
| Occupation | Male | Female |
| Management | 25 (37.9%) | 41 (62.1%) |
| Business & Financial | 28 (65.1%) | 15 (34.9%) |
| Computers, Engineering & Science | 22 (100.0%) | 0 (0.0%) |
| Computers & Mathematics | 13 (100.0%) | 0 (0.0%) |
| Architecture & Engineering | 9 (100.0%) | 0 (0.0%) |
| Life, Physical & Social Science | 0 (0.0%) | 0 (0.0%) |
| Community & Social Service | 11 (12.6%) | 76 (87.4%) |
| Education, Arts & Media | 0 (0.0%) | 0 (0.0%) |
| Legal Services & Support | 0 (0.0%) | 8 (100.0%) |
| Education Instruction & Library | 11 (18.3%) | 49 (81.7%) |
| Arts, Media & Entertainment | 0 (0.0%) | 19 (100.0%) |
| Health Diagnosing & Treating | 35 (31.5%) | 76 (68.5%) |
| Health Technologists | 16 (61.5%) | 10 (38.5%) |
| Total (Category) | 121 (36.8%) | 208 (63.2%) |
| Total (Overall) | 950 (54.0%) | 809 (46.0%) |
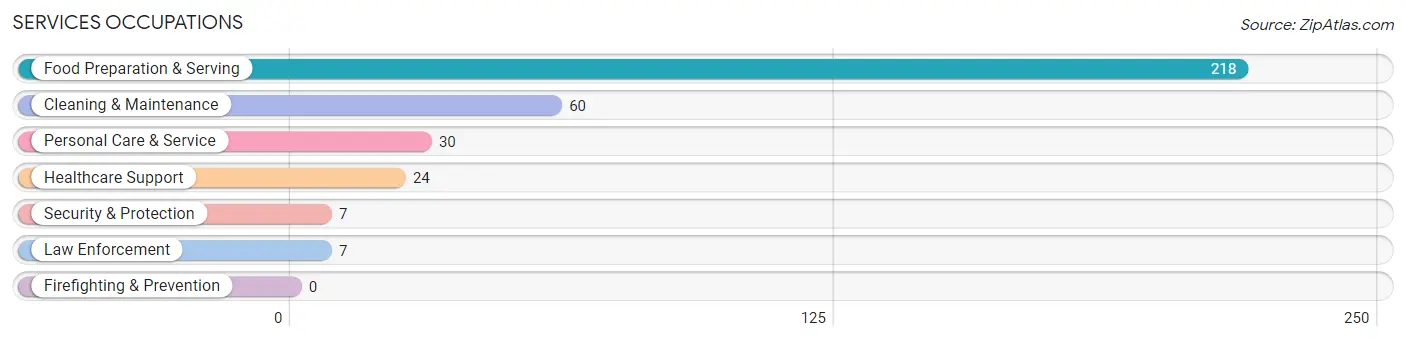
Services Occupations
The most common Services occupations in Farley are Food Preparation & Serving (218 | 12.4%), Cleaning & Maintenance (60 | 3.4%), Personal Care & Service (30 | 1.7%), Healthcare Support (24 | 1.4%), and Security & Protection (7 | 0.4%).
Services Occupations by Sex
Within the Services occupations in Farley, the most male-oriented occupations are Security & Protection (100.0%), Law Enforcement (100.0%), and Cleaning & Maintenance (55.0%), while the most female-oriented occupations are Healthcare Support (100.0%), Personal Care & Service (76.7%), and Food Preparation & Serving (59.2%).
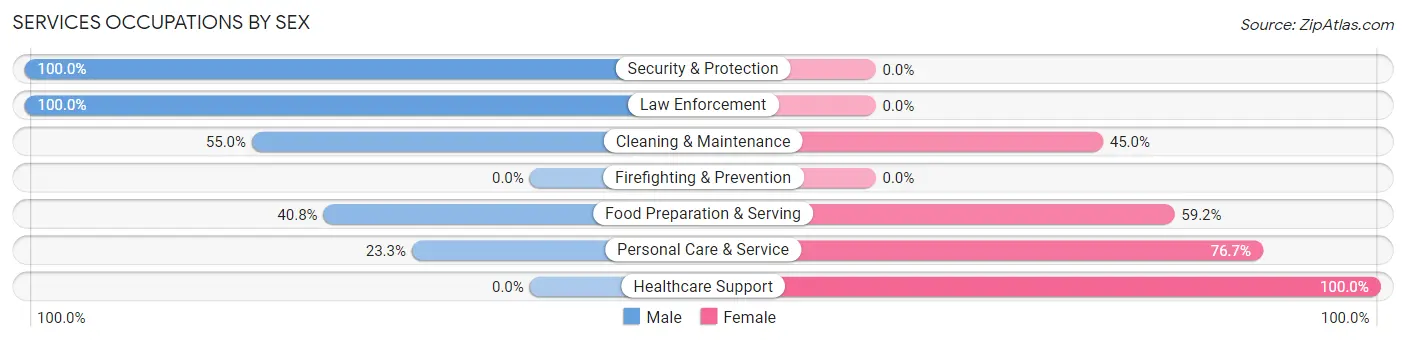
| Occupation | Male | Female |
| Healthcare Support | 0 (0.0%) | 24 (100.0%) |
| Security & Protection | 7 (100.0%) | 0 (0.0%) |
| Firefighting & Prevention | 0 (0.0%) | 0 (0.0%) |
| Law Enforcement | 7 (100.0%) | 0 (0.0%) |
| Food Preparation & Serving | 89 (40.8%) | 129 (59.2%) |
| Cleaning & Maintenance | 33 (55.0%) | 27 (45.0%) |
| Personal Care & Service | 7 (23.3%) | 23 (76.7%) |
| Total (Category) | 136 (40.1%) | 203 (59.9%) |
| Total (Overall) | 950 (54.0%) | 809 (46.0%) |
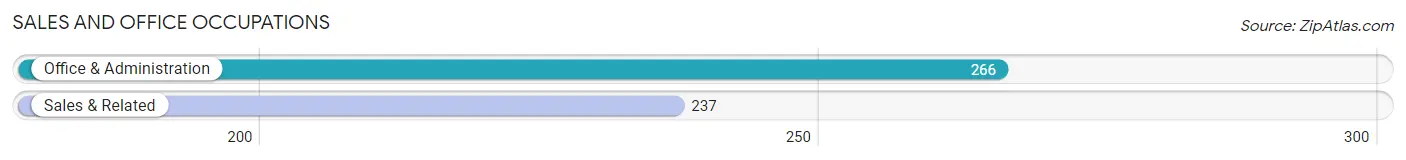
Sales and Office Occupations
The most common Sales and Office occupations in Farley are Office & Administration (266 | 15.1%), and Sales & Related (237 | 13.5%).
Sales and Office Occupations by Sex
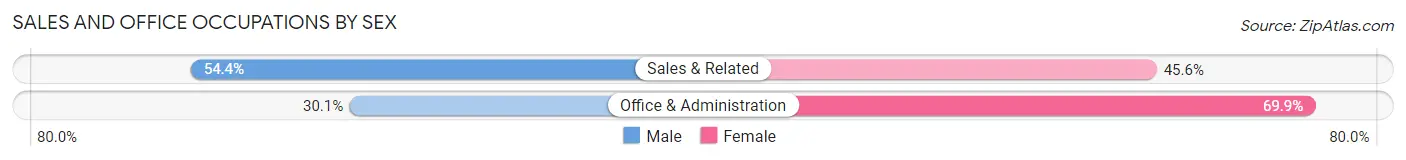
| Occupation | Male | Female |
| Sales & Related | 129 (54.4%) | 108 (45.6%) |
| Office & Administration | 80 (30.1%) | 186 (69.9%) |
| Total (Category) | 209 (41.5%) | 294 (58.5%) |
| Total (Overall) | 950 (54.0%) | 809 (46.0%) |
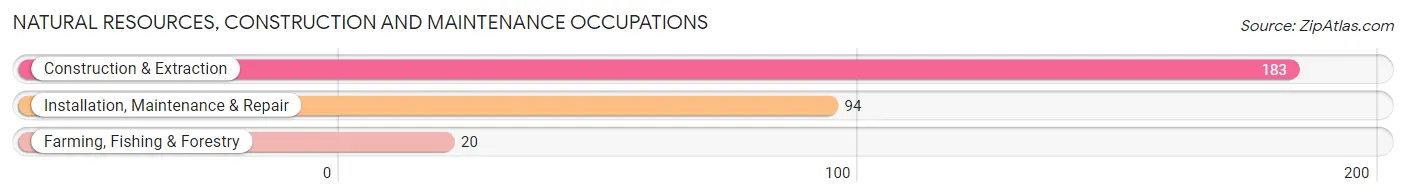
Natural Resources, Construction and Maintenance Occupations
The most common Natural Resources, Construction and Maintenance occupations in Farley are Construction & Extraction (183 | 10.4%), Installation, Maintenance & Repair (94 | 5.3%), and Farming, Fishing & Forestry (20 | 1.1%).
Natural Resources, Construction and Maintenance Occupations by Sex
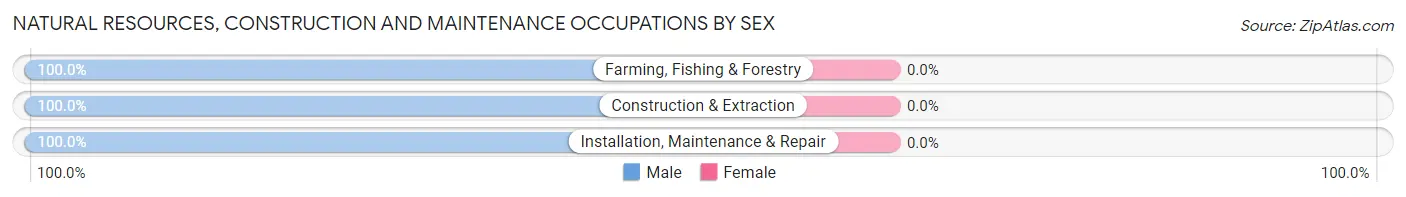
| Occupation | Male | Female |
| Farming, Fishing & Forestry | 20 (100.0%) | 0 (0.0%) |
| Construction & Extraction | 183 (100.0%) | 0 (0.0%) |
| Installation, Maintenance & Repair | 94 (100.0%) | 0 (0.0%) |
| Total (Category) | 297 (100.0%) | 0 (0.0%) |
| Total (Overall) | 950 (54.0%) | 809 (46.0%) |
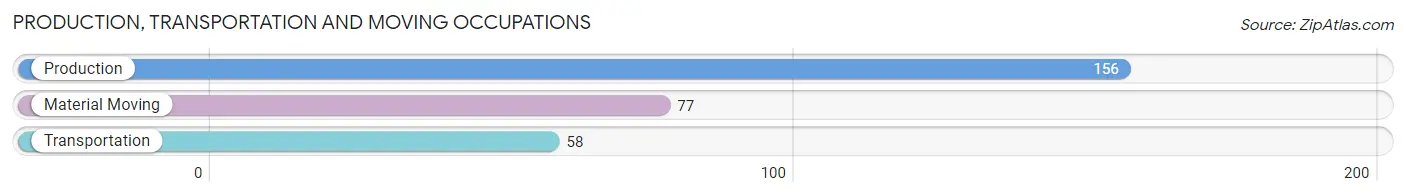
Production, Transportation and Moving Occupations
The most common Production, Transportation and Moving occupations in Farley are Production (156 | 8.9%), Material Moving (77 | 4.4%), and Transportation (58 | 3.3%).
Production, Transportation and Moving Occupations by Sex
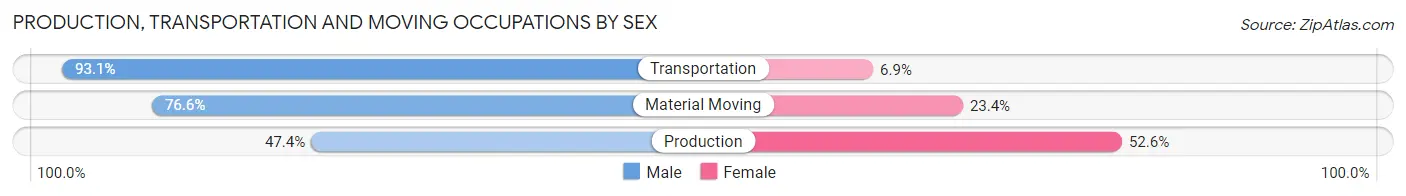
| Occupation | Male | Female |
| Production | 74 (47.4%) | 82 (52.6%) |
| Transportation | 54 (93.1%) | 4 (6.9%) |
| Material Moving | 59 (76.6%) | 18 (23.4%) |
| Total (Category) | 187 (64.3%) | 104 (35.7%) |
| Total (Overall) | 950 (54.0%) | 809 (46.0%) |
Employment Industries by Sex in Farley
Employment Industries in Farley
The major employment industries in Farley include Accommodation & Food Services (257 | 14.6%), Retail Trade (245 | 13.9%), Health Care & Social Assistance (220 | 12.5%), Manufacturing (200 | 11.4%), and Construction (164 | 9.3%).
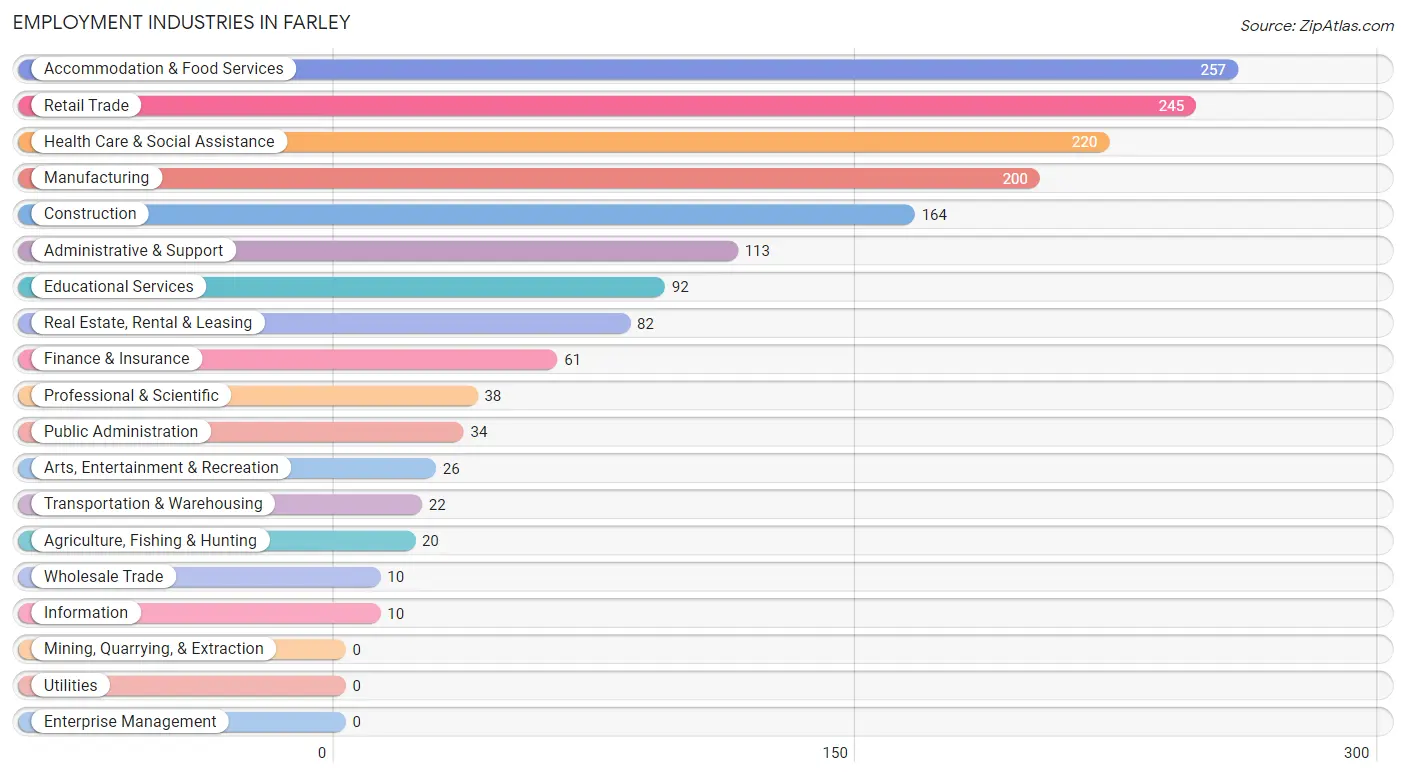
Employment Industries by Sex in Farley
The Farley industries that see more men than women are Agriculture, Fishing & Hunting (100.0%), Construction (100.0%), and Wholesale Trade (100.0%), whereas the industries that tend to have a higher number of women are Health Care & Social Assistance (85.9%), Professional & Scientific (76.3%), and Administrative & Support (76.1%).
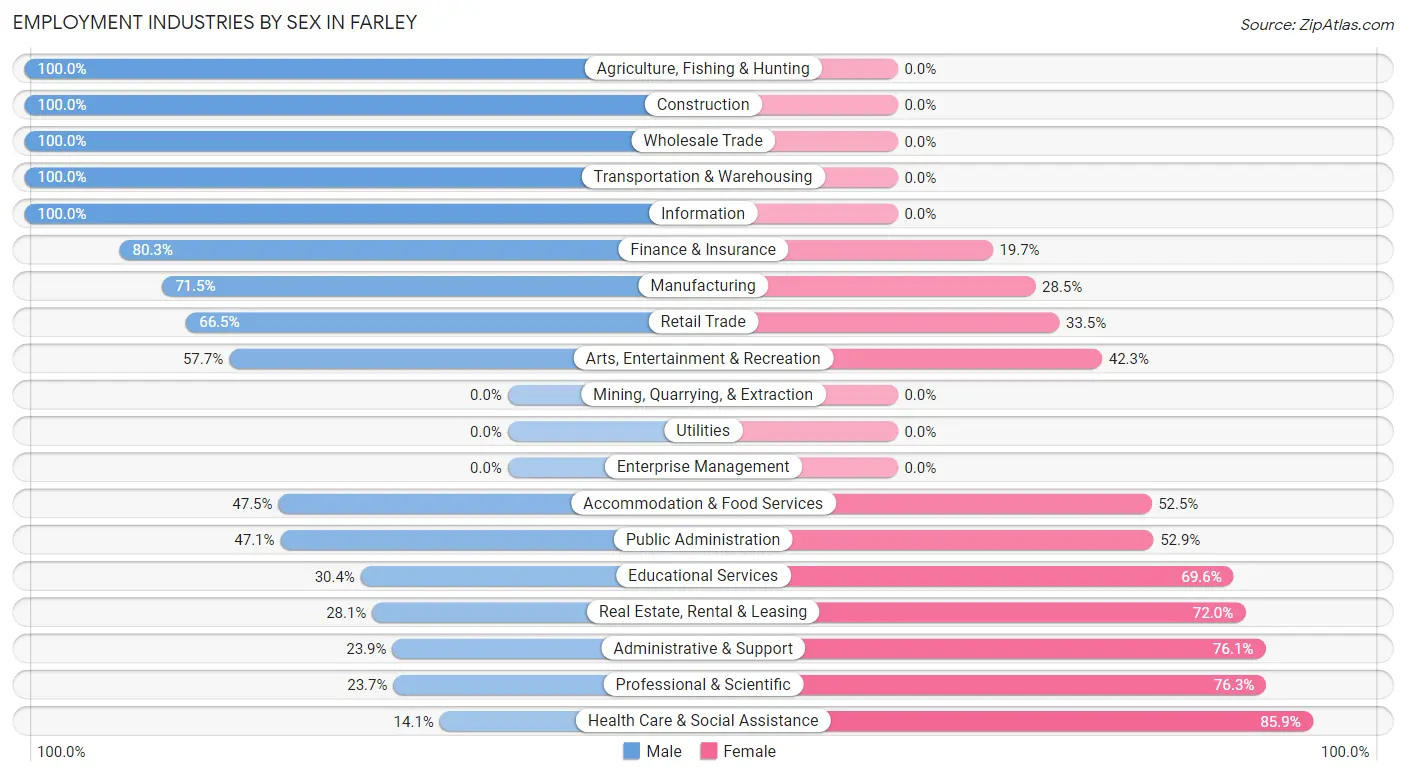
| Industry | Male | Female |
| Agriculture, Fishing & Hunting | 20 (100.0%) | 0 (0.0%) |
| Mining, Quarrying, & Extraction | 0 (0.0%) | 0 (0.0%) |
| Construction | 164 (100.0%) | 0 (0.0%) |
| Manufacturing | 143 (71.5%) | 57 (28.5%) |
| Wholesale Trade | 10 (100.0%) | 0 (0.0%) |
| Retail Trade | 163 (66.5%) | 82 (33.5%) |
| Transportation & Warehousing | 22 (100.0%) | 0 (0.0%) |
| Utilities | 0 (0.0%) | 0 (0.0%) |
| Information | 10 (100.0%) | 0 (0.0%) |
| Finance & Insurance | 49 (80.3%) | 12 (19.7%) |
| Real Estate, Rental & Leasing | 23 (28.1%) | 59 (72.0%) |
| Professional & Scientific | 9 (23.7%) | 29 (76.3%) |
| Enterprise Management | 0 (0.0%) | 0 (0.0%) |
| Administrative & Support | 27 (23.9%) | 86 (76.1%) |
| Educational Services | 28 (30.4%) | 64 (69.6%) |
| Health Care & Social Assistance | 31 (14.1%) | 189 (85.9%) |
| Arts, Entertainment & Recreation | 15 (57.7%) | 11 (42.3%) |
| Accommodation & Food Services | 122 (47.5%) | 135 (52.5%) |
| Public Administration | 16 (47.1%) | 18 (52.9%) |
| Total | 950 (54.0%) | 809 (46.0%) |
Education in Farley
School Enrollment in Farley
The most common levels of schooling among the 1,058 students in Farley are elementary school (378 | 35.7%), high school (238 | 22.5%), and middle school (150 | 14.2%).
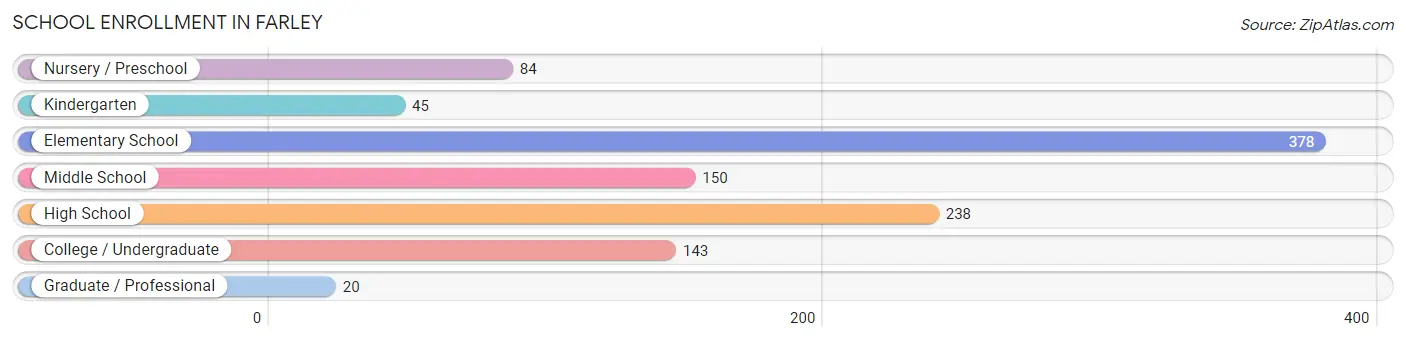
| School Level | # Students | % Students |
| Nursery / Preschool | 84 | 7.9% |
| Kindergarten | 45 | 4.3% |
| Elementary School | 378 | 35.7% |
| Middle School | 150 | 14.2% |
| High School | 238 | 22.5% |
| College / Undergraduate | 143 | 13.5% |
| Graduate / Professional | 20 | 1.9% |
| Total | 1,058 | 100.0% |
School Enrollment by Age by Funding Source in Farley
Out of a total of 1,058 students who are enrolled in schools in Farley, 203 (19.2%) attend a private institution, while the remaining 855 (80.8%) are enrolled in public schools. The age group of 20 to 24 year olds has the highest likelihood of being enrolled in private schools, with 18 (100.0% in the age bracket) enrolled. Conversely, the age group of 3 to 4 year olds has the lowest likelihood of being enrolled in a private school, with 61 (100.0% in the age bracket) attending a public institution.
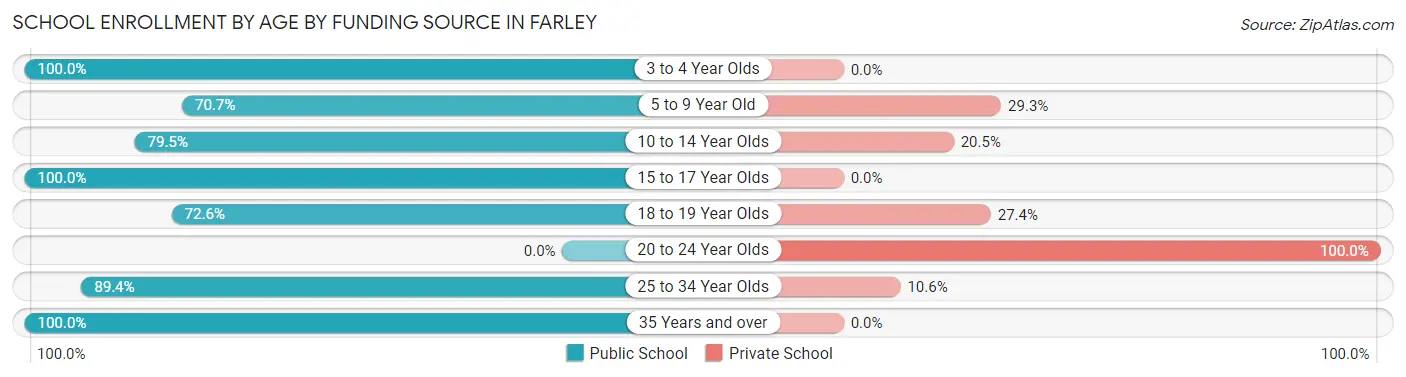
| Age Bracket | Public School | Private School |
| 3 to 4 Year Olds | 61 (100.0%) | 0 (0.0%) |
| 5 to 9 Year Old | 253 (70.7%) | 105 (29.3%) |
| 10 to 14 Year Olds | 190 (79.5%) | 49 (20.5%) |
| 15 to 17 Year Olds | 196 (100.0%) | 0 (0.0%) |
| 18 to 19 Year Olds | 53 (72.6%) | 20 (27.4%) |
| 20 to 24 Year Olds | 0 (0.0%) | 18 (100.0%) |
| 25 to 34 Year Olds | 93 (89.4%) | 11 (10.6%) |
| 35 Years and over | 9 (100.0%) | 0 (0.0%) |
| Total | 855 (80.8%) | 203 (19.2%) |
Educational Attainment by Field of Study in Farley
Arts & humanities (94 | 24.8%), education (75 | 19.8%), business (68 | 17.9%), computers & mathematics (36 | 9.5%), and liberal arts & history (26 | 6.9%) are the most common fields of study among 379 individuals in Farley who have obtained a bachelor's degree or higher.
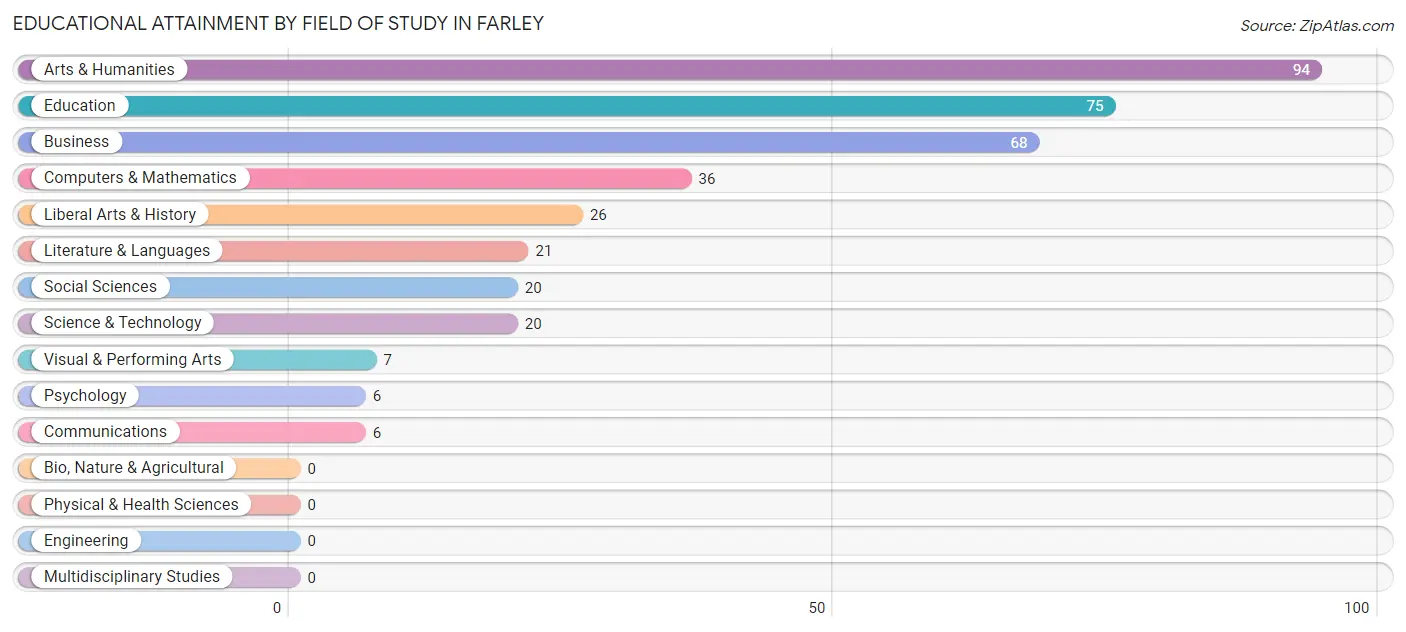
| Field of Study | # Graduates | % Graduates |
| Computers & Mathematics | 36 | 9.5% |
| Bio, Nature & Agricultural | 0 | 0.0% |
| Physical & Health Sciences | 0 | 0.0% |
| Psychology | 6 | 1.6% |
| Social Sciences | 20 | 5.3% |
| Engineering | 0 | 0.0% |
| Multidisciplinary Studies | 0 | 0.0% |
| Science & Technology | 20 | 5.3% |
| Business | 68 | 17.9% |
| Education | 75 | 19.8% |
| Literature & Languages | 21 | 5.5% |
| Liberal Arts & History | 26 | 6.9% |
| Visual & Performing Arts | 7 | 1.8% |
| Communications | 6 | 1.6% |
| Arts & Humanities | 94 | 24.8% |
| Total | 379 | 100.0% |
Transportation & Commute in Farley
Vehicle Availability by Sex in Farley
The most prevalent vehicle ownership categories in Farley are males with 2 vehicles (489, accounting for 52.0%) and females with 2 vehicles (285, making up 61.4%).
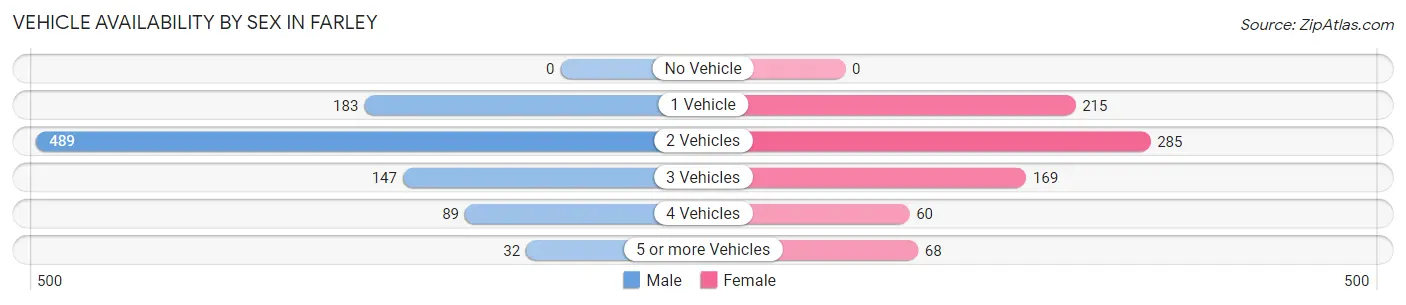
| Vehicles Available | Male | Female |
| No Vehicle | 0 (0.0%) | 0 (0.0%) |
| 1 Vehicle | 183 (19.5%) | 215 (27.0%) |
| 2 Vehicles | 489 (52.0%) | 285 (35.8%) |
| 3 Vehicles | 147 (15.6%) | 169 (21.2%) |
| 4 Vehicles | 89 (9.5%) | 60 (7.5%) |
| 5 or more Vehicles | 32 (3.4%) | 68 (8.5%) |
| Total | 940 (100.0%) | 797 (100.0%) |
Commute Time in Farley
The most frequently occuring commute durations in Farley are 10 to 14 minutes (733 commuters, 44.3%), 15 to 19 minutes (270 commuters, 16.3%), and 5 to 9 minutes (236 commuters, 14.3%).
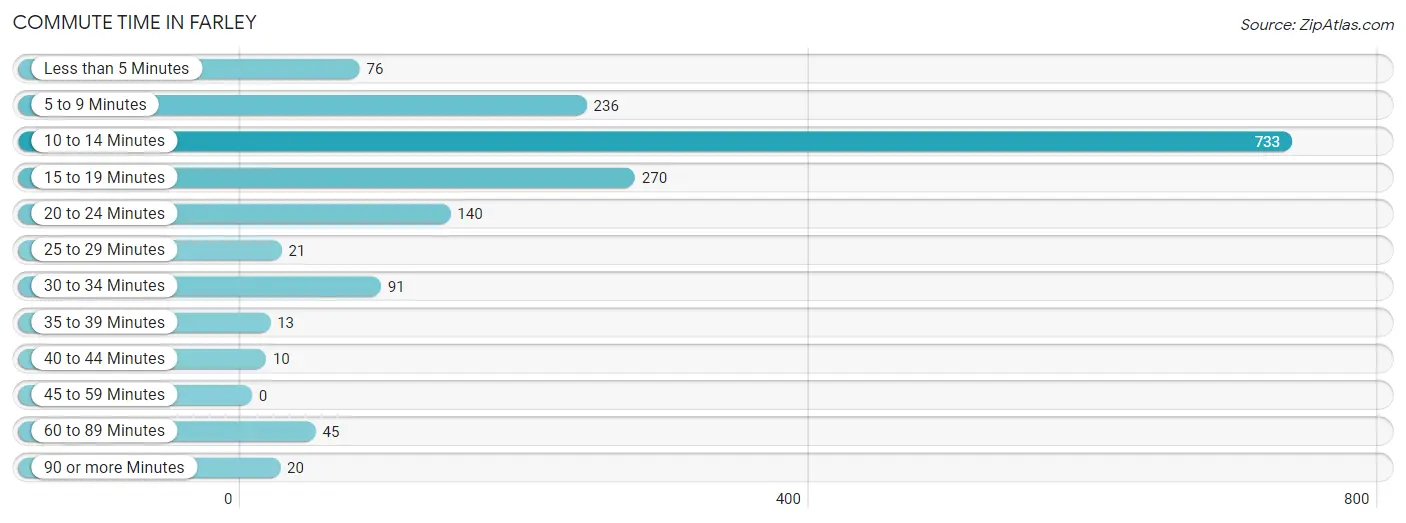
| Commute Time | # Commuters | % Commuters |
| Less than 5 Minutes | 76 | 4.6% |
| 5 to 9 Minutes | 236 | 14.3% |
| 10 to 14 Minutes | 733 | 44.3% |
| 15 to 19 Minutes | 270 | 16.3% |
| 20 to 24 Minutes | 140 | 8.5% |
| 25 to 29 Minutes | 21 | 1.3% |
| 30 to 34 Minutes | 91 | 5.5% |
| 35 to 39 Minutes | 13 | 0.8% |
| 40 to 44 Minutes | 10 | 0.6% |
| 45 to 59 Minutes | 0 | 0.0% |
| 60 to 89 Minutes | 45 | 2.7% |
| 90 or more Minutes | 20 | 1.2% |
Commute Time by Sex in Farley
The most common commute times in Farley are 10 to 14 minutes (478 commuters, 52.8%) for males and 10 to 14 minutes (255 commuters, 34.1%) for females.
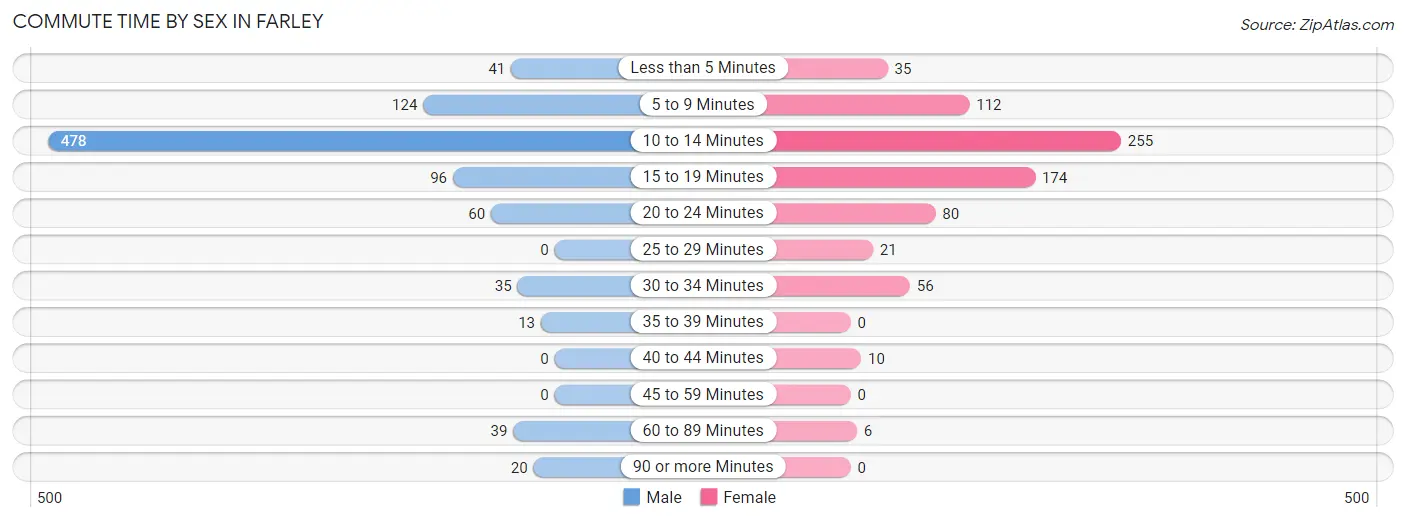
| Commute Time | Male | Female |
| Less than 5 Minutes | 41 (4.5%) | 35 (4.7%) |
| 5 to 9 Minutes | 124 (13.7%) | 112 (14.9%) |
| 10 to 14 Minutes | 478 (52.8%) | 255 (34.1%) |
| 15 to 19 Minutes | 96 (10.6%) | 174 (23.2%) |
| 20 to 24 Minutes | 60 (6.6%) | 80 (10.7%) |
| 25 to 29 Minutes | 0 (0.0%) | 21 (2.8%) |
| 30 to 34 Minutes | 35 (3.9%) | 56 (7.5%) |
| 35 to 39 Minutes | 13 (1.4%) | 0 (0.0%) |
| 40 to 44 Minutes | 0 (0.0%) | 10 (1.3%) |
| 45 to 59 Minutes | 0 (0.0%) | 0 (0.0%) |
| 60 to 89 Minutes | 39 (4.3%) | 6 (0.8%) |
| 90 or more Minutes | 20 (2.2%) | 0 (0.0%) |
Time of Departure to Work by Sex in Farley
The most frequent times of departure to work in Farley are 6:00 AM to 6:29 AM (142, 15.7%) for males and 12:00 PM to 3:59 PM (121, 16.2%) for females.
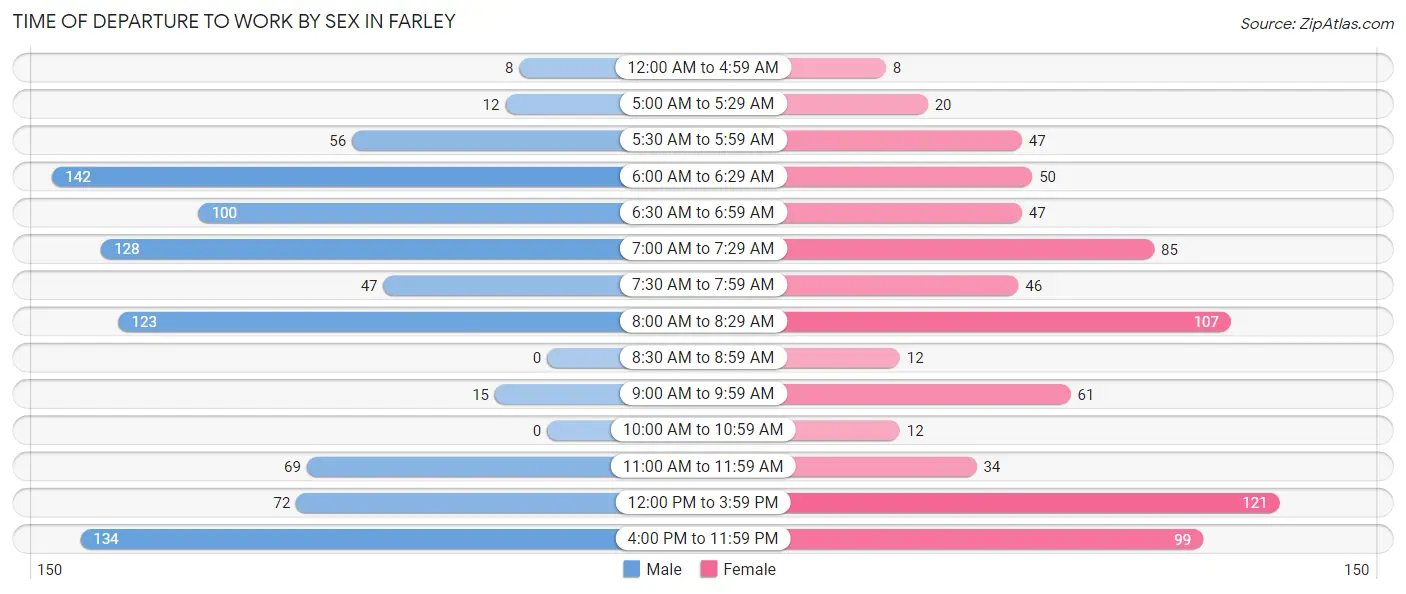
| Time of Departure | Male | Female |
| 12:00 AM to 4:59 AM | 8 (0.9%) | 8 (1.1%) |
| 5:00 AM to 5:29 AM | 12 (1.3%) | 20 (2.7%) |
| 5:30 AM to 5:59 AM | 56 (6.2%) | 47 (6.3%) |
| 6:00 AM to 6:29 AM | 142 (15.7%) | 50 (6.7%) |
| 6:30 AM to 6:59 AM | 100 (11.0%) | 47 (6.3%) |
| 7:00 AM to 7:29 AM | 128 (14.1%) | 85 (11.4%) |
| 7:30 AM to 7:59 AM | 47 (5.2%) | 46 (6.1%) |
| 8:00 AM to 8:29 AM | 123 (13.6%) | 107 (14.3%) |
| 8:30 AM to 8:59 AM | 0 (0.0%) | 12 (1.6%) |
| 9:00 AM to 9:59 AM | 15 (1.7%) | 61 (8.1%) |
| 10:00 AM to 10:59 AM | 0 (0.0%) | 12 (1.6%) |
| 11:00 AM to 11:59 AM | 69 (7.6%) | 34 (4.5%) |
| 12:00 PM to 3:59 PM | 72 (8.0%) | 121 (16.2%) |
| 4:00 PM to 11:59 PM | 134 (14.8%) | 99 (13.2%) |
| Total | 906 (100.0%) | 749 (100.0%) |
Housing Occupancy in Farley
Occupancy by Ownership in Farley
Of the total 1,593 dwellings in Farley, owner-occupied units account for 1,146 (71.9%), while renter-occupied units make up 447 (28.1%).
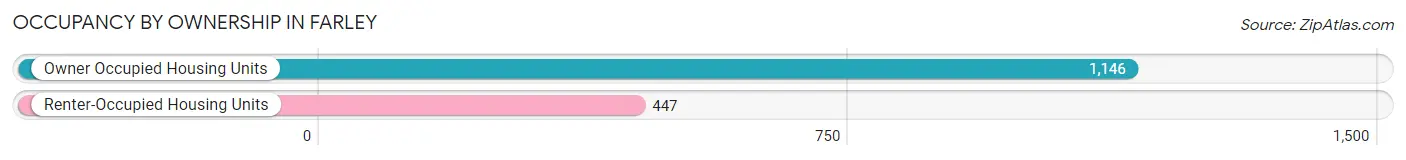
| Occupancy | # Housing Units | % Housing Units |
| Owner Occupied Housing Units | 1,146 | 71.9% |
| Renter-Occupied Housing Units | 447 | 28.1% |
| Total Occupied Housing Units | 1,593 | 100.0% |
Occupancy by Household Size in Farley
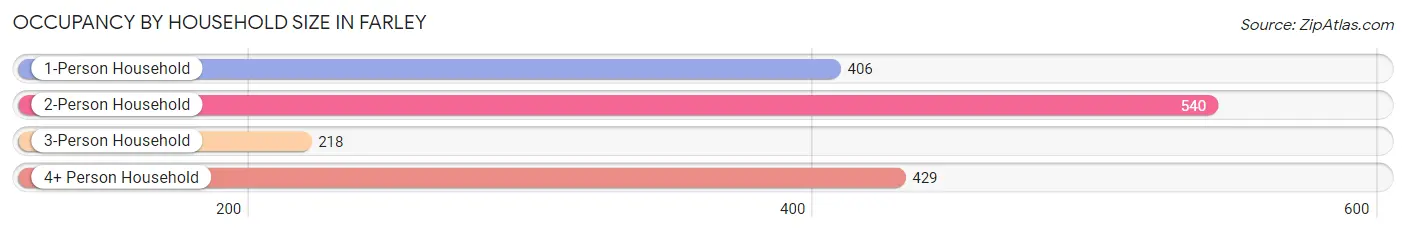
| Household Size | # Housing Units | % Housing Units |
| 1-Person Household | 406 | 25.5% |
| 2-Person Household | 540 | 33.9% |
| 3-Person Household | 218 | 13.7% |
| 4+ Person Household | 429 | 26.9% |
| Total Housing Units | 1,593 | 100.0% |
Occupancy by Ownership by Household Size in Farley
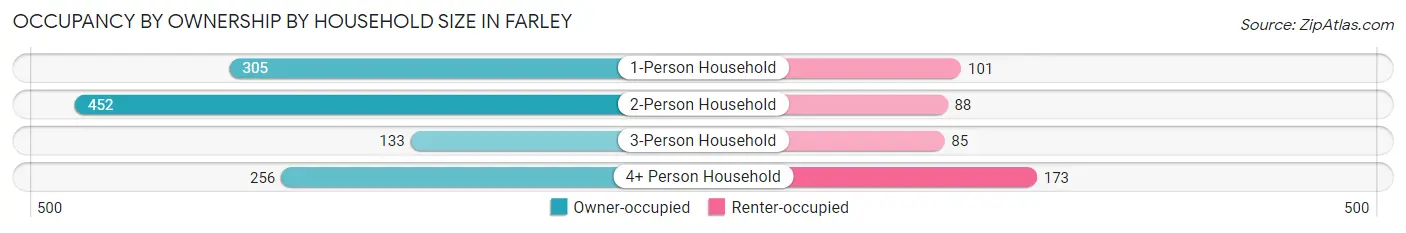
| Household Size | Owner-occupied | Renter-occupied |
| 1-Person Household | 305 (75.1%) | 101 (24.9%) |
| 2-Person Household | 452 (83.7%) | 88 (16.3%) |
| 3-Person Household | 133 (61.0%) | 85 (39.0%) |
| 4+ Person Household | 256 (59.7%) | 173 (40.3%) |
| Total Housing Units | 1,146 (71.9%) | 447 (28.1%) |
Occupancy by Educational Attainment in Farley
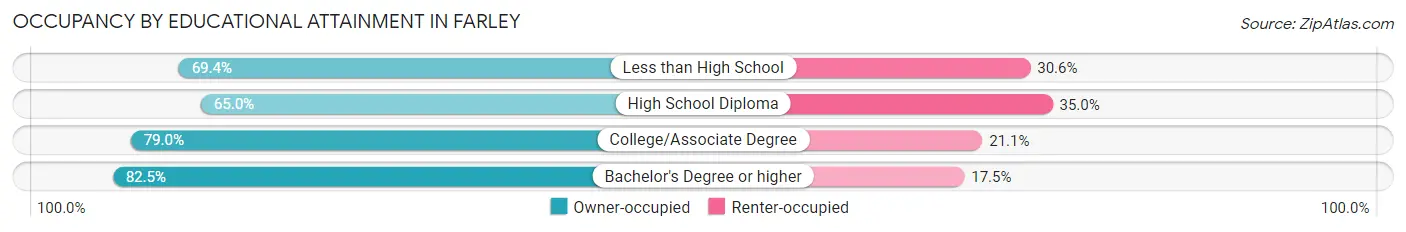
| Household Size | Owner-occupied | Renter-occupied |
| Less than High School | 150 (69.4%) | 66 (30.6%) |
| High School Diploma | 454 (65.0%) | 244 (35.0%) |
| College/Associate Degree | 405 (78.9%) | 108 (21.0%) |
| Bachelor's Degree or higher | 137 (82.5%) | 29 (17.5%) |
Occupancy by Age of Householder in Farley
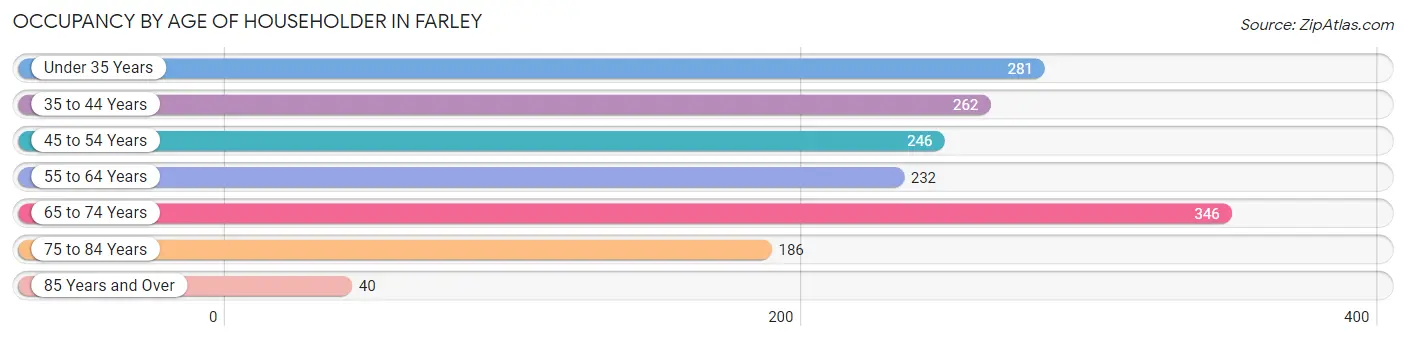
| Age Bracket | # Households | % Households |
| Under 35 Years | 281 | 17.6% |
| 35 to 44 Years | 262 | 16.5% |
| 45 to 54 Years | 246 | 15.4% |
| 55 to 64 Years | 232 | 14.6% |
| 65 to 74 Years | 346 | 21.7% |
| 75 to 84 Years | 186 | 11.7% |
| 85 Years and Over | 40 | 2.5% |
| Total | 1,593 | 100.0% |
Housing Finances in Farley
Median Income by Occupancy in Farley
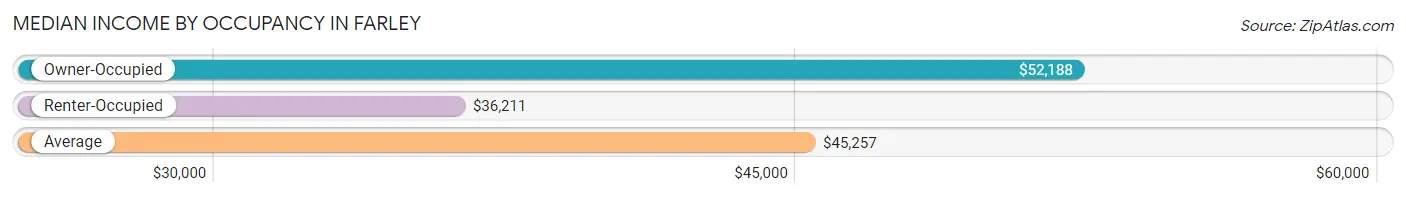
| Occupancy Type | # Households | Median Income |
| Owner-Occupied | 1,146 (71.9%) | $52,188 |
| Renter-Occupied | 447 (28.1%) | $36,211 |
| Average | 1,593 (100.0%) | $45,257 |
Occupancy by Householder Income Bracket in Farley
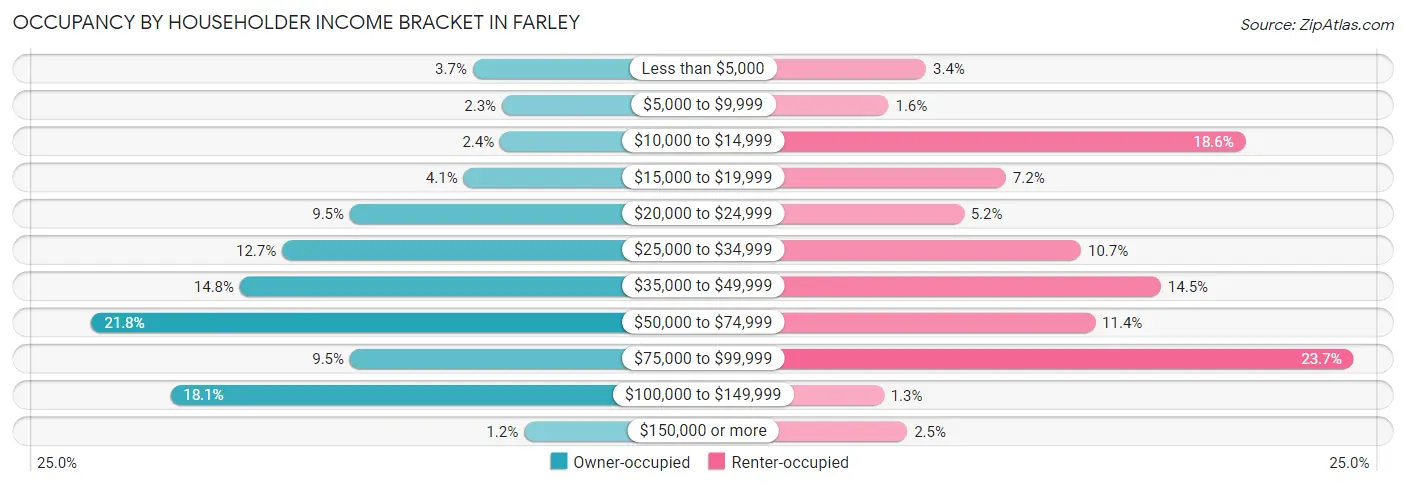
| Income Bracket | Owner-occupied | Renter-occupied |
| Less than $5,000 | 42 (3.7%) | 15 (3.4%) |
| $5,000 to $9,999 | 26 (2.3%) | 7 (1.6%) |
| $10,000 to $14,999 | 27 (2.4%) | 83 (18.6%) |
| $15,000 to $19,999 | 47 (4.1%) | 32 (7.2%) |
| $20,000 to $24,999 | 109 (9.5%) | 23 (5.1%) |
| $25,000 to $34,999 | 146 (12.7%) | 48 (10.7%) |
| $35,000 to $49,999 | 169 (14.7%) | 65 (14.5%) |
| $50,000 to $74,999 | 250 (21.8%) | 51 (11.4%) |
| $75,000 to $99,999 | 109 (9.5%) | 106 (23.7%) |
| $100,000 to $149,999 | 207 (18.1%) | 6 (1.3%) |
| $150,000 or more | 14 (1.2%) | 11 (2.5%) |
| Total | 1,146 (100.0%) | 447 (100.0%) |
Monthly Housing Cost Tiers in Farley
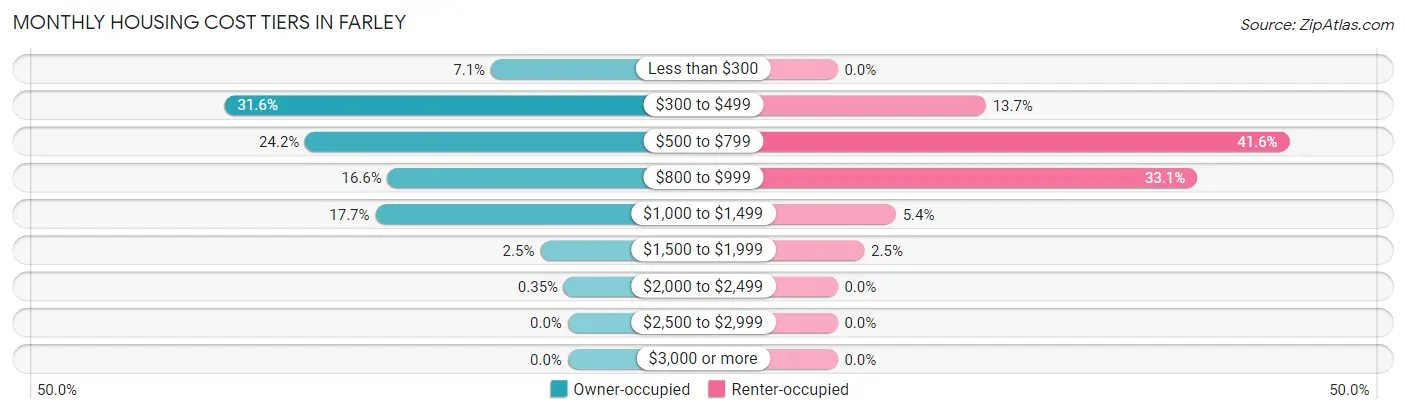
| Monthly Cost | Owner-occupied | Renter-occupied |
| Less than $300 | 81 (7.1%) | 0 (0.0%) |
| $300 to $499 | 362 (31.6%) | 61 (13.7%) |
| $500 to $799 | 277 (24.2%) | 186 (41.6%) |
| $800 to $999 | 190 (16.6%) | 148 (33.1%) |
| $1,000 to $1,499 | 203 (17.7%) | 24 (5.4%) |
| $1,500 to $1,999 | 29 (2.5%) | 11 (2.5%) |
| $2,000 to $2,499 | 4 (0.4%) | 0 (0.0%) |
| $2,500 to $2,999 | 0 (0.0%) | 0 (0.0%) |
| $3,000 or more | 0 (0.0%) | 0 (0.0%) |
| Total | 1,146 (100.0%) | 447 (100.0%) |
Physical Housing Characteristics in Farley
Housing Structures in Farley
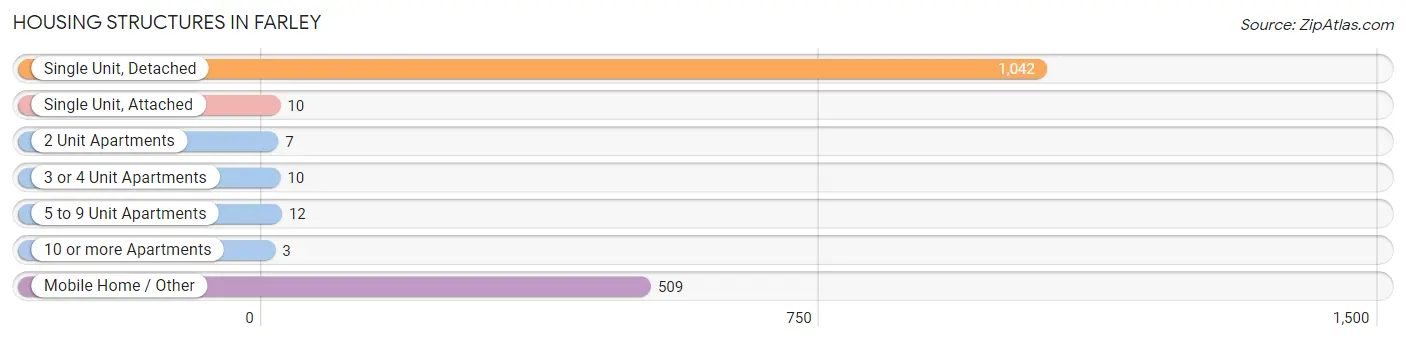
| Structure Type | # Housing Units | % Housing Units |
| Single Unit, Detached | 1,042 | 65.4% |
| Single Unit, Attached | 10 | 0.6% |
| 2 Unit Apartments | 7 | 0.4% |
| 3 or 4 Unit Apartments | 10 | 0.6% |
| 5 to 9 Unit Apartments | 12 | 0.7% |
| 10 or more Apartments | 3 | 0.2% |
| Mobile Home / Other | 509 | 32.0% |
| Total | 1,593 | 100.0% |
Housing Structures by Occupancy in Farley
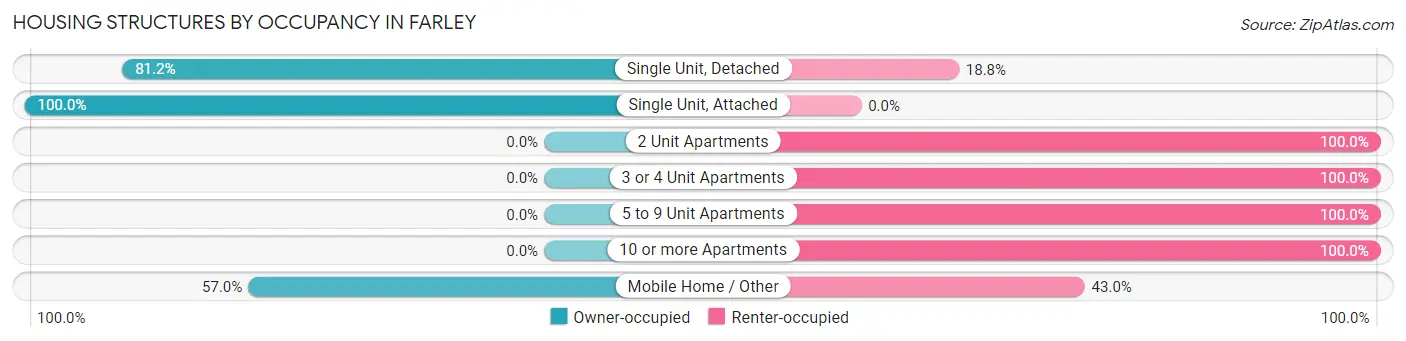
| Structure Type | Owner-occupied | Renter-occupied |
| Single Unit, Detached | 846 (81.2%) | 196 (18.8%) |
| Single Unit, Attached | 10 (100.0%) | 0 (0.0%) |
| 2 Unit Apartments | 0 (0.0%) | 7 (100.0%) |
| 3 or 4 Unit Apartments | 0 (0.0%) | 10 (100.0%) |
| 5 to 9 Unit Apartments | 0 (0.0%) | 12 (100.0%) |
| 10 or more Apartments | 0 (0.0%) | 3 (100.0%) |
| Mobile Home / Other | 290 (57.0%) | 219 (43.0%) |
| Total | 1,146 (71.9%) | 447 (28.1%) |
Housing Structures by Number of Rooms in Farley
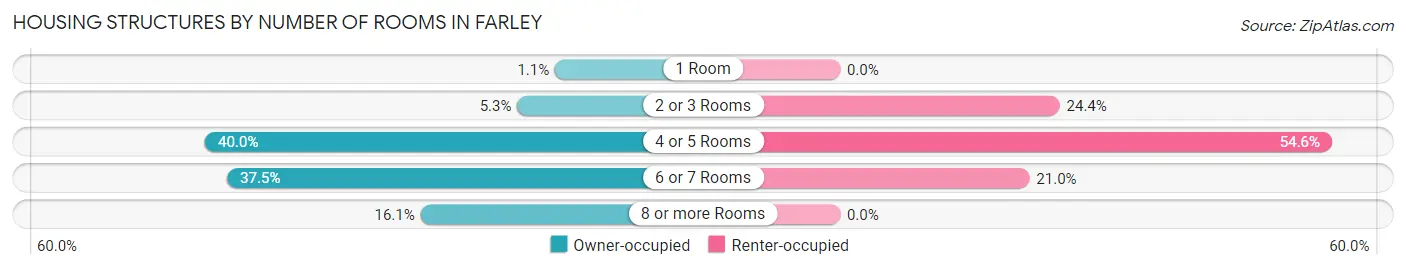
| Number of Rooms | Owner-occupied | Renter-occupied |
| 1 Room | 13 (1.1%) | 0 (0.0%) |
| 2 or 3 Rooms | 61 (5.3%) | 109 (24.4%) |
| 4 or 5 Rooms | 458 (40.0%) | 244 (54.6%) |
| 6 or 7 Rooms | 430 (37.5%) | 94 (21.0%) |
| 8 or more Rooms | 184 (16.1%) | 0 (0.0%) |
| Total | 1,146 (100.0%) | 447 (100.0%) |
Housing Structure by Heating Type in Farley
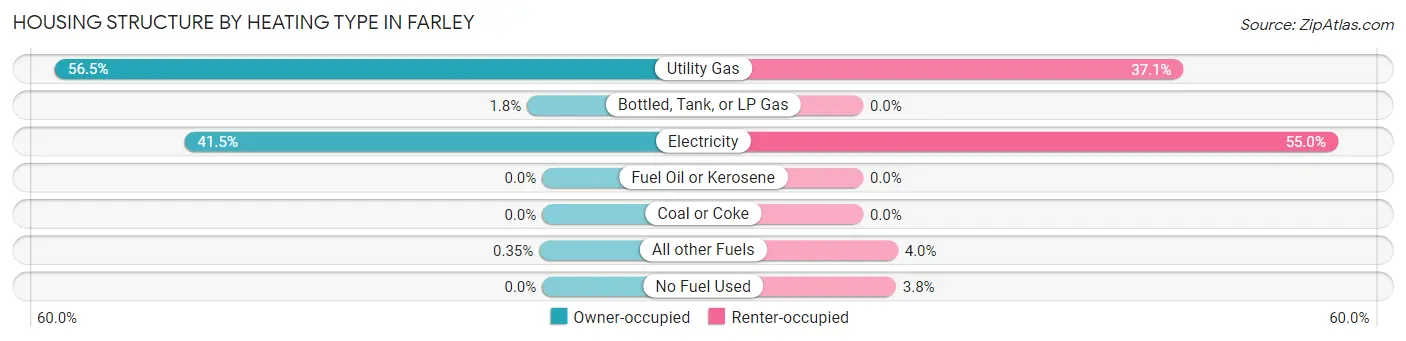
| Heating Type | Owner-occupied | Renter-occupied |
| Utility Gas | 647 (56.5%) | 166 (37.1%) |
| Bottled, Tank, or LP Gas | 20 (1.8%) | 0 (0.0%) |
| Electricity | 475 (41.4%) | 246 (55.0%) |
| Fuel Oil or Kerosene | 0 (0.0%) | 0 (0.0%) |
| Coal or Coke | 0 (0.0%) | 0 (0.0%) |
| All other Fuels | 4 (0.4%) | 18 (4.0%) |
| No Fuel Used | 0 (0.0%) | 17 (3.8%) |
| Total | 1,146 (100.0%) | 447 (100.0%) |
Household Vehicle Usage in Farley
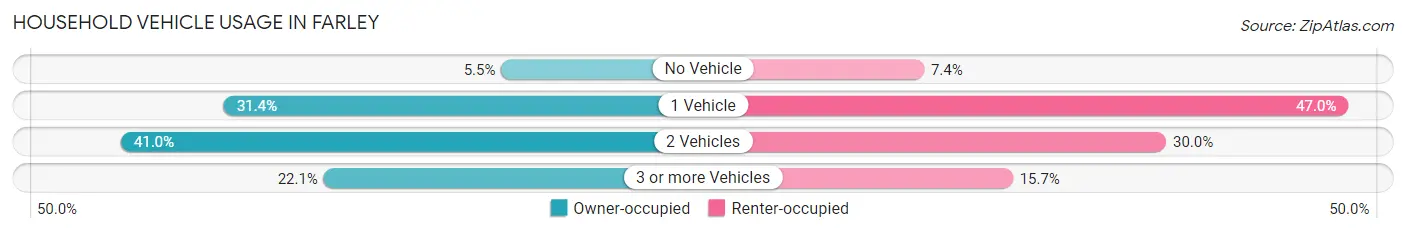
| Vehicles per Household | Owner-occupied | Renter-occupied |
| No Vehicle | 63 (5.5%) | 33 (7.4%) |
| 1 Vehicle | 360 (31.4%) | 210 (47.0%) |
| 2 Vehicles | 470 (41.0%) | 134 (30.0%) |
| 3 or more Vehicles | 253 (22.1%) | 70 (15.7%) |
| Total | 1,146 (100.0%) | 447 (100.0%) |
Real Estate & Mortgages in Farley
Real Estate and Mortgage Overview in Farley
| Characteristic | Without Mortgage | With Mortgage |
| Housing Units | 593 | 553 |
| Median Property Value | $54,100 | $94,700 |
| Median Household Income | $45,083 | $14 |
| Monthly Housing Costs | $447 | $0 |
| Real Estate Taxes | $243 | $74 |
Property Value by Mortgage Status in Farley
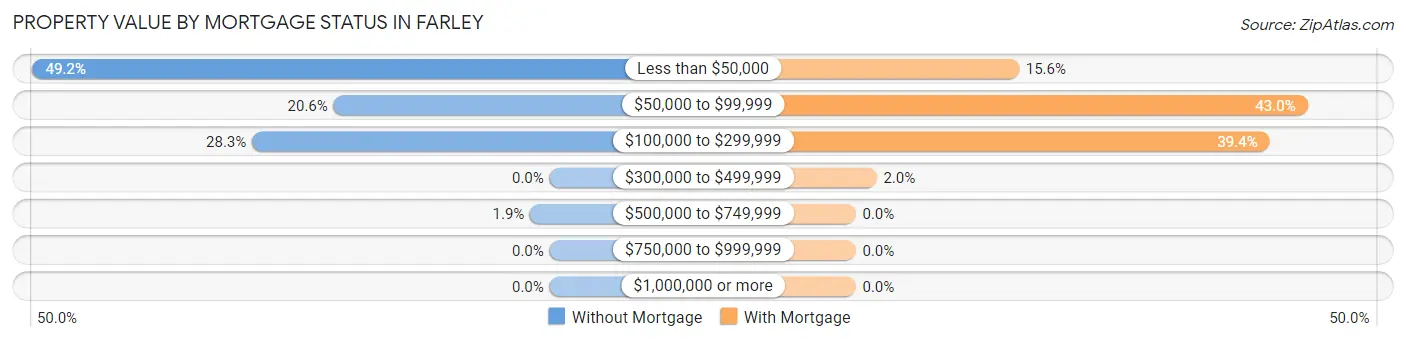
| Property Value | Without Mortgage | With Mortgage |
| Less than $50,000 | 292 (49.2%) | 86 (15.5%) |
| $50,000 to $99,999 | 122 (20.6%) | 238 (43.0%) |
| $100,000 to $299,999 | 168 (28.3%) | 218 (39.4%) |
| $300,000 to $499,999 | 0 (0.0%) | 11 (2.0%) |
| $500,000 to $749,999 | 11 (1.8%) | 0 (0.0%) |
| $750,000 to $999,999 | 0 (0.0%) | 0 (0.0%) |
| $1,000,000 or more | 0 (0.0%) | 0 (0.0%) |
| Total | 593 (100.0%) | 553 (100.0%) |
Household Income by Mortgage Status in Farley
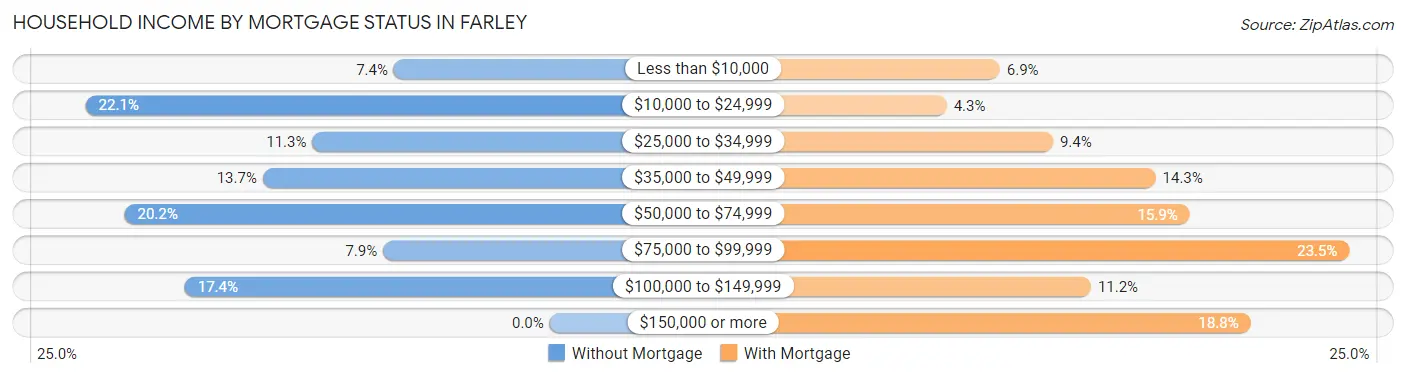
| Household Income | Without Mortgage | With Mortgage |
| Less than $10,000 | 44 (7.4%) | 38 (6.9%) |
| $10,000 to $24,999 | 131 (22.1%) | 24 (4.3%) |
| $25,000 to $34,999 | 67 (11.3%) | 52 (9.4%) |
| $35,000 to $49,999 | 81 (13.7%) | 79 (14.3%) |
| $50,000 to $74,999 | 120 (20.2%) | 88 (15.9%) |
| $75,000 to $99,999 | 47 (7.9%) | 130 (23.5%) |
| $100,000 to $149,999 | 103 (17.4%) | 62 (11.2%) |
| $150,000 or more | 0 (0.0%) | 104 (18.8%) |
| Total | 593 (100.0%) | 553 (100.0%) |
Property Value to Household Income Ratio in Farley
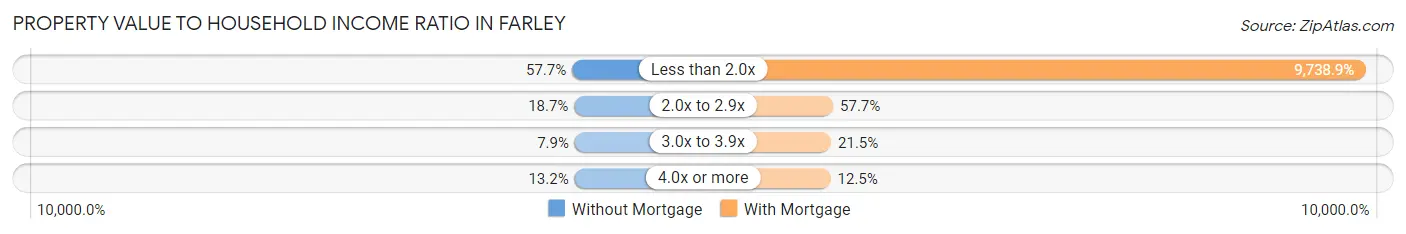
| Value-to-Income Ratio | Without Mortgage | With Mortgage |
| Less than 2.0x | 342 (57.7%) | 53,856 (9,738.9%) |
| 2.0x to 2.9x | 111 (18.7%) | 319 (57.7%) |
| 3.0x to 3.9x | 47 (7.9%) | 119 (21.5%) |
| 4.0x or more | 78 (13.2%) | 69 (12.5%) |
| Total | 593 (100.0%) | 553 (100.0%) |
Real Estate Taxes by Mortgage Status in Farley
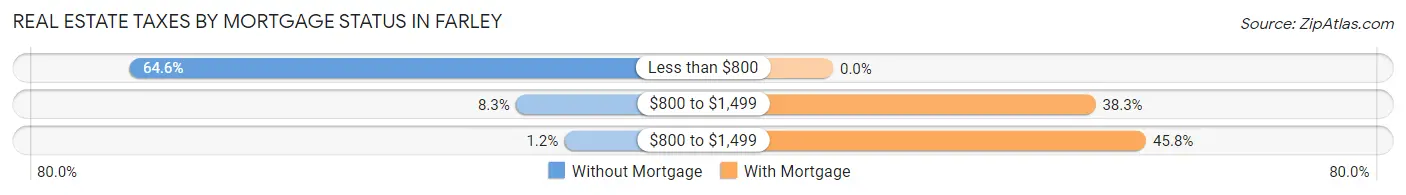
| Property Taxes | Without Mortgage | With Mortgage |
| Less than $800 | 383 (64.6%) | 0 (0.0%) |
| $800 to $1,499 | 49 (8.3%) | 212 (38.3%) |
| $800 to $1,499 | 7 (1.2%) | 253 (45.8%) |
| Total | 593 (100.0%) | 553 (100.0%) |
Health & Disability in Farley
Health Insurance Coverage by Age in Farley
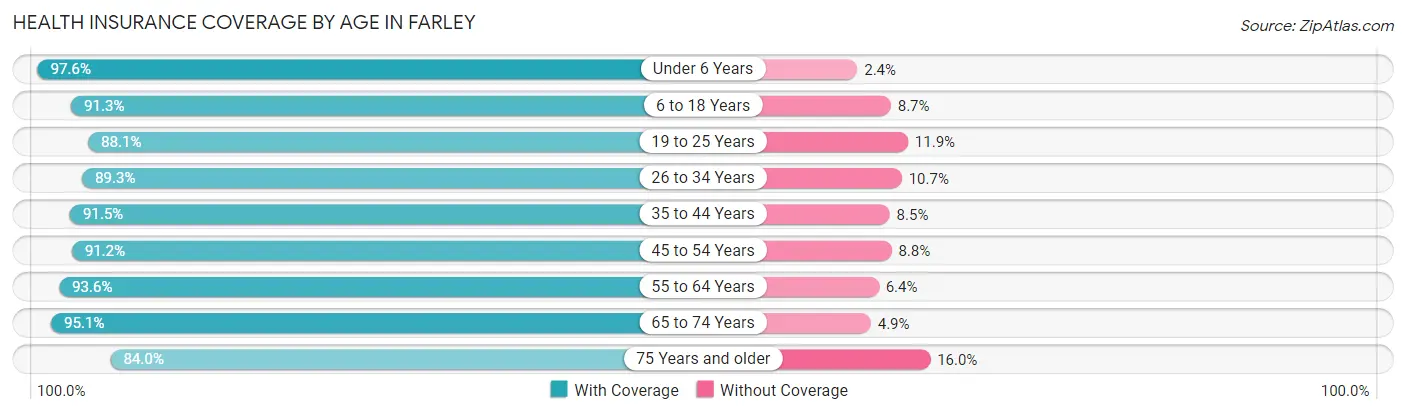
| Age Bracket | With Coverage | Without Coverage |
| Under 6 Years | 403 (97.6%) | 10 (2.4%) |
| 6 to 18 Years | 748 (91.3%) | 71 (8.7%) |
| 19 to 25 Years | 223 (88.1%) | 30 (11.9%) |
| 26 to 34 Years | 567 (89.3%) | 68 (10.7%) |
| 35 to 44 Years | 530 (91.5%) | 49 (8.5%) |
| 45 to 54 Years | 508 (91.2%) | 49 (8.8%) |
| 55 to 64 Years | 350 (93.6%) | 24 (6.4%) |
| 65 to 74 Years | 539 (95.1%) | 28 (4.9%) |
| 75 Years and older | 304 (84.0%) | 58 (16.0%) |
| Total | 4,172 (91.5%) | 387 (8.5%) |
Health Insurance Coverage by Citizenship Status in Farley
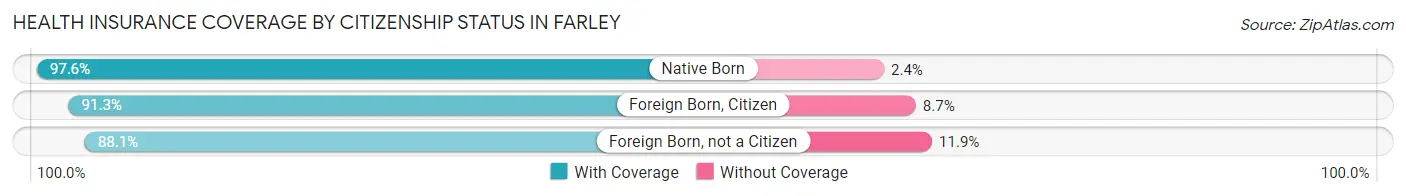
| Citizenship Status | With Coverage | Without Coverage |
| Native Born | 403 (97.6%) | 10 (2.4%) |
| Foreign Born, Citizen | 748 (91.3%) | 71 (8.7%) |
| Foreign Born, not a Citizen | 223 (88.1%) | 30 (11.9%) |
Health Insurance Coverage by Household Income in Farley
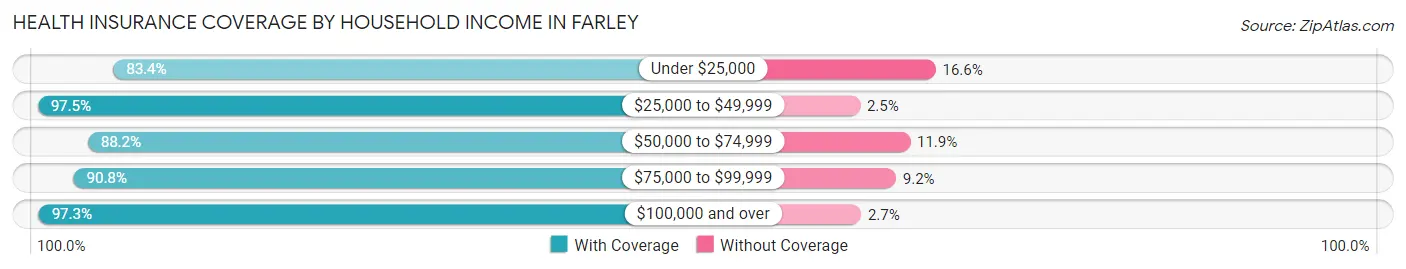
| Household Income | With Coverage | Without Coverage |
| Under $25,000 | 852 (83.4%) | 170 (16.6%) |
| $25,000 to $49,999 | 1,147 (97.5%) | 29 (2.5%) |
| $50,000 to $74,999 | 744 (88.1%) | 100 (11.8%) |
| $75,000 to $99,999 | 662 (90.8%) | 67 (9.2%) |
| $100,000 and over | 767 (97.3%) | 21 (2.7%) |
Public vs Private Health Insurance Coverage by Age in Farley
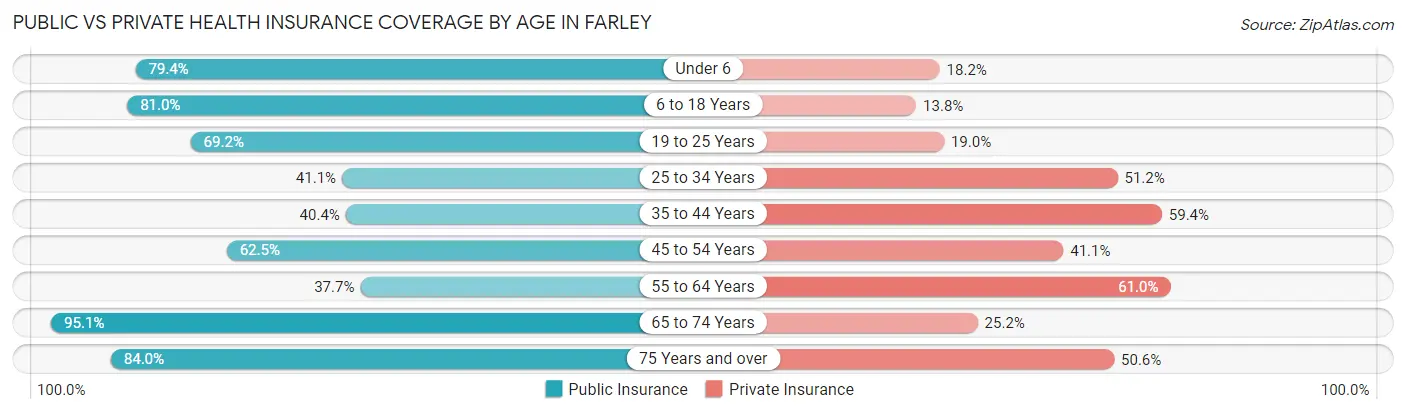
| Age Bracket | Public Insurance | Private Insurance |
| Under 6 | 328 (79.4%) | 75 (18.2%) |
| 6 to 18 Years | 663 (80.9%) | 113 (13.8%) |
| 19 to 25 Years | 175 (69.2%) | 48 (19.0%) |
| 25 to 34 Years | 261 (41.1%) | 325 (51.2%) |
| 35 to 44 Years | 234 (40.4%) | 344 (59.4%) |
| 45 to 54 Years | 348 (62.5%) | 229 (41.1%) |
| 55 to 64 Years | 141 (37.7%) | 228 (61.0%) |
| 65 to 74 Years | 539 (95.1%) | 143 (25.2%) |
| 75 Years and over | 304 (84.0%) | 183 (50.5%) |
| Total | 2,993 (65.6%) | 1,688 (37.0%) |
Disability Status by Sex by Age in Farley
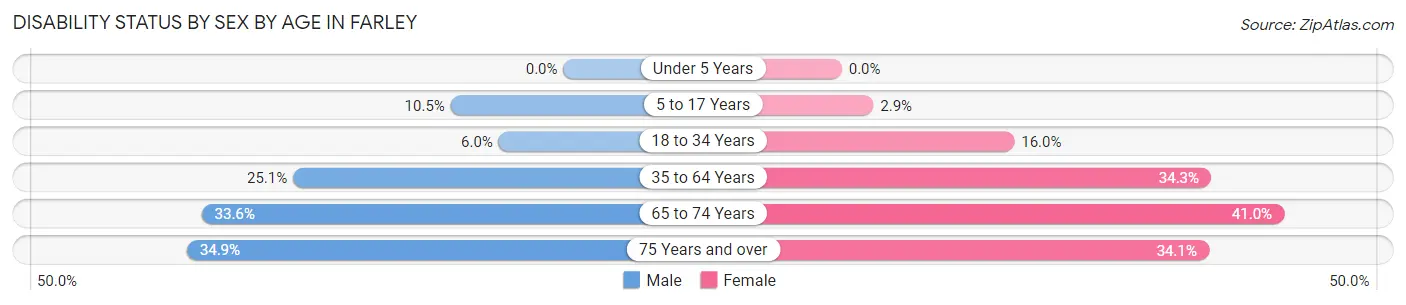
| Age Bracket | Male | Female |
| Under 5 Years | 0 (0.0%) | 0 (0.0%) |
| 5 to 17 Years | 50 (10.5%) | 12 (2.9%) |
| 18 to 34 Years | 24 (6.0%) | 86 (16.0%) |
| 35 to 64 Years | 206 (25.1%) | 236 (34.3%) |
| 65 to 74 Years | 93 (33.6%) | 119 (41.0%) |
| 75 Years and over | 29 (34.9%) | 95 (34.1%) |
Disability Class by Sex by Age in Farley
Disability Class: Hearing Difficulty
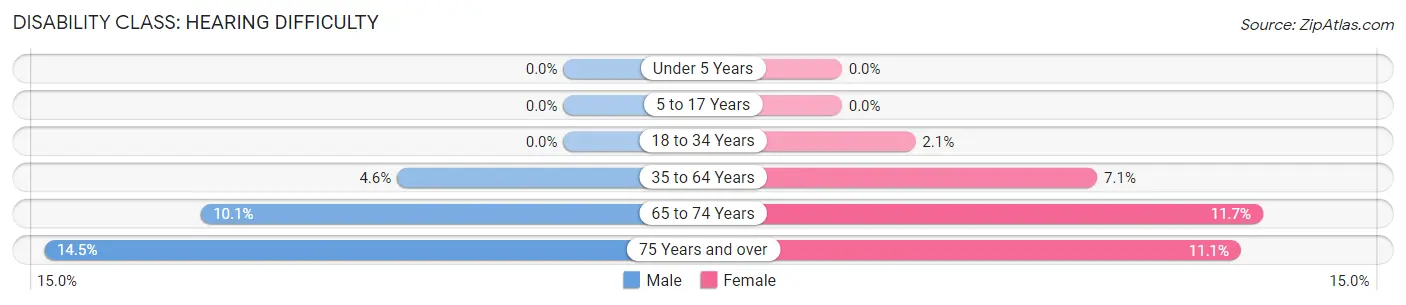
| Age Bracket | Male | Female |
| Under 5 Years | 0 (0.0%) | 0 (0.0%) |
| 5 to 17 Years | 0 (0.0%) | 0 (0.0%) |
| 18 to 34 Years | 0 (0.0%) | 11 (2.1%) |
| 35 to 64 Years | 38 (4.6%) | 49 (7.1%) |
| 65 to 74 Years | 28 (10.1%) | 34 (11.7%) |
| 75 Years and over | 12 (14.5%) | 31 (11.1%) |
Disability Class: Vision Difficulty
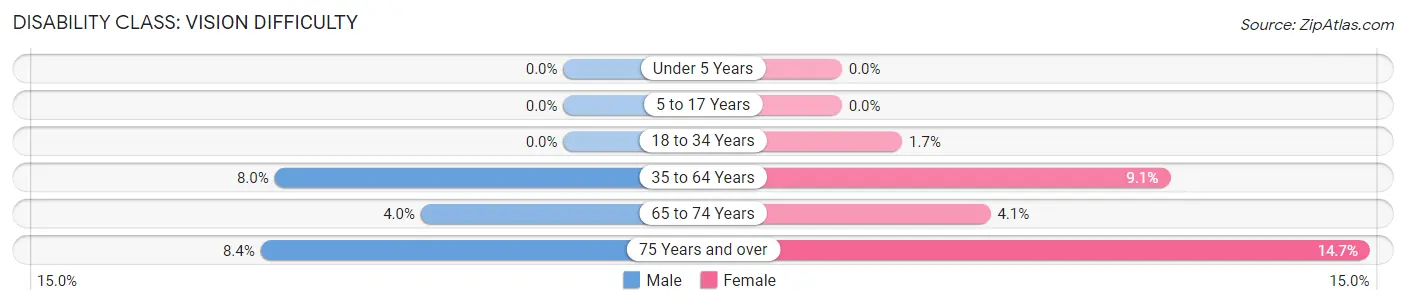
| Age Bracket | Male | Female |
| Under 5 Years | 0 (0.0%) | 0 (0.0%) |
| 5 to 17 Years | 0 (0.0%) | 0 (0.0%) |
| 18 to 34 Years | 0 (0.0%) | 9 (1.7%) |
| 35 to 64 Years | 66 (8.0%) | 63 (9.1%) |
| 65 to 74 Years | 11 (4.0%) | 12 (4.1%) |
| 75 Years and over | 7 (8.4%) | 41 (14.7%) |
Disability Class: Cognitive Difficulty
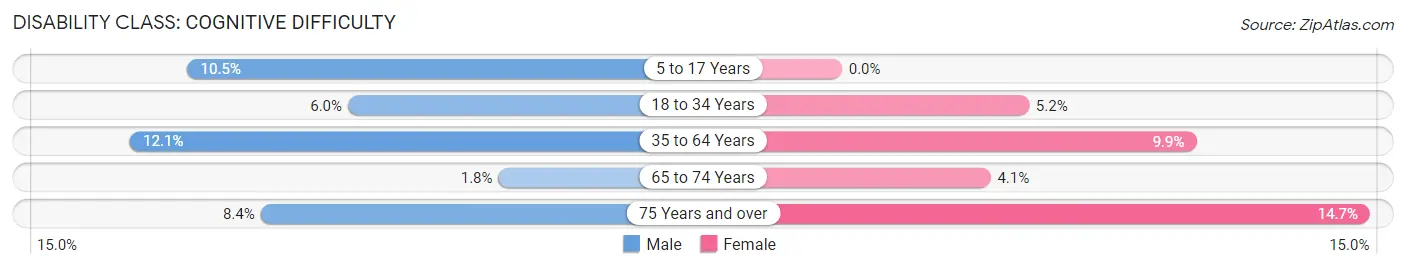
| Age Bracket | Male | Female |
| 5 to 17 Years | 50 (10.5%) | 0 (0.0%) |
| 18 to 34 Years | 24 (6.0%) | 28 (5.2%) |
| 35 to 64 Years | 99 (12.1%) | 68 (9.9%) |
| 65 to 74 Years | 5 (1.8%) | 12 (4.1%) |
| 75 Years and over | 7 (8.4%) | 41 (14.7%) |
Disability Class: Ambulatory Difficulty
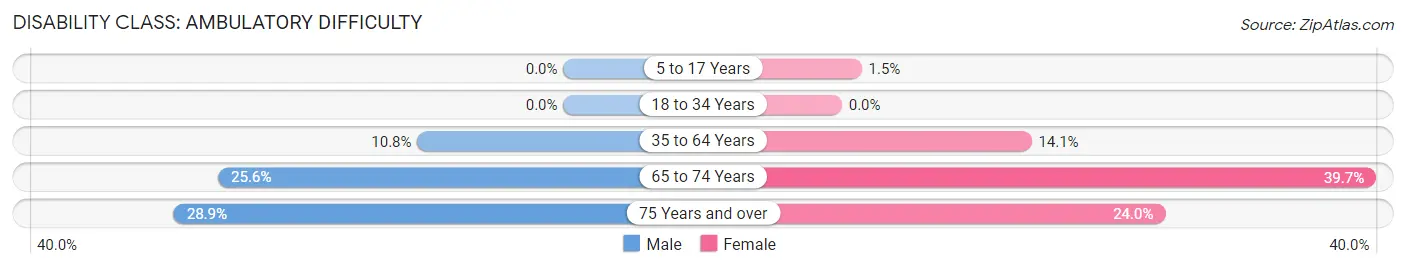
| Age Bracket | Male | Female |
| 5 to 17 Years | 0 (0.0%) | 6 (1.5%) |
| 18 to 34 Years | 0 (0.0%) | 0 (0.0%) |
| 35 to 64 Years | 89 (10.8%) | 97 (14.1%) |
| 65 to 74 Years | 71 (25.6%) | 115 (39.7%) |
| 75 Years and over | 24 (28.9%) | 67 (24.0%) |
Disability Class: Self-Care Difficulty
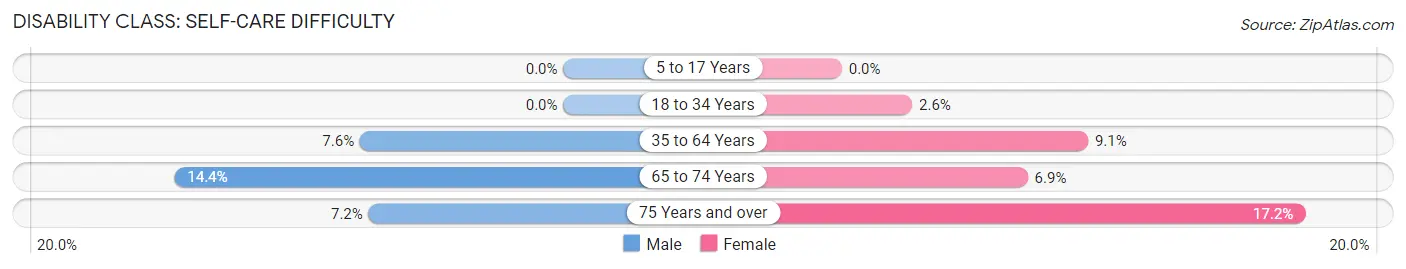
| Age Bracket | Male | Female |
| 5 to 17 Years | 0 (0.0%) | 0 (0.0%) |
| 18 to 34 Years | 0 (0.0%) | 14 (2.6%) |
| 35 to 64 Years | 62 (7.5%) | 63 (9.1%) |
| 65 to 74 Years | 40 (14.4%) | 20 (6.9%) |
| 75 Years and over | 6 (7.2%) | 48 (17.2%) |
Technology Access in Farley
Computing Device Access in Farley
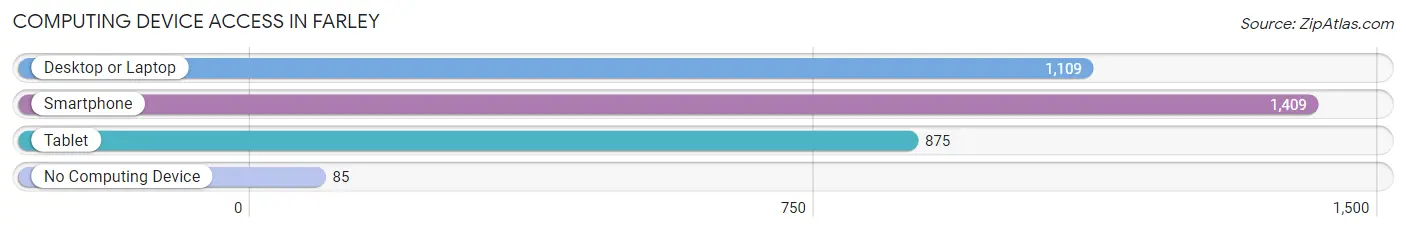
| Device Type | # Households | % Households |
| Desktop or Laptop | 1,109 | 69.6% |
| Smartphone | 1,409 | 88.4% |
| Tablet | 875 | 54.9% |
| No Computing Device | 85 | 5.3% |
| Total | 1,593 | 100.0% |
Internet Access in Farley
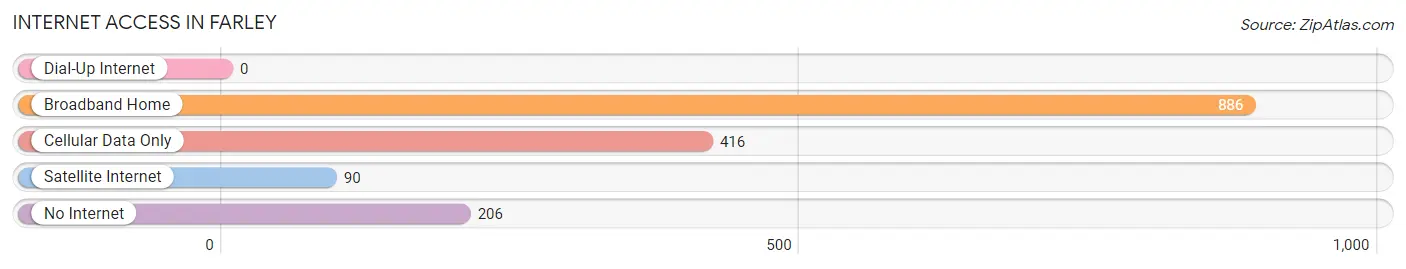
| Internet Type | # Households | % Households |
| Dial-Up Internet | 0 | 0.0% |
| Broadband Home | 886 | 55.6% |
| Cellular Data Only | 416 | 26.1% |
| Satellite Internet | 90 | 5.7% |
| No Internet | 206 | 12.9% |
| Total | 1,593 | 100.0% |
Farley Summary
Farley, Kentucky is a small unincorporated community located in the western part of the state, in the county of Ballard. It is situated on the banks of the Mississippi River, just south of the Kentucky-Tennessee border. The population of Farley was estimated to be around 200 people in 2020.
History
Farley was first settled in the early 1800s by a group of settlers from Virginia. The town was named after a local landowner, William Farley. The town was originally a small farming community, but it soon grew to become a bustling river port. The town was a major stop on the Mississippi River for steamboats and barges, and it was also a popular destination for travelers.
In the late 1800s, Farley was a major hub for the cotton industry. The town was home to several cotton mills, and it was also a major shipping point for cotton bales. The town was also home to several stores and businesses, including a hotel, a bank, and a post office.
In the early 1900s, Farley began to decline as the cotton industry moved away from the area. The town was eventually abandoned, and it remained largely uninhabited until the late 20th century.
Geography
Farley is located in the western part of Kentucky, in Ballard County. It is situated on the banks of the Mississippi River, just south of the Kentucky-Tennessee border. The town is surrounded by rolling hills and farmland, and it is located about 25 miles south of Paducah.
The climate in Farley is humid subtropical, with hot summers and mild winters. The average annual temperature is around 60 degrees Fahrenheit, and the average annual precipitation is around 45 inches.
Economy
Farley is a small, rural community with a limited economy. The town is home to a few small businesses, including a convenience store, a gas station, and a few restaurants. The town is also home to a few small farms, and it is a popular destination for hunters and fishermen.
Demographics
As of 2020, the population of Farley was estimated to be around 200 people. The town is predominantly white, with a small African American population. The median household income in Farley is around $30,000, and the median home value is around $90,000. The town has a high poverty rate, with around 25% of the population living below the poverty line.
Common Questions
What is Per Capita Income in Farley?
Per Capita income in Farley is $21,514.
What is the Median Family Income in Farley?
Median Family Income in Farley is $53,750.
What is the Median Household income in Farley?
Median Household Income in Farley is $45,257.
What is Income or Wage Gap in Farley?
Income or Wage Gap in Farley is 37.1%.
Women in Farley earn 62.9 cents for every dollar earned by a man.
What is Family Income Deficit in Farley?
Family Income Deficit in Farley is $11,056.
Families that are below poverty line in Farley earn $11,056 less on average than the poverty threshold level.
What is Inequality or Gini Index in Farley?
Inequality or Gini Index in Farley is 0.38.
What is the Total Population of Farley?
Total Population of Farley is 4,559.
What is the Total Male Population of Farley?
Total Male Population of Farley is 2,224.
What is the Total Female Population of Farley?
Total Female Population of Farley is 2,335.
What is the Ratio of Males per 100 Females in Farley?
There are 95.25 Males per 100 Females in Farley.
What is the Ratio of Females per 100 Males in Farley?
There are 104.99 Females per 100 Males in Farley.
What is the Median Population Age in Farley?
Median Population Age in Farley is 37.5 Years.
What is the Average Family Size in Farley
Average Family Size in Farley is 3.3 People.
What is the Average Household Size in Farley
Average Household Size in Farley is 2.9 People.
How Large is the Labor Force in Farley?
There are 1,829 People in the Labor Forcein in Farley.
What is the Percentage of People in the Labor Force in Farley?
51.9% of People are in the Labor Force in Farley.
What is the Unemployment Rate in Farley?
Unemployment Rate in Farley is 3.9%.