Cynthiana, KY Map & Demographics
Cynthiana Map
Cynthiana Overview
$24,324
PER CAPITA INCOME
$52,016
AVG FAMILY INCOME
$46,601
AVG HOUSEHOLD INCOME
23.6%
WAGE / INCOME GAP [ % ]
76.4¢/ $1
WAGE / INCOME GAP [ $ ]
0.44
INEQUALITY / GINI INDEX
6,355
TOTAL POPULATION
2,895
MALE POPULATION
3,460
FEMALE POPULATION
83.67
MALES / 100 FEMALES
119.52
FEMALES / 100 MALES
41.8
MEDIAN AGE
2.9
AVG FAMILY SIZE
2.4
AVG HOUSEHOLD SIZE
2,765
LABOR FORCE [ PEOPLE ]
53.9%
PERCENT IN LABOR FORCE
2.1%
UNEMPLOYMENT RATE
Cynthiana Zip Codes
Cynthiana Area Codes
Income in Cynthiana
Income Overview in Cynthiana
Per Capita Income in Cynthiana is $24,324, while median incomes of families and households are $52,016 and $46,601 respectively.
| Characteristic | Number | Measure |
| Per Capita Income | 6,355 | $24,324 |
| Median Family Income | 1,700 | $52,016 |
| Mean Family Income | 1,700 | $64,809 |
| Median Household Income | 2,544 | $46,601 |
| Mean Household Income | 2,544 | $56,606 |
| Income Deficit | 1,700 | $0 |
| Wage / Income Gap (%) | 6,355 | 23.62% |
| Wage / Income Gap ($) | 6,355 | 76.38¢ per $1 |
| Gini / Inequality Index | 6,355 | 0.44 |
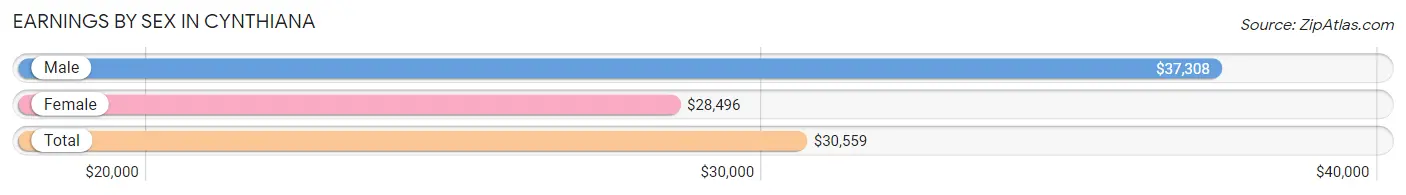
Earnings by Sex in Cynthiana
Average Earnings in Cynthiana are $30,559, $37,308 for men and $28,496 for women, a difference of 23.6%.
| Sex | Number | Average Earnings |
| Male | 1,392 (49.0%) | $37,308 |
| Female | 1,447 (51.0%) | $28,496 |
| Total | 2,839 (100.0%) | $30,559 |
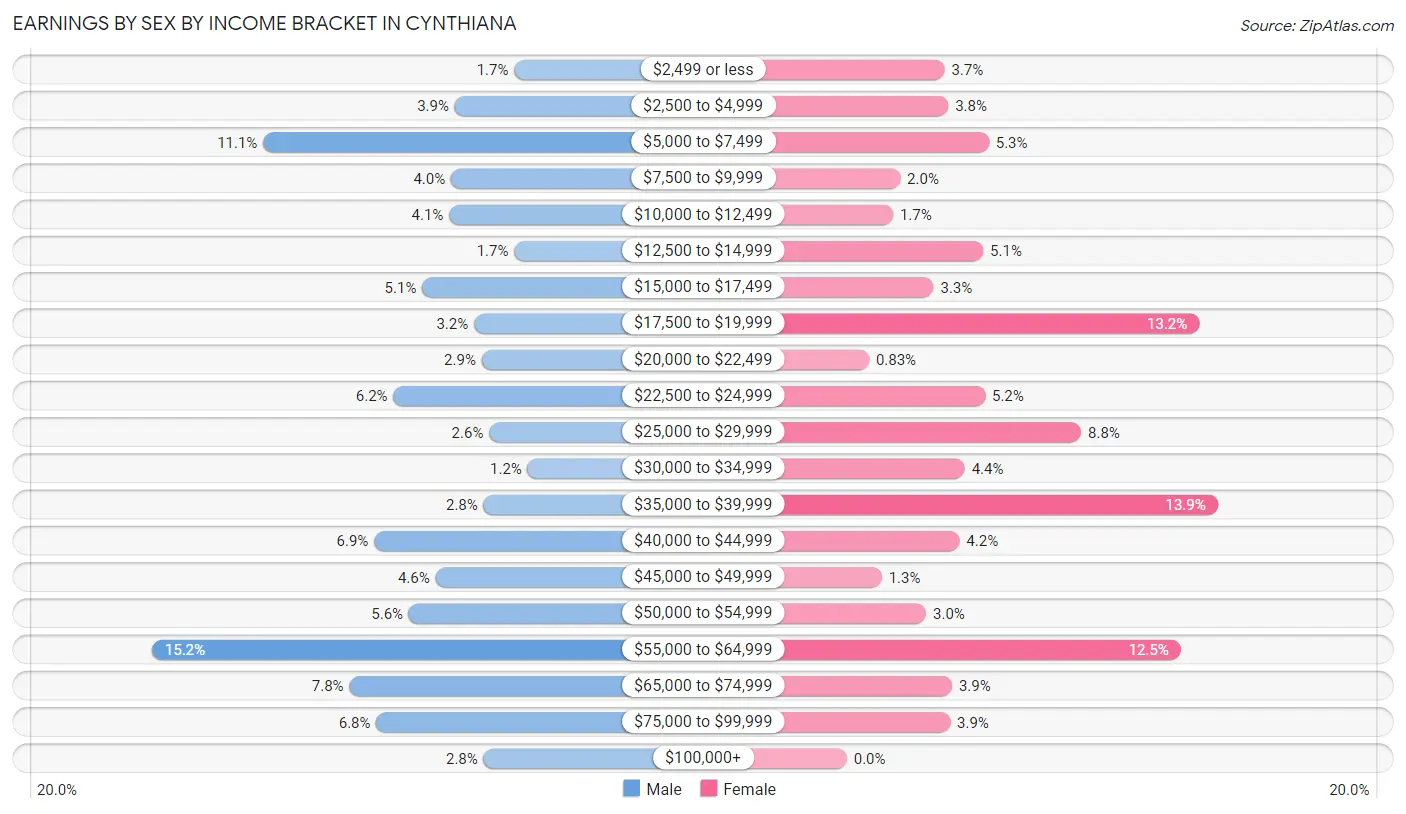
Earnings by Sex by Income Bracket in Cynthiana
The most common earnings brackets in Cynthiana are $55,000 to $64,999 for men (212 | 15.2%) and $35,000 to $39,999 for women (201 | 13.9%).
| Income | Male | Female |
| $2,499 or less | 23 (1.7%) | 53 (3.7%) |
| $2,500 to $4,999 | 54 (3.9%) | 55 (3.8%) |
| $5,000 to $7,499 | 154 (11.1%) | 77 (5.3%) |
| $7,500 to $9,999 | 56 (4.0%) | 29 (2.0%) |
| $10,000 to $12,499 | 57 (4.1%) | 25 (1.7%) |
| $12,500 to $14,999 | 23 (1.7%) | 74 (5.1%) |
| $15,000 to $17,499 | 71 (5.1%) | 47 (3.3%) |
| $17,500 to $19,999 | 44 (3.2%) | 191 (13.2%) |
| $20,000 to $22,499 | 40 (2.9%) | 12 (0.8%) |
| $22,500 to $24,999 | 86 (6.2%) | 75 (5.2%) |
| $25,000 to $29,999 | 36 (2.6%) | 127 (8.8%) |
| $30,000 to $34,999 | 16 (1.1%) | 64 (4.4%) |
| $35,000 to $39,999 | 39 (2.8%) | 201 (13.9%) |
| $40,000 to $44,999 | 96 (6.9%) | 61 (4.2%) |
| $45,000 to $49,999 | 64 (4.6%) | 19 (1.3%) |
| $50,000 to $54,999 | 78 (5.6%) | 43 (3.0%) |
| $55,000 to $64,999 | 212 (15.2%) | 181 (12.5%) |
| $65,000 to $74,999 | 109 (7.8%) | 57 (3.9%) |
| $75,000 to $99,999 | 95 (6.8%) | 56 (3.9%) |
| $100,000+ | 39 (2.8%) | 0 (0.0%) |
| Total | 1,392 (100.0%) | 1,447 (100.0%) |
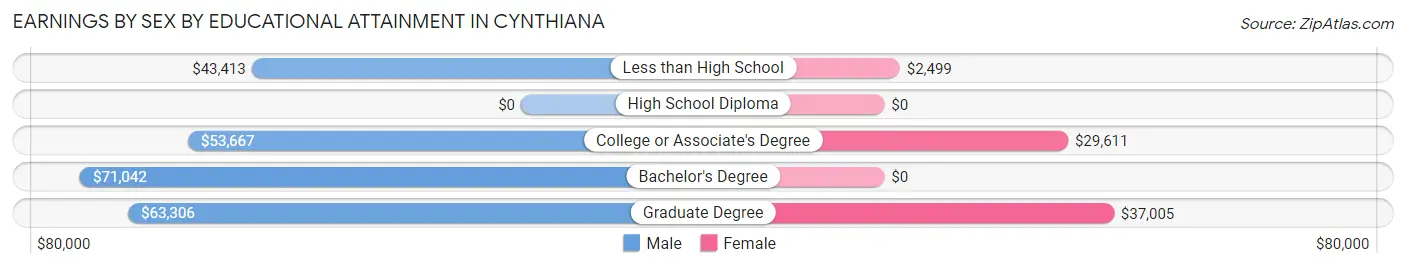
Earnings by Sex by Educational Attainment in Cynthiana
Average earnings in Cynthiana are $45,114 for men and $33,017 for women, a difference of 26.8%. Men with an educational attainment of bachelor's degree enjoy the highest average annual earnings of $71,042, while those with less than high school education earn the least with $43,413. Women with an educational attainment of graduate degree earn the most with the average annual earnings of $37,005, while those with less than high school education have the smallest earnings of $2,499.
| Educational Attainment | Male Income | Female Income |
| Less than High School | $43,413 | $2,499 |
| High School Diploma | - | - |
| College or Associate's Degree | $53,667 | $29,611 |
| Bachelor's Degree | $71,042 | $0 |
| Graduate Degree | $63,306 | $37,005 |
| Total | $45,114 | $33,017 |
Family Income in Cynthiana
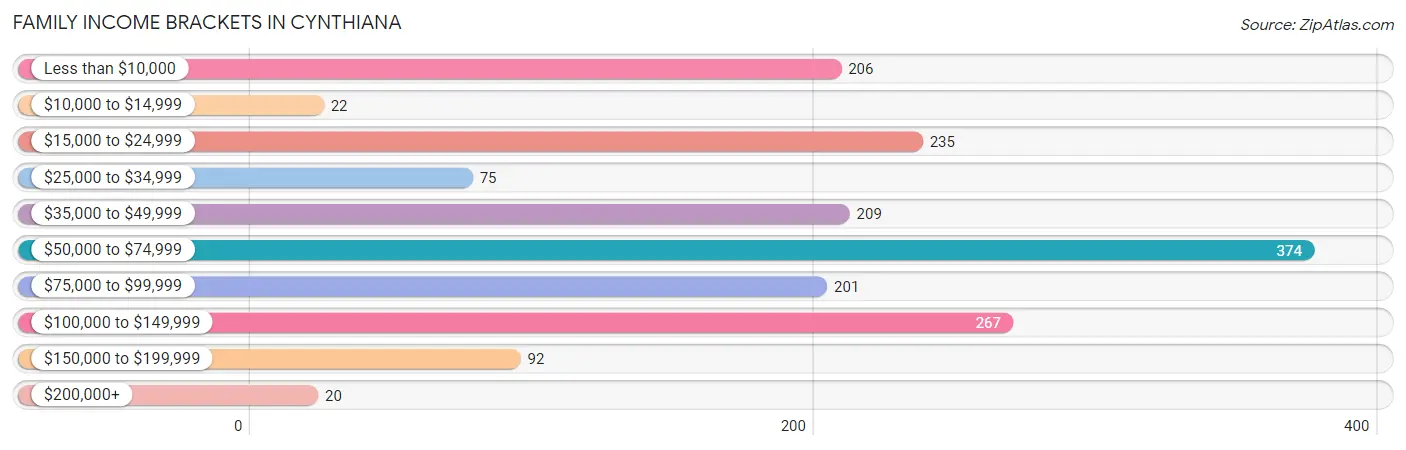
Family Income Brackets in Cynthiana
According to the Cynthiana family income data, there are 374 families falling into the $50,000 to $74,999 income range, which is the most common income bracket and makes up 22.0% of all families. Conversely, the $200,000+ income bracket is the least frequent group with only 20 families (1.2%) belonging to this category.
| Income Bracket | # Families | % Families |
| Less than $10,000 | 206 | 12.1% |
| $10,000 to $14,999 | 22 | 1.3% |
| $15,000 to $24,999 | 235 | 13.8% |
| $25,000 to $34,999 | 75 | 4.4% |
| $35,000 to $49,999 | 209 | 12.3% |
| $50,000 to $74,999 | 374 | 22.0% |
| $75,000 to $99,999 | 201 | 11.8% |
| $100,000 to $149,999 | 267 | 15.7% |
| $150,000 to $199,999 | 92 | 5.4% |
| $200,000+ | 20 | 1.2% |
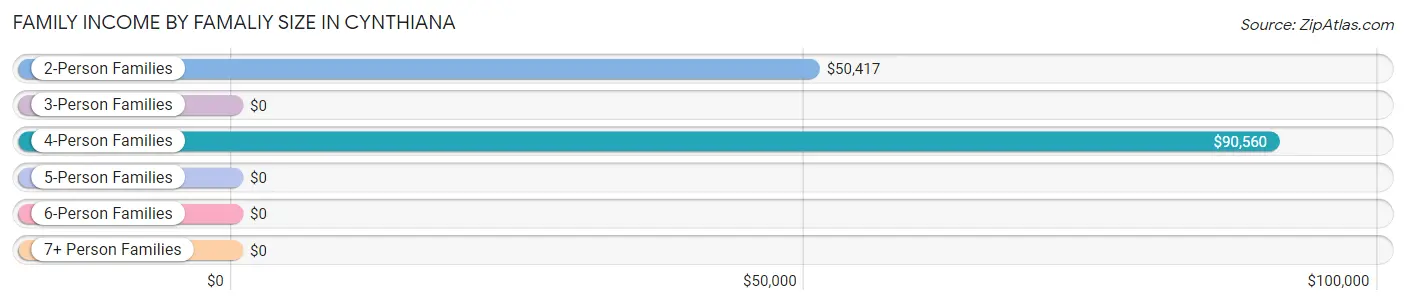
Family Income by Famaliy Size in Cynthiana
4-person families (317 | 18.6%) account for the highest median family income in Cynthiana with $90,560 per family, while 2-person families (918 | 54.0%) have the highest median income of $25,208 per family member.
| Income Bracket | # Families | Median Income |
| 2-Person Families | 918 (54.0%) | $50,417 |
| 3-Person Families | 379 (22.3%) | $0 |
| 4-Person Families | 317 (18.6%) | $90,560 |
| 5-Person Families | 69 (4.1%) | $0 |
| 6-Person Families | 0 (0.0%) | $0 |
| 7+ Person Families | 17 (1.0%) | $0 |
| Total | 1,700 (100.0%) | $52,016 |
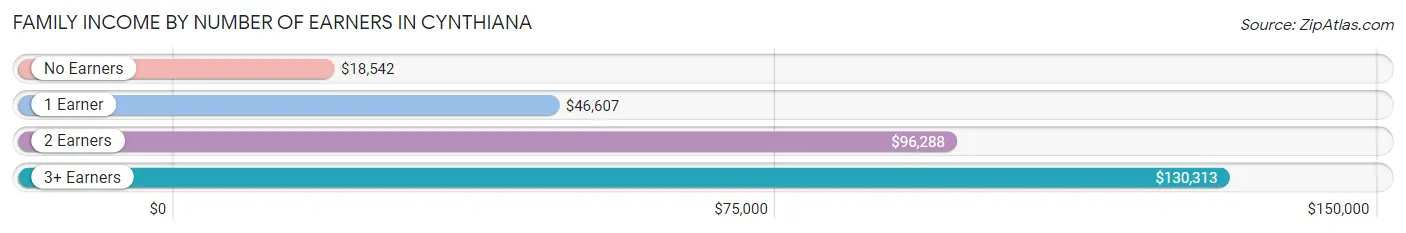
Family Income by Number of Earners in Cynthiana
The median family income in Cynthiana is $52,016, with families comprising 3+ earners (130) having the highest median family income of $130,313, while families with no earners (313) have the lowest median family income of $18,542, accounting for 7.6% and 18.4% of families, respectively.
| Number of Earners | # Families | Median Income |
| No Earners | 313 (18.4%) | $18,542 |
| 1 Earner | 813 (47.8%) | $46,607 |
| 2 Earners | 444 (26.1%) | $96,288 |
| 3+ Earners | 130 (7.6%) | $130,313 |
| Total | 1,700 (100.0%) | $52,016 |
Household Income in Cynthiana
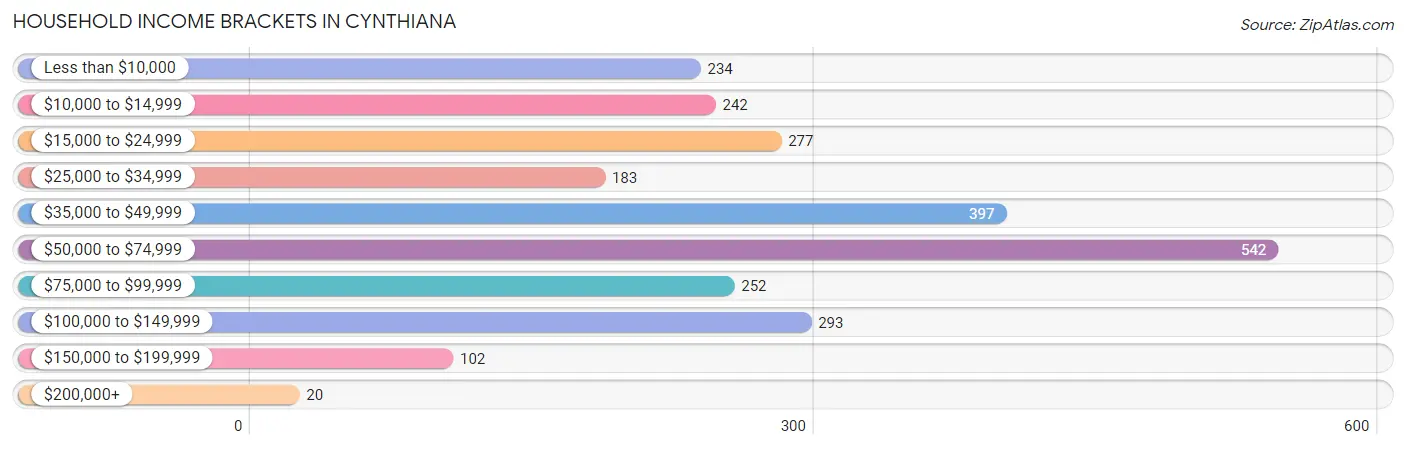
Household Income Brackets in Cynthiana
With 542 households falling in the category, the $50,000 to $74,999 income range is the most frequent in Cynthiana, accounting for 21.3% of all households. In contrast, only 20 households (0.8%) fall into the $200,000+ income bracket, making it the least populous group.
| Income Bracket | # Households | % Households |
| Less than $10,000 | 234 | 9.2% |
| $10,000 to $14,999 | 242 | 9.5% |
| $15,000 to $24,999 | 277 | 10.9% |
| $25,000 to $34,999 | 183 | 7.2% |
| $35,000 to $49,999 | 397 | 15.6% |
| $50,000 to $74,999 | 542 | 21.3% |
| $75,000 to $99,999 | 252 | 9.9% |
| $100,000 to $149,999 | 293 | 11.5% |
| $150,000 to $199,999 | 102 | 4.0% |
| $200,000+ | 20 | 0.8% |
Household Income by Householder Age in Cynthiana
The median household income in Cynthiana is $46,601, with the highest median household income of $59,000 found in the 25 to 44 years age bracket for the primary householder. A total of 698 households (27.4%) fall into this category. Meanwhile, the 15 to 24 years age bracket for the primary householder has the lowest median household income of $0, with 182 households (7.1%) in this group.
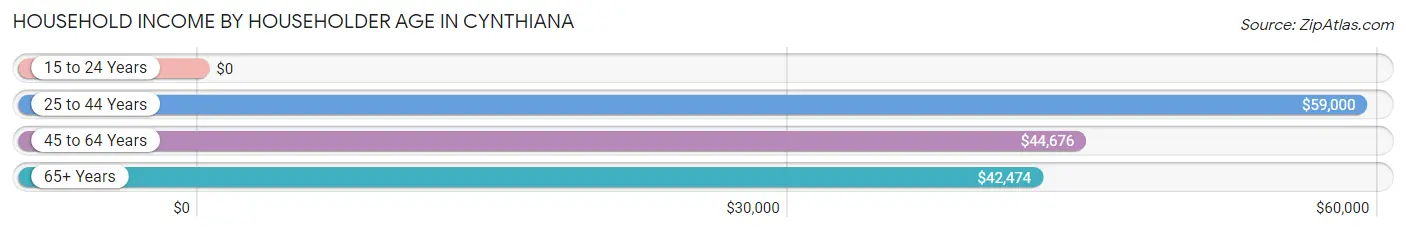
| Income Bracket | # Households | Median Income |
| 15 to 24 Years | 182 (7.1%) | $0 |
| 25 to 44 Years | 698 (27.4%) | $59,000 |
| 45 to 64 Years | 865 (34.0%) | $44,676 |
| 65+ Years | 799 (31.4%) | $42,474 |
| Total | 2,544 (100.0%) | $46,601 |
Poverty in Cynthiana
Income Below Poverty by Sex and Age in Cynthiana
With 22.7% poverty level for males and 24.2% for females among the residents of Cynthiana, 12 to 14 year old males and 5 year old females are the most vulnerable to poverty, with 123 males (62.1%) and 19 females (100.0%) in their respective age groups living below the poverty level.
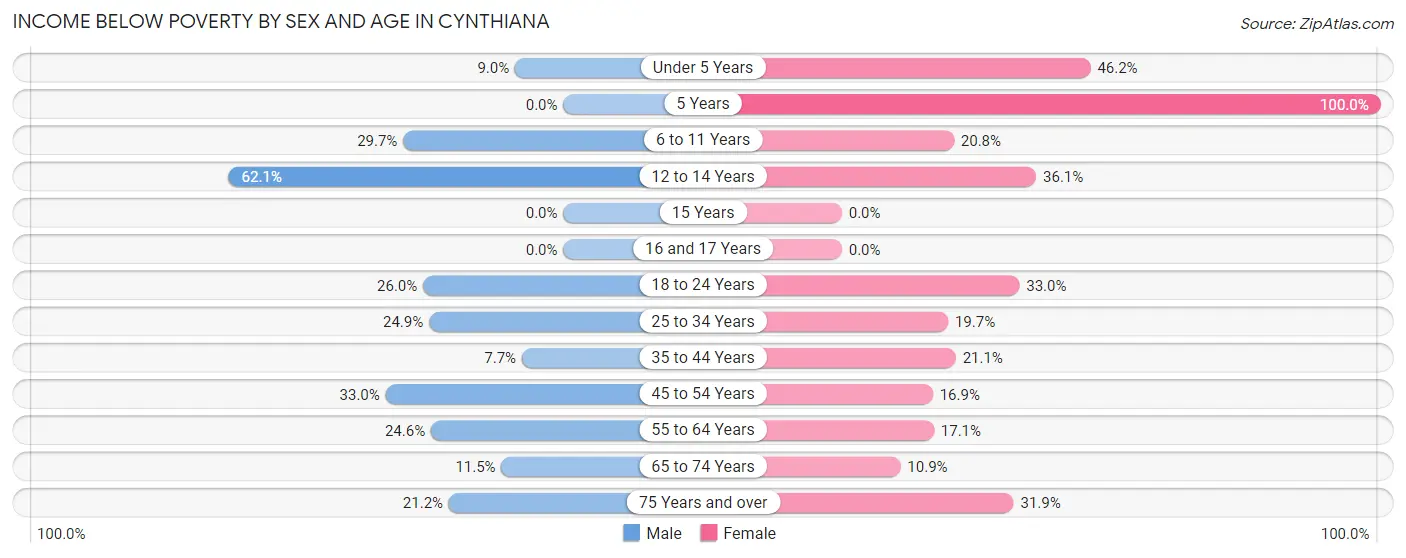
| Age Bracket | Male | Female |
| Under 5 Years | 21 (9.0%) | 132 (46.2%) |
| 5 Years | 0 (0.0%) | 19 (100.0%) |
| 6 to 11 Years | 33 (29.7%) | 47 (20.8%) |
| 12 to 14 Years | 123 (62.1%) | 44 (36.1%) |
| 15 Years | 0 (0.0%) | 0 (0.0%) |
| 16 and 17 Years | 0 (0.0%) | 0 (0.0%) |
| 18 to 24 Years | 76 (26.0%) | 114 (33.0%) |
| 25 to 34 Years | 88 (24.9%) | 82 (19.7%) |
| 35 to 44 Years | 16 (7.7%) | 67 (21.1%) |
| 45 to 54 Years | 127 (33.0%) | 67 (16.9%) |
| 55 to 64 Years | 99 (24.6%) | 101 (17.1%) |
| 65 to 74 Years | 40 (11.5%) | 32 (10.9%) |
| 75 Years and over | 24 (21.2%) | 124 (31.9%) |
| Total | 647 (22.7%) | 829 (24.2%) |
Income Above Poverty by Sex and Age in Cynthiana
According to the poverty statistics in Cynthiana, males aged 15 years and females aged 15 years are the age groups that are most secure financially, with 100.0% of males and 100.0% of females in these age groups living above the poverty line.
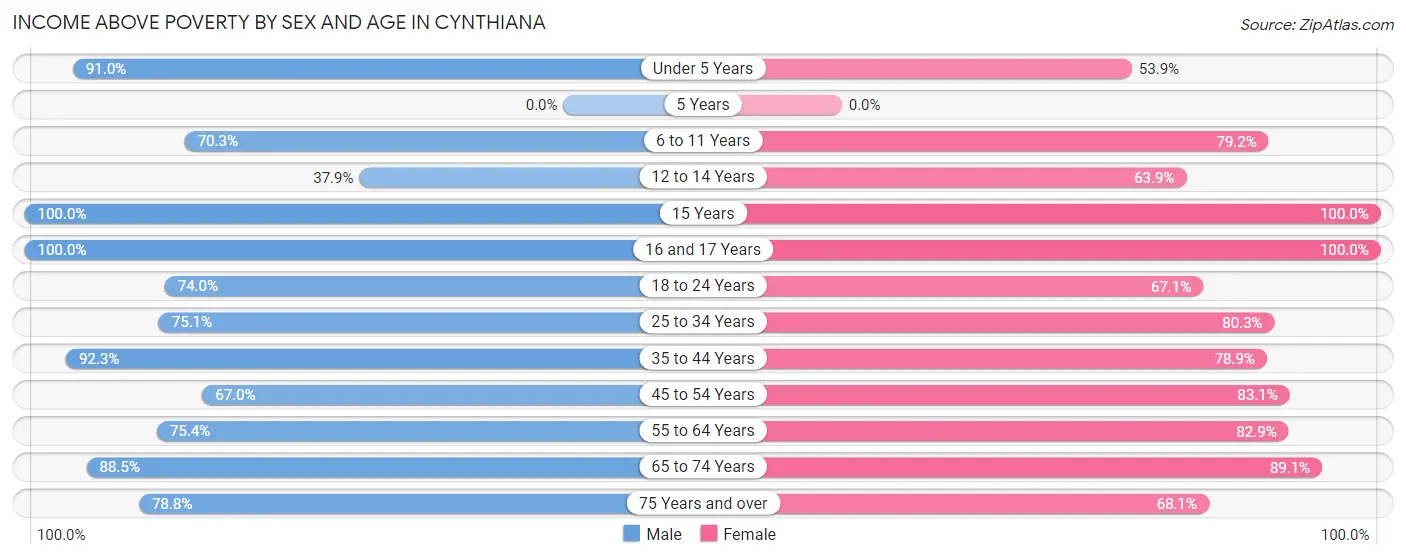
| Age Bracket | Male | Female |
| Under 5 Years | 213 (91.0%) | 154 (53.8%) |
| 5 Years | 0 (0.0%) | 0 (0.0%) |
| 6 to 11 Years | 78 (70.3%) | 179 (79.2%) |
| 12 to 14 Years | 75 (37.9%) | 78 (63.9%) |
| 15 Years | 26 (100.0%) | 4 (100.0%) |
| 16 and 17 Years | 185 (100.0%) | 22 (100.0%) |
| 18 to 24 Years | 216 (74.0%) | 232 (67.0%) |
| 25 to 34 Years | 265 (75.1%) | 334 (80.3%) |
| 35 to 44 Years | 192 (92.3%) | 250 (78.9%) |
| 45 to 54 Years | 258 (67.0%) | 330 (83.1%) |
| 55 to 64 Years | 304 (75.4%) | 490 (82.9%) |
| 65 to 74 Years | 308 (88.5%) | 262 (89.1%) |
| 75 Years and over | 89 (78.8%) | 265 (68.1%) |
| Total | 2,209 (77.3%) | 2,600 (75.8%) |
Income Below Poverty Among Married-Couple Families in Cynthiana
The poverty statistics for married-couple families in Cynthiana show that 12.6% or 136 of the total 1,077 families live below the poverty line. Families with 3 or 4 children have the highest poverty rate of 53.4%, comprising of 31 families. On the other hand, families with no children have the lowest poverty rate of 10.2%, which includes 66 families.
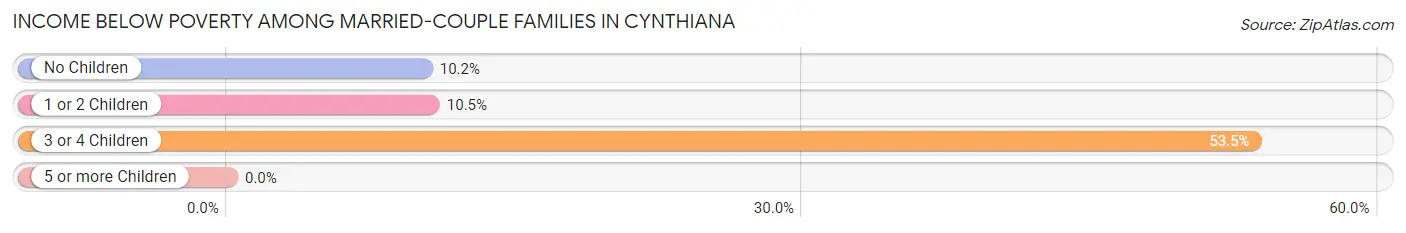
| Children | Above Poverty | Below Poverty |
| No Children | 583 (89.8%) | 66 (10.2%) |
| 1 or 2 Children | 331 (89.5%) | 39 (10.5%) |
| 3 or 4 Children | 27 (46.6%) | 31 (53.4%) |
| 5 or more Children | 0 (0.0%) | 0 (0.0%) |
| Total | 941 (87.4%) | 136 (12.6%) |
Income Below Poverty Among Single-Parent Households in Cynthiana
According to the poverty data in Cynthiana, 42.7% or 76 single-father households and 32.8% or 146 single-mother households are living below the poverty line. Among single-father households, those with 1 or 2 children have the highest poverty rate, with 76 households (44.7%) experiencing poverty. Likewise, among single-mother households, those with 3 or 4 children have the highest poverty rate, with 19 households (100.0%) falling below the poverty line.
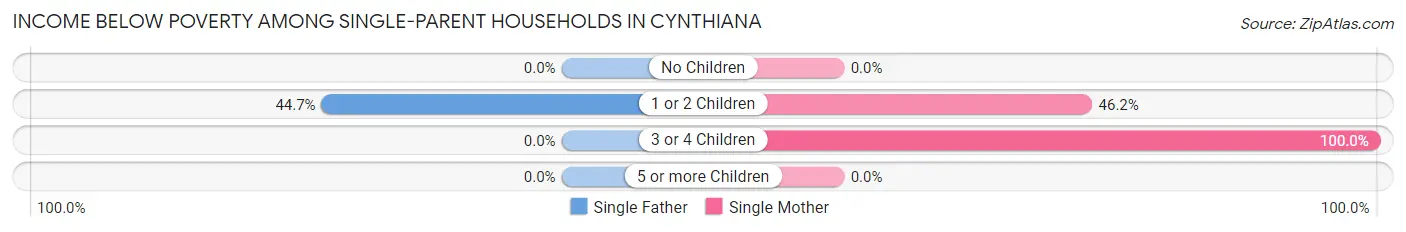
| Children | Single Father | Single Mother |
| No Children | 0 (0.0%) | 0 (0.0%) |
| 1 or 2 Children | 76 (44.7%) | 127 (46.2%) |
| 3 or 4 Children | 0 (0.0%) | 19 (100.0%) |
| 5 or more Children | 0 (0.0%) | 0 (0.0%) |
| Total | 76 (42.7%) | 146 (32.8%) |
Income Below Poverty Among Married-Couple vs Single-Parent Households in Cynthiana
The poverty data for Cynthiana shows that 136 of the married-couple family households (12.6%) and 222 of the single-parent households (35.6%) are living below the poverty level. Within the married-couple family households, those with 3 or 4 children have the highest poverty rate, with 31 households (53.4%) falling below the poverty line. Among the single-parent households, those with 3 or 4 children have the highest poverty rate, with 19 household (100.0%) living below poverty.
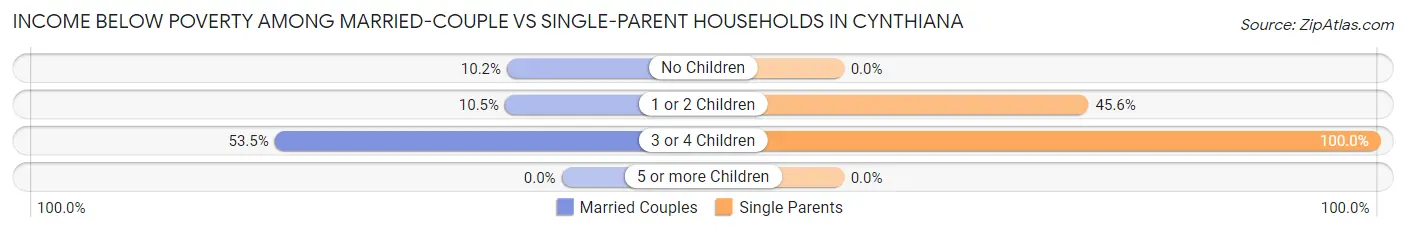
| Children | Married-Couple Families | Single-Parent Households |
| No Children | 66 (10.2%) | 0 (0.0%) |
| 1 or 2 Children | 39 (10.5%) | 203 (45.6%) |
| 3 or 4 Children | 31 (53.4%) | 19 (100.0%) |
| 5 or more Children | 0 (0.0%) | 0 (0.0%) |
| Total | 136 (12.6%) | 222 (35.6%) |
Race in Cynthiana
The most populous races in Cynthiana are White / Caucasian (5,830 | 91.7%), Two or more Races (276 | 4.3%), and Black / African American (210 | 3.3%).
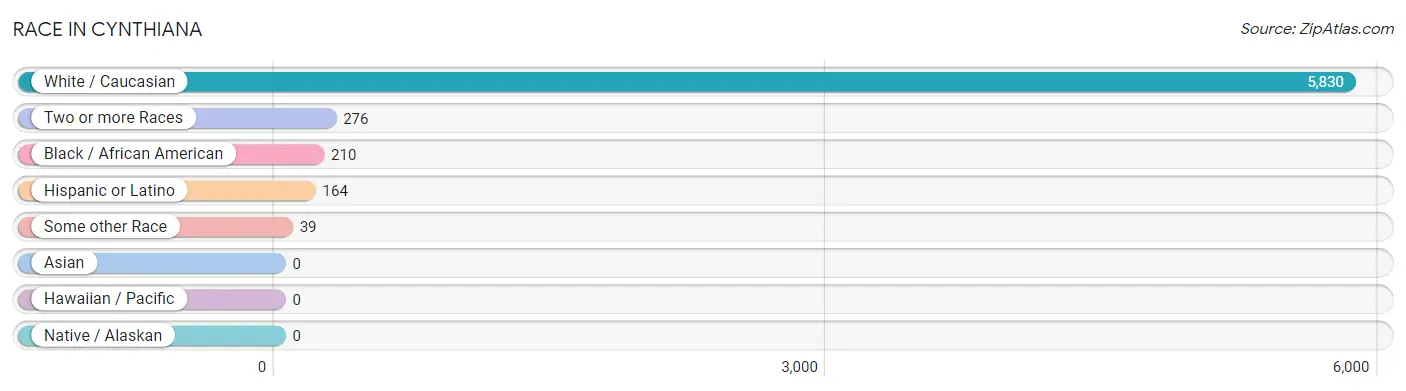
| Race | # Population | % Population |
| Asian | 0 | 0.0% |
| Black / African American | 210 | 3.3% |
| Hawaiian / Pacific | 0 | 0.0% |
| Hispanic or Latino | 164 | 2.6% |
| Native / Alaskan | 0 | 0.0% |
| White / Caucasian | 5,830 | 91.7% |
| Two or more Races | 276 | 4.3% |
| Some other Race | 39 | 0.6% |
| Total | 6,355 | 100.0% |
Ancestry in Cynthiana
The most populous ancestries reported in Cynthiana are American (1,429 | 22.5%), German (932 | 14.7%), English (736 | 11.6%), Irish (522 | 8.2%), and Scottish (151 | 2.4%), together accounting for 59.3% of all Cynthiana residents.
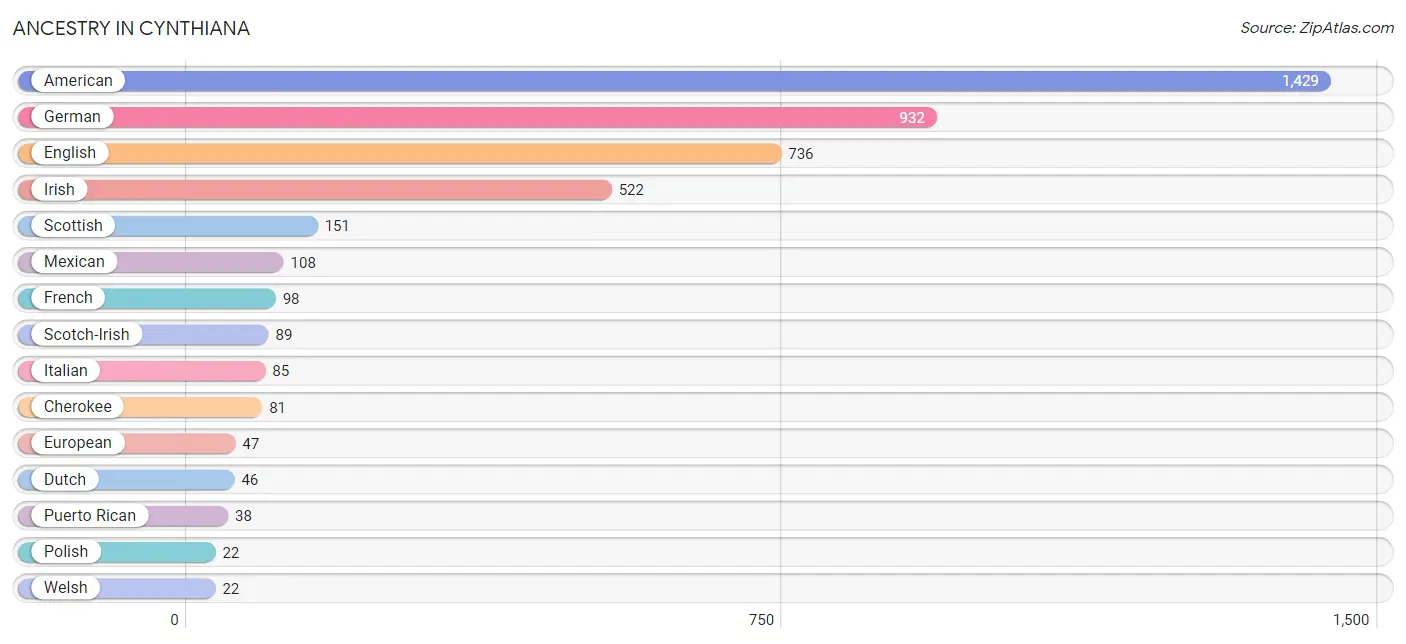
| Ancestry | # Population | % Population |
| American | 1,429 | 22.5% |
| Canadian | 8 | 0.1% |
| Cherokee | 81 | 1.3% |
| Cheyenne | 10 | 0.2% |
| Dutch | 46 | 0.7% |
| English | 736 | 11.6% |
| European | 47 | 0.7% |
| French | 98 | 1.5% |
| French Canadian | 12 | 0.2% |
| German | 932 | 14.7% |
| Irish | 522 | 8.2% |
| Italian | 85 | 1.3% |
| Mexican | 108 | 1.7% |
| Polish | 22 | 0.4% |
| Puerto Rican | 38 | 0.6% |
| Scotch-Irish | 89 | 1.4% |
| Scottish | 151 | 2.4% |
| Slovak | 13 | 0.2% |
| Welsh | 22 | 0.4% | View All 19 Rows |
Immigrants in Cynthiana
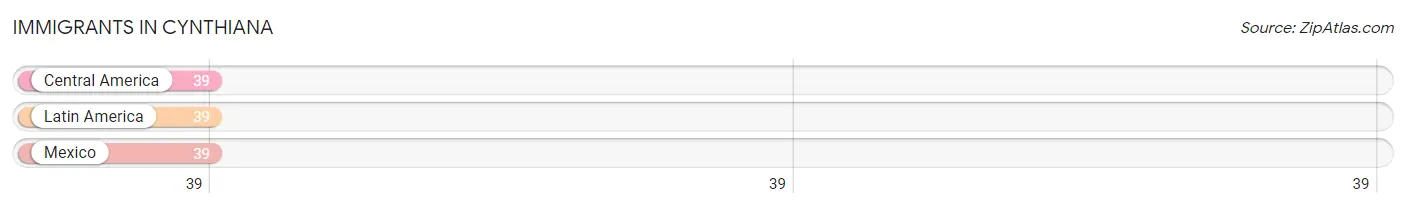
The most numerous immigrant groups reported in Cynthiana came from Central America (39 | 0.6%), Latin America (39 | 0.6%), and Mexico (39 | 0.6%), together accounting for 1.8% of all Cynthiana residents.
| Immigration Origin | # Population | % Population |
| Central America | 39 | 0.6% |
| Latin America | 39 | 0.6% |
| Mexico | 39 | 0.6% | View All 3 Rows |
Sex and Age in Cynthiana
Sex and Age in Cynthiana
The most populous age groups in Cynthiana are 15 to 19 Years (269 | 9.3%) for men and 60 to 64 Years (393 | 11.4%) for women.
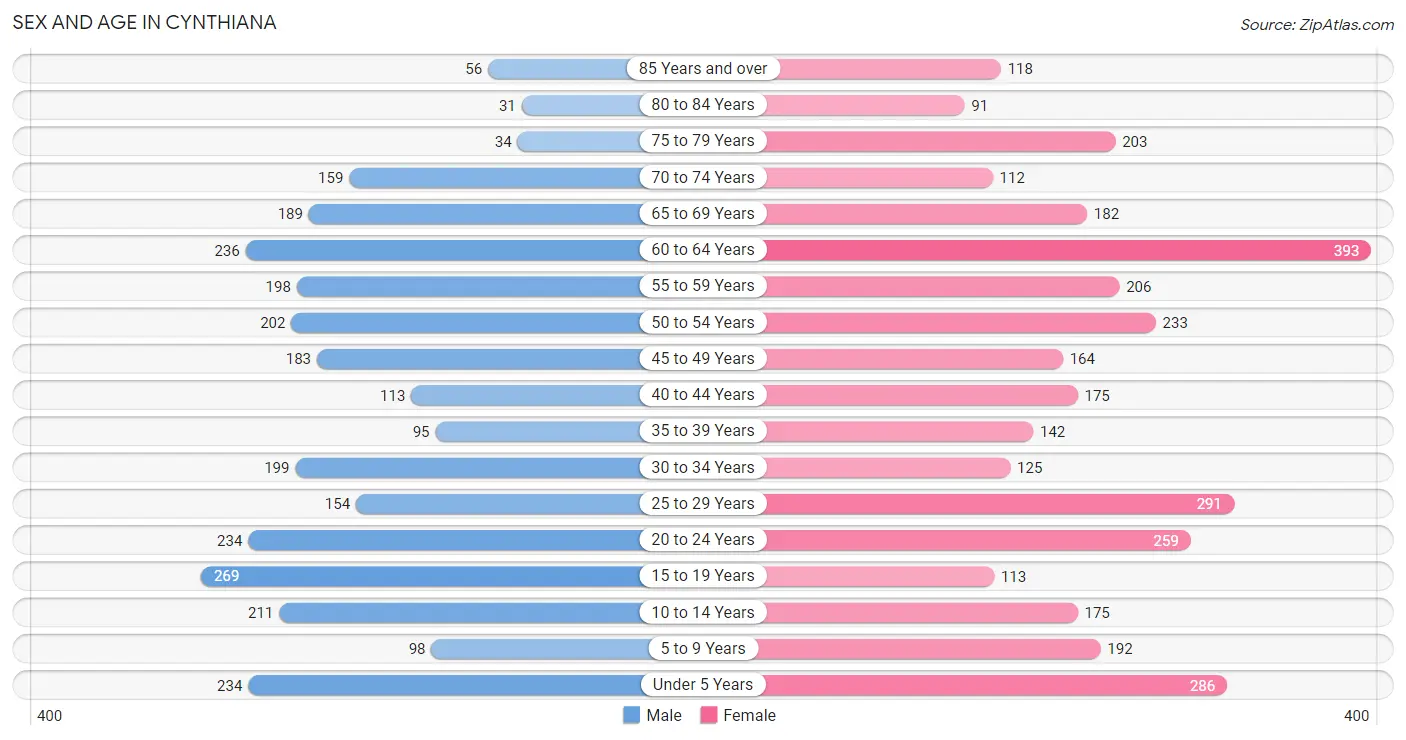
| Age Bracket | Male | Female |
| Under 5 Years | 234 (8.1%) | 286 (8.3%) |
| 5 to 9 Years | 98 (3.4%) | 192 (5.6%) |
| 10 to 14 Years | 211 (7.3%) | 175 (5.1%) |
| 15 to 19 Years | 269 (9.3%) | 113 (3.3%) |
| 20 to 24 Years | 234 (8.1%) | 259 (7.5%) |
| 25 to 29 Years | 154 (5.3%) | 291 (8.4%) |
| 30 to 34 Years | 199 (6.9%) | 125 (3.6%) |
| 35 to 39 Years | 95 (3.3%) | 142 (4.1%) |
| 40 to 44 Years | 113 (3.9%) | 175 (5.1%) |
| 45 to 49 Years | 183 (6.3%) | 164 (4.7%) |
| 50 to 54 Years | 202 (7.0%) | 233 (6.7%) |
| 55 to 59 Years | 198 (6.8%) | 206 (5.9%) |
| 60 to 64 Years | 236 (8.2%) | 393 (11.4%) |
| 65 to 69 Years | 189 (6.5%) | 182 (5.3%) |
| 70 to 74 Years | 159 (5.5%) | 112 (3.2%) |
| 75 to 79 Years | 34 (1.2%) | 203 (5.9%) |
| 80 to 84 Years | 31 (1.1%) | 91 (2.6%) |
| 85 Years and over | 56 (1.9%) | 118 (3.4%) |
| Total | 2,895 (100.0%) | 3,460 (100.0%) |
Families and Households in Cynthiana
Median Family Size in Cynthiana
The median family size in Cynthiana is 2.86 persons per family, with married-couple families (1,077 | 63.3%) accounting for the largest median family size of 3.19 persons per family. On the other hand, single male/father families (178 | 10.5%) represent the smallest median family size with 1.92 persons per family.
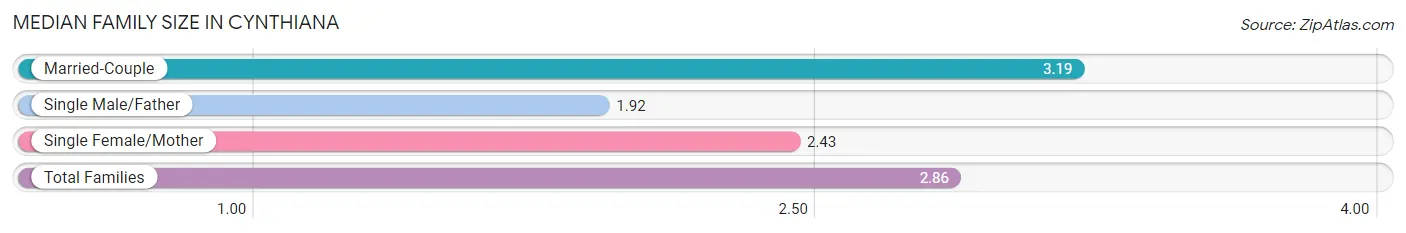
| Family Type | # Families | Family Size |
| Married-Couple | 1,077 (63.3%) | 3.19 |
| Single Male/Father | 178 (10.5%) | 1.92 |
| Single Female/Mother | 445 (26.2%) | 2.43 |
| Total Families | 1,700 (100.0%) | 2.86 |
Median Household Size in Cynthiana
The median household size in Cynthiana is 2.40 persons per household, with married-couple households (1,077 | 42.3%) accounting for the largest median household size of 3.21 persons per household. non-family households (844 | 33.2%) represent the smallest median household size with 1.10 persons per household.
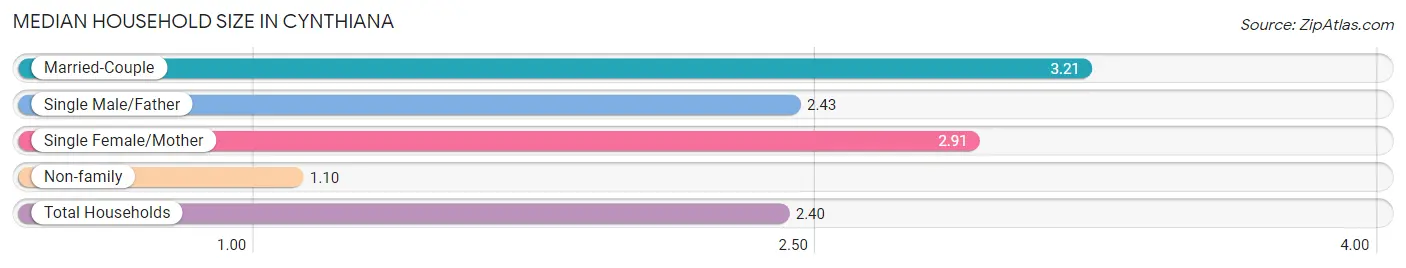
| Household Type | # Households | Household Size |
| Married-Couple | 1,077 (42.3%) | 3.21 |
| Single Male/Father | 178 (7.0%) | 2.43 |
| Single Female/Mother | 445 (17.5%) | 2.91 |
| Non-family | 844 (33.2%) | 1.10 |
| Total Households | 2,544 (100.0%) | 2.40 |
Household Size by Marriage Status in Cynthiana
Out of a total of 2,544 households in Cynthiana, 1,700 (66.8%) are family households, while 844 (33.2%) are nonfamily households. The most numerous type of family households are 2-person households, comprising 774, and the most common type of nonfamily households are 1-person households, comprising 753.
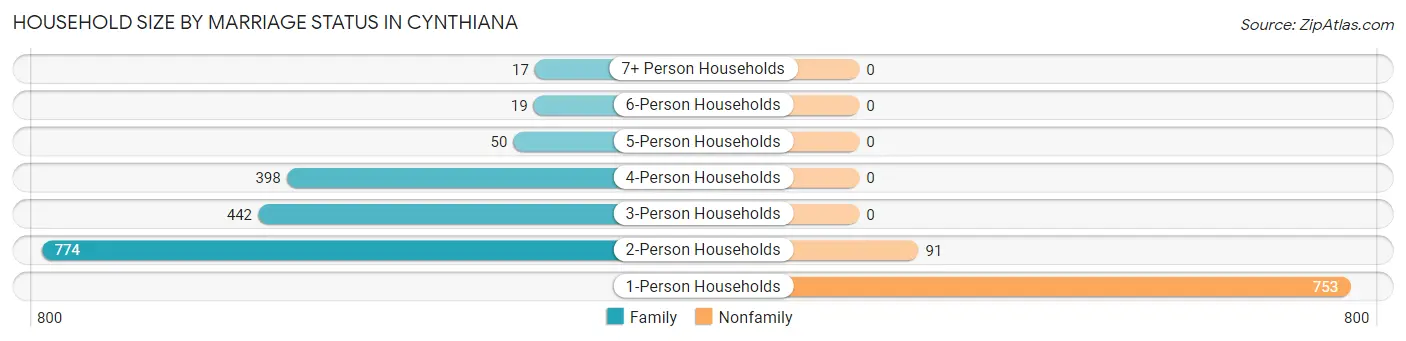
| Household Size | Family Households | Nonfamily Households |
| 1-Person Households | - | 753 (29.6%) |
| 2-Person Households | 774 (30.4%) | 91 (3.6%) |
| 3-Person Households | 442 (17.4%) | 0 (0.0%) |
| 4-Person Households | 398 (15.6%) | 0 (0.0%) |
| 5-Person Households | 50 (2.0%) | 0 (0.0%) |
| 6-Person Households | 19 (0.7%) | 0 (0.0%) |
| 7+ Person Households | 17 (0.7%) | 0 (0.0%) |
| Total | 1,700 (66.8%) | 844 (33.2%) |
Female Fertility in Cynthiana
Fertility by Age in Cynthiana
Average fertility rate in Cynthiana is 27.0 births per 1,000 women. Women in the age bracket of 15 to 19 years have the highest fertility rate with 142.0 births per 1,000 women. Women in the age bracket of 35 to 50 years acount for 54.3% of all women with births.
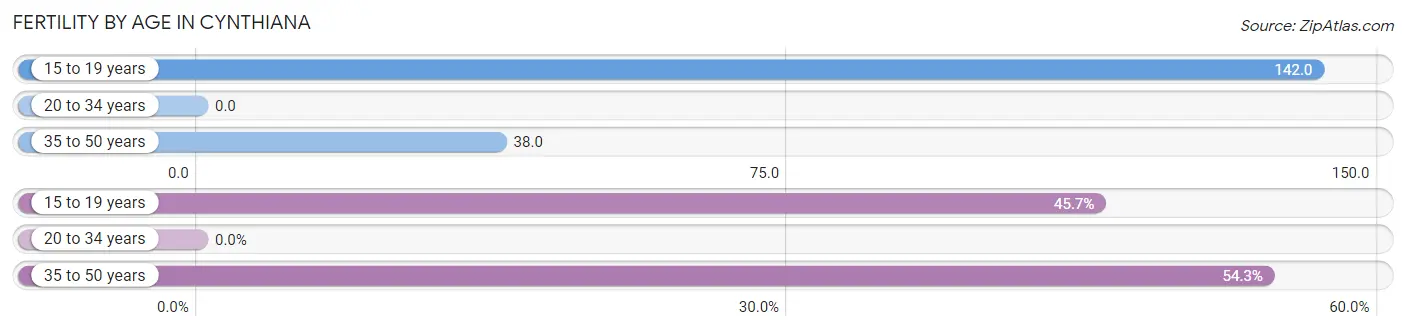
| Age Bracket | Women with Births | Births / 1,000 Women |
| 15 to 19 years | 16 (45.7%) | 142.0 |
| 20 to 34 years | 0 (0.0%) | 0.0 |
| 35 to 50 years | 19 (54.3%) | 38.0 |
| Total | 35 (100.0%) | 27.0 |
Fertility by Age by Marriage Status in Cynthiana
34.3% of women with births (35) in Cynthiana are married. The highest percentage of unmarried women with births falls into 15 to 19 years age bracket with 100.0% of them unmarried at the time of birth, while the lowest percentage of unmarried women with births belong to 35 to 50 years age bracket with 36.8% of them unmarried.
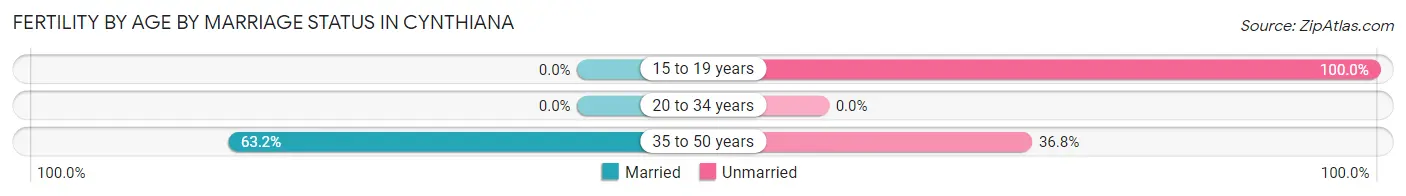
| Age Bracket | Married | Unmarried |
| 15 to 19 years | 0 (0.0%) | 16 (100.0%) |
| 20 to 34 years | 0 (0.0%) | 0 (0.0%) |
| 35 to 50 years | 12 (63.2%) | 7 (36.8%) |
| Total | 12 (34.3%) | 23 (65.7%) |
Fertility by Education in Cynthiana
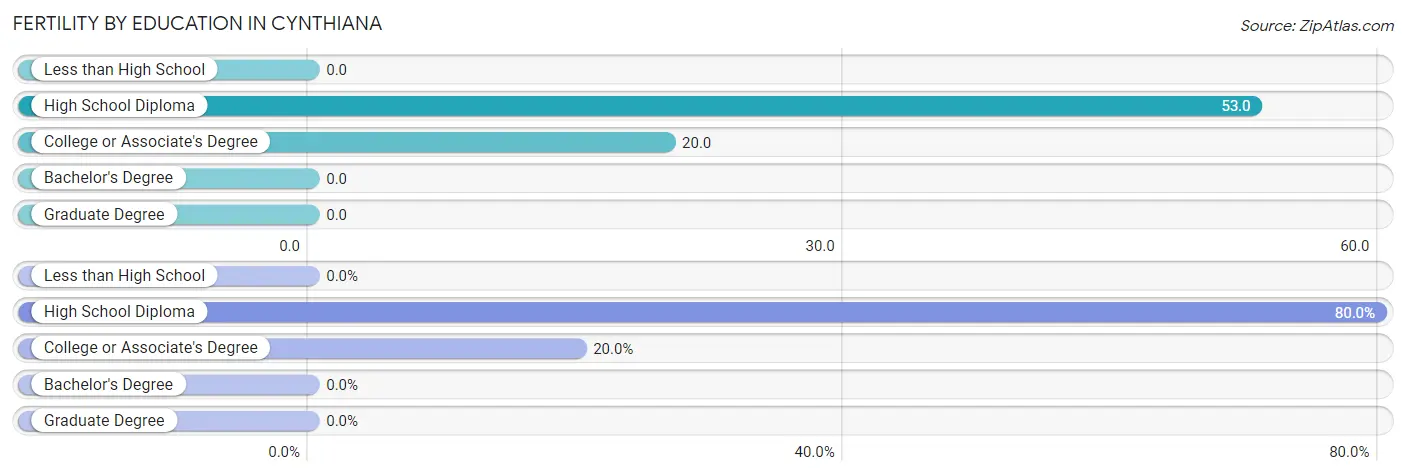
| Educational Attainment | Women with Births | Births / 1,000 Women |
| Less than High School | 0 (0.0%) | 0.0 |
| High School Diploma | 28 (80.0%) | 53.0 |
| College or Associate's Degree | 7 (20.0%) | 20.0 |
| Bachelor's Degree | 0 (0.0%) | 0.0 |
| Graduate Degree | 0 (0.0%) | 0.0 |
| Total | 35 (100.0%) | 27.0 |
Fertility by Education by Marriage Status in Cynthiana
65.7% of women with births in Cynthiana are unmarried. Women with the educational attainment of high school diploma are most likely to be married with 42.9% of them married at childbirth, while women with the educational attainment of college or associate's degree are least likely to be married with 100.0% of them unmarried at childbirth.
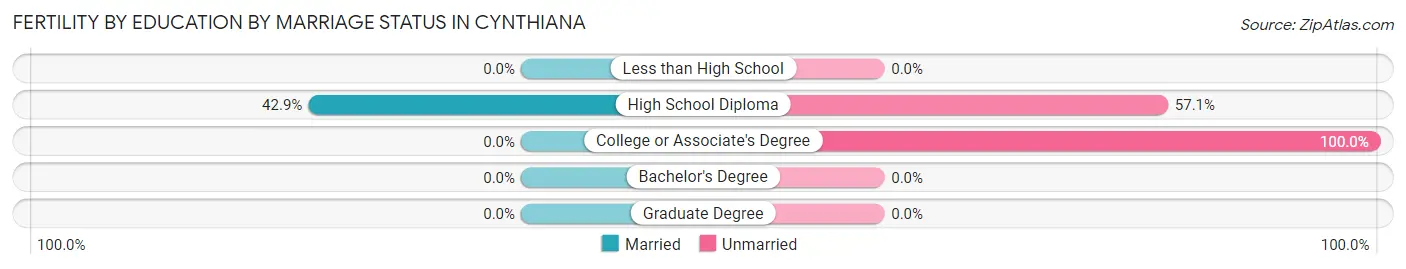
| Educational Attainment | Married | Unmarried |
| Less than High School | 0 (0.0%) | 0 (0.0%) |
| High School Diploma | 12 (42.9%) | 16 (57.1%) |
| College or Associate's Degree | 0 (0.0%) | 7 (100.0%) |
| Bachelor's Degree | 0 (0.0%) | 0 (0.0%) |
| Graduate Degree | 0 (0.0%) | 0 (0.0%) |
| Total | 12 (34.3%) | 23 (65.7%) |
Employment Characteristics in Cynthiana
Employment by Class of Employer in Cynthiana
Among the 2,670 employed individuals in Cynthiana, private company employees (1,847 | 69.2%), state government employees (309 | 11.6%), and local government employees (271 | 10.2%) make up the most common classes of employment.
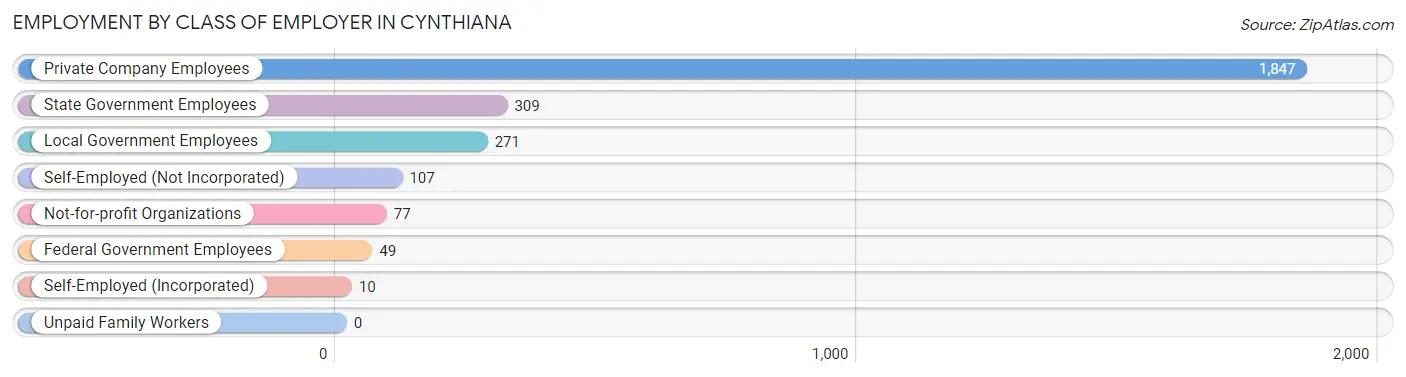
| Employer Class | # Employees | % Employees |
| Private Company Employees | 1,847 | 69.2% |
| Self-Employed (Incorporated) | 10 | 0.4% |
| Self-Employed (Not Incorporated) | 107 | 4.0% |
| Not-for-profit Organizations | 77 | 2.9% |
| Local Government Employees | 271 | 10.2% |
| State Government Employees | 309 | 11.6% |
| Federal Government Employees | 49 | 1.8% |
| Unpaid Family Workers | 0 | 0.0% |
| Total | 2,670 | 100.0% |
Employment Status by Age in Cynthiana
According to the labor force statistics for Cynthiana, out of the total population over 16 years of age (5,129), 53.9% or 2,765 individuals are in the labor force, with 2.1% or 58 of them unemployed. The age group with the highest labor force participation rate is 25 to 29 years, with 89.0% or 396 individuals in the labor force. Within the labor force, the 45 to 54 years age range has the highest percentage of unemployed individuals, with 5.6% or 25 of them being unemployed.
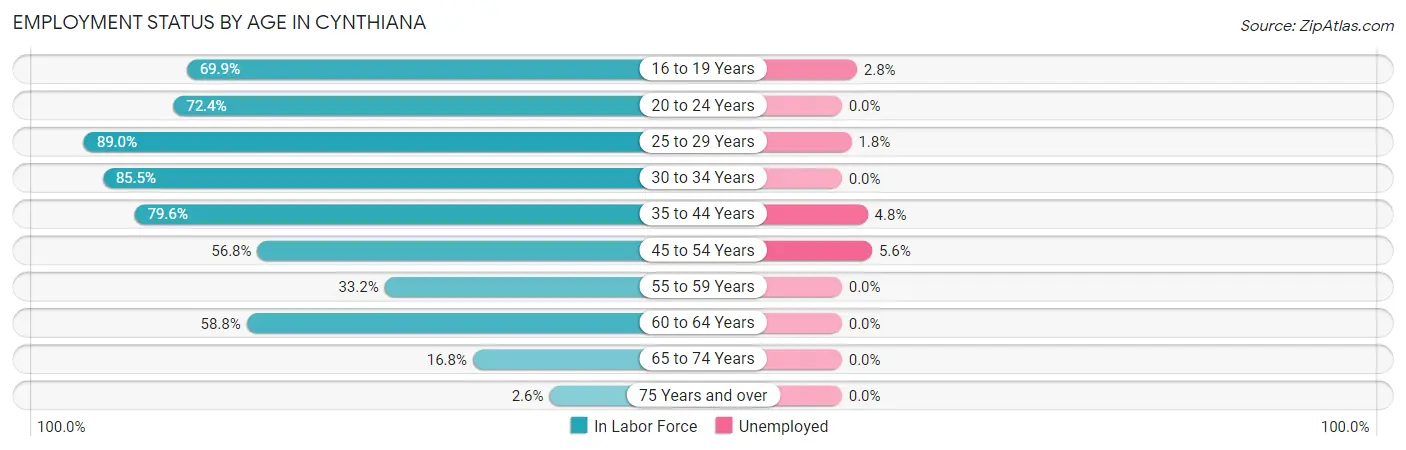
| Age Bracket | In Labor Force | Unemployed |
| 16 to 19 Years | 246 (69.9%) | 7 (2.8%) |
| 20 to 24 Years | 357 (72.4%) | 0 (0.0%) |
| 25 to 29 Years | 396 (89.0%) | 7 (1.8%) |
| 30 to 34 Years | 277 (85.5%) | 0 (0.0%) |
| 35 to 44 Years | 418 (79.6%) | 20 (4.8%) |
| 45 to 54 Years | 444 (56.8%) | 25 (5.6%) |
| 55 to 59 Years | 134 (33.2%) | 0 (0.0%) |
| 60 to 64 Years | 370 (58.8%) | 0 (0.0%) |
| 65 to 74 Years | 108 (16.8%) | 0 (0.0%) |
| 75 Years and over | 14 (2.6%) | 0 (0.0%) |
| Total | 2,765 (53.9%) | 58 (2.1%) |
Employment Status by Educational Attainment in Cynthiana
According to labor force statistics for Cynthiana, 65.6% of individuals (2,040) out of the total population between 25 and 64 years of age (3,109) are in the labor force, with 2.6% or 53 of them being unemployed. The group with the highest labor force participation rate are those with the educational attainment of bachelor's degree or higher, with 94.1% or 416 individuals in the labor force. Within the labor force, individuals with high school diploma education have the highest percentage of unemployment, with 5.0% or 45 of them being unemployed.
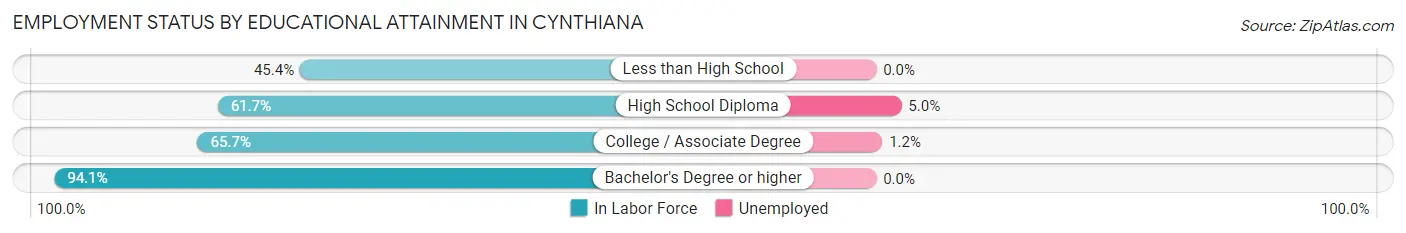
| Educational Attainment | In Labor Force | Unemployed |
| Less than High School | 157 (45.4%) | 0 (0.0%) |
| High School Diploma | 897 (61.7%) | 73 (5.0%) |
| College / Associate Degree | 570 (65.7%) | 10 (1.2%) |
| Bachelor's Degree or higher | 416 (94.1%) | 0 (0.0%) |
| Total | 2,040 (65.6%) | 81 (2.6%) |
Employment Occupations by Sex in Cynthiana
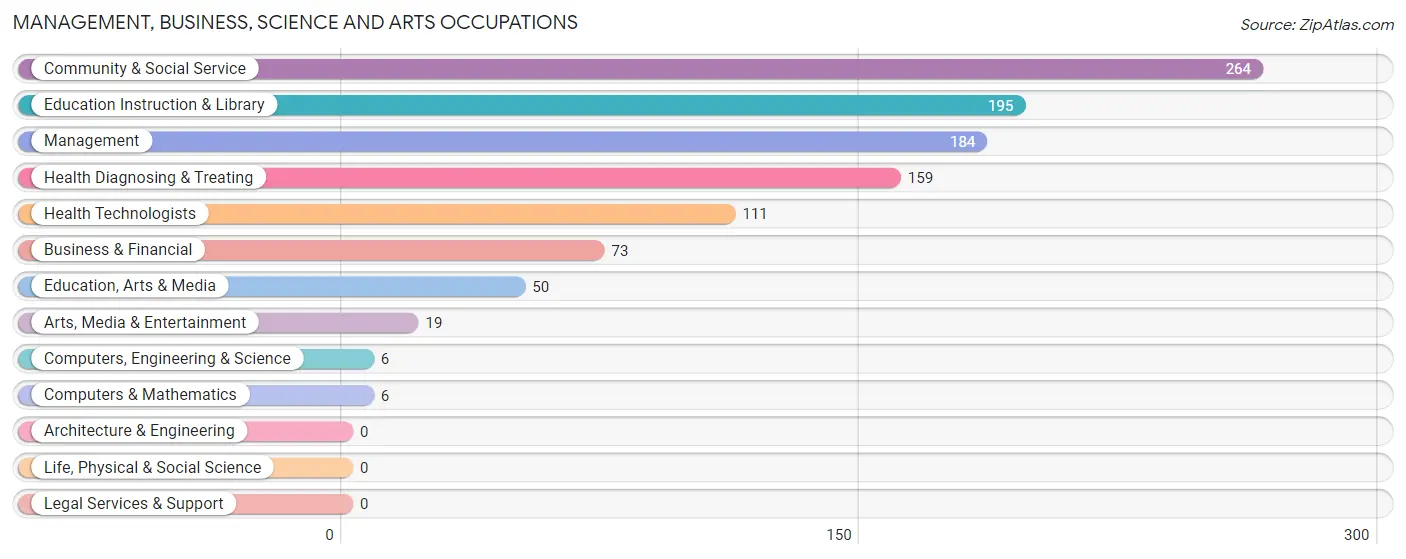
Management, Business, Science and Arts Occupations
The most common Management, Business, Science and Arts occupations in Cynthiana are Community & Social Service (264 | 9.8%), Education Instruction & Library (195 | 7.2%), Management (184 | 6.8%), Health Diagnosing & Treating (159 | 5.9%), and Health Technologists (111 | 4.1%).
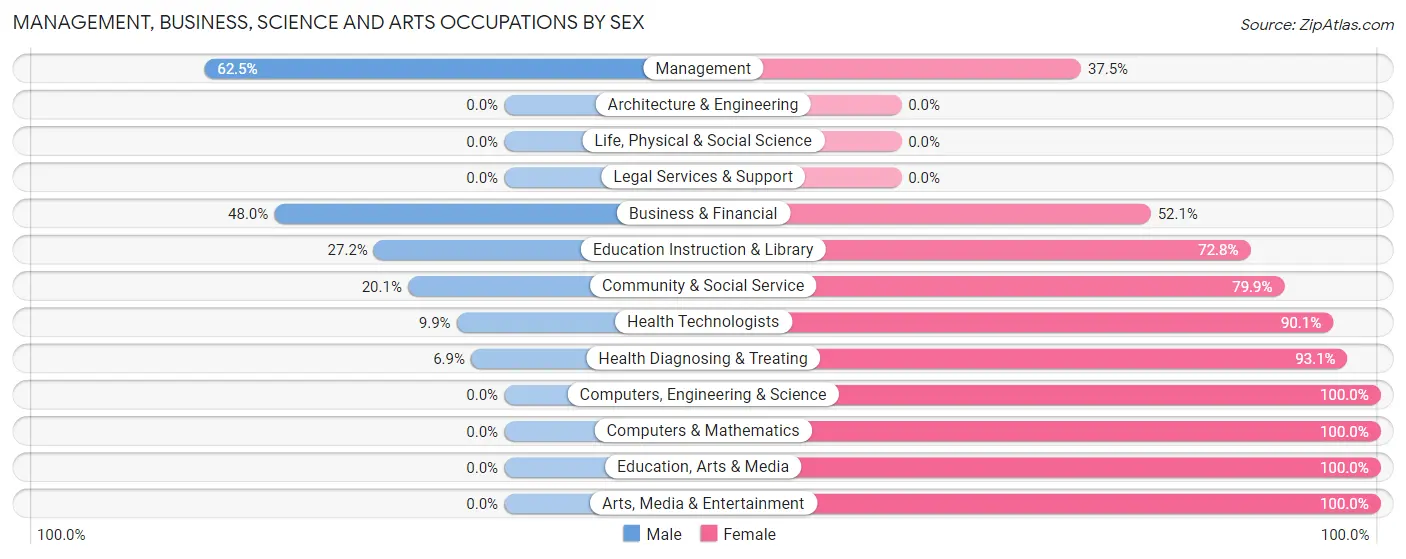
Management, Business, Science and Arts Occupations by Sex
Within the Management, Business, Science and Arts occupations in Cynthiana, the most male-oriented occupations are Management (62.5%), Business & Financial (47.9%), and Education Instruction & Library (27.2%), while the most female-oriented occupations are Computers, Engineering & Science (100.0%), Computers & Mathematics (100.0%), and Education, Arts & Media (100.0%).
| Occupation | Male | Female |
| Management | 115 (62.5%) | 69 (37.5%) |
| Business & Financial | 35 (47.9%) | 38 (52.0%) |
| Computers, Engineering & Science | 0 (0.0%) | 6 (100.0%) |
| Computers & Mathematics | 0 (0.0%) | 6 (100.0%) |
| Architecture & Engineering | 0 (0.0%) | 0 (0.0%) |
| Life, Physical & Social Science | 0 (0.0%) | 0 (0.0%) |
| Community & Social Service | 53 (20.1%) | 211 (79.9%) |
| Education, Arts & Media | 0 (0.0%) | 50 (100.0%) |
| Legal Services & Support | 0 (0.0%) | 0 (0.0%) |
| Education Instruction & Library | 53 (27.2%) | 142 (72.8%) |
| Arts, Media & Entertainment | 0 (0.0%) | 19 (100.0%) |
| Health Diagnosing & Treating | 11 (6.9%) | 148 (93.1%) |
| Health Technologists | 11 (9.9%) | 100 (90.1%) |
| Total (Category) | 214 (31.2%) | 472 (68.8%) |
| Total (Overall) | 1,352 (50.0%) | 1,353 (50.0%) |
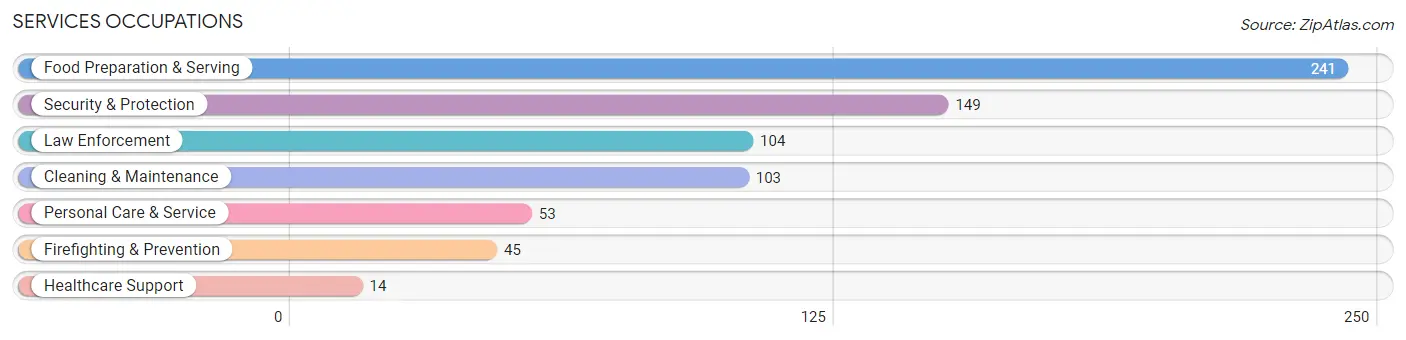
Services Occupations
The most common Services occupations in Cynthiana are Food Preparation & Serving (241 | 8.9%), Security & Protection (149 | 5.5%), Law Enforcement (104 | 3.8%), Cleaning & Maintenance (103 | 3.8%), and Personal Care & Service (53 | 2.0%).
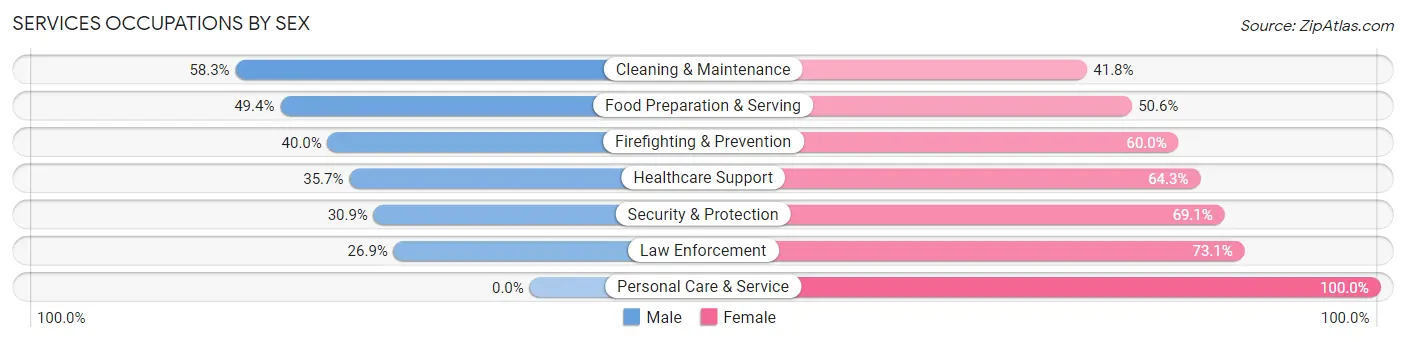
Services Occupations by Sex
Within the Services occupations in Cynthiana, the most male-oriented occupations are Cleaning & Maintenance (58.3%), Food Preparation & Serving (49.4%), and Firefighting & Prevention (40.0%), while the most female-oriented occupations are Personal Care & Service (100.0%), Law Enforcement (73.1%), and Security & Protection (69.1%).
| Occupation | Male | Female |
| Healthcare Support | 5 (35.7%) | 9 (64.3%) |
| Security & Protection | 46 (30.9%) | 103 (69.1%) |
| Firefighting & Prevention | 18 (40.0%) | 27 (60.0%) |
| Law Enforcement | 28 (26.9%) | 76 (73.1%) |
| Food Preparation & Serving | 119 (49.4%) | 122 (50.6%) |
| Cleaning & Maintenance | 60 (58.3%) | 43 (41.7%) |
| Personal Care & Service | 0 (0.0%) | 53 (100.0%) |
| Total (Category) | 230 (41.1%) | 330 (58.9%) |
| Total (Overall) | 1,352 (50.0%) | 1,353 (50.0%) |
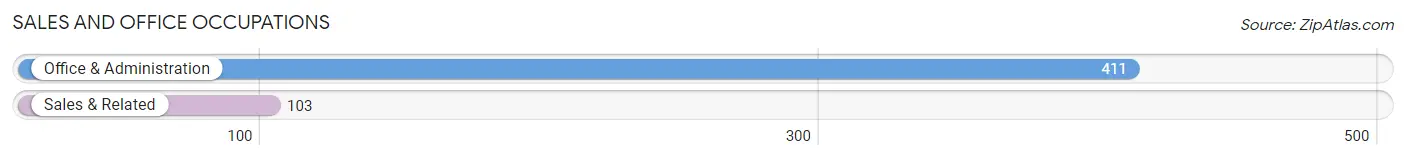
Sales and Office Occupations
The most common Sales and Office occupations in Cynthiana are Office & Administration (411 | 15.2%), and Sales & Related (103 | 3.8%).
Sales and Office Occupations by Sex
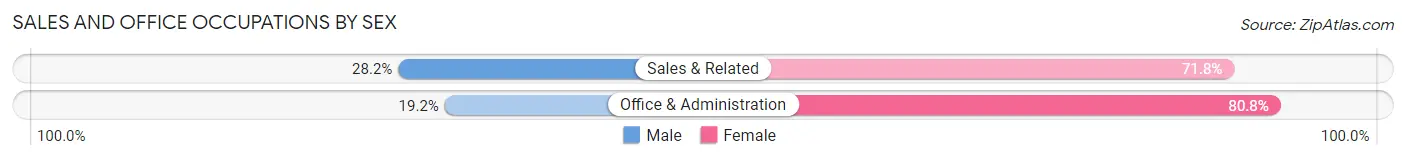
| Occupation | Male | Female |
| Sales & Related | 29 (28.2%) | 74 (71.8%) |
| Office & Administration | 79 (19.2%) | 332 (80.8%) |
| Total (Category) | 108 (21.0%) | 406 (79.0%) |
| Total (Overall) | 1,352 (50.0%) | 1,353 (50.0%) |
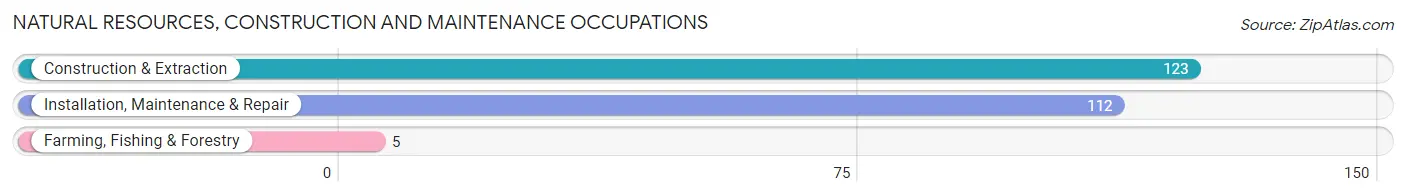
Natural Resources, Construction and Maintenance Occupations
The most common Natural Resources, Construction and Maintenance occupations in Cynthiana are Construction & Extraction (123 | 4.5%), Installation, Maintenance & Repair (112 | 4.1%), and Farming, Fishing & Forestry (5 | 0.2%).
Natural Resources, Construction and Maintenance Occupations by Sex
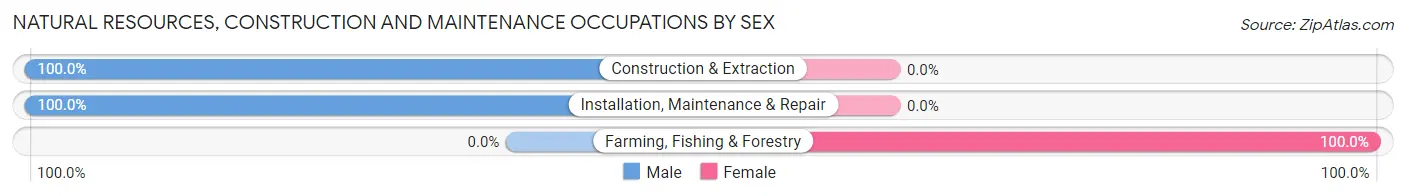
| Occupation | Male | Female |
| Farming, Fishing & Forestry | 0 (0.0%) | 5 (100.0%) |
| Construction & Extraction | 123 (100.0%) | 0 (0.0%) |
| Installation, Maintenance & Repair | 112 (100.0%) | 0 (0.0%) |
| Total (Category) | 235 (97.9%) | 5 (2.1%) |
| Total (Overall) | 1,352 (50.0%) | 1,353 (50.0%) |
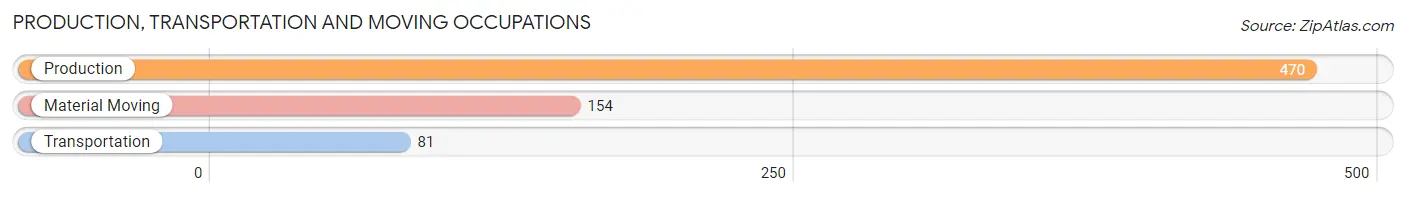
Production, Transportation and Moving Occupations
The most common Production, Transportation and Moving occupations in Cynthiana are Production (470 | 17.4%), Material Moving (154 | 5.7%), and Transportation (81 | 3.0%).
Production, Transportation and Moving Occupations by Sex
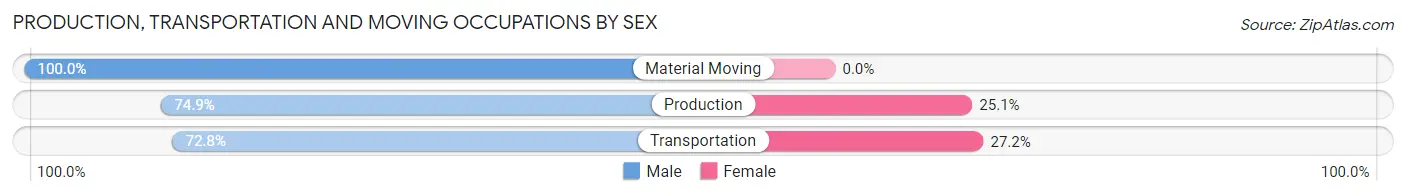
| Occupation | Male | Female |
| Production | 352 (74.9%) | 118 (25.1%) |
| Transportation | 59 (72.8%) | 22 (27.2%) |
| Material Moving | 154 (100.0%) | 0 (0.0%) |
| Total (Category) | 565 (80.1%) | 140 (19.9%) |
| Total (Overall) | 1,352 (50.0%) | 1,353 (50.0%) |
Employment Industries by Sex in Cynthiana
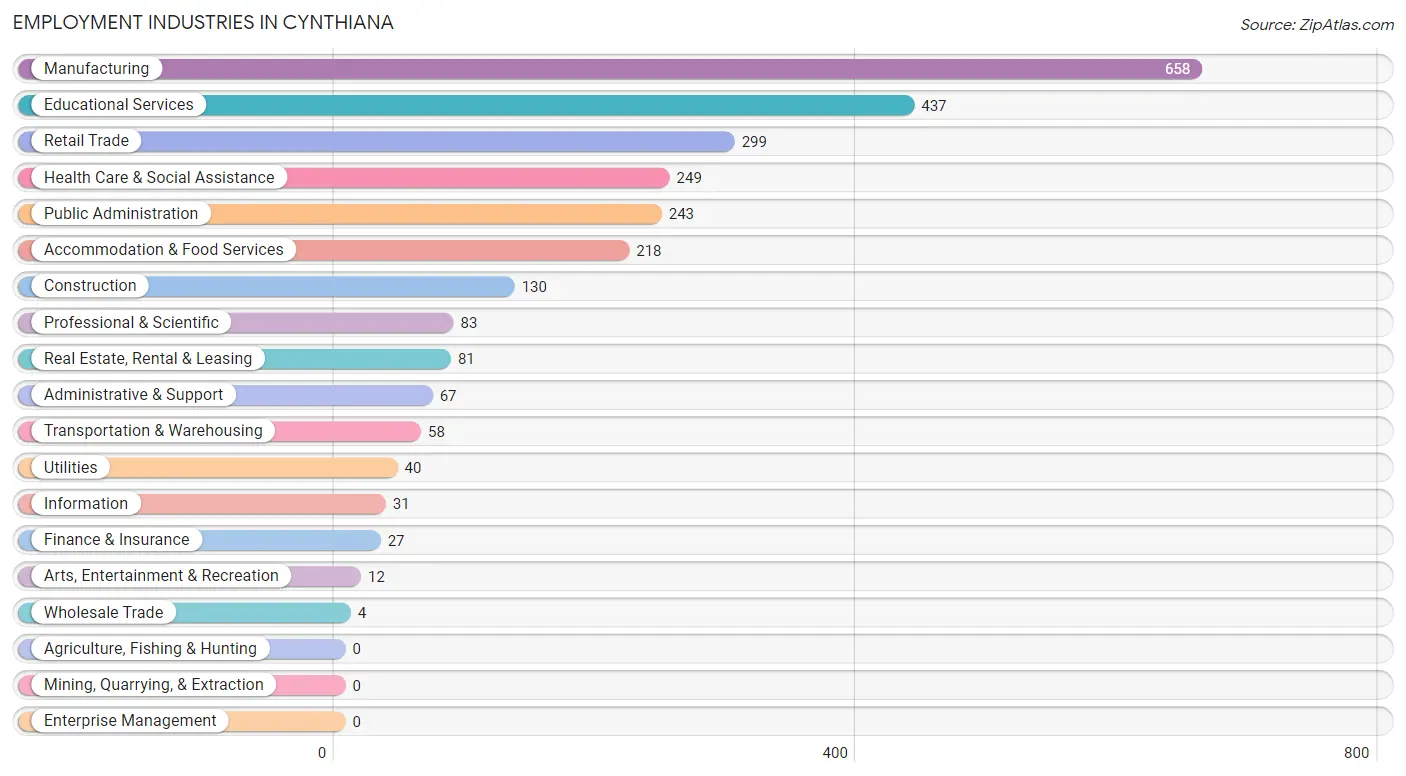
Employment Industries in Cynthiana
The major employment industries in Cynthiana include Manufacturing (658 | 24.3%), Educational Services (437 | 16.2%), Retail Trade (299 | 11.1%), Health Care & Social Assistance (249 | 9.2%), and Public Administration (243 | 9.0%).
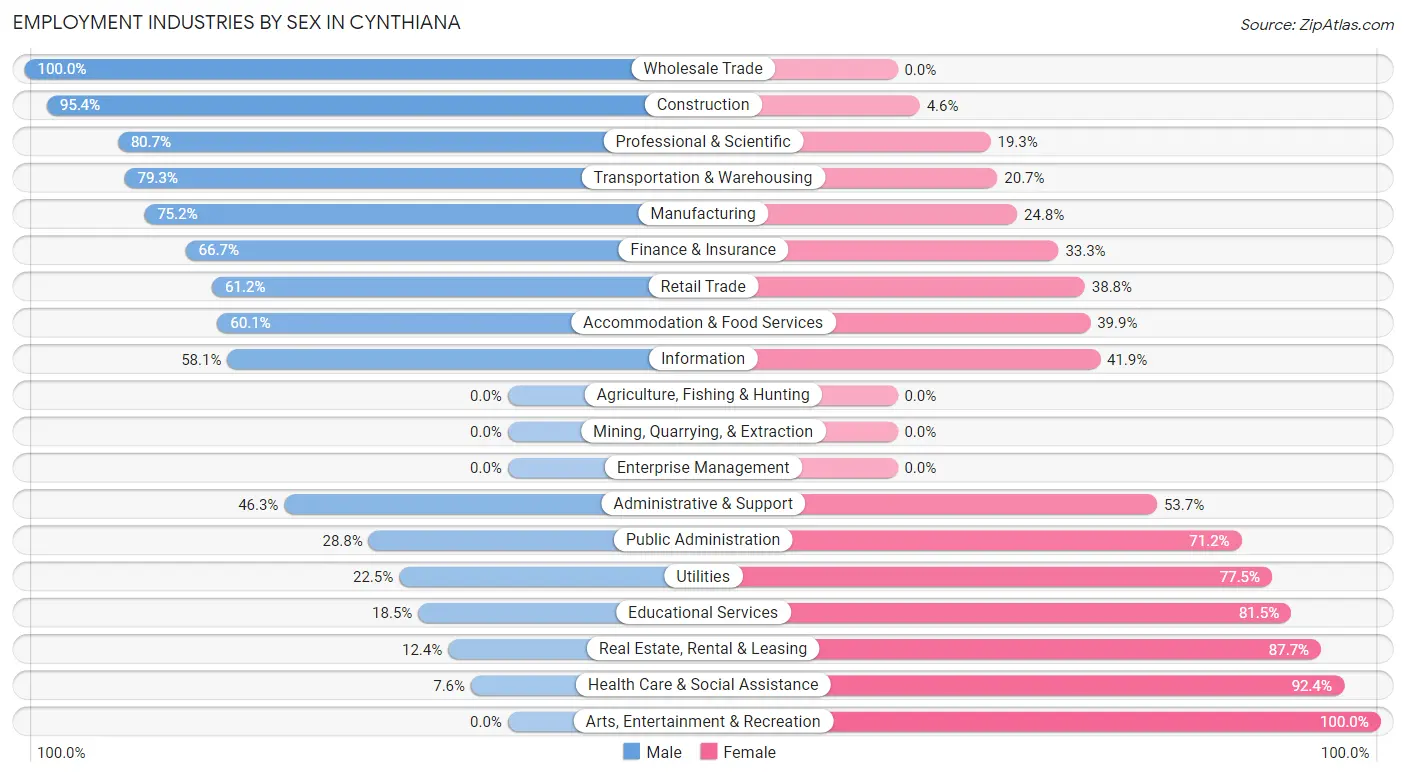
Employment Industries by Sex in Cynthiana
The Cynthiana industries that see more men than women are Wholesale Trade (100.0%), Construction (95.4%), and Professional & Scientific (80.7%), whereas the industries that tend to have a higher number of women are Arts, Entertainment & Recreation (100.0%), Health Care & Social Assistance (92.4%), and Real Estate, Rental & Leasing (87.6%).
| Industry | Male | Female |
| Agriculture, Fishing & Hunting | 0 (0.0%) | 0 (0.0%) |
| Mining, Quarrying, & Extraction | 0 (0.0%) | 0 (0.0%) |
| Construction | 124 (95.4%) | 6 (4.6%) |
| Manufacturing | 495 (75.2%) | 163 (24.8%) |
| Wholesale Trade | 4 (100.0%) | 0 (0.0%) |
| Retail Trade | 183 (61.2%) | 116 (38.8%) |
| Transportation & Warehousing | 46 (79.3%) | 12 (20.7%) |
| Utilities | 9 (22.5%) | 31 (77.5%) |
| Information | 18 (58.1%) | 13 (41.9%) |
| Finance & Insurance | 18 (66.7%) | 9 (33.3%) |
| Real Estate, Rental & Leasing | 10 (12.3%) | 71 (87.6%) |
| Professional & Scientific | 67 (80.7%) | 16 (19.3%) |
| Enterprise Management | 0 (0.0%) | 0 (0.0%) |
| Administrative & Support | 31 (46.3%) | 36 (53.7%) |
| Educational Services | 81 (18.5%) | 356 (81.5%) |
| Health Care & Social Assistance | 19 (7.6%) | 230 (92.4%) |
| Arts, Entertainment & Recreation | 0 (0.0%) | 12 (100.0%) |
| Accommodation & Food Services | 131 (60.1%) | 87 (39.9%) |
| Public Administration | 70 (28.8%) | 173 (71.2%) |
| Total | 1,352 (50.0%) | 1,353 (50.0%) |
Education in Cynthiana
School Enrollment in Cynthiana
The most common levels of schooling among the 1,142 students in Cynthiana are middle school (327 | 28.6%), high school (308 | 27.0%), and elementary school (260 | 22.8%).
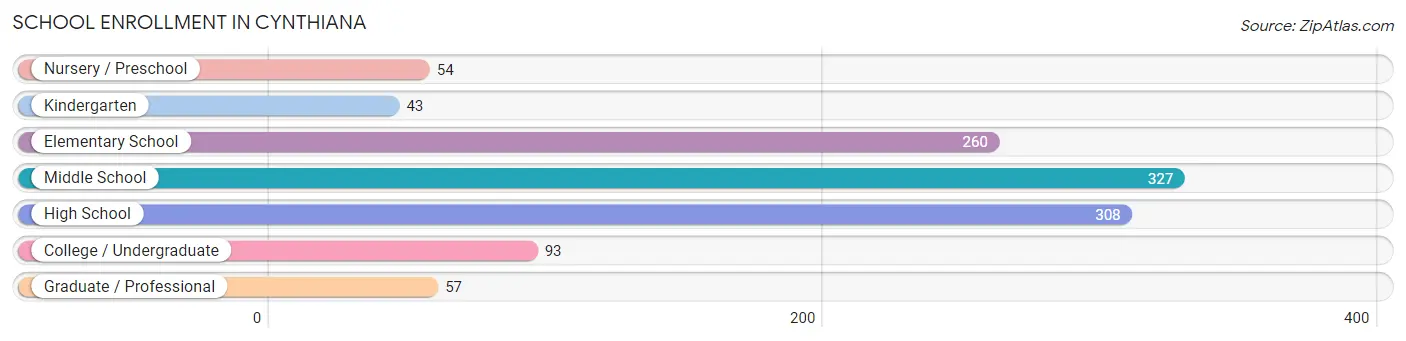
| School Level | # Students | % Students |
| Nursery / Preschool | 54 | 4.7% |
| Kindergarten | 43 | 3.8% |
| Elementary School | 260 | 22.8% |
| Middle School | 327 | 28.6% |
| High School | 308 | 27.0% |
| College / Undergraduate | 93 | 8.1% |
| Graduate / Professional | 57 | 5.0% |
| Total | 1,142 | 100.0% |
School Enrollment by Age by Funding Source in Cynthiana
Out of a total of 1,142 students who are enrolled in schools in Cynthiana, 57 (5.0%) attend a private institution, while the remaining 1,085 (95.0%) are enrolled in public schools. The age group of 20 to 24 year olds has the highest likelihood of being enrolled in private schools, with 12 (57.1% in the age bracket) enrolled. Conversely, the age group of 3 to 4 year olds has the lowest likelihood of being enrolled in a private school, with 54 (100.0% in the age bracket) attending a public institution.
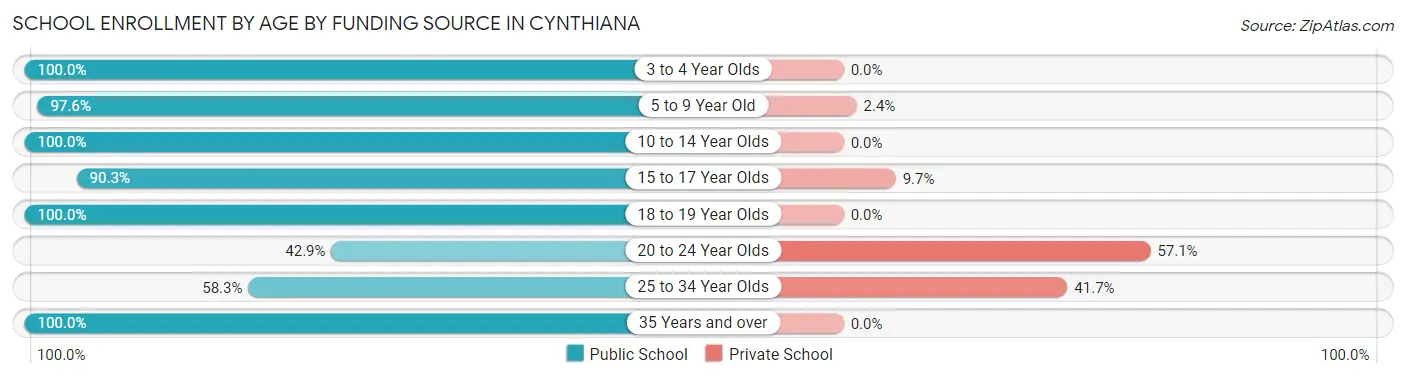
| Age Bracket | Public School | Private School |
| 3 to 4 Year Olds | 54 (100.0%) | 0 (0.0%) |
| 5 to 9 Year Old | 283 (97.6%) | 7 (2.4%) |
| 10 to 14 Year Olds | 386 (100.0%) | 0 (0.0%) |
| 15 to 17 Year Olds | 214 (90.3%) | 23 (9.7%) |
| 18 to 19 Year Olds | 48 (100.0%) | 0 (0.0%) |
| 20 to 24 Year Olds | 9 (42.9%) | 12 (57.1%) |
| 25 to 34 Year Olds | 21 (58.3%) | 15 (41.7%) |
| 35 Years and over | 70 (100.0%) | 0 (0.0%) |
| Total | 1,085 (95.0%) | 57 (5.0%) |
Educational Attainment by Field of Study in Cynthiana
Education (178 | 30.3%), arts & humanities (171 | 29.1%), business (97 | 16.5%), bio, nature & agricultural (38 | 6.5%), and visual & performing arts (24 | 4.1%) are the most common fields of study among 587 individuals in Cynthiana who have obtained a bachelor's degree or higher.
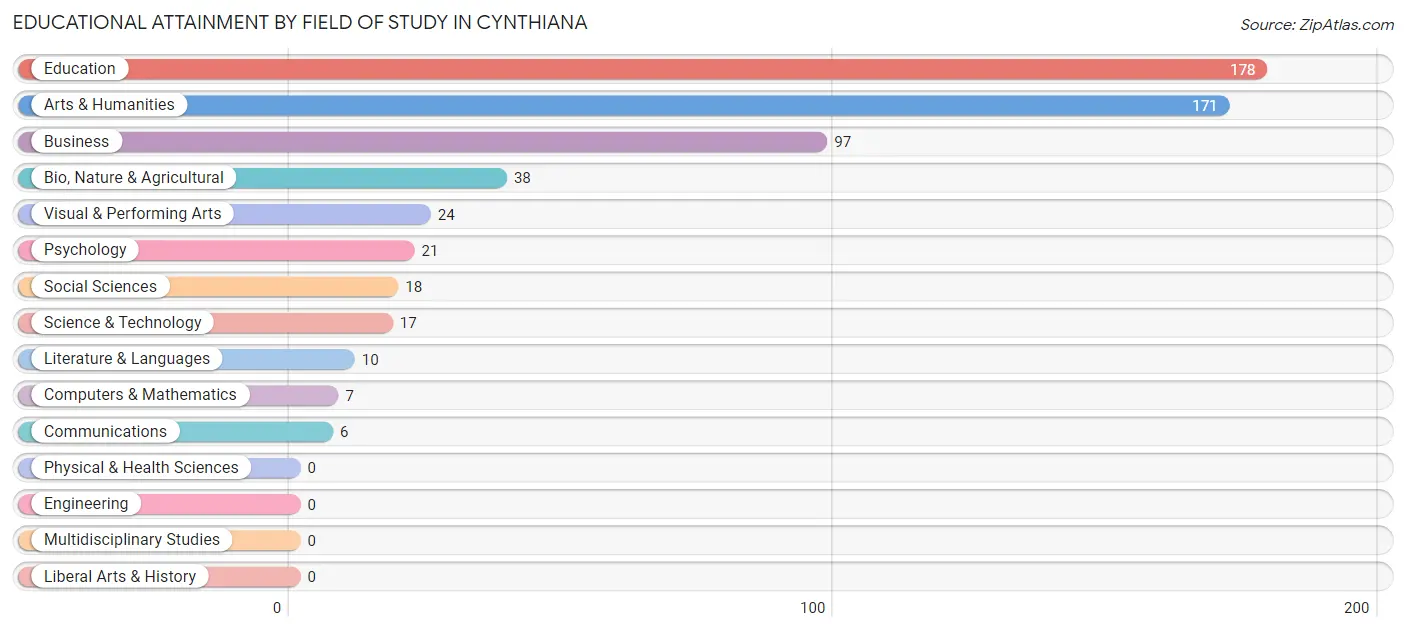
| Field of Study | # Graduates | % Graduates |
| Computers & Mathematics | 7 | 1.2% |
| Bio, Nature & Agricultural | 38 | 6.5% |
| Physical & Health Sciences | 0 | 0.0% |
| Psychology | 21 | 3.6% |
| Social Sciences | 18 | 3.1% |
| Engineering | 0 | 0.0% |
| Multidisciplinary Studies | 0 | 0.0% |
| Science & Technology | 17 | 2.9% |
| Business | 97 | 16.5% |
| Education | 178 | 30.3% |
| Literature & Languages | 10 | 1.7% |
| Liberal Arts & History | 0 | 0.0% |
| Visual & Performing Arts | 24 | 4.1% |
| Communications | 6 | 1.0% |
| Arts & Humanities | 171 | 29.1% |
| Total | 587 | 100.0% |
Transportation & Commute in Cynthiana
Vehicle Availability by Sex in Cynthiana
The most prevalent vehicle ownership categories in Cynthiana are males with 2 vehicles (609, accounting for 46.2%) and females with 2 vehicles (633, making up 45.6%).
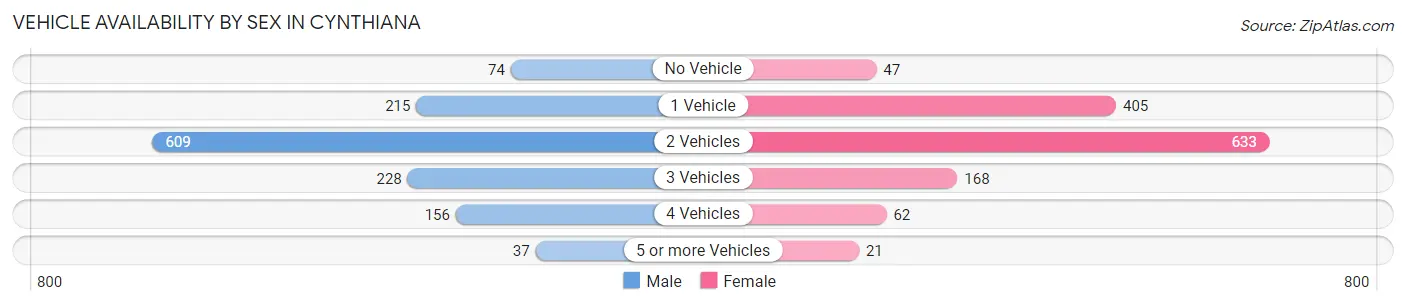
| Vehicles Available | Male | Female |
| No Vehicle | 74 (5.6%) | 47 (3.5%) |
| 1 Vehicle | 215 (16.3%) | 405 (30.3%) |
| 2 Vehicles | 609 (46.2%) | 633 (47.4%) |
| 3 Vehicles | 228 (17.3%) | 168 (12.6%) |
| 4 Vehicles | 156 (11.8%) | 62 (4.6%) |
| 5 or more Vehicles | 37 (2.8%) | 21 (1.6%) |
| Total | 1,319 (100.0%) | 1,336 (100.0%) |
Commute Time in Cynthiana
The most frequently occuring commute durations in Cynthiana are 5 to 9 minutes (730 commuters, 28.4%), 30 to 34 minutes (319 commuters, 12.4%), and 10 to 14 minutes (308 commuters, 12.0%).
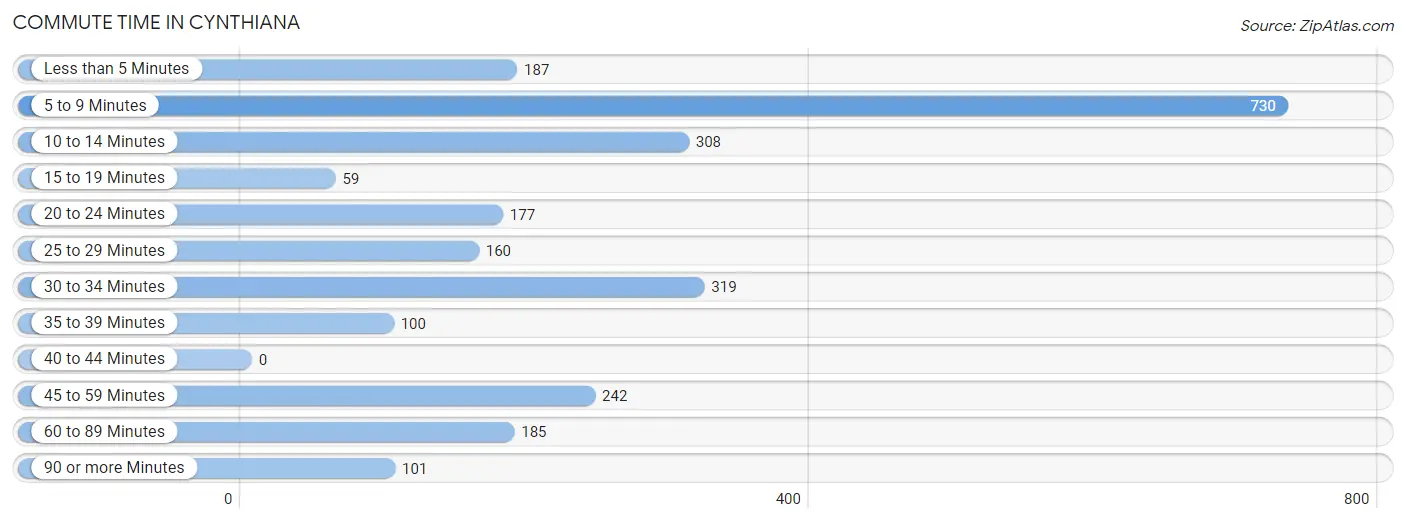
| Commute Time | # Commuters | % Commuters |
| Less than 5 Minutes | 187 | 7.3% |
| 5 to 9 Minutes | 730 | 28.4% |
| 10 to 14 Minutes | 308 | 12.0% |
| 15 to 19 Minutes | 59 | 2.3% |
| 20 to 24 Minutes | 177 | 6.9% |
| 25 to 29 Minutes | 160 | 6.2% |
| 30 to 34 Minutes | 319 | 12.4% |
| 35 to 39 Minutes | 100 | 3.9% |
| 40 to 44 Minutes | 0 | 0.0% |
| 45 to 59 Minutes | 242 | 9.4% |
| 60 to 89 Minutes | 185 | 7.2% |
| 90 or more Minutes | 101 | 3.9% |
Commute Time by Sex in Cynthiana
The most common commute times in Cynthiana are 5 to 9 minutes (349 commuters, 27.0%) for males and 5 to 9 minutes (381 commuters, 29.9%) for females.
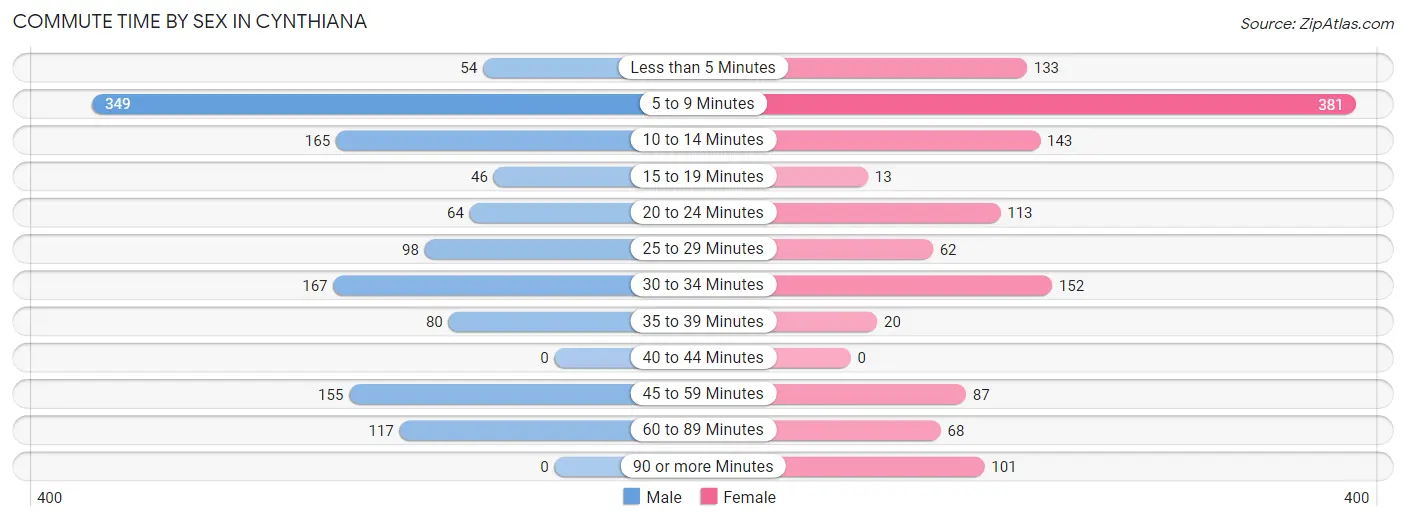
| Commute Time | Male | Female |
| Less than 5 Minutes | 54 (4.2%) | 133 (10.4%) |
| 5 to 9 Minutes | 349 (27.0%) | 381 (29.9%) |
| 10 to 14 Minutes | 165 (12.7%) | 143 (11.2%) |
| 15 to 19 Minutes | 46 (3.5%) | 13 (1.0%) |
| 20 to 24 Minutes | 64 (4.9%) | 113 (8.9%) |
| 25 to 29 Minutes | 98 (7.6%) | 62 (4.9%) |
| 30 to 34 Minutes | 167 (12.9%) | 152 (11.9%) |
| 35 to 39 Minutes | 80 (6.2%) | 20 (1.6%) |
| 40 to 44 Minutes | 0 (0.0%) | 0 (0.0%) |
| 45 to 59 Minutes | 155 (12.0%) | 87 (6.8%) |
| 60 to 89 Minutes | 117 (9.0%) | 68 (5.3%) |
| 90 or more Minutes | 0 (0.0%) | 101 (7.9%) |
Time of Departure to Work by Sex in Cynthiana
The most frequent times of departure to work in Cynthiana are 4:00 PM to 11:59 PM (300, 23.2%) for males and 6:30 AM to 6:59 AM (324, 25.5%) for females.
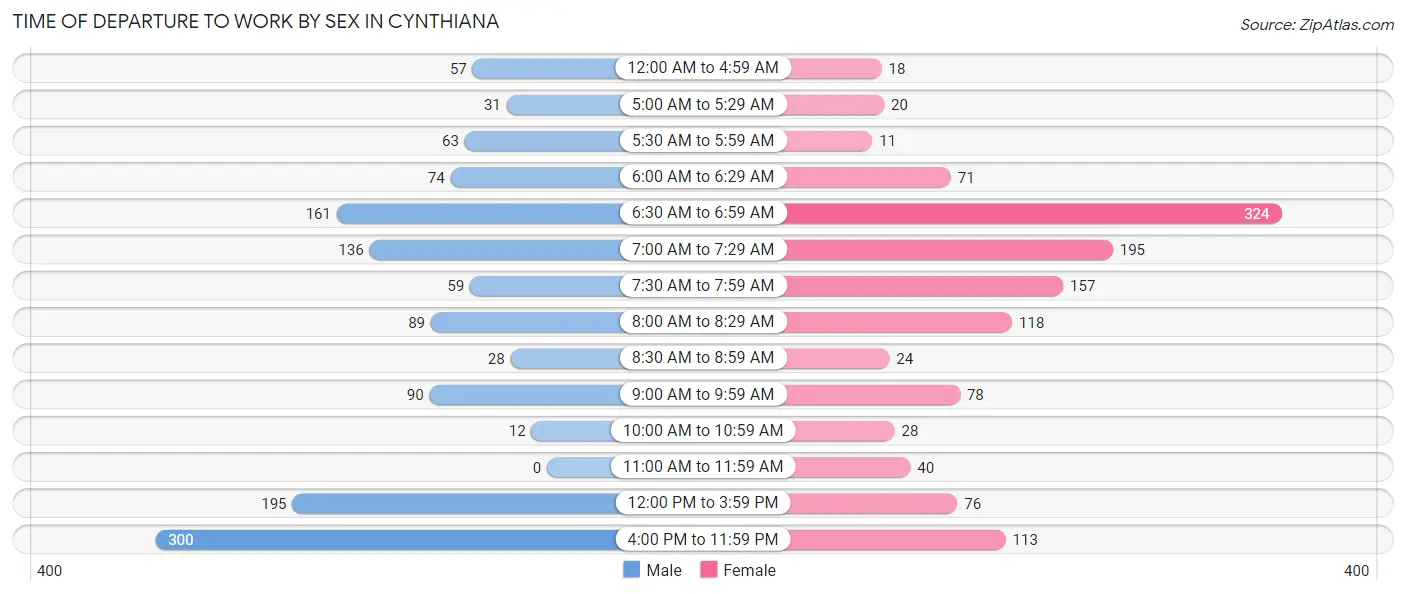
| Time of Departure | Male | Female |
| 12:00 AM to 4:59 AM | 57 (4.4%) | 18 (1.4%) |
| 5:00 AM to 5:29 AM | 31 (2.4%) | 20 (1.6%) |
| 5:30 AM to 5:59 AM | 63 (4.9%) | 11 (0.9%) |
| 6:00 AM to 6:29 AM | 74 (5.7%) | 71 (5.6%) |
| 6:30 AM to 6:59 AM | 161 (12.4%) | 324 (25.5%) |
| 7:00 AM to 7:29 AM | 136 (10.5%) | 195 (15.3%) |
| 7:30 AM to 7:59 AM | 59 (4.6%) | 157 (12.3%) |
| 8:00 AM to 8:29 AM | 89 (6.9%) | 118 (9.3%) |
| 8:30 AM to 8:59 AM | 28 (2.2%) | 24 (1.9%) |
| 9:00 AM to 9:59 AM | 90 (7.0%) | 78 (6.1%) |
| 10:00 AM to 10:59 AM | 12 (0.9%) | 28 (2.2%) |
| 11:00 AM to 11:59 AM | 0 (0.0%) | 40 (3.1%) |
| 12:00 PM to 3:59 PM | 195 (15.1%) | 76 (6.0%) |
| 4:00 PM to 11:59 PM | 300 (23.2%) | 113 (8.9%) |
| Total | 1,295 (100.0%) | 1,273 (100.0%) |
Housing Occupancy in Cynthiana
Occupancy by Ownership in Cynthiana
Of the total 2,544 dwellings in Cynthiana, owner-occupied units account for 1,240 (48.7%), while renter-occupied units make up 1,304 (51.3%).
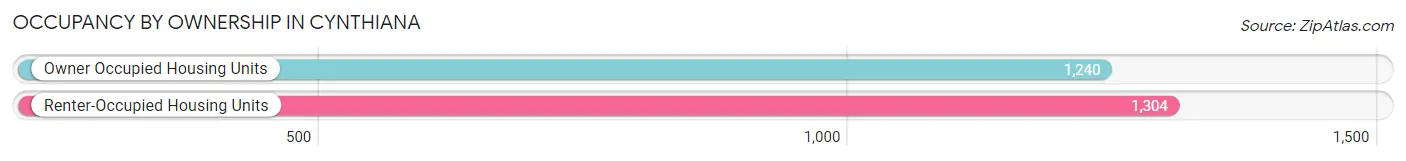
| Occupancy | # Housing Units | % Housing Units |
| Owner Occupied Housing Units | 1,240 | 48.7% |
| Renter-Occupied Housing Units | 1,304 | 51.3% |
| Total Occupied Housing Units | 2,544 | 100.0% |
Occupancy by Household Size in Cynthiana
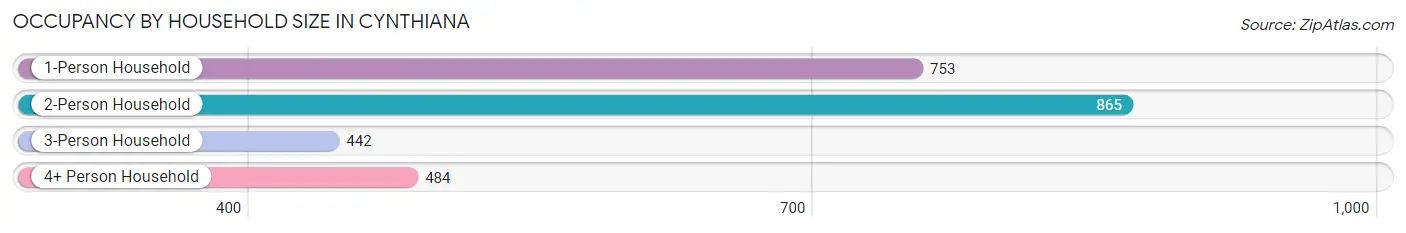
| Household Size | # Housing Units | % Housing Units |
| 1-Person Household | 753 | 29.6% |
| 2-Person Household | 865 | 34.0% |
| 3-Person Household | 442 | 17.4% |
| 4+ Person Household | 484 | 19.0% |
| Total Housing Units | 2,544 | 100.0% |
Occupancy by Ownership by Household Size in Cynthiana
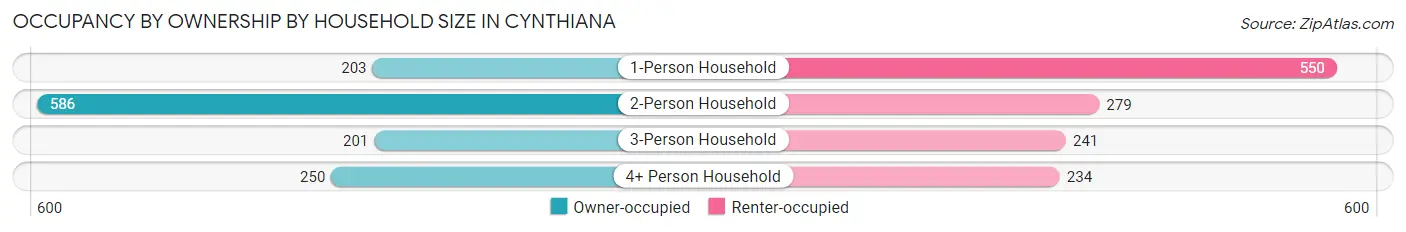
| Household Size | Owner-occupied | Renter-occupied |
| 1-Person Household | 203 (27.0%) | 550 (73.0%) |
| 2-Person Household | 586 (67.7%) | 279 (32.3%) |
| 3-Person Household | 201 (45.5%) | 241 (54.5%) |
| 4+ Person Household | 250 (51.6%) | 234 (48.3%) |
| Total Housing Units | 1,240 (48.7%) | 1,304 (51.3%) |
Occupancy by Educational Attainment in Cynthiana
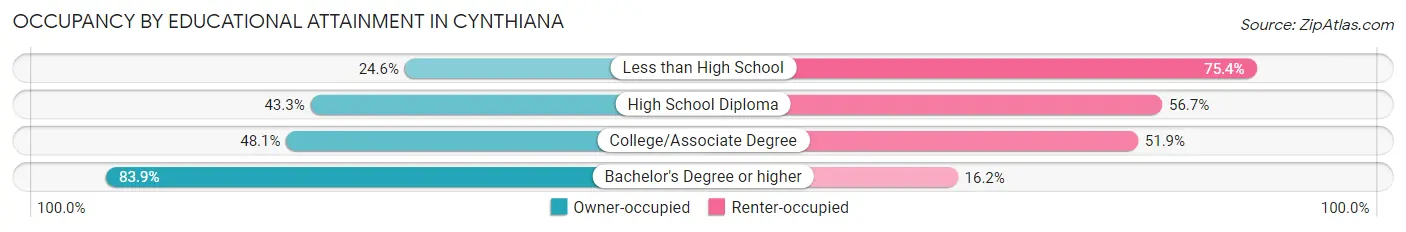
| Household Size | Owner-occupied | Renter-occupied |
| Less than High School | 67 (24.6%) | 205 (75.4%) |
| High School Diploma | 519 (43.3%) | 679 (56.7%) |
| College/Associate Degree | 332 (48.1%) | 358 (51.9%) |
| Bachelor's Degree or higher | 322 (83.9%) | 62 (16.2%) |
Occupancy by Age of Householder in Cynthiana
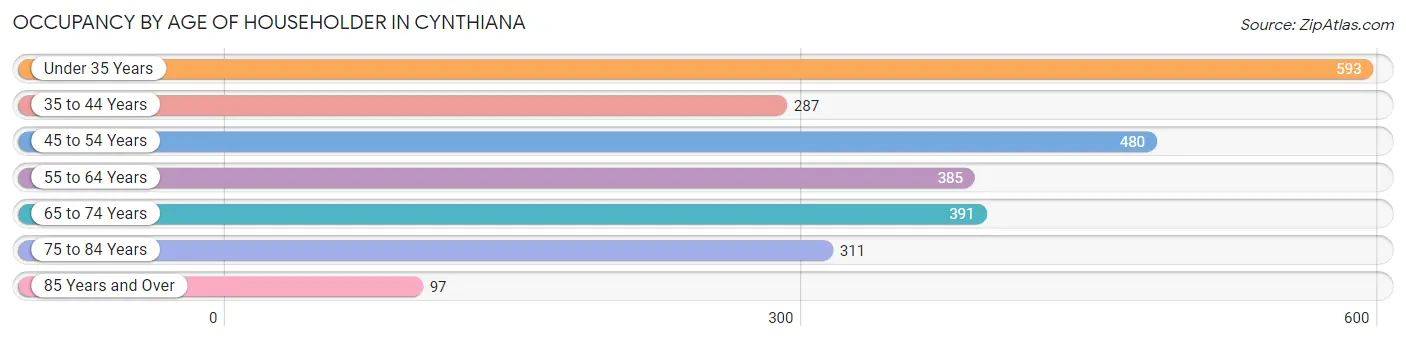
| Age Bracket | # Households | % Households |
| Under 35 Years | 593 | 23.3% |
| 35 to 44 Years | 287 | 11.3% |
| 45 to 54 Years | 480 | 18.9% |
| 55 to 64 Years | 385 | 15.1% |
| 65 to 74 Years | 391 | 15.4% |
| 75 to 84 Years | 311 | 12.2% |
| 85 Years and Over | 97 | 3.8% |
| Total | 2,544 | 100.0% |
Housing Finances in Cynthiana
Median Income by Occupancy in Cynthiana
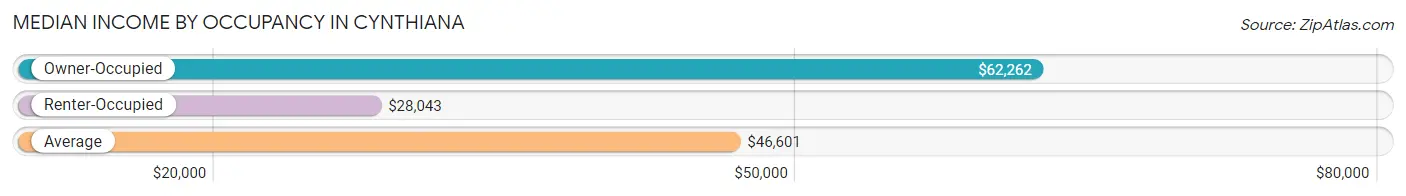
| Occupancy Type | # Households | Median Income |
| Owner-Occupied | 1,240 (48.7%) | $62,262 |
| Renter-Occupied | 1,304 (51.3%) | $28,043 |
| Average | 2,544 (100.0%) | $46,601 |
Occupancy by Householder Income Bracket in Cynthiana
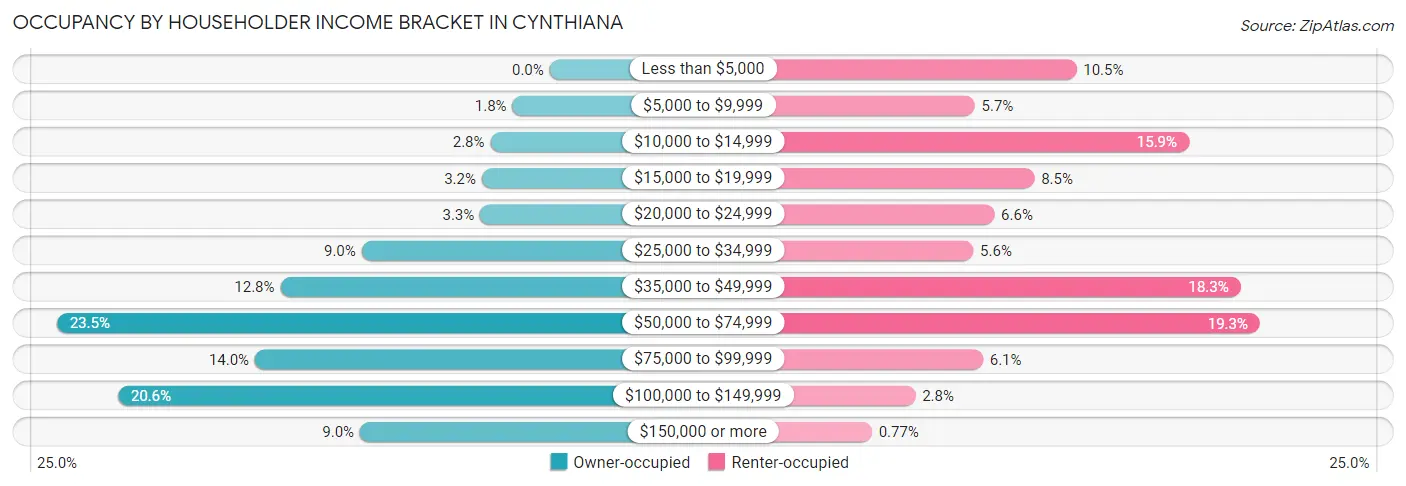
| Income Bracket | Owner-occupied | Renter-occupied |
| Less than $5,000 | 0 (0.0%) | 137 (10.5%) |
| $5,000 to $9,999 | 22 (1.8%) | 74 (5.7%) |
| $10,000 to $14,999 | 35 (2.8%) | 207 (15.9%) |
| $15,000 to $19,999 | 40 (3.2%) | 111 (8.5%) |
| $20,000 to $24,999 | 41 (3.3%) | 86 (6.6%) |
| $25,000 to $34,999 | 111 (8.9%) | 73 (5.6%) |
| $35,000 to $49,999 | 159 (12.8%) | 239 (18.3%) |
| $50,000 to $74,999 | 291 (23.5%) | 251 (19.3%) |
| $75,000 to $99,999 | 174 (14.0%) | 79 (6.1%) |
| $100,000 to $149,999 | 255 (20.6%) | 37 (2.8%) |
| $150,000 or more | 112 (9.0%) | 10 (0.8%) |
| Total | 1,240 (100.0%) | 1,304 (100.0%) |
Monthly Housing Cost Tiers in Cynthiana
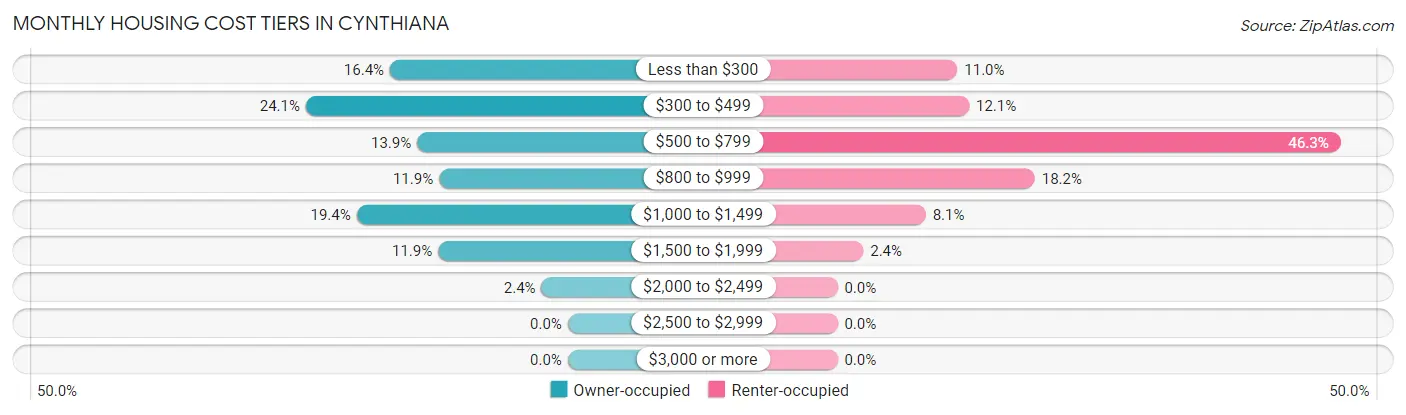
| Monthly Cost | Owner-occupied | Renter-occupied |
| Less than $300 | 203 (16.4%) | 144 (11.0%) |
| $300 to $499 | 299 (24.1%) | 158 (12.1%) |
| $500 to $799 | 172 (13.9%) | 604 (46.3%) |
| $800 to $999 | 147 (11.8%) | 237 (18.2%) |
| $1,000 to $1,499 | 241 (19.4%) | 106 (8.1%) |
| $1,500 to $1,999 | 148 (11.9%) | 31 (2.4%) |
| $2,000 to $2,499 | 30 (2.4%) | 0 (0.0%) |
| $2,500 to $2,999 | 0 (0.0%) | 0 (0.0%) |
| $3,000 or more | 0 (0.0%) | 0 (0.0%) |
| Total | 1,240 (100.0%) | 1,304 (100.0%) |
Physical Housing Characteristics in Cynthiana
Housing Structures in Cynthiana
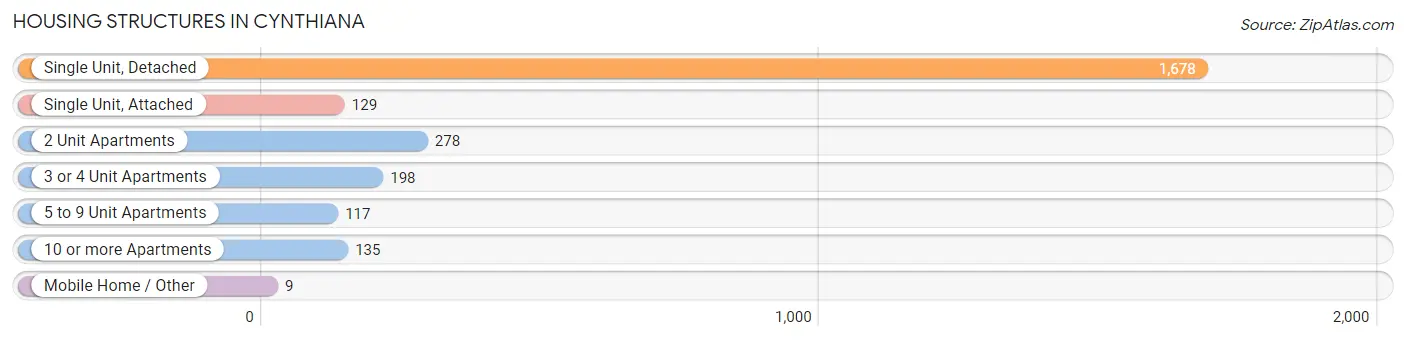
| Structure Type | # Housing Units | % Housing Units |
| Single Unit, Detached | 1,678 | 66.0% |
| Single Unit, Attached | 129 | 5.1% |
| 2 Unit Apartments | 278 | 10.9% |
| 3 or 4 Unit Apartments | 198 | 7.8% |
| 5 to 9 Unit Apartments | 117 | 4.6% |
| 10 or more Apartments | 135 | 5.3% |
| Mobile Home / Other | 9 | 0.4% |
| Total | 2,544 | 100.0% |
Housing Structures by Occupancy in Cynthiana
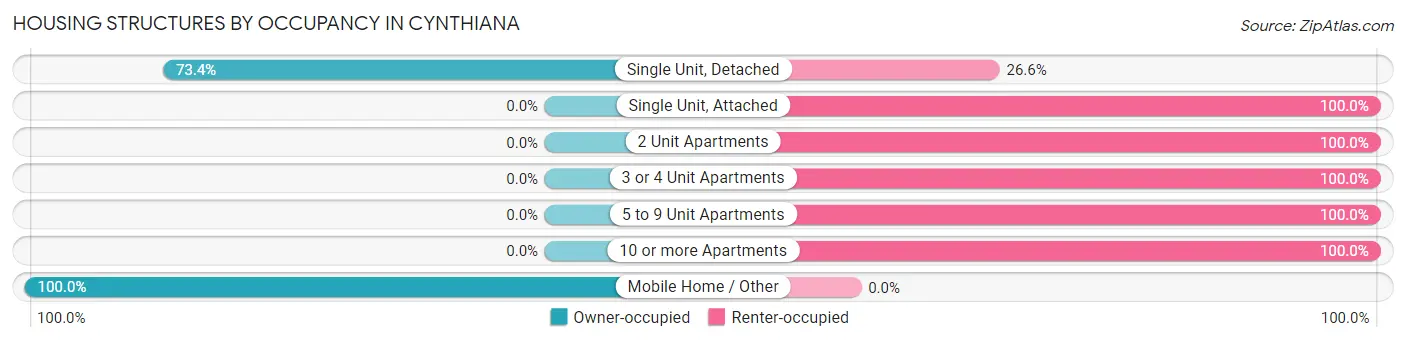
| Structure Type | Owner-occupied | Renter-occupied |
| Single Unit, Detached | 1,231 (73.4%) | 447 (26.6%) |
| Single Unit, Attached | 0 (0.0%) | 129 (100.0%) |
| 2 Unit Apartments | 0 (0.0%) | 278 (100.0%) |
| 3 or 4 Unit Apartments | 0 (0.0%) | 198 (100.0%) |
| 5 to 9 Unit Apartments | 0 (0.0%) | 117 (100.0%) |
| 10 or more Apartments | 0 (0.0%) | 135 (100.0%) |
| Mobile Home / Other | 9 (100.0%) | 0 (0.0%) |
| Total | 1,240 (48.7%) | 1,304 (51.3%) |
Housing Structures by Number of Rooms in Cynthiana
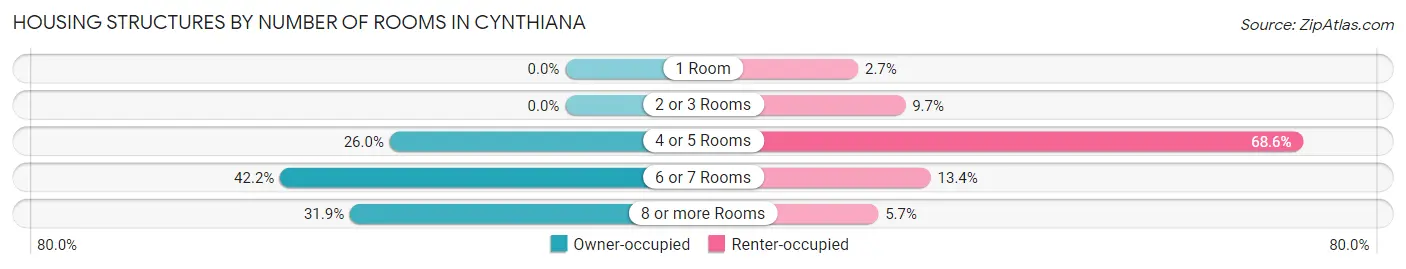
| Number of Rooms | Owner-occupied | Renter-occupied |
| 1 Room | 0 (0.0%) | 35 (2.7%) |
| 2 or 3 Rooms | 0 (0.0%) | 126 (9.7%) |
| 4 or 5 Rooms | 322 (26.0%) | 894 (68.6%) |
| 6 or 7 Rooms | 523 (42.2%) | 175 (13.4%) |
| 8 or more Rooms | 395 (31.9%) | 74 (5.7%) |
| Total | 1,240 (100.0%) | 1,304 (100.0%) |
Housing Structure by Heating Type in Cynthiana
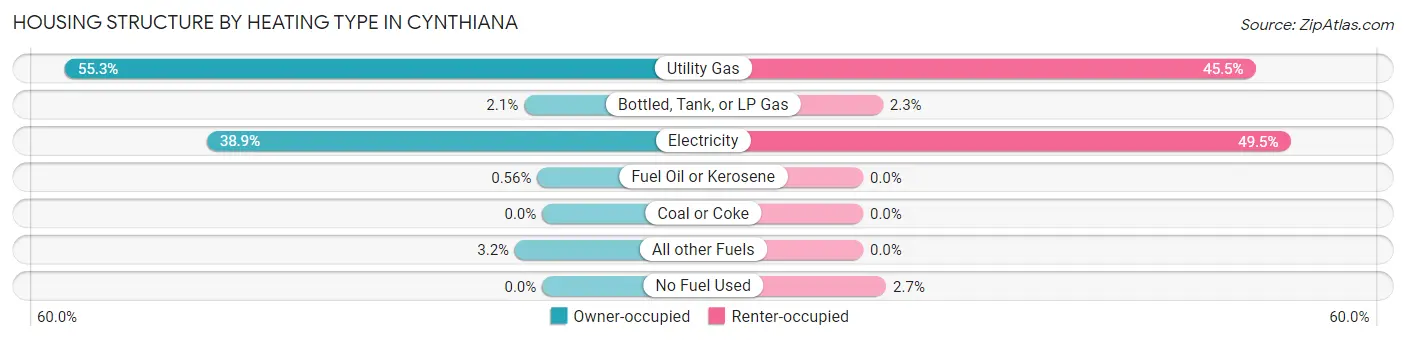
| Heating Type | Owner-occupied | Renter-occupied |
| Utility Gas | 686 (55.3%) | 593 (45.5%) |
| Bottled, Tank, or LP Gas | 26 (2.1%) | 30 (2.3%) |
| Electricity | 482 (38.9%) | 646 (49.5%) |
| Fuel Oil or Kerosene | 7 (0.6%) | 0 (0.0%) |
| Coal or Coke | 0 (0.0%) | 0 (0.0%) |
| All other Fuels | 39 (3.2%) | 0 (0.0%) |
| No Fuel Used | 0 (0.0%) | 35 (2.7%) |
| Total | 1,240 (100.0%) | 1,304 (100.0%) |
Household Vehicle Usage in Cynthiana
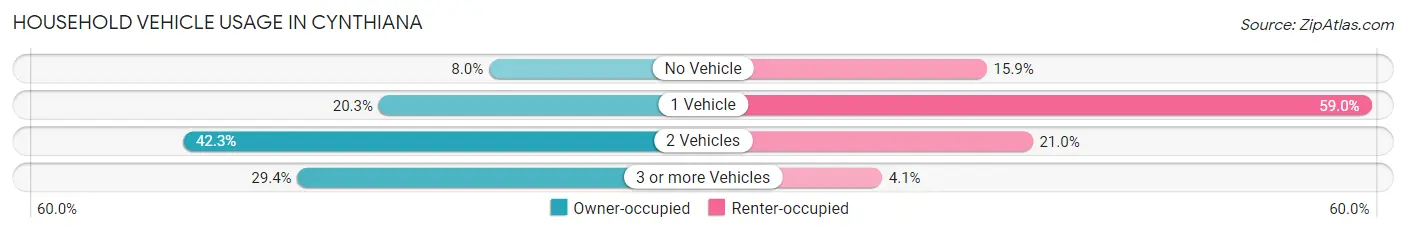
| Vehicles per Household | Owner-occupied | Renter-occupied |
| No Vehicle | 99 (8.0%) | 207 (15.9%) |
| 1 Vehicle | 252 (20.3%) | 769 (59.0%) |
| 2 Vehicles | 524 (42.3%) | 274 (21.0%) |
| 3 or more Vehicles | 365 (29.4%) | 54 (4.1%) |
| Total | 1,240 (100.0%) | 1,304 (100.0%) |
Real Estate & Mortgages in Cynthiana
Real Estate and Mortgage Overview in Cynthiana
| Characteristic | Without Mortgage | With Mortgage |
| Housing Units | 640 | 600 |
| Median Property Value | $121,600 | $183,800 |
| Median Household Income | $57,611 | $79 |
| Monthly Housing Costs | $358 | $0 |
| Real Estate Taxes | $862 | $0 |
Property Value by Mortgage Status in Cynthiana
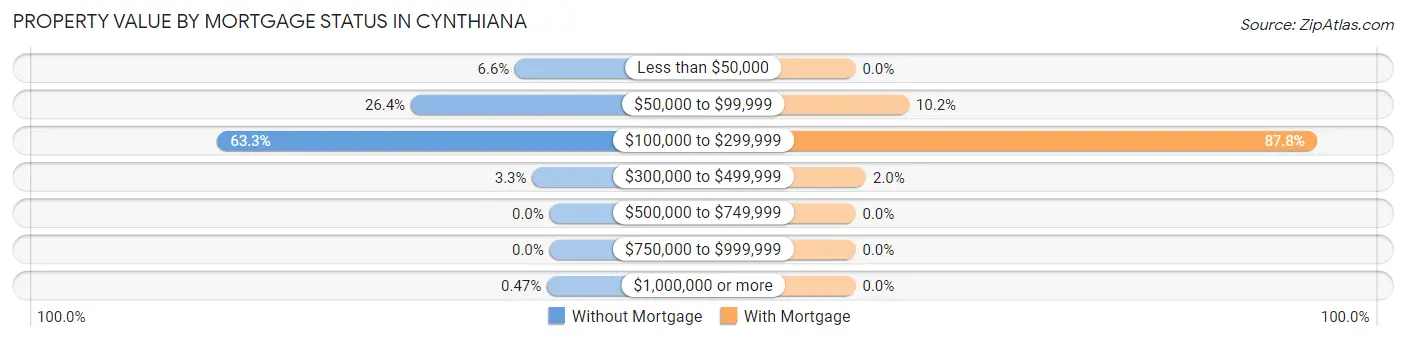
| Property Value | Without Mortgage | With Mortgage |
| Less than $50,000 | 42 (6.6%) | 0 (0.0%) |
| $50,000 to $99,999 | 169 (26.4%) | 61 (10.2%) |
| $100,000 to $299,999 | 405 (63.3%) | 527 (87.8%) |
| $300,000 to $499,999 | 21 (3.3%) | 12 (2.0%) |
| $500,000 to $749,999 | 0 (0.0%) | 0 (0.0%) |
| $750,000 to $999,999 | 0 (0.0%) | 0 (0.0%) |
| $1,000,000 or more | 3 (0.5%) | 0 (0.0%) |
| Total | 640 (100.0%) | 600 (100.0%) |
Household Income by Mortgage Status in Cynthiana
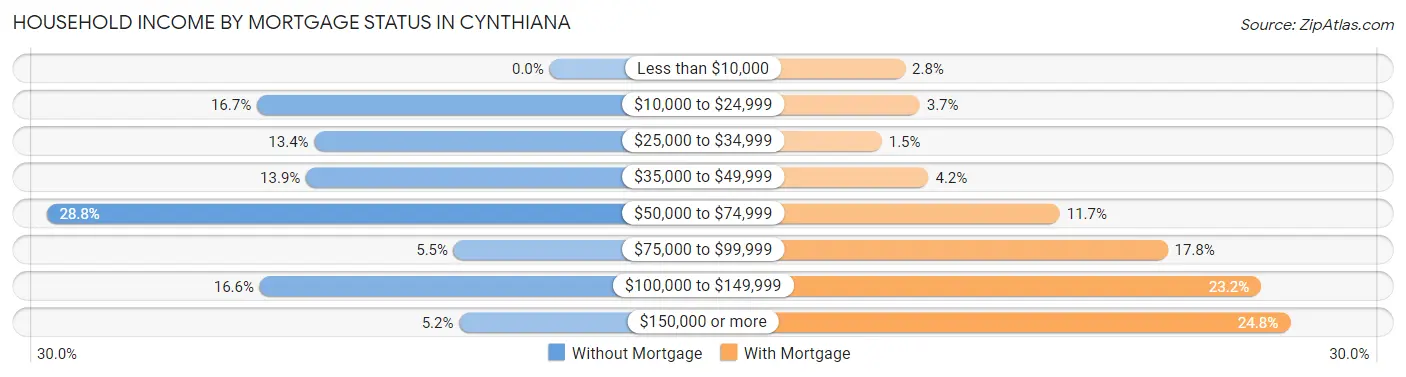
| Household Income | Without Mortgage | With Mortgage |
| Less than $10,000 | 0 (0.0%) | 17 (2.8%) |
| $10,000 to $24,999 | 107 (16.7%) | 22 (3.7%) |
| $25,000 to $34,999 | 86 (13.4%) | 9 (1.5%) |
| $35,000 to $49,999 | 89 (13.9%) | 25 (4.2%) |
| $50,000 to $74,999 | 184 (28.7%) | 70 (11.7%) |
| $75,000 to $99,999 | 35 (5.5%) | 107 (17.8%) |
| $100,000 to $149,999 | 106 (16.6%) | 139 (23.2%) |
| $150,000 or more | 33 (5.2%) | 149 (24.8%) |
| Total | 640 (100.0%) | 600 (100.0%) |
Property Value to Household Income Ratio in Cynthiana
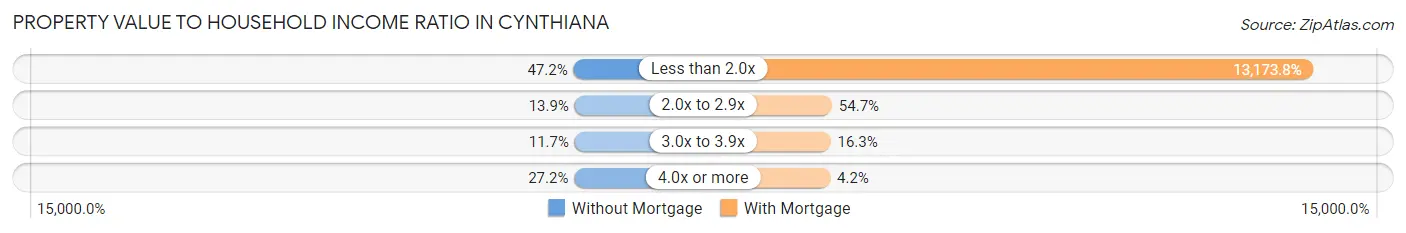
| Value-to-Income Ratio | Without Mortgage | With Mortgage |
| Less than 2.0x | 302 (47.2%) | 79,043 (13,173.8%) |
| 2.0x to 2.9x | 89 (13.9%) | 328 (54.7%) |
| 3.0x to 3.9x | 75 (11.7%) | 98 (16.3%) |
| 4.0x or more | 174 (27.2%) | 25 (4.2%) |
| Total | 640 (100.0%) | 600 (100.0%) |
Real Estate Taxes by Mortgage Status in Cynthiana

| Property Taxes | Without Mortgage | With Mortgage |
| Less than $800 | 287 (44.8%) | 0 (0.0%) |
| $800 to $1,499 | 217 (33.9%) | 77 (12.8%) |
| $800 to $1,499 | 123 (19.2%) | 325 (54.2%) |
| Total | 640 (100.0%) | 600 (100.0%) |
Health & Disability in Cynthiana
Health Insurance Coverage by Age in Cynthiana
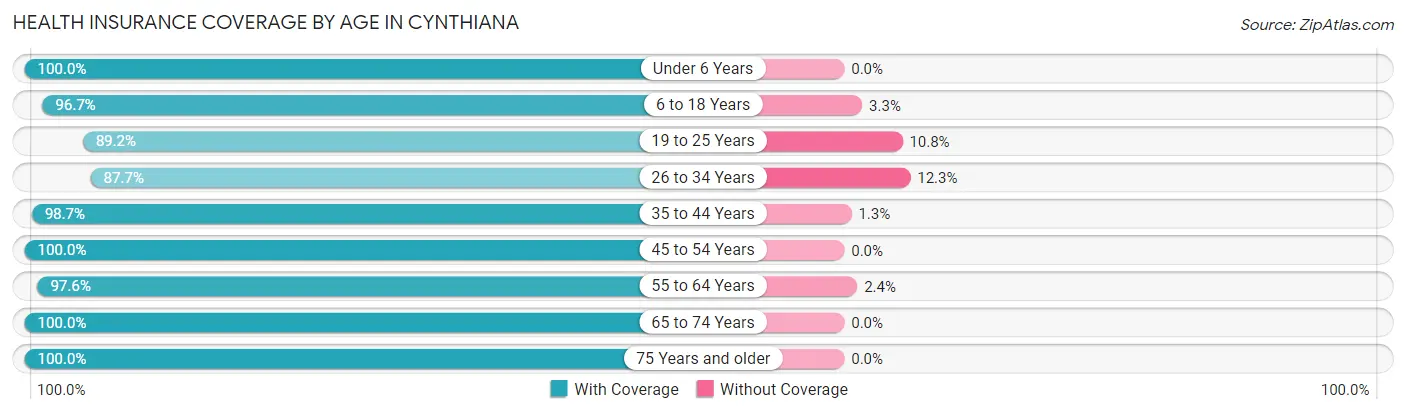
| Age Bracket | With Coverage | Without Coverage |
| Under 6 Years | 539 (100.0%) | 0 (0.0%) |
| 6 to 18 Years | 928 (96.7%) | 32 (3.3%) |
| 19 to 25 Years | 543 (89.2%) | 66 (10.8%) |
| 26 to 34 Years | 642 (87.7%) | 90 (12.3%) |
| 35 to 44 Years | 518 (98.7%) | 7 (1.3%) |
| 45 to 54 Years | 782 (100.0%) | 0 (0.0%) |
| 55 to 64 Years | 970 (97.6%) | 24 (2.4%) |
| 65 to 74 Years | 642 (100.0%) | 0 (0.0%) |
| 75 Years and older | 502 (100.0%) | 0 (0.0%) |
| Total | 6,066 (96.5%) | 219 (3.5%) |
Health Insurance Coverage by Citizenship Status in Cynthiana
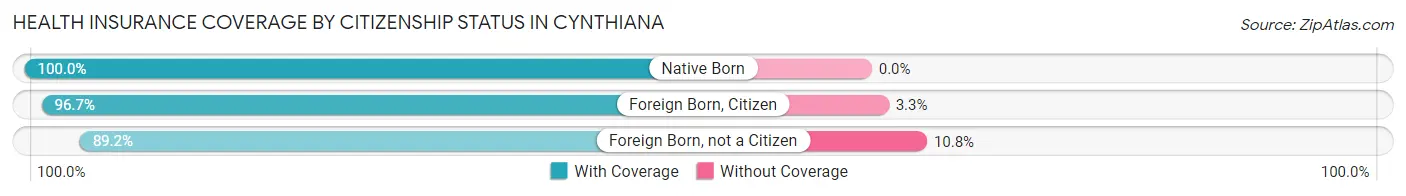
| Citizenship Status | With Coverage | Without Coverage |
| Native Born | 539 (100.0%) | 0 (0.0%) |
| Foreign Born, Citizen | 928 (96.7%) | 32 (3.3%) |
| Foreign Born, not a Citizen | 543 (89.2%) | 66 (10.8%) |
Health Insurance Coverage by Household Income in Cynthiana
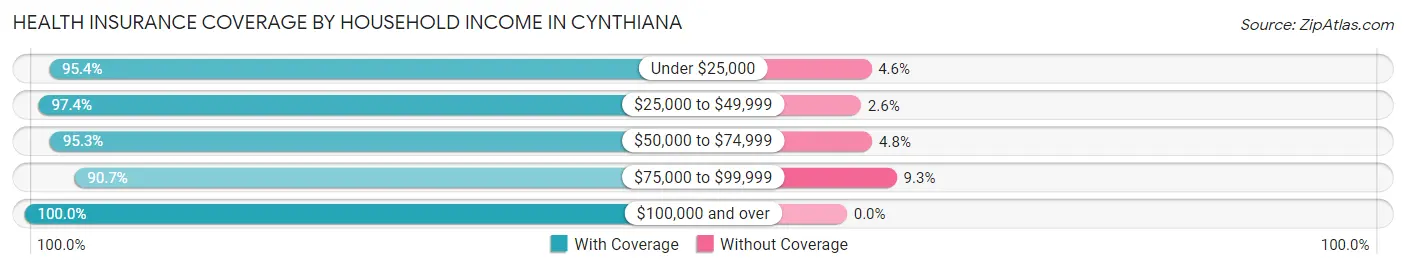
| Household Income | With Coverage | Without Coverage |
| Under $25,000 | 1,354 (95.4%) | 65 (4.6%) |
| $25,000 to $49,999 | 1,330 (97.4%) | 36 (2.6%) |
| $50,000 to $74,999 | 1,003 (95.3%) | 50 (4.8%) |
| $75,000 to $99,999 | 660 (90.7%) | 68 (9.3%) |
| $100,000 and over | 1,551 (100.0%) | 0 (0.0%) |
Public vs Private Health Insurance Coverage by Age in Cynthiana
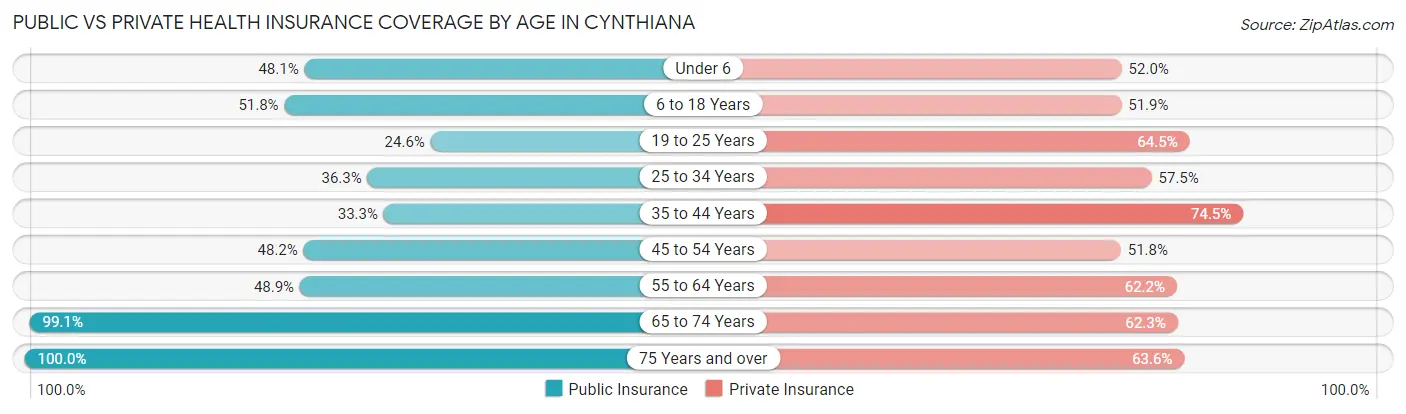
| Age Bracket | Public Insurance | Private Insurance |
| Under 6 | 259 (48.0%) | 280 (51.9%) |
| 6 to 18 Years | 497 (51.8%) | 498 (51.9%) |
| 19 to 25 Years | 150 (24.6%) | 393 (64.5%) |
| 25 to 34 Years | 266 (36.3%) | 421 (57.5%) |
| 35 to 44 Years | 175 (33.3%) | 391 (74.5%) |
| 45 to 54 Years | 377 (48.2%) | 405 (51.8%) |
| 55 to 64 Years | 486 (48.9%) | 618 (62.2%) |
| 65 to 74 Years | 636 (99.1%) | 400 (62.3%) |
| 75 Years and over | 502 (100.0%) | 319 (63.5%) |
| Total | 3,348 (53.3%) | 3,725 (59.3%) |
Disability Status by Sex by Age in Cynthiana
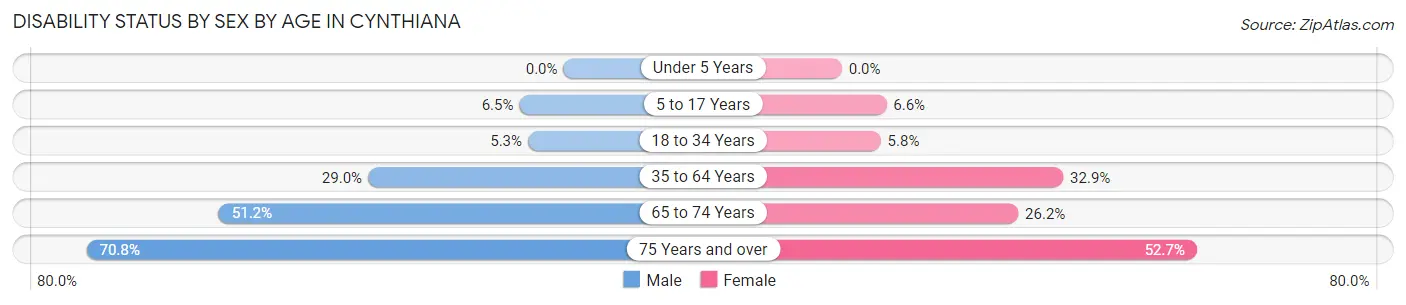
| Age Bracket | Male | Female |
| Under 5 Years | 0 (0.0%) | 0 (0.0%) |
| 5 to 17 Years | 34 (6.5%) | 26 (6.6%) |
| 18 to 34 Years | 34 (5.3%) | 44 (5.8%) |
| 35 to 64 Years | 289 (29.0%) | 429 (32.9%) |
| 65 to 74 Years | 178 (51.1%) | 77 (26.2%) |
| 75 Years and over | 80 (70.8%) | 205 (52.7%) |
Disability Class by Sex by Age in Cynthiana
Disability Class: Hearing Difficulty
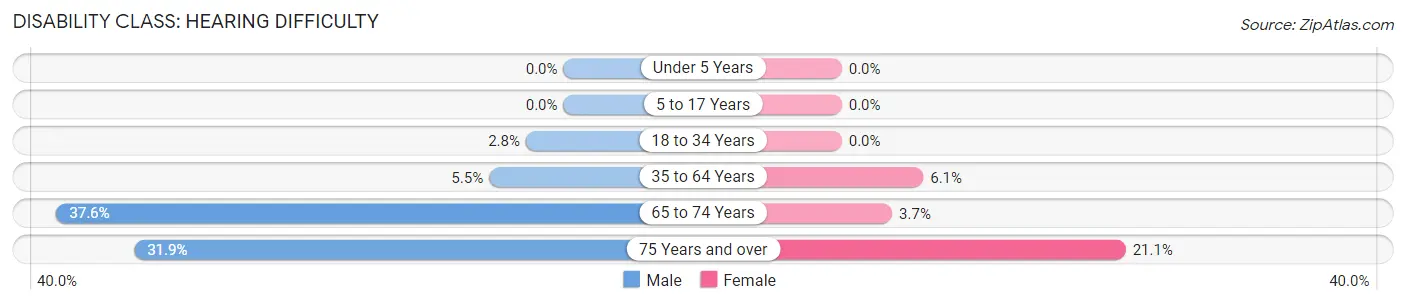
| Age Bracket | Male | Female |
| Under 5 Years | 0 (0.0%) | 0 (0.0%) |
| 5 to 17 Years | 0 (0.0%) | 0 (0.0%) |
| 18 to 34 Years | 18 (2.8%) | 0 (0.0%) |
| 35 to 64 Years | 55 (5.5%) | 79 (6.0%) |
| 65 to 74 Years | 131 (37.6%) | 11 (3.7%) |
| 75 Years and over | 36 (31.9%) | 82 (21.1%) |
Disability Class: Vision Difficulty
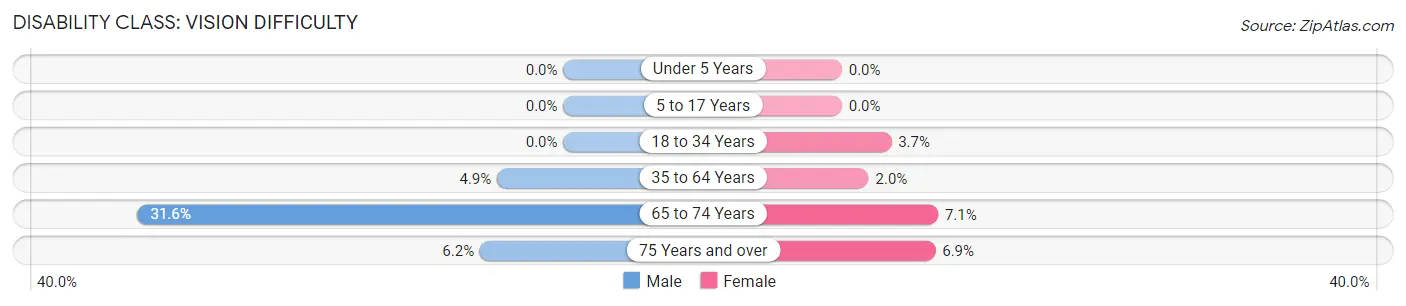
| Age Bracket | Male | Female |
| Under 5 Years | 0 (0.0%) | 0 (0.0%) |
| 5 to 17 Years | 0 (0.0%) | 0 (0.0%) |
| 18 to 34 Years | 0 (0.0%) | 28 (3.7%) |
| 35 to 64 Years | 49 (4.9%) | 26 (2.0%) |
| 65 to 74 Years | 110 (31.6%) | 21 (7.1%) |
| 75 Years and over | 7 (6.2%) | 27 (6.9%) |
Disability Class: Cognitive Difficulty
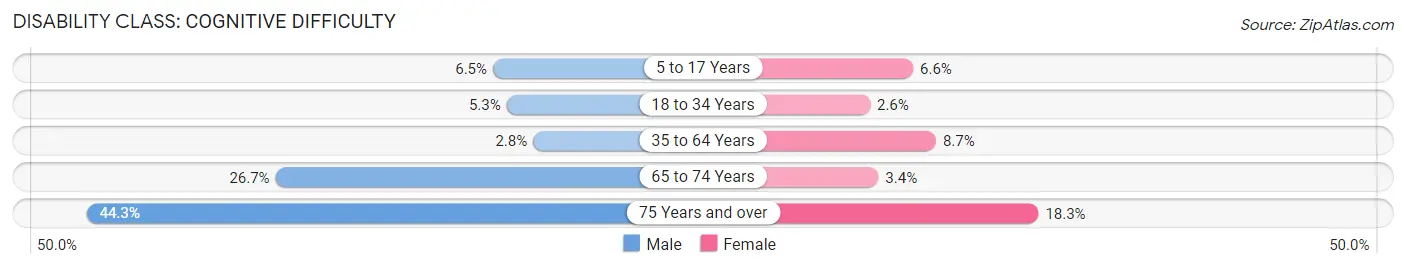
| Age Bracket | Male | Female |
| 5 to 17 Years | 34 (6.5%) | 26 (6.6%) |
| 18 to 34 Years | 34 (5.3%) | 20 (2.6%) |
| 35 to 64 Years | 28 (2.8%) | 114 (8.7%) |
| 65 to 74 Years | 93 (26.7%) | 10 (3.4%) |
| 75 Years and over | 50 (44.3%) | 71 (18.2%) |
Disability Class: Ambulatory Difficulty
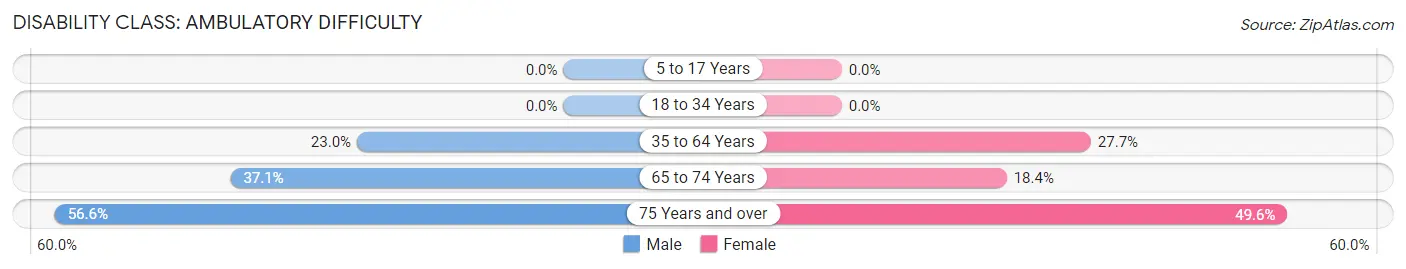
| Age Bracket | Male | Female |
| 5 to 17 Years | 0 (0.0%) | 0 (0.0%) |
| 18 to 34 Years | 0 (0.0%) | 0 (0.0%) |
| 35 to 64 Years | 229 (23.0%) | 362 (27.7%) |
| 65 to 74 Years | 129 (37.1%) | 54 (18.4%) |
| 75 Years and over | 64 (56.6%) | 193 (49.6%) |
Disability Class: Self-Care Difficulty
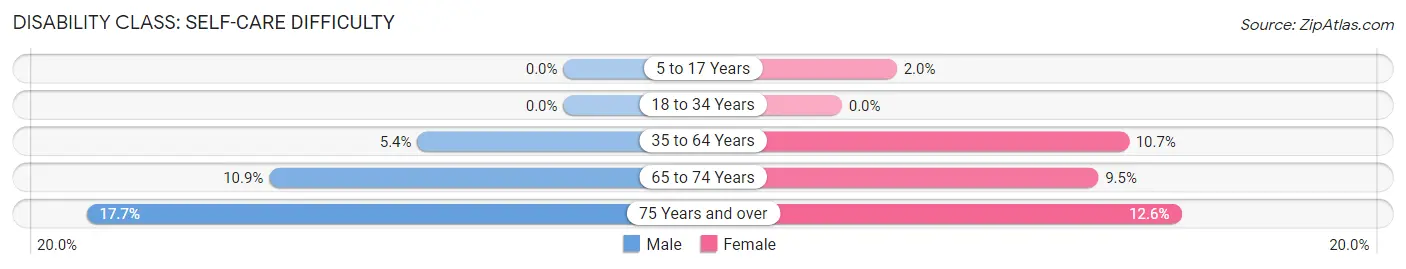
| Age Bracket | Male | Female |
| 5 to 17 Years | 0 (0.0%) | 8 (2.0%) |
| 18 to 34 Years | 0 (0.0%) | 0 (0.0%) |
| 35 to 64 Years | 54 (5.4%) | 139 (10.6%) |
| 65 to 74 Years | 38 (10.9%) | 28 (9.5%) |
| 75 Years and over | 20 (17.7%) | 49 (12.6%) |
Technology Access in Cynthiana
Computing Device Access in Cynthiana
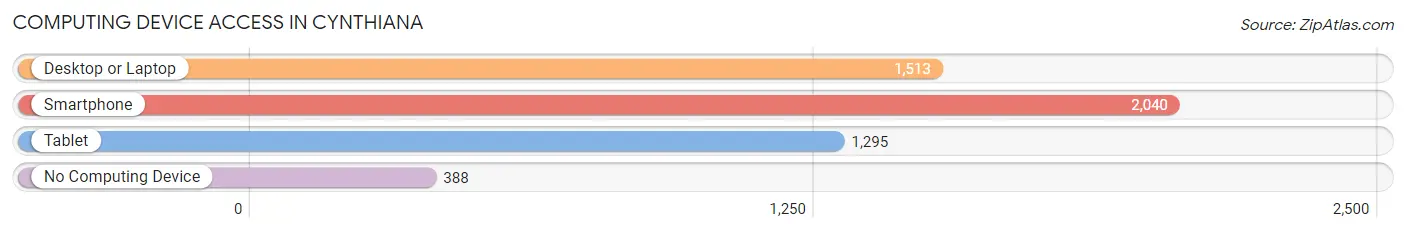
| Device Type | # Households | % Households |
| Desktop or Laptop | 1,513 | 59.5% |
| Smartphone | 2,040 | 80.2% |
| Tablet | 1,295 | 50.9% |
| No Computing Device | 388 | 15.2% |
| Total | 2,544 | 100.0% |
Internet Access in Cynthiana
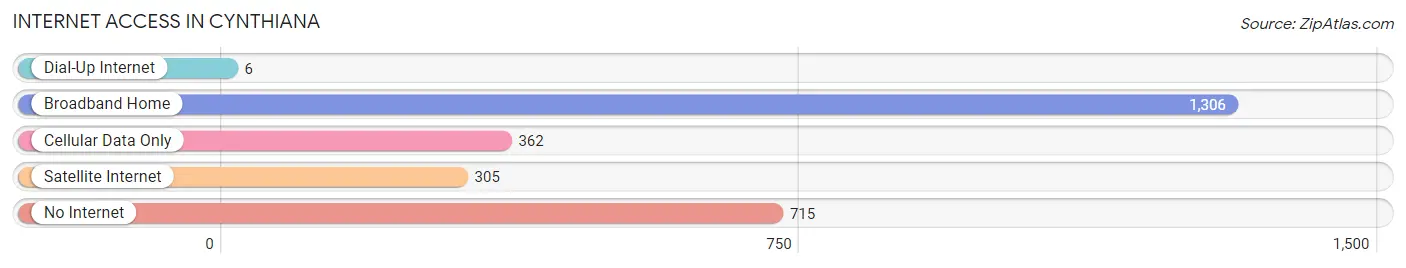
| Internet Type | # Households | % Households |
| Dial-Up Internet | 6 | 0.2% |
| Broadband Home | 1,306 | 51.3% |
| Cellular Data Only | 362 | 14.2% |
| Satellite Internet | 305 | 12.0% |
| No Internet | 715 | 28.1% |
| Total | 2,544 | 100.0% |
Cynthiana Summary
Cynthiana is a city located in Harrison County, Kentucky, United States. It is the county seat of Harrison County and the population was 6,402 at the 2010 census. The city is located in the heart of the Bluegrass region of Kentucky and is known for its rich history, beautiful scenery, and friendly people.
History
Cynthiana was founded in 1793 by Colonel Robert Patterson, a Revolutionary War veteran. The city was named after his wife, Cynthia, and the Greek word for flower, hana. The city was incorporated in 1836 and has been the county seat of Harrison County since 1838.
Cynthiana was an important stop on the Lexington and Big Sandy Railroad, which connected Lexington to the Ohio River. The railroad was completed in 1873 and was a major factor in the growth of the city.
Cynthiana was also the site of a major Civil War battle in 1862. The Battle of Cynthiana was fought between Union and Confederate forces and resulted in a Confederate victory. The battle was a major turning point in the war and helped to secure the Confederate victory in Kentucky.
Geography
Cynthiana is located in the heart of the Bluegrass region of Kentucky. The city is situated in the foothills of the Appalachian Mountains and is surrounded by rolling hills and lush farmland. The city is located at the intersection of US 27 and KY 36 and is about 40 miles northeast of Lexington.
The climate in Cynthiana is mild and humid with hot summers and cold winters. The average temperature in the summer is around 80 degrees Fahrenheit and the average temperature in the winter is around 40 degrees Fahrenheit.
Economy
Cynthiana’s economy is largely based on agriculture and manufacturing. The city is home to several large manufacturing companies, including a paper mill, a furniture factory, and a plastics plant. The city is also home to several small businesses, including restaurants, retail stores, and service providers.
The city is also home to several educational institutions, including a community college and a technical school. The city is also home to several hospitals and medical centers.
Demographics
As of the 2010 census, the population of Cynthiana was 6,402. The racial makeup of the city was 95.3% White, 2.2% African American, 0.3% Native American, 0.3% Asian, 0.1% Pacific Islander, 0.7% from other races, and 1.3% from two or more races. Hispanic or Latino of any race were 1.7% of the population.
The median income for a household in the city was $35,938 and the median income for a family was $45,938. The per capita income for the city was $19,938. About 15.3% of families and 19.2% of the population were below the poverty line, including 28.3% of those under age 18 and 11.2% of those age 65 or over.
Cynthiana is a city with a rich history, beautiful scenery, and friendly people. The city is home to several large manufacturing companies and educational institutions, and is a great place to live and work. The city is also home to several hospitals and medical centers, making it a great place to receive medical care. The city is a great place to visit and explore, and is sure to provide a memorable experience.
Common Questions
What is Per Capita Income in Cynthiana?
Per Capita income in Cynthiana is $24,324.
What is the Median Family Income in Cynthiana?
Median Family Income in Cynthiana is $52,016.
What is the Median Household income in Cynthiana?
Median Household Income in Cynthiana is $46,601.
What is Income or Wage Gap in Cynthiana?
Income or Wage Gap in Cynthiana is 23.6%.
Women in Cynthiana earn 76.4 cents for every dollar earned by a man.
What is Inequality or Gini Index in Cynthiana?
Inequality or Gini Index in Cynthiana is 0.44.
What is the Total Population of Cynthiana?
Total Population of Cynthiana is 6,355.
What is the Total Male Population of Cynthiana?
Total Male Population of Cynthiana is 2,895.
What is the Total Female Population of Cynthiana?
Total Female Population of Cynthiana is 3,460.
What is the Ratio of Males per 100 Females in Cynthiana?
There are 83.67 Males per 100 Females in Cynthiana.
What is the Ratio of Females per 100 Males in Cynthiana?
There are 119.52 Females per 100 Males in Cynthiana.
What is the Median Population Age in Cynthiana?
Median Population Age in Cynthiana is 41.8 Years.
What is the Average Family Size in Cynthiana
Average Family Size in Cynthiana is 2.9 People.
What is the Average Household Size in Cynthiana
Average Household Size in Cynthiana is 2.4 People.
How Large is the Labor Force in Cynthiana?
There are 2,765 People in the Labor Forcein in Cynthiana.
What is the Percentage of People in the Labor Force in Cynthiana?
53.9% of People are in the Labor Force in Cynthiana.
What is the Unemployment Rate in Cynthiana?
Unemployment Rate in Cynthiana is 2.1%.