Somerset, KY Map & Demographics
Somerset Map
Somerset Overview
$29,740
PER CAPITA INCOME
$53,459
AVG FAMILY INCOME
$33,245
AVG HOUSEHOLD INCOME
44.9%
WAGE / INCOME GAP [ % ]
55.1¢/ $1
WAGE / INCOME GAP [ $ ]
$13,229
FAMILY INCOME DEFICIT
0.60
INEQUALITY / GINI INDEX
11,998
TOTAL POPULATION
5,921
MALE POPULATION
6,077
FEMALE POPULATION
97.43
MALES / 100 FEMALES
102.63
FEMALES / 100 MALES
38.1
MEDIAN AGE
3.0
AVG FAMILY SIZE
2.5
AVG HOUSEHOLD SIZE
5,059
LABOR FORCE [ PEOPLE ]
52.5%
PERCENT IN LABOR FORCE
8.7%
UNEMPLOYMENT RATE
Somerset Area Codes
Income in Somerset
Income Overview in Somerset
Per Capita Income in Somerset is $29,740, while median incomes of families and households are $53,459 and $33,245 respectively.
| Characteristic | Number | Measure |
| Per Capita Income | 11,998 | $29,740 |
| Median Family Income | 2,717 | $53,459 |
| Mean Family Income | 2,717 | $79,068 |
| Median Household Income | 4,554 | $33,245 |
| Mean Household Income | 4,554 | $70,446 |
| Income Deficit | 2,717 | $13,229 |
| Wage / Income Gap (%) | 11,998 | 44.85% |
| Wage / Income Gap ($) | 11,998 | 55.15¢ per $1 |
| Gini / Inequality Index | 11,998 | 0.60 |
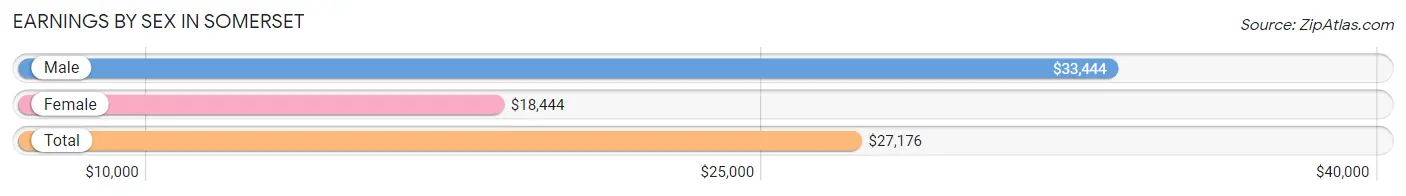
Earnings by Sex in Somerset
Average Earnings in Somerset are $27,176, $33,444 for men and $18,444 for women, a difference of 44.9%.
| Sex | Number | Average Earnings |
| Male | 3,243 (58.6%) | $33,444 |
| Female | 2,290 (41.4%) | $18,444 |
| Total | 5,533 (100.0%) | $27,176 |
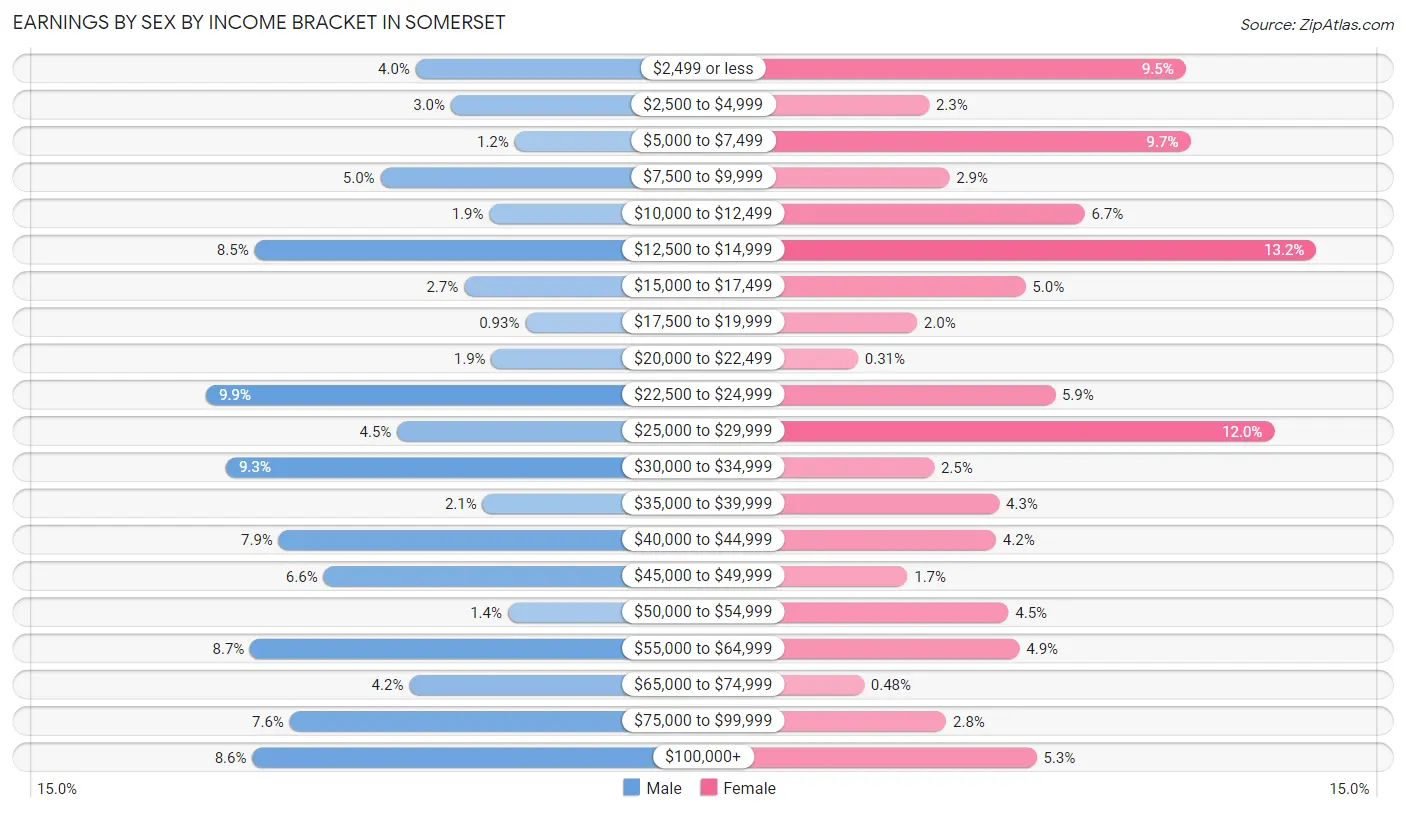
Earnings by Sex by Income Bracket in Somerset
The most common earnings brackets in Somerset are $22,500 to $24,999 for men (321 | 9.9%) and $12,500 to $14,999 for women (302 | 13.2%).
| Income | Male | Female |
| $2,499 or less | 130 (4.0%) | 218 (9.5%) |
| $2,500 to $4,999 | 98 (3.0%) | 53 (2.3%) |
| $5,000 to $7,499 | 40 (1.2%) | 221 (9.7%) |
| $7,500 to $9,999 | 162 (5.0%) | 66 (2.9%) |
| $10,000 to $12,499 | 63 (1.9%) | 153 (6.7%) |
| $12,500 to $14,999 | 277 (8.5%) | 302 (13.2%) |
| $15,000 to $17,499 | 86 (2.6%) | 115 (5.0%) |
| $17,500 to $19,999 | 30 (0.9%) | 45 (2.0%) |
| $20,000 to $22,499 | 61 (1.9%) | 7 (0.3%) |
| $22,500 to $24,999 | 321 (9.9%) | 134 (5.9%) |
| $25,000 to $29,999 | 147 (4.5%) | 275 (12.0%) |
| $30,000 to $34,999 | 303 (9.3%) | 56 (2.5%) |
| $35,000 to $39,999 | 69 (2.1%) | 98 (4.3%) |
| $40,000 to $44,999 | 255 (7.9%) | 96 (4.2%) |
| $45,000 to $49,999 | 214 (6.6%) | 39 (1.7%) |
| $50,000 to $54,999 | 46 (1.4%) | 104 (4.5%) |
| $55,000 to $64,999 | 281 (8.7%) | 111 (4.9%) |
| $65,000 to $74,999 | 136 (4.2%) | 11 (0.5%) |
| $75,000 to $99,999 | 245 (7.5%) | 64 (2.8%) |
| $100,000+ | 279 (8.6%) | 122 (5.3%) |
| Total | 3,243 (100.0%) | 2,290 (100.0%) |
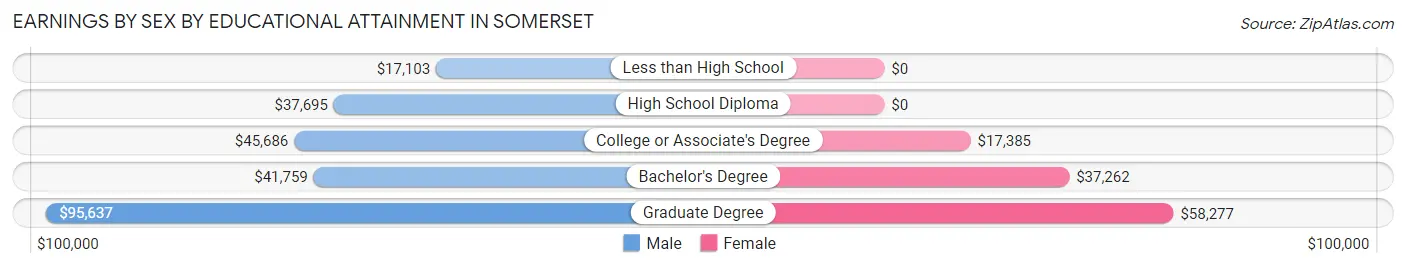
Earnings by Sex by Educational Attainment in Somerset
Average earnings in Somerset are $41,502 for men and $24,188 for women, a difference of 41.7%. Men with an educational attainment of graduate degree enjoy the highest average annual earnings of $95,637, while those with less than high school education earn the least with $17,103. Women with an educational attainment of graduate degree earn the most with the average annual earnings of $58,277, while those with college or associate's degree education have the smallest earnings of $17,385.
| Educational Attainment | Male Income | Female Income |
| Less than High School | $17,103 | $0 |
| High School Diploma | $37,695 | $0 |
| College or Associate's Degree | $45,686 | $17,385 |
| Bachelor's Degree | $41,759 | $37,262 |
| Graduate Degree | $95,637 | $58,277 |
| Total | $41,502 | $24,188 |
Family Income in Somerset
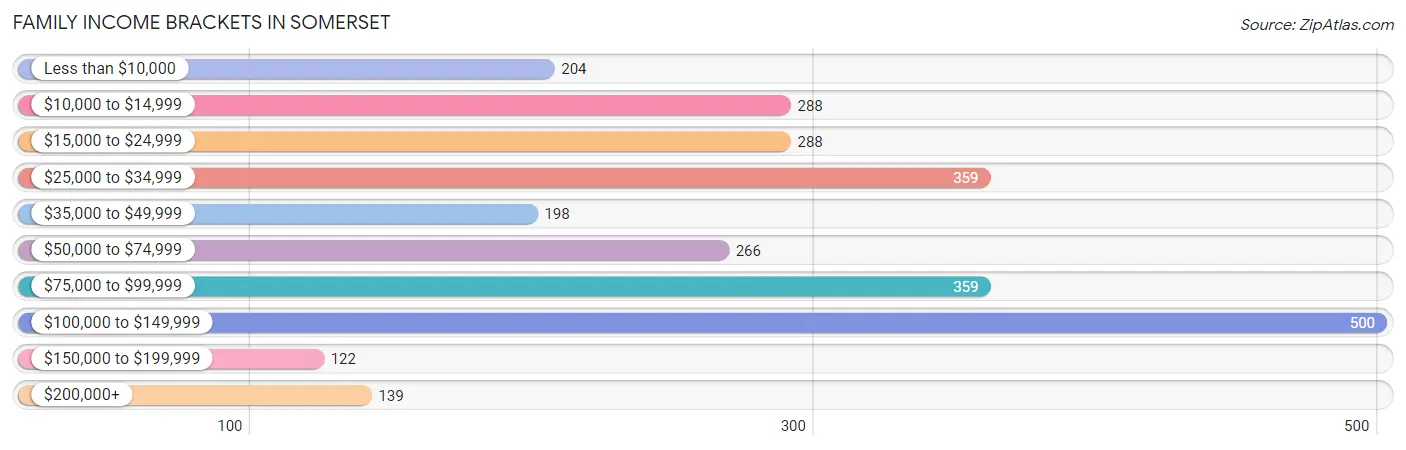
Family Income Brackets in Somerset
According to the Somerset family income data, there are 500 families falling into the $100,000 to $149,999 income range, which is the most common income bracket and makes up 18.4% of all families. Conversely, the $150,000 to $199,999 income bracket is the least frequent group with only 122 families (4.5%) belonging to this category.
| Income Bracket | # Families | % Families |
| Less than $10,000 | 204 | 7.5% |
| $10,000 to $14,999 | 288 | 10.6% |
| $15,000 to $24,999 | 288 | 10.6% |
| $25,000 to $34,999 | 359 | 13.2% |
| $35,000 to $49,999 | 198 | 7.3% |
| $50,000 to $74,999 | 266 | 9.8% |
| $75,000 to $99,999 | 359 | 13.2% |
| $100,000 to $149,999 | 500 | 18.4% |
| $150,000 to $199,999 | 122 | 4.5% |
| $200,000+ | 139 | 5.1% |
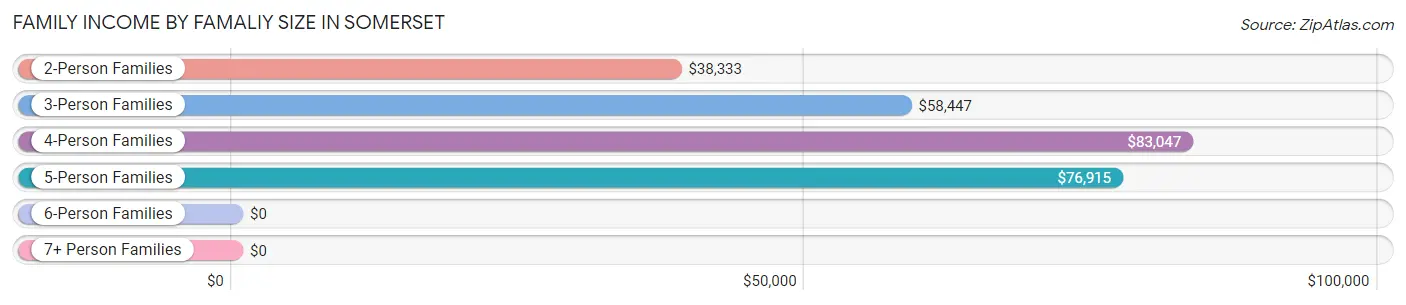
Family Income by Famaliy Size in Somerset
4-person families (492 | 18.1%) account for the highest median family income in Somerset with $83,047 per family, while 4-person families (492 | 18.1%) have the highest median income of $20,762 per family member.
| Income Bracket | # Families | Median Income |
| 2-Person Families | 1,158 (42.6%) | $38,333 |
| 3-Person Families | 743 (27.4%) | $58,447 |
| 4-Person Families | 492 (18.1%) | $83,047 |
| 5-Person Families | 189 (7.0%) | $76,915 |
| 6-Person Families | 0 (0.0%) | $0 |
| 7+ Person Families | 135 (5.0%) | $0 |
| Total | 2,717 (100.0%) | $53,459 |
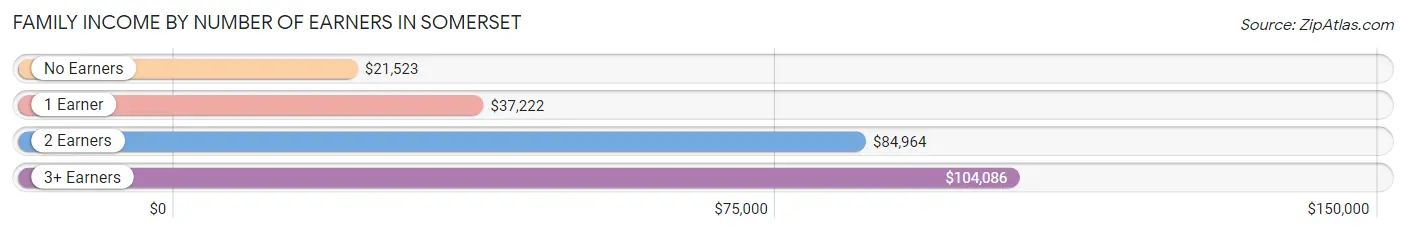
Family Income by Number of Earners in Somerset
The median family income in Somerset is $53,459, with families comprising 3+ earners (185) having the highest median family income of $104,086, while families with no earners (492) have the lowest median family income of $21,523, accounting for 6.8% and 18.1% of families, respectively.
| Number of Earners | # Families | Median Income |
| No Earners | 492 (18.1%) | $21,523 |
| 1 Earner | 1,188 (43.7%) | $37,222 |
| 2 Earners | 852 (31.4%) | $84,964 |
| 3+ Earners | 185 (6.8%) | $104,086 |
| Total | 2,717 (100.0%) | $53,459 |
Household Income in Somerset
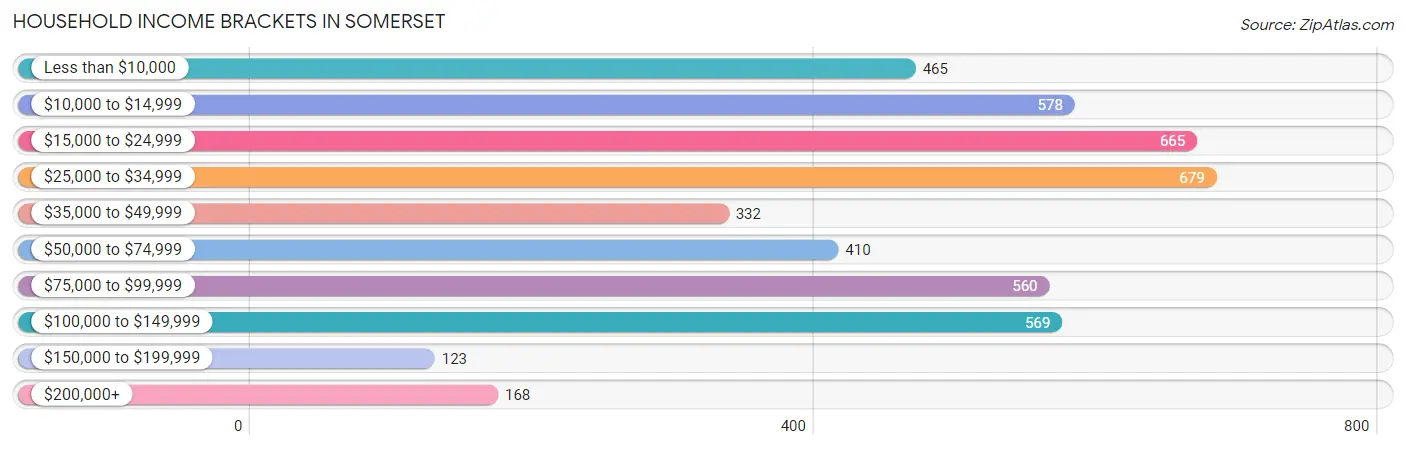
Household Income Brackets in Somerset
With 679 households falling in the category, the $25,000 to $34,999 income range is the most frequent in Somerset, accounting for 14.9% of all households. In contrast, only 123 households (2.7%) fall into the $150,000 to $199,999 income bracket, making it the least populous group.
| Income Bracket | # Households | % Households |
| Less than $10,000 | 465 | 10.2% |
| $10,000 to $14,999 | 578 | 12.7% |
| $15,000 to $24,999 | 665 | 14.6% |
| $25,000 to $34,999 | 679 | 14.9% |
| $35,000 to $49,999 | 332 | 7.3% |
| $50,000 to $74,999 | 410 | 9.0% |
| $75,000 to $99,999 | 560 | 12.3% |
| $100,000 to $149,999 | 569 | 12.5% |
| $150,000 to $199,999 | 123 | 2.7% |
| $200,000+ | 168 | 3.7% |
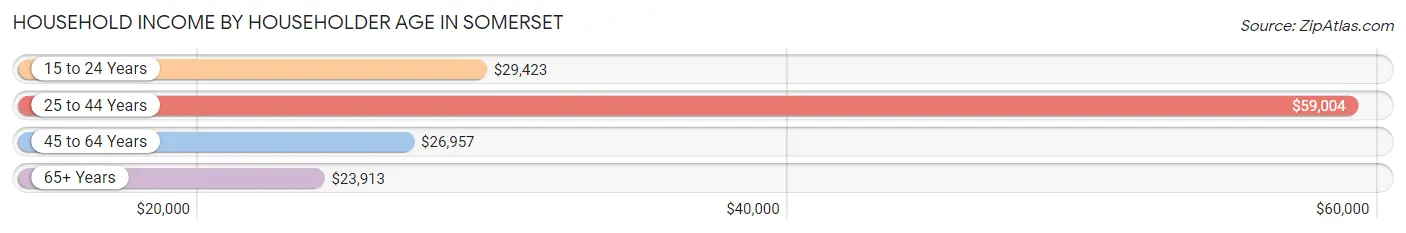
Household Income by Householder Age in Somerset
The median household income in Somerset is $33,245, with the highest median household income of $59,004 found in the 25 to 44 years age bracket for the primary householder. A total of 1,644 households (36.1%) fall into this category. Meanwhile, the 65+ years age bracket for the primary householder has the lowest median household income of $23,913, with 1,142 households (25.1%) in this group.
| Income Bracket | # Households | Median Income |
| 15 to 24 Years | 230 (5.1%) | $29,423 |
| 25 to 44 Years | 1,644 (36.1%) | $59,004 |
| 45 to 64 Years | 1,538 (33.8%) | $26,957 |
| 65+ Years | 1,142 (25.1%) | $23,913 |
| Total | 4,554 (100.0%) | $33,245 |
Poverty in Somerset
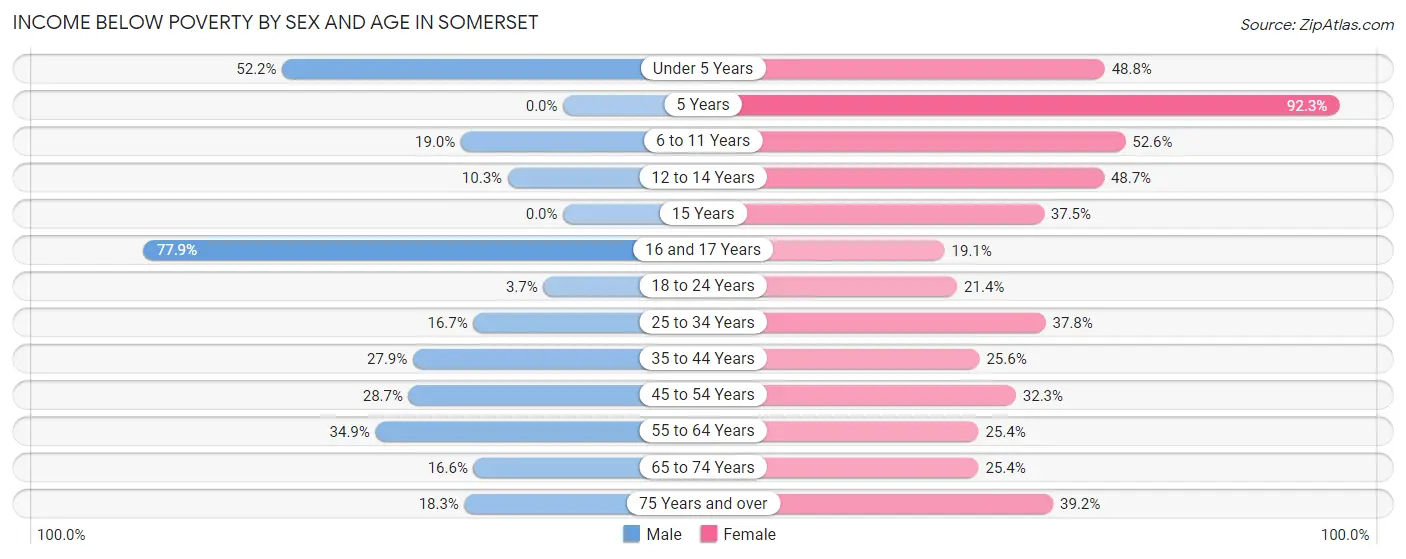
Income Below Poverty by Sex and Age in Somerset
With 23.8% poverty level for males and 34.4% for females among the residents of Somerset, 16 and 17 year old males and 5 year old females are the most vulnerable to poverty, with 102 males (77.9%) and 96 females (92.3%) in their respective age groups living below the poverty level.
| Age Bracket | Male | Female |
| Under 5 Years | 194 (52.1%) | 162 (48.8%) |
| 5 Years | 0 (0.0%) | 96 (92.3%) |
| 6 to 11 Years | 71 (19.0%) | 171 (52.6%) |
| 12 to 14 Years | 43 (10.3%) | 91 (48.7%) |
| 15 Years | 0 (0.0%) | 15 (37.5%) |
| 16 and 17 Years | 102 (77.9%) | 29 (19.1%) |
| 18 to 24 Years | 19 (3.7%) | 76 (21.4%) |
| 25 to 34 Years | 176 (16.7%) | 255 (37.8%) |
| 35 to 44 Years | 239 (27.9%) | 159 (25.6%) |
| 45 to 54 Years | 181 (28.7%) | 263 (32.3%) |
| 55 to 64 Years | 169 (34.8%) | 167 (25.4%) |
| 65 to 74 Years | 76 (16.6%) | 149 (25.4%) |
| 75 Years and over | 26 (18.3%) | 273 (39.2%) |
| Total | 1,296 (23.8%) | 1,906 (34.4%) |
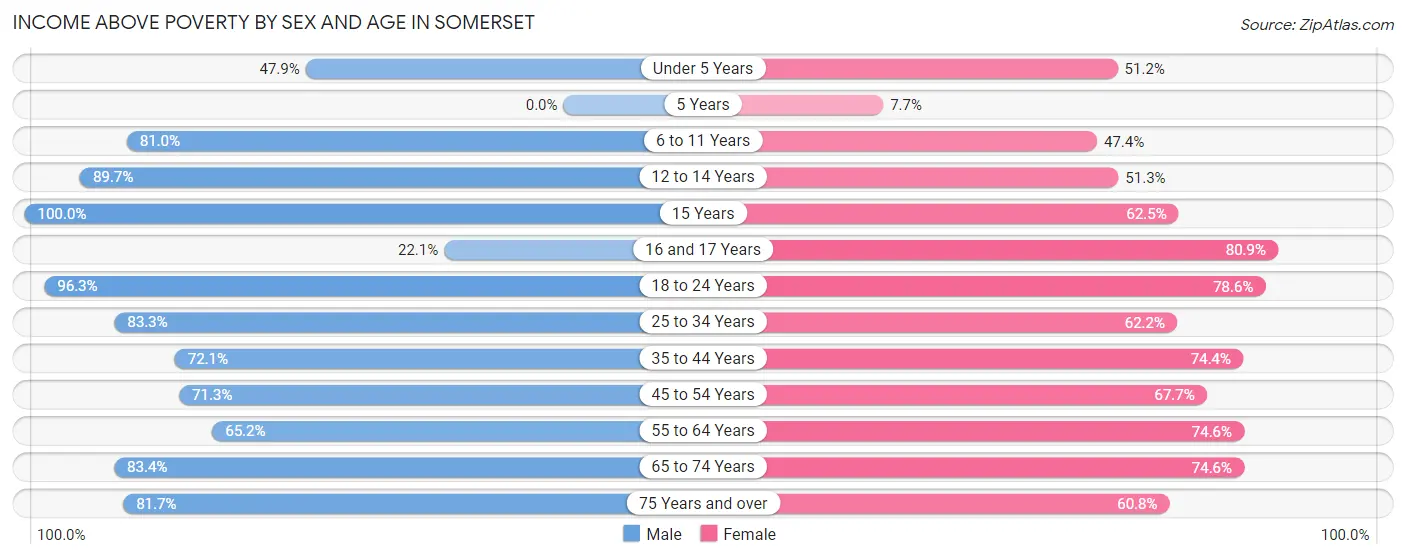
Income Above Poverty by Sex and Age in Somerset
According to the poverty statistics in Somerset, males aged 15 years and females aged 16 and 17 years are the age groups that are most secure financially, with 100.0% of males and 80.9% of females in these age groups living above the poverty line.
| Age Bracket | Male | Female |
| Under 5 Years | 178 (47.8%) | 170 (51.2%) |
| 5 Years | 0 (0.0%) | 8 (7.7%) |
| 6 to 11 Years | 303 (81.0%) | 154 (47.4%) |
| 12 to 14 Years | 375 (89.7%) | 96 (51.3%) |
| 15 Years | 4 (100.0%) | 25 (62.5%) |
| 16 and 17 Years | 29 (22.1%) | 123 (80.9%) |
| 18 to 24 Years | 499 (96.3%) | 279 (78.6%) |
| 25 to 34 Years | 880 (83.3%) | 419 (62.2%) |
| 35 to 44 Years | 618 (72.1%) | 463 (74.4%) |
| 45 to 54 Years | 450 (71.3%) | 551 (67.7%) |
| 55 to 64 Years | 316 (65.1%) | 491 (74.6%) |
| 65 to 74 Years | 381 (83.4%) | 438 (74.6%) |
| 75 Years and over | 116 (81.7%) | 423 (60.8%) |
| Total | 4,149 (76.2%) | 3,640 (65.6%) |
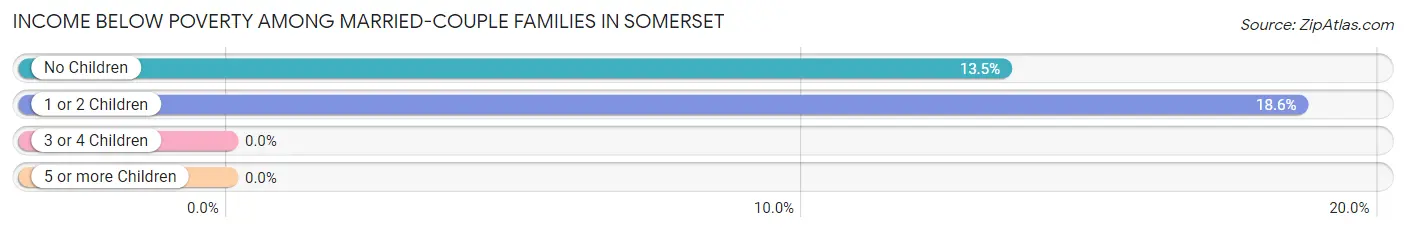
Income Below Poverty Among Married-Couple Families in Somerset
The poverty statistics for married-couple families in Somerset show that 14.8% or 226 of the total 1,526 families live below the poverty line. Families with 1 or 2 children have the highest poverty rate of 18.6%, comprising of 120 families. On the other hand, families with 3 or 4 children have the lowest poverty rate of 0.0%, which includes 0 families.
| Children | Above Poverty | Below Poverty |
| No Children | 681 (86.5%) | 106 (13.5%) |
| 1 or 2 Children | 524 (81.4%) | 120 (18.6%) |
| 3 or 4 Children | 76 (100.0%) | 0 (0.0%) |
| 5 or more Children | 19 (100.0%) | 0 (0.0%) |
| Total | 1,300 (85.2%) | 226 (14.8%) |
Income Below Poverty Among Single-Parent Households in Somerset
According to the poverty data in Somerset, 34.1% or 166 single-father households and 44.9% or 316 single-mother households are living below the poverty line. Among single-father households, those with 3 or 4 children have the highest poverty rate, with 116 households (68.6%) experiencing poverty. Likewise, among single-mother households, those with 3 or 4 children have the highest poverty rate, with 78 households (100.0%) falling below the poverty line.
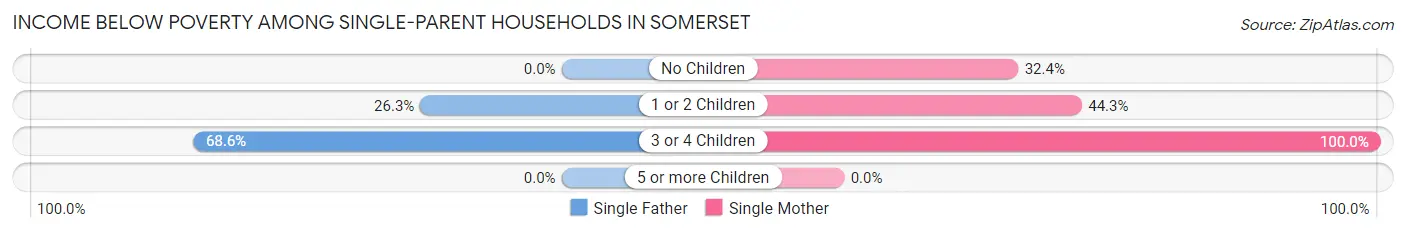
| Children | Single Father | Single Mother |
| No Children | 0 (0.0%) | 107 (32.4%) |
| 1 or 2 Children | 50 (26.3%) | 131 (44.3%) |
| 3 or 4 Children | 116 (68.6%) | 78 (100.0%) |
| 5 or more Children | 0 (0.0%) | 0 (0.0%) |
| Total | 166 (34.1%) | 316 (44.9%) |
Income Below Poverty Among Married-Couple vs Single-Parent Households in Somerset
The poverty data for Somerset shows that 226 of the married-couple family households (14.8%) and 482 of the single-parent households (40.5%) are living below the poverty level. Within the married-couple family households, those with 1 or 2 children have the highest poverty rate, with 120 households (18.6%) falling below the poverty line. Among the single-parent households, those with 3 or 4 children have the highest poverty rate, with 194 household (78.5%) living below poverty.
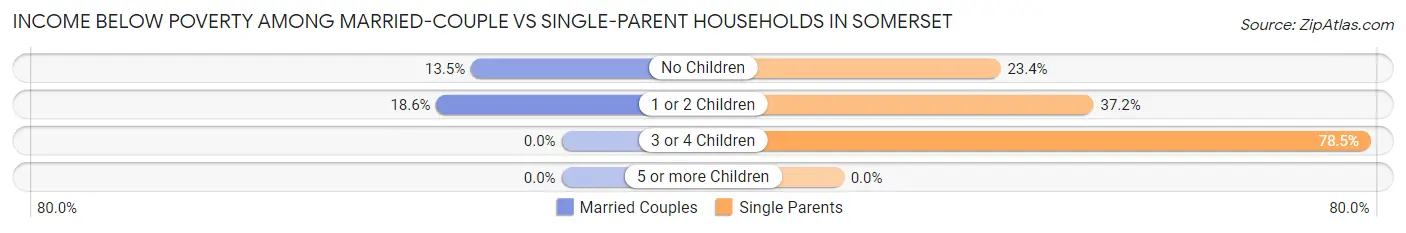
| Children | Married-Couple Families | Single-Parent Households |
| No Children | 106 (13.5%) | 107 (23.4%) |
| 1 or 2 Children | 120 (18.6%) | 181 (37.2%) |
| 3 or 4 Children | 0 (0.0%) | 194 (78.5%) |
| 5 or more Children | 0 (0.0%) | 0 (0.0%) |
| Total | 226 (14.8%) | 482 (40.5%) |
Race in Somerset
The most populous races in Somerset are White / Caucasian (10,983 | 91.5%), Hispanic or Latino (665 | 5.5%), and Black / African American (437 | 3.6%).
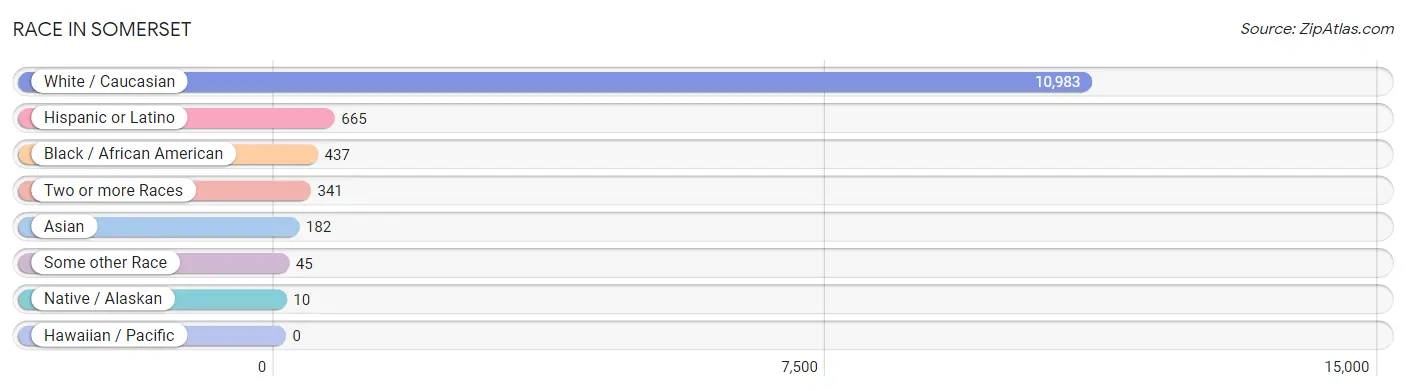
| Race | # Population | % Population |
| Asian | 182 | 1.5% |
| Black / African American | 437 | 3.6% |
| Hawaiian / Pacific | 0 | 0.0% |
| Hispanic or Latino | 665 | 5.5% |
| Native / Alaskan | 10 | 0.1% |
| White / Caucasian | 10,983 | 91.5% |
| Two or more Races | 341 | 2.8% |
| Some other Race | 45 | 0.4% |
| Total | 11,998 | 100.0% |
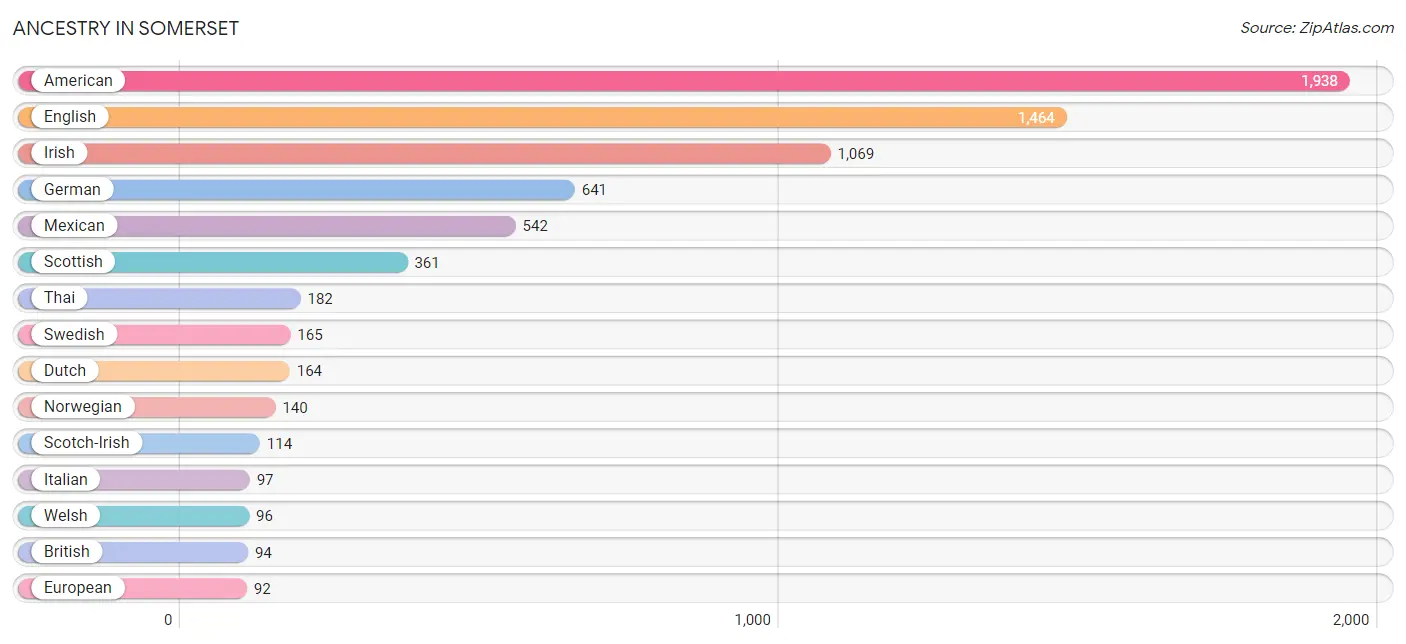
Ancestry in Somerset
The most populous ancestries reported in Somerset are American (1,938 | 16.2%), English (1,464 | 12.2%), Irish (1,069 | 8.9%), German (641 | 5.3%), and Mexican (542 | 4.5%), together accounting for 47.1% of all Somerset residents.
| Ancestry | # Population | % Population |
| American | 1,938 | 16.2% |
| British | 94 | 0.8% |
| Canadian | 1 | 0.0% |
| Central American | 5 | 0.0% |
| Cherokee | 57 | 0.5% |
| Chippewa | 3 | 0.0% |
| Dutch | 164 | 1.4% |
| English | 1,464 | 12.2% |
| European | 92 | 0.8% |
| French | 32 | 0.3% |
| French Canadian | 27 | 0.2% |
| German | 641 | 5.3% |
| Hungarian | 16 | 0.1% |
| Irish | 1,069 | 8.9% |
| Italian | 97 | 0.8% |
| Jamaican | 10 | 0.1% |
| Mexican | 542 | 4.5% |
| Nigerian | 42 | 0.4% |
| Northern European | 46 | 0.4% |
| Norwegian | 140 | 1.2% |
| Panamanian | 5 | 0.0% |
| Peruvian | 67 | 0.6% |
| Polish | 28 | 0.2% |
| Scandinavian | 21 | 0.2% |
| Scotch-Irish | 114 | 0.9% |
| Scottish | 361 | 3.0% |
| South American | 67 | 0.6% |
| Subsaharan African | 42 | 0.4% |
| Swedish | 165 | 1.4% |
| Thai | 182 | 1.5% |
| Welsh | 96 | 0.8% | View All 31 Rows |
Immigrants in Somerset
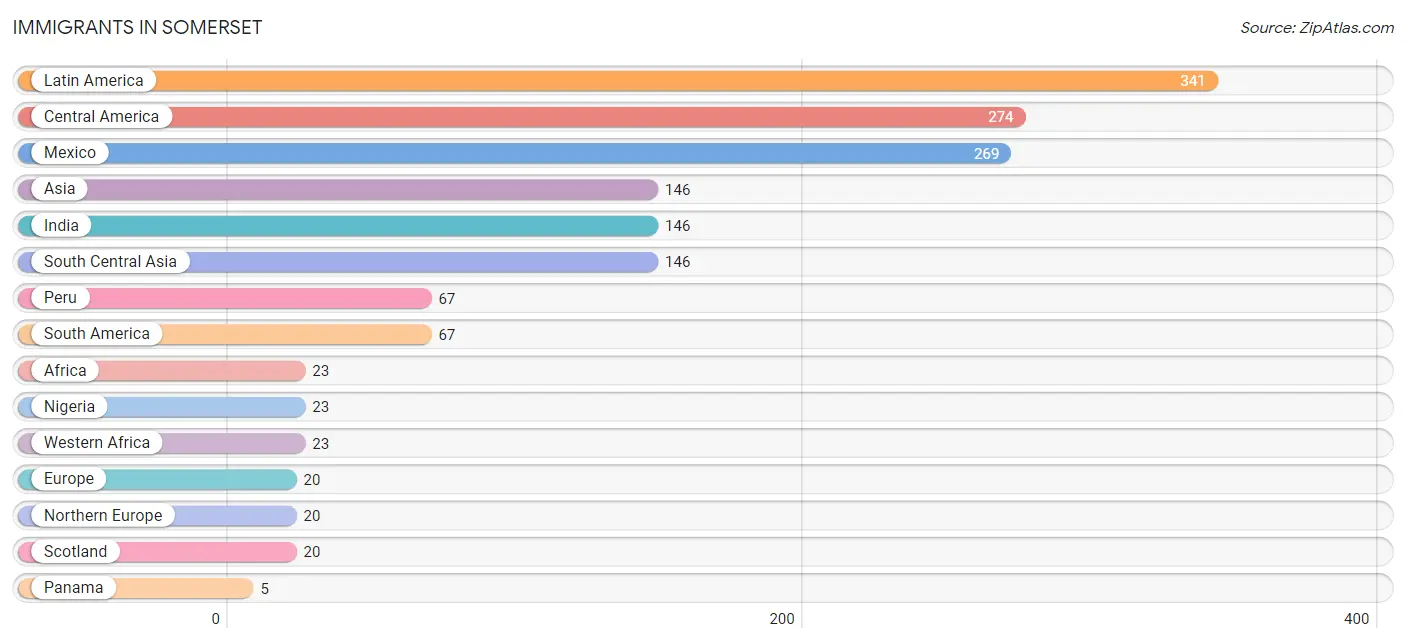
The most numerous immigrant groups reported in Somerset came from Latin America (341 | 2.8%), Central America (274 | 2.3%), Mexico (269 | 2.2%), Asia (146 | 1.2%), and India (146 | 1.2%), together accounting for 9.8% of all Somerset residents.
| Immigration Origin | # Population | % Population |
| Africa | 23 | 0.2% |
| Asia | 146 | 1.2% |
| Central America | 274 | 2.3% |
| Europe | 20 | 0.2% |
| India | 146 | 1.2% |
| Latin America | 341 | 2.8% |
| Mexico | 269 | 2.2% |
| Nigeria | 23 | 0.2% |
| Northern Europe | 20 | 0.2% |
| Panama | 5 | 0.0% |
| Peru | 67 | 0.6% |
| Scotland | 20 | 0.2% |
| South America | 67 | 0.6% |
| South Central Asia | 146 | 1.2% |
| Western Africa | 23 | 0.2% | View All 15 Rows |
Sex and Age in Somerset
Sex and Age in Somerset
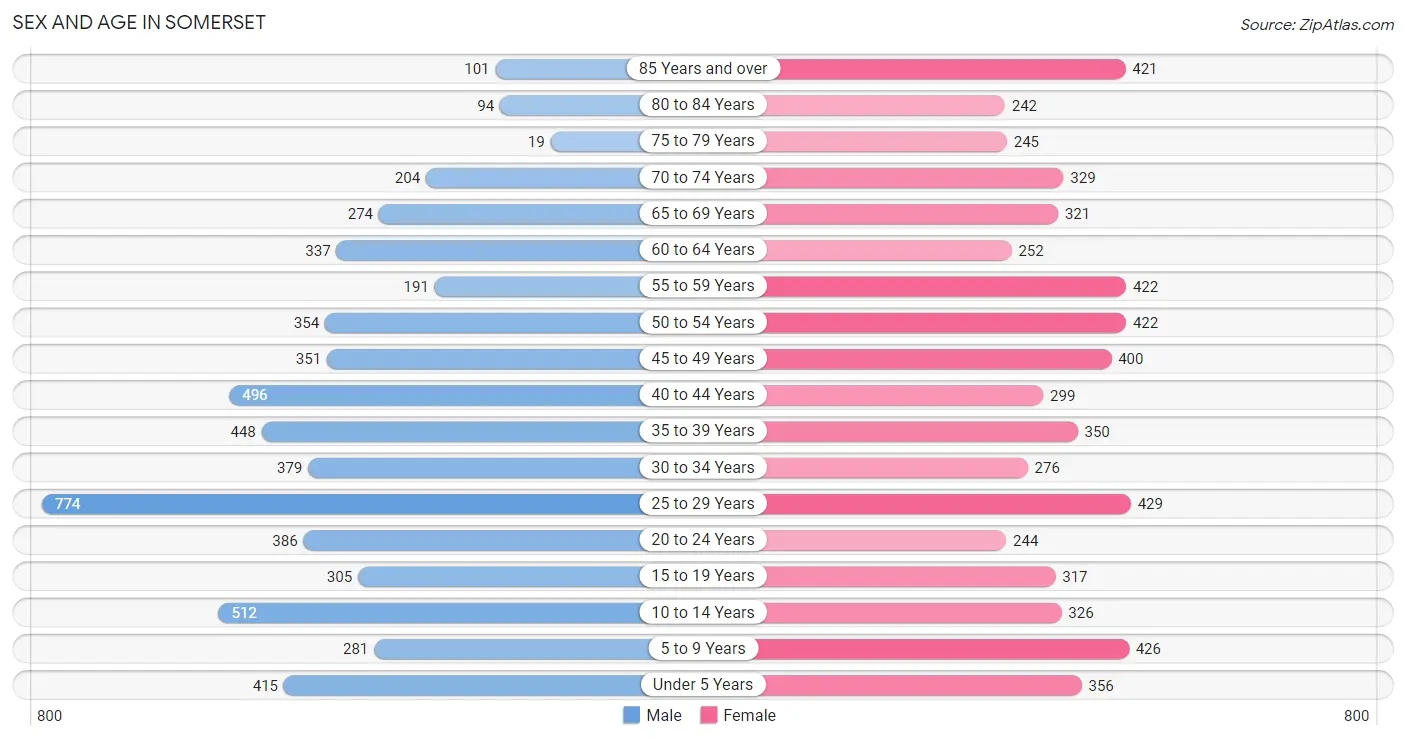
The most populous age groups in Somerset are 25 to 29 Years (774 | 13.1%) for men and 25 to 29 Years (429 | 7.1%) for women.
| Age Bracket | Male | Female |
| Under 5 Years | 415 (7.0%) | 356 (5.9%) |
| 5 to 9 Years | 281 (4.8%) | 426 (7.0%) |
| 10 to 14 Years | 512 (8.6%) | 326 (5.4%) |
| 15 to 19 Years | 305 (5.1%) | 317 (5.2%) |
| 20 to 24 Years | 386 (6.5%) | 244 (4.0%) |
| 25 to 29 Years | 774 (13.1%) | 429 (7.1%) |
| 30 to 34 Years | 379 (6.4%) | 276 (4.5%) |
| 35 to 39 Years | 448 (7.6%) | 350 (5.8%) |
| 40 to 44 Years | 496 (8.4%) | 299 (4.9%) |
| 45 to 49 Years | 351 (5.9%) | 400 (6.6%) |
| 50 to 54 Years | 354 (6.0%) | 422 (6.9%) |
| 55 to 59 Years | 191 (3.2%) | 422 (6.9%) |
| 60 to 64 Years | 337 (5.7%) | 252 (4.2%) |
| 65 to 69 Years | 274 (4.6%) | 321 (5.3%) |
| 70 to 74 Years | 204 (3.5%) | 329 (5.4%) |
| 75 to 79 Years | 19 (0.3%) | 245 (4.0%) |
| 80 to 84 Years | 94 (1.6%) | 242 (4.0%) |
| 85 Years and over | 101 (1.7%) | 421 (6.9%) |
| Total | 5,921 (100.0%) | 6,077 (100.0%) |
Families and Households in Somerset
Median Family Size in Somerset
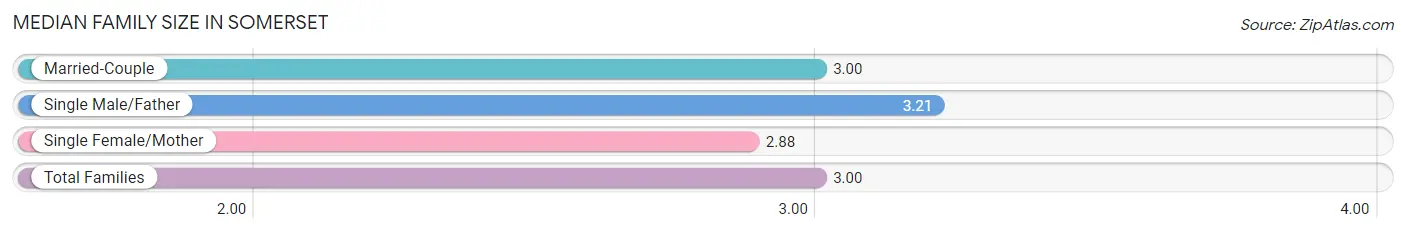
The median family size in Somerset is 3.00 persons per family, with single male/father families (487 | 17.9%) accounting for the largest median family size of 3.21 persons per family. On the other hand, single female/mother families (704 | 25.9%) represent the smallest median family size with 2.88 persons per family.
| Family Type | # Families | Family Size |
| Married-Couple | 1,526 (56.2%) | 3.00 |
| Single Male/Father | 487 (17.9%) | 3.21 |
| Single Female/Mother | 704 (25.9%) | 2.88 |
| Total Families | 2,717 (100.0%) | 3.00 |
Median Household Size in Somerset
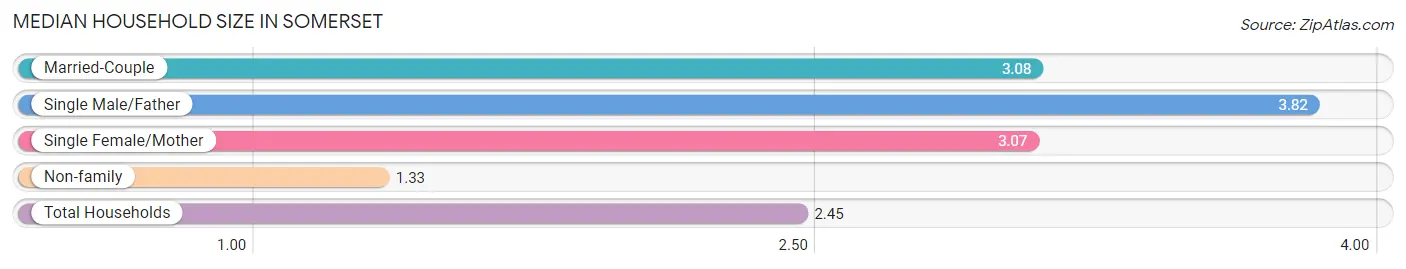
The median household size in Somerset is 2.45 persons per household, with single male/father households (487 | 10.7%) accounting for the largest median household size of 3.82 persons per household. non-family households (1,837 | 40.3%) represent the smallest median household size with 1.33 persons per household.
| Household Type | # Households | Household Size |
| Married-Couple | 1,526 (33.5%) | 3.08 |
| Single Male/Father | 487 (10.7%) | 3.82 |
| Single Female/Mother | 704 (15.5%) | 3.07 |
| Non-family | 1,837 (40.3%) | 1.33 |
| Total Households | 4,554 (100.0%) | 2.45 |
Household Size by Marriage Status in Somerset
Out of a total of 4,554 households in Somerset, 2,717 (59.7%) are family households, while 1,837 (40.3%) are nonfamily households. The most numerous type of family households are 2-person households, comprising 1,008, and the most common type of nonfamily households are 1-person households, comprising 1,348.
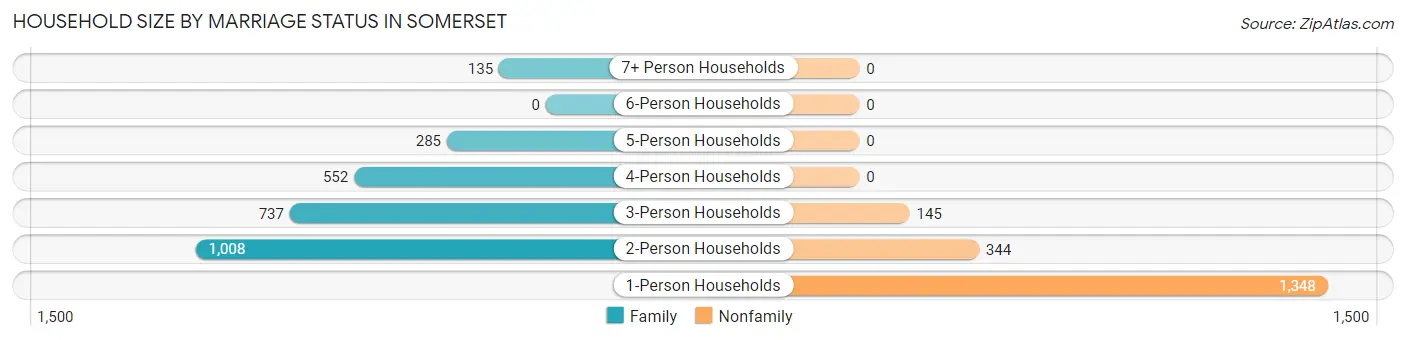
| Household Size | Family Households | Nonfamily Households |
| 1-Person Households | - | 1,348 (29.6%) |
| 2-Person Households | 1,008 (22.1%) | 344 (7.5%) |
| 3-Person Households | 737 (16.2%) | 145 (3.2%) |
| 4-Person Households | 552 (12.1%) | 0 (0.0%) |
| 5-Person Households | 285 (6.3%) | 0 (0.0%) |
| 6-Person Households | 0 (0.0%) | 0 (0.0%) |
| 7+ Person Households | 135 (3.0%) | 0 (0.0%) |
| Total | 2,717 (59.7%) | 1,837 (40.3%) |
Female Fertility in Somerset
Fertility by Age in Somerset
Average fertility rate in Somerset is 47.0 births per 1,000 women. Women in the age bracket of 20 to 34 years have the highest fertility rate with 118.0 births per 1,000 women. Women in the age bracket of 20 to 34 years acount for 100.0% of all women with births.
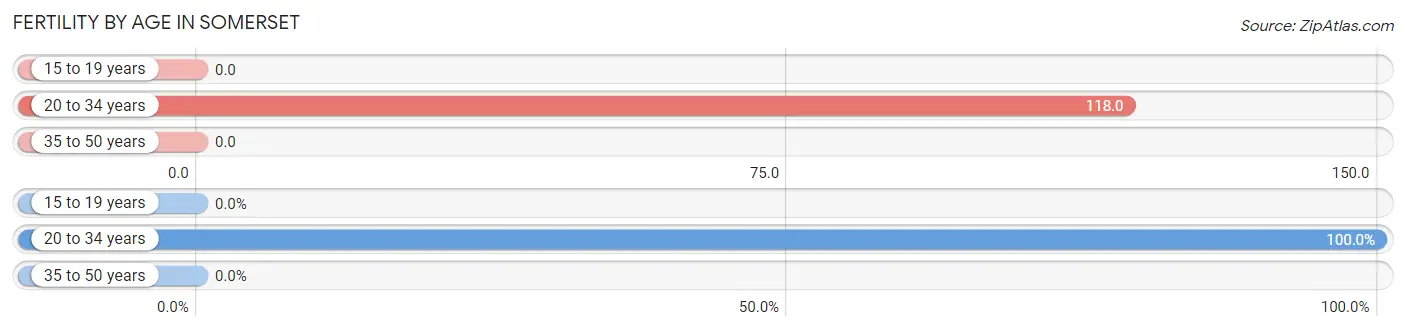
| Age Bracket | Women with Births | Births / 1,000 Women |
| 15 to 19 years | 0 (0.0%) | 0.0 |
| 20 to 34 years | 112 (100.0%) | 118.0 |
| 35 to 50 years | 0 (0.0%) | 0.0 |
| Total | 112 (100.0%) | 47.0 |
Fertility by Age by Marriage Status in Somerset
58.9% of women with births (112) in Somerset are married. The highest percentage of unmarried women with births falls into 20 to 34 years age bracket with 41.1% of them unmarried at the time of birth, while the lowest percentage of unmarried women with births belong to 20 to 34 years age bracket with 41.1% of them unmarried.
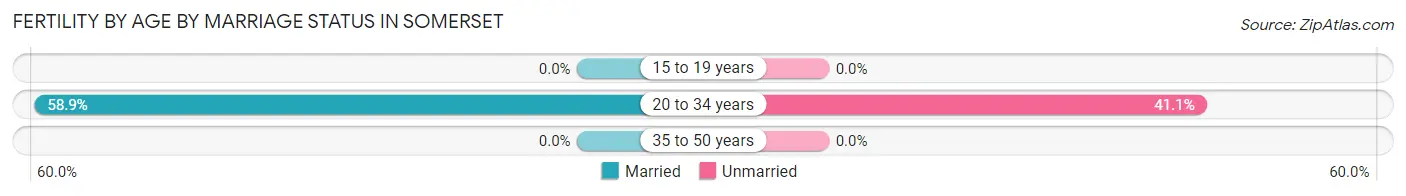
| Age Bracket | Married | Unmarried |
| 15 to 19 years | 0 (0.0%) | 0 (0.0%) |
| 20 to 34 years | 66 (58.9%) | 46 (41.1%) |
| 35 to 50 years | 0 (0.0%) | 0 (0.0%) |
| Total | 66 (58.9%) | 46 (41.1%) |
Fertility by Education in Somerset
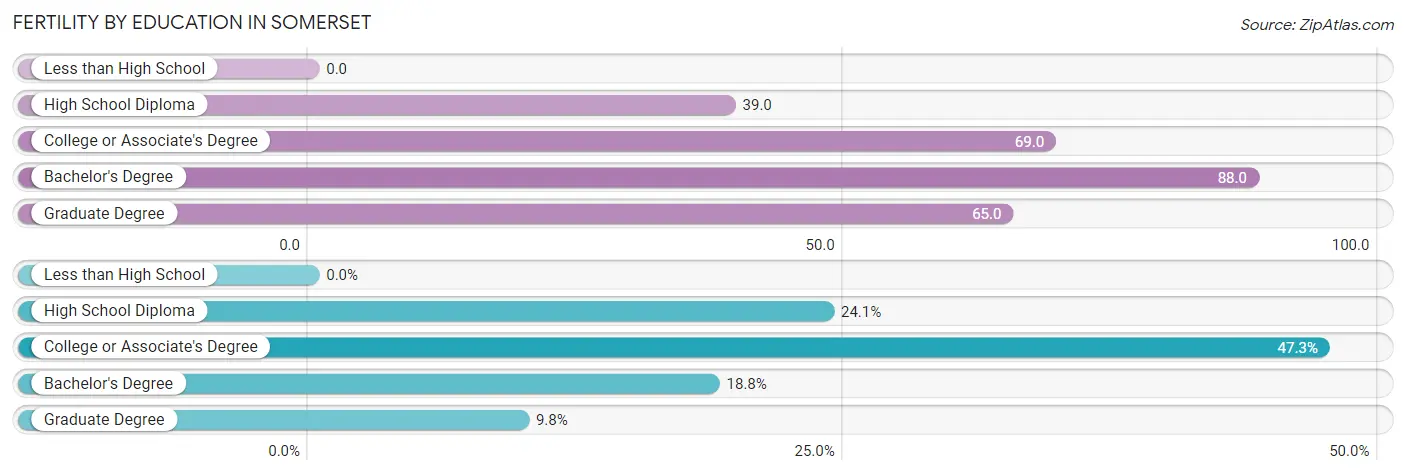
| Educational Attainment | Women with Births | Births / 1,000 Women |
| Less than High School | 0 (0.0%) | 0.0 |
| High School Diploma | 27 (24.1%) | 39.0 |
| College or Associate's Degree | 53 (47.3%) | 69.0 |
| Bachelor's Degree | 21 (18.8%) | 88.0 |
| Graduate Degree | 11 (9.8%) | 65.0 |
| Total | 112 (100.0%) | 47.0 |
Fertility by Education by Marriage Status in Somerset
41.1% of women with births in Somerset are unmarried. Women with the educational attainment of high school diploma are most likely to be married with 100.0% of them married at childbirth, while women with the educational attainment of bachelor's degree are least likely to be married with 100.0% of them unmarried at childbirth.
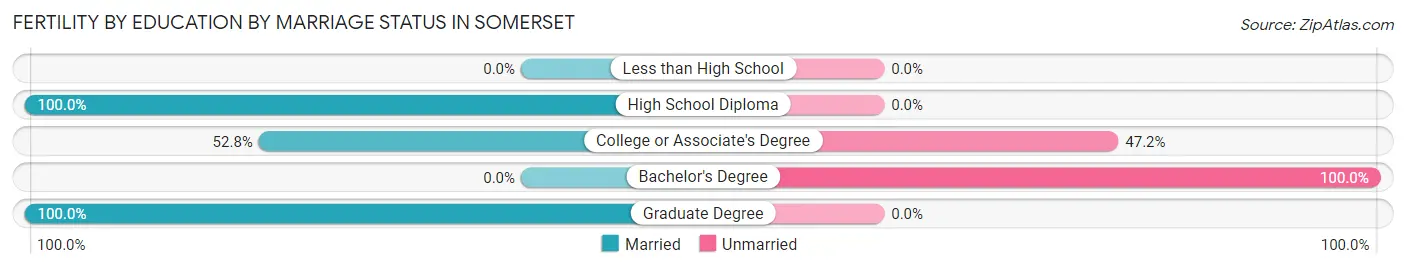
| Educational Attainment | Married | Unmarried |
| Less than High School | 0 (0.0%) | 0 (0.0%) |
| High School Diploma | 27 (100.0%) | 0 (0.0%) |
| College or Associate's Degree | 28 (52.8%) | 25 (47.2%) |
| Bachelor's Degree | 0 (0.0%) | 21 (100.0%) |
| Graduate Degree | 11 (100.0%) | 0 (0.0%) |
| Total | 66 (58.9%) | 46 (41.1%) |
Employment Characteristics in Somerset
Employment by Class of Employer in Somerset
Among the 4,588 employed individuals in Somerset, private company employees (3,355 | 73.1%), state government employees (355 | 7.7%), and not-for-profit organizations (323 | 7.0%) make up the most common classes of employment.
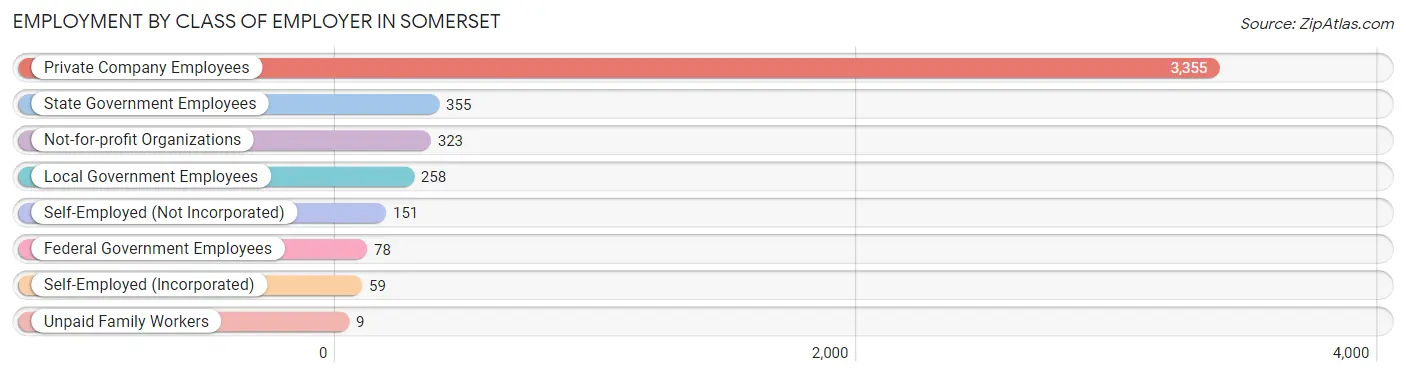
| Employer Class | # Employees | % Employees |
| Private Company Employees | 3,355 | 73.1% |
| Self-Employed (Incorporated) | 59 | 1.3% |
| Self-Employed (Not Incorporated) | 151 | 3.3% |
| Not-for-profit Organizations | 323 | 7.0% |
| Local Government Employees | 258 | 5.6% |
| State Government Employees | 355 | 7.7% |
| Federal Government Employees | 78 | 1.7% |
| Unpaid Family Workers | 9 | 0.2% |
| Total | 4,588 | 100.0% |
Employment Status by Age in Somerset
According to the labor force statistics for Somerset, out of the total population over 16 years of age (9,637), 52.5% or 5,059 individuals are in the labor force, with 8.7% or 440 of them unemployed. The age group with the highest labor force participation rate is 25 to 29 years, with 85.4% or 1,027 individuals in the labor force. Within the labor force, the 16 to 19 years age range has the highest percentage of unemployed individuals, with 21.0% or 66 of them being unemployed.
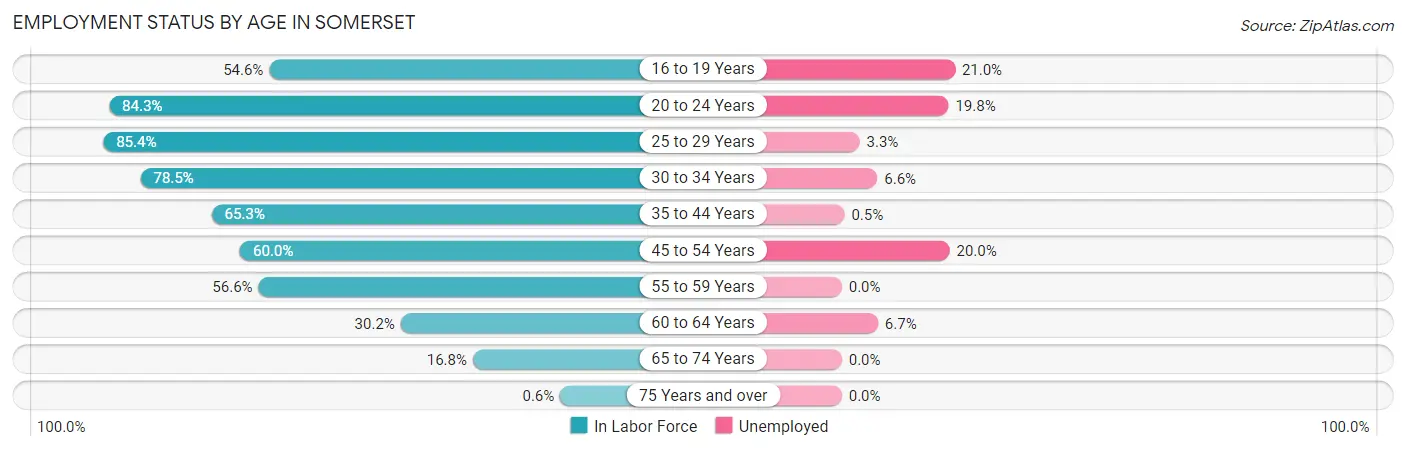
| Age Bracket | In Labor Force | Unemployed |
| 16 to 19 Years | 315 (54.6%) | 66 (21.0%) |
| 20 to 24 Years | 531 (84.3%) | 105 (19.8%) |
| 25 to 29 Years | 1,027 (85.4%) | 34 (3.3%) |
| 30 to 34 Years | 514 (78.5%) | 34 (6.6%) |
| 35 to 44 Years | 1,040 (65.3%) | 5 (0.5%) |
| 45 to 54 Years | 916 (60.0%) | 183 (20.0%) |
| 55 to 59 Years | 347 (56.6%) | 0 (0.0%) |
| 60 to 64 Years | 178 (30.2%) | 12 (6.7%) |
| 65 to 74 Years | 190 (16.8%) | 0 (0.0%) |
| 75 Years and over | 7 (0.6%) | 0 (0.0%) |
| Total | 5,059 (52.5%) | 440 (8.7%) |
Employment Status by Educational Attainment in Somerset
According to labor force statistics for Somerset, 65.1% of individuals (4,023) out of the total population between 25 and 64 years of age (6,180) are in the labor force, with 6.7% or 270 of them being unemployed. The group with the highest labor force participation rate are those with the educational attainment of bachelor's degree or higher, with 89.0% or 1,056 individuals in the labor force. Within the labor force, individuals with college / associate degree education have the highest percentage of unemployment, with 15.3% or 221 of them being unemployed.
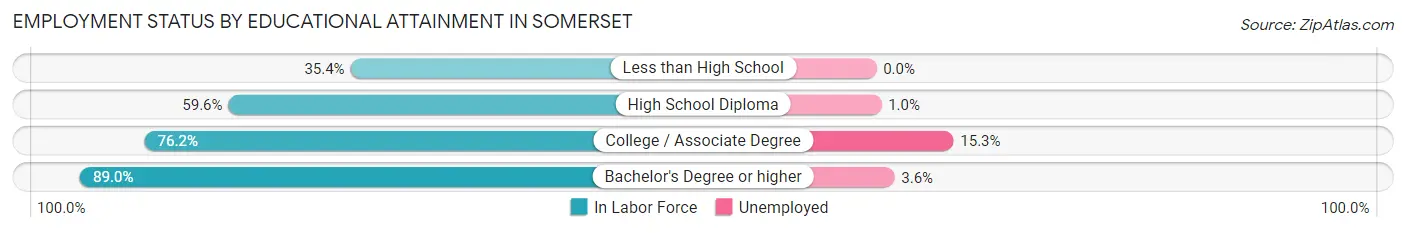
| Educational Attainment | In Labor Force | Unemployed |
| Less than High School | 474 (35.4%) | 0 (0.0%) |
| High School Diploma | 1,051 (59.6%) | 18 (1.0%) |
| College / Associate Degree | 1,442 (76.2%) | 289 (15.3%) |
| Bachelor's Degree or higher | 1,056 (89.0%) | 43 (3.6%) |
| Total | 4,023 (65.1%) | 414 (6.7%) |
Employment Occupations by Sex in Somerset
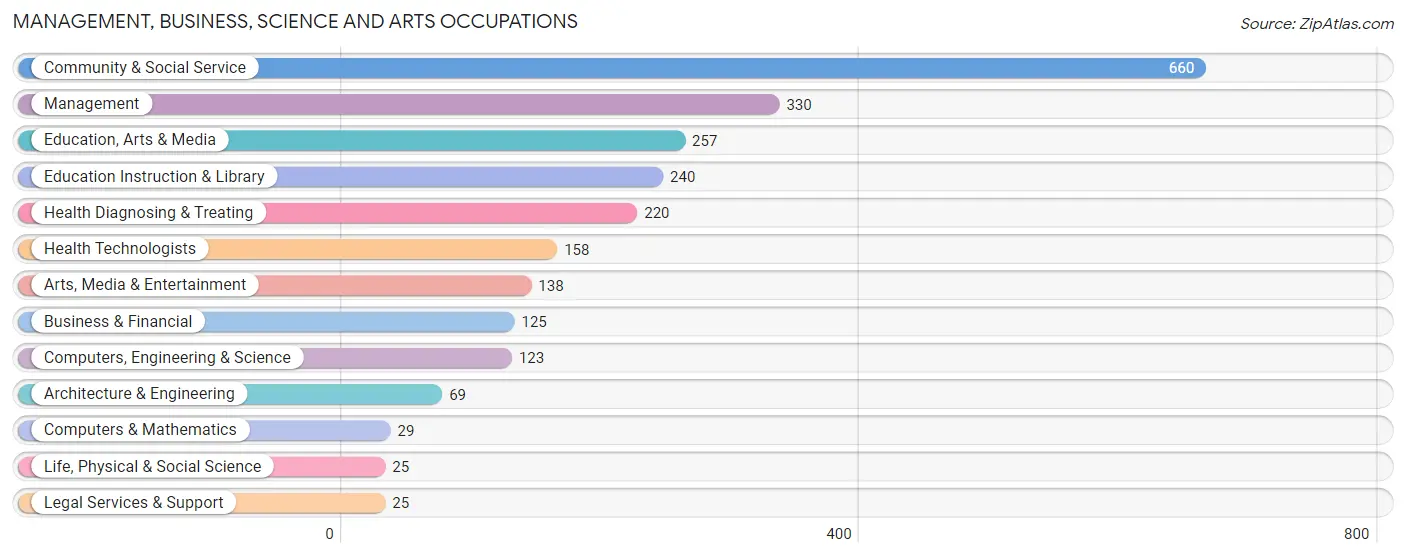
Management, Business, Science and Arts Occupations
The most common Management, Business, Science and Arts occupations in Somerset are Community & Social Service (660 | 14.3%), Management (330 | 7.1%), Education, Arts & Media (257 | 5.6%), Education Instruction & Library (240 | 5.2%), and Health Diagnosing & Treating (220 | 4.8%).
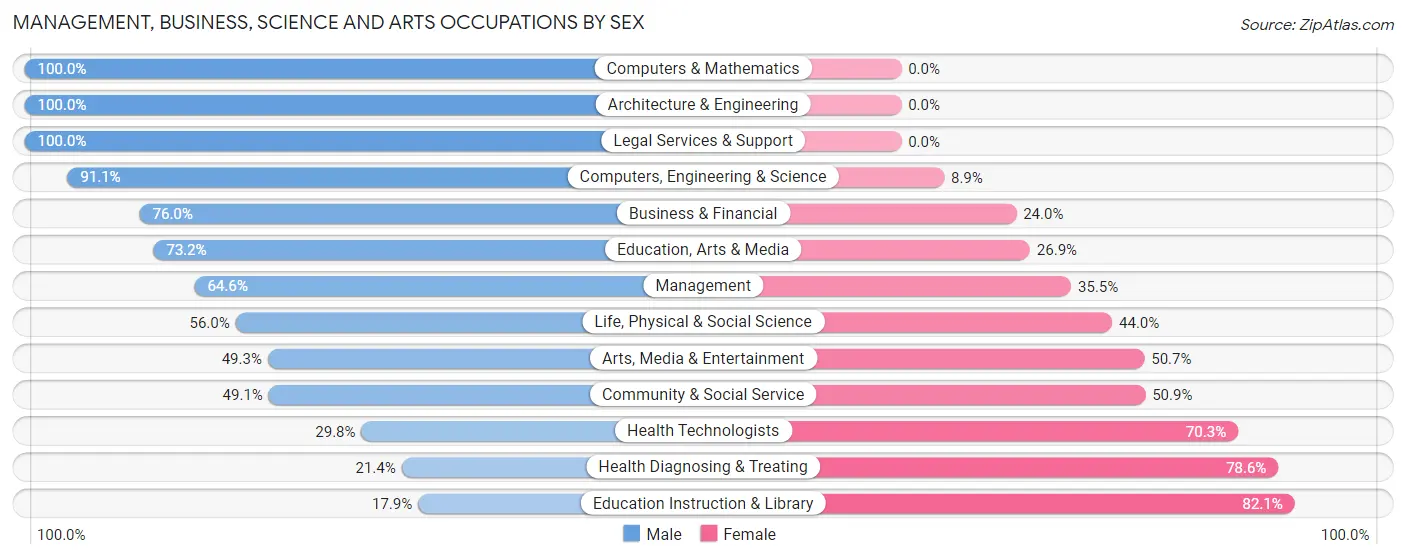
Management, Business, Science and Arts Occupations by Sex
Within the Management, Business, Science and Arts occupations in Somerset, the most male-oriented occupations are Computers & Mathematics (100.0%), Architecture & Engineering (100.0%), and Legal Services & Support (100.0%), while the most female-oriented occupations are Education Instruction & Library (82.1%), Health Diagnosing & Treating (78.6%), and Health Technologists (70.3%).
| Occupation | Male | Female |
| Management | 213 (64.5%) | 117 (35.4%) |
| Business & Financial | 95 (76.0%) | 30 (24.0%) |
| Computers, Engineering & Science | 112 (91.1%) | 11 (8.9%) |
| Computers & Mathematics | 29 (100.0%) | 0 (0.0%) |
| Architecture & Engineering | 69 (100.0%) | 0 (0.0%) |
| Life, Physical & Social Science | 14 (56.0%) | 11 (44.0%) |
| Community & Social Service | 324 (49.1%) | 336 (50.9%) |
| Education, Arts & Media | 188 (73.2%) | 69 (26.9%) |
| Legal Services & Support | 25 (100.0%) | 0 (0.0%) |
| Education Instruction & Library | 43 (17.9%) | 197 (82.1%) |
| Arts, Media & Entertainment | 68 (49.3%) | 70 (50.7%) |
| Health Diagnosing & Treating | 47 (21.4%) | 173 (78.6%) |
| Health Technologists | 47 (29.7%) | 111 (70.3%) |
| Total (Category) | 791 (54.2%) | 667 (45.8%) |
| Total (Overall) | 2,718 (58.8%) | 1,904 (41.2%) |
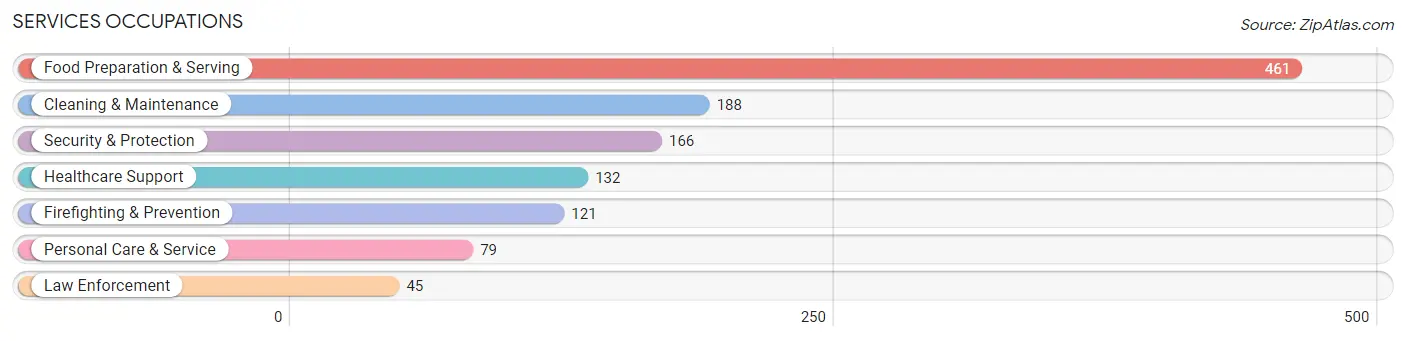
Services Occupations
The most common Services occupations in Somerset are Food Preparation & Serving (461 | 10.0%), Cleaning & Maintenance (188 | 4.1%), Security & Protection (166 | 3.6%), Healthcare Support (132 | 2.9%), and Firefighting & Prevention (121 | 2.6%).
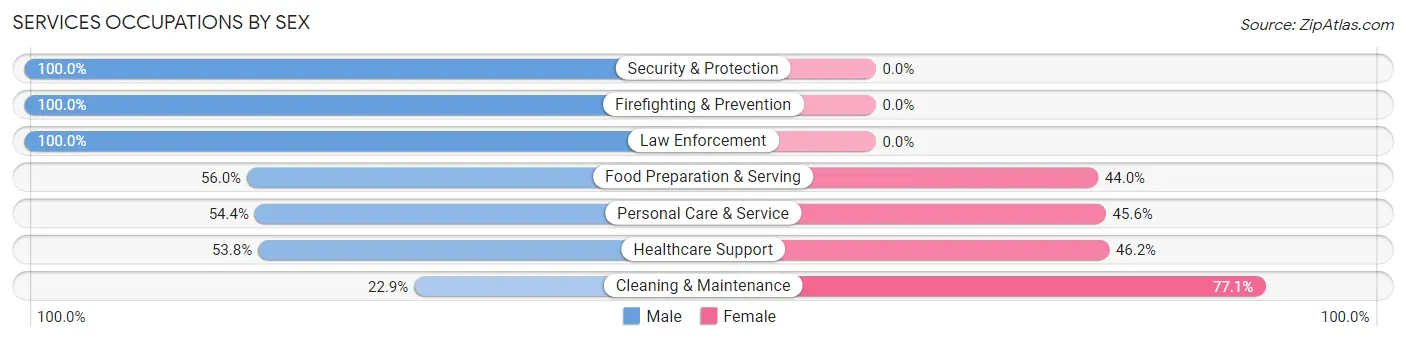
Services Occupations by Sex
Within the Services occupations in Somerset, the most male-oriented occupations are Security & Protection (100.0%), Firefighting & Prevention (100.0%), and Law Enforcement (100.0%), while the most female-oriented occupations are Cleaning & Maintenance (77.1%), Healthcare Support (46.2%), and Personal Care & Service (45.6%).
| Occupation | Male | Female |
| Healthcare Support | 71 (53.8%) | 61 (46.2%) |
| Security & Protection | 166 (100.0%) | 0 (0.0%) |
| Firefighting & Prevention | 121 (100.0%) | 0 (0.0%) |
| Law Enforcement | 45 (100.0%) | 0 (0.0%) |
| Food Preparation & Serving | 258 (56.0%) | 203 (44.0%) |
| Cleaning & Maintenance | 43 (22.9%) | 145 (77.1%) |
| Personal Care & Service | 43 (54.4%) | 36 (45.6%) |
| Total (Category) | 581 (56.6%) | 445 (43.4%) |
| Total (Overall) | 2,718 (58.8%) | 1,904 (41.2%) |
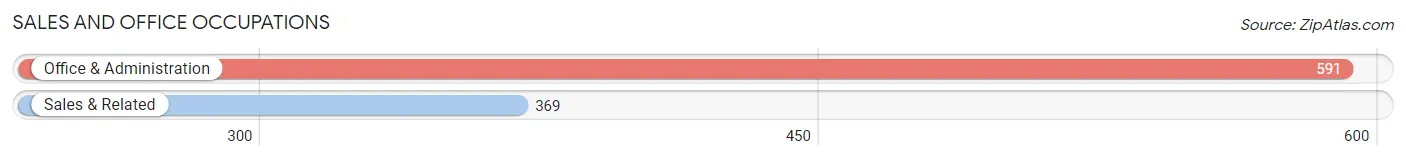
Sales and Office Occupations
The most common Sales and Office occupations in Somerset are Office & Administration (591 | 12.8%), and Sales & Related (369 | 8.0%).
Sales and Office Occupations by Sex
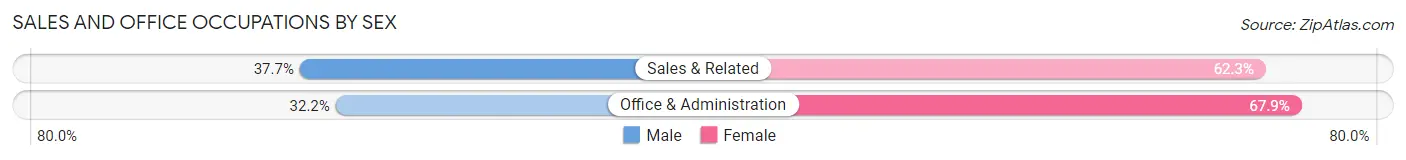
| Occupation | Male | Female |
| Sales & Related | 139 (37.7%) | 230 (62.3%) |
| Office & Administration | 190 (32.2%) | 401 (67.8%) |
| Total (Category) | 329 (34.3%) | 631 (65.7%) |
| Total (Overall) | 2,718 (58.8%) | 1,904 (41.2%) |
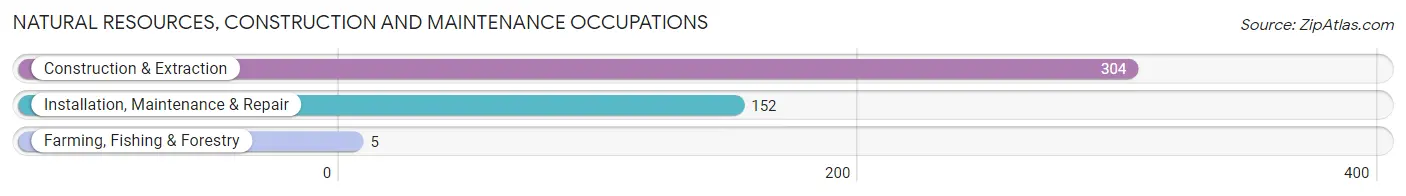
Natural Resources, Construction and Maintenance Occupations
The most common Natural Resources, Construction and Maintenance occupations in Somerset are Construction & Extraction (304 | 6.6%), Installation, Maintenance & Repair (152 | 3.3%), and Farming, Fishing & Forestry (5 | 0.1%).
Natural Resources, Construction and Maintenance Occupations by Sex
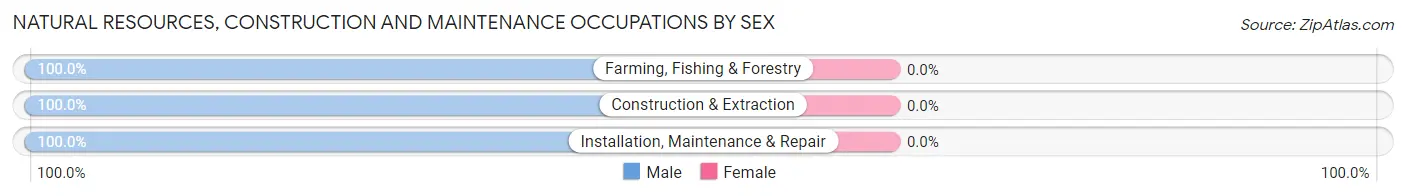
| Occupation | Male | Female |
| Farming, Fishing & Forestry | 5 (100.0%) | 0 (0.0%) |
| Construction & Extraction | 304 (100.0%) | 0 (0.0%) |
| Installation, Maintenance & Repair | 152 (100.0%) | 0 (0.0%) |
| Total (Category) | 461 (100.0%) | 0 (0.0%) |
| Total (Overall) | 2,718 (58.8%) | 1,904 (41.2%) |
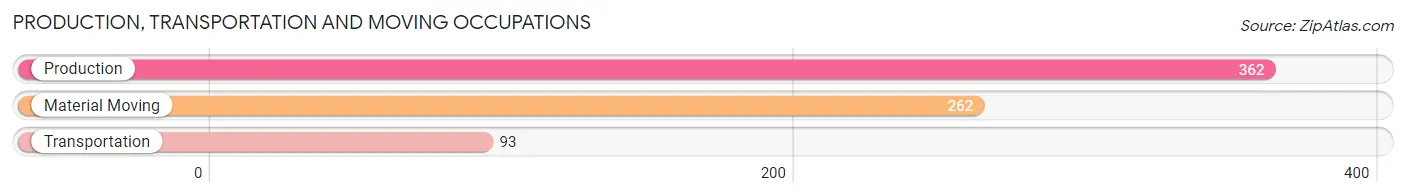
Production, Transportation and Moving Occupations
The most common Production, Transportation and Moving occupations in Somerset are Production (362 | 7.8%), Material Moving (262 | 5.7%), and Transportation (93 | 2.0%).
Production, Transportation and Moving Occupations by Sex
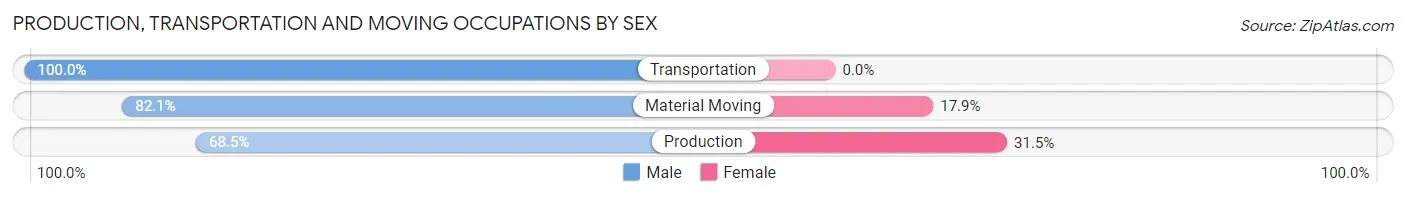
| Occupation | Male | Female |
| Production | 248 (68.5%) | 114 (31.5%) |
| Transportation | 93 (100.0%) | 0 (0.0%) |
| Material Moving | 215 (82.1%) | 47 (17.9%) |
| Total (Category) | 556 (77.5%) | 161 (22.5%) |
| Total (Overall) | 2,718 (58.8%) | 1,904 (41.2%) |
Employment Industries by Sex in Somerset
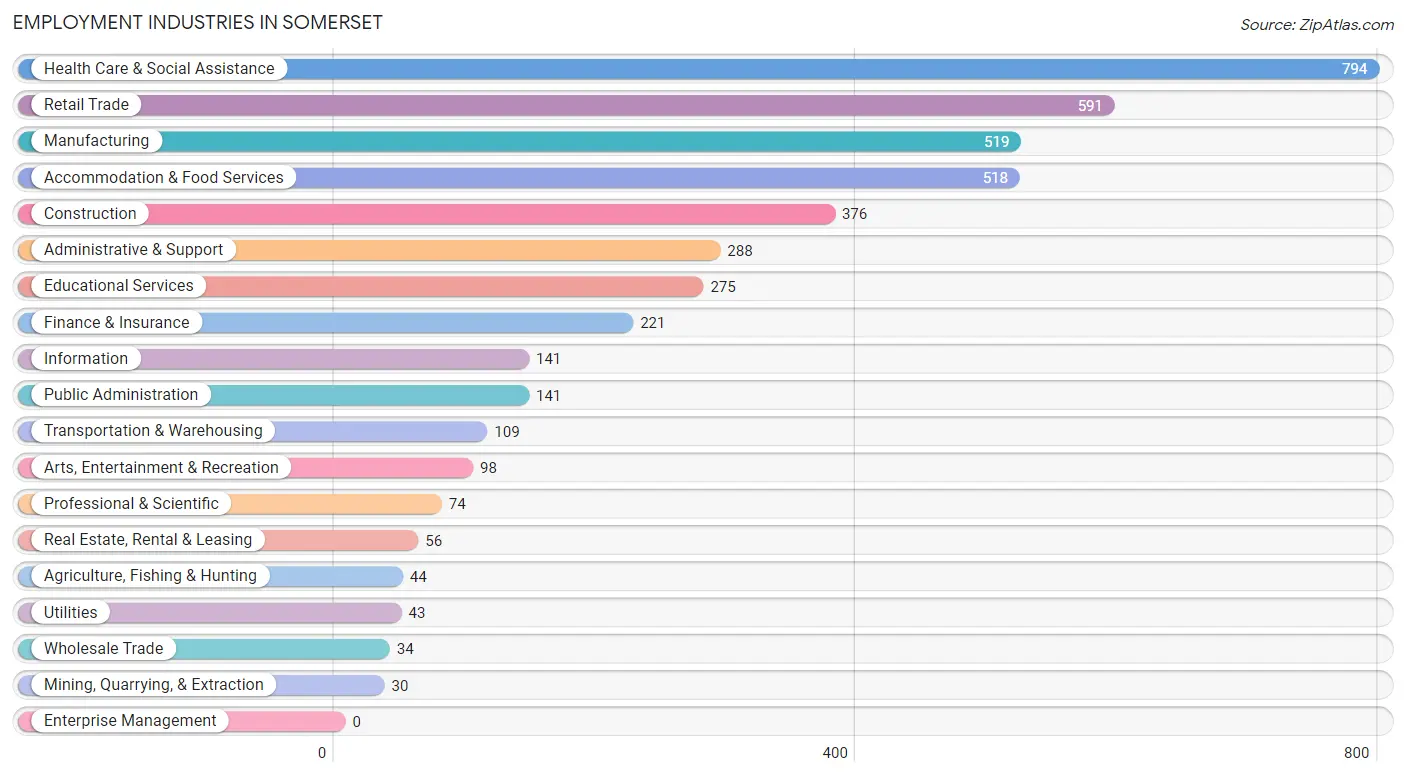
Employment Industries in Somerset
The major employment industries in Somerset include Health Care & Social Assistance (794 | 17.2%), Retail Trade (591 | 12.8%), Manufacturing (519 | 11.2%), Accommodation & Food Services (518 | 11.2%), and Construction (376 | 8.1%).
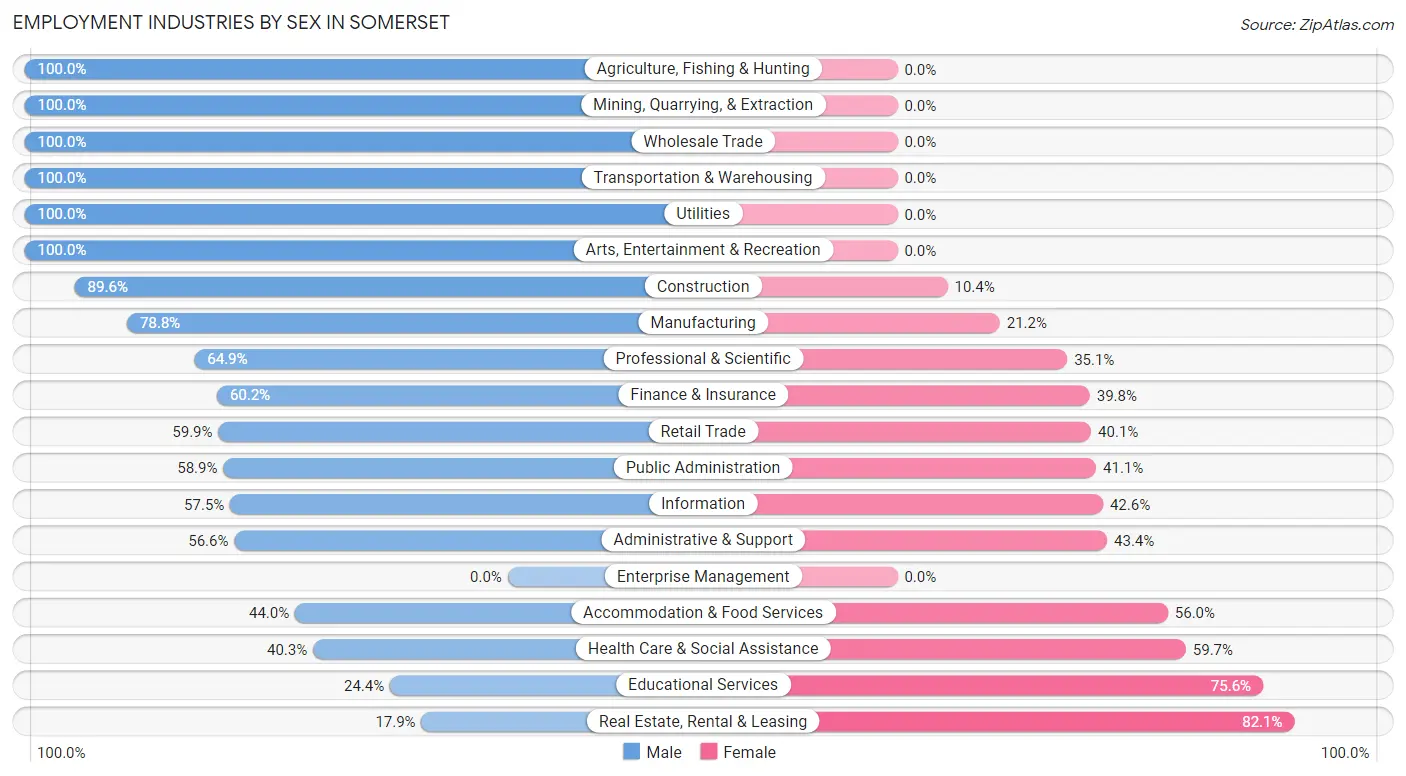
Employment Industries by Sex in Somerset
The Somerset industries that see more men than women are Agriculture, Fishing & Hunting (100.0%), Mining, Quarrying, & Extraction (100.0%), and Wholesale Trade (100.0%), whereas the industries that tend to have a higher number of women are Real Estate, Rental & Leasing (82.1%), Educational Services (75.6%), and Health Care & Social Assistance (59.7%).
| Industry | Male | Female |
| Agriculture, Fishing & Hunting | 44 (100.0%) | 0 (0.0%) |
| Mining, Quarrying, & Extraction | 30 (100.0%) | 0 (0.0%) |
| Construction | 337 (89.6%) | 39 (10.4%) |
| Manufacturing | 409 (78.8%) | 110 (21.2%) |
| Wholesale Trade | 34 (100.0%) | 0 (0.0%) |
| Retail Trade | 354 (59.9%) | 237 (40.1%) |
| Transportation & Warehousing | 109 (100.0%) | 0 (0.0%) |
| Utilities | 43 (100.0%) | 0 (0.0%) |
| Information | 81 (57.5%) | 60 (42.5%) |
| Finance & Insurance | 133 (60.2%) | 88 (39.8%) |
| Real Estate, Rental & Leasing | 10 (17.9%) | 46 (82.1%) |
| Professional & Scientific | 48 (64.9%) | 26 (35.1%) |
| Enterprise Management | 0 (0.0%) | 0 (0.0%) |
| Administrative & Support | 163 (56.6%) | 125 (43.4%) |
| Educational Services | 67 (24.4%) | 208 (75.6%) |
| Health Care & Social Assistance | 320 (40.3%) | 474 (59.7%) |
| Arts, Entertainment & Recreation | 98 (100.0%) | 0 (0.0%) |
| Accommodation & Food Services | 228 (44.0%) | 290 (56.0%) |
| Public Administration | 83 (58.9%) | 58 (41.1%) |
| Total | 2,718 (58.8%) | 1,904 (41.2%) |
Education in Somerset
School Enrollment in Somerset
The most common levels of schooling among the 2,468 students in Somerset are middle school (619 | 25.1%), high school (572 | 23.2%), and elementary school (539 | 21.8%).
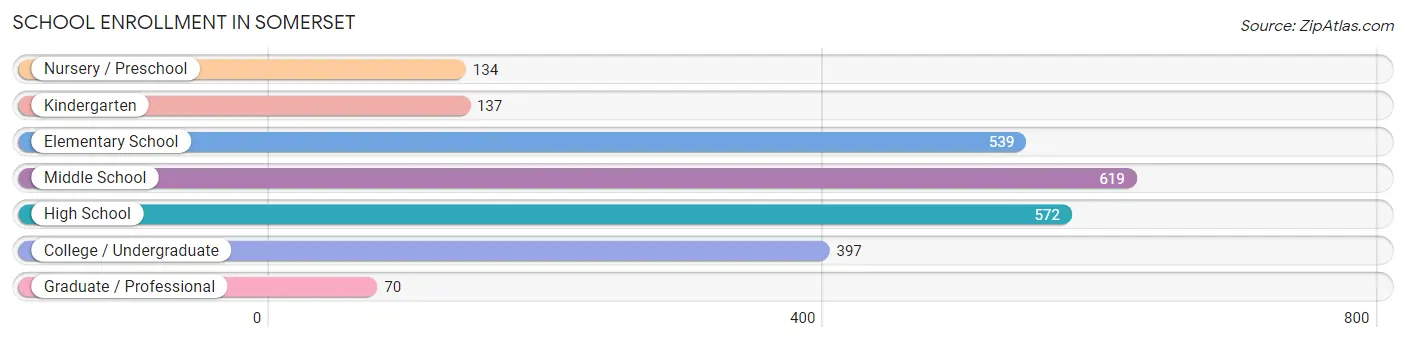
| School Level | # Students | % Students |
| Nursery / Preschool | 134 | 5.4% |
| Kindergarten | 137 | 5.6% |
| Elementary School | 539 | 21.8% |
| Middle School | 619 | 25.1% |
| High School | 572 | 23.2% |
| College / Undergraduate | 397 | 16.1% |
| Graduate / Professional | 70 | 2.8% |
| Total | 2,468 | 100.0% |
School Enrollment by Age by Funding Source in Somerset
Out of a total of 2,468 students who are enrolled in schools in Somerset, 168 (6.8%) attend a private institution, while the remaining 2,300 (93.2%) are enrolled in public schools. The age group of 3 to 4 year olds has the highest likelihood of being enrolled in private schools, with 31 (27.9% in the age bracket) enrolled. Conversely, the age group of 18 to 19 year olds has the lowest likelihood of being enrolled in a private school, with 181 (100.0% in the age bracket) attending a public institution.
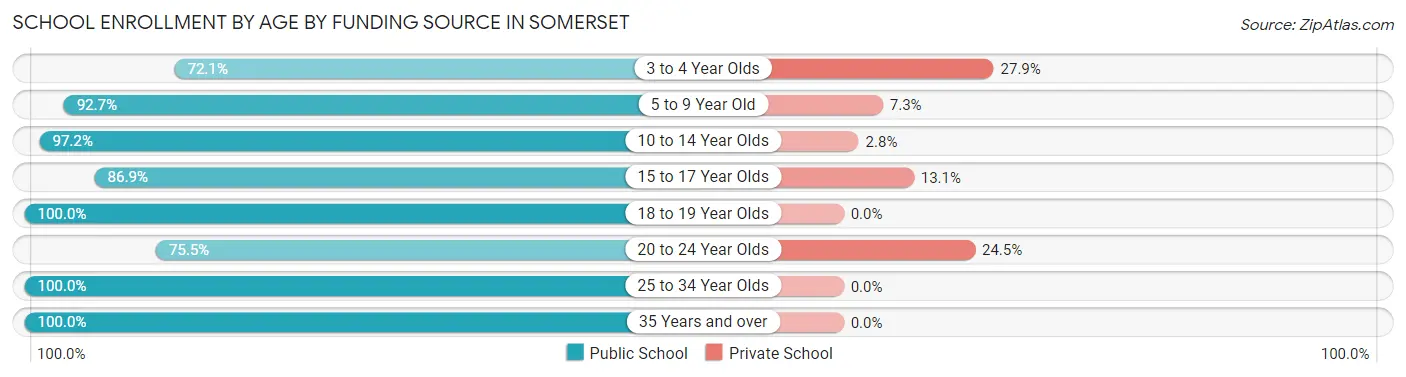
| Age Bracket | Public School | Private School |
| 3 to 4 Year Olds | 80 (72.1%) | 31 (27.9%) |
| 5 to 9 Year Old | 648 (92.7%) | 51 (7.3%) |
| 10 to 14 Year Olds | 802 (97.2%) | 23 (2.8%) |
| 15 to 17 Year Olds | 273 (86.9%) | 41 (13.1%) |
| 18 to 19 Year Olds | 181 (100.0%) | 0 (0.0%) |
| 20 to 24 Year Olds | 71 (75.5%) | 23 (24.5%) |
| 25 to 34 Year Olds | 112 (100.0%) | 0 (0.0%) |
| 35 Years and over | 132 (100.0%) | 0 (0.0%) |
| Total | 2,300 (93.2%) | 168 (6.8%) |
Educational Attainment by Field of Study in Somerset
Education (383 | 24.2%), arts & humanities (295 | 18.6%), business (231 | 14.6%), science & technology (164 | 10.3%), and liberal arts & history (162 | 10.2%) are the most common fields of study among 1,584 individuals in Somerset who have obtained a bachelor's degree or higher.
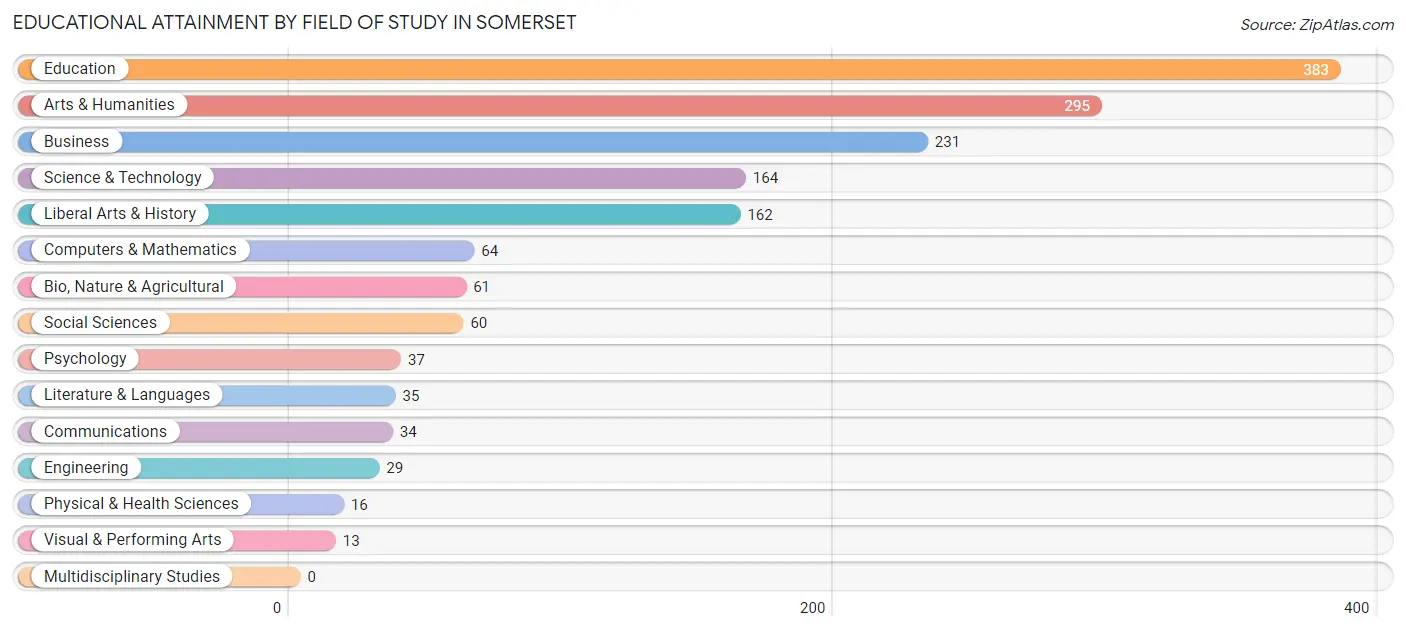
| Field of Study | # Graduates | % Graduates |
| Computers & Mathematics | 64 | 4.0% |
| Bio, Nature & Agricultural | 61 | 3.8% |
| Physical & Health Sciences | 16 | 1.0% |
| Psychology | 37 | 2.3% |
| Social Sciences | 60 | 3.8% |
| Engineering | 29 | 1.8% |
| Multidisciplinary Studies | 0 | 0.0% |
| Science & Technology | 164 | 10.3% |
| Business | 231 | 14.6% |
| Education | 383 | 24.2% |
| Literature & Languages | 35 | 2.2% |
| Liberal Arts & History | 162 | 10.2% |
| Visual & Performing Arts | 13 | 0.8% |
| Communications | 34 | 2.1% |
| Arts & Humanities | 295 | 18.6% |
| Total | 1,584 | 100.0% |
Transportation & Commute in Somerset
Vehicle Availability by Sex in Somerset
The most prevalent vehicle ownership categories in Somerset are males with 2 vehicles (1,034, accounting for 38.1%) and females with 2 vehicles (581, making up 55.3%).
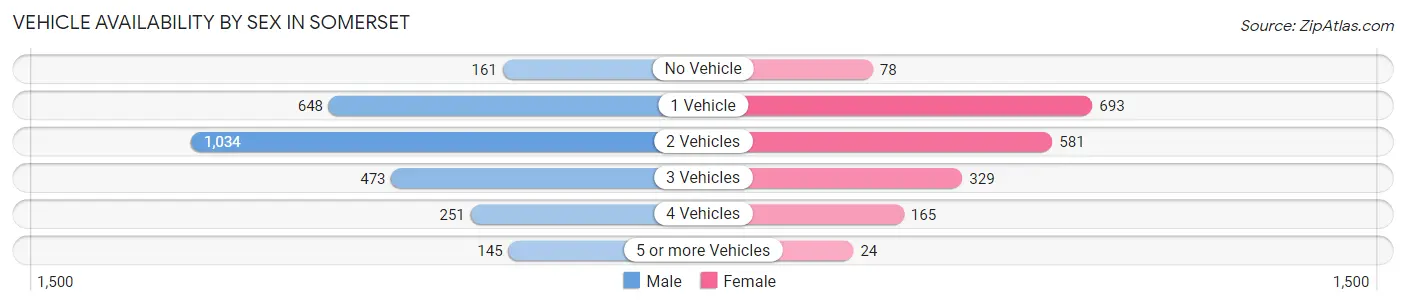
| Vehicles Available | Male | Female |
| No Vehicle | 161 (5.9%) | 78 (4.2%) |
| 1 Vehicle | 648 (23.9%) | 693 (37.1%) |
| 2 Vehicles | 1,034 (38.1%) | 581 (31.1%) |
| 3 Vehicles | 473 (17.4%) | 329 (17.6%) |
| 4 Vehicles | 251 (9.3%) | 165 (8.8%) |
| 5 or more Vehicles | 145 (5.3%) | 24 (1.3%) |
| Total | 2,712 (100.0%) | 1,870 (100.0%) |
Commute Time in Somerset
The most frequently occuring commute durations in Somerset are 5 to 9 minutes (887 commuters, 20.0%), 15 to 19 minutes (885 commuters, 20.0%), and 10 to 14 minutes (693 commuters, 15.6%).
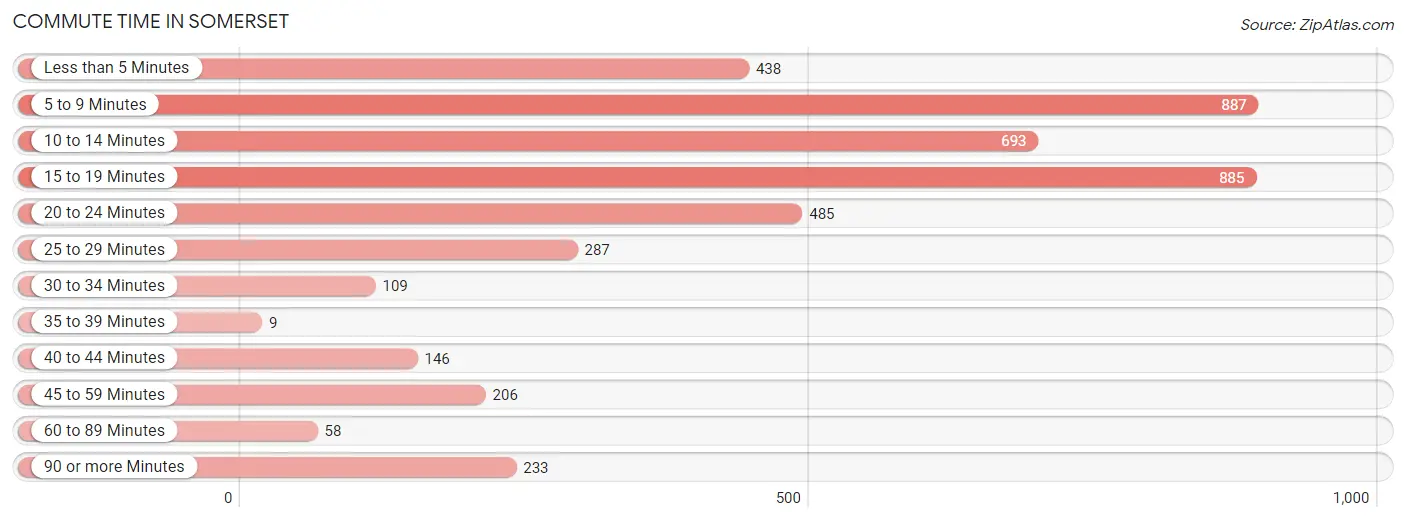
| Commute Time | # Commuters | % Commuters |
| Less than 5 Minutes | 438 | 9.9% |
| 5 to 9 Minutes | 887 | 20.0% |
| 10 to 14 Minutes | 693 | 15.6% |
| 15 to 19 Minutes | 885 | 20.0% |
| 20 to 24 Minutes | 485 | 10.9% |
| 25 to 29 Minutes | 287 | 6.5% |
| 30 to 34 Minutes | 109 | 2.5% |
| 35 to 39 Minutes | 9 | 0.2% |
| 40 to 44 Minutes | 146 | 3.3% |
| 45 to 59 Minutes | 206 | 4.6% |
| 60 to 89 Minutes | 58 | 1.3% |
| 90 or more Minutes | 233 | 5.2% |
Commute Time by Sex in Somerset
The most common commute times in Somerset are 15 to 19 minutes (652 commuters, 24.7%) for males and 5 to 9 minutes (438 commuters, 24.4%) for females.
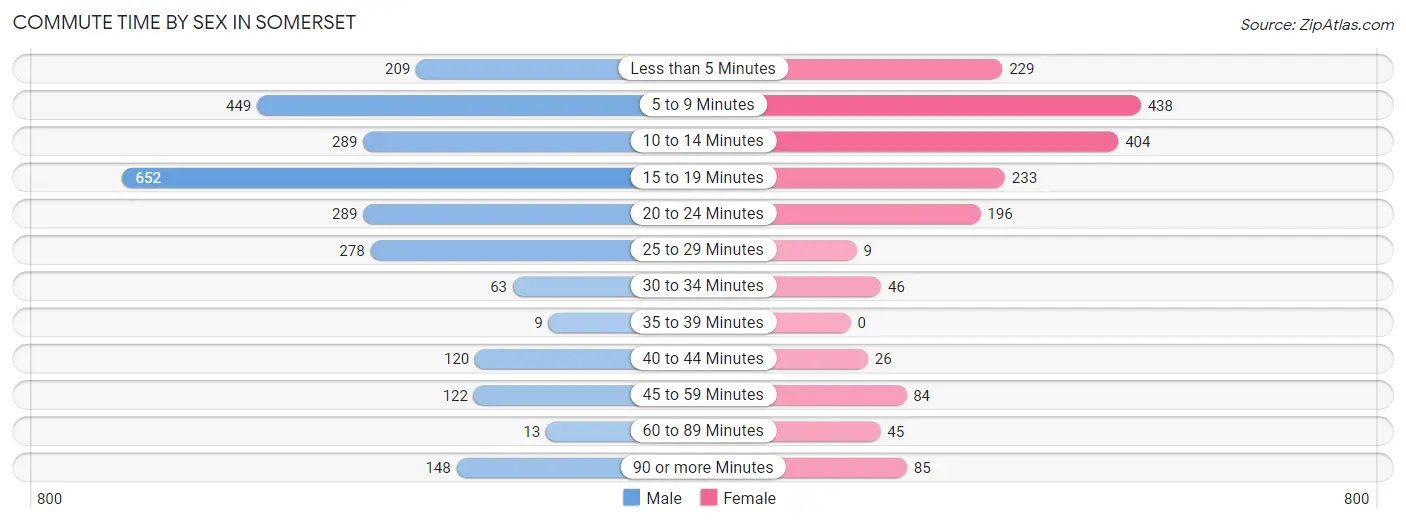
| Commute Time | Male | Female |
| Less than 5 Minutes | 209 (7.9%) | 229 (12.8%) |
| 5 to 9 Minutes | 449 (17.0%) | 438 (24.4%) |
| 10 to 14 Minutes | 289 (10.9%) | 404 (22.5%) |
| 15 to 19 Minutes | 652 (24.7%) | 233 (13.0%) |
| 20 to 24 Minutes | 289 (10.9%) | 196 (10.9%) |
| 25 to 29 Minutes | 278 (10.5%) | 9 (0.5%) |
| 30 to 34 Minutes | 63 (2.4%) | 46 (2.6%) |
| 35 to 39 Minutes | 9 (0.3%) | 0 (0.0%) |
| 40 to 44 Minutes | 120 (4.5%) | 26 (1.5%) |
| 45 to 59 Minutes | 122 (4.6%) | 84 (4.7%) |
| 60 to 89 Minutes | 13 (0.5%) | 45 (2.5%) |
| 90 or more Minutes | 148 (5.6%) | 85 (4.7%) |
Time of Departure to Work by Sex in Somerset
The most frequent times of departure to work in Somerset are 7:30 AM to 7:59 AM (532, 20.1%) for males and 8:00 AM to 8:29 AM (310, 17.3%) for females.
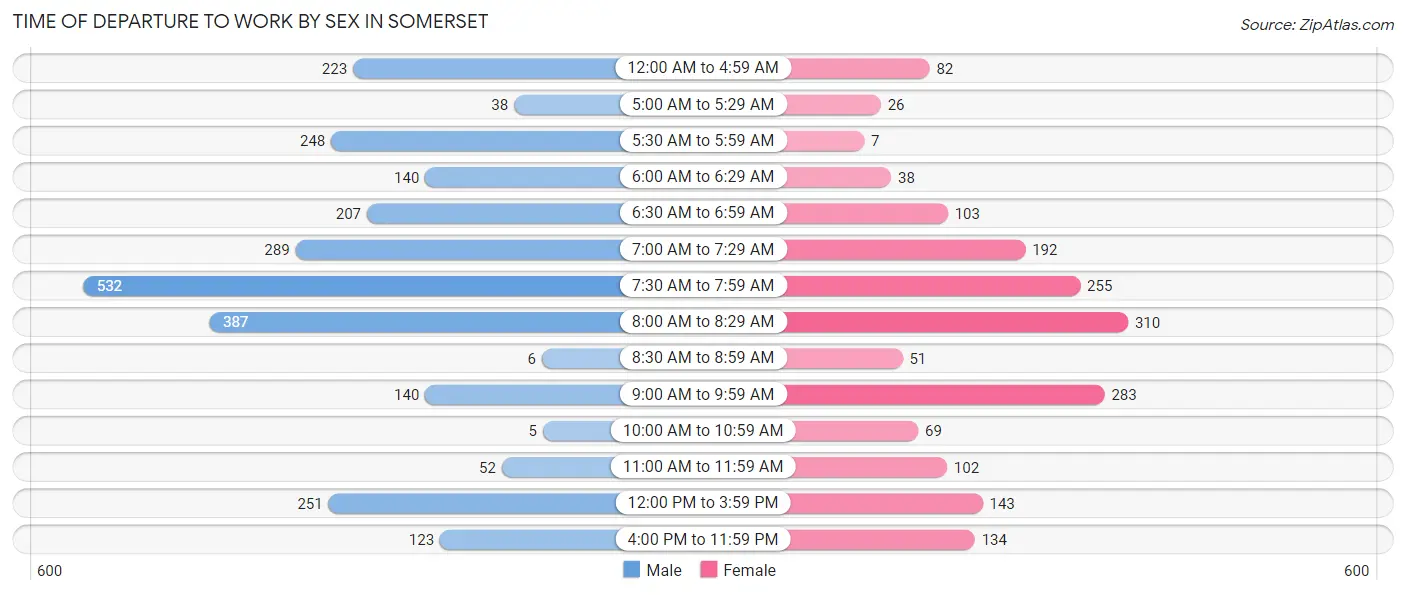
| Time of Departure | Male | Female |
| 12:00 AM to 4:59 AM | 223 (8.4%) | 82 (4.6%) |
| 5:00 AM to 5:29 AM | 38 (1.4%) | 26 (1.5%) |
| 5:30 AM to 5:59 AM | 248 (9.4%) | 7 (0.4%) |
| 6:00 AM to 6:29 AM | 140 (5.3%) | 38 (2.1%) |
| 6:30 AM to 6:59 AM | 207 (7.8%) | 103 (5.7%) |
| 7:00 AM to 7:29 AM | 289 (10.9%) | 192 (10.7%) |
| 7:30 AM to 7:59 AM | 532 (20.1%) | 255 (14.2%) |
| 8:00 AM to 8:29 AM | 387 (14.6%) | 310 (17.3%) |
| 8:30 AM to 8:59 AM | 6 (0.2%) | 51 (2.8%) |
| 9:00 AM to 9:59 AM | 140 (5.3%) | 283 (15.8%) |
| 10:00 AM to 10:59 AM | 5 (0.2%) | 69 (3.8%) |
| 11:00 AM to 11:59 AM | 52 (2.0%) | 102 (5.7%) |
| 12:00 PM to 3:59 PM | 251 (9.5%) | 143 (8.0%) |
| 4:00 PM to 11:59 PM | 123 (4.7%) | 134 (7.5%) |
| Total | 2,641 (100.0%) | 1,795 (100.0%) |
Housing Occupancy in Somerset
Occupancy by Ownership in Somerset
Of the total 4,554 dwellings in Somerset, owner-occupied units account for 2,057 (45.2%), while renter-occupied units make up 2,497 (54.8%).
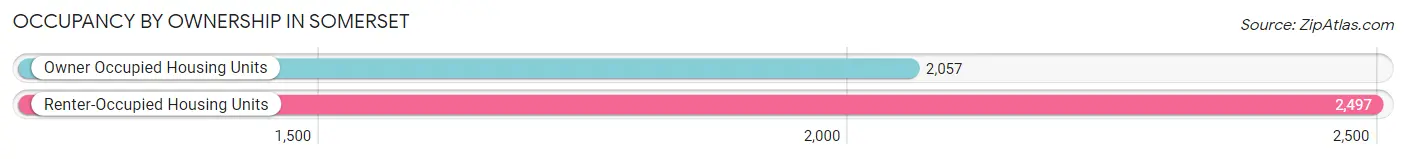
| Occupancy | # Housing Units | % Housing Units |
| Owner Occupied Housing Units | 2,057 | 45.2% |
| Renter-Occupied Housing Units | 2,497 | 54.8% |
| Total Occupied Housing Units | 4,554 | 100.0% |
Occupancy by Household Size in Somerset
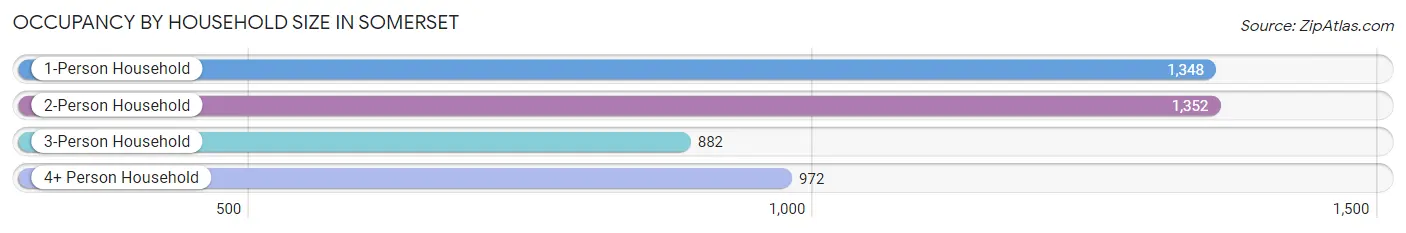
| Household Size | # Housing Units | % Housing Units |
| 1-Person Household | 1,348 | 29.6% |
| 2-Person Household | 1,352 | 29.7% |
| 3-Person Household | 882 | 19.4% |
| 4+ Person Household | 972 | 21.3% |
| Total Housing Units | 4,554 | 100.0% |
Occupancy by Ownership by Household Size in Somerset
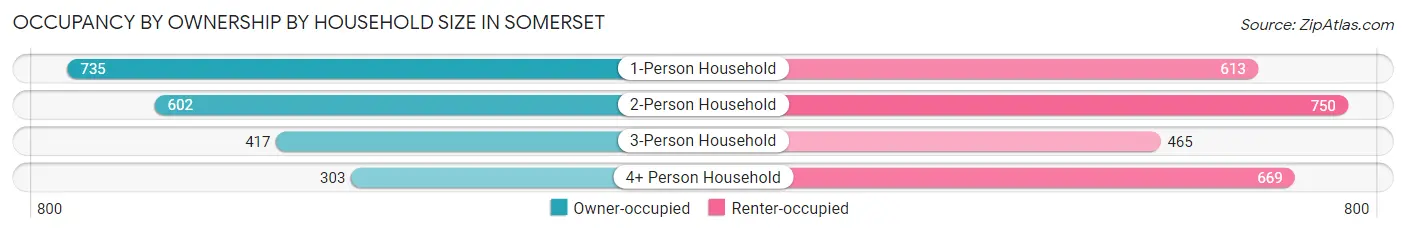
| Household Size | Owner-occupied | Renter-occupied |
| 1-Person Household | 735 (54.5%) | 613 (45.5%) |
| 2-Person Household | 602 (44.5%) | 750 (55.5%) |
| 3-Person Household | 417 (47.3%) | 465 (52.7%) |
| 4+ Person Household | 303 (31.2%) | 669 (68.8%) |
| Total Housing Units | 2,057 (45.2%) | 2,497 (54.8%) |
Occupancy by Educational Attainment in Somerset
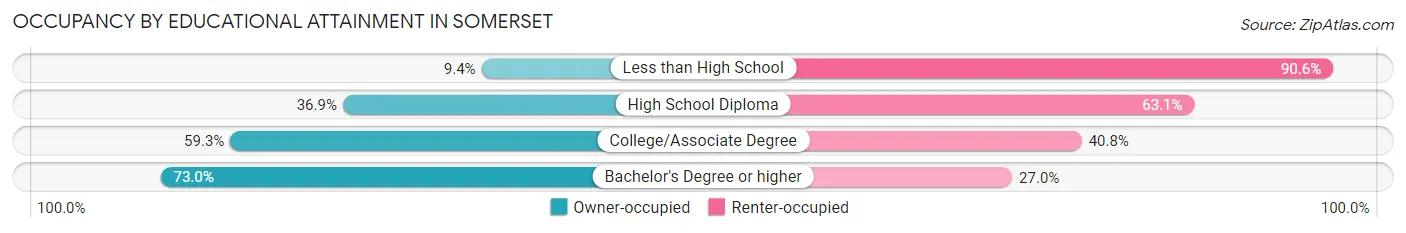
| Household Size | Owner-occupied | Renter-occupied |
| Less than High School | 87 (9.4%) | 837 (90.6%) |
| High School Diploma | 497 (36.9%) | 849 (63.1%) |
| College/Associate Degree | 839 (59.3%) | 577 (40.7%) |
| Bachelor's Degree or higher | 634 (73.0%) | 234 (27.0%) |
Occupancy by Age of Householder in Somerset
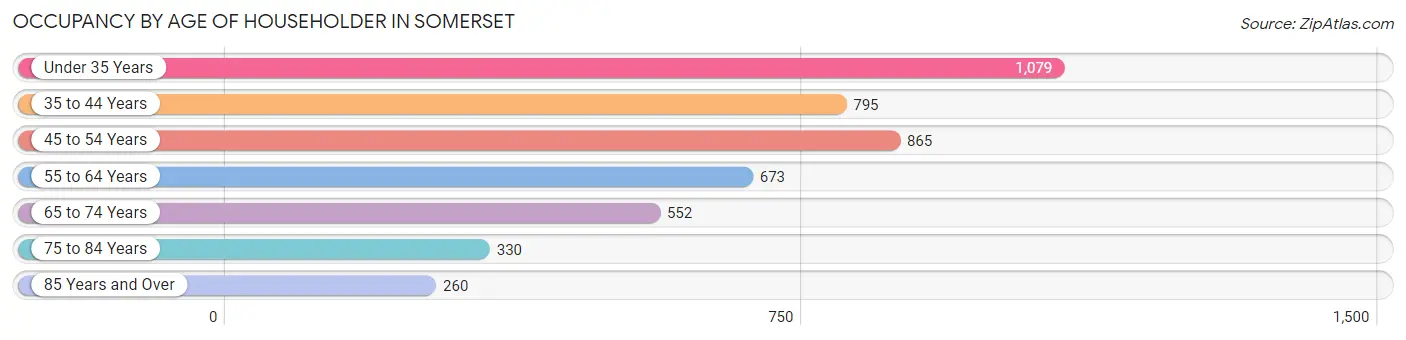
| Age Bracket | # Households | % Households |
| Under 35 Years | 1,079 | 23.7% |
| 35 to 44 Years | 795 | 17.5% |
| 45 to 54 Years | 865 | 19.0% |
| 55 to 64 Years | 673 | 14.8% |
| 65 to 74 Years | 552 | 12.1% |
| 75 to 84 Years | 330 | 7.2% |
| 85 Years and Over | 260 | 5.7% |
| Total | 4,554 | 100.0% |
Housing Finances in Somerset
Median Income by Occupancy in Somerset
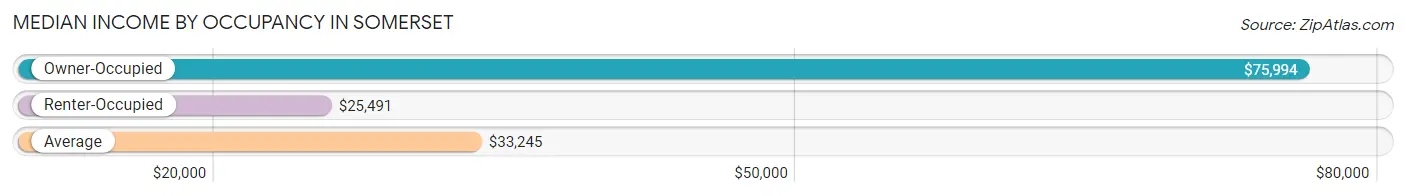
| Occupancy Type | # Households | Median Income |
| Owner-Occupied | 2,057 (45.2%) | $75,994 |
| Renter-Occupied | 2,497 (54.8%) | $25,491 |
| Average | 4,554 (100.0%) | $33,245 |
Occupancy by Householder Income Bracket in Somerset
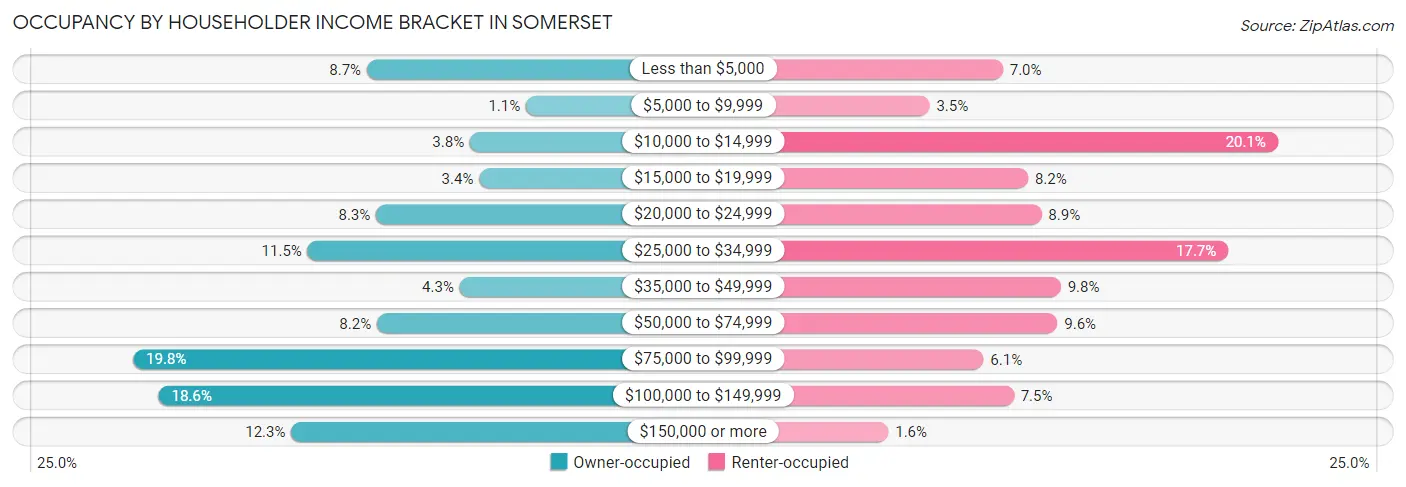
| Income Bracket | Owner-occupied | Renter-occupied |
| Less than $5,000 | 179 (8.7%) | 175 (7.0%) |
| $5,000 to $9,999 | 23 (1.1%) | 88 (3.5%) |
| $10,000 to $14,999 | 78 (3.8%) | 502 (20.1%) |
| $15,000 to $19,999 | 69 (3.4%) | 205 (8.2%) |
| $20,000 to $24,999 | 170 (8.3%) | 221 (8.8%) |
| $25,000 to $34,999 | 237 (11.5%) | 443 (17.7%) |
| $35,000 to $49,999 | 88 (4.3%) | 244 (9.8%) |
| $50,000 to $74,999 | 169 (8.2%) | 240 (9.6%) |
| $75,000 to $99,999 | 408 (19.8%) | 152 (6.1%) |
| $100,000 to $149,999 | 383 (18.6%) | 188 (7.5%) |
| $150,000 or more | 253 (12.3%) | 39 (1.6%) |
| Total | 2,057 (100.0%) | 2,497 (100.0%) |
Monthly Housing Cost Tiers in Somerset
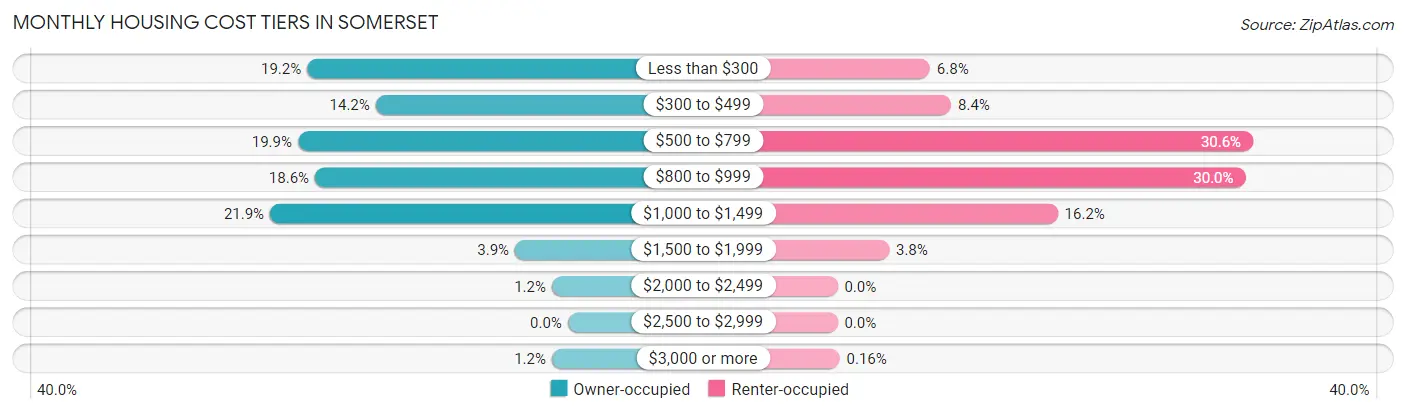
| Monthly Cost | Owner-occupied | Renter-occupied |
| Less than $300 | 395 (19.2%) | 170 (6.8%) |
| $300 to $499 | 291 (14.1%) | 209 (8.4%) |
| $500 to $799 | 409 (19.9%) | 764 (30.6%) |
| $800 to $999 | 383 (18.6%) | 750 (30.0%) |
| $1,000 to $1,499 | 451 (21.9%) | 405 (16.2%) |
| $1,500 to $1,999 | 80 (3.9%) | 95 (3.8%) |
| $2,000 to $2,499 | 24 (1.2%) | 0 (0.0%) |
| $2,500 to $2,999 | 0 (0.0%) | 0 (0.0%) |
| $3,000 or more | 24 (1.2%) | 4 (0.2%) |
| Total | 2,057 (100.0%) | 2,497 (100.0%) |
Physical Housing Characteristics in Somerset
Housing Structures in Somerset
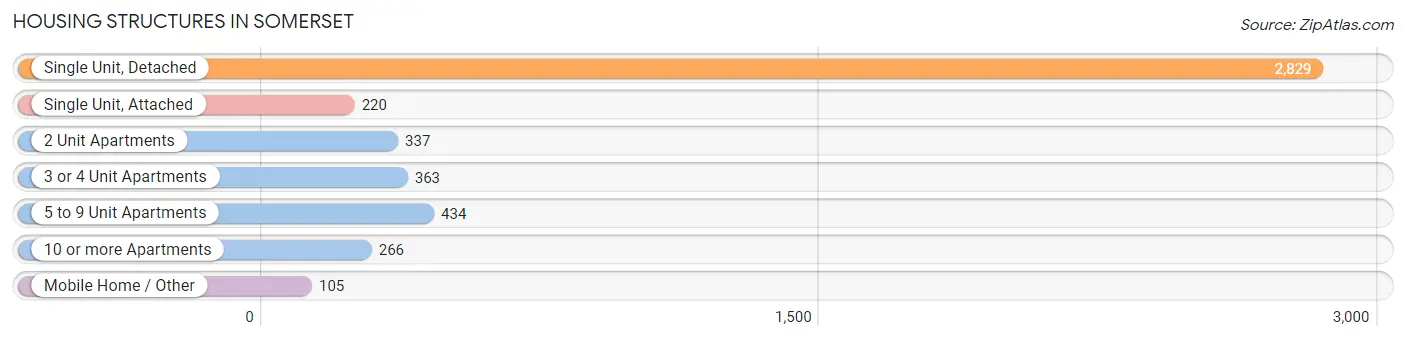
| Structure Type | # Housing Units | % Housing Units |
| Single Unit, Detached | 2,829 | 62.1% |
| Single Unit, Attached | 220 | 4.8% |
| 2 Unit Apartments | 337 | 7.4% |
| 3 or 4 Unit Apartments | 363 | 8.0% |
| 5 to 9 Unit Apartments | 434 | 9.5% |
| 10 or more Apartments | 266 | 5.8% |
| Mobile Home / Other | 105 | 2.3% |
| Total | 4,554 | 100.0% |
Housing Structures by Occupancy in Somerset
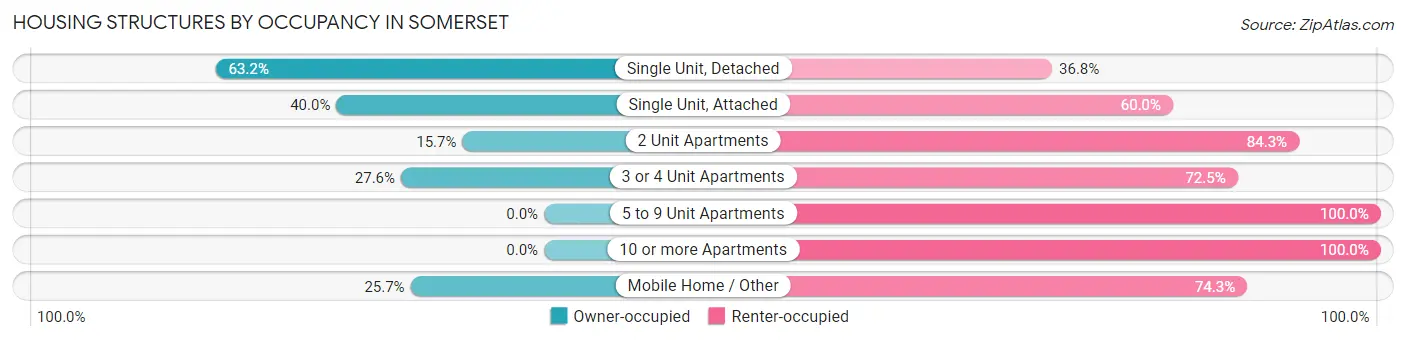
| Structure Type | Owner-occupied | Renter-occupied |
| Single Unit, Detached | 1,789 (63.2%) | 1,040 (36.8%) |
| Single Unit, Attached | 88 (40.0%) | 132 (60.0%) |
| 2 Unit Apartments | 53 (15.7%) | 284 (84.3%) |
| 3 or 4 Unit Apartments | 100 (27.6%) | 263 (72.5%) |
| 5 to 9 Unit Apartments | 0 (0.0%) | 434 (100.0%) |
| 10 or more Apartments | 0 (0.0%) | 266 (100.0%) |
| Mobile Home / Other | 27 (25.7%) | 78 (74.3%) |
| Total | 2,057 (45.2%) | 2,497 (54.8%) |
Housing Structures by Number of Rooms in Somerset
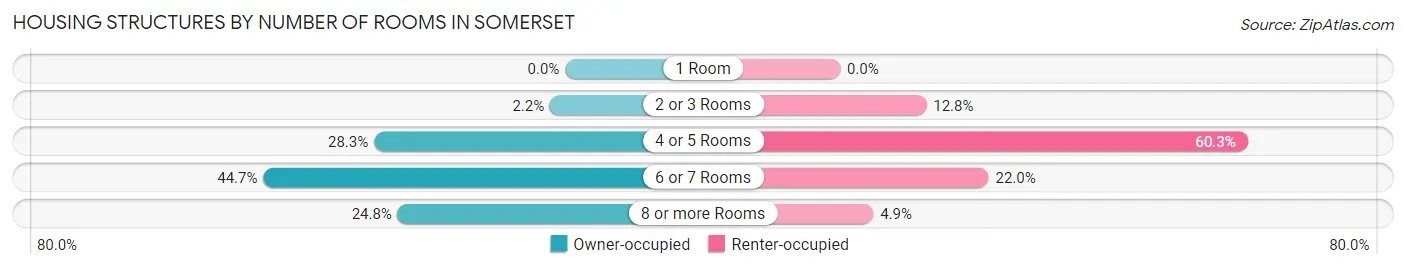
| Number of Rooms | Owner-occupied | Renter-occupied |
| 1 Room | 0 (0.0%) | 0 (0.0%) |
| 2 or 3 Rooms | 46 (2.2%) | 319 (12.8%) |
| 4 or 5 Rooms | 582 (28.3%) | 1,506 (60.3%) |
| 6 or 7 Rooms | 919 (44.7%) | 549 (22.0%) |
| 8 or more Rooms | 510 (24.8%) | 123 (4.9%) |
| Total | 2,057 (100.0%) | 2,497 (100.0%) |
Housing Structure by Heating Type in Somerset
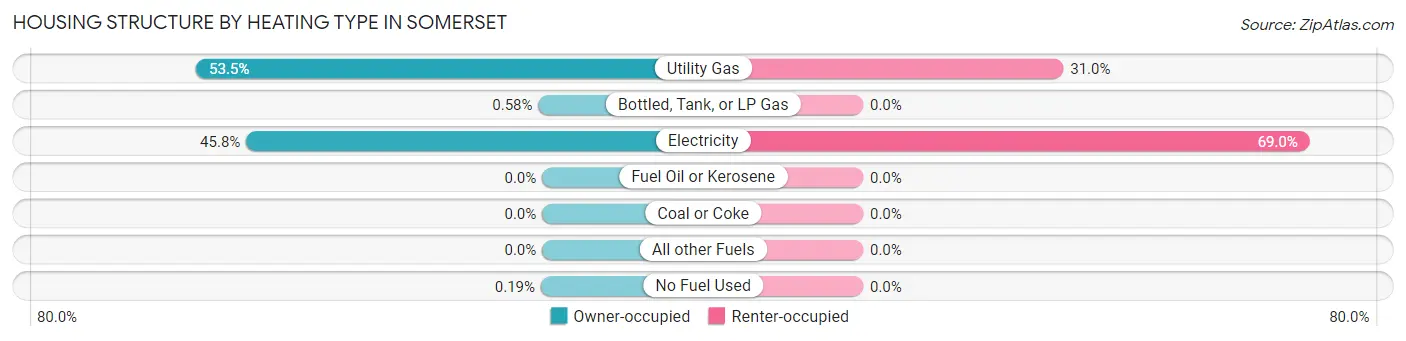
| Heating Type | Owner-occupied | Renter-occupied |
| Utility Gas | 1,100 (53.5%) | 773 (31.0%) |
| Bottled, Tank, or LP Gas | 12 (0.6%) | 0 (0.0%) |
| Electricity | 941 (45.8%) | 1,724 (69.0%) |
| Fuel Oil or Kerosene | 0 (0.0%) | 0 (0.0%) |
| Coal or Coke | 0 (0.0%) | 0 (0.0%) |
| All other Fuels | 0 (0.0%) | 0 (0.0%) |
| No Fuel Used | 4 (0.2%) | 0 (0.0%) |
| Total | 2,057 (100.0%) | 2,497 (100.0%) |
Household Vehicle Usage in Somerset
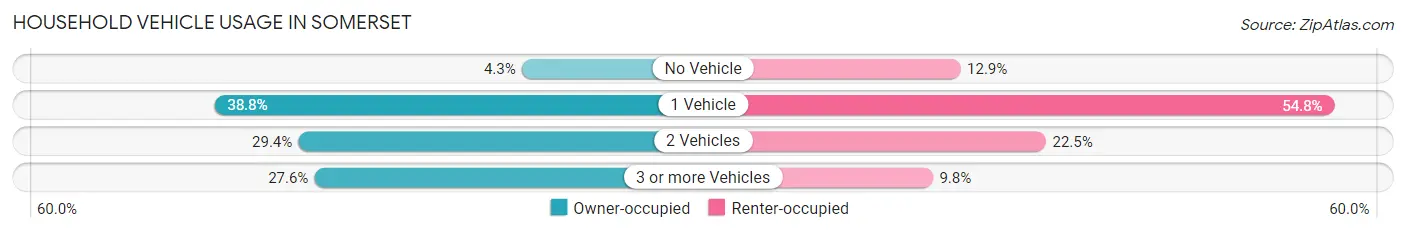
| Vehicles per Household | Owner-occupied | Renter-occupied |
| No Vehicle | 89 (4.3%) | 322 (12.9%) |
| 1 Vehicle | 797 (38.8%) | 1,369 (54.8%) |
| 2 Vehicles | 604 (29.4%) | 561 (22.5%) |
| 3 or more Vehicles | 567 (27.6%) | 245 (9.8%) |
| Total | 2,057 (100.0%) | 2,497 (100.0%) |
Real Estate & Mortgages in Somerset
Real Estate and Mortgage Overview in Somerset
| Characteristic | Without Mortgage | With Mortgage |
| Housing Units | 880 | 1,177 |
| Median Property Value | $117,900 | $140,400 |
| Median Household Income | $32,794 | $115 |
| Monthly Housing Costs | $350 | $24 |
| Real Estate Taxes | $758 | $95 |
Property Value by Mortgage Status in Somerset
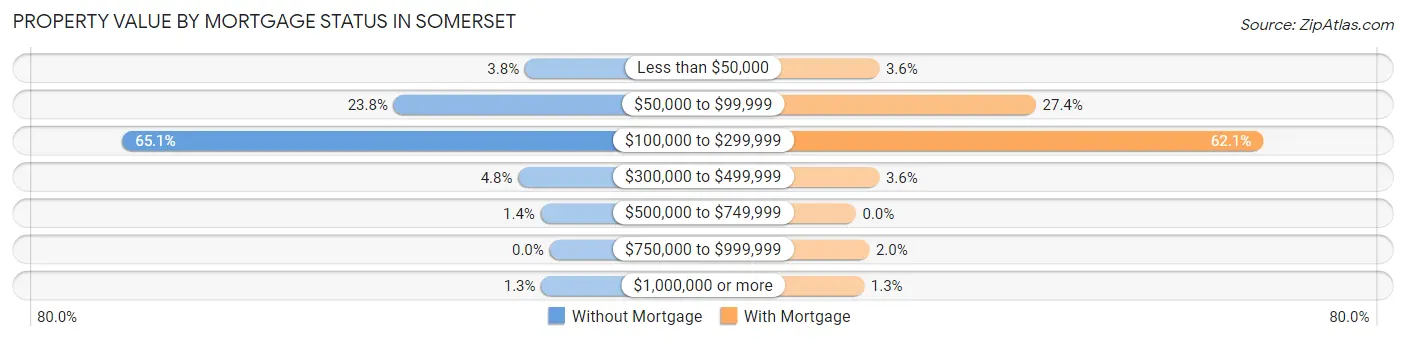
| Property Value | Without Mortgage | With Mortgage |
| Less than $50,000 | 33 (3.7%) | 42 (3.6%) |
| $50,000 to $99,999 | 209 (23.7%) | 323 (27.4%) |
| $100,000 to $299,999 | 573 (65.1%) | 731 (62.1%) |
| $300,000 to $499,999 | 42 (4.8%) | 42 (3.6%) |
| $500,000 to $749,999 | 12 (1.4%) | 0 (0.0%) |
| $750,000 to $999,999 | 0 (0.0%) | 24 (2.0%) |
| $1,000,000 or more | 11 (1.3%) | 15 (1.3%) |
| Total | 880 (100.0%) | 1,177 (100.0%) |
Household Income by Mortgage Status in Somerset
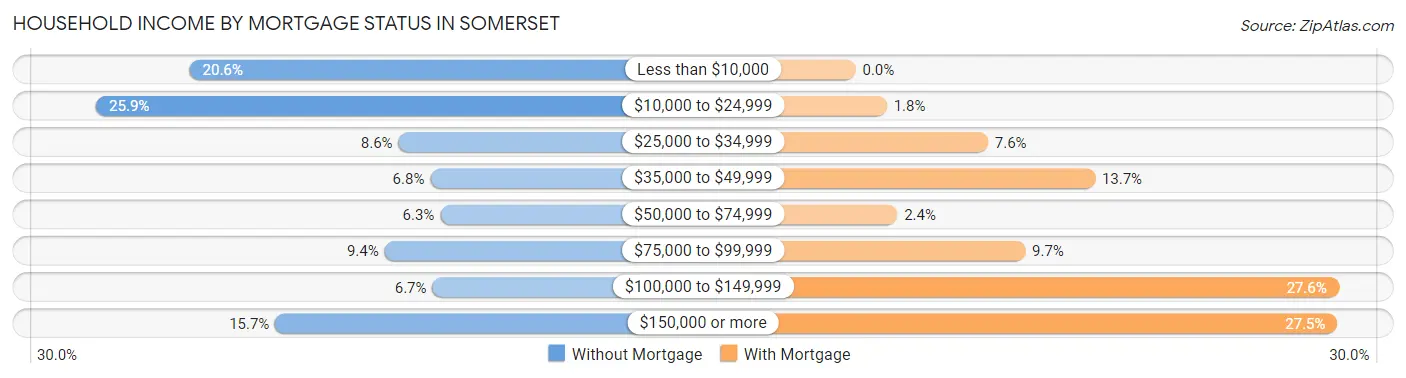
| Household Income | Without Mortgage | With Mortgage |
| Less than $10,000 | 181 (20.6%) | 0 (0.0%) |
| $10,000 to $24,999 | 228 (25.9%) | 21 (1.8%) |
| $25,000 to $34,999 | 76 (8.6%) | 89 (7.6%) |
| $35,000 to $49,999 | 60 (6.8%) | 161 (13.7%) |
| $50,000 to $74,999 | 55 (6.2%) | 28 (2.4%) |
| $75,000 to $99,999 | 83 (9.4%) | 114 (9.7%) |
| $100,000 to $149,999 | 59 (6.7%) | 325 (27.6%) |
| $150,000 or more | 138 (15.7%) | 324 (27.5%) |
| Total | 880 (100.0%) | 1,177 (100.0%) |
Property Value to Household Income Ratio in Somerset
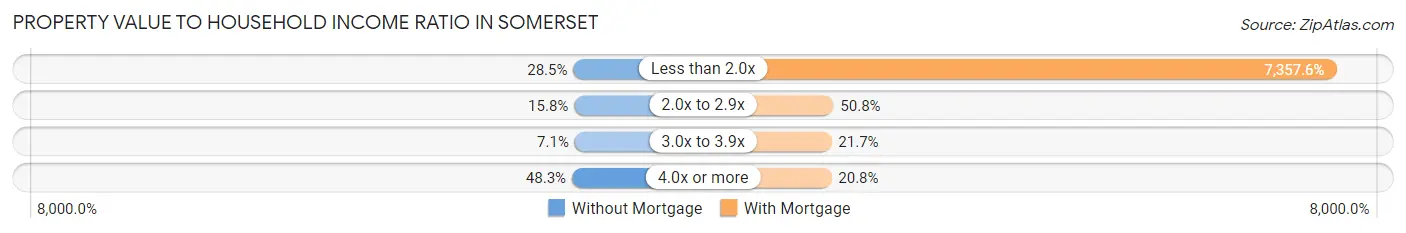
| Value-to-Income Ratio | Without Mortgage | With Mortgage |
| Less than 2.0x | 251 (28.5%) | 86,599 (7,357.6%) |
| 2.0x to 2.9x | 139 (15.8%) | 598 (50.8%) |
| 3.0x to 3.9x | 62 (7.0%) | 255 (21.7%) |
| 4.0x or more | 425 (48.3%) | 245 (20.8%) |
| Total | 880 (100.0%) | 1,177 (100.0%) |
Real Estate Taxes by Mortgage Status in Somerset
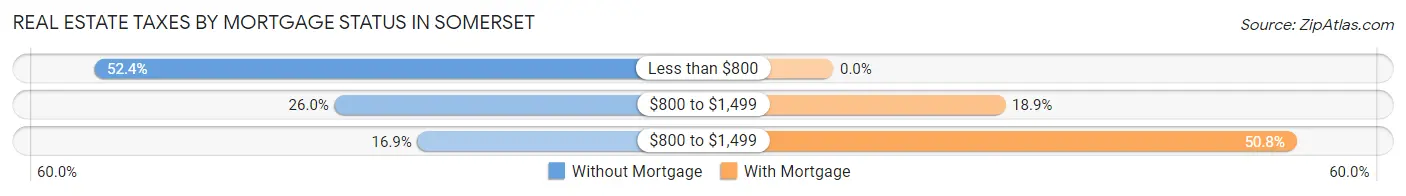
| Property Taxes | Without Mortgage | With Mortgage |
| Less than $800 | 461 (52.4%) | 0 (0.0%) |
| $800 to $1,499 | 229 (26.0%) | 222 (18.9%) |
| $800 to $1,499 | 149 (16.9%) | 598 (50.8%) |
| Total | 880 (100.0%) | 1,177 (100.0%) |
Health & Disability in Somerset
Health Insurance Coverage by Age in Somerset
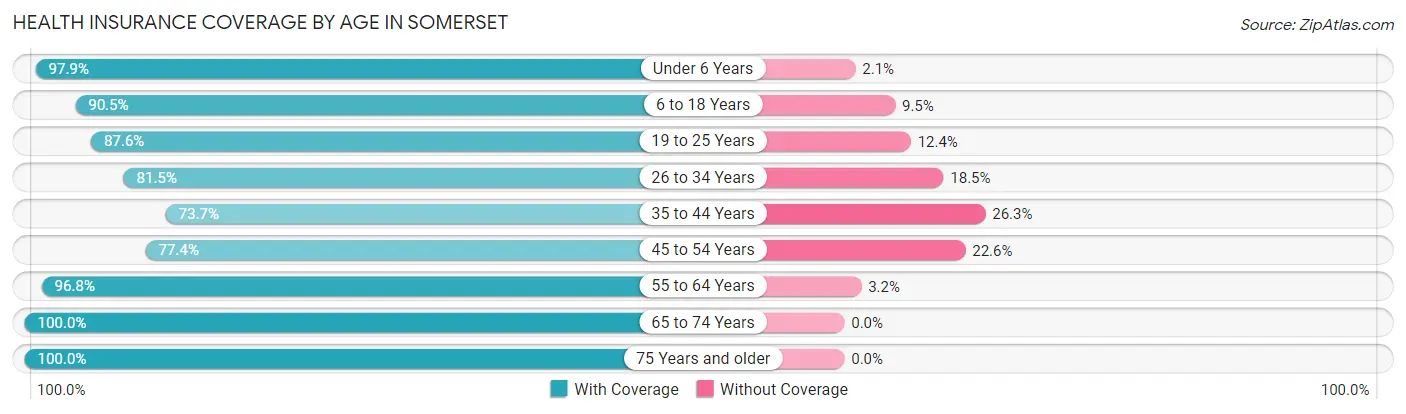
| Age Bracket | With Coverage | Without Coverage |
| Under 6 Years | 857 (97.9%) | 18 (2.1%) |
| 6 to 18 Years | 1,733 (90.5%) | 181 (9.5%) |
| 19 to 25 Years | 842 (87.6%) | 119 (12.4%) |
| 26 to 34 Years | 1,218 (81.5%) | 276 (18.5%) |
| 35 to 44 Years | 1,090 (73.7%) | 389 (26.3%) |
| 45 to 54 Years | 1,119 (77.4%) | 326 (22.6%) |
| 55 to 64 Years | 1,104 (96.8%) | 36 (3.2%) |
| 65 to 74 Years | 1,044 (100.0%) | 0 (0.0%) |
| 75 Years and older | 838 (100.0%) | 0 (0.0%) |
| Total | 9,845 (88.0%) | 1,345 (12.0%) |
Health Insurance Coverage by Citizenship Status in Somerset
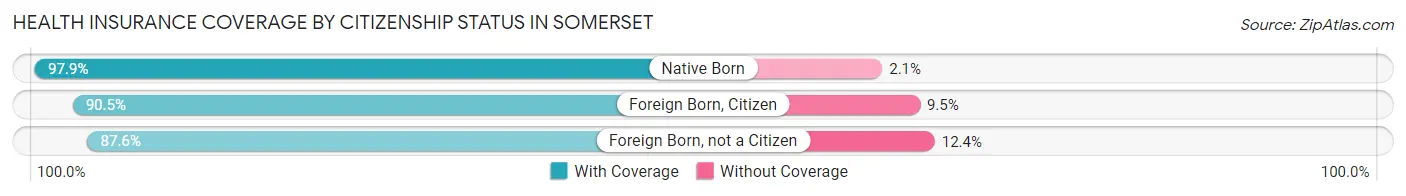
| Citizenship Status | With Coverage | Without Coverage |
| Native Born | 857 (97.9%) | 18 (2.1%) |
| Foreign Born, Citizen | 1,733 (90.5%) | 181 (9.5%) |
| Foreign Born, not a Citizen | 842 (87.6%) | 119 (12.4%) |
Health Insurance Coverage by Household Income in Somerset
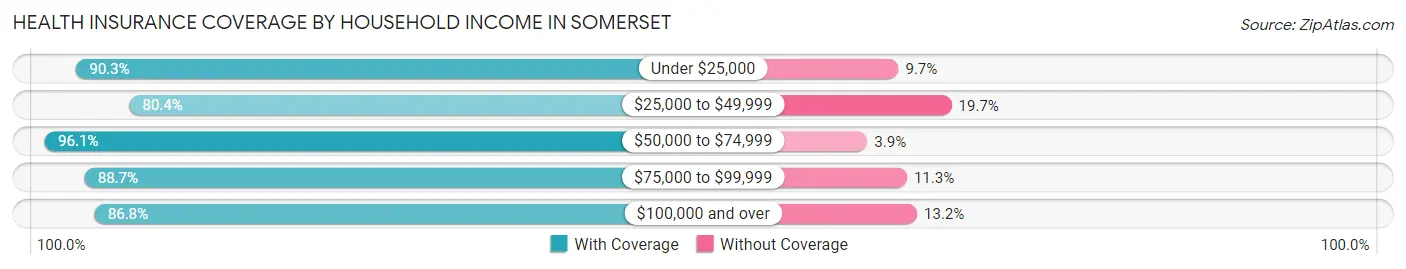
| Household Income | With Coverage | Without Coverage |
| Under $25,000 | 3,000 (90.3%) | 322 (9.7%) |
| $25,000 to $49,999 | 1,754 (80.3%) | 429 (19.7%) |
| $50,000 to $74,999 | 1,247 (96.1%) | 50 (3.9%) |
| $75,000 to $99,999 | 1,479 (88.7%) | 188 (11.3%) |
| $100,000 and over | 2,348 (86.8%) | 356 (13.2%) |
Public vs Private Health Insurance Coverage by Age in Somerset
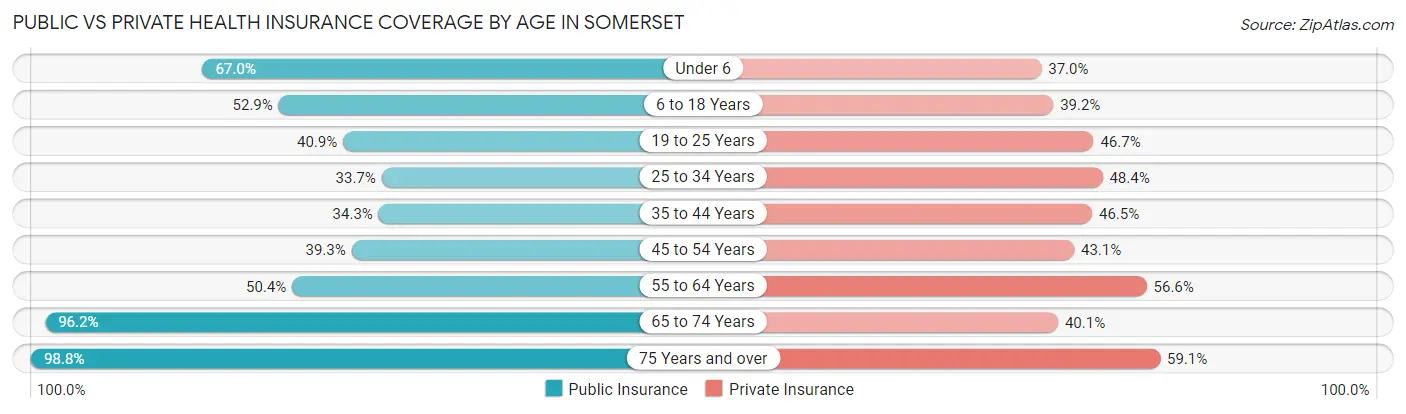
| Age Bracket | Public Insurance | Private Insurance |
| Under 6 | 586 (67.0%) | 324 (37.0%) |
| 6 to 18 Years | 1,012 (52.9%) | 751 (39.2%) |
| 19 to 25 Years | 393 (40.9%) | 449 (46.7%) |
| 25 to 34 Years | 504 (33.7%) | 723 (48.4%) |
| 35 to 44 Years | 507 (34.3%) | 687 (46.5%) |
| 45 to 54 Years | 568 (39.3%) | 623 (43.1%) |
| 55 to 64 Years | 574 (50.3%) | 645 (56.6%) |
| 65 to 74 Years | 1,004 (96.2%) | 419 (40.1%) |
| 75 Years and over | 828 (98.8%) | 495 (59.1%) |
| Total | 5,976 (53.4%) | 5,116 (45.7%) |
Disability Status by Sex by Age in Somerset
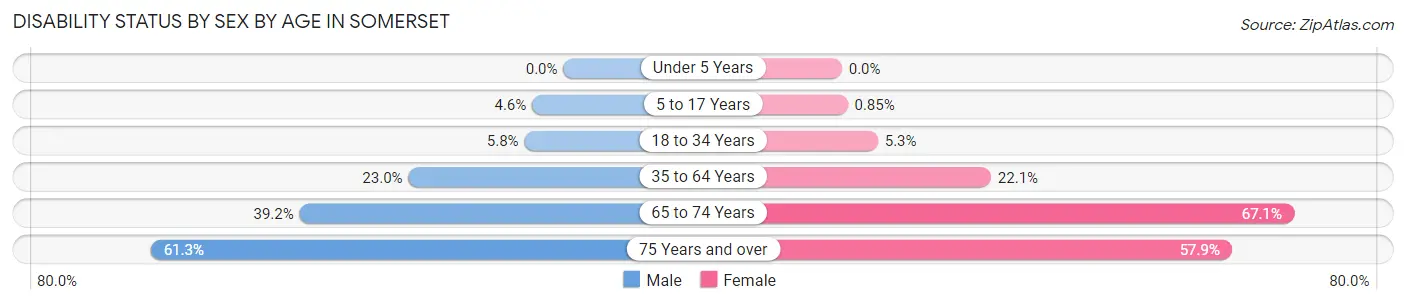
| Age Bracket | Male | Female |
| Under 5 Years | 0 (0.0%) | 0 (0.0%) |
| 5 to 17 Years | 43 (4.6%) | 8 (0.9%) |
| 18 to 34 Years | 91 (5.8%) | 55 (5.3%) |
| 35 to 64 Years | 454 (23.0%) | 463 (22.1%) |
| 65 to 74 Years | 179 (39.2%) | 394 (67.1%) |
| 75 Years and over | 87 (61.3%) | 403 (57.9%) |
Disability Class by Sex by Age in Somerset
Disability Class: Hearing Difficulty
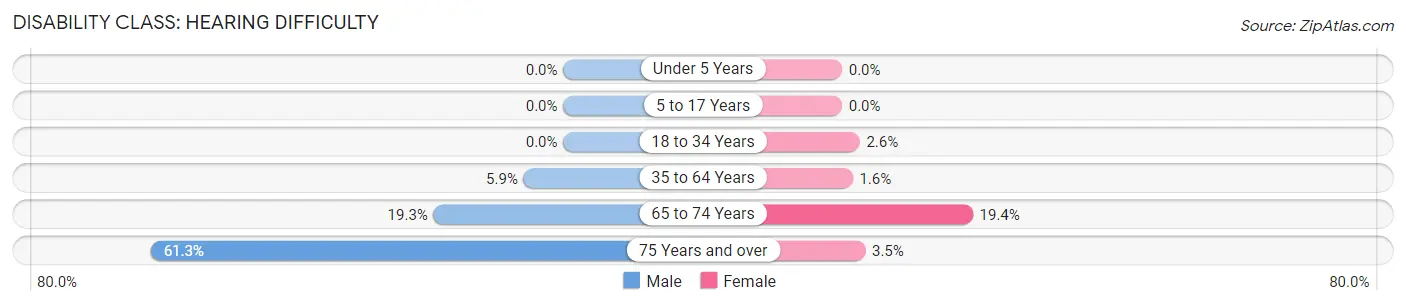
| Age Bracket | Male | Female |
| Under 5 Years | 0 (0.0%) | 0 (0.0%) |
| 5 to 17 Years | 0 (0.0%) | 0 (0.0%) |
| 18 to 34 Years | 0 (0.0%) | 27 (2.6%) |
| 35 to 64 Years | 116 (5.9%) | 33 (1.6%) |
| 65 to 74 Years | 88 (19.3%) | 114 (19.4%) |
| 75 Years and over | 87 (61.3%) | 24 (3.5%) |
Disability Class: Vision Difficulty
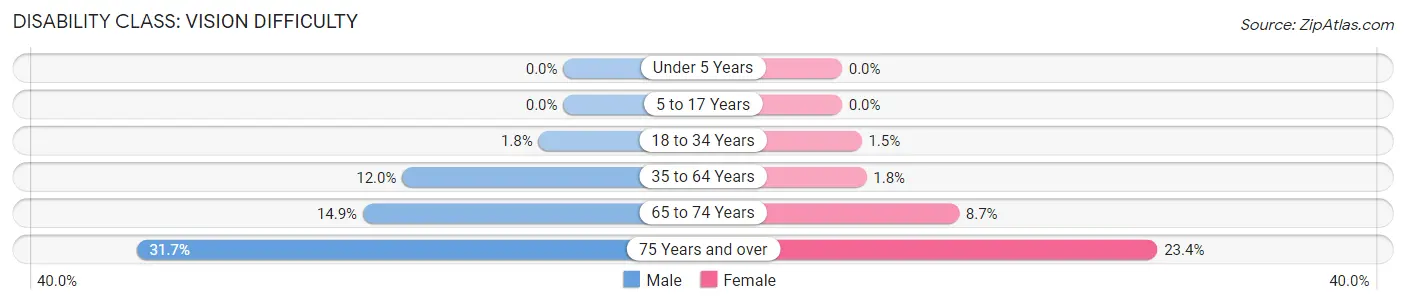
| Age Bracket | Male | Female |
| Under 5 Years | 0 (0.0%) | 0 (0.0%) |
| 5 to 17 Years | 0 (0.0%) | 0 (0.0%) |
| 18 to 34 Years | 29 (1.8%) | 15 (1.5%) |
| 35 to 64 Years | 236 (12.0%) | 38 (1.8%) |
| 65 to 74 Years | 68 (14.9%) | 51 (8.7%) |
| 75 Years and over | 45 (31.7%) | 163 (23.4%) |
Disability Class: Cognitive Difficulty
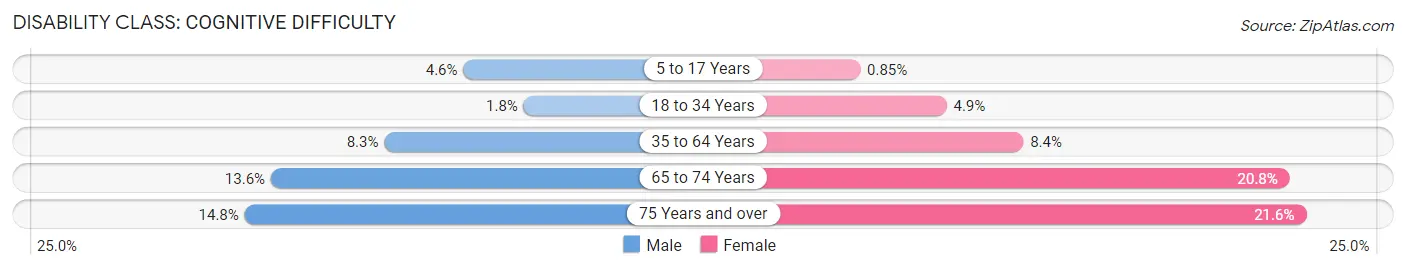
| Age Bracket | Male | Female |
| 5 to 17 Years | 43 (4.6%) | 8 (0.9%) |
| 18 to 34 Years | 29 (1.8%) | 50 (4.9%) |
| 35 to 64 Years | 164 (8.3%) | 176 (8.4%) |
| 65 to 74 Years | 62 (13.6%) | 122 (20.8%) |
| 75 Years and over | 21 (14.8%) | 150 (21.5%) |
Disability Class: Ambulatory Difficulty
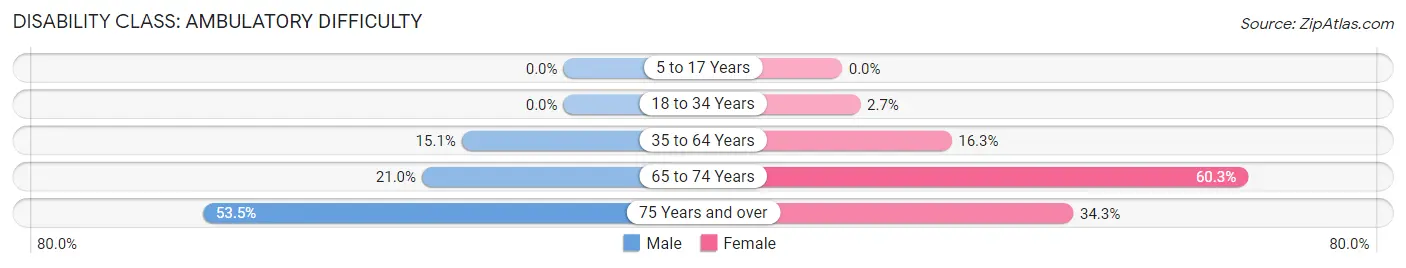
| Age Bracket | Male | Female |
| 5 to 17 Years | 0 (0.0%) | 0 (0.0%) |
| 18 to 34 Years | 0 (0.0%) | 28 (2.7%) |
| 35 to 64 Years | 298 (15.1%) | 340 (16.3%) |
| 65 to 74 Years | 96 (21.0%) | 354 (60.3%) |
| 75 Years and over | 76 (53.5%) | 239 (34.3%) |
Disability Class: Self-Care Difficulty
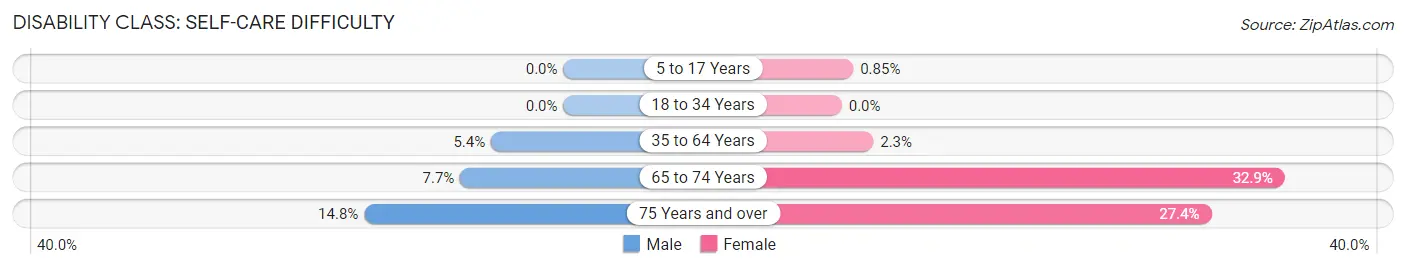
| Age Bracket | Male | Female |
| 5 to 17 Years | 0 (0.0%) | 8 (0.9%) |
| 18 to 34 Years | 0 (0.0%) | 0 (0.0%) |
| 35 to 64 Years | 106 (5.4%) | 49 (2.3%) |
| 65 to 74 Years | 35 (7.7%) | 193 (32.9%) |
| 75 Years and over | 21 (14.8%) | 191 (27.4%) |
Technology Access in Somerset
Computing Device Access in Somerset
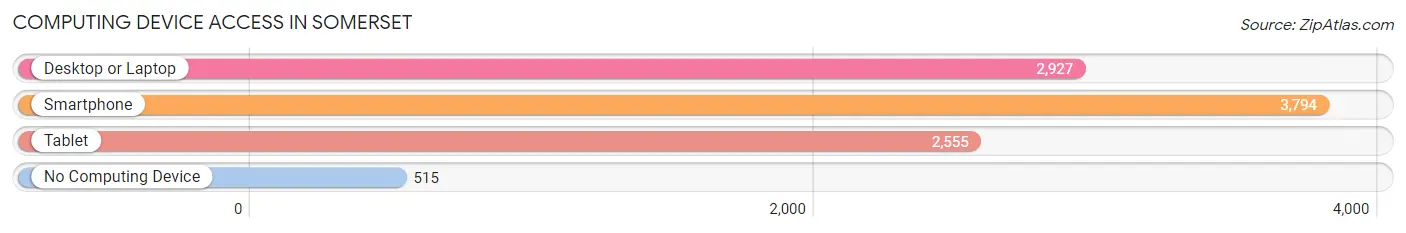
| Device Type | # Households | % Households |
| Desktop or Laptop | 2,927 | 64.3% |
| Smartphone | 3,794 | 83.3% |
| Tablet | 2,555 | 56.1% |
| No Computing Device | 515 | 11.3% |
| Total | 4,554 | 100.0% |
Internet Access in Somerset
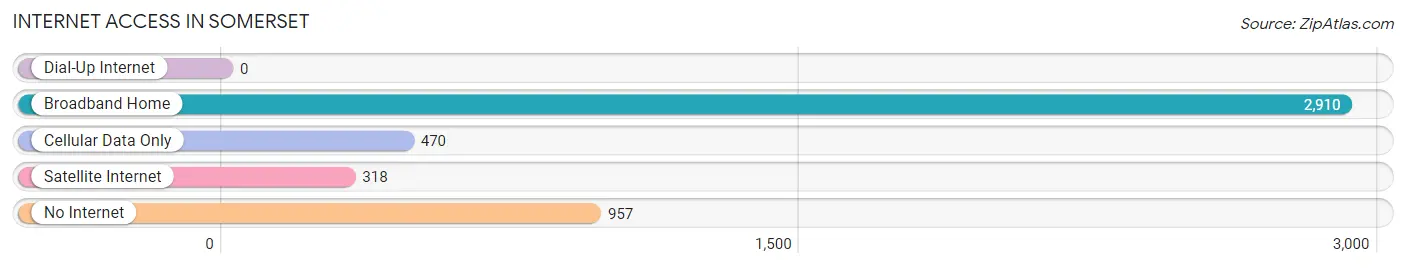
| Internet Type | # Households | % Households |
| Dial-Up Internet | 0 | 0.0% |
| Broadband Home | 2,910 | 63.9% |
| Cellular Data Only | 470 | 10.3% |
| Satellite Internet | 318 | 7.0% |
| No Internet | 957 | 21.0% |
| Total | 4,554 | 100.0% |
Somerset Summary
Somerset, Kentucky is a city located in Pulaski County, Kentucky, United States. It is the county seat of Pulaski County and the 11th-largest city in the state. The population was 11,196 at the 2010 census. Somerset is located in the heart of the Lake Cumberland region of Kentucky, and is the primary city of the Somerset-Pulaski County Metropolitan Statistical Area, which includes all of Pulaski and Lincoln counties.
History
Somerset was founded in 1798 by a group of settlers from Maryland and Virginia. The town was named after Somerset County, Maryland, which was the home of many of the settlers. The town was incorporated in 1802 and became the county seat of Pulaski County in 1807.
Somerset was a major stop on the Louisville and Nashville Railroad, which connected the city to the rest of the country. The railroad brought many new businesses and industries to the area, and the city grew rapidly.
In the late 19th century, Somerset was a major center for the timber industry. The city was home to several large sawmills and lumber companies, and the surrounding area was heavily logged.
Geography
Somerset is located in the heart of the Lake Cumberland region of Kentucky. The city is situated on the banks of the Cumberland River, and is surrounded by rolling hills and forests. The city is located at the intersection of US 27 and US 68, and is about 90 miles south of Lexington.
The climate in Somerset is humid subtropical, with hot, humid summers and mild winters. The average annual temperature is 61°F, and the average annual precipitation is 44 inches.
Economy
Somerset is the economic center of the Lake Cumberland region. The city is home to several large employers, including Lake Cumberland Regional Hospital, Somerset Community College, and the Somerset-Pulaski County Industrial Park.
The city is also home to several manufacturing companies, including General Electric, which produces large appliances, and the Somerset-Pulaski County Industrial Park, which is home to several automotive parts manufacturers.
The city is also home to several retail stores, including Walmart, Kmart, and several local businesses.
Demographics
As of the 2010 census, the population of Somerset was 11,196. The racial makeup of the city was 90.3% White, 6.2% African American, 0.4% Native American, 0.7% Asian, 0.1% Pacific Islander, 0.7% from other races, and 1.8% from two or more races. Hispanic or Latino of any race were 2.2% of the population.
The median income for a household in the city was $30,945, and the median income for a family was $37,945. The per capita income for the city was $17,845. About 17.2% of families and 20.3% of the population were below the poverty line, including 28.2% of those under age 18 and 14.2% of those age 65 or over.
Common Questions
What is Per Capita Income in Somerset?
Per Capita income in Somerset is $29,740.
What is the Median Family Income in Somerset?
Median Family Income in Somerset is $53,459.
What is the Median Household income in Somerset?
Median Household Income in Somerset is $33,245.
What is Income or Wage Gap in Somerset?
Income or Wage Gap in Somerset is 44.9%.
Women in Somerset earn 55.1 cents for every dollar earned by a man.
What is Family Income Deficit in Somerset?
Family Income Deficit in Somerset is $13,229.
Families that are below poverty line in Somerset earn $13,229 less on average than the poverty threshold level.
What is Inequality or Gini Index in Somerset?
Inequality or Gini Index in Somerset is 0.60.
What is the Total Population of Somerset?
Total Population of Somerset is 11,998.
What is the Total Male Population of Somerset?
Total Male Population of Somerset is 5,921.
What is the Total Female Population of Somerset?
Total Female Population of Somerset is 6,077.
What is the Ratio of Males per 100 Females in Somerset?
There are 97.43 Males per 100 Females in Somerset.
What is the Ratio of Females per 100 Males in Somerset?
There are 102.63 Females per 100 Males in Somerset.
What is the Median Population Age in Somerset?
Median Population Age in Somerset is 38.1 Years.
What is the Average Family Size in Somerset
Average Family Size in Somerset is 3.0 People.
What is the Average Household Size in Somerset
Average Household Size in Somerset is 2.5 People.
How Large is the Labor Force in Somerset?
There are 5,059 People in the Labor Forcein in Somerset.
What is the Percentage of People in the Labor Force in Somerset?
52.5% of People are in the Labor Force in Somerset.
What is the Unemployment Rate in Somerset?
Unemployment Rate in Somerset is 8.7%.