Poplar Hills, KY Map & Demographics
Poplar Hills Map
Poplar Hills Overview
$18,566
PER CAPITA INCOME
$21,567
AVG HOUSEHOLD INCOME
9.6%
WAGE / INCOME GAP [ % ]
90.4¢/ $1
WAGE / INCOME GAP [ $ ]
$14,464
FAMILY INCOME DEFICIT
0.43
INEQUALITY / GINI INDEX
519
TOTAL POPULATION
248
MALE POPULATION
271
FEMALE POPULATION
91.51
MALES / 100 FEMALES
109.27
FEMALES / 100 MALES
36.8
MEDIAN AGE
3.1
AVG FAMILY SIZE
1.6
AVG HOUSEHOLD SIZE
286
LABOR FORCE [ PEOPLE ]
72.4%
PERCENT IN LABOR FORCE
1.7%
UNEMPLOYMENT RATE
Poplar Hills Area Codes
Income in Poplar Hills
Income Overview in Poplar Hills
| Characteristic | Number | Measure |
| Per Capita Income | 519 | $18,566 |
| Median Family Income | 66 | $0 |
| Mean Family Income | 66 | $26,750 |
| Median Household Income | 327 | $21,567 |
| Mean Household Income | 327 | $28,477 |
| Income Deficit | 66 | $14,464 |
| Wage / Income Gap (%) | 519 | 9.62% |
| Wage / Income Gap ($) | 519 | 90.38¢ per $1 |
| Gini / Inequality Index | 519 | 0.43 |
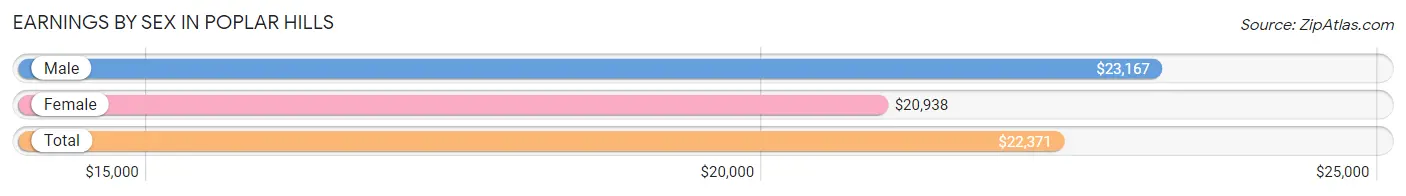
Earnings by Sex in Poplar Hills
Average Earnings in Poplar Hills are $22,371, $23,167 for men and $20,938 for women, a difference of 9.6%.
| Sex | Number | Average Earnings |
| Male | 158 (52.8%) | $23,167 |
| Female | 141 (47.2%) | $20,938 |
| Total | 299 (100.0%) | $22,371 |
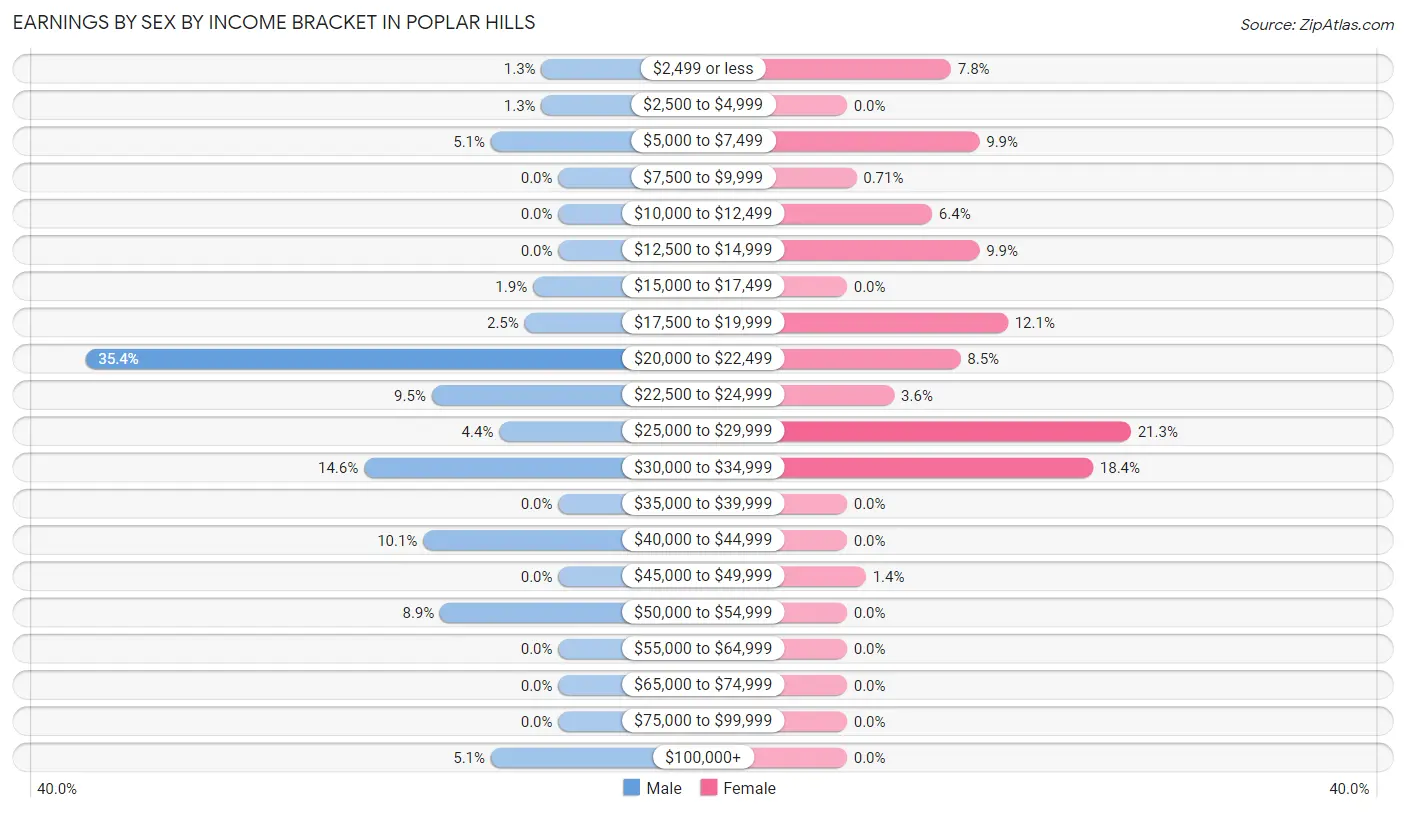
Earnings by Sex by Income Bracket in Poplar Hills
The most common earnings brackets in Poplar Hills are $20,000 to $22,499 for men (56 | 35.4%) and $25,000 to $29,999 for women (30 | 21.3%).
| Income | Male | Female |
| $2,499 or less | 2 (1.3%) | 11 (7.8%) |
| $2,500 to $4,999 | 2 (1.3%) | 0 (0.0%) |
| $5,000 to $7,499 | 8 (5.1%) | 14 (9.9%) |
| $7,500 to $9,999 | 0 (0.0%) | 1 (0.7%) |
| $10,000 to $12,499 | 0 (0.0%) | 9 (6.4%) |
| $12,500 to $14,999 | 0 (0.0%) | 14 (9.9%) |
| $15,000 to $17,499 | 3 (1.9%) | 0 (0.0%) |
| $17,500 to $19,999 | 4 (2.5%) | 17 (12.1%) |
| $20,000 to $22,499 | 56 (35.4%) | 12 (8.5%) |
| $22,500 to $24,999 | 15 (9.5%) | 5 (3.5%) |
| $25,000 to $29,999 | 7 (4.4%) | 30 (21.3%) |
| $30,000 to $34,999 | 23 (14.6%) | 26 (18.4%) |
| $35,000 to $39,999 | 0 (0.0%) | 0 (0.0%) |
| $40,000 to $44,999 | 16 (10.1%) | 0 (0.0%) |
| $45,000 to $49,999 | 0 (0.0%) | 2 (1.4%) |
| $50,000 to $54,999 | 14 (8.9%) | 0 (0.0%) |
| $55,000 to $64,999 | 0 (0.0%) | 0 (0.0%) |
| $65,000 to $74,999 | 0 (0.0%) | 0 (0.0%) |
| $75,000 to $99,999 | 0 (0.0%) | 0 (0.0%) |
| $100,000+ | 8 (5.1%) | 0 (0.0%) |
| Total | 158 (100.0%) | 141 (100.0%) |
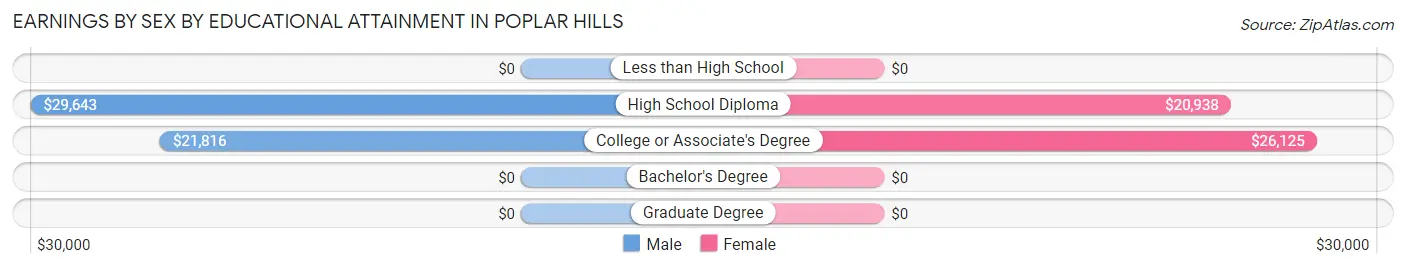
Earnings by Sex by Educational Attainment in Poplar Hills
Average earnings in Poplar Hills are $23,167 for men and $22,188 for women, a difference of 4.2%. Men with an educational attainment of high school diploma enjoy the highest average annual earnings of $29,643, while those with college or associate's degree education earn the least with $21,816. Women with an educational attainment of college or associate's degree earn the most with the average annual earnings of $26,125, while those with high school diploma education have the smallest earnings of $20,938.
| Educational Attainment | Male Income | Female Income |
| Less than High School | - | - |
| High School Diploma | $29,643 | $20,938 |
| College or Associate's Degree | $21,816 | $26,125 |
| Bachelor's Degree | - | - |
| Graduate Degree | - | - |
| Total | $23,167 | $22,188 |
Family Income in Poplar Hills
Family Income Brackets in Poplar Hills
According to the Poplar Hills family income data, there are 32 families falling into the less than $10,000 income range, which is the most common income bracket and makes up 48.5% of all families.
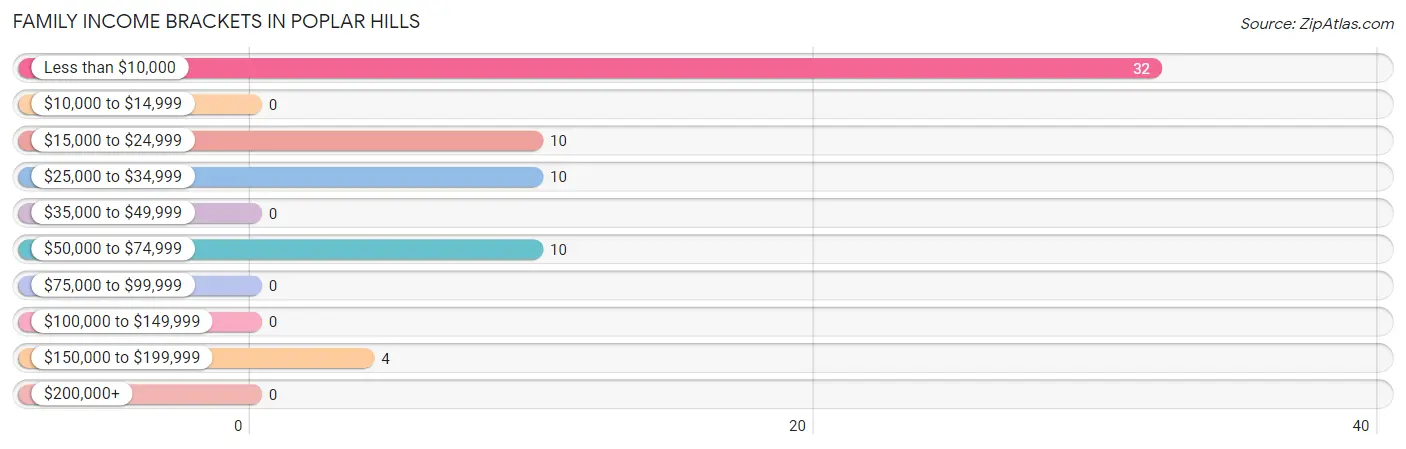
| Income Bracket | # Families | % Families |
| Less than $10,000 | 32 | 48.5% |
| $10,000 to $14,999 | 0 | 0.0% |
| $15,000 to $24,999 | 10 | 15.2% |
| $25,000 to $34,999 | 10 | 15.2% |
| $35,000 to $49,999 | 0 | 0.0% |
| $50,000 to $74,999 | 10 | 15.2% |
| $75,000 to $99,999 | 0 | 0.0% |
| $100,000 to $149,999 | 0 | 0.0% |
| $150,000 to $199,999 | 4 | 6.1% |
| $200,000+ | 0 | 0.0% |
Family Income by Famaliy Size in Poplar Hills
| Income Bracket | # Families | Median Income |
| 2-Person Families | 49 (74.2%) | $0 |
| 3-Person Families | 0 (0.0%) | $0 |
| 4-Person Families | 17 (25.8%) | $0 |
| 5-Person Families | 0 (0.0%) | $0 |
| 6-Person Families | 0 (0.0%) | $0 |
| 7+ Person Families | 0 (0.0%) | $0 |
| Total | 66 (100.0%) | $0 |
Family Income by Number of Earners in Poplar Hills
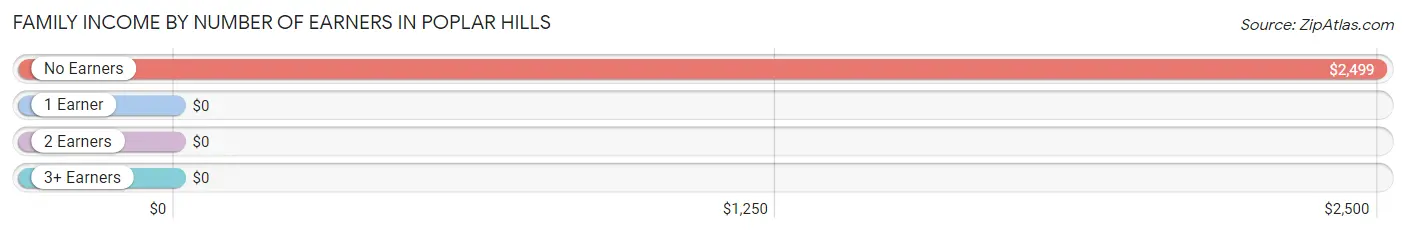
| Number of Earners | # Families | Median Income |
| No Earners | 22 (33.3%) | $2,499 |
| 1 Earner | 31 (47.0%) | $0 |
| 2 Earners | 13 (19.7%) | $0 |
| 3+ Earners | 0 (0.0%) | $0 |
| Total | 66 (100.0%) | $0 |
Household Income in Poplar Hills
Household Income Brackets in Poplar Hills
With 92 households falling in the category, the $15,000 to $24,999 income range is the most frequent in Poplar Hills, accounting for 28.1% of all households.
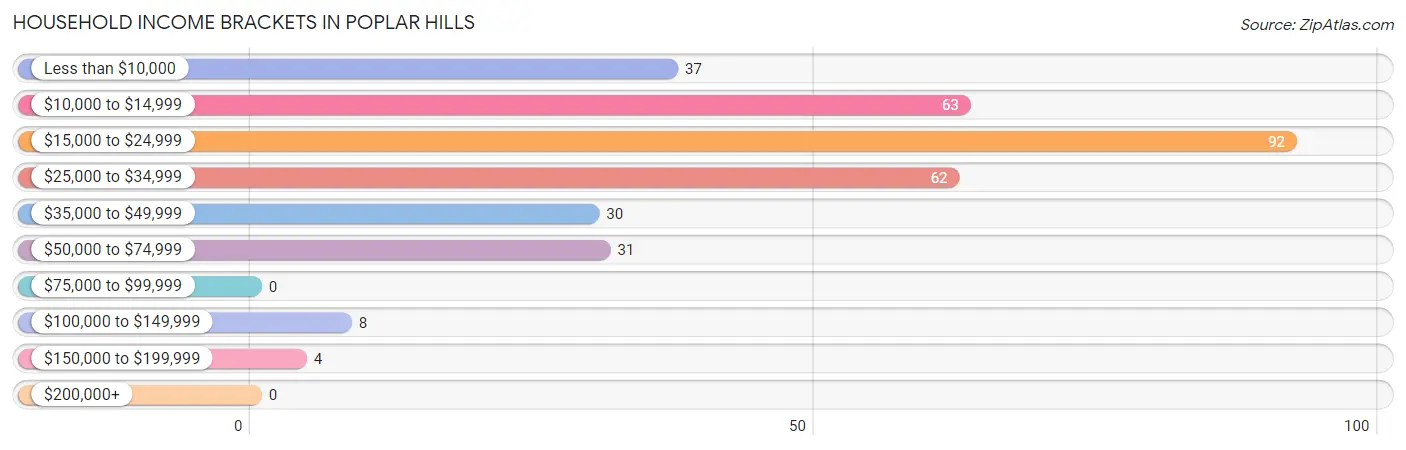
| Income Bracket | # Households | % Households |
| Less than $10,000 | 37 | 11.3% |
| $10,000 to $14,999 | 63 | 19.3% |
| $15,000 to $24,999 | 92 | 28.1% |
| $25,000 to $34,999 | 62 | 19.0% |
| $35,000 to $49,999 | 30 | 9.2% |
| $50,000 to $74,999 | 31 | 9.5% |
| $75,000 to $99,999 | 0 | 0.0% |
| $100,000 to $149,999 | 8 | 2.4% |
| $150,000 to $199,999 | 4 | 1.2% |
| $200,000+ | 0 | 0.0% |
Household Income by Householder Age in Poplar Hills
The median household income in Poplar Hills is $21,567, with the highest median household income of $27,125 found in the 25 to 44 years age bracket for the primary householder. A total of 131 households (40.1%) fall into this category. Meanwhile, the 15 to 24 years age bracket for the primary householder has the lowest median household income of $0, with 12 households (3.7%) in this group.
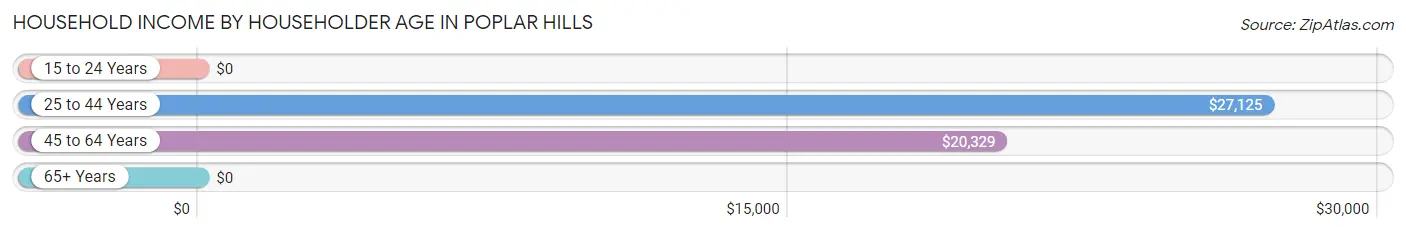
| Income Bracket | # Households | Median Income |
| 15 to 24 Years | 12 (3.7%) | $0 |
| 25 to 44 Years | 131 (40.1%) | $27,125 |
| 45 to 64 Years | 171 (52.3%) | $20,329 |
| 65+ Years | 13 (4.0%) | $0 |
| Total | 327 (100.0%) | $21,567 |
Poverty in Poplar Hills
Income Below Poverty by Sex and Age in Poplar Hills
With 29.0% poverty level for males and 52.0% for females among the residents of Poplar Hills, 12 to 14 year old males and 18 to 24 year old females are the most vulnerable to poverty, with 9 males (100.0%) and 12 females (100.0%) in their respective age groups living below the poverty level.
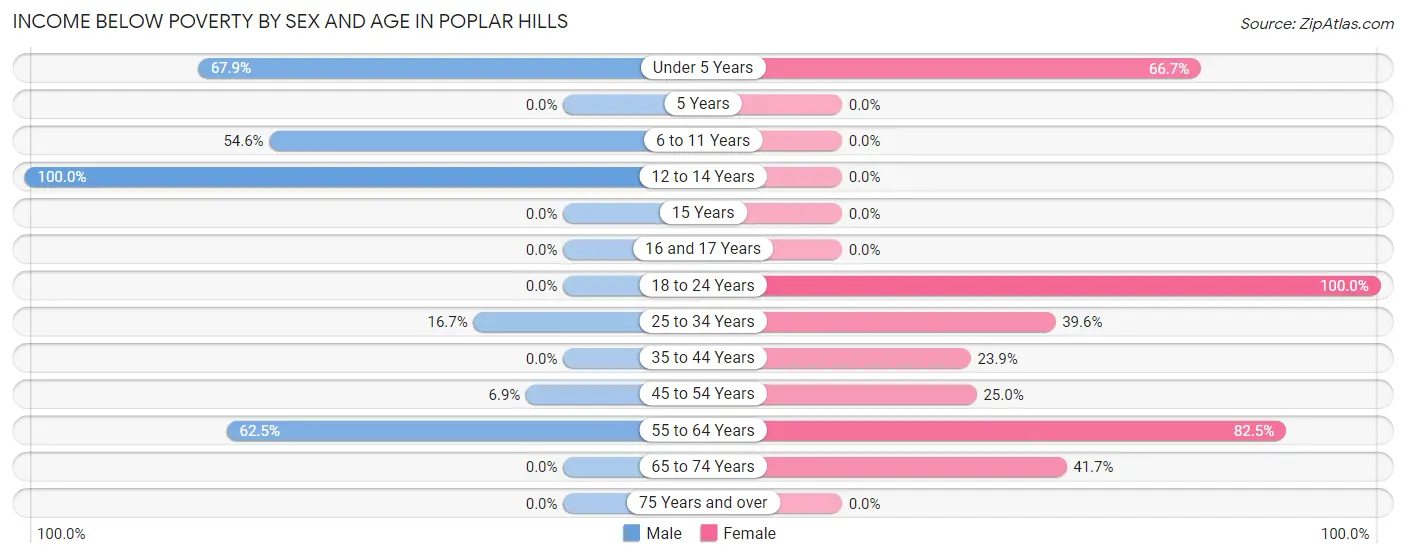
| Age Bracket | Male | Female |
| Under 5 Years | 19 (67.9%) | 36 (66.7%) |
| 5 Years | 0 (0.0%) | 0 (0.0%) |
| 6 to 11 Years | 18 (54.5%) | 0 (0.0%) |
| 12 to 14 Years | 9 (100.0%) | 0 (0.0%) |
| 15 Years | 0 (0.0%) | 0 (0.0%) |
| 16 and 17 Years | 0 (0.0%) | 0 (0.0%) |
| 18 to 24 Years | 0 (0.0%) | 12 (100.0%) |
| 25 to 34 Years | 10 (16.7%) | 21 (39.6%) |
| 35 to 44 Years | 0 (0.0%) | 11 (23.9%) |
| 45 to 54 Years | 6 (6.9%) | 9 (25.0%) |
| 55 to 64 Years | 10 (62.5%) | 47 (82.5%) |
| 65 to 74 Years | 0 (0.0%) | 5 (41.7%) |
| 75 Years and over | 0 (0.0%) | 0 (0.0%) |
| Total | 72 (29.0%) | 141 (52.0%) |
Income Above Poverty by Sex and Age in Poplar Hills
According to the poverty statistics in Poplar Hills, males aged 35 to 44 years and females aged 75 years and over are the age groups that are most secure financially, with 100.0% of males and 100.0% of females in these age groups living above the poverty line.
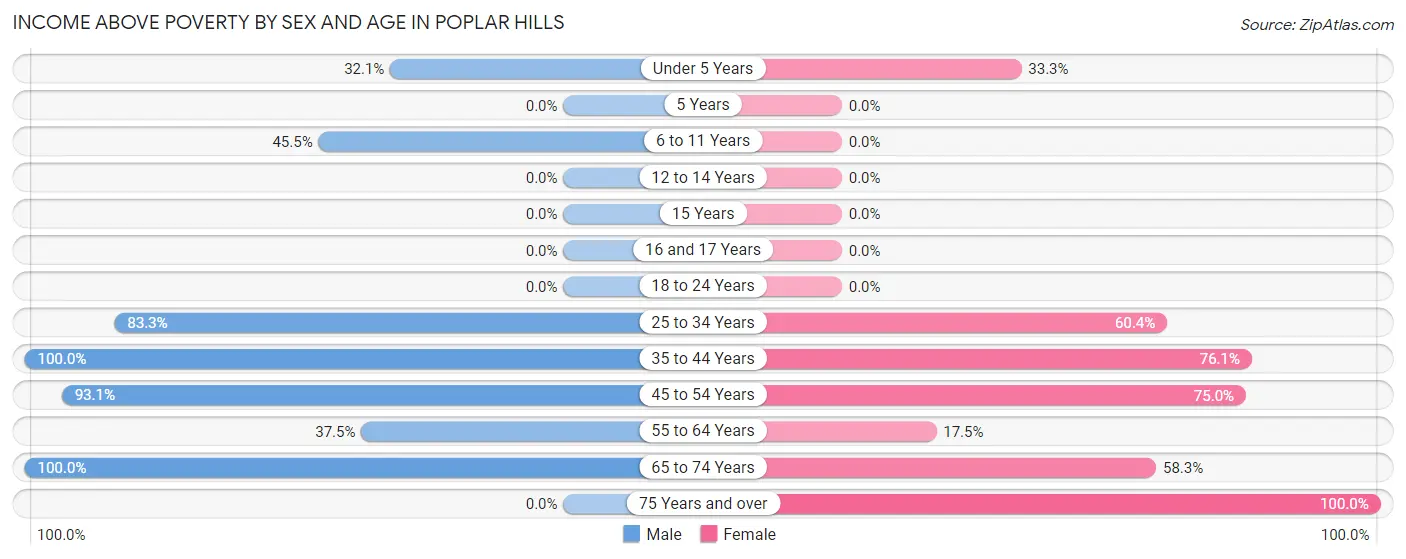
| Age Bracket | Male | Female |
| Under 5 Years | 9 (32.1%) | 18 (33.3%) |
| 5 Years | 0 (0.0%) | 0 (0.0%) |
| 6 to 11 Years | 15 (45.5%) | 0 (0.0%) |
| 12 to 14 Years | 0 (0.0%) | 0 (0.0%) |
| 15 Years | 0 (0.0%) | 0 (0.0%) |
| 16 and 17 Years | 0 (0.0%) | 0 (0.0%) |
| 18 to 24 Years | 0 (0.0%) | 0 (0.0%) |
| 25 to 34 Years | 50 (83.3%) | 32 (60.4%) |
| 35 to 44 Years | 14 (100.0%) | 35 (76.1%) |
| 45 to 54 Years | 81 (93.1%) | 27 (75.0%) |
| 55 to 64 Years | 6 (37.5%) | 10 (17.5%) |
| 65 to 74 Years | 1 (100.0%) | 7 (58.3%) |
| 75 Years and over | 0 (0.0%) | 1 (100.0%) |
| Total | 176 (71.0%) | 130 (48.0%) |
Income Below Poverty Among Married-Couple Families in Poplar Hills
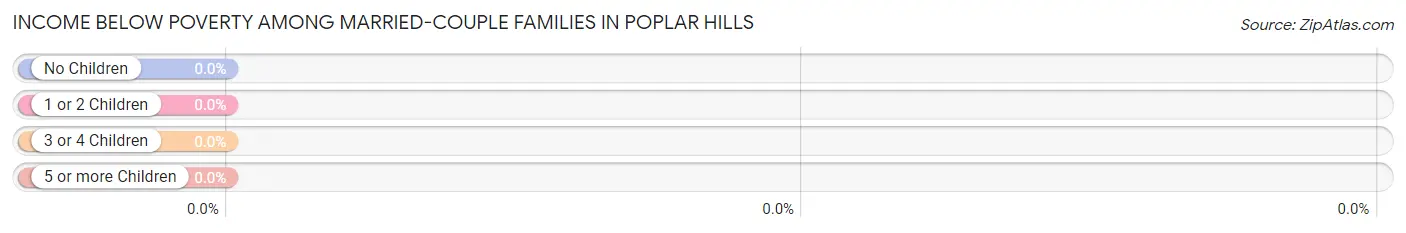
| Children | Above Poverty | Below Poverty |
| No Children | 0 (0.0%) | 0 (0.0%) |
| 1 or 2 Children | 10 (100.0%) | 0 (0.0%) |
| 3 or 4 Children | 0 (0.0%) | 0 (0.0%) |
| 5 or more Children | 0 (0.0%) | 0 (0.0%) |
| Total | 10 (100.0%) | 0 (0.0%) |
Income Below Poverty Among Single-Parent Households in Poplar Hills
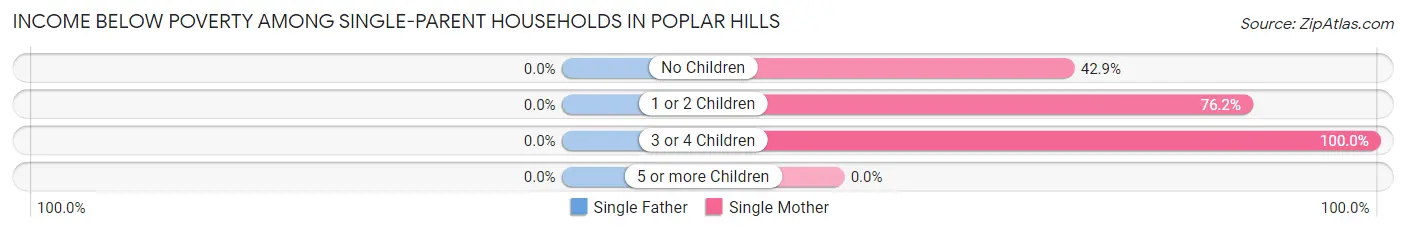
| Children | Single Father | Single Mother |
| No Children | 0 (0.0%) | 3 (42.9%) |
| 1 or 2 Children | 0 (0.0%) | 32 (76.2%) |
| 3 or 4 Children | 0 (0.0%) | 7 (100.0%) |
| 5 or more Children | 0 (0.0%) | 0 (0.0%) |
| Total | 0 (0.0%) | 42 (75.0%) |
Income Below Poverty Among Married-Couple vs Single-Parent Households in Poplar Hills
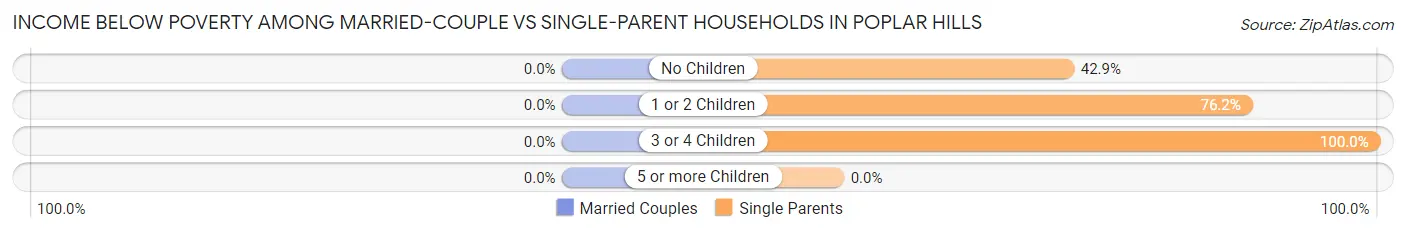
| Children | Married-Couple Families | Single-Parent Households |
| No Children | 0 (0.0%) | 3 (42.9%) |
| 1 or 2 Children | 0 (0.0%) | 32 (76.2%) |
| 3 or 4 Children | 0 (0.0%) | 7 (100.0%) |
| 5 or more Children | 0 (0.0%) | 0 (0.0%) |
| Total | 0 (0.0%) | 42 (75.0%) |
Race in Poplar Hills
The most populous races in Poplar Hills are Hispanic or Latino (386 | 74.4%), White / Caucasian (208 | 40.1%), and Two or more Races (144 | 27.8%).
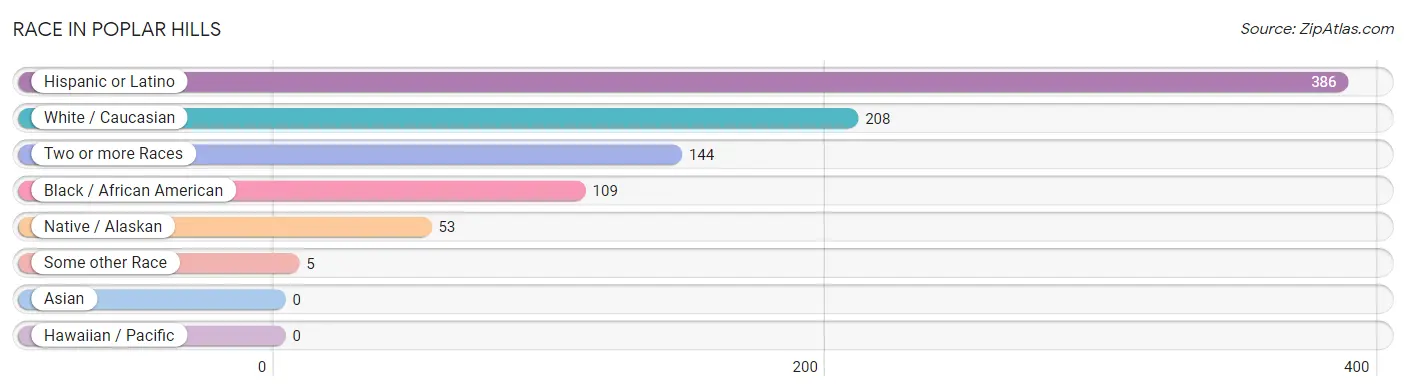
| Race | # Population | % Population |
| Asian | 0 | 0.0% |
| Black / African American | 109 | 21.0% |
| Hawaiian / Pacific | 0 | 0.0% |
| Hispanic or Latino | 386 | 74.4% |
| Native / Alaskan | 53 | 10.2% |
| White / Caucasian | 208 | 40.1% |
| Two or more Races | 144 | 27.8% |
| Some other Race | 5 | 1.0% |
| Total | 519 | 100.0% |
Ancestry in Poplar Hills
The most populous ancestries reported in Poplar Hills are Cuban (257 | 49.5%), Mexican (123 | 23.7%), Mexican American Indian (53 | 10.2%), American (42 | 8.1%), and African (16 | 3.1%), together accounting for 94.6% of all Poplar Hills residents.
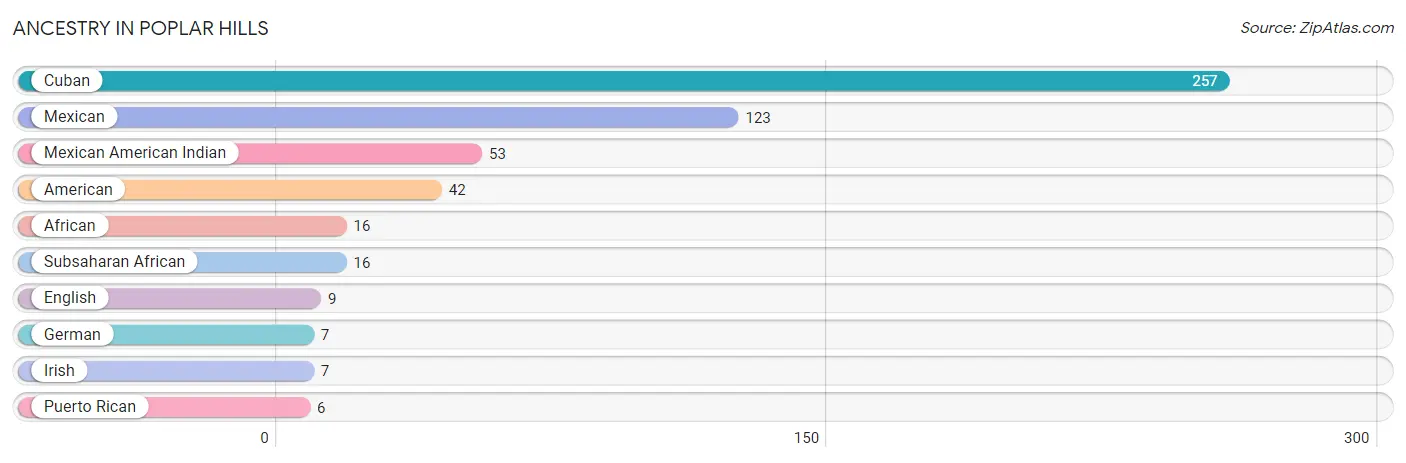
| Ancestry | # Population | % Population |
| African | 16 | 3.1% |
| American | 42 | 8.1% |
| Cuban | 257 | 49.5% |
| English | 9 | 1.7% |
| German | 7 | 1.3% |
| Irish | 7 | 1.3% |
| Mexican | 123 | 23.7% |
| Mexican American Indian | 53 | 10.2% |
| Puerto Rican | 6 | 1.2% |
| Subsaharan African | 16 | 3.1% | View All 10 Rows |
Immigrants in Poplar Hills
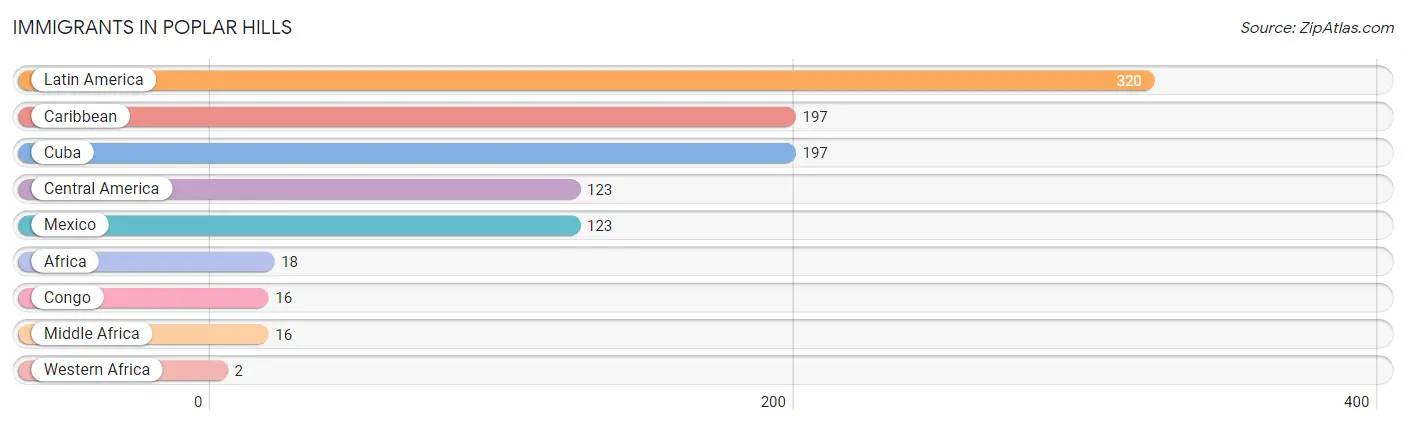
The most numerous immigrant groups reported in Poplar Hills came from Latin America (320 | 61.7%), Caribbean (197 | 38.0%), Cuba (197 | 38.0%), Central America (123 | 23.7%), and Mexico (123 | 23.7%), together accounting for 185.0% of all Poplar Hills residents.
| Immigration Origin | # Population | % Population |
| Africa | 18 | 3.5% |
| Caribbean | 197 | 38.0% |
| Central America | 123 | 23.7% |
| Congo | 16 | 3.1% |
| Cuba | 197 | 38.0% |
| Latin America | 320 | 61.7% |
| Mexico | 123 | 23.7% |
| Middle Africa | 16 | 3.1% |
| Western Africa | 2 | 0.4% | View All 9 Rows |
Sex and Age in Poplar Hills
Sex and Age in Poplar Hills
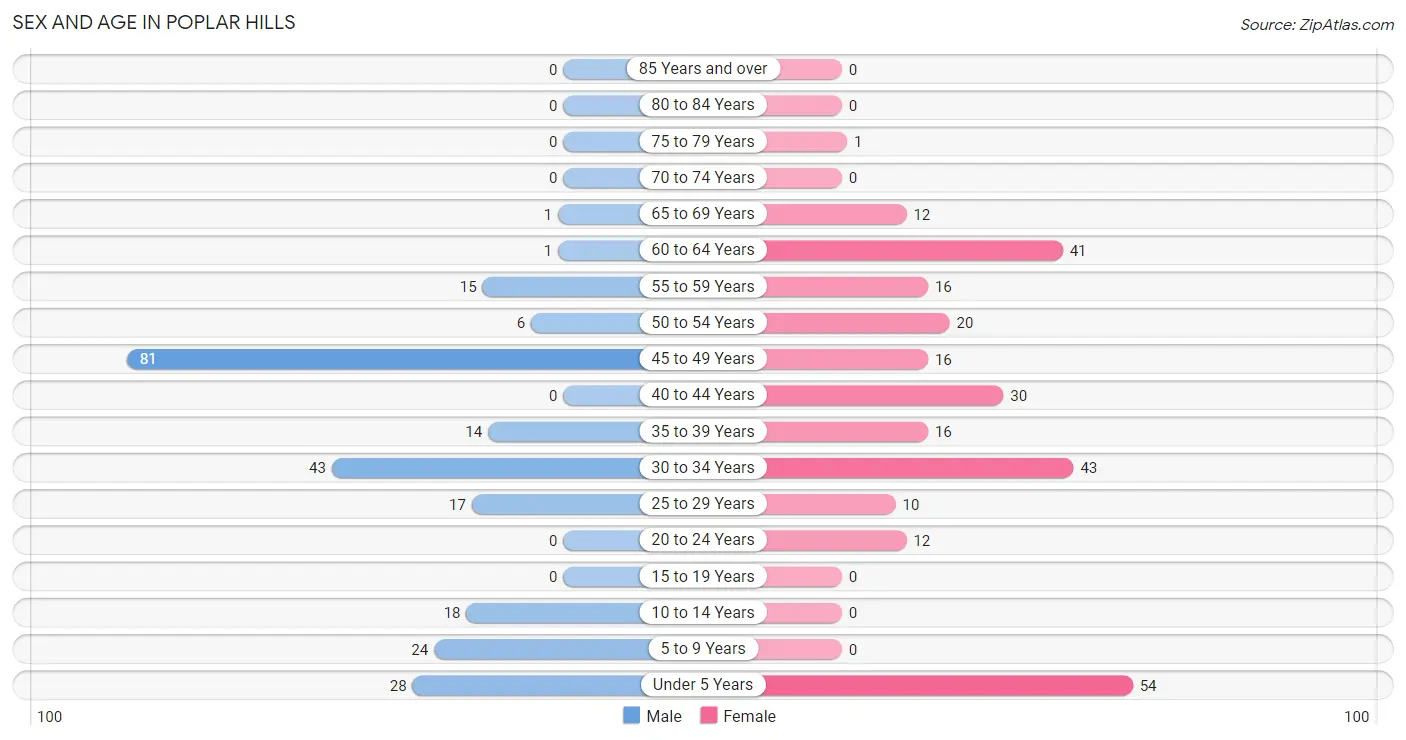
The most populous age groups in Poplar Hills are 45 to 49 Years (81 | 32.7%) for men and Under 5 Years (54 | 19.9%) for women.
| Age Bracket | Male | Female |
| Under 5 Years | 28 (11.3%) | 54 (19.9%) |
| 5 to 9 Years | 24 (9.7%) | 0 (0.0%) |
| 10 to 14 Years | 18 (7.3%) | 0 (0.0%) |
| 15 to 19 Years | 0 (0.0%) | 0 (0.0%) |
| 20 to 24 Years | 0 (0.0%) | 12 (4.4%) |
| 25 to 29 Years | 17 (6.9%) | 10 (3.7%) |
| 30 to 34 Years | 43 (17.3%) | 43 (15.9%) |
| 35 to 39 Years | 14 (5.7%) | 16 (5.9%) |
| 40 to 44 Years | 0 (0.0%) | 30 (11.1%) |
| 45 to 49 Years | 81 (32.7%) | 16 (5.9%) |
| 50 to 54 Years | 6 (2.4%) | 20 (7.4%) |
| 55 to 59 Years | 15 (6.0%) | 16 (5.9%) |
| 60 to 64 Years | 1 (0.4%) | 41 (15.1%) |
| 65 to 69 Years | 1 (0.4%) | 12 (4.4%) |
| 70 to 74 Years | 0 (0.0%) | 0 (0.0%) |
| 75 to 79 Years | 0 (0.0%) | 1 (0.4%) |
| 80 to 84 Years | 0 (0.0%) | 0 (0.0%) |
| 85 Years and over | 0 (0.0%) | 0 (0.0%) |
| Total | 248 (100.0%) | 271 (100.0%) |
Families and Households in Poplar Hills
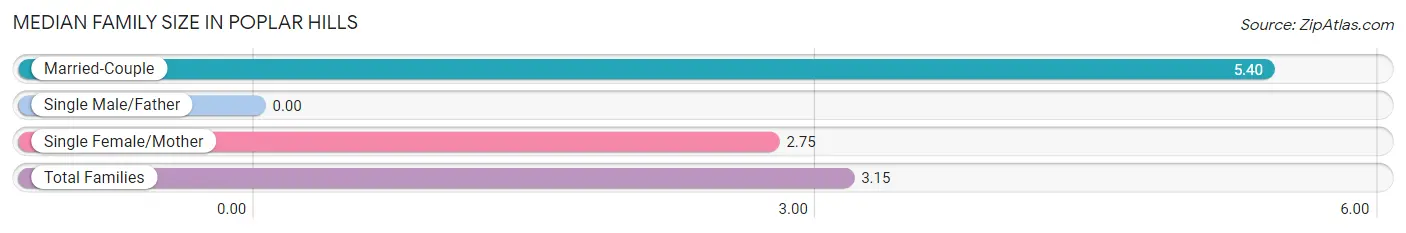
Median Family Size in Poplar Hills
| Family Type | # Families | Family Size |
| Married-Couple | 10 (15.1%) | 5.40 |
| Single Male/Father | 0 (0.0%) | - |
| Single Female/Mother | 56 (84.9%) | 2.75 |
| Total Families | 66 (100.0%) | 3.15 |
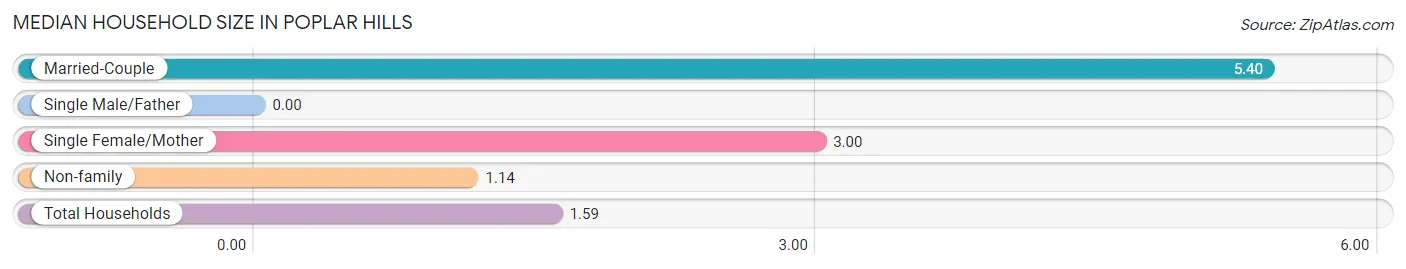
Median Household Size in Poplar Hills
| Household Type | # Households | Household Size |
| Married-Couple | 10 (3.1%) | 5.40 |
| Single Male/Father | 0 (0.0%) | - |
| Single Female/Mother | 56 (17.1%) | 3.00 |
| Non-family | 261 (79.8%) | 1.14 |
| Total Households | 327 (100.0%) | 1.59 |
Household Size by Marriage Status in Poplar Hills
Out of a total of 327 households in Poplar Hills, 66 (20.2%) are family households, while 261 (79.8%) are nonfamily households. The most numerous type of family households are 2-person households, comprising 38, and the most common type of nonfamily households are 1-person households, comprising 229.
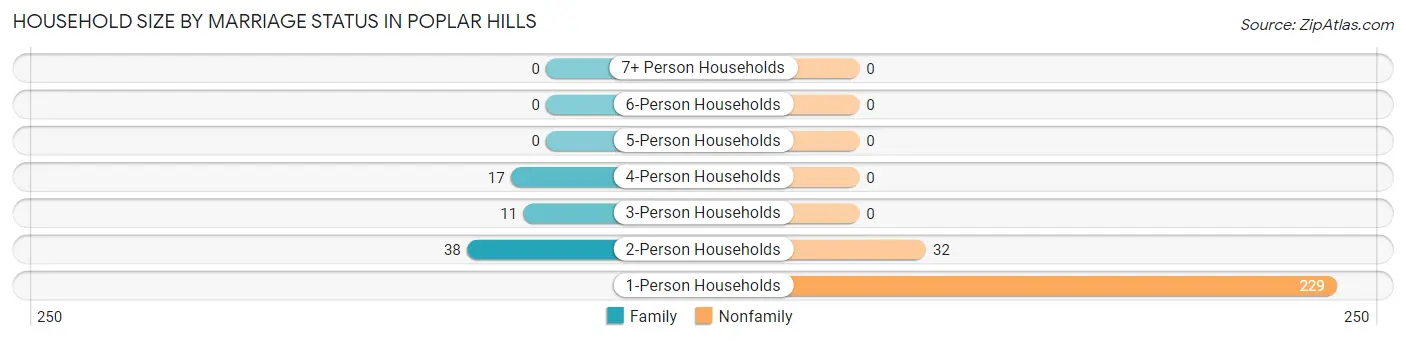
| Household Size | Family Households | Nonfamily Households |
| 1-Person Households | - | 229 (70.0%) |
| 2-Person Households | 38 (11.6%) | 32 (9.8%) |
| 3-Person Households | 11 (3.4%) | 0 (0.0%) |
| 4-Person Households | 17 (5.2%) | 0 (0.0%) |
| 5-Person Households | 0 (0.0%) | 0 (0.0%) |
| 6-Person Households | 0 (0.0%) | 0 (0.0%) |
| 7+ Person Households | 0 (0.0%) | 0 (0.0%) |
| Total | 66 (20.2%) | 261 (79.8%) |
Female Fertility in Poplar Hills
Fertility by Age in Poplar Hills
Average fertility rate in Poplar Hills is 77.0 births per 1,000 women. Women in the age bracket of 20 to 34 years have the highest fertility rate with 154.0 births per 1,000 women. Women in the age bracket of 20 to 34 years acount for 100.0% of all women with births.
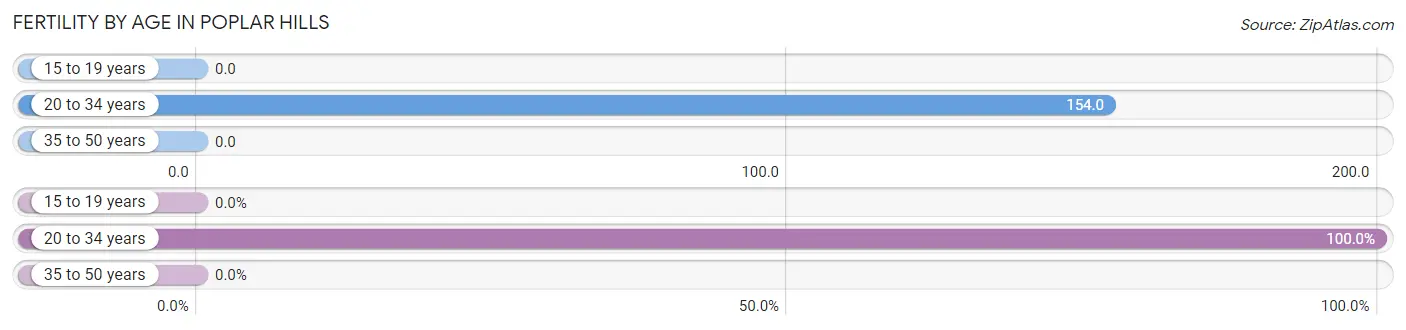
| Age Bracket | Women with Births | Births / 1,000 Women |
| 15 to 19 years | 0 (0.0%) | 0.0 |
| 20 to 34 years | 10 (100.0%) | 154.0 |
| 35 to 50 years | 0 (0.0%) | 0.0 |
| Total | 10 (100.0%) | 77.0 |
Fertility by Age by Marriage Status in Poplar Hills
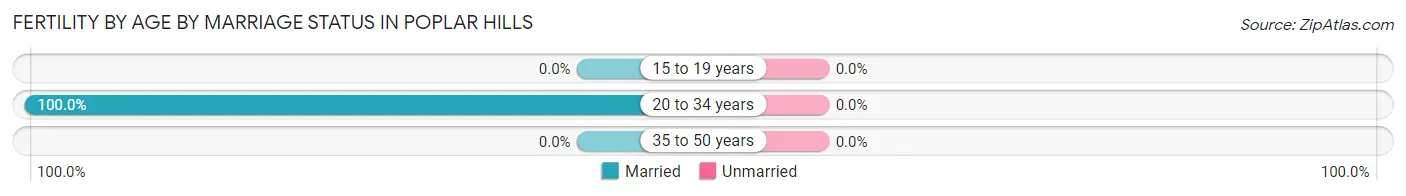
| Age Bracket | Married | Unmarried |
| 15 to 19 years | 0 (0.0%) | 0 (0.0%) |
| 20 to 34 years | 10 (100.0%) | 0 (0.0%) |
| 35 to 50 years | 0 (0.0%) | 0 (0.0%) |
| Total | 10 (100.0%) | 0 (0.0%) |
Fertility by Education in Poplar Hills
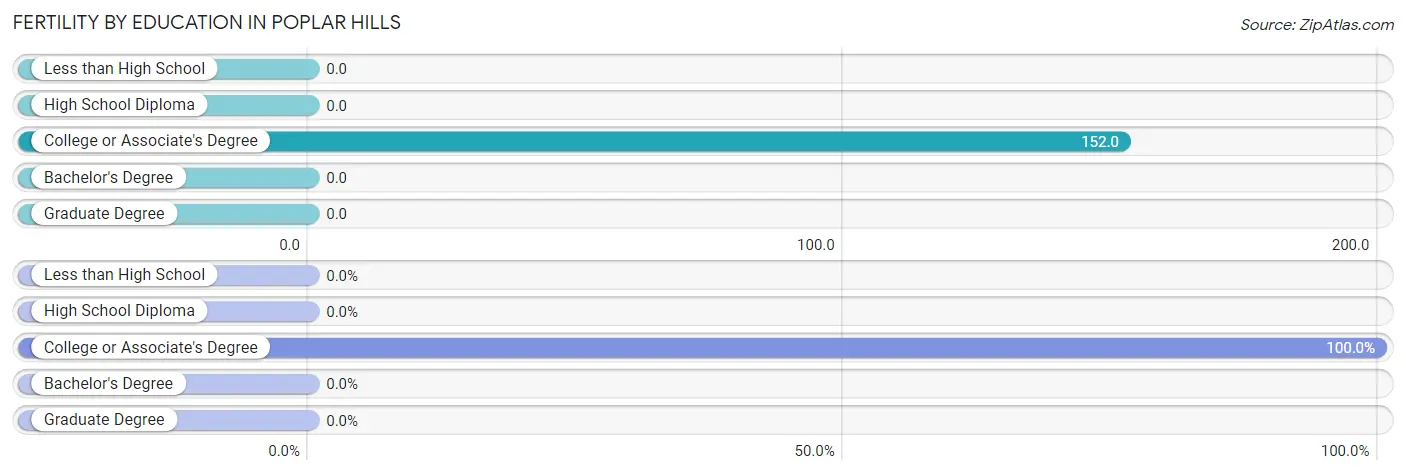
| Educational Attainment | Women with Births | Births / 1,000 Women |
| Less than High School | 0 (0.0%) | 0.0 |
| High School Diploma | 0 (0.0%) | 0.0 |
| College or Associate's Degree | 10 (100.0%) | 152.0 |
| Bachelor's Degree | 0 (0.0%) | 0.0 |
| Graduate Degree | 0 (0.0%) | 0.0 |
| Total | 10 (100.0%) | 77.0 |
Fertility by Education by Marriage Status in Poplar Hills
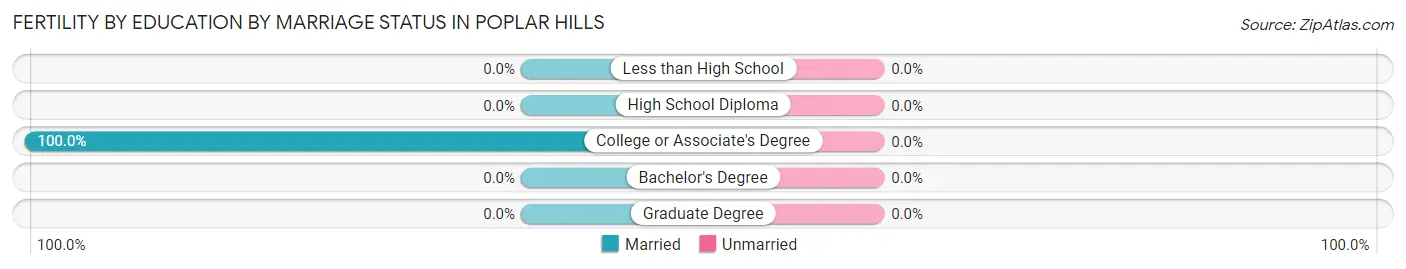
| Educational Attainment | Married | Unmarried |
| Less than High School | 0 (0.0%) | 0 (0.0%) |
| High School Diploma | 0 (0.0%) | 0 (0.0%) |
| College or Associate's Degree | 10 (100.0%) | 0 (0.0%) |
| Bachelor's Degree | 0 (0.0%) | 0 (0.0%) |
| Graduate Degree | 0 (0.0%) | 0 (0.0%) |
| Total | 10 (100.0%) | 0 (0.0%) |
Employment Characteristics in Poplar Hills
Employment by Class of Employer in Poplar Hills
Among the 266 employed individuals in Poplar Hills, private company employees (189 | 71.1%), local government employees (53 | 19.9%), and self-employed (not incorporated) (14 | 5.3%) make up the most common classes of employment.
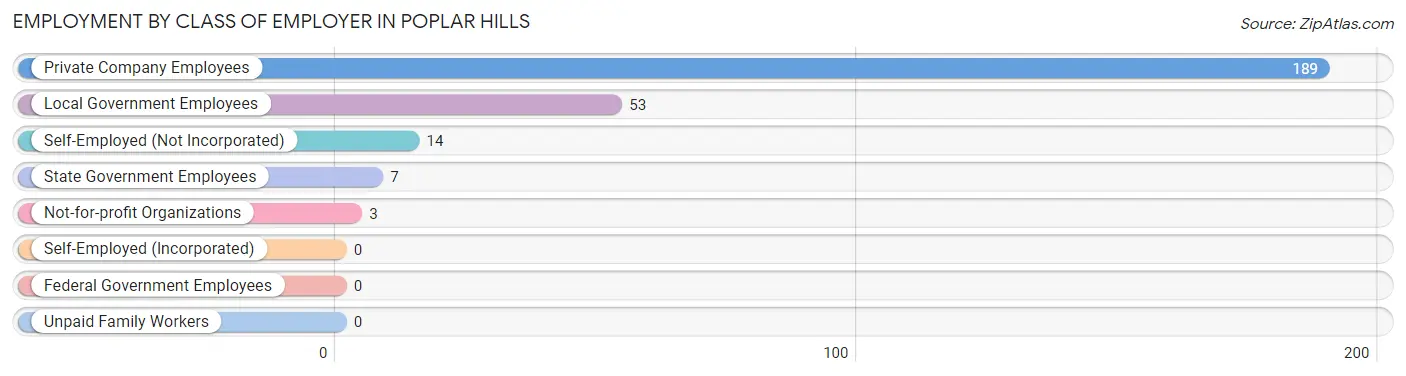
| Employer Class | # Employees | % Employees |
| Private Company Employees | 189 | 71.1% |
| Self-Employed (Incorporated) | 0 | 0.0% |
| Self-Employed (Not Incorporated) | 14 | 5.3% |
| Not-for-profit Organizations | 3 | 1.1% |
| Local Government Employees | 53 | 19.9% |
| State Government Employees | 7 | 2.6% |
| Federal Government Employees | 0 | 0.0% |
| Unpaid Family Workers | 0 | 0.0% |
| Total | 266 | 100.0% |
Employment Status by Age in Poplar Hills
According to the labor force statistics for Poplar Hills, out of the total population over 16 years of age (395), 72.4% or 286 individuals are in the labor force, with 1.7% or 5 of them unemployed. The age group with the highest labor force participation rate is 20 to 24 years, with 100.0% or 12 individuals in the labor force. Within the labor force, the 55 to 59 years age range has the highest percentage of unemployed individuals, with 18.2% or 2 of them being unemployed.
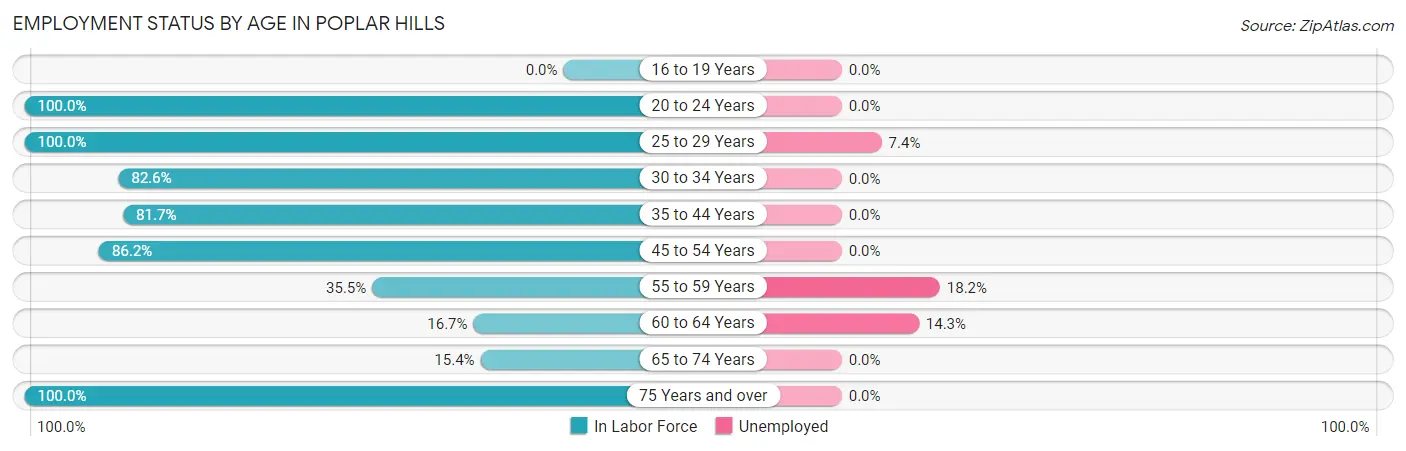
| Age Bracket | In Labor Force | Unemployed |
| 16 to 19 Years | 0 (0.0%) | 0 (0.0%) |
| 20 to 24 Years | 12 (100.0%) | 0 (0.0%) |
| 25 to 29 Years | 27 (100.0%) | 2 (7.4%) |
| 30 to 34 Years | 71 (82.6%) | 0 (0.0%) |
| 35 to 44 Years | 49 (81.7%) | 0 (0.0%) |
| 45 to 54 Years | 106 (86.2%) | 0 (0.0%) |
| 55 to 59 Years | 11 (35.5%) | 2 (18.2%) |
| 60 to 64 Years | 7 (16.7%) | 1 (14.3%) |
| 65 to 74 Years | 2 (15.4%) | 0 (0.0%) |
| 75 Years and over | 1 (100.0%) | 0 (0.0%) |
| Total | 286 (72.4%) | 5 (1.7%) |
Employment Status by Educational Attainment in Poplar Hills
According to labor force statistics for Poplar Hills, 73.4% of individuals (271) out of the total population between 25 and 64 years of age (369) are in the labor force, with 1.8% or 5 of them being unemployed. The group with the highest labor force participation rate are those with the educational attainment of college / associate degree, with 92.5% or 136 individuals in the labor force. Within the labor force, individuals with less than high school education have the highest percentage of unemployment, with 5.6% or 2 of them being unemployed.
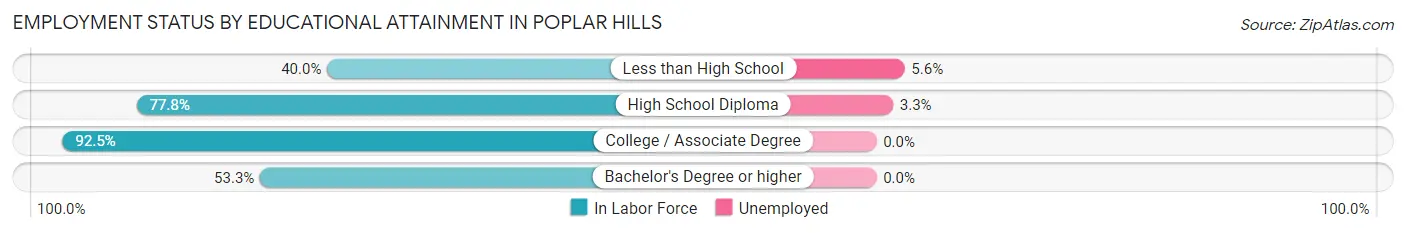
| Educational Attainment | In Labor Force | Unemployed |
| Less than High School | 36 (40.0%) | 5 (5.6%) |
| High School Diploma | 91 (77.8%) | 4 (3.3%) |
| College / Associate Degree | 136 (92.5%) | 0 (0.0%) |
| Bachelor's Degree or higher | 8 (53.3%) | 0 (0.0%) |
| Total | 271 (73.4%) | 7 (1.8%) |
Employment Occupations by Sex in Poplar Hills
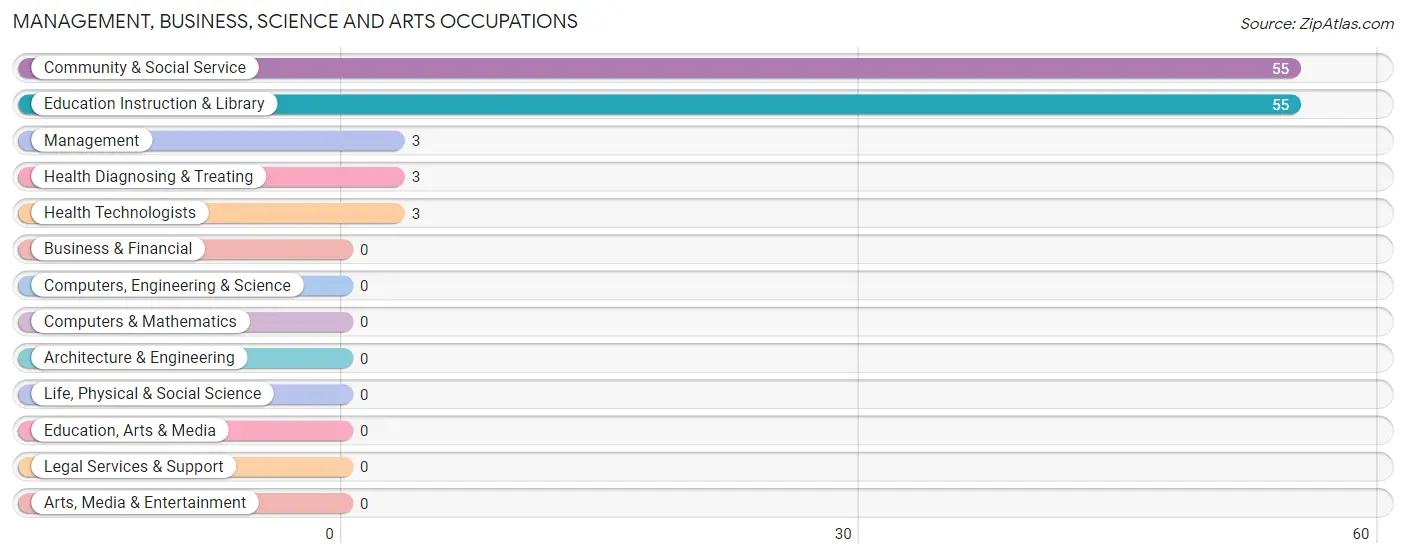
Management, Business, Science and Arts Occupations
The most common Management, Business, Science and Arts occupations in Poplar Hills are Community & Social Service (55 | 19.6%), Education Instruction & Library (55 | 19.6%), Management (3 | 1.1%), Health Diagnosing & Treating (3 | 1.1%), and Health Technologists (3 | 1.1%).
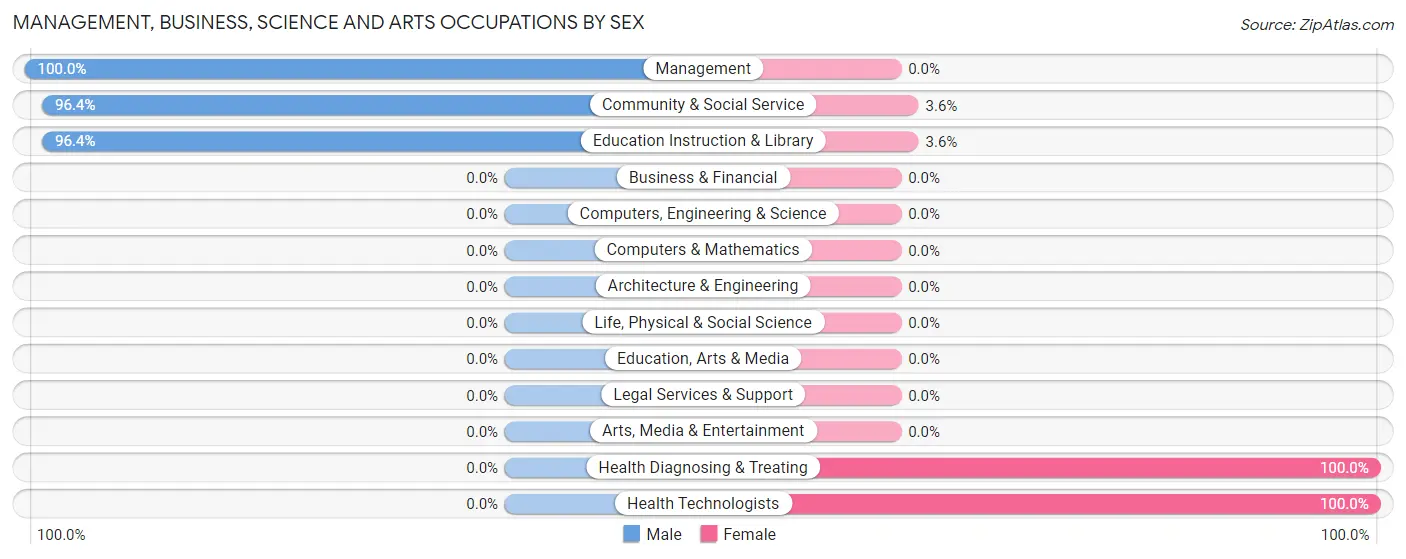
Management, Business, Science and Arts Occupations by Sex
Within the Management, Business, Science and Arts occupations in Poplar Hills, the most male-oriented occupations are Management (100.0%), Community & Social Service (96.4%), and Education Instruction & Library (96.4%), while the most female-oriented occupations are Health Diagnosing & Treating (100.0%), Health Technologists (100.0%), and Community & Social Service (3.6%).
| Occupation | Male | Female |
| Management | 3 (100.0%) | 0 (0.0%) |
| Business & Financial | 0 (0.0%) | 0 (0.0%) |
| Computers, Engineering & Science | 0 (0.0%) | 0 (0.0%) |
| Computers & Mathematics | 0 (0.0%) | 0 (0.0%) |
| Architecture & Engineering | 0 (0.0%) | 0 (0.0%) |
| Life, Physical & Social Science | 0 (0.0%) | 0 (0.0%) |
| Community & Social Service | 53 (96.4%) | 2 (3.6%) |
| Education, Arts & Media | 0 (0.0%) | 0 (0.0%) |
| Legal Services & Support | 0 (0.0%) | 0 (0.0%) |
| Education Instruction & Library | 53 (96.4%) | 2 (3.6%) |
| Arts, Media & Entertainment | 0 (0.0%) | 0 (0.0%) |
| Health Diagnosing & Treating | 0 (0.0%) | 3 (100.0%) |
| Health Technologists | 0 (0.0%) | 3 (100.0%) |
| Total (Category) | 56 (91.8%) | 5 (8.2%) |
| Total (Overall) | 146 (52.0%) | 135 (48.0%) |
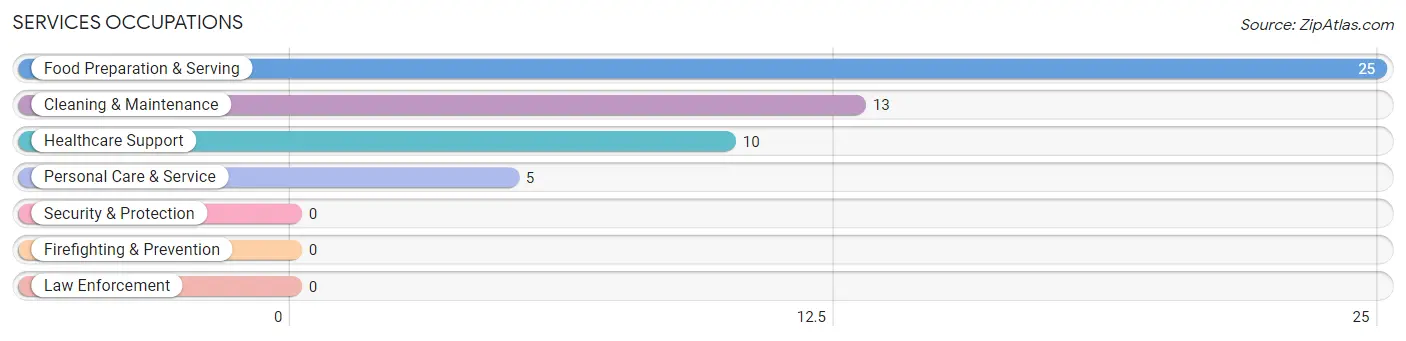
Services Occupations
The most common Services occupations in Poplar Hills are Food Preparation & Serving (25 | 8.9%), Cleaning & Maintenance (13 | 4.6%), Healthcare Support (10 | 3.6%), and Personal Care & Service (5 | 1.8%).
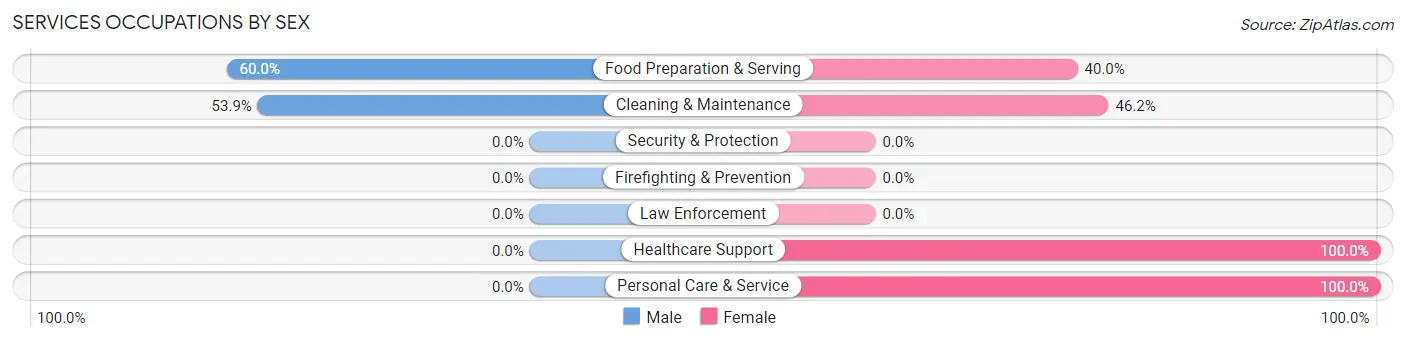
Services Occupations by Sex
Within the Services occupations in Poplar Hills, the most male-oriented occupations are Food Preparation & Serving (60.0%), and Cleaning & Maintenance (53.8%), while the most female-oriented occupations are Healthcare Support (100.0%), Personal Care & Service (100.0%), and Cleaning & Maintenance (46.2%).
| Occupation | Male | Female |
| Healthcare Support | 0 (0.0%) | 10 (100.0%) |
| Security & Protection | 0 (0.0%) | 0 (0.0%) |
| Firefighting & Prevention | 0 (0.0%) | 0 (0.0%) |
| Law Enforcement | 0 (0.0%) | 0 (0.0%) |
| Food Preparation & Serving | 15 (60.0%) | 10 (40.0%) |
| Cleaning & Maintenance | 7 (53.8%) | 6 (46.2%) |
| Personal Care & Service | 0 (0.0%) | 5 (100.0%) |
| Total (Category) | 22 (41.5%) | 31 (58.5%) |
| Total (Overall) | 146 (52.0%) | 135 (48.0%) |
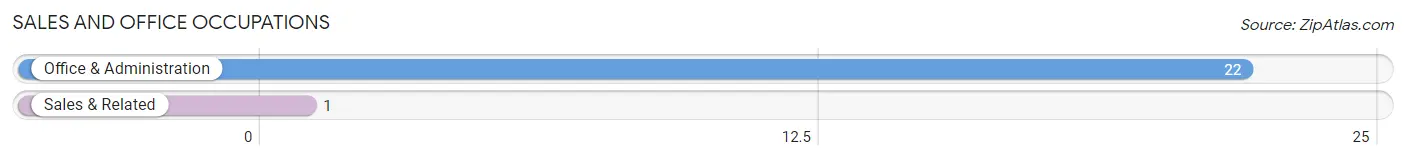
Sales and Office Occupations
The most common Sales and Office occupations in Poplar Hills are Office & Administration (22 | 7.8%), and Sales & Related (1 | 0.4%).
Sales and Office Occupations by Sex
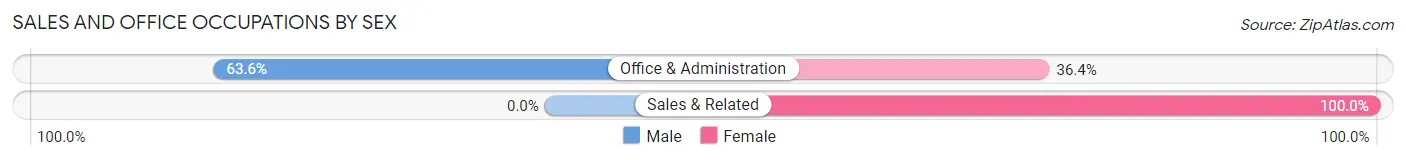
| Occupation | Male | Female |
| Sales & Related | 0 (0.0%) | 1 (100.0%) |
| Office & Administration | 14 (63.6%) | 8 (36.4%) |
| Total (Category) | 14 (60.9%) | 9 (39.1%) |
| Total (Overall) | 146 (52.0%) | 135 (48.0%) |
Natural Resources, Construction and Maintenance Occupations
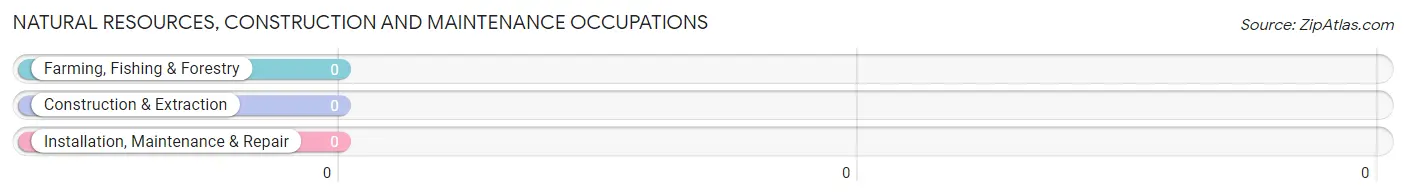
Natural Resources, Construction and Maintenance Occupations by Sex
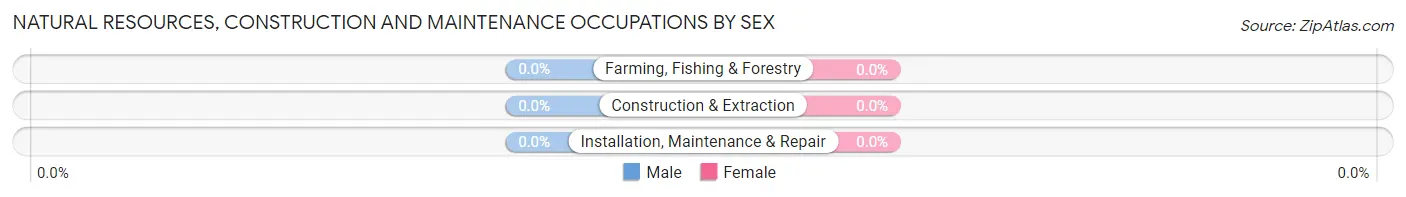
| Occupation | Male | Female |
| Farming, Fishing & Forestry | 0 (0.0%) | 0 (0.0%) |
| Construction & Extraction | 0 (0.0%) | 0 (0.0%) |
| Installation, Maintenance & Repair | 0 (0.0%) | 0 (0.0%) |
| Total (Category) | 0 (0.0%) | 0 (0.0%) |
| Total (Overall) | 146 (52.0%) | 135 (48.0%) |
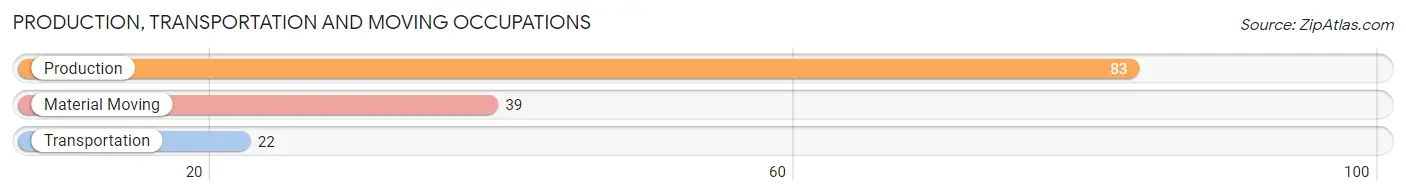
Production, Transportation and Moving Occupations
The most common Production, Transportation and Moving occupations in Poplar Hills are Production (83 | 29.5%), Material Moving (39 | 13.9%), and Transportation (22 | 7.8%).
Production, Transportation and Moving Occupations by Sex
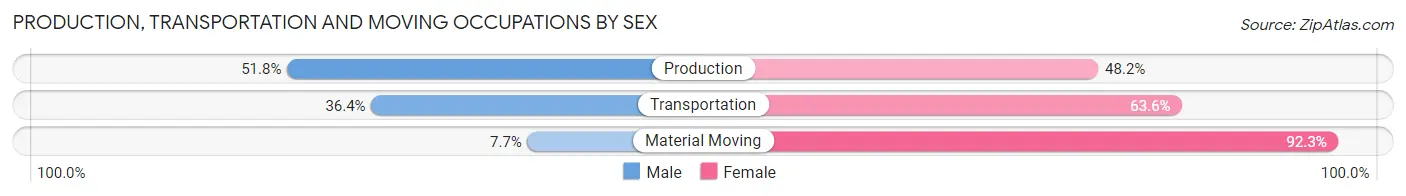
| Occupation | Male | Female |
| Production | 43 (51.8%) | 40 (48.2%) |
| Transportation | 8 (36.4%) | 14 (63.6%) |
| Material Moving | 3 (7.7%) | 36 (92.3%) |
| Total (Category) | 54 (37.5%) | 90 (62.5%) |
| Total (Overall) | 146 (52.0%) | 135 (48.0%) |
Employment Industries by Sex in Poplar Hills
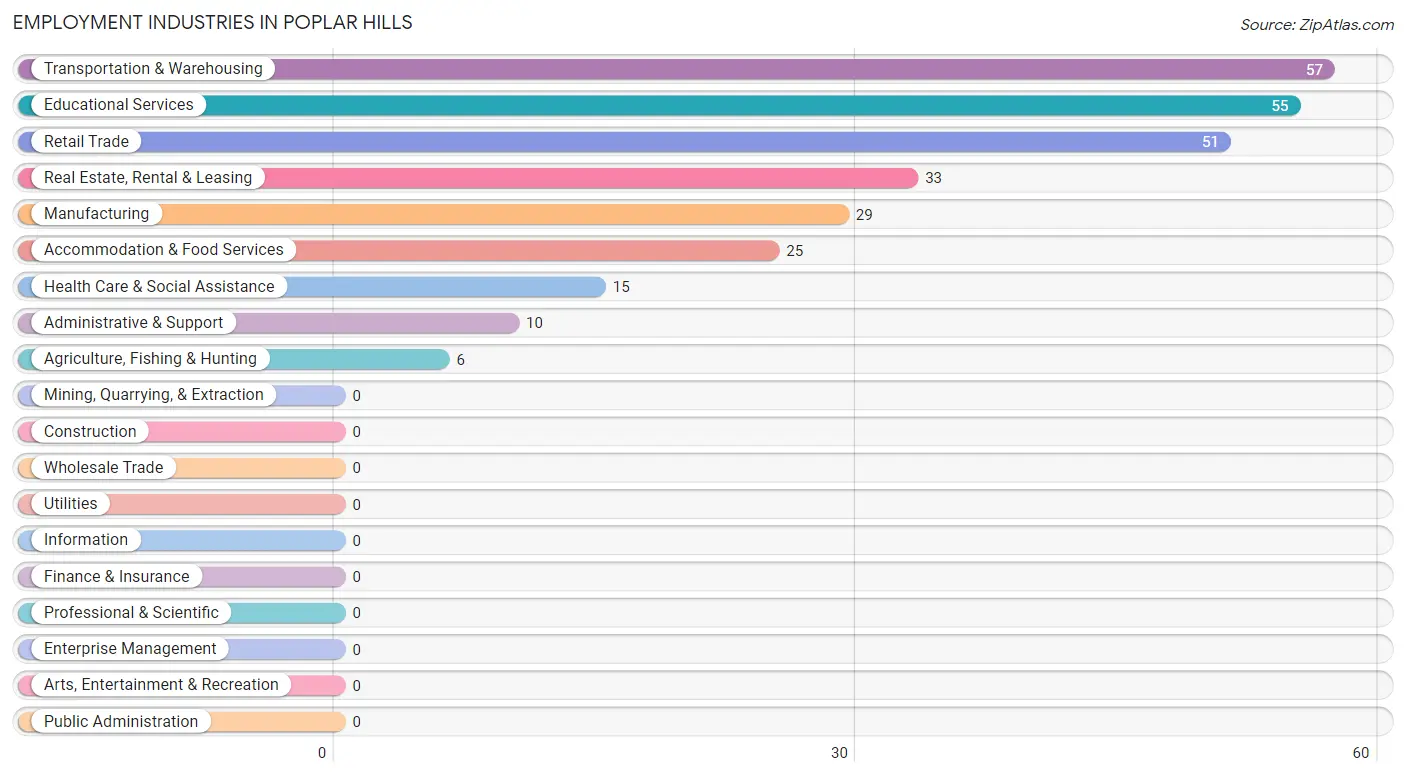
Employment Industries in Poplar Hills
The major employment industries in Poplar Hills include Transportation & Warehousing (57 | 20.3%), Educational Services (55 | 19.6%), Retail Trade (51 | 18.1%), Real Estate, Rental & Leasing (33 | 11.7%), and Manufacturing (29 | 10.3%).
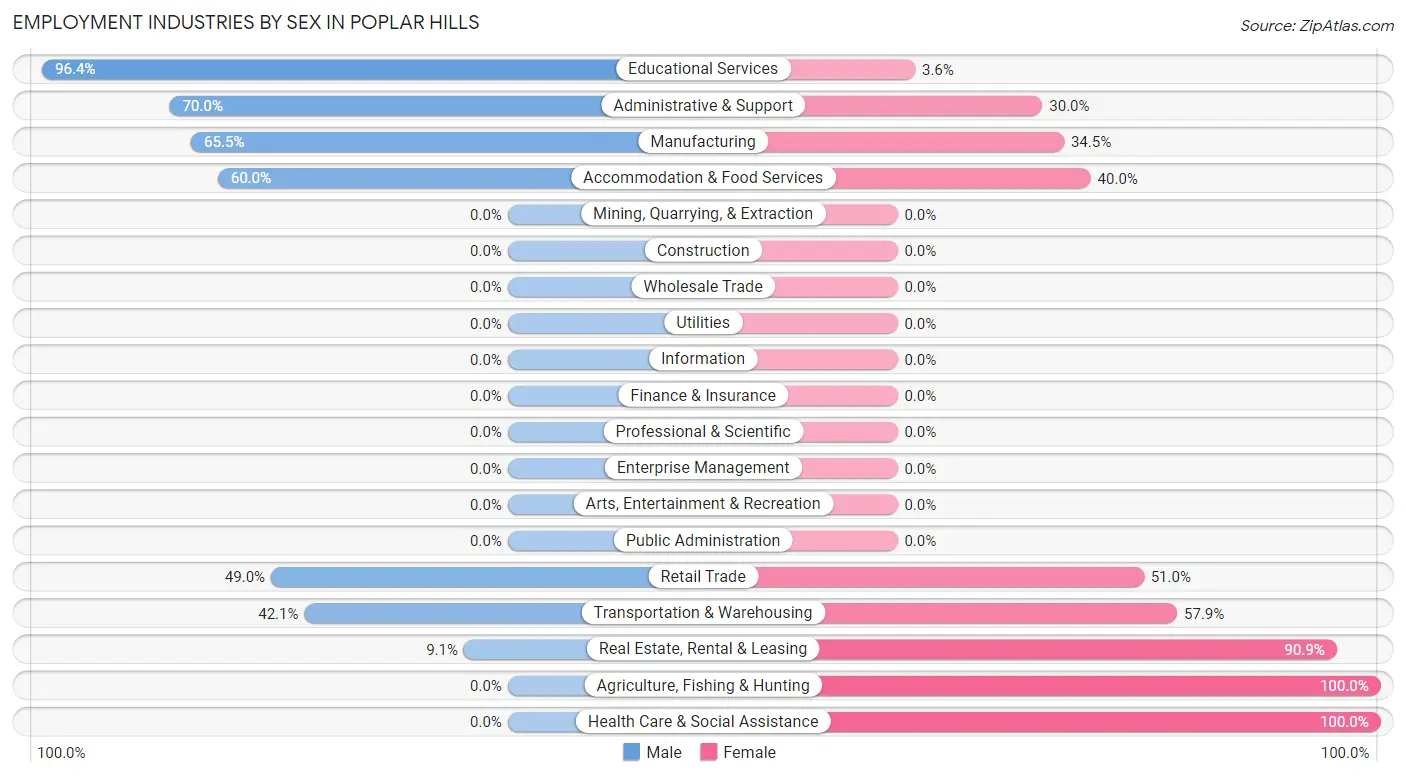
Employment Industries by Sex in Poplar Hills
The Poplar Hills industries that see more men than women are Educational Services (96.4%), Administrative & Support (70.0%), and Manufacturing (65.5%), whereas the industries that tend to have a higher number of women are Agriculture, Fishing & Hunting (100.0%), Health Care & Social Assistance (100.0%), and Real Estate, Rental & Leasing (90.9%).
| Industry | Male | Female |
| Agriculture, Fishing & Hunting | 0 (0.0%) | 6 (100.0%) |
| Mining, Quarrying, & Extraction | 0 (0.0%) | 0 (0.0%) |
| Construction | 0 (0.0%) | 0 (0.0%) |
| Manufacturing | 19 (65.5%) | 10 (34.5%) |
| Wholesale Trade | 0 (0.0%) | 0 (0.0%) |
| Retail Trade | 25 (49.0%) | 26 (51.0%) |
| Transportation & Warehousing | 24 (42.1%) | 33 (57.9%) |
| Utilities | 0 (0.0%) | 0 (0.0%) |
| Information | 0 (0.0%) | 0 (0.0%) |
| Finance & Insurance | 0 (0.0%) | 0 (0.0%) |
| Real Estate, Rental & Leasing | 3 (9.1%) | 30 (90.9%) |
| Professional & Scientific | 0 (0.0%) | 0 (0.0%) |
| Enterprise Management | 0 (0.0%) | 0 (0.0%) |
| Administrative & Support | 7 (70.0%) | 3 (30.0%) |
| Educational Services | 53 (96.4%) | 2 (3.6%) |
| Health Care & Social Assistance | 0 (0.0%) | 15 (100.0%) |
| Arts, Entertainment & Recreation | 0 (0.0%) | 0 (0.0%) |
| Accommodation & Food Services | 15 (60.0%) | 10 (40.0%) |
| Public Administration | 0 (0.0%) | 0 (0.0%) |
| Total | 146 (52.0%) | 135 (48.0%) |
Education in Poplar Hills
School Enrollment in Poplar Hills
The most common levels of schooling among the 98 students in Poplar Hills are college / undergraduate (56 | 57.1%), elementary school (24 | 24.5%), and middle school (18 | 18.4%).
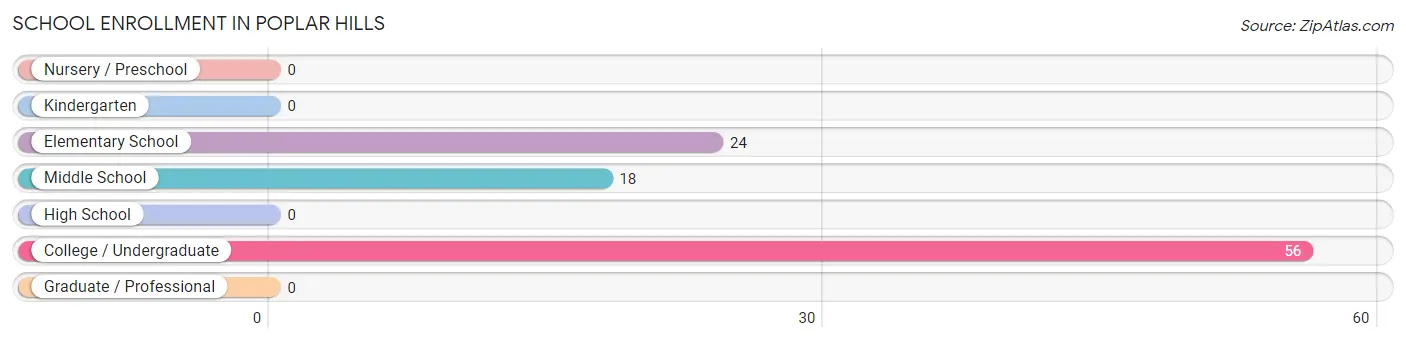
| School Level | # Students | % Students |
| Nursery / Preschool | 0 | 0.0% |
| Kindergarten | 0 | 0.0% |
| Elementary School | 24 | 24.5% |
| Middle School | 18 | 18.4% |
| High School | 0 | 0.0% |
| College / Undergraduate | 56 | 57.1% |
| Graduate / Professional | 0 | 0.0% |
| Total | 98 | 100.0% |
School Enrollment by Age by Funding Source in Poplar Hills
Out of a total of 98 students who are enrolled in schools in Poplar Hills, 3 (3.1%) attend a private institution, while the remaining 95 (96.9%) are enrolled in public schools. The age group of 35 years and over has the highest likelihood of being enrolled in private schools, with 3 (5.4% in the age bracket) enrolled. Conversely, the age group of 5 to 9 year old has the lowest likelihood of being enrolled in a private school, with 24 (100.0% in the age bracket) attending a public institution.
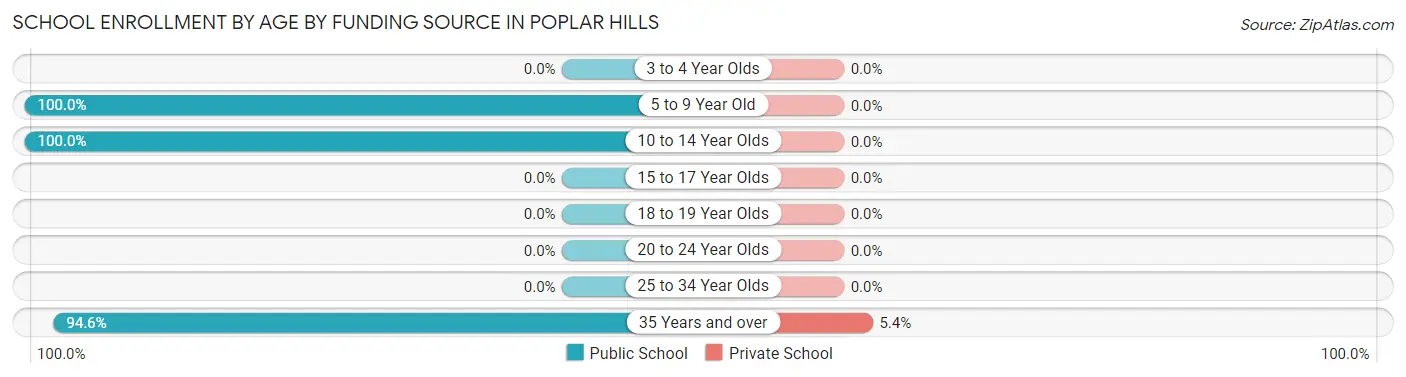
| Age Bracket | Public School | Private School |
| 3 to 4 Year Olds | 0 (0.0%) | 0 (0.0%) |
| 5 to 9 Year Old | 24 (100.0%) | 0 (0.0%) |
| 10 to 14 Year Olds | 18 (100.0%) | 0 (0.0%) |
| 15 to 17 Year Olds | 0 (0.0%) | 0 (0.0%) |
| 18 to 19 Year Olds | 0 (0.0%) | 0 (0.0%) |
| 20 to 24 Year Olds | 0 (0.0%) | 0 (0.0%) |
| 25 to 34 Year Olds | 0 (0.0%) | 0 (0.0%) |
| 35 Years and over | 53 (94.6%) | 3 (5.4%) |
| Total | 95 (96.9%) | 3 (3.1%) |
Educational Attainment by Field of Study in Poplar Hills
Business (7 | 46.7%), literature & languages (5 | 33.3%), and science & technology (3 | 20.0%) are the most common fields of study among 15 individuals in Poplar Hills who have obtained a bachelor's degree or higher.
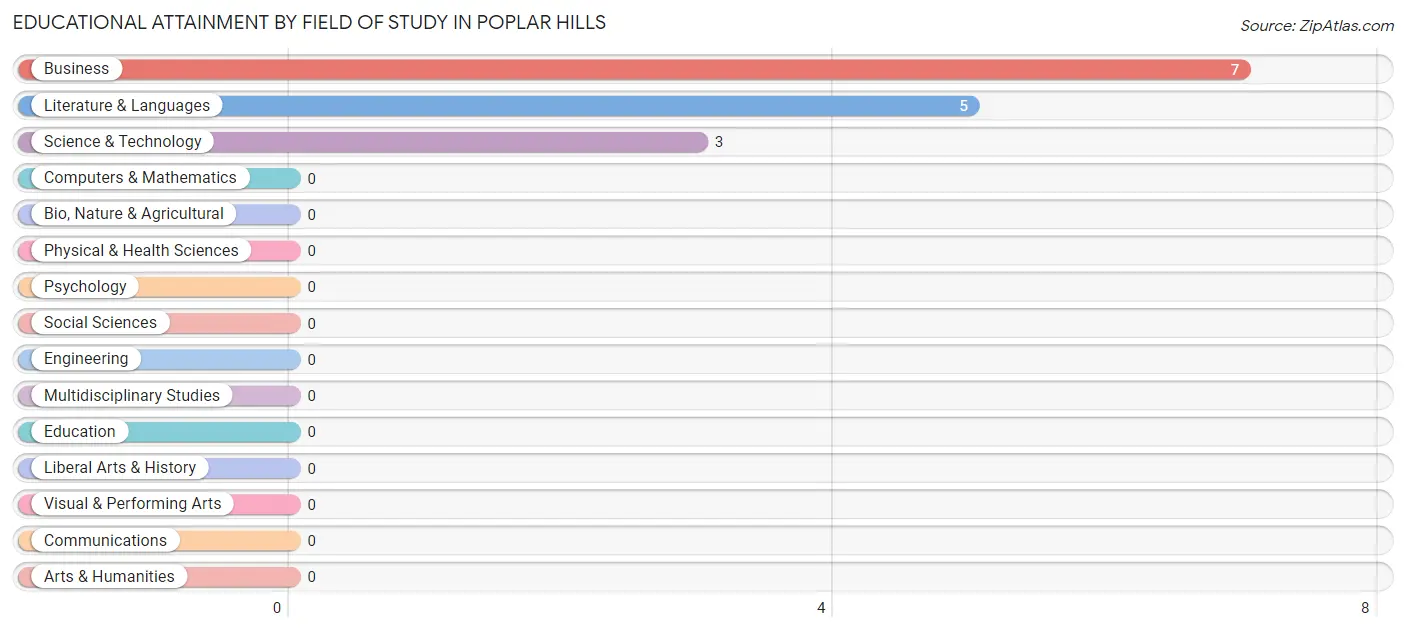
| Field of Study | # Graduates | % Graduates |
| Computers & Mathematics | 0 | 0.0% |
| Bio, Nature & Agricultural | 0 | 0.0% |
| Physical & Health Sciences | 0 | 0.0% |
| Psychology | 0 | 0.0% |
| Social Sciences | 0 | 0.0% |
| Engineering | 0 | 0.0% |
| Multidisciplinary Studies | 0 | 0.0% |
| Science & Technology | 3 | 20.0% |
| Business | 7 | 46.7% |
| Education | 0 | 0.0% |
| Literature & Languages | 5 | 33.3% |
| Liberal Arts & History | 0 | 0.0% |
| Visual & Performing Arts | 0 | 0.0% |
| Communications | 0 | 0.0% |
| Arts & Humanities | 0 | 0.0% |
| Total | 15 | 100.0% |
Transportation & Commute in Poplar Hills
Vehicle Availability by Sex in Poplar Hills
The most prevalent vehicle ownership categories in Poplar Hills are males with 1 vehicle (105, accounting for 73.9%) and females with 1 vehicle (97, making up 84.7%).
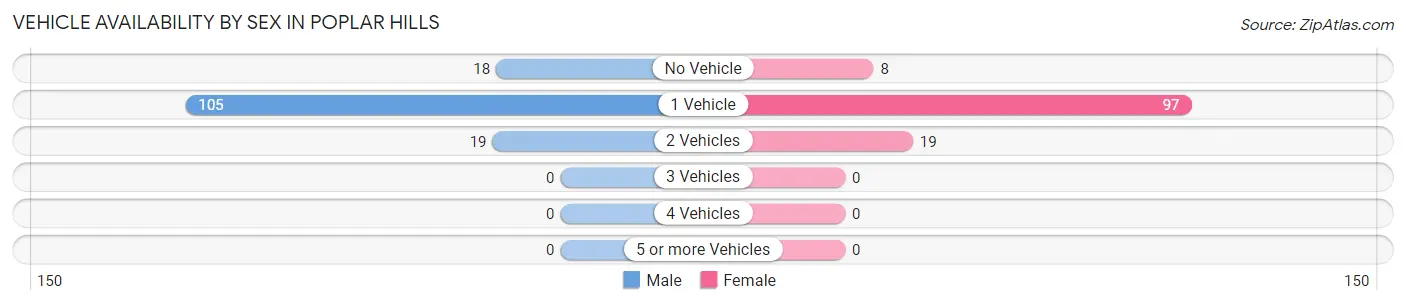
| Vehicles Available | Male | Female |
| No Vehicle | 18 (12.7%) | 8 (6.5%) |
| 1 Vehicle | 105 (73.9%) | 97 (78.2%) |
| 2 Vehicles | 19 (13.4%) | 19 (15.3%) |
| 3 Vehicles | 0 (0.0%) | 0 (0.0%) |
| 4 Vehicles | 0 (0.0%) | 0 (0.0%) |
| 5 or more Vehicles | 0 (0.0%) | 0 (0.0%) |
| Total | 142 (100.0%) | 124 (100.0%) |
Commute Time in Poplar Hills
The most frequently occuring commute durations in Poplar Hills are 15 to 19 minutes (62 commuters, 29.1%), 20 to 24 minutes (57 commuters, 26.8%), and 5 to 9 minutes (37 commuters, 17.4%).
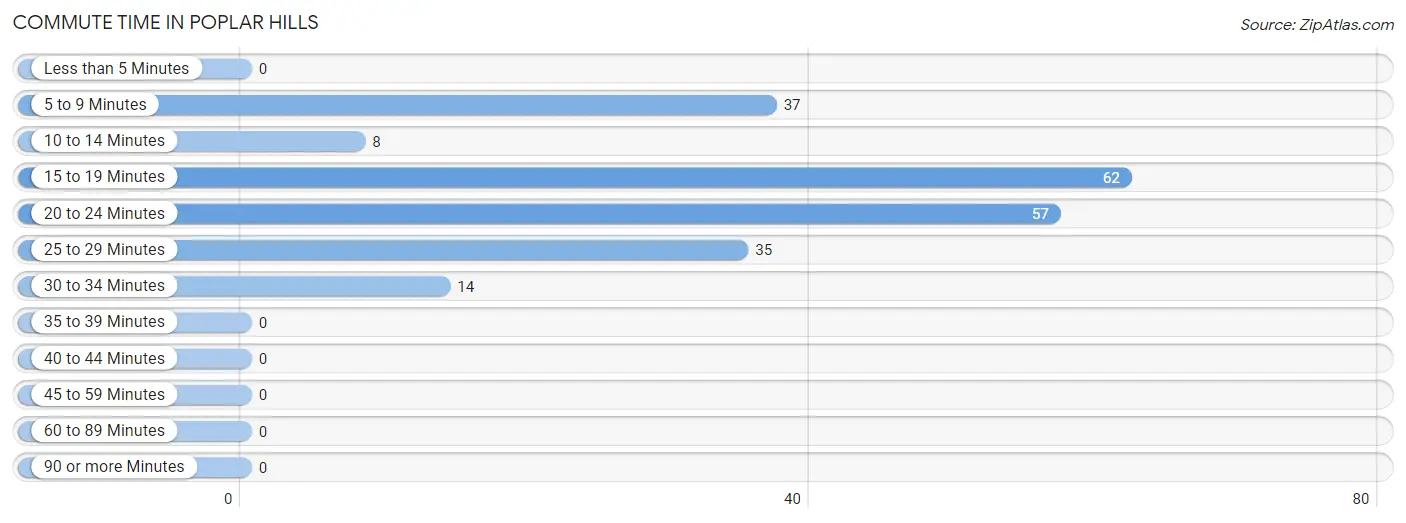
| Commute Time | # Commuters | % Commuters |
| Less than 5 Minutes | 0 | 0.0% |
| 5 to 9 Minutes | 37 | 17.4% |
| 10 to 14 Minutes | 8 | 3.8% |
| 15 to 19 Minutes | 62 | 29.1% |
| 20 to 24 Minutes | 57 | 26.8% |
| 25 to 29 Minutes | 35 | 16.4% |
| 30 to 34 Minutes | 14 | 6.6% |
| 35 to 39 Minutes | 0 | 0.0% |
| 40 to 44 Minutes | 0 | 0.0% |
| 45 to 59 Minutes | 0 | 0.0% |
| 60 to 89 Minutes | 0 | 0.0% |
| 90 or more Minutes | 0 | 0.0% |
Commute Time by Sex in Poplar Hills
The most common commute times in Poplar Hills are 20 to 24 minutes (28 commuters, 31.5%) for males and 15 to 19 minutes (47 commuters, 37.9%) for females.
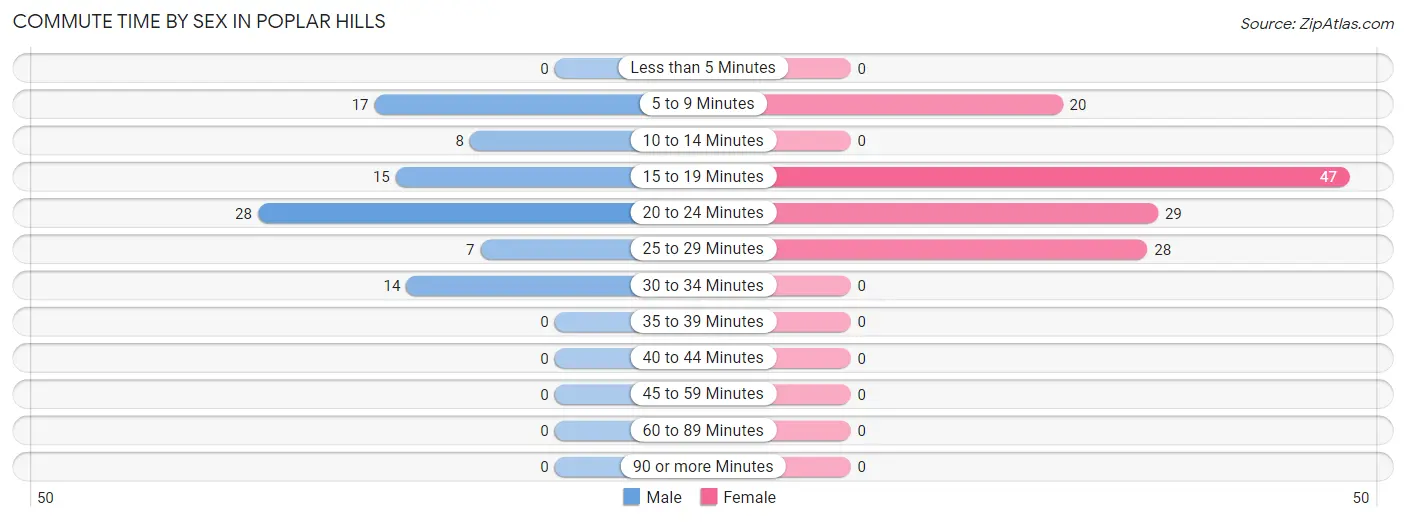
| Commute Time | Male | Female |
| Less than 5 Minutes | 0 (0.0%) | 0 (0.0%) |
| 5 to 9 Minutes | 17 (19.1%) | 20 (16.1%) |
| 10 to 14 Minutes | 8 (9.0%) | 0 (0.0%) |
| 15 to 19 Minutes | 15 (16.9%) | 47 (37.9%) |
| 20 to 24 Minutes | 28 (31.5%) | 29 (23.4%) |
| 25 to 29 Minutes | 7 (7.9%) | 28 (22.6%) |
| 30 to 34 Minutes | 14 (15.7%) | 0 (0.0%) |
| 35 to 39 Minutes | 0 (0.0%) | 0 (0.0%) |
| 40 to 44 Minutes | 0 (0.0%) | 0 (0.0%) |
| 45 to 59 Minutes | 0 (0.0%) | 0 (0.0%) |
| 60 to 89 Minutes | 0 (0.0%) | 0 (0.0%) |
| 90 or more Minutes | 0 (0.0%) | 0 (0.0%) |
Time of Departure to Work by Sex in Poplar Hills
The most frequent times of departure to work in Poplar Hills are 12:00 PM to 3:59 PM (31, 34.8%) for males and 7:00 AM to 7:29 AM (77, 62.1%) for females.
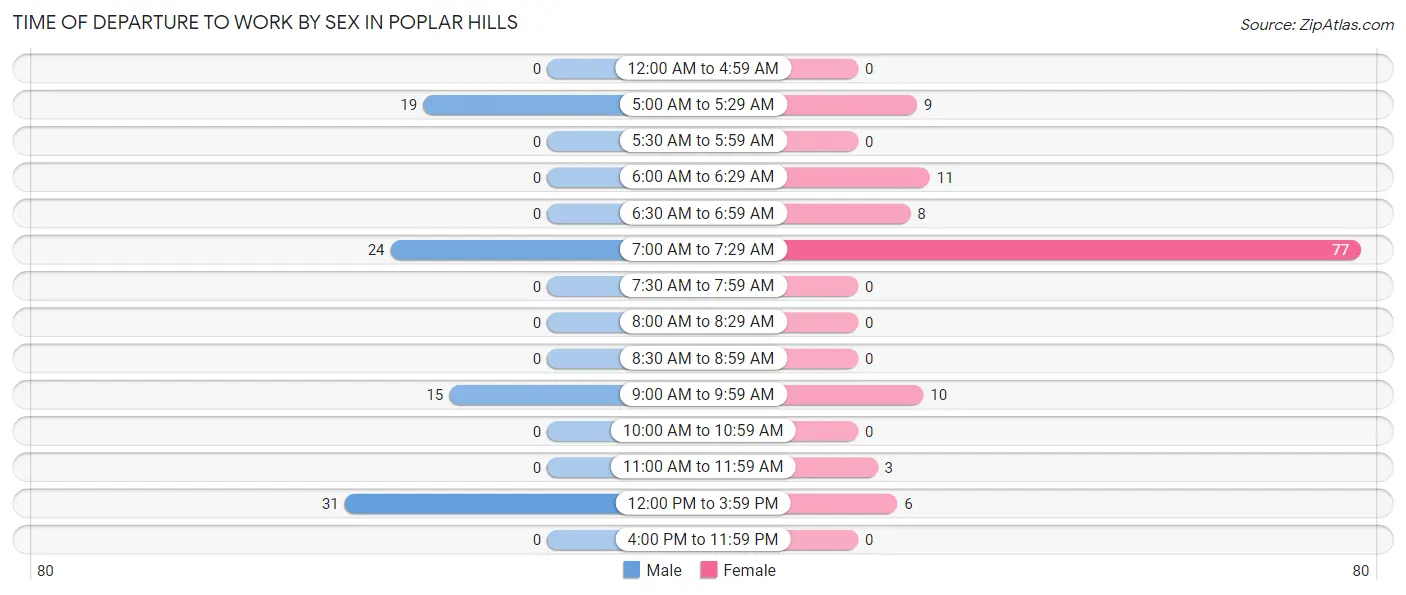
| Time of Departure | Male | Female |
| 12:00 AM to 4:59 AM | 0 (0.0%) | 0 (0.0%) |
| 5:00 AM to 5:29 AM | 19 (21.3%) | 9 (7.3%) |
| 5:30 AM to 5:59 AM | 0 (0.0%) | 0 (0.0%) |
| 6:00 AM to 6:29 AM | 0 (0.0%) | 11 (8.9%) |
| 6:30 AM to 6:59 AM | 0 (0.0%) | 8 (6.5%) |
| 7:00 AM to 7:29 AM | 24 (27.0%) | 77 (62.1%) |
| 7:30 AM to 7:59 AM | 0 (0.0%) | 0 (0.0%) |
| 8:00 AM to 8:29 AM | 0 (0.0%) | 0 (0.0%) |
| 8:30 AM to 8:59 AM | 0 (0.0%) | 0 (0.0%) |
| 9:00 AM to 9:59 AM | 15 (16.9%) | 10 (8.1%) |
| 10:00 AM to 10:59 AM | 0 (0.0%) | 0 (0.0%) |
| 11:00 AM to 11:59 AM | 0 (0.0%) | 3 (2.4%) |
| 12:00 PM to 3:59 PM | 31 (34.8%) | 6 (4.8%) |
| 4:00 PM to 11:59 PM | 0 (0.0%) | 0 (0.0%) |
| Total | 89 (100.0%) | 124 (100.0%) |
Housing Occupancy in Poplar Hills
Occupancy by Ownership in Poplar Hills
Of the total 327 dwellings in Poplar Hills, owner-occupied units account for 0 (0.0%), while renter-occupied units make up 327 (100.0%).
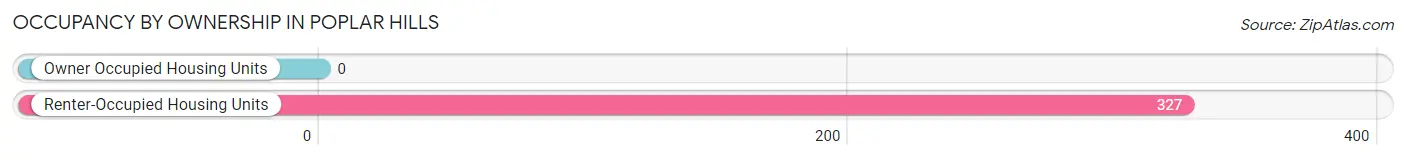
| Occupancy | # Housing Units | % Housing Units |
| Owner Occupied Housing Units | 0 | 0.0% |
| Renter-Occupied Housing Units | 327 | 100.0% |
| Total Occupied Housing Units | 327 | 100.0% |
Occupancy by Household Size in Poplar Hills
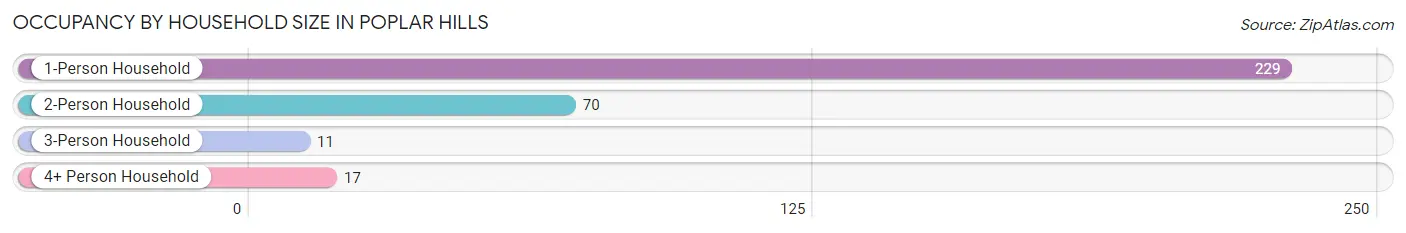
| Household Size | # Housing Units | % Housing Units |
| 1-Person Household | 229 | 70.0% |
| 2-Person Household | 70 | 21.4% |
| 3-Person Household | 11 | 3.4% |
| 4+ Person Household | 17 | 5.2% |
| Total Housing Units | 327 | 100.0% |
Occupancy by Ownership by Household Size in Poplar Hills
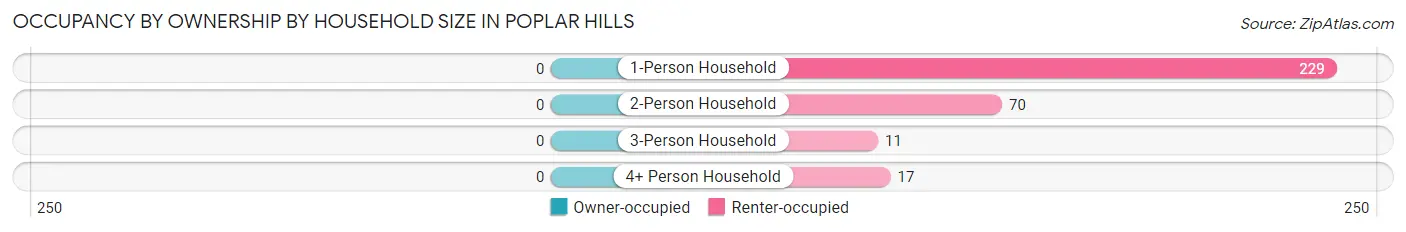
| Household Size | Owner-occupied | Renter-occupied |
| 1-Person Household | 0 (0.0%) | 229 (100.0%) |
| 2-Person Household | 0 (0.0%) | 70 (100.0%) |
| 3-Person Household | 0 (0.0%) | 11 (100.0%) |
| 4+ Person Household | 0 (0.0%) | 17 (100.0%) |
| Total Housing Units | 0 (0.0%) | 327 (100.0%) |
Occupancy by Educational Attainment in Poplar Hills
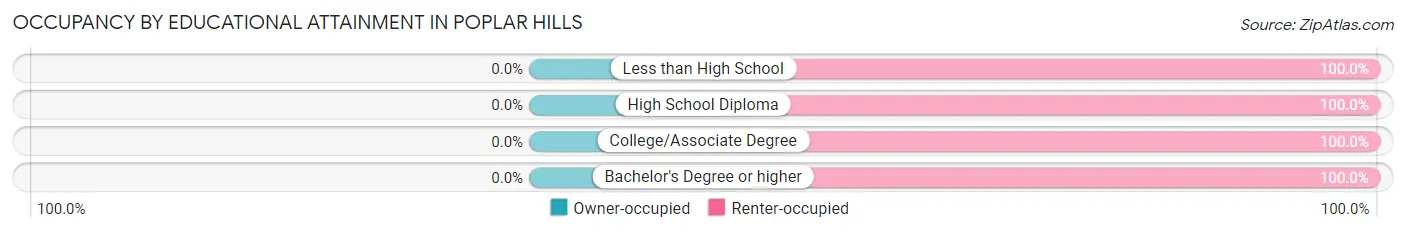
| Household Size | Owner-occupied | Renter-occupied |
| Less than High School | 0 (0.0%) | 92 (100.0%) |
| High School Diploma | 0 (0.0%) | 79 (100.0%) |
| College/Associate Degree | 0 (0.0%) | 141 (100.0%) |
| Bachelor's Degree or higher | 0 (0.0%) | 15 (100.0%) |
Occupancy by Age of Householder in Poplar Hills
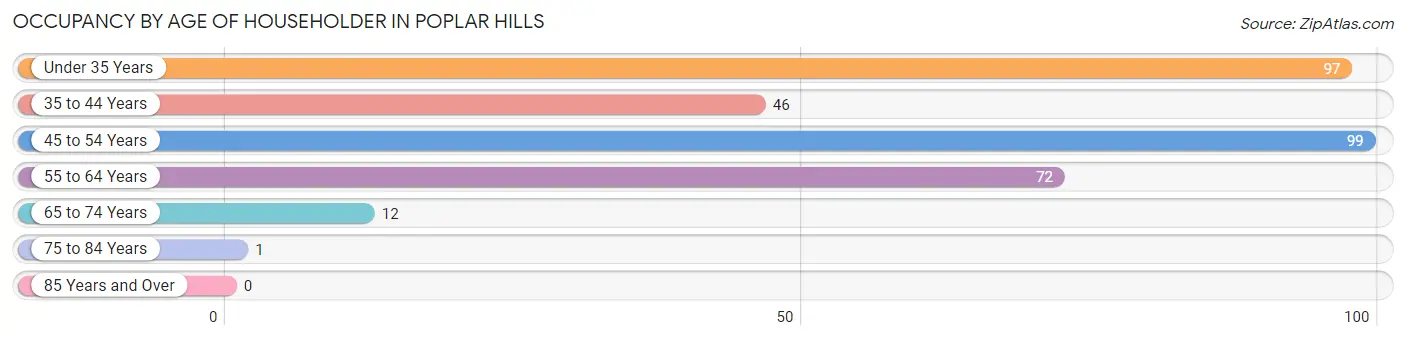
| Age Bracket | # Households | % Households |
| Under 35 Years | 97 | 29.7% |
| 35 to 44 Years | 46 | 14.1% |
| 45 to 54 Years | 99 | 30.3% |
| 55 to 64 Years | 72 | 22.0% |
| 65 to 74 Years | 12 | 3.7% |
| 75 to 84 Years | 1 | 0.3% |
| 85 Years and Over | 0 | 0.0% |
| Total | 327 | 100.0% |
Housing Finances in Poplar Hills
Median Income by Occupancy in Poplar Hills
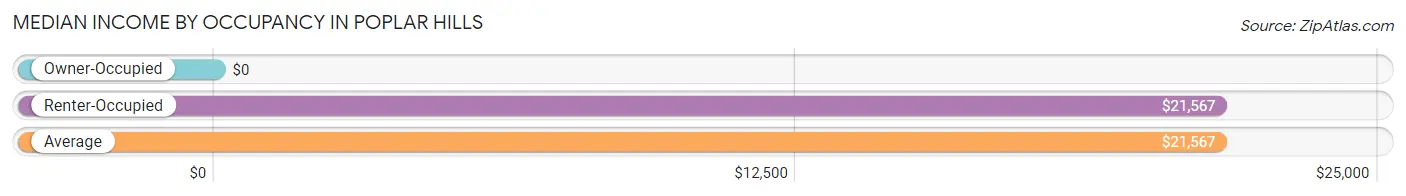
| Occupancy Type | # Households | Median Income |
| Owner-Occupied | 0 (0.0%) | $0 |
| Renter-Occupied | 327 (100.0%) | $21,567 |
| Average | 327 (100.0%) | $21,567 |
Occupancy by Householder Income Bracket in Poplar Hills
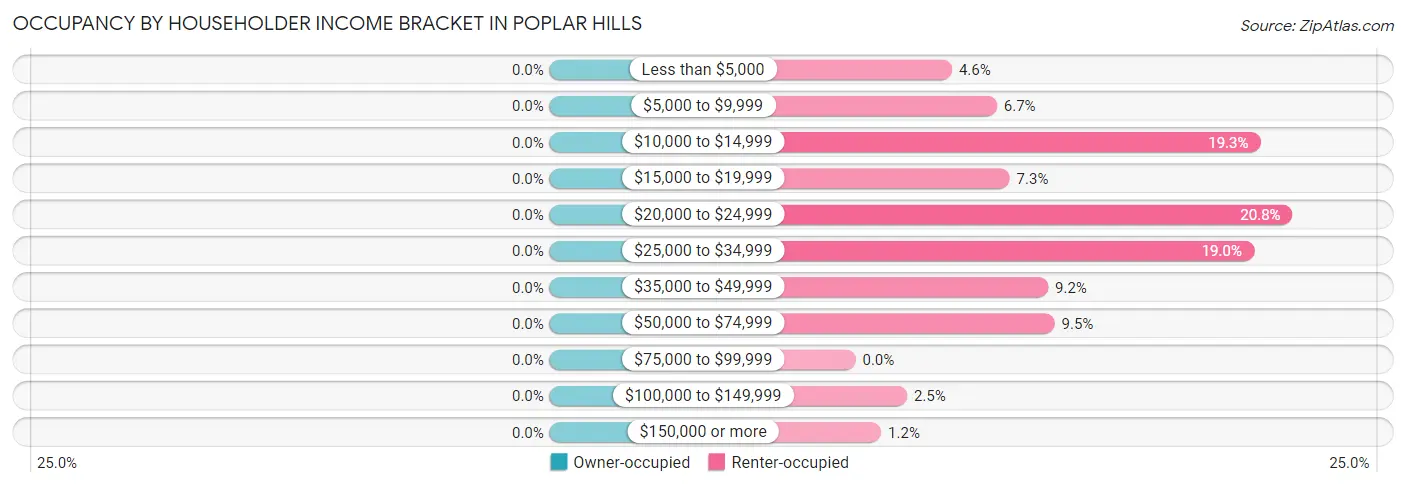
| Income Bracket | Owner-occupied | Renter-occupied |
| Less than $5,000 | 0 (0.0%) | 15 (4.6%) |
| $5,000 to $9,999 | 0 (0.0%) | 22 (6.7%) |
| $10,000 to $14,999 | 0 (0.0%) | 63 (19.3%) |
| $15,000 to $19,999 | 0 (0.0%) | 24 (7.3%) |
| $20,000 to $24,999 | 0 (0.0%) | 68 (20.8%) |
| $25,000 to $34,999 | 0 (0.0%) | 62 (19.0%) |
| $35,000 to $49,999 | 0 (0.0%) | 30 (9.2%) |
| $50,000 to $74,999 | 0 (0.0%) | 31 (9.5%) |
| $75,000 to $99,999 | 0 (0.0%) | 0 (0.0%) |
| $100,000 to $149,999 | 0 (0.0%) | 8 (2.5%) |
| $150,000 or more | 0 (0.0%) | 4 (1.2%) |
| Total | 0 (0.0%) | 327 (100.0%) |
Monthly Housing Cost Tiers in Poplar Hills
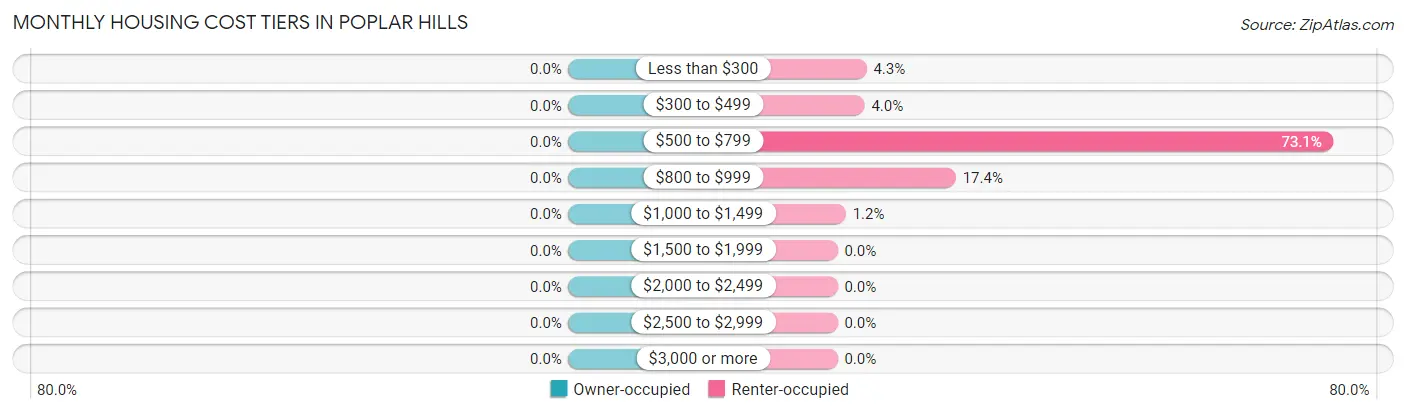
| Monthly Cost | Owner-occupied | Renter-occupied |
| Less than $300 | 0 (0.0%) | 14 (4.3%) |
| $300 to $499 | 0 (0.0%) | 13 (4.0%) |
| $500 to $799 | 0 (0.0%) | 239 (73.1%) |
| $800 to $999 | 0 (0.0%) | 57 (17.4%) |
| $1,000 to $1,499 | 0 (0.0%) | 4 (1.2%) |
| $1,500 to $1,999 | 0 (0.0%) | 0 (0.0%) |
| $2,000 to $2,499 | 0 (0.0%) | 0 (0.0%) |
| $2,500 to $2,999 | 0 (0.0%) | 0 (0.0%) |
| $3,000 or more | 0 (0.0%) | 0 (0.0%) |
| Total | 0 (0.0%) | 327 (100.0%) |
Physical Housing Characteristics in Poplar Hills
Housing Structures in Poplar Hills
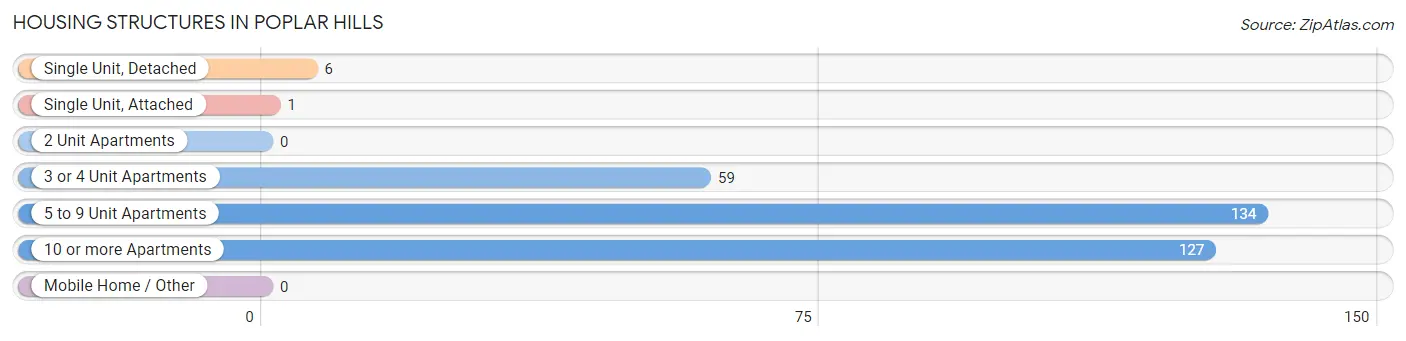
| Structure Type | # Housing Units | % Housing Units |
| Single Unit, Detached | 6 | 1.8% |
| Single Unit, Attached | 1 | 0.3% |
| 2 Unit Apartments | 0 | 0.0% |
| 3 or 4 Unit Apartments | 59 | 18.0% |
| 5 to 9 Unit Apartments | 134 | 41.0% |
| 10 or more Apartments | 127 | 38.8% |
| Mobile Home / Other | 0 | 0.0% |
| Total | 327 | 100.0% |
Housing Structures by Occupancy in Poplar Hills
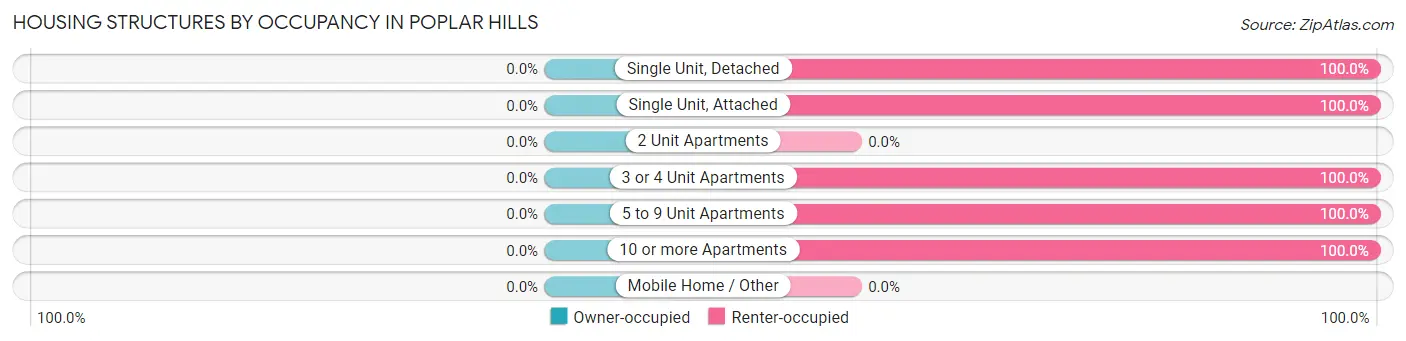
| Structure Type | Owner-occupied | Renter-occupied |
| Single Unit, Detached | 0 (0.0%) | 6 (100.0%) |
| Single Unit, Attached | 0 (0.0%) | 1 (100.0%) |
| 2 Unit Apartments | 0 (0.0%) | 0 (0.0%) |
| 3 or 4 Unit Apartments | 0 (0.0%) | 59 (100.0%) |
| 5 to 9 Unit Apartments | 0 (0.0%) | 134 (100.0%) |
| 10 or more Apartments | 0 (0.0%) | 127 (100.0%) |
| Mobile Home / Other | 0 (0.0%) | 0 (0.0%) |
| Total | 0 (0.0%) | 327 (100.0%) |
Housing Structures by Number of Rooms in Poplar Hills
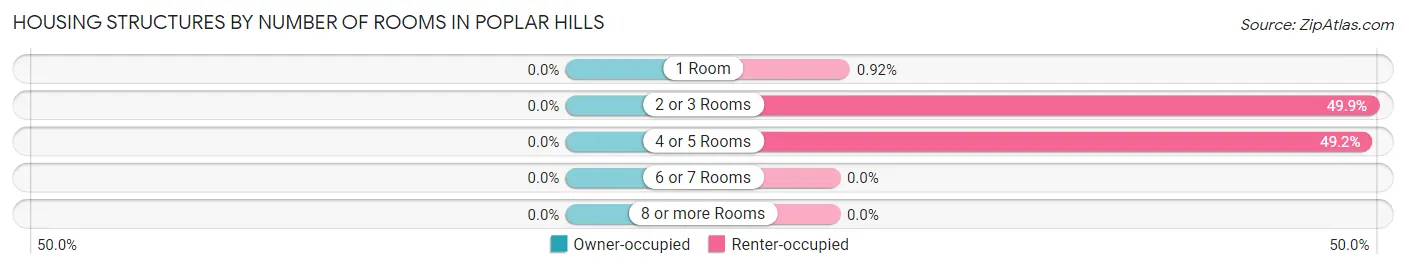
| Number of Rooms | Owner-occupied | Renter-occupied |
| 1 Room | 0 (0.0%) | 3 (0.9%) |
| 2 or 3 Rooms | 0 (0.0%) | 163 (49.8%) |
| 4 or 5 Rooms | 0 (0.0%) | 161 (49.2%) |
| 6 or 7 Rooms | 0 (0.0%) | 0 (0.0%) |
| 8 or more Rooms | 0 (0.0%) | 0 (0.0%) |
| Total | 0 (0.0%) | 327 (100.0%) |
Housing Structure by Heating Type in Poplar Hills
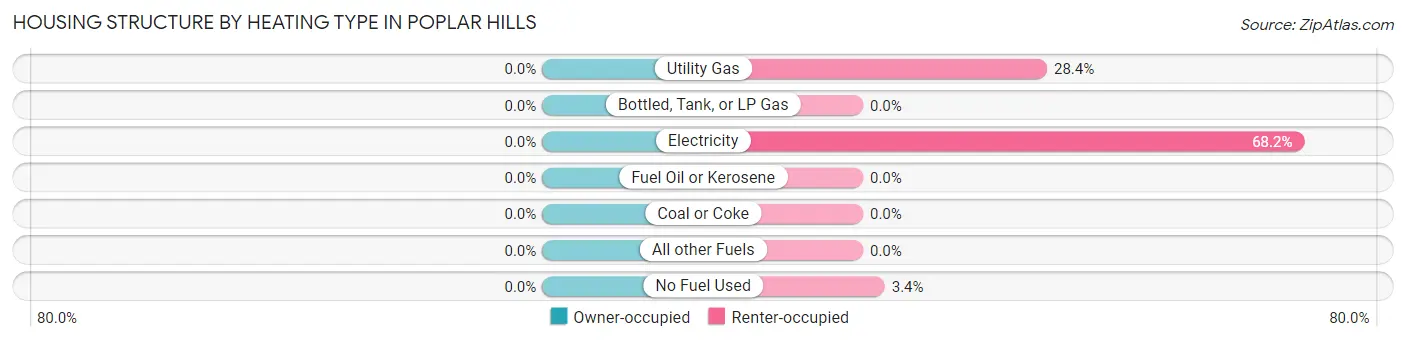
| Heating Type | Owner-occupied | Renter-occupied |
| Utility Gas | 0 (0.0%) | 93 (28.4%) |
| Bottled, Tank, or LP Gas | 0 (0.0%) | 0 (0.0%) |
| Electricity | 0 (0.0%) | 223 (68.2%) |
| Fuel Oil or Kerosene | 0 (0.0%) | 0 (0.0%) |
| Coal or Coke | 0 (0.0%) | 0 (0.0%) |
| All other Fuels | 0 (0.0%) | 0 (0.0%) |
| No Fuel Used | 0 (0.0%) | 11 (3.4%) |
| Total | 0 (0.0%) | 327 (100.0%) |
Household Vehicle Usage in Poplar Hills
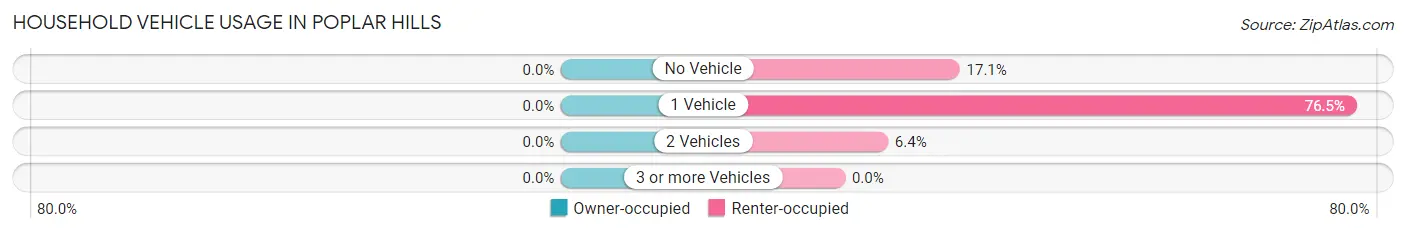
| Vehicles per Household | Owner-occupied | Renter-occupied |
| No Vehicle | 0 (0.0%) | 56 (17.1%) |
| 1 Vehicle | 0 (0.0%) | 250 (76.4%) |
| 2 Vehicles | 0 (0.0%) | 21 (6.4%) |
| 3 or more Vehicles | 0 (0.0%) | 0 (0.0%) |
| Total | 0 (0.0%) | 327 (100.0%) |
Real Estate & Mortgages in Poplar Hills
Real Estate and Mortgage Overview in Poplar Hills
| Characteristic | Without Mortgage | With Mortgage |
| Housing Units | 0 | 0 |
| Median Property Value | - | - |
| Median Household Income | - | - |
| Monthly Housing Costs | - | - |
| Real Estate Taxes | - | - |
Property Value by Mortgage Status in Poplar Hills
| Property Value | Without Mortgage | With Mortgage |
| Less than $50,000 | 0 (0.0%) | 0 (0.0%) |
| $50,000 to $99,999 | 0 (0.0%) | 0 (0.0%) |
| $100,000 to $299,999 | 0 (0.0%) | 0 (0.0%) |
| $300,000 to $499,999 | 0 (0.0%) | 0 (0.0%) |
| $500,000 to $749,999 | 0 (0.0%) | 0 (0.0%) |
| $750,000 to $999,999 | 0 (0.0%) | 0 (0.0%) |
| $1,000,000 or more | 0 (0.0%) | 0 (0.0%) |
| Total | 0 (0.0%) | 0 (0.0%) |
Household Income by Mortgage Status in Poplar Hills
| Household Income | Without Mortgage | With Mortgage |
| Less than $10,000 | 0 (0.0%) | 0 (0.0%) |
| $10,000 to $24,999 | 0 (0.0%) | 0 (0.0%) |
| $25,000 to $34,999 | 0 (0.0%) | 0 (0.0%) |
| $35,000 to $49,999 | 0 (0.0%) | 0 (0.0%) |
| $50,000 to $74,999 | 0 (0.0%) | 0 (0.0%) |
| $75,000 to $99,999 | 0 (0.0%) | 0 (0.0%) |
| $100,000 to $149,999 | 0 (0.0%) | 0 (0.0%) |
| $150,000 or more | 0 (0.0%) | 0 (0.0%) |
| Total | 0 (0.0%) | 0 (0.0%) |
Property Value to Household Income Ratio in Poplar Hills
| Value-to-Income Ratio | Without Mortgage | With Mortgage |
| Less than 2.0x | 0 (0.0%) | 0 (0.0%) |
| 2.0x to 2.9x | 0 (0.0%) | 0 (0.0%) |
| 3.0x to 3.9x | 0 (0.0%) | 0 (0.0%) |
| 4.0x or more | 0 (0.0%) | 0 (0.0%) |
| Total | 0 (0.0%) | 0 (0.0%) |
Real Estate Taxes by Mortgage Status in Poplar Hills
| Property Taxes | Without Mortgage | With Mortgage |
| Less than $800 | 0 (0.0%) | 0 (0.0%) |
| $800 to $1,499 | 0 (0.0%) | 0 (0.0%) |
| $800 to $1,499 | 0 (0.0%) | 0 (0.0%) |
| Total | 0 (0.0%) | 0 (0.0%) |
Health & Disability in Poplar Hills
Health Insurance Coverage by Age in Poplar Hills
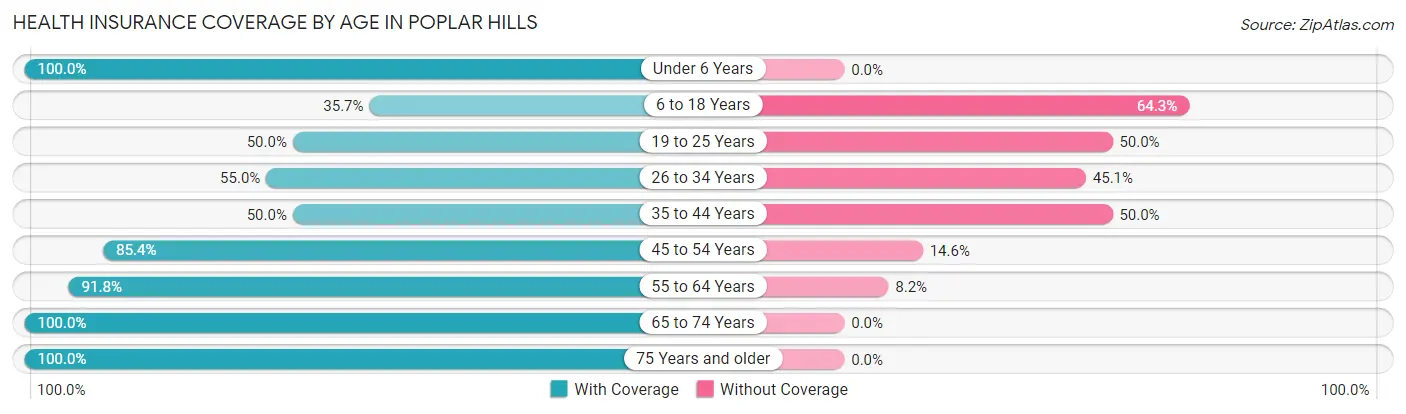
| Age Bracket | With Coverage | Without Coverage |
| Under 6 Years | 82 (100.0%) | 0 (0.0%) |
| 6 to 18 Years | 15 (35.7%) | 27 (64.3%) |
| 19 to 25 Years | 7 (50.0%) | 7 (50.0%) |
| 26 to 34 Years | 61 (54.9%) | 50 (45.1%) |
| 35 to 44 Years | 30 (50.0%) | 30 (50.0%) |
| 45 to 54 Years | 105 (85.4%) | 18 (14.6%) |
| 55 to 64 Years | 67 (91.8%) | 6 (8.2%) |
| 65 to 74 Years | 13 (100.0%) | 0 (0.0%) |
| 75 Years and older | 1 (100.0%) | 0 (0.0%) |
| Total | 381 (73.4%) | 138 (26.6%) |
Health Insurance Coverage by Citizenship Status in Poplar Hills
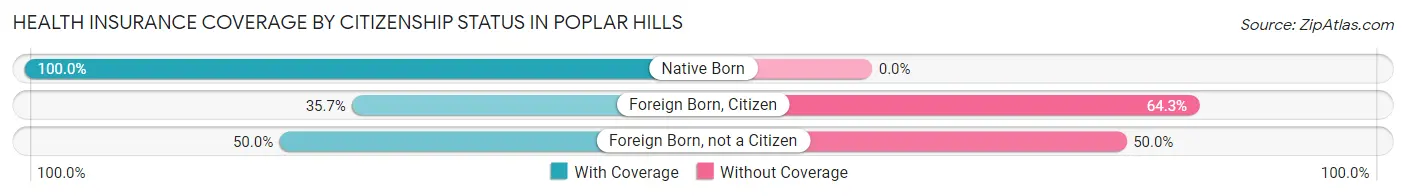
| Citizenship Status | With Coverage | Without Coverage |
| Native Born | 82 (100.0%) | 0 (0.0%) |
| Foreign Born, Citizen | 15 (35.7%) | 27 (64.3%) |
| Foreign Born, not a Citizen | 7 (50.0%) | 7 (50.0%) |
Health Insurance Coverage by Household Income in Poplar Hills
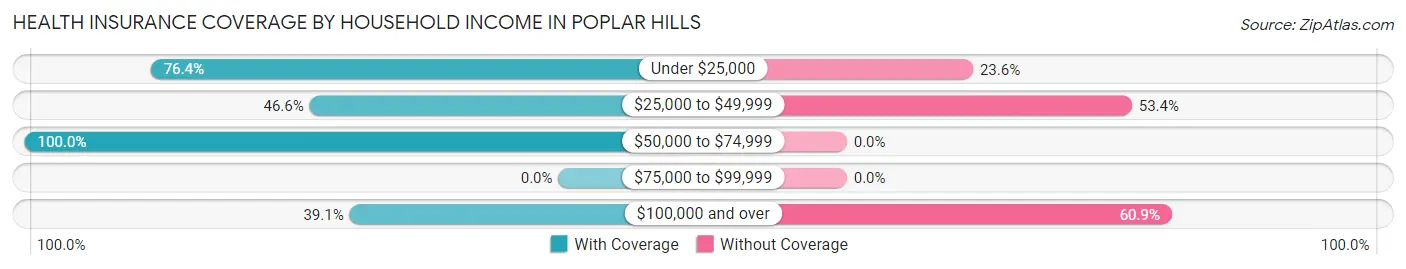
| Household Income | With Coverage | Without Coverage |
| Under $25,000 | 197 (76.4%) | 61 (23.6%) |
| $25,000 to $49,999 | 55 (46.6%) | 63 (53.4%) |
| $50,000 to $74,999 | 120 (100.0%) | 0 (0.0%) |
| $75,000 to $99,999 | 0 (0.0%) | 0 (0.0%) |
| $100,000 and over | 9 (39.1%) | 14 (60.9%) |
Public vs Private Health Insurance Coverage by Age in Poplar Hills
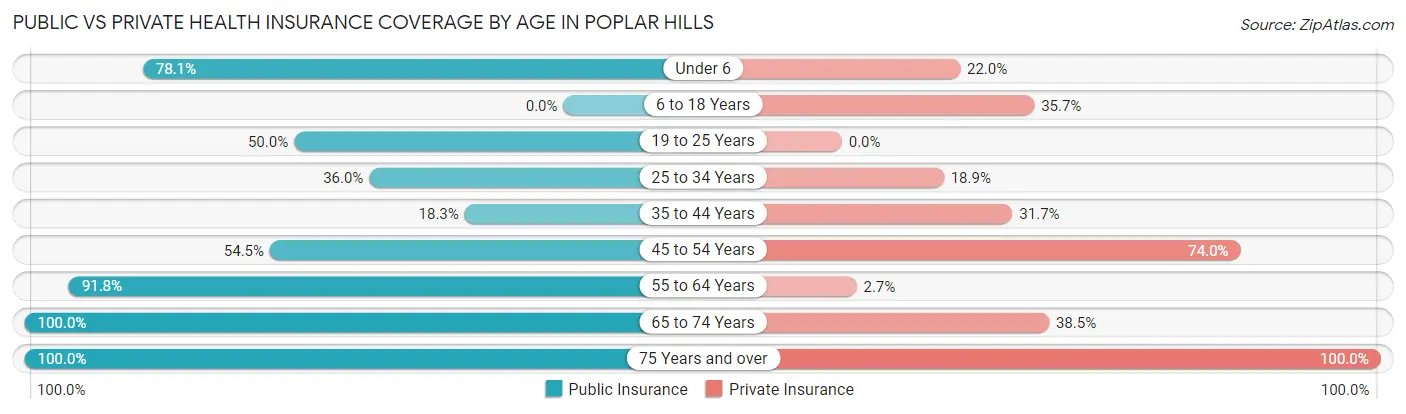
| Age Bracket | Public Insurance | Private Insurance |
| Under 6 | 64 (78.0%) | 18 (22.0%) |
| 6 to 18 Years | 0 (0.0%) | 15 (35.7%) |
| 19 to 25 Years | 7 (50.0%) | 0 (0.0%) |
| 25 to 34 Years | 40 (36.0%) | 21 (18.9%) |
| 35 to 44 Years | 11 (18.3%) | 19 (31.7%) |
| 45 to 54 Years | 67 (54.5%) | 91 (74.0%) |
| 55 to 64 Years | 67 (91.8%) | 2 (2.7%) |
| 65 to 74 Years | 13 (100.0%) | 5 (38.5%) |
| 75 Years and over | 1 (100.0%) | 1 (100.0%) |
| Total | 270 (52.0%) | 172 (33.1%) |
Disability Status by Sex by Age in Poplar Hills
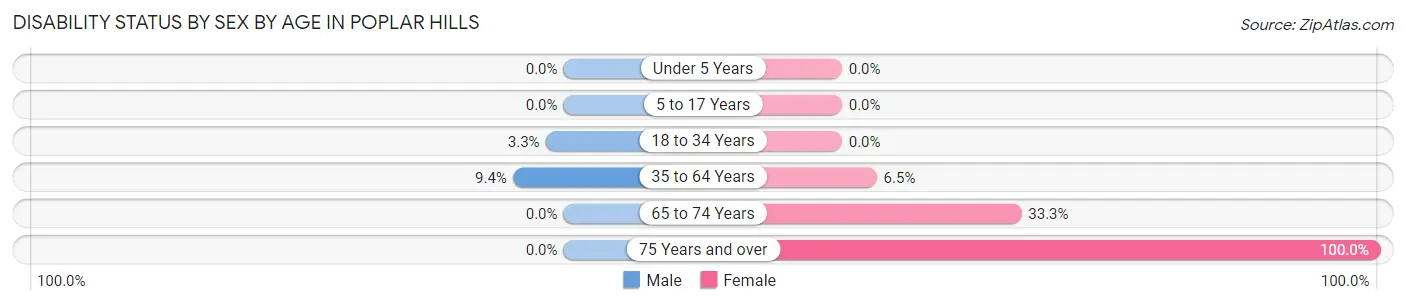
| Age Bracket | Male | Female |
| Under 5 Years | 0 (0.0%) | 0 (0.0%) |
| 5 to 17 Years | 0 (0.0%) | 0 (0.0%) |
| 18 to 34 Years | 2 (3.3%) | 0 (0.0%) |
| 35 to 64 Years | 11 (9.4%) | 9 (6.5%) |
| 65 to 74 Years | 0 (0.0%) | 4 (33.3%) |
| 75 Years and over | 0 (0.0%) | 1 (100.0%) |
Disability Class by Sex by Age in Poplar Hills
Disability Class: Hearing Difficulty
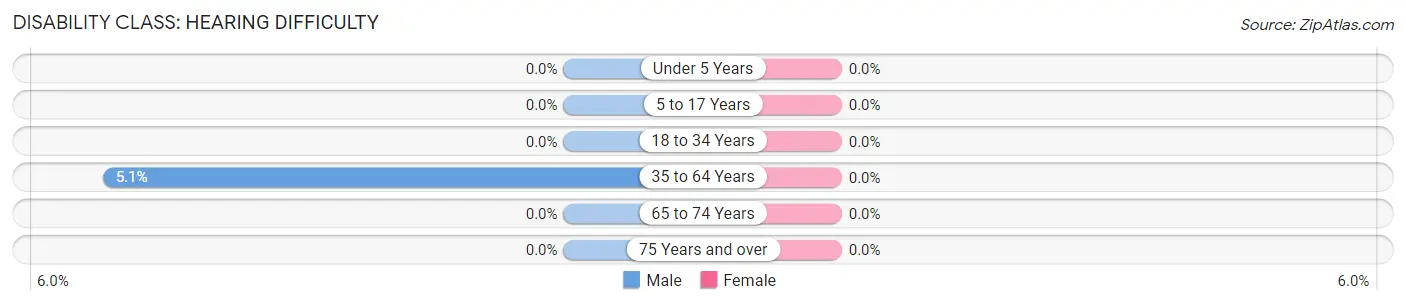
| Age Bracket | Male | Female |
| Under 5 Years | 0 (0.0%) | 0 (0.0%) |
| 5 to 17 Years | 0 (0.0%) | 0 (0.0%) |
| 18 to 34 Years | 0 (0.0%) | 0 (0.0%) |
| 35 to 64 Years | 6 (5.1%) | 0 (0.0%) |
| 65 to 74 Years | 0 (0.0%) | 0 (0.0%) |
| 75 Years and over | 0 (0.0%) | 0 (0.0%) |
Disability Class: Vision Difficulty
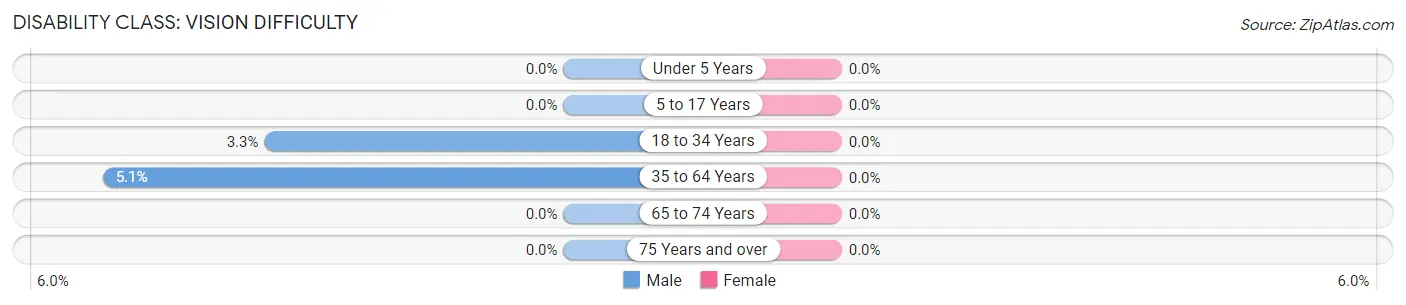
| Age Bracket | Male | Female |
| Under 5 Years | 0 (0.0%) | 0 (0.0%) |
| 5 to 17 Years | 0 (0.0%) | 0 (0.0%) |
| 18 to 34 Years | 2 (3.3%) | 0 (0.0%) |
| 35 to 64 Years | 6 (5.1%) | 0 (0.0%) |
| 65 to 74 Years | 0 (0.0%) | 0 (0.0%) |
| 75 Years and over | 0 (0.0%) | 0 (0.0%) |
Disability Class: Cognitive Difficulty
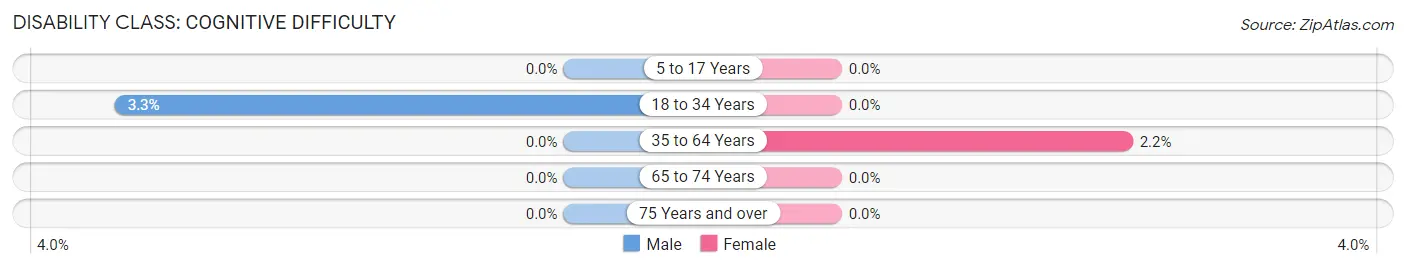
| Age Bracket | Male | Female |
| 5 to 17 Years | 0 (0.0%) | 0 (0.0%) |
| 18 to 34 Years | 2 (3.3%) | 0 (0.0%) |
| 35 to 64 Years | 0 (0.0%) | 3 (2.2%) |
| 65 to 74 Years | 0 (0.0%) | 0 (0.0%) |
| 75 Years and over | 0 (0.0%) | 0 (0.0%) |
Disability Class: Ambulatory Difficulty
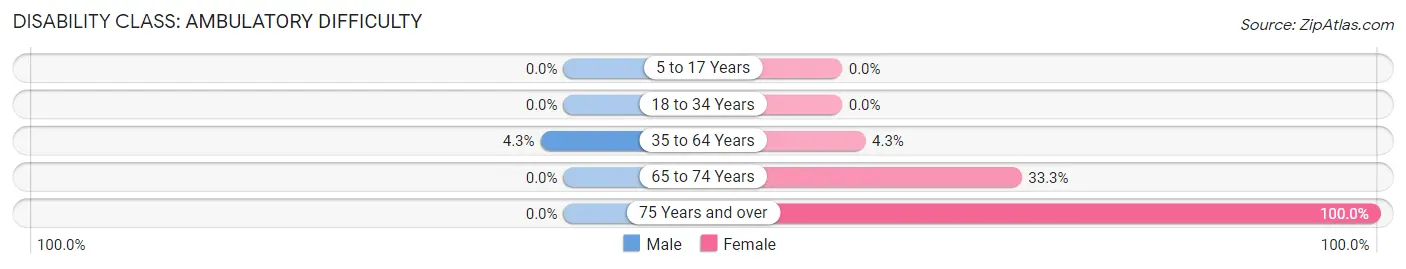
| Age Bracket | Male | Female |
| 5 to 17 Years | 0 (0.0%) | 0 (0.0%) |
| 18 to 34 Years | 0 (0.0%) | 0 (0.0%) |
| 35 to 64 Years | 5 (4.3%) | 6 (4.3%) |
| 65 to 74 Years | 0 (0.0%) | 4 (33.3%) |
| 75 Years and over | 0 (0.0%) | 1 (100.0%) |
Disability Class: Self-Care Difficulty
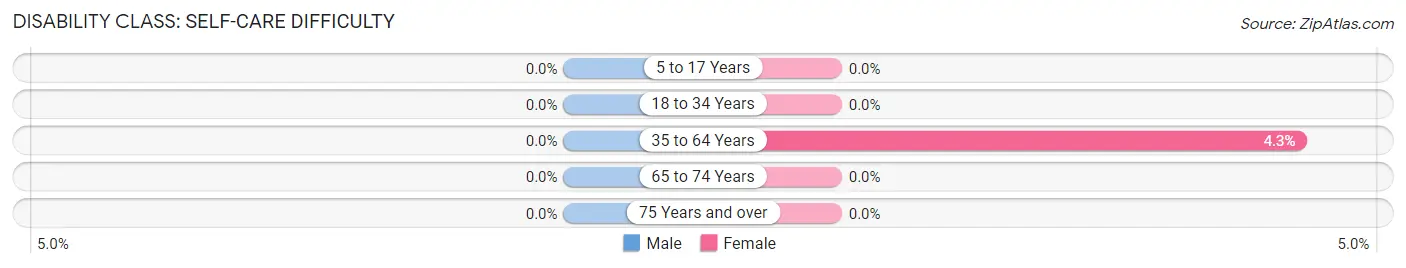
| Age Bracket | Male | Female |
| 5 to 17 Years | 0 (0.0%) | 0 (0.0%) |
| 18 to 34 Years | 0 (0.0%) | 0 (0.0%) |
| 35 to 64 Years | 0 (0.0%) | 6 (4.3%) |
| 65 to 74 Years | 0 (0.0%) | 0 (0.0%) |
| 75 Years and over | 0 (0.0%) | 0 (0.0%) |
Technology Access in Poplar Hills
Computing Device Access in Poplar Hills
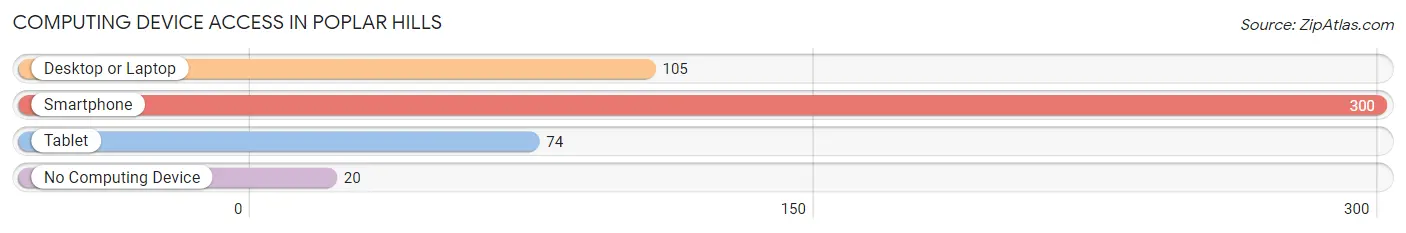
| Device Type | # Households | % Households |
| Desktop or Laptop | 105 | 32.1% |
| Smartphone | 300 | 91.7% |
| Tablet | 74 | 22.6% |
| No Computing Device | 20 | 6.1% |
| Total | 327 | 100.0% |
Internet Access in Poplar Hills
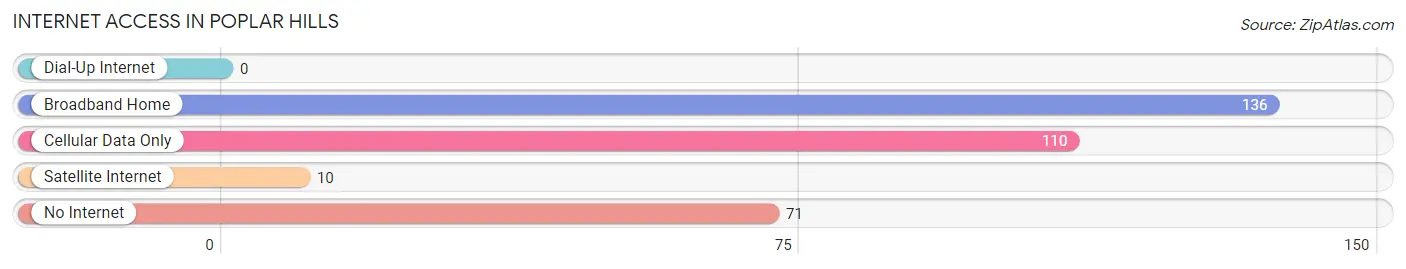
| Internet Type | # Households | % Households |
| Dial-Up Internet | 0 | 0.0% |
| Broadband Home | 136 | 41.6% |
| Cellular Data Only | 110 | 33.6% |
| Satellite Internet | 10 | 3.1% |
| No Internet | 71 | 21.7% |
| Total | 327 | 100.0% |
Poplar Hills Summary
Poplar Hills is a small unincorporated community located in the state of Kentucky, in the United States. It is situated in the western part of the state, in the county of Christian. The population of Poplar Hills was estimated to be around 1,000 people in the year 2000.
Geography
Poplar Hills is located in the western part of Christian County, Kentucky, in the United States. It is situated in the Pennyrile region of the state, which is characterized by rolling hills and valleys. The area is known for its abundance of natural resources, including timber, coal, and limestone. The nearest major city is Hopkinsville, which is located about 20 miles to the east.
The climate in Poplar Hills is generally mild, with temperatures ranging from the mid-30s in the winter to the mid-80s in the summer. The area receives an average of 45 inches of precipitation per year, with most of it falling in the form of rain.
Economy
The economy of Poplar Hills is largely based on agriculture and forestry. The area is home to several farms, which produce a variety of crops, including corn, soybeans, and wheat. The timber industry is also an important part of the local economy, with several sawmills located in the area.
In addition to agriculture and forestry, Poplar Hills is home to several small businesses, including a grocery store, a hardware store, and a few restaurants. The area also has a few manufacturing plants, which produce a variety of products, including furniture and clothing.
Demographics
As of the year 2000, the population of Poplar Hills was estimated to be around 1,000 people. The majority of the population is white, with a small percentage of African Americans and Hispanics. The median household income in the area is around $30,000, and the median age is around 40 years old.
The majority of the population is Christian, with a small percentage of other religions, including Judaism and Islam. The area is served by several churches, including the Poplar Hills Baptist Church and the Poplar Hills United Methodist Church.
Conclusion
Poplar Hills is a small unincorporated community located in the western part of Christian County, Kentucky. The area is known for its abundance of natural resources, including timber, coal, and limestone. The economy of Poplar Hills is largely based on agriculture and forestry, with several small businesses located in the area. The population of Poplar Hills was estimated to be around 1,000 people in the year 2000, with the majority of the population being white. The median household income in the area is around $30,000, and the median age is around 40 years old.
Common Questions
What is Per Capita Income in Poplar Hills?
Per Capita income in Poplar Hills is $18,566.
What is the Median Household income in Poplar Hills?
Median Household Income in Poplar Hills is $21,567.
What is Income or Wage Gap in Poplar Hills?
Income or Wage Gap in Poplar Hills is 9.6%.
Women in Poplar Hills earn 90.4 cents for every dollar earned by a man.
What is Family Income Deficit in Poplar Hills?
Family Income Deficit in Poplar Hills is $14,464.
Families that are below poverty line in Poplar Hills earn $14,464 less on average than the poverty threshold level.
What is Inequality or Gini Index in Poplar Hills?
Inequality or Gini Index in Poplar Hills is 0.43.
What is the Total Population of Poplar Hills?
Total Population of Poplar Hills is 519.
What is the Total Male Population of Poplar Hills?
Total Male Population of Poplar Hills is 248.
What is the Total Female Population of Poplar Hills?
Total Female Population of Poplar Hills is 271.
What is the Ratio of Males per 100 Females in Poplar Hills?
There are 91.51 Males per 100 Females in Poplar Hills.
What is the Ratio of Females per 100 Males in Poplar Hills?
There are 109.27 Females per 100 Males in Poplar Hills.
What is the Median Population Age in Poplar Hills?
Median Population Age in Poplar Hills is 36.8 Years.
What is the Average Family Size in Poplar Hills
Average Family Size in Poplar Hills is 3.1 People.
What is the Average Household Size in Poplar Hills
Average Household Size in Poplar Hills is 1.6 People.
How Large is the Labor Force in Poplar Hills?
There are 286 People in the Labor Forcein in Poplar Hills.
What is the Percentage of People in the Labor Force in Poplar Hills?
72.4% of People are in the Labor Force in Poplar Hills.
What is the Unemployment Rate in Poplar Hills?
Unemployment Rate in Poplar Hills is 1.7%.