Owingsville, KY Map & Demographics
Owingsville Map
Owingsville Overview
$22,636
PER CAPITA INCOME
$48,500
AVG FAMILY INCOME
$38,255
AVG HOUSEHOLD INCOME
22.6%
WAGE / INCOME GAP [ % ]
77.4¢/ $1
WAGE / INCOME GAP [ $ ]
0.45
INEQUALITY / GINI INDEX
1,960
TOTAL POPULATION
842
MALE POPULATION
1,118
FEMALE POPULATION
75.31
MALES / 100 FEMALES
132.78
FEMALES / 100 MALES
38.1
MEDIAN AGE
3.1
AVG FAMILY SIZE
2.2
AVG HOUSEHOLD SIZE
789
LABOR FORCE [ PEOPLE ]
51.0%
PERCENT IN LABOR FORCE
5.2%
UNEMPLOYMENT RATE
Owingsville Zip Codes
Owingsville Area Codes
Income in Owingsville
Income Overview in Owingsville
Per Capita Income in Owingsville is $22,636, while median incomes of families and households are $48,500 and $38,255 respectively.
| Characteristic | Number | Measure |
| Per Capita Income | 1,960 | $22,636 |
| Median Family Income | 490 | $48,500 |
| Mean Family Income | 490 | $64,939 |
| Median Household Income | 882 | $38,255 |
| Mean Household Income | 882 | $49,542 |
| Income Deficit | 490 | $0 |
| Wage / Income Gap (%) | 1,960 | 22.62% |
| Wage / Income Gap ($) | 1,960 | 77.38¢ per $1 |
| Gini / Inequality Index | 1,960 | 0.45 |
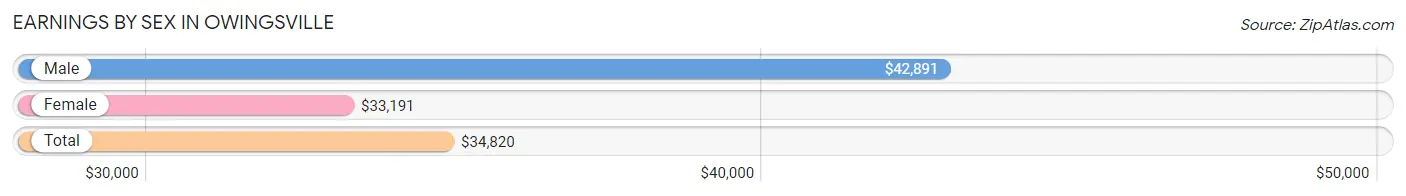
Earnings by Sex in Owingsville
Average Earnings in Owingsville are $34,820, $42,891 for men and $33,191 for women, a difference of 22.6%.
| Sex | Number | Average Earnings |
| Male | 369 (44.2%) | $42,891 |
| Female | 466 (55.8%) | $33,191 |
| Total | 835 (100.0%) | $34,820 |
Earnings by Sex by Income Bracket in Owingsville
The most common earnings brackets in Owingsville are $35,000 to $39,999 for men (55 | 14.9%) and $30,000 to $34,999 for women (119 | 25.5%).

| Income | Male | Female |
| $2,499 or less | 35 (9.5%) | 11 (2.4%) |
| $2,500 to $4,999 | 0 (0.0%) | 10 (2.1%) |
| $5,000 to $7,499 | 2 (0.5%) | 10 (2.1%) |
| $7,500 to $9,999 | 0 (0.0%) | 15 (3.2%) |
| $10,000 to $12,499 | 2 (0.5%) | 0 (0.0%) |
| $12,500 to $14,999 | 38 (10.3%) | 50 (10.7%) |
| $15,000 to $17,499 | 3 (0.8%) | 28 (6.0%) |
| $17,500 to $19,999 | 0 (0.0%) | 20 (4.3%) |
| $20,000 to $22,499 | 0 (0.0%) | 15 (3.2%) |
| $22,500 to $24,999 | 0 (0.0%) | 6 (1.3%) |
| $25,000 to $29,999 | 34 (9.2%) | 17 (3.6%) |
| $30,000 to $34,999 | 10 (2.7%) | 119 (25.5%) |
| $35,000 to $39,999 | 55 (14.9%) | 21 (4.5%) |
| $40,000 to $44,999 | 19 (5.1%) | 28 (6.0%) |
| $45,000 to $49,999 | 54 (14.6%) | 3 (0.6%) |
| $50,000 to $54,999 | 15 (4.1%) | 6 (1.3%) |
| $55,000 to $64,999 | 48 (13.0%) | 52 (11.2%) |
| $65,000 to $74,999 | 0 (0.0%) | 10 (2.1%) |
| $75,000 to $99,999 | 46 (12.5%) | 18 (3.9%) |
| $100,000+ | 8 (2.2%) | 27 (5.8%) |
| Total | 369 (100.0%) | 466 (100.0%) |
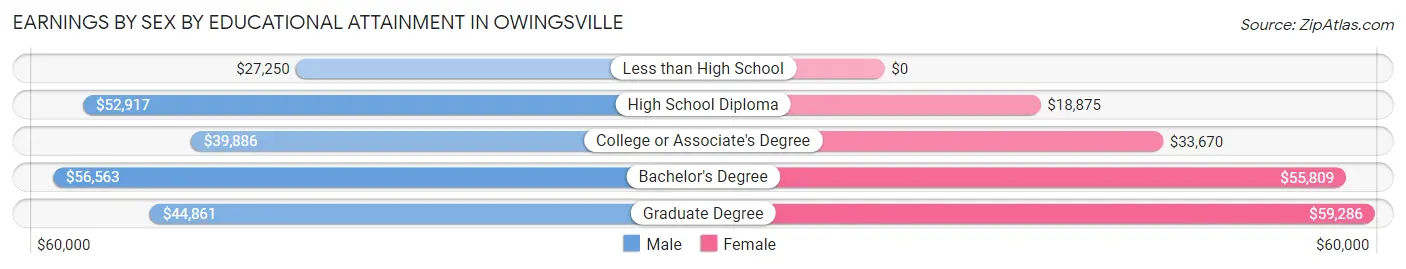
Earnings by Sex by Educational Attainment in Owingsville
Average earnings in Owingsville are $46,197 for men and $33,484 for women, a difference of 27.5%. Men with an educational attainment of bachelor's degree enjoy the highest average annual earnings of $56,563, while those with less than high school education earn the least with $27,250. Women with an educational attainment of graduate degree earn the most with the average annual earnings of $59,286, while those with high school diploma education have the smallest earnings of $18,875.
| Educational Attainment | Male Income | Female Income |
| Less than High School | $27,250 | $0 |
| High School Diploma | $52,917 | $18,875 |
| College or Associate's Degree | $39,886 | $33,670 |
| Bachelor's Degree | $56,563 | $55,809 |
| Graduate Degree | $44,861 | $59,286 |
| Total | $46,197 | $33,484 |
Family Income in Owingsville
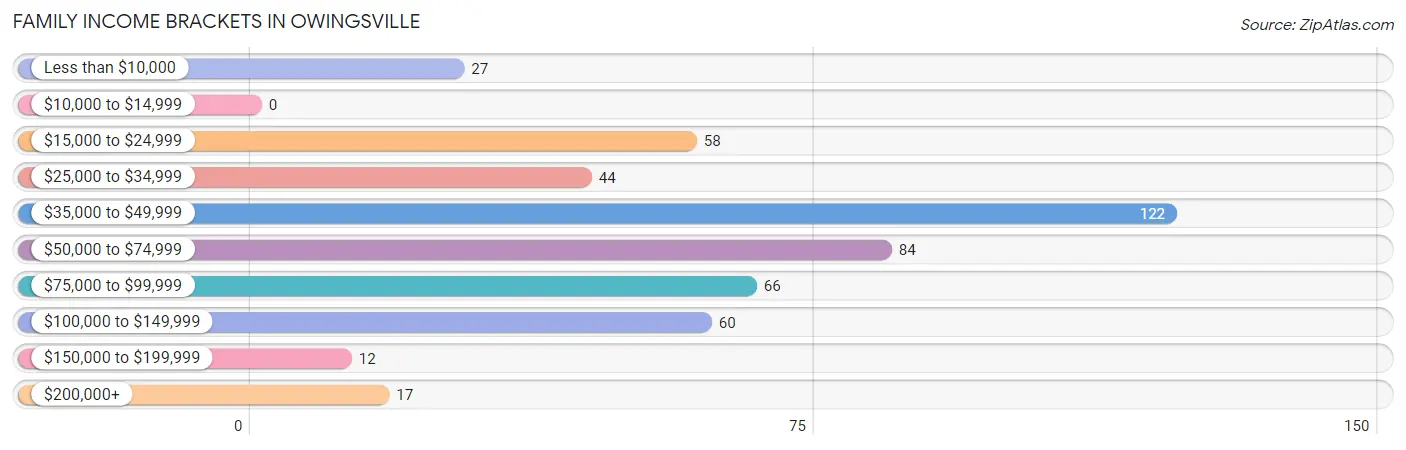
Family Income Brackets in Owingsville
According to the Owingsville family income data, there are 122 families falling into the $35,000 to $49,999 income range, which is the most common income bracket and makes up 24.9% of all families.
| Income Bracket | # Families | % Families |
| Less than $10,000 | 27 | 5.5% |
| $10,000 to $14,999 | 0 | 0.0% |
| $15,000 to $24,999 | 58 | 11.8% |
| $25,000 to $34,999 | 44 | 9.0% |
| $35,000 to $49,999 | 122 | 24.9% |
| $50,000 to $74,999 | 84 | 17.1% |
| $75,000 to $99,999 | 66 | 13.5% |
| $100,000 to $149,999 | 60 | 12.2% |
| $150,000 to $199,999 | 12 | 2.4% |
| $200,000+ | 17 | 3.5% |
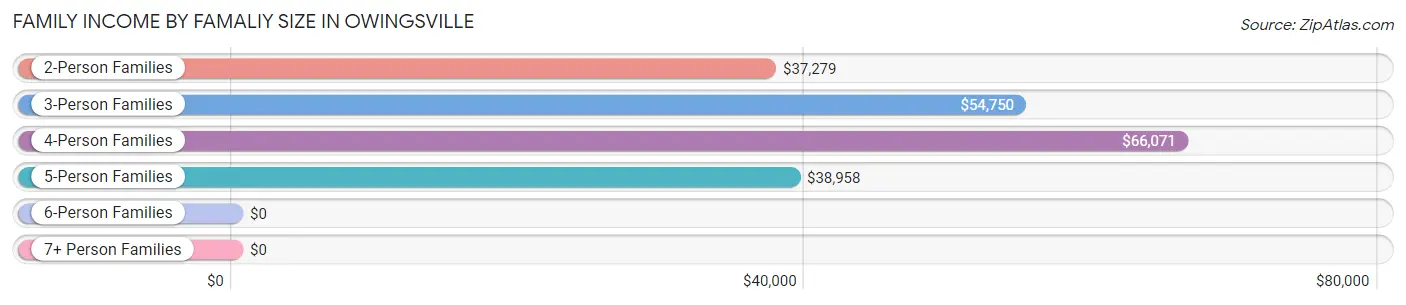
Family Income by Famaliy Size in Owingsville
4-person families (126 | 25.7%) account for the highest median family income in Owingsville with $66,071 per family, while 2-person families (205 | 41.8%) have the highest median income of $18,640 per family member.
| Income Bracket | # Families | Median Income |
| 2-Person Families | 205 (41.8%) | $37,279 |
| 3-Person Families | 103 (21.0%) | $54,750 |
| 4-Person Families | 126 (25.7%) | $66,071 |
| 5-Person Families | 41 (8.4%) | $38,958 |
| 6-Person Families | 12 (2.5%) | $0 |
| 7+ Person Families | 3 (0.6%) | $0 |
| Total | 490 (100.0%) | $48,500 |
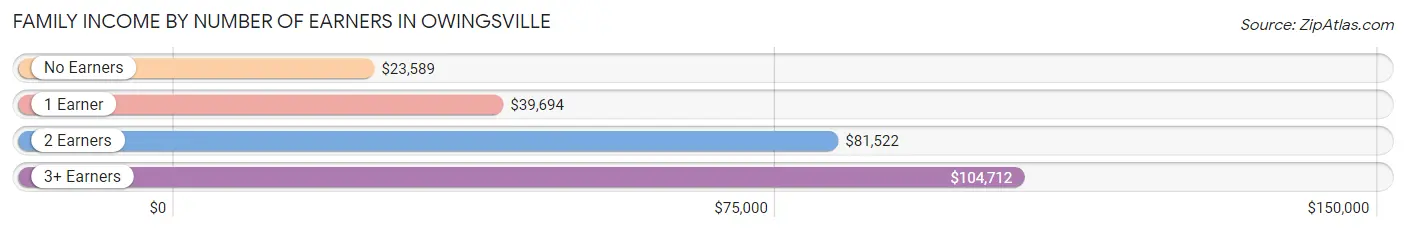
Family Income by Number of Earners in Owingsville
The median family income in Owingsville is $48,500, with families comprising 3+ earners (35) having the highest median family income of $104,712, while families with no earners (71) have the lowest median family income of $23,589, accounting for 7.1% and 14.5% of families, respectively.
| Number of Earners | # Families | Median Income |
| No Earners | 71 (14.5%) | $23,589 |
| 1 Earner | 210 (42.9%) | $39,694 |
| 2 Earners | 174 (35.5%) | $81,522 |
| 3+ Earners | 35 (7.1%) | $104,712 |
| Total | 490 (100.0%) | $48,500 |
Household Income in Owingsville
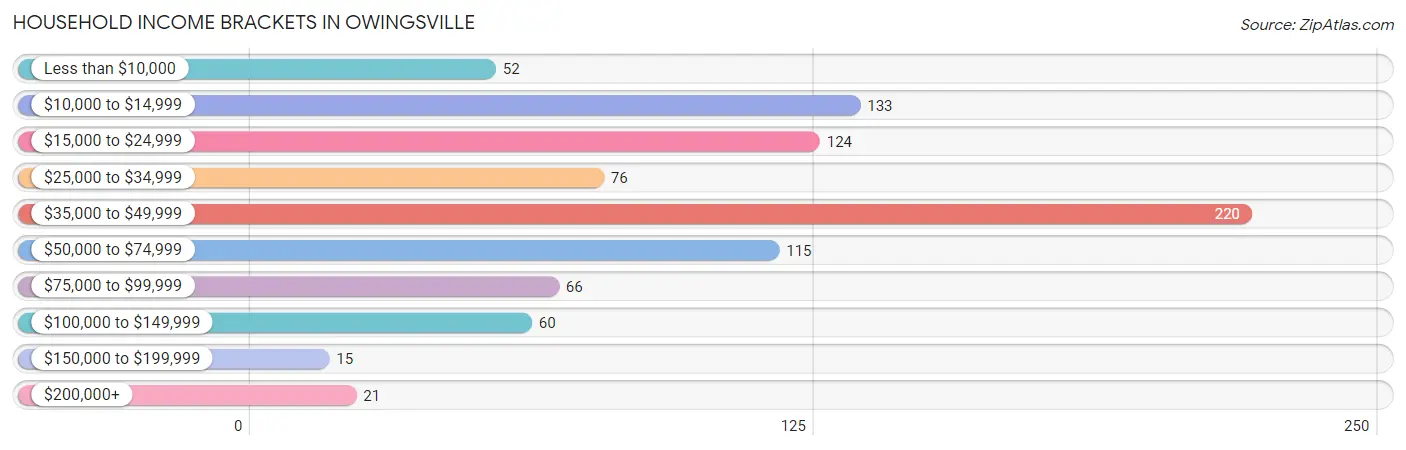
Household Income Brackets in Owingsville
With 220 households falling in the category, the $35,000 to $49,999 income range is the most frequent in Owingsville, accounting for 24.9% of all households. In contrast, only 15 households (1.7%) fall into the $150,000 to $199,999 income bracket, making it the least populous group.
| Income Bracket | # Households | % Households |
| Less than $10,000 | 52 | 5.9% |
| $10,000 to $14,999 | 133 | 15.1% |
| $15,000 to $24,999 | 124 | 14.1% |
| $25,000 to $34,999 | 76 | 8.6% |
| $35,000 to $49,999 | 220 | 24.9% |
| $50,000 to $74,999 | 115 | 13.0% |
| $75,000 to $99,999 | 66 | 7.5% |
| $100,000 to $149,999 | 60 | 6.8% |
| $150,000 to $199,999 | 15 | 1.7% |
| $200,000+ | 21 | 2.4% |
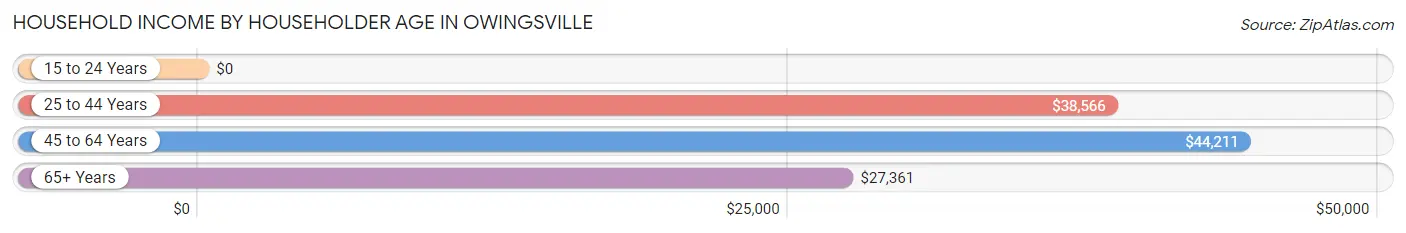
Household Income by Householder Age in Owingsville
The median household income in Owingsville is $38,255, with the highest median household income of $44,211 found in the 45 to 64 years age bracket for the primary householder. A total of 324 households (36.7%) fall into this category.
| Income Bracket | # Households | Median Income |
| 15 to 24 Years | 0 (0.0%) | $0 |
| 25 to 44 Years | 243 (27.6%) | $38,566 |
| 45 to 64 Years | 324 (36.7%) | $44,211 |
| 65+ Years | 315 (35.7%) | $27,361 |
| Total | 882 (100.0%) | $38,255 |
Poverty in Owingsville
Income Below Poverty by Sex and Age in Owingsville
With 12.5% poverty level for males and 23.5% for females among the residents of Owingsville, 35 to 44 year old males and 55 to 64 year old females are the most vulnerable to poverty, with 31 males (25.0%) and 85 females (61.6%) in their respective age groups living below the poverty level.
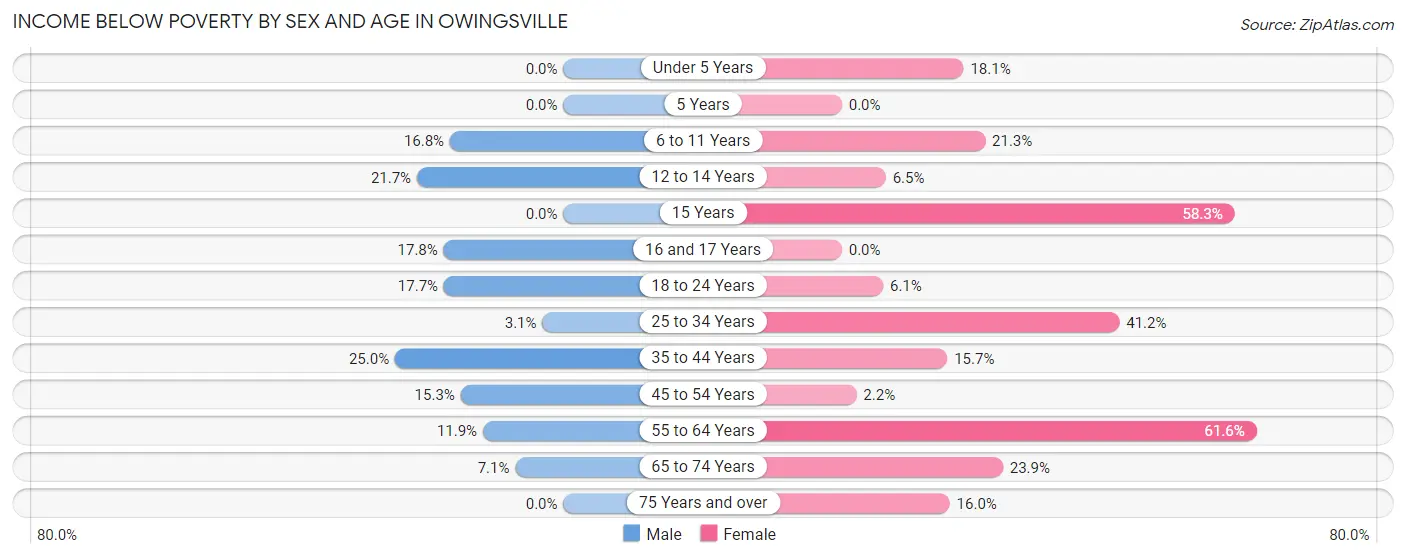
| Age Bracket | Male | Female |
| Under 5 Years | 0 (0.0%) | 15 (18.1%) |
| 5 Years | 0 (0.0%) | 0 (0.0%) |
| 6 to 11 Years | 16 (16.8%) | 10 (21.3%) |
| 12 to 14 Years | 5 (21.7%) | 3 (6.5%) |
| 15 Years | 0 (0.0%) | 7 (58.3%) |
| 16 and 17 Years | 8 (17.8%) | 0 (0.0%) |
| 18 to 24 Years | 11 (17.7%) | 3 (6.1%) |
| 25 to 34 Years | 4 (3.1%) | 68 (41.2%) |
| 35 to 44 Years | 31 (25.0%) | 13 (15.7%) |
| 45 to 54 Years | 18 (15.2%) | 4 (2.2%) |
| 55 to 64 Years | 8 (11.9%) | 85 (61.6%) |
| 65 to 74 Years | 4 (7.1%) | 22 (23.9%) |
| 75 Years and over | 0 (0.0%) | 29 (16.0%) |
| Total | 105 (12.5%) | 259 (23.5%) |
Income Above Poverty by Sex and Age in Owingsville
According to the poverty statistics in Owingsville, males aged under 5 years and females aged 16 and 17 years are the age groups that are most secure financially, with 100.0% of males and 100.0% of females in these age groups living above the poverty line.
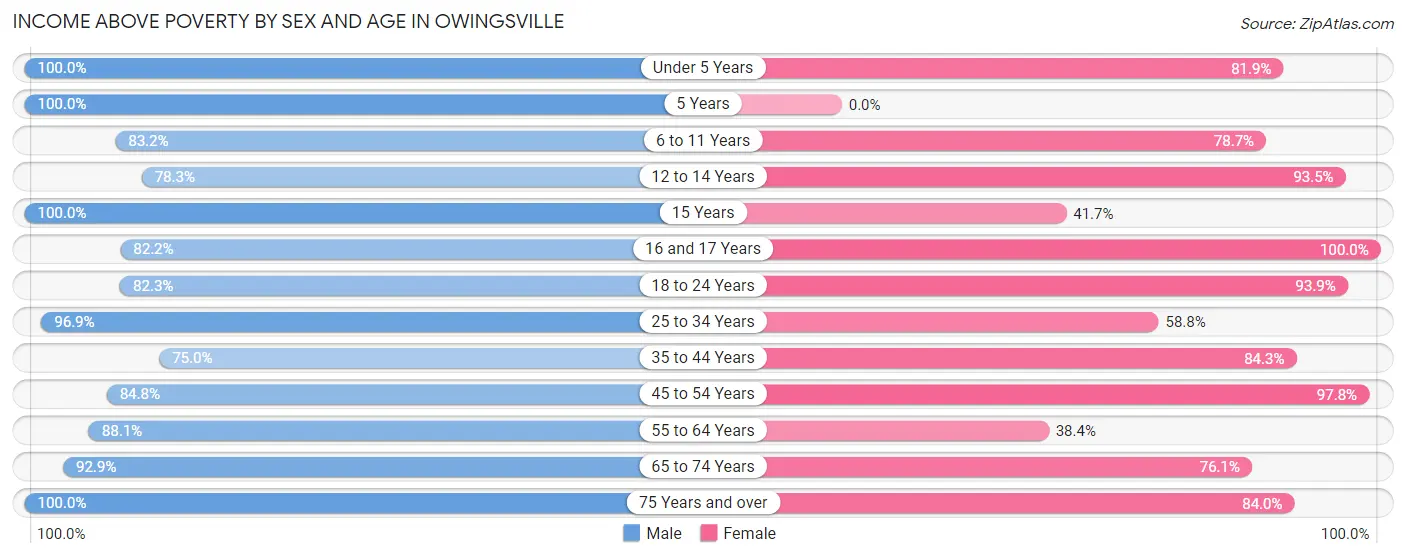
| Age Bracket | Male | Female |
| Under 5 Years | 54 (100.0%) | 68 (81.9%) |
| 5 Years | 13 (100.0%) | 0 (0.0%) |
| 6 to 11 Years | 79 (83.2%) | 37 (78.7%) |
| 12 to 14 Years | 18 (78.3%) | 43 (93.5%) |
| 15 Years | 24 (100.0%) | 5 (41.7%) |
| 16 and 17 Years | 37 (82.2%) | 23 (100.0%) |
| 18 to 24 Years | 51 (82.3%) | 46 (93.9%) |
| 25 to 34 Years | 124 (96.9%) | 97 (58.8%) |
| 35 to 44 Years | 93 (75.0%) | 70 (84.3%) |
| 45 to 54 Years | 100 (84.8%) | 180 (97.8%) |
| 55 to 64 Years | 59 (88.1%) | 53 (38.4%) |
| 65 to 74 Years | 52 (92.9%) | 70 (76.1%) |
| 75 Years and over | 33 (100.0%) | 152 (84.0%) |
| Total | 737 (87.5%) | 844 (76.5%) |
Income Below Poverty Among Married-Couple Families in Owingsville
The poverty statistics for married-couple families in Owingsville show that 2.6% or 8 of the total 304 families live below the poverty line. Families with 1 or 2 children have the highest poverty rate of 3.3%, comprising of 4 families. On the other hand, families with 3 or 4 children have the lowest poverty rate of 0.0%, which includes 0 families.
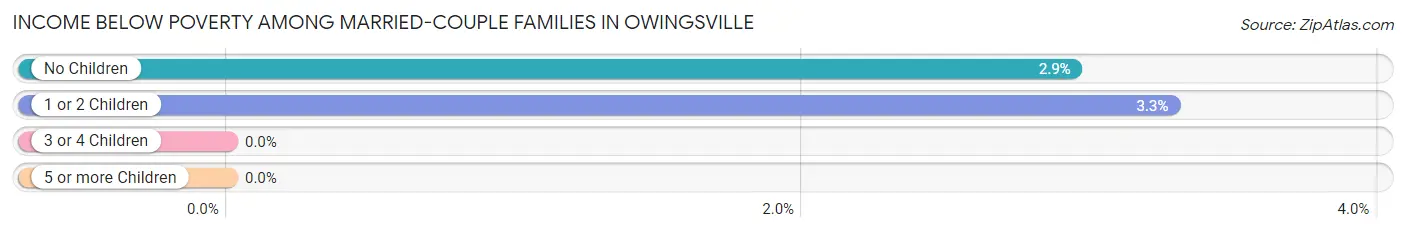
| Children | Above Poverty | Below Poverty |
| No Children | 132 (97.1%) | 4 (2.9%) |
| 1 or 2 Children | 118 (96.7%) | 4 (3.3%) |
| 3 or 4 Children | 46 (100.0%) | 0 (0.0%) |
| 5 or more Children | 0 (0.0%) | 0 (0.0%) |
| Total | 296 (97.4%) | 8 (2.6%) |
Income Below Poverty Among Single-Parent Households in Owingsville
According to the poverty data in Owingsville, 23.7% or 14 single-father households and 33.1% or 42 single-mother households are living below the poverty line. Among single-father households, those with 1 or 2 children have the highest poverty rate, with 14 households (50.0%) experiencing poverty. Likewise, among single-mother households, those with 1 or 2 children have the highest poverty rate, with 32 households (42.1%) falling below the poverty line.
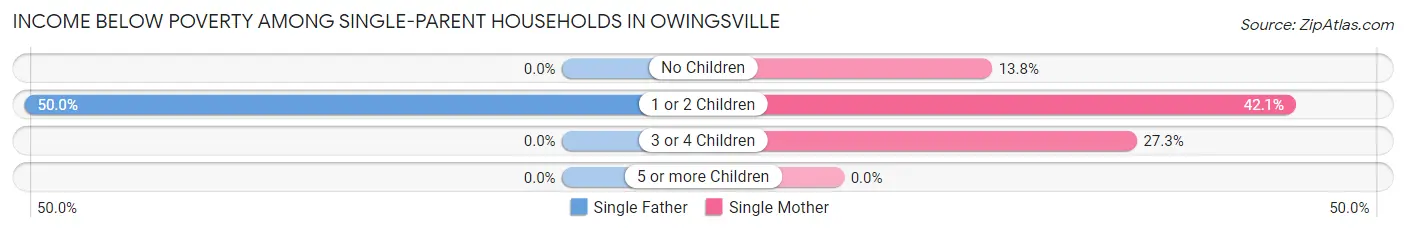
| Children | Single Father | Single Mother |
| No Children | 0 (0.0%) | 4 (13.8%) |
| 1 or 2 Children | 14 (50.0%) | 32 (42.1%) |
| 3 or 4 Children | 0 (0.0%) | 6 (27.3%) |
| 5 or more Children | 0 (0.0%) | 0 (0.0%) |
| Total | 14 (23.7%) | 42 (33.1%) |
Income Below Poverty Among Married-Couple vs Single-Parent Households in Owingsville
The poverty data for Owingsville shows that 8 of the married-couple family households (2.6%) and 56 of the single-parent households (30.1%) are living below the poverty level. Within the married-couple family households, those with 1 or 2 children have the highest poverty rate, with 4 households (3.3%) falling below the poverty line. Among the single-parent households, those with 1 or 2 children have the highest poverty rate, with 46 household (44.2%) living below poverty.
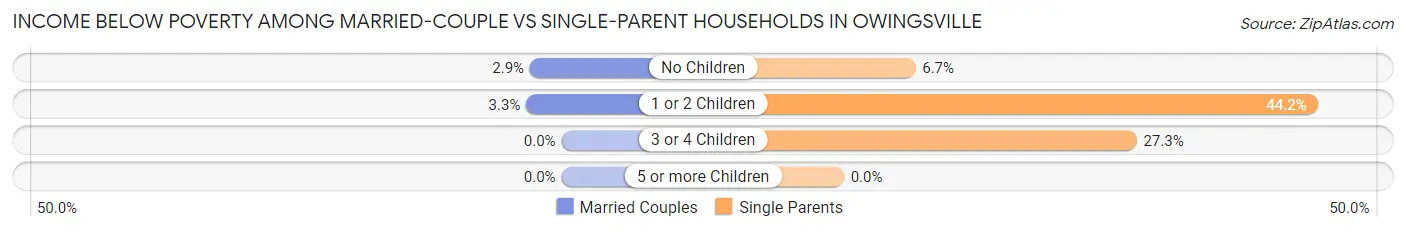
| Children | Married-Couple Families | Single-Parent Households |
| No Children | 4 (2.9%) | 4 (6.7%) |
| 1 or 2 Children | 4 (3.3%) | 46 (44.2%) |
| 3 or 4 Children | 0 (0.0%) | 6 (27.3%) |
| 5 or more Children | 0 (0.0%) | 0 (0.0%) |
| Total | 8 (2.6%) | 56 (30.1%) |
Race in Owingsville
The most populous races in Owingsville are White / Caucasian (1,859 | 94.9%), Black / African American (56 | 2.9%), and Two or more Races (42 | 2.1%).
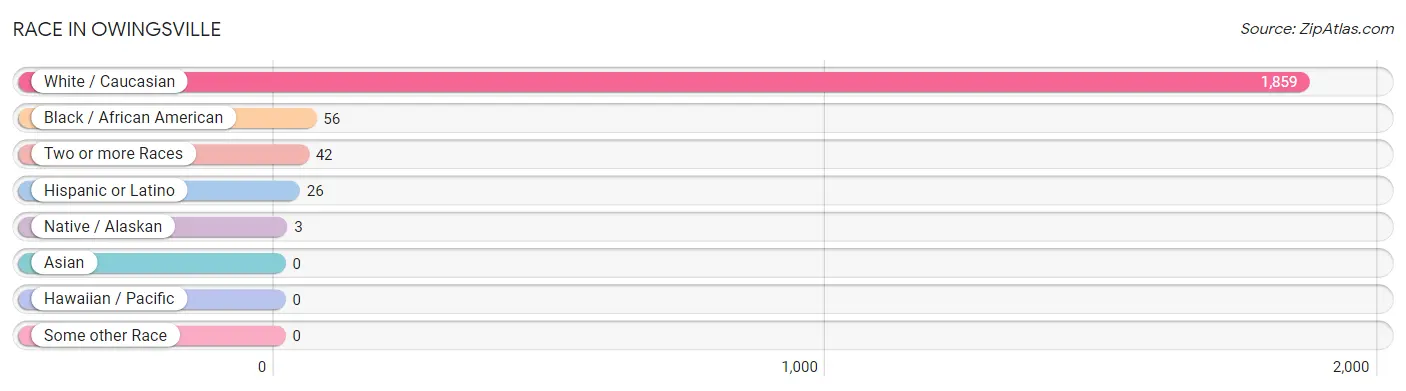
| Race | # Population | % Population |
| Asian | 0 | 0.0% |
| Black / African American | 56 | 2.9% |
| Hawaiian / Pacific | 0 | 0.0% |
| Hispanic or Latino | 26 | 1.3% |
| Native / Alaskan | 3 | 0.2% |
| White / Caucasian | 1,859 | 94.9% |
| Two or more Races | 42 | 2.1% |
| Some other Race | 0 | 0.0% |
| Total | 1,960 | 100.0% |
Ancestry in Owingsville
The most populous ancestries reported in Owingsville are American (851 | 43.4%), Irish (324 | 16.5%), English (258 | 13.2%), German (197 | 10.1%), and Polish (57 | 2.9%), together accounting for 86.1% of all Owingsville residents.
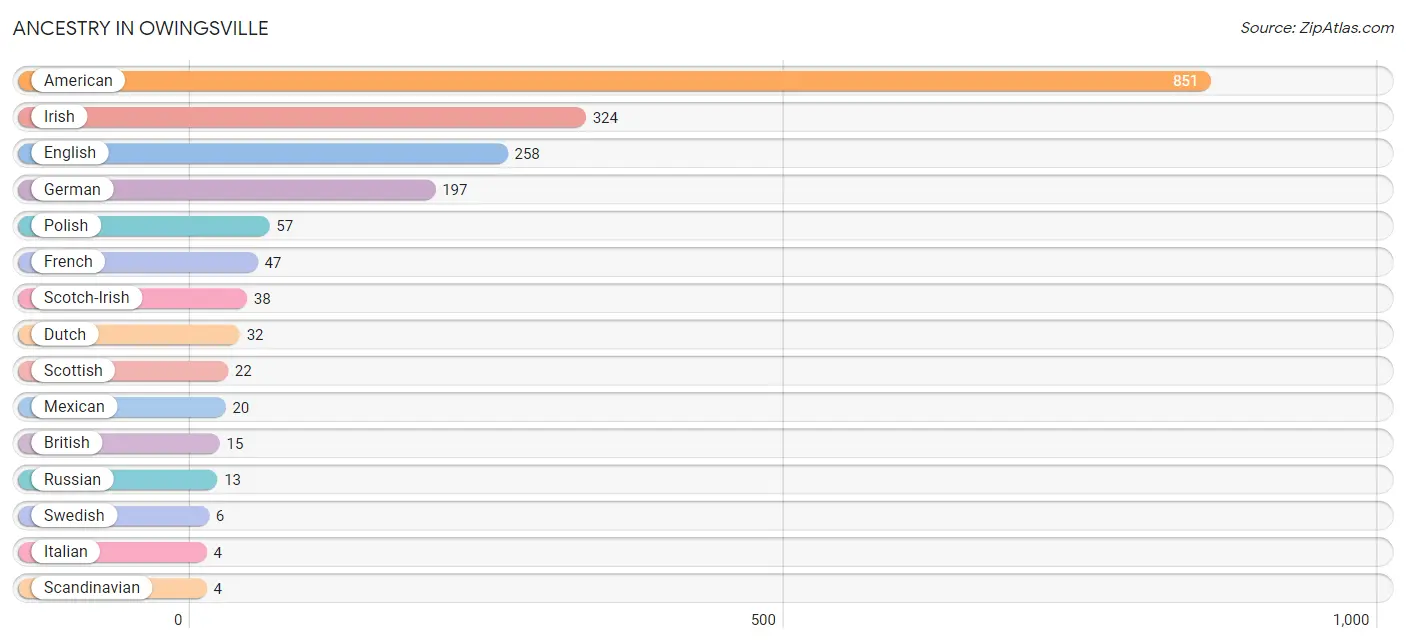
| Ancestry | # Population | % Population |
| American | 851 | 43.4% |
| British | 15 | 0.8% |
| Dutch | 32 | 1.6% |
| English | 258 | 13.2% |
| European | 3 | 0.2% |
| French | 47 | 2.4% |
| German | 197 | 10.1% |
| Irish | 324 | 16.5% |
| Italian | 4 | 0.2% |
| Mexican | 20 | 1.0% |
| Polish | 57 | 2.9% |
| Russian | 13 | 0.7% |
| Scandinavian | 4 | 0.2% |
| Scotch-Irish | 38 | 1.9% |
| Scottish | 22 | 1.1% |
| Swedish | 6 | 0.3% |
| Tohono O'Odham | 3 | 0.2% | View All 17 Rows |
Immigrants in Owingsville

| Immigration Origin | # Population | % Population | View All 0 Rows |
Sex and Age in Owingsville
Sex and Age in Owingsville
The most populous age groups in Owingsville are 30 to 34 Years (115 | 13.7%) for men and 75 to 79 Years (116 | 10.4%) for women.
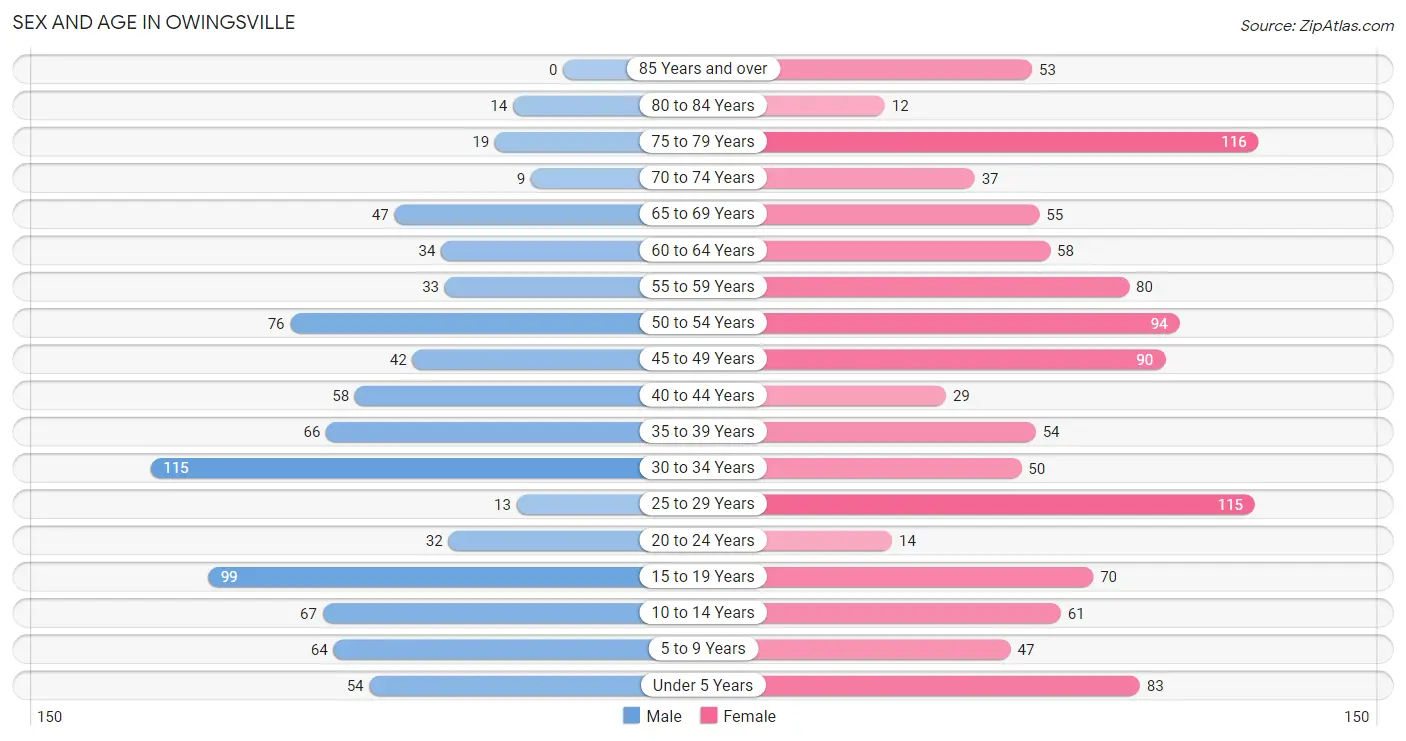
| Age Bracket | Male | Female |
| Under 5 Years | 54 (6.4%) | 83 (7.4%) |
| 5 to 9 Years | 64 (7.6%) | 47 (4.2%) |
| 10 to 14 Years | 67 (8.0%) | 61 (5.5%) |
| 15 to 19 Years | 99 (11.8%) | 70 (6.3%) |
| 20 to 24 Years | 32 (3.8%) | 14 (1.3%) |
| 25 to 29 Years | 13 (1.5%) | 115 (10.3%) |
| 30 to 34 Years | 115 (13.7%) | 50 (4.5%) |
| 35 to 39 Years | 66 (7.8%) | 54 (4.8%) |
| 40 to 44 Years | 58 (6.9%) | 29 (2.6%) |
| 45 to 49 Years | 42 (5.0%) | 90 (8.1%) |
| 50 to 54 Years | 76 (9.0%) | 94 (8.4%) |
| 55 to 59 Years | 33 (3.9%) | 80 (7.2%) |
| 60 to 64 Years | 34 (4.0%) | 58 (5.2%) |
| 65 to 69 Years | 47 (5.6%) | 55 (4.9%) |
| 70 to 74 Years | 9 (1.1%) | 37 (3.3%) |
| 75 to 79 Years | 19 (2.3%) | 116 (10.4%) |
| 80 to 84 Years | 14 (1.7%) | 12 (1.1%) |
| 85 Years and over | 0 (0.0%) | 53 (4.7%) |
| Total | 842 (100.0%) | 1,118 (100.0%) |
Families and Households in Owingsville
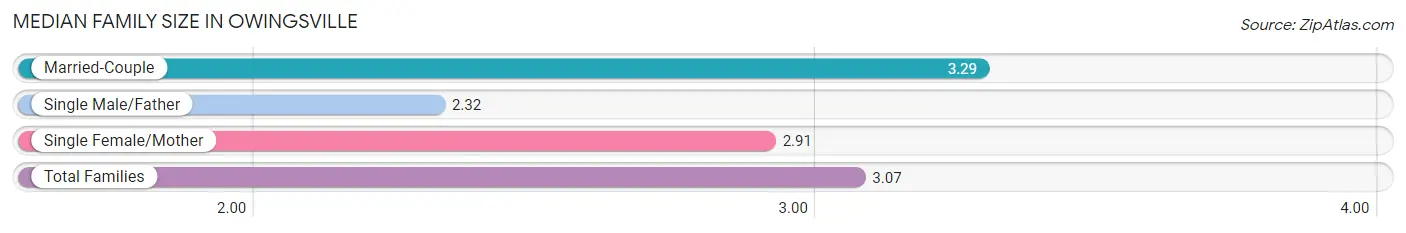
Median Family Size in Owingsville
The median family size in Owingsville is 3.07 persons per family, with married-couple families (304 | 62.0%) accounting for the largest median family size of 3.29 persons per family. On the other hand, single male/father families (59 | 12.0%) represent the smallest median family size with 2.32 persons per family.
| Family Type | # Families | Family Size |
| Married-Couple | 304 (62.0%) | 3.29 |
| Single Male/Father | 59 (12.0%) | 2.32 |
| Single Female/Mother | 127 (25.9%) | 2.91 |
| Total Families | 490 (100.0%) | 3.07 |
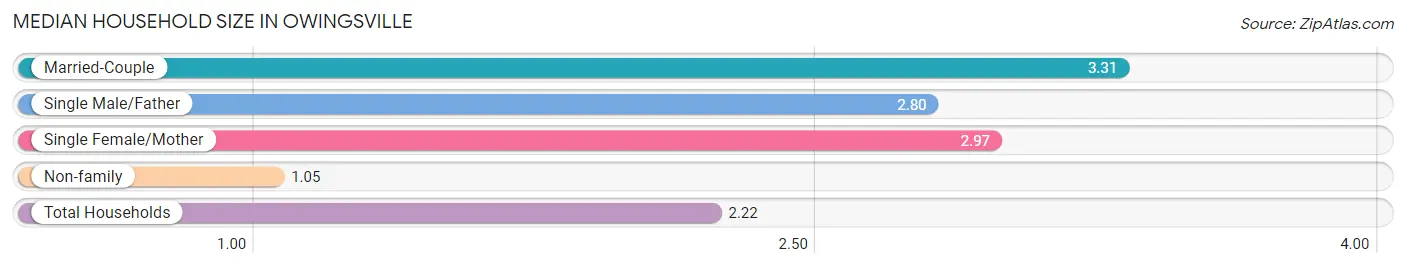
Median Household Size in Owingsville
The median household size in Owingsville is 2.22 persons per household, with married-couple households (304 | 34.5%) accounting for the largest median household size of 3.31 persons per household. non-family households (392 | 44.4%) represent the smallest median household size with 1.05 persons per household.
| Household Type | # Households | Household Size |
| Married-Couple | 304 (34.5%) | 3.31 |
| Single Male/Father | 59 (6.7%) | 2.80 |
| Single Female/Mother | 127 (14.4%) | 2.97 |
| Non-family | 392 (44.4%) | 1.05 |
| Total Households | 882 (100.0%) | 2.22 |
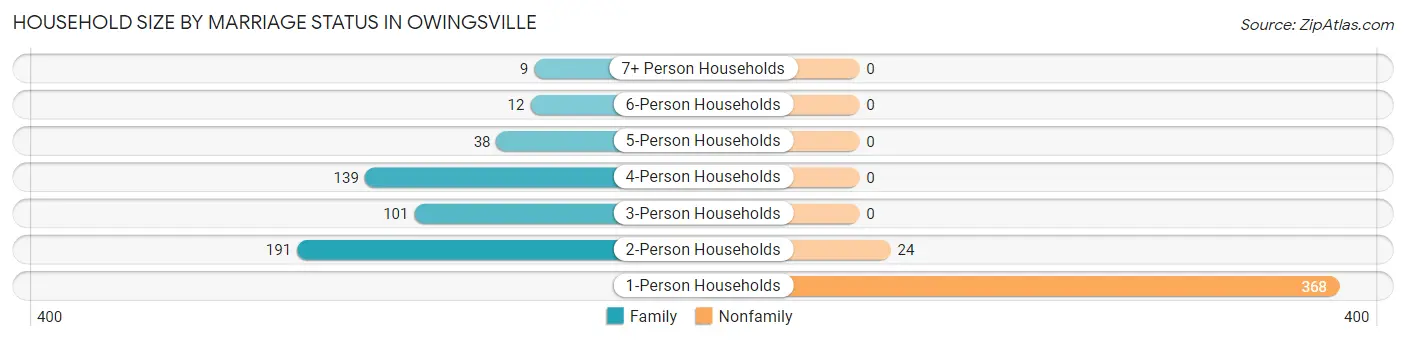
Household Size by Marriage Status in Owingsville
Out of a total of 882 households in Owingsville, 490 (55.6%) are family households, while 392 (44.4%) are nonfamily households. The most numerous type of family households are 2-person households, comprising 191, and the most common type of nonfamily households are 1-person households, comprising 368.
| Household Size | Family Households | Nonfamily Households |
| 1-Person Households | - | 368 (41.7%) |
| 2-Person Households | 191 (21.7%) | 24 (2.7%) |
| 3-Person Households | 101 (11.5%) | 0 (0.0%) |
| 4-Person Households | 139 (15.8%) | 0 (0.0%) |
| 5-Person Households | 38 (4.3%) | 0 (0.0%) |
| 6-Person Households | 12 (1.4%) | 0 (0.0%) |
| 7+ Person Households | 9 (1.0%) | 0 (0.0%) |
| Total | 490 (55.6%) | 392 (44.4%) |
Female Fertility in Owingsville
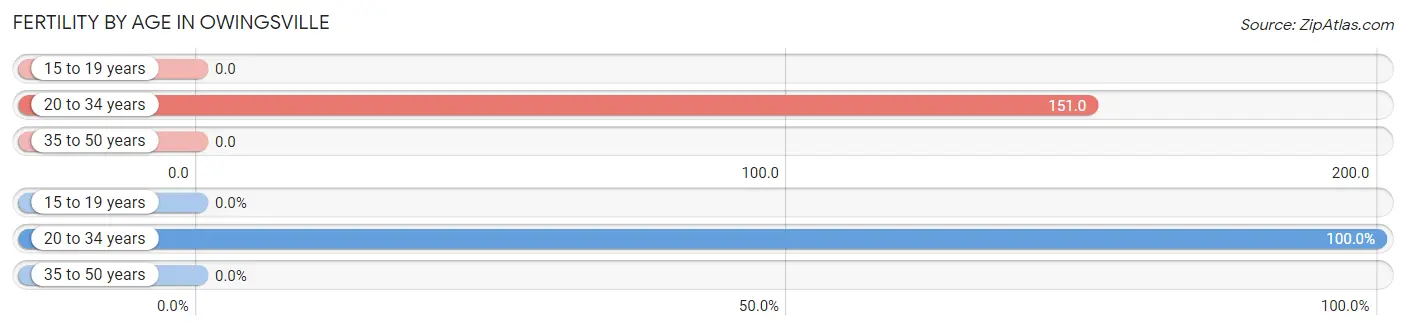
Fertility by Age in Owingsville
Average fertility rate in Owingsville is 62.0 births per 1,000 women. Women in the age bracket of 20 to 34 years have the highest fertility rate with 151.0 births per 1,000 women. Women in the age bracket of 20 to 34 years acount for 100.0% of all women with births.
| Age Bracket | Women with Births | Births / 1,000 Women |
| 15 to 19 years | 0 (0.0%) | 0.0 |
| 20 to 34 years | 27 (100.0%) | 151.0 |
| 35 to 50 years | 0 (0.0%) | 0.0 |
| Total | 27 (100.0%) | 62.0 |
Fertility by Age by Marriage Status in Owingsville
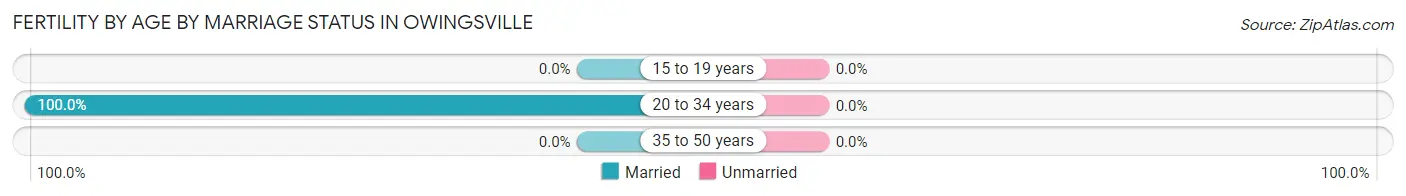
| Age Bracket | Married | Unmarried |
| 15 to 19 years | 0 (0.0%) | 0 (0.0%) |
| 20 to 34 years | 27 (100.0%) | 0 (0.0%) |
| 35 to 50 years | 0 (0.0%) | 0 (0.0%) |
| Total | 27 (100.0%) | 0 (0.0%) |
Fertility by Education in Owingsville
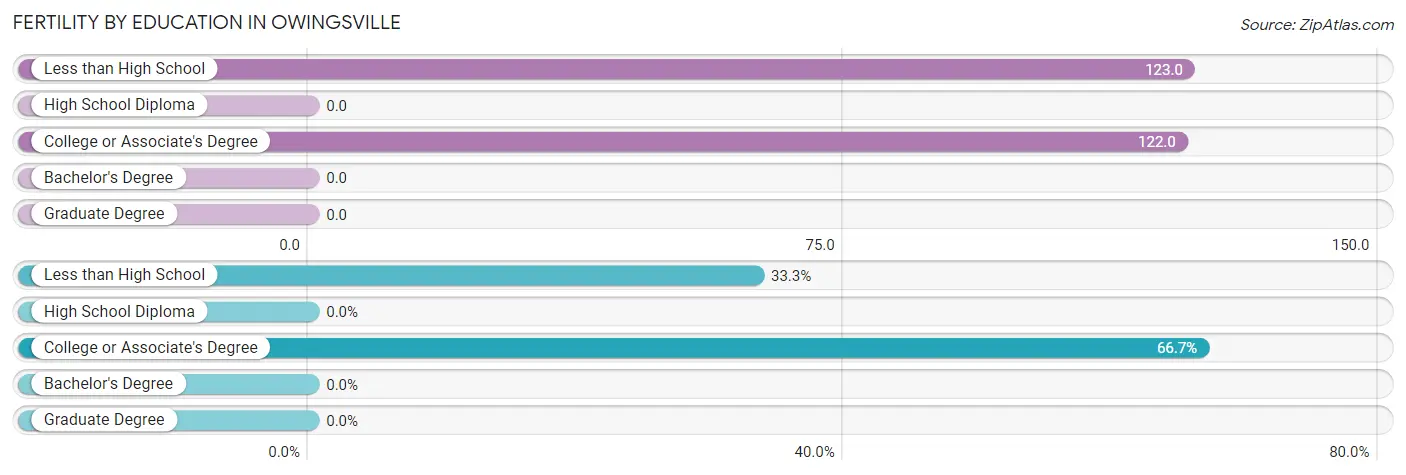
| Educational Attainment | Women with Births | Births / 1,000 Women |
| Less than High School | 9 (33.3%) | 123.0 |
| High School Diploma | 0 (0.0%) | 0.0 |
| College or Associate's Degree | 18 (66.7%) | 122.0 |
| Bachelor's Degree | 0 (0.0%) | 0.0 |
| Graduate Degree | 0 (0.0%) | 0.0 |
| Total | 27 (100.0%) | 62.0 |
Fertility by Education by Marriage Status in Owingsville
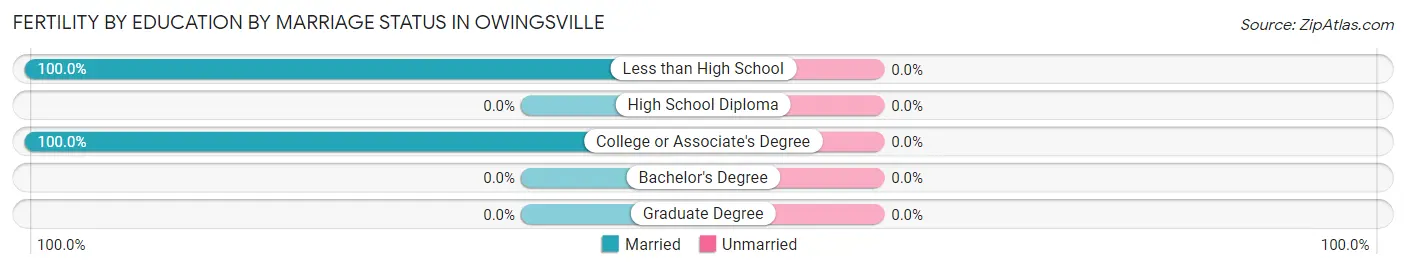
| Educational Attainment | Married | Unmarried |
| Less than High School | 9 (100.0%) | 0 (0.0%) |
| High School Diploma | 0 (0.0%) | 0 (0.0%) |
| College or Associate's Degree | 18 (100.0%) | 0 (0.0%) |
| Bachelor's Degree | 0 (0.0%) | 0 (0.0%) |
| Graduate Degree | 0 (0.0%) | 0 (0.0%) |
| Total | 27 (100.0%) | 0 (0.0%) |
Employment Characteristics in Owingsville
Employment by Class of Employer in Owingsville
Among the 733 employed individuals in Owingsville, private company employees (413 | 56.3%), state government employees (120 | 16.4%), and self-employed (not incorporated) (63 | 8.6%) make up the most common classes of employment.
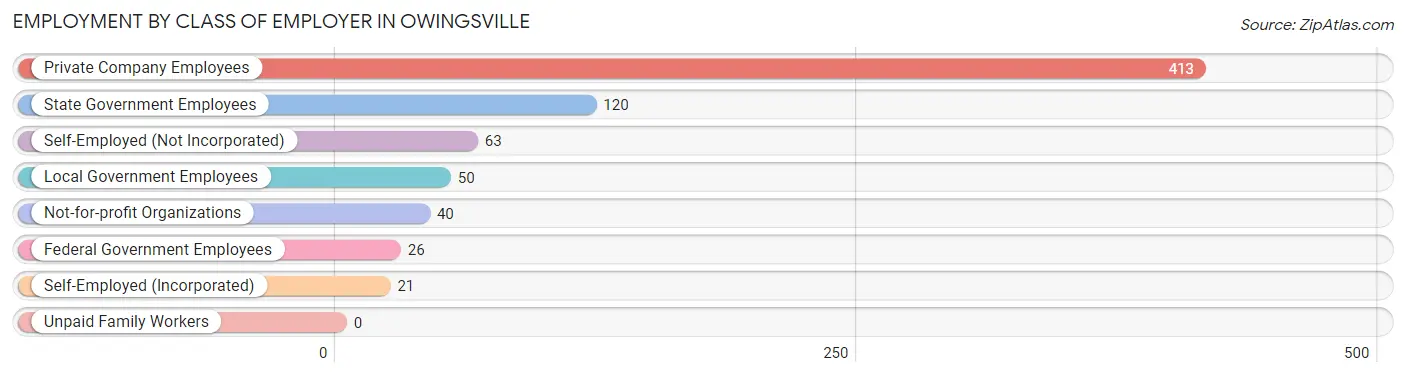
| Employer Class | # Employees | % Employees |
| Private Company Employees | 413 | 56.3% |
| Self-Employed (Incorporated) | 21 | 2.9% |
| Self-Employed (Not Incorporated) | 63 | 8.6% |
| Not-for-profit Organizations | 40 | 5.5% |
| Local Government Employees | 50 | 6.8% |
| State Government Employees | 120 | 16.4% |
| Federal Government Employees | 26 | 3.5% |
| Unpaid Family Workers | 0 | 0.0% |
| Total | 733 | 100.0% |
Employment Status by Age in Owingsville
According to the labor force statistics for Owingsville, out of the total population over 16 years of age (1,548), 51.0% or 789 individuals are in the labor force, with 5.2% or 41 of them unemployed. The age group with the highest labor force participation rate is 45 to 54 years, with 80.1% or 242 individuals in the labor force. Within the labor force, the 16 to 19 years age range has the highest percentage of unemployed individuals, with 53.6% or 30 of them being unemployed.
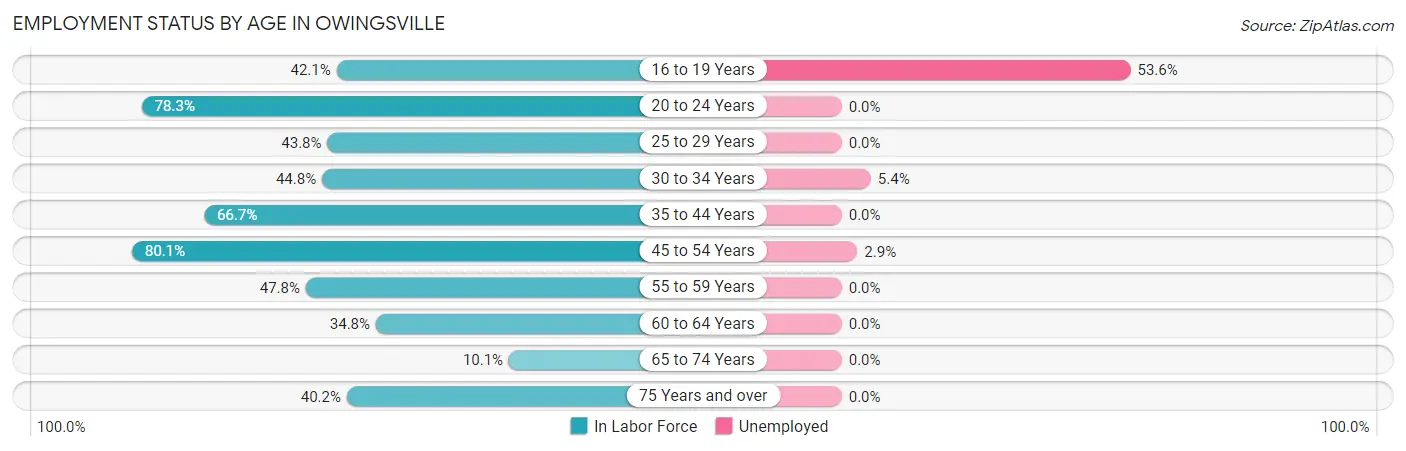
| Age Bracket | In Labor Force | Unemployed |
| 16 to 19 Years | 56 (42.1%) | 30 (53.6%) |
| 20 to 24 Years | 36 (78.3%) | 0 (0.0%) |
| 25 to 29 Years | 56 (43.8%) | 0 (0.0%) |
| 30 to 34 Years | 74 (44.8%) | 4 (5.4%) |
| 35 to 44 Years | 138 (66.7%) | 0 (0.0%) |
| 45 to 54 Years | 242 (80.1%) | 7 (2.9%) |
| 55 to 59 Years | 54 (47.8%) | 0 (0.0%) |
| 60 to 64 Years | 32 (34.8%) | 0 (0.0%) |
| 65 to 74 Years | 15 (10.1%) | 0 (0.0%) |
| 75 Years and over | 86 (40.2%) | 0 (0.0%) |
| Total | 789 (51.0%) | 41 (5.2%) |
Employment Status by Educational Attainment in Owingsville
According to labor force statistics for Owingsville, 59.2% of individuals (596) out of the total population between 25 and 64 years of age (1,007) are in the labor force, with 1.8% or 11 of them being unemployed. The group with the highest labor force participation rate are those with the educational attainment of bachelor's degree or higher, with 91.1% or 113 individuals in the labor force. Within the labor force, individuals with bachelor's degree or higher education have the highest percentage of unemployment, with 2.7% or 3 of them being unemployed.
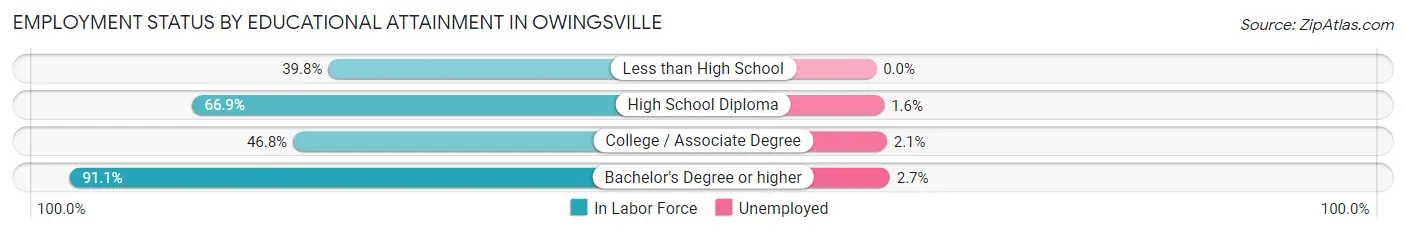
| Educational Attainment | In Labor Force | Unemployed |
| Less than High School | 35 (39.8%) | 0 (0.0%) |
| High School Diploma | 253 (66.9%) | 6 (1.6%) |
| College / Associate Degree | 195 (46.8%) | 9 (2.1%) |
| Bachelor's Degree or higher | 113 (91.1%) | 3 (2.7%) |
| Total | 596 (59.2%) | 18 (1.8%) |
Employment Occupations by Sex in Owingsville
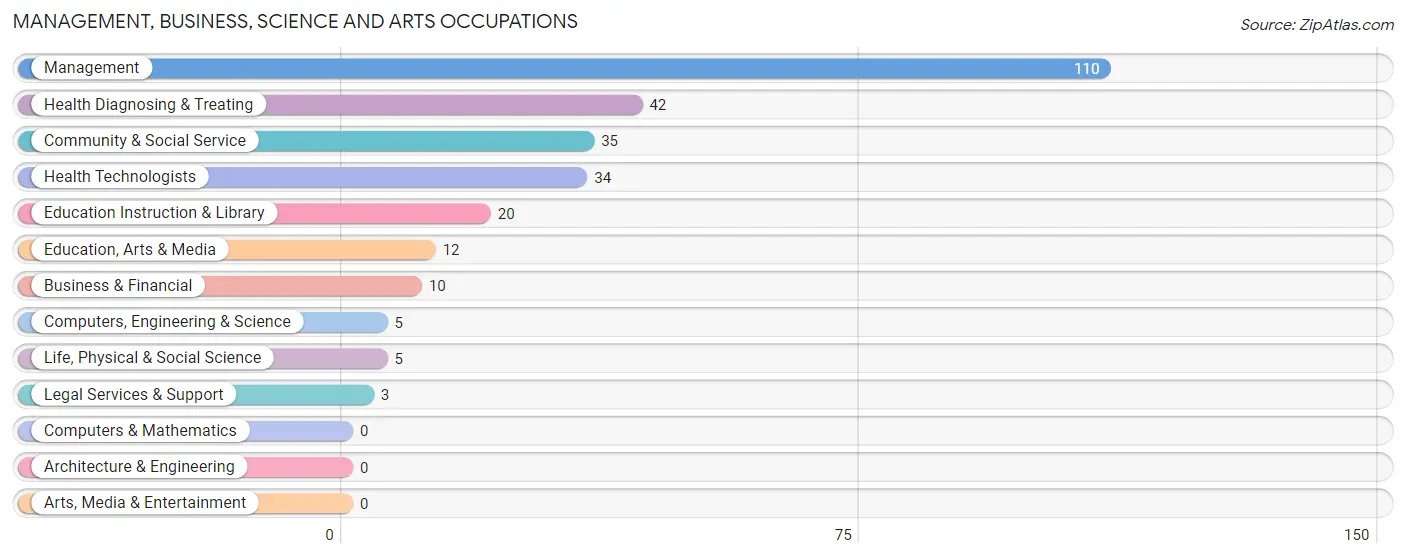
Management, Business, Science and Arts Occupations
The most common Management, Business, Science and Arts occupations in Owingsville are Management (110 | 14.7%), Health Diagnosing & Treating (42 | 5.6%), Community & Social Service (35 | 4.7%), Health Technologists (34 | 4.5%), and Education Instruction & Library (20 | 2.7%).
Management, Business, Science and Arts Occupations by Sex
Within the Management, Business, Science and Arts occupations in Owingsville, the most male-oriented occupations are Computers, Engineering & Science (100.0%), Life, Physical & Social Science (100.0%), and Legal Services & Support (100.0%), while the most female-oriented occupations are Business & Financial (100.0%), Health Diagnosing & Treating (100.0%), and Health Technologists (100.0%).
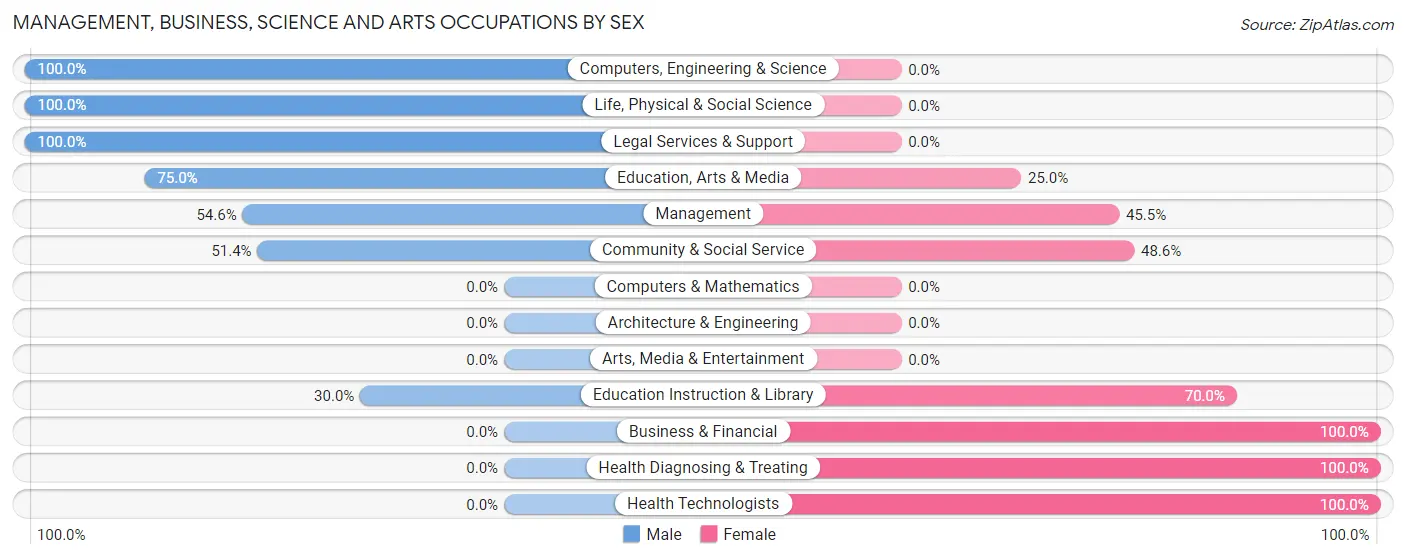
| Occupation | Male | Female |
| Management | 60 (54.5%) | 50 (45.5%) |
| Business & Financial | 0 (0.0%) | 10 (100.0%) |
| Computers, Engineering & Science | 5 (100.0%) | 0 (0.0%) |
| Computers & Mathematics | 0 (0.0%) | 0 (0.0%) |
| Architecture & Engineering | 0 (0.0%) | 0 (0.0%) |
| Life, Physical & Social Science | 5 (100.0%) | 0 (0.0%) |
| Community & Social Service | 18 (51.4%) | 17 (48.6%) |
| Education, Arts & Media | 9 (75.0%) | 3 (25.0%) |
| Legal Services & Support | 3 (100.0%) | 0 (0.0%) |
| Education Instruction & Library | 6 (30.0%) | 14 (70.0%) |
| Arts, Media & Entertainment | 0 (0.0%) | 0 (0.0%) |
| Health Diagnosing & Treating | 0 (0.0%) | 42 (100.0%) |
| Health Technologists | 0 (0.0%) | 34 (100.0%) |
| Total (Category) | 83 (41.1%) | 119 (58.9%) |
| Total (Overall) | 316 (42.2%) | 432 (57.8%) |
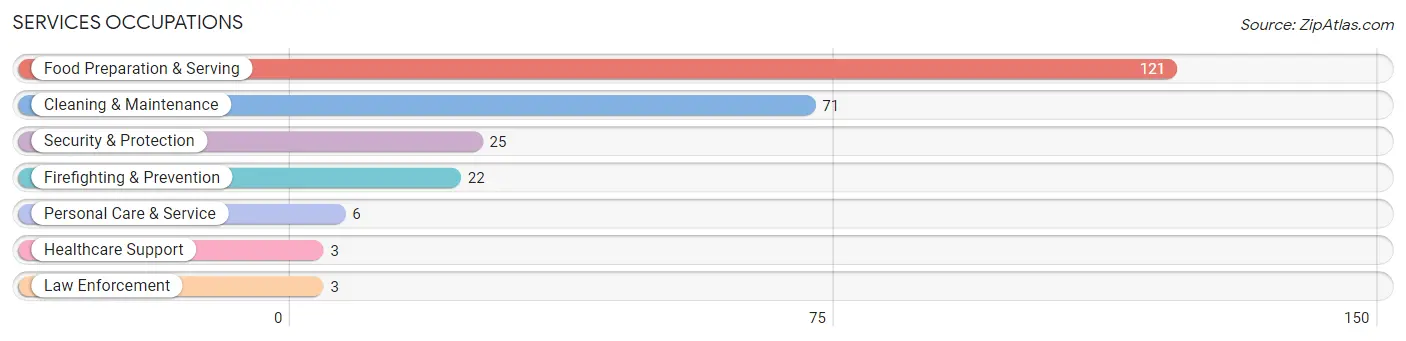
Services Occupations
The most common Services occupations in Owingsville are Food Preparation & Serving (121 | 16.2%), Cleaning & Maintenance (71 | 9.5%), Security & Protection (25 | 3.3%), Firefighting & Prevention (22 | 2.9%), and Personal Care & Service (6 | 0.8%).
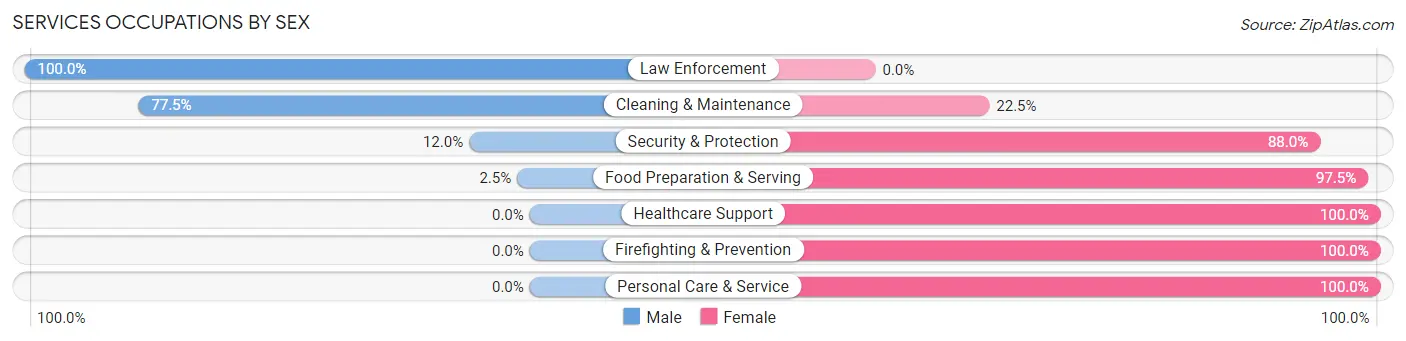
Services Occupations by Sex
Within the Services occupations in Owingsville, the most male-oriented occupations are Law Enforcement (100.0%), Cleaning & Maintenance (77.5%), and Security & Protection (12.0%), while the most female-oriented occupations are Healthcare Support (100.0%), Firefighting & Prevention (100.0%), and Personal Care & Service (100.0%).
| Occupation | Male | Female |
| Healthcare Support | 0 (0.0%) | 3 (100.0%) |
| Security & Protection | 3 (12.0%) | 22 (88.0%) |
| Firefighting & Prevention | 0 (0.0%) | 22 (100.0%) |
| Law Enforcement | 3 (100.0%) | 0 (0.0%) |
| Food Preparation & Serving | 3 (2.5%) | 118 (97.5%) |
| Cleaning & Maintenance | 55 (77.5%) | 16 (22.5%) |
| Personal Care & Service | 0 (0.0%) | 6 (100.0%) |
| Total (Category) | 61 (27.0%) | 165 (73.0%) |
| Total (Overall) | 316 (42.2%) | 432 (57.8%) |
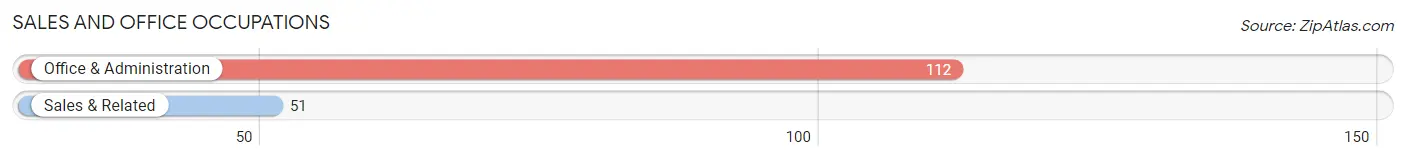
Sales and Office Occupations
The most common Sales and Office occupations in Owingsville are Office & Administration (112 | 15.0%), and Sales & Related (51 | 6.8%).
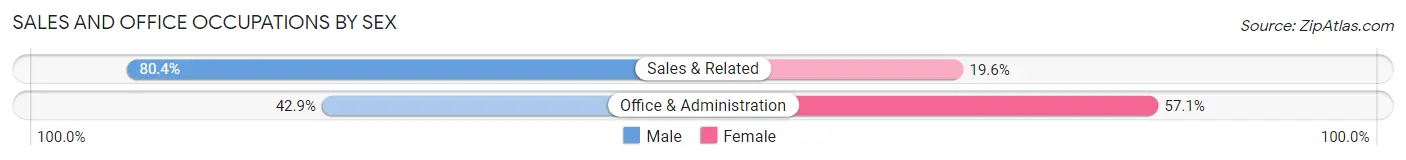
Sales and Office Occupations by Sex
| Occupation | Male | Female |
| Sales & Related | 41 (80.4%) | 10 (19.6%) |
| Office & Administration | 48 (42.9%) | 64 (57.1%) |
| Total (Category) | 89 (54.6%) | 74 (45.4%) |
| Total (Overall) | 316 (42.2%) | 432 (57.8%) |
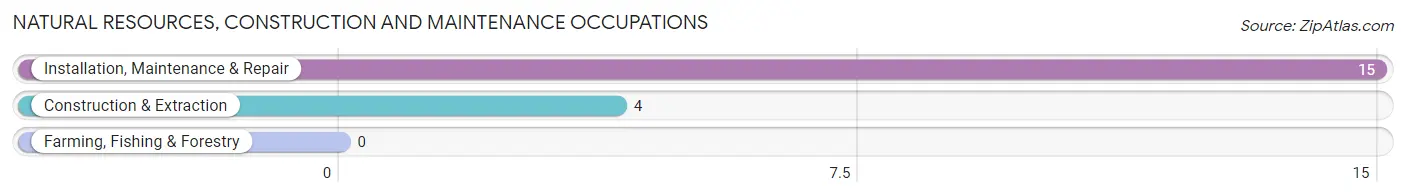
Natural Resources, Construction and Maintenance Occupations
The most common Natural Resources, Construction and Maintenance occupations in Owingsville are Installation, Maintenance & Repair (15 | 2.0%), and Construction & Extraction (4 | 0.5%).
Natural Resources, Construction and Maintenance Occupations by Sex
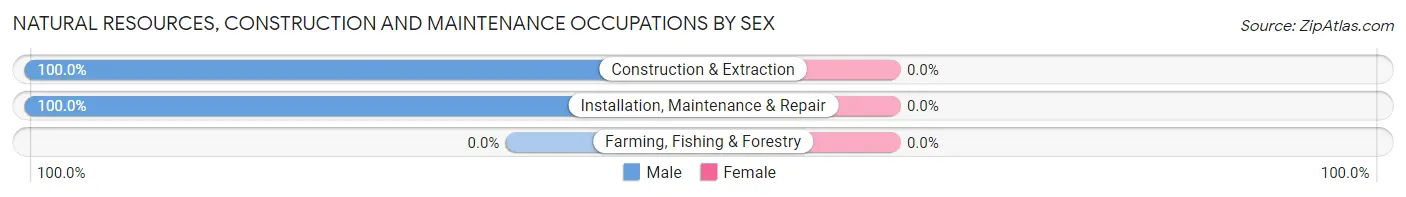
| Occupation | Male | Female |
| Farming, Fishing & Forestry | 0 (0.0%) | 0 (0.0%) |
| Construction & Extraction | 4 (100.0%) | 0 (0.0%) |
| Installation, Maintenance & Repair | 15 (100.0%) | 0 (0.0%) |
| Total (Category) | 19 (100.0%) | 0 (0.0%) |
| Total (Overall) | 316 (42.2%) | 432 (57.8%) |
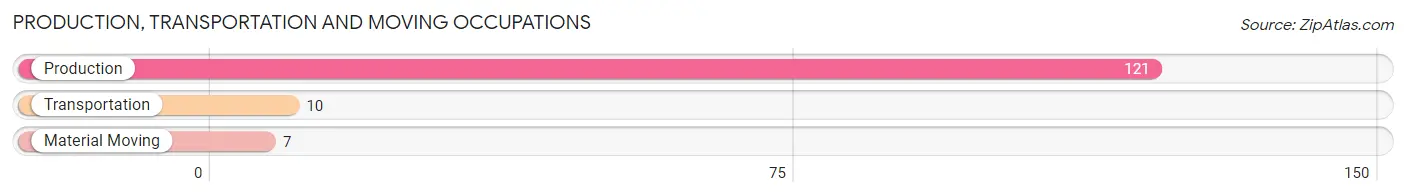
Production, Transportation and Moving Occupations
The most common Production, Transportation and Moving occupations in Owingsville are Production (121 | 16.2%), Transportation (10 | 1.3%), and Material Moving (7 | 0.9%).
Production, Transportation and Moving Occupations by Sex
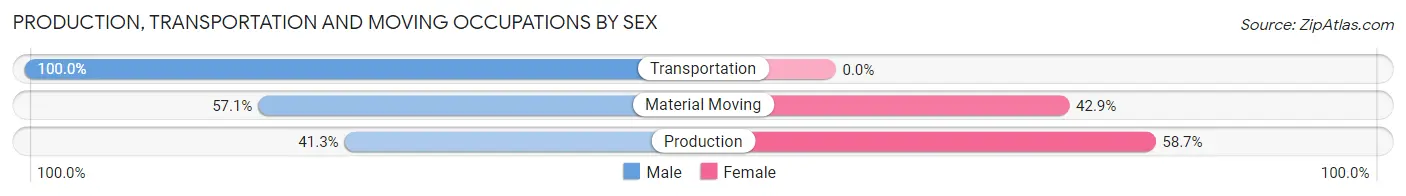
| Occupation | Male | Female |
| Production | 50 (41.3%) | 71 (58.7%) |
| Transportation | 10 (100.0%) | 0 (0.0%) |
| Material Moving | 4 (57.1%) | 3 (42.9%) |
| Total (Category) | 64 (46.4%) | 74 (53.6%) |
| Total (Overall) | 316 (42.2%) | 432 (57.8%) |
Employment Industries by Sex in Owingsville
Employment Industries in Owingsville
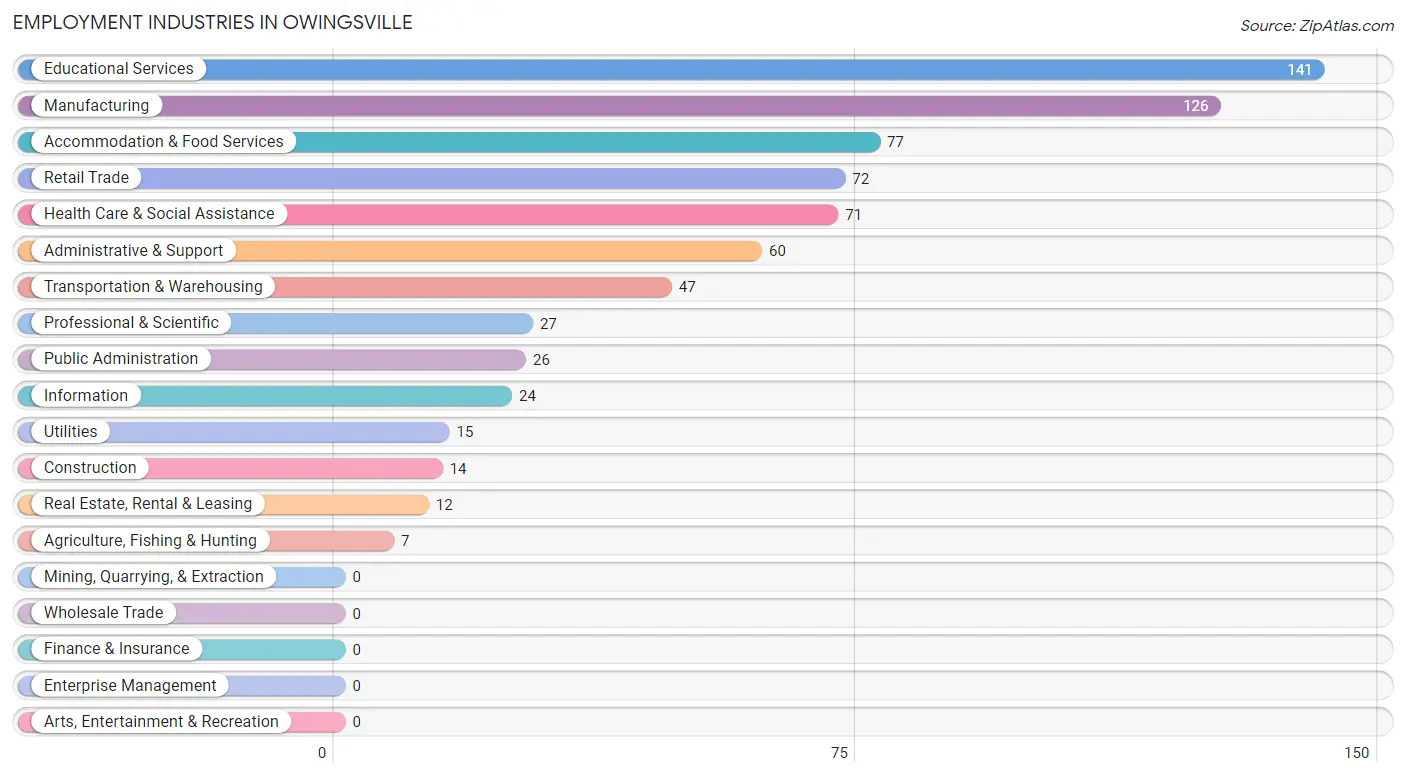
The major employment industries in Owingsville include Educational Services (141 | 18.9%), Manufacturing (126 | 16.8%), Accommodation & Food Services (77 | 10.3%), Retail Trade (72 | 9.6%), and Health Care & Social Assistance (71 | 9.5%).
Employment Industries by Sex in Owingsville
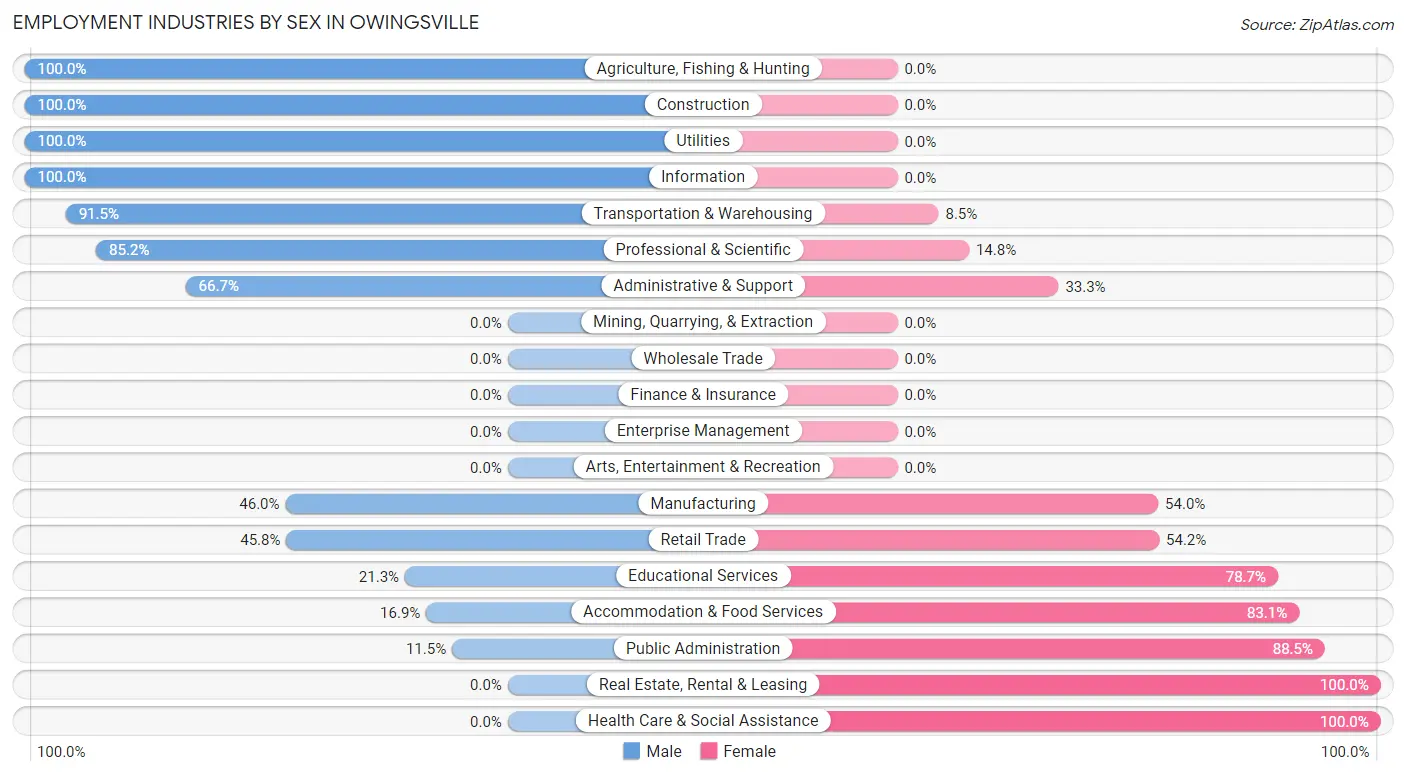
The Owingsville industries that see more men than women are Agriculture, Fishing & Hunting (100.0%), Construction (100.0%), and Utilities (100.0%), whereas the industries that tend to have a higher number of women are Real Estate, Rental & Leasing (100.0%), Health Care & Social Assistance (100.0%), and Public Administration (88.5%).
| Industry | Male | Female |
| Agriculture, Fishing & Hunting | 7 (100.0%) | 0 (0.0%) |
| Mining, Quarrying, & Extraction | 0 (0.0%) | 0 (0.0%) |
| Construction | 14 (100.0%) | 0 (0.0%) |
| Manufacturing | 58 (46.0%) | 68 (54.0%) |
| Wholesale Trade | 0 (0.0%) | 0 (0.0%) |
| Retail Trade | 33 (45.8%) | 39 (54.2%) |
| Transportation & Warehousing | 43 (91.5%) | 4 (8.5%) |
| Utilities | 15 (100.0%) | 0 (0.0%) |
| Information | 24 (100.0%) | 0 (0.0%) |
| Finance & Insurance | 0 (0.0%) | 0 (0.0%) |
| Real Estate, Rental & Leasing | 0 (0.0%) | 12 (100.0%) |
| Professional & Scientific | 23 (85.2%) | 4 (14.8%) |
| Enterprise Management | 0 (0.0%) | 0 (0.0%) |
| Administrative & Support | 40 (66.7%) | 20 (33.3%) |
| Educational Services | 30 (21.3%) | 111 (78.7%) |
| Health Care & Social Assistance | 0 (0.0%) | 71 (100.0%) |
| Arts, Entertainment & Recreation | 0 (0.0%) | 0 (0.0%) |
| Accommodation & Food Services | 13 (16.9%) | 64 (83.1%) |
| Public Administration | 3 (11.5%) | 23 (88.5%) |
| Total | 316 (42.2%) | 432 (57.8%) |
Education in Owingsville
School Enrollment in Owingsville
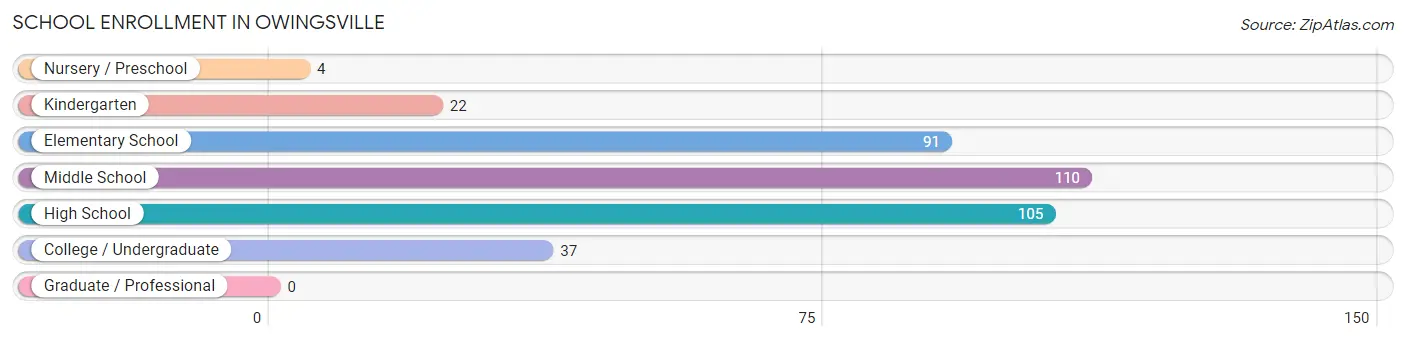
The most common levels of schooling among the 369 students in Owingsville are middle school (110 | 29.8%), high school (105 | 28.5%), and elementary school (91 | 24.7%).
| School Level | # Students | % Students |
| Nursery / Preschool | 4 | 1.1% |
| Kindergarten | 22 | 6.0% |
| Elementary School | 91 | 24.7% |
| Middle School | 110 | 29.8% |
| High School | 105 | 28.5% |
| College / Undergraduate | 37 | 10.0% |
| Graduate / Professional | 0 | 0.0% |
| Total | 369 | 100.0% |
School Enrollment by Age by Funding Source in Owingsville
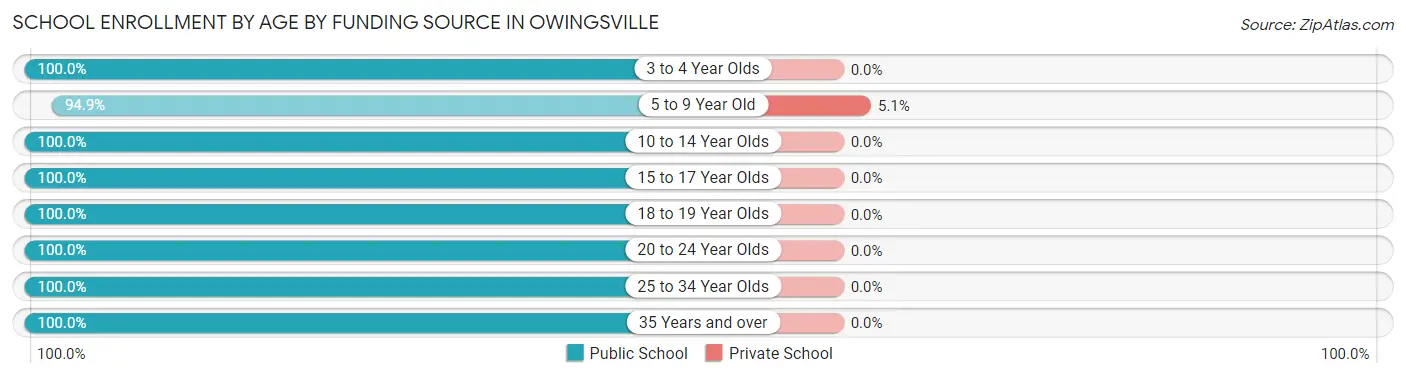
Out of a total of 369 students who are enrolled in schools in Owingsville, 5 (1.4%) attend a private institution, while the remaining 364 (98.6%) are enrolled in public schools. The age group of 5 to 9 year old has the highest likelihood of being enrolled in private schools, with 5 (5.1% in the age bracket) enrolled. Conversely, the age group of 3 to 4 year olds has the lowest likelihood of being enrolled in a private school, with 4 (100.0% in the age bracket) attending a public institution.
| Age Bracket | Public School | Private School |
| 3 to 4 Year Olds | 4 (100.0%) | 0 (0.0%) |
| 5 to 9 Year Old | 93 (94.9%) | 5 (5.1%) |
| 10 to 14 Year Olds | 127 (100.0%) | 0 (0.0%) |
| 15 to 17 Year Olds | 103 (100.0%) | 0 (0.0%) |
| 18 to 19 Year Olds | 21 (100.0%) | 0 (0.0%) |
| 20 to 24 Year Olds | 10 (100.0%) | 0 (0.0%) |
| 25 to 34 Year Olds | 3 (100.0%) | 0 (0.0%) |
| 35 Years and over | 3 (100.0%) | 0 (0.0%) |
| Total | 364 (98.6%) | 5 (1.4%) |
Educational Attainment by Field of Study in Owingsville
Education (46 | 24.1%), science & technology (40 | 20.9%), business (28 | 14.7%), bio, nature & agricultural (24 | 12.6%), and computers & mathematics (11 | 5.8%) are the most common fields of study among 191 individuals in Owingsville who have obtained a bachelor's degree or higher.
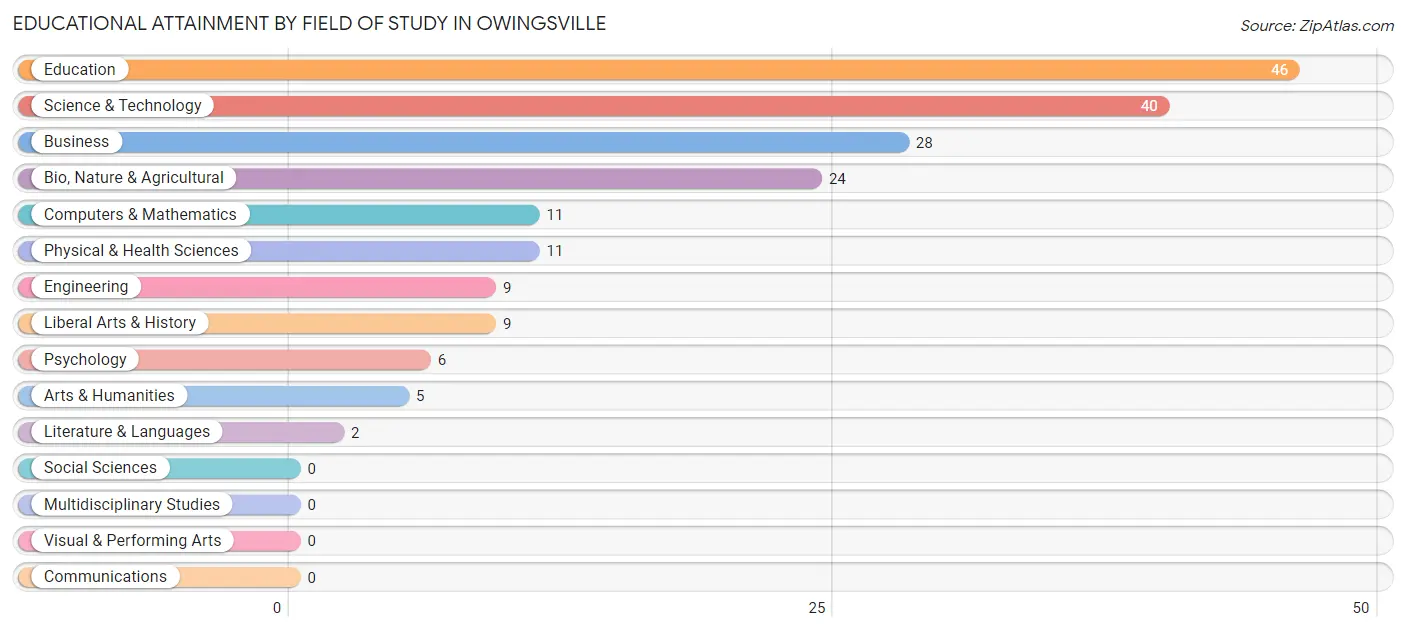
| Field of Study | # Graduates | % Graduates |
| Computers & Mathematics | 11 | 5.8% |
| Bio, Nature & Agricultural | 24 | 12.6% |
| Physical & Health Sciences | 11 | 5.8% |
| Psychology | 6 | 3.1% |
| Social Sciences | 0 | 0.0% |
| Engineering | 9 | 4.7% |
| Multidisciplinary Studies | 0 | 0.0% |
| Science & Technology | 40 | 20.9% |
| Business | 28 | 14.7% |
| Education | 46 | 24.1% |
| Literature & Languages | 2 | 1.1% |
| Liberal Arts & History | 9 | 4.7% |
| Visual & Performing Arts | 0 | 0.0% |
| Communications | 0 | 0.0% |
| Arts & Humanities | 5 | 2.6% |
| Total | 191 | 100.0% |
Transportation & Commute in Owingsville
Vehicle Availability by Sex in Owingsville
The most prevalent vehicle ownership categories in Owingsville are males with 2 vehicles (136, accounting for 43.0%) and females with 2 vehicles (116, making up 32.6%).
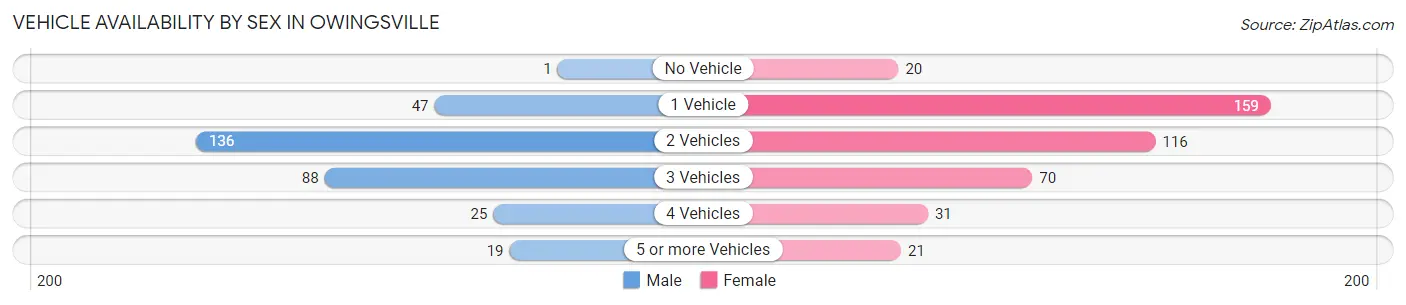
| Vehicles Available | Male | Female |
| No Vehicle | 1 (0.3%) | 20 (4.8%) |
| 1 Vehicle | 47 (14.9%) | 159 (38.1%) |
| 2 Vehicles | 136 (43.0%) | 116 (27.8%) |
| 3 Vehicles | 88 (27.9%) | 70 (16.8%) |
| 4 Vehicles | 25 (7.9%) | 31 (7.4%) |
| 5 or more Vehicles | 19 (6.0%) | 21 (5.0%) |
| Total | 316 (100.0%) | 417 (100.0%) |
Commute Time in Owingsville
The most frequently occuring commute durations in Owingsville are less than 5 minutes (175 commuters, 25.1%), 15 to 19 minutes (108 commuters, 15.5%), and 5 to 9 minutes (104 commuters, 14.9%).
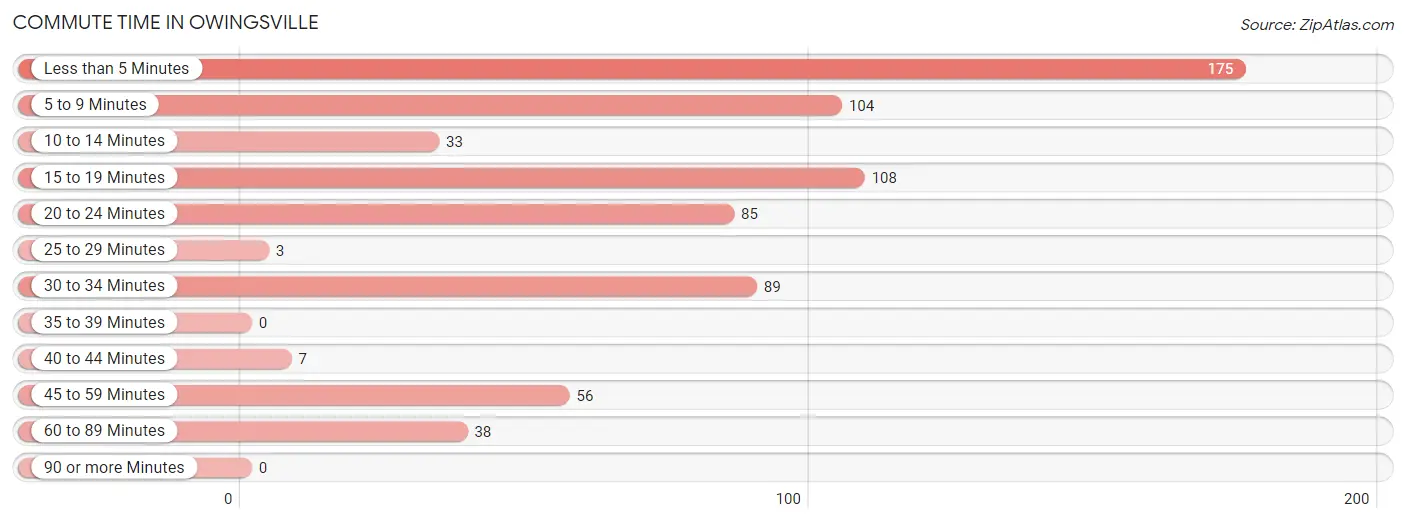
| Commute Time | # Commuters | % Commuters |
| Less than 5 Minutes | 175 | 25.1% |
| 5 to 9 Minutes | 104 | 14.9% |
| 10 to 14 Minutes | 33 | 4.7% |
| 15 to 19 Minutes | 108 | 15.5% |
| 20 to 24 Minutes | 85 | 12.2% |
| 25 to 29 Minutes | 3 | 0.4% |
| 30 to 34 Minutes | 89 | 12.8% |
| 35 to 39 Minutes | 0 | 0.0% |
| 40 to 44 Minutes | 7 | 1.0% |
| 45 to 59 Minutes | 56 | 8.0% |
| 60 to 89 Minutes | 38 | 5.4% |
| 90 or more Minutes | 0 | 0.0% |
Commute Time by Sex in Owingsville
The most common commute times in Owingsville are less than 5 minutes (85 commuters, 29.4%) for males and less than 5 minutes (90 commuters, 22.0%) for females.
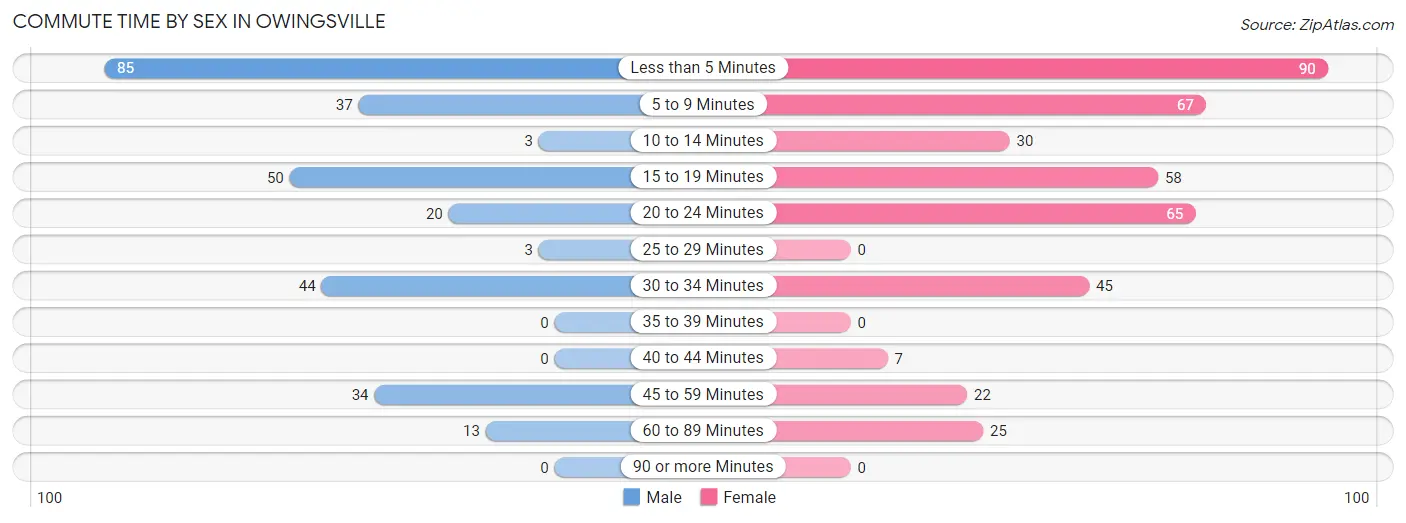
| Commute Time | Male | Female |
| Less than 5 Minutes | 85 (29.4%) | 90 (22.0%) |
| 5 to 9 Minutes | 37 (12.8%) | 67 (16.4%) |
| 10 to 14 Minutes | 3 (1.0%) | 30 (7.3%) |
| 15 to 19 Minutes | 50 (17.3%) | 58 (14.2%) |
| 20 to 24 Minutes | 20 (6.9%) | 65 (15.9%) |
| 25 to 29 Minutes | 3 (1.0%) | 0 (0.0%) |
| 30 to 34 Minutes | 44 (15.2%) | 45 (11.0%) |
| 35 to 39 Minutes | 0 (0.0%) | 0 (0.0%) |
| 40 to 44 Minutes | 0 (0.0%) | 7 (1.7%) |
| 45 to 59 Minutes | 34 (11.8%) | 22 (5.4%) |
| 60 to 89 Minutes | 13 (4.5%) | 25 (6.1%) |
| 90 or more Minutes | 0 (0.0%) | 0 (0.0%) |
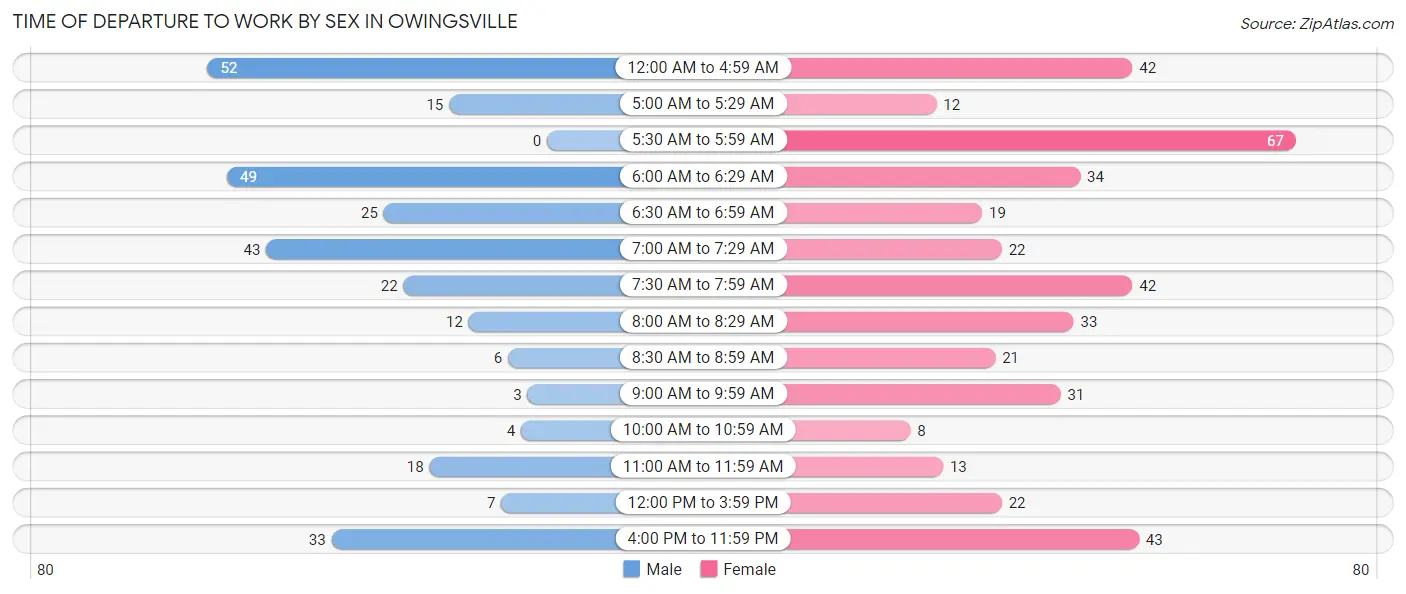
Time of Departure to Work by Sex in Owingsville
The most frequent times of departure to work in Owingsville are 12:00 AM to 4:59 AM (52, 18.0%) for males and 5:30 AM to 5:59 AM (67, 16.4%) for females.
| Time of Departure | Male | Female |
| 12:00 AM to 4:59 AM | 52 (18.0%) | 42 (10.3%) |
| 5:00 AM to 5:29 AM | 15 (5.2%) | 12 (2.9%) |
| 5:30 AM to 5:59 AM | 0 (0.0%) | 67 (16.4%) |
| 6:00 AM to 6:29 AM | 49 (17.0%) | 34 (8.3%) |
| 6:30 AM to 6:59 AM | 25 (8.6%) | 19 (4.6%) |
| 7:00 AM to 7:29 AM | 43 (14.9%) | 22 (5.4%) |
| 7:30 AM to 7:59 AM | 22 (7.6%) | 42 (10.3%) |
| 8:00 AM to 8:29 AM | 12 (4.2%) | 33 (8.1%) |
| 8:30 AM to 8:59 AM | 6 (2.1%) | 21 (5.1%) |
| 9:00 AM to 9:59 AM | 3 (1.0%) | 31 (7.6%) |
| 10:00 AM to 10:59 AM | 4 (1.4%) | 8 (2.0%) |
| 11:00 AM to 11:59 AM | 18 (6.2%) | 13 (3.2%) |
| 12:00 PM to 3:59 PM | 7 (2.4%) | 22 (5.4%) |
| 4:00 PM to 11:59 PM | 33 (11.4%) | 43 (10.5%) |
| Total | 289 (100.0%) | 409 (100.0%) |
Housing Occupancy in Owingsville
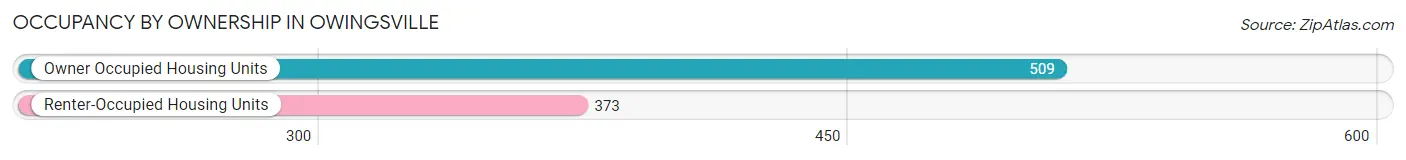
Occupancy by Ownership in Owingsville
Of the total 882 dwellings in Owingsville, owner-occupied units account for 509 (57.7%), while renter-occupied units make up 373 (42.3%).
| Occupancy | # Housing Units | % Housing Units |
| Owner Occupied Housing Units | 509 | 57.7% |
| Renter-Occupied Housing Units | 373 | 42.3% |
| Total Occupied Housing Units | 882 | 100.0% |
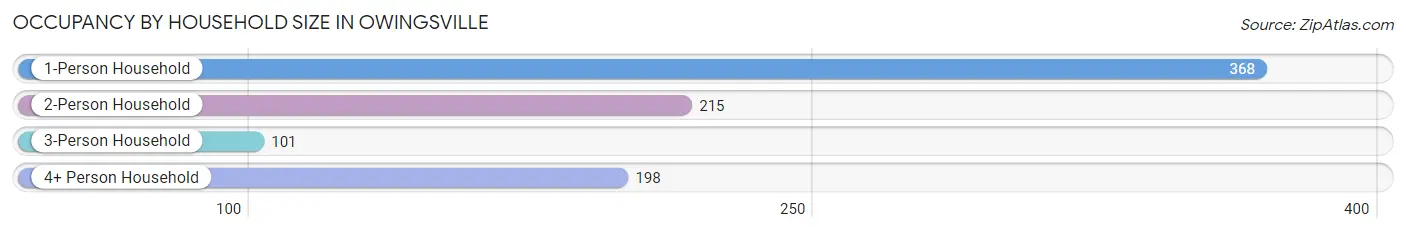
Occupancy by Household Size in Owingsville
| Household Size | # Housing Units | % Housing Units |
| 1-Person Household | 368 | 41.7% |
| 2-Person Household | 215 | 24.4% |
| 3-Person Household | 101 | 11.5% |
| 4+ Person Household | 198 | 22.5% |
| Total Housing Units | 882 | 100.0% |
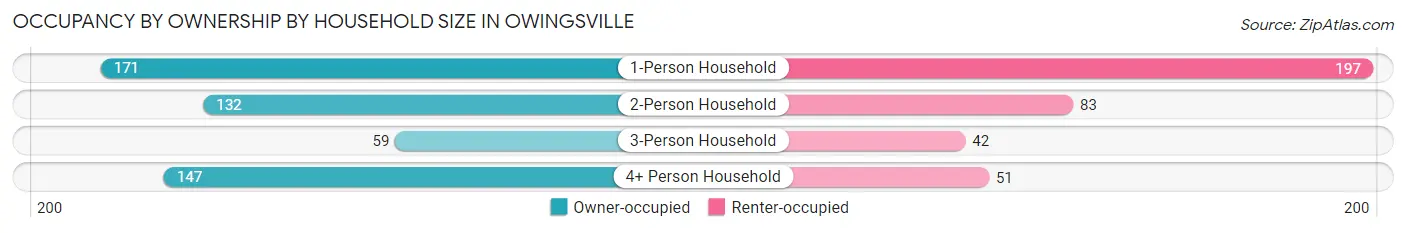
Occupancy by Ownership by Household Size in Owingsville
| Household Size | Owner-occupied | Renter-occupied |
| 1-Person Household | 171 (46.5%) | 197 (53.5%) |
| 2-Person Household | 132 (61.4%) | 83 (38.6%) |
| 3-Person Household | 59 (58.4%) | 42 (41.6%) |
| 4+ Person Household | 147 (74.2%) | 51 (25.8%) |
| Total Housing Units | 509 (57.7%) | 373 (42.3%) |
Occupancy by Educational Attainment in Owingsville
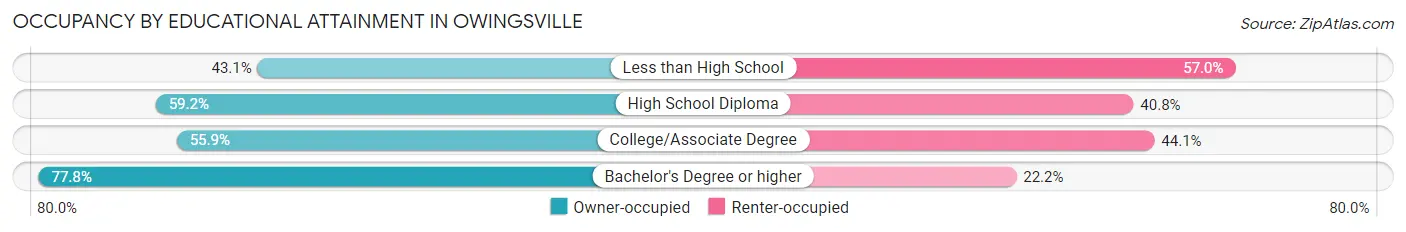
| Household Size | Owner-occupied | Renter-occupied |
| Less than High School | 65 (43.0%) | 86 (57.0%) |
| High School Diploma | 177 (59.2%) | 122 (40.8%) |
| College/Associate Degree | 176 (55.9%) | 139 (44.1%) |
| Bachelor's Degree or higher | 91 (77.8%) | 26 (22.2%) |
Occupancy by Age of Householder in Owingsville
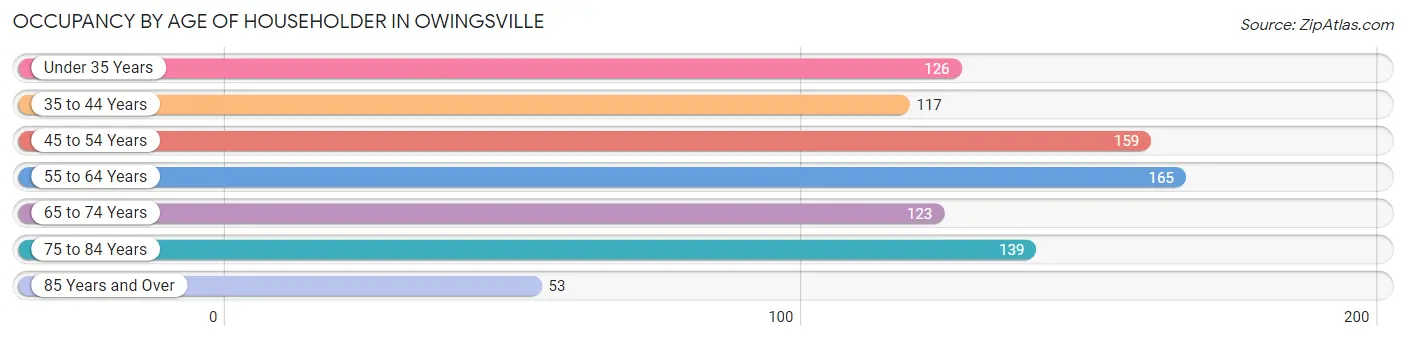
| Age Bracket | # Households | % Households |
| Under 35 Years | 126 | 14.3% |
| 35 to 44 Years | 117 | 13.3% |
| 45 to 54 Years | 159 | 18.0% |
| 55 to 64 Years | 165 | 18.7% |
| 65 to 74 Years | 123 | 14.0% |
| 75 to 84 Years | 139 | 15.8% |
| 85 Years and Over | 53 | 6.0% |
| Total | 882 | 100.0% |
Housing Finances in Owingsville
Median Income by Occupancy in Owingsville
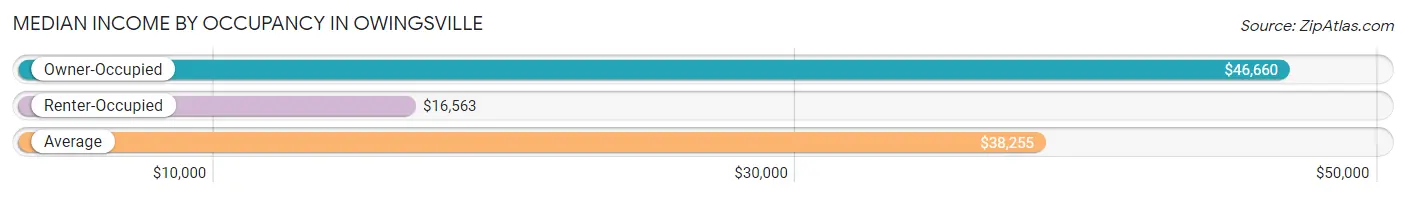
| Occupancy Type | # Households | Median Income |
| Owner-Occupied | 509 (57.7%) | $46,660 |
| Renter-Occupied | 373 (42.3%) | $16,563 |
| Average | 882 (100.0%) | $38,255 |
Occupancy by Householder Income Bracket in Owingsville
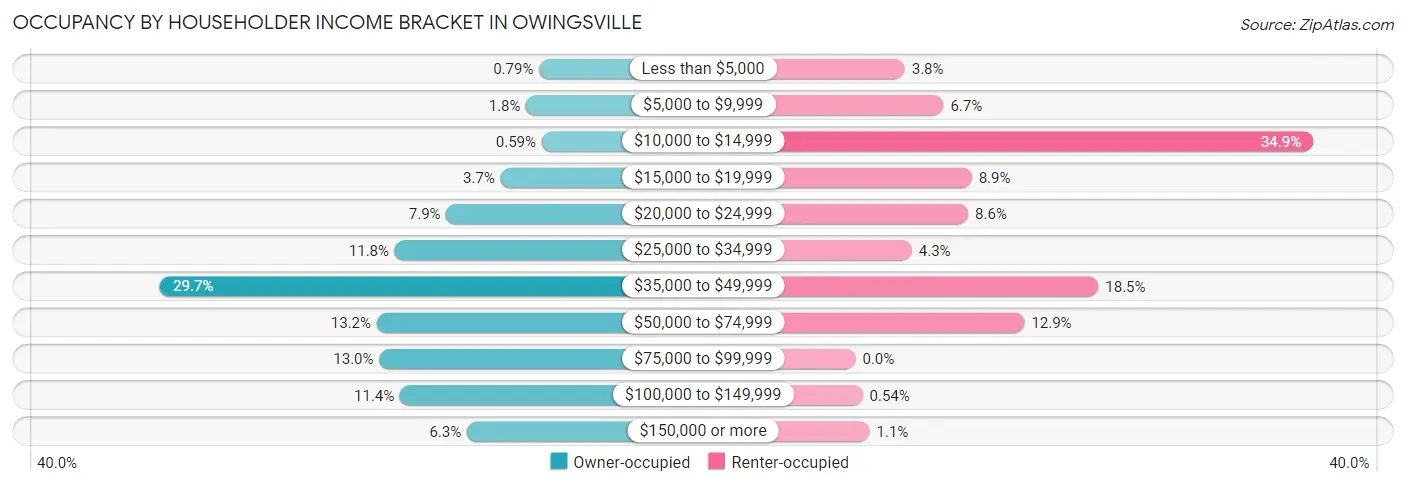
| Income Bracket | Owner-occupied | Renter-occupied |
| Less than $5,000 | 4 (0.8%) | 14 (3.7%) |
| $5,000 to $9,999 | 9 (1.8%) | 25 (6.7%) |
| $10,000 to $14,999 | 3 (0.6%) | 130 (34.8%) |
| $15,000 to $19,999 | 19 (3.7%) | 33 (8.8%) |
| $20,000 to $24,999 | 40 (7.9%) | 32 (8.6%) |
| $25,000 to $34,999 | 60 (11.8%) | 16 (4.3%) |
| $35,000 to $49,999 | 151 (29.7%) | 69 (18.5%) |
| $50,000 to $74,999 | 67 (13.2%) | 48 (12.9%) |
| $75,000 to $99,999 | 66 (13.0%) | 0 (0.0%) |
| $100,000 to $149,999 | 58 (11.4%) | 2 (0.5%) |
| $150,000 or more | 32 (6.3%) | 4 (1.1%) |
| Total | 509 (100.0%) | 373 (100.0%) |
Monthly Housing Cost Tiers in Owingsville
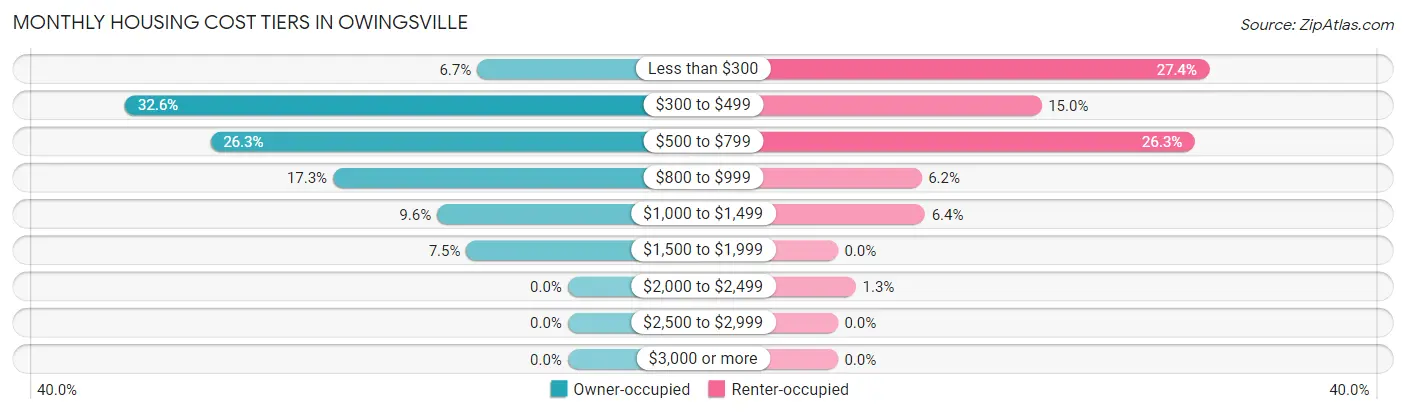
| Monthly Cost | Owner-occupied | Renter-occupied |
| Less than $300 | 34 (6.7%) | 102 (27.4%) |
| $300 to $499 | 166 (32.6%) | 56 (15.0%) |
| $500 to $799 | 134 (26.3%) | 98 (26.3%) |
| $800 to $999 | 88 (17.3%) | 23 (6.2%) |
| $1,000 to $1,499 | 49 (9.6%) | 24 (6.4%) |
| $1,500 to $1,999 | 38 (7.5%) | 0 (0.0%) |
| $2,000 to $2,499 | 0 (0.0%) | 5 (1.3%) |
| $2,500 to $2,999 | 0 (0.0%) | 0 (0.0%) |
| $3,000 or more | 0 (0.0%) | 0 (0.0%) |
| Total | 509 (100.0%) | 373 (100.0%) |
Physical Housing Characteristics in Owingsville
Housing Structures in Owingsville
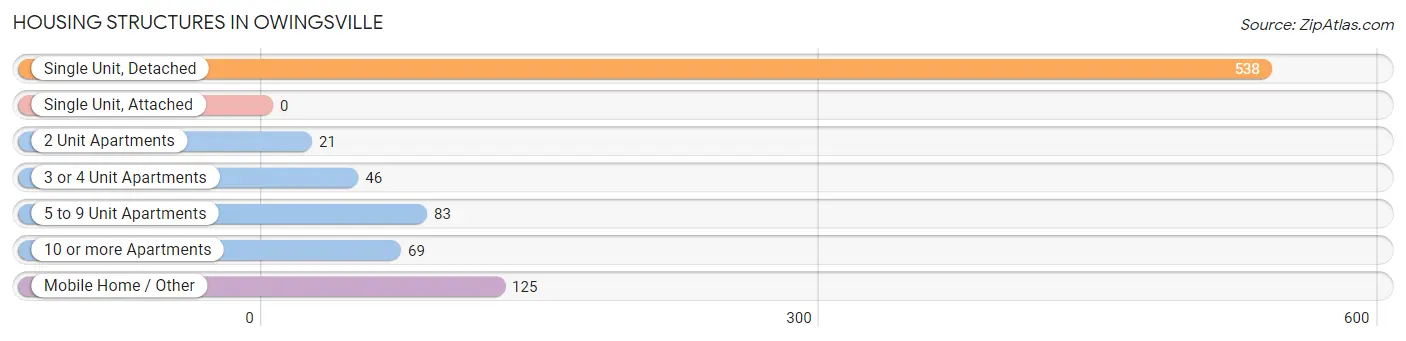
| Structure Type | # Housing Units | % Housing Units |
| Single Unit, Detached | 538 | 61.0% |
| Single Unit, Attached | 0 | 0.0% |
| 2 Unit Apartments | 21 | 2.4% |
| 3 or 4 Unit Apartments | 46 | 5.2% |
| 5 to 9 Unit Apartments | 83 | 9.4% |
| 10 or more Apartments | 69 | 7.8% |
| Mobile Home / Other | 125 | 14.2% |
| Total | 882 | 100.0% |
Housing Structures by Occupancy in Owingsville
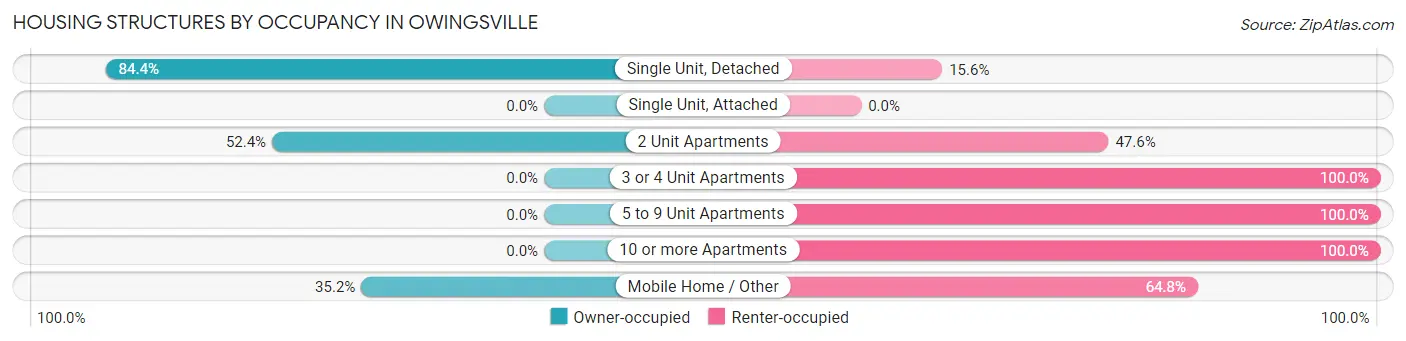
| Structure Type | Owner-occupied | Renter-occupied |
| Single Unit, Detached | 454 (84.4%) | 84 (15.6%) |
| Single Unit, Attached | 0 (0.0%) | 0 (0.0%) |
| 2 Unit Apartments | 11 (52.4%) | 10 (47.6%) |
| 3 or 4 Unit Apartments | 0 (0.0%) | 46 (100.0%) |
| 5 to 9 Unit Apartments | 0 (0.0%) | 83 (100.0%) |
| 10 or more Apartments | 0 (0.0%) | 69 (100.0%) |
| Mobile Home / Other | 44 (35.2%) | 81 (64.8%) |
| Total | 509 (57.7%) | 373 (42.3%) |
Housing Structures by Number of Rooms in Owingsville
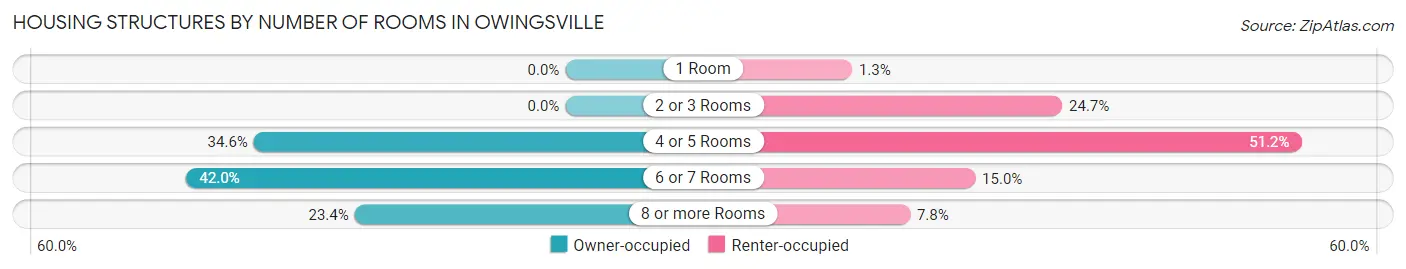
| Number of Rooms | Owner-occupied | Renter-occupied |
| 1 Room | 0 (0.0%) | 5 (1.3%) |
| 2 or 3 Rooms | 0 (0.0%) | 92 (24.7%) |
| 4 or 5 Rooms | 176 (34.6%) | 191 (51.2%) |
| 6 or 7 Rooms | 214 (42.0%) | 56 (15.0%) |
| 8 or more Rooms | 119 (23.4%) | 29 (7.8%) |
| Total | 509 (100.0%) | 373 (100.0%) |
Housing Structure by Heating Type in Owingsville
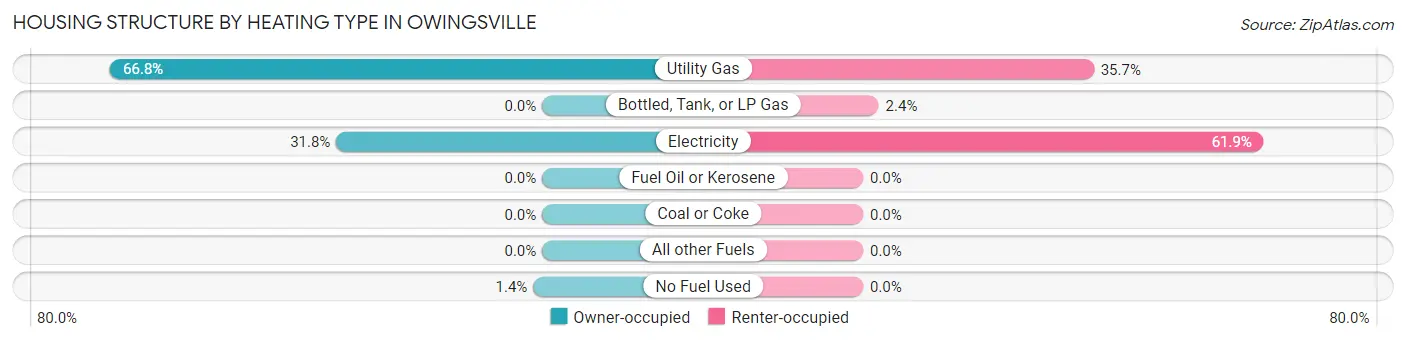
| Heating Type | Owner-occupied | Renter-occupied |
| Utility Gas | 340 (66.8%) | 133 (35.7%) |
| Bottled, Tank, or LP Gas | 0 (0.0%) | 9 (2.4%) |
| Electricity | 162 (31.8%) | 231 (61.9%) |
| Fuel Oil or Kerosene | 0 (0.0%) | 0 (0.0%) |
| Coal or Coke | 0 (0.0%) | 0 (0.0%) |
| All other Fuels | 0 (0.0%) | 0 (0.0%) |
| No Fuel Used | 7 (1.4%) | 0 (0.0%) |
| Total | 509 (100.0%) | 373 (100.0%) |
Household Vehicle Usage in Owingsville
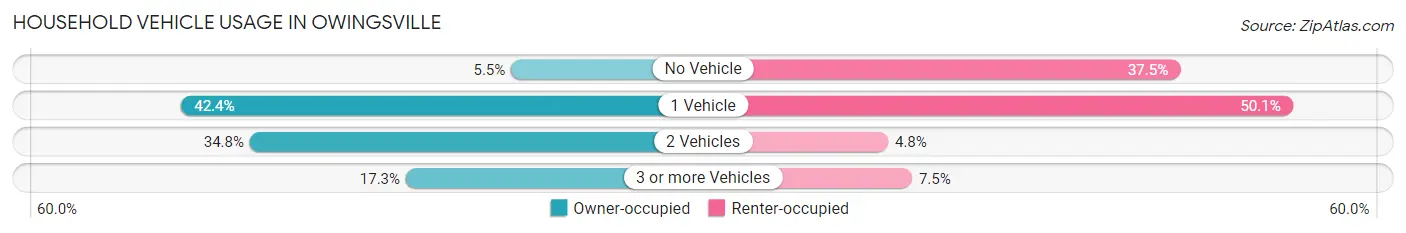
| Vehicles per Household | Owner-occupied | Renter-occupied |
| No Vehicle | 28 (5.5%) | 140 (37.5%) |
| 1 Vehicle | 216 (42.4%) | 187 (50.1%) |
| 2 Vehicles | 177 (34.8%) | 18 (4.8%) |
| 3 or more Vehicles | 88 (17.3%) | 28 (7.5%) |
| Total | 509 (100.0%) | 373 (100.0%) |
Real Estate & Mortgages in Owingsville
Real Estate and Mortgage Overview in Owingsville
| Characteristic | Without Mortgage | With Mortgage |
| Housing Units | 211 | 298 |
| Median Property Value | $75,700 | $89,700 |
| Median Household Income | $46,414 | $32 |
| Monthly Housing Costs | $330 | $0 |
| Real Estate Taxes | $421 | $4 |
Property Value by Mortgage Status in Owingsville
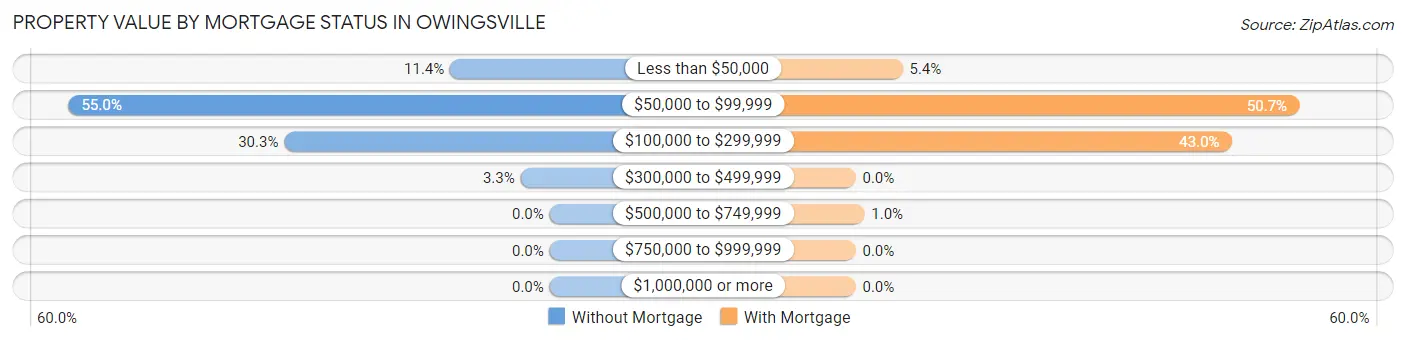
| Property Value | Without Mortgage | With Mortgage |
| Less than $50,000 | 24 (11.4%) | 16 (5.4%) |
| $50,000 to $99,999 | 116 (55.0%) | 151 (50.7%) |
| $100,000 to $299,999 | 64 (30.3%) | 128 (42.9%) |
| $300,000 to $499,999 | 7 (3.3%) | 0 (0.0%) |
| $500,000 to $749,999 | 0 (0.0%) | 3 (1.0%) |
| $750,000 to $999,999 | 0 (0.0%) | 0 (0.0%) |
| $1,000,000 or more | 0 (0.0%) | 0 (0.0%) |
| Total | 211 (100.0%) | 298 (100.0%) |
Household Income by Mortgage Status in Owingsville
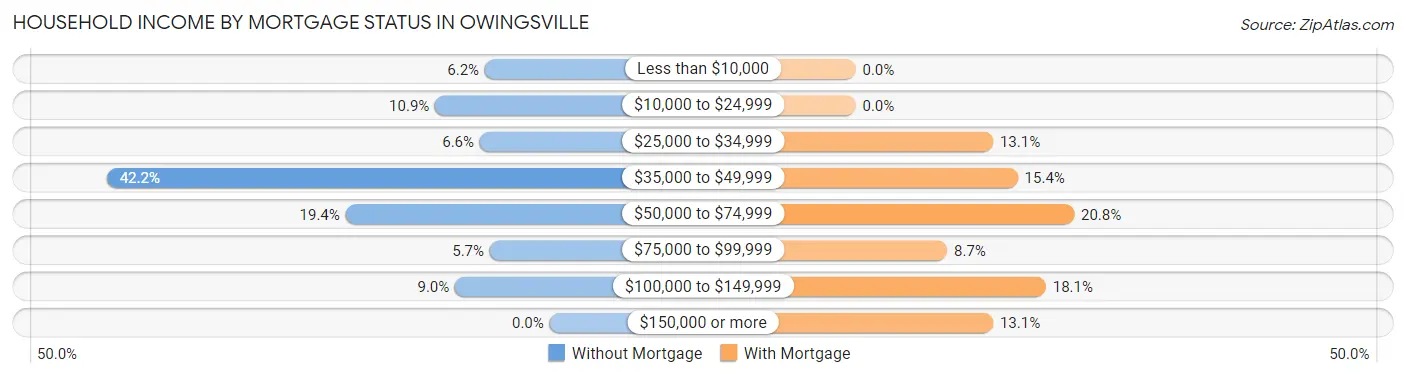
| Household Income | Without Mortgage | With Mortgage |
| Less than $10,000 | 13 (6.2%) | 0 (0.0%) |
| $10,000 to $24,999 | 23 (10.9%) | 0 (0.0%) |
| $25,000 to $34,999 | 14 (6.6%) | 39 (13.1%) |
| $35,000 to $49,999 | 89 (42.2%) | 46 (15.4%) |
| $50,000 to $74,999 | 41 (19.4%) | 62 (20.8%) |
| $75,000 to $99,999 | 12 (5.7%) | 26 (8.7%) |
| $100,000 to $149,999 | 19 (9.0%) | 54 (18.1%) |
| $150,000 or more | 0 (0.0%) | 39 (13.1%) |
| Total | 211 (100.0%) | 298 (100.0%) |
Property Value to Household Income Ratio in Owingsville
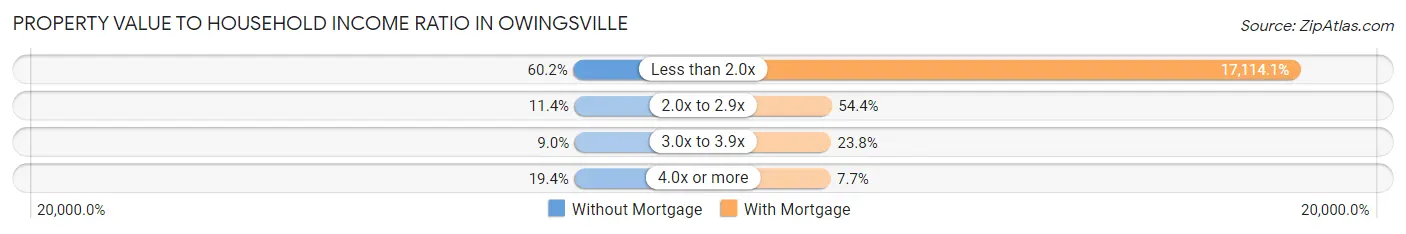
| Value-to-Income Ratio | Without Mortgage | With Mortgage |
| Less than 2.0x | 127 (60.2%) | 51,000 (17,114.1%) |
| 2.0x to 2.9x | 24 (11.4%) | 162 (54.4%) |
| 3.0x to 3.9x | 19 (9.0%) | 71 (23.8%) |
| 4.0x or more | 41 (19.4%) | 23 (7.7%) |
| Total | 211 (100.0%) | 298 (100.0%) |
Real Estate Taxes by Mortgage Status in Owingsville
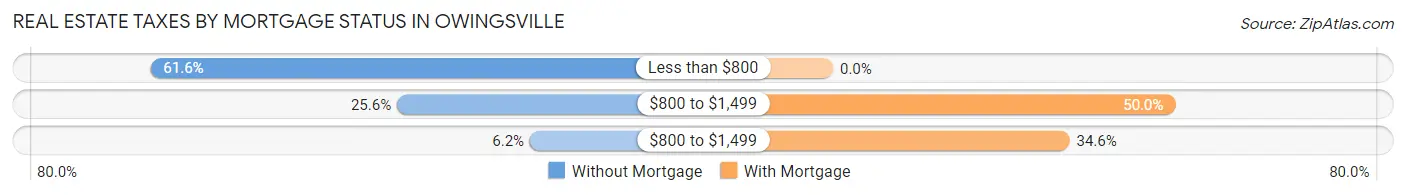
| Property Taxes | Without Mortgage | With Mortgage |
| Less than $800 | 130 (61.6%) | 0 (0.0%) |
| $800 to $1,499 | 54 (25.6%) | 149 (50.0%) |
| $800 to $1,499 | 13 (6.2%) | 103 (34.6%) |
| Total | 211 (100.0%) | 298 (100.0%) |
Health & Disability in Owingsville
Health Insurance Coverage by Age in Owingsville
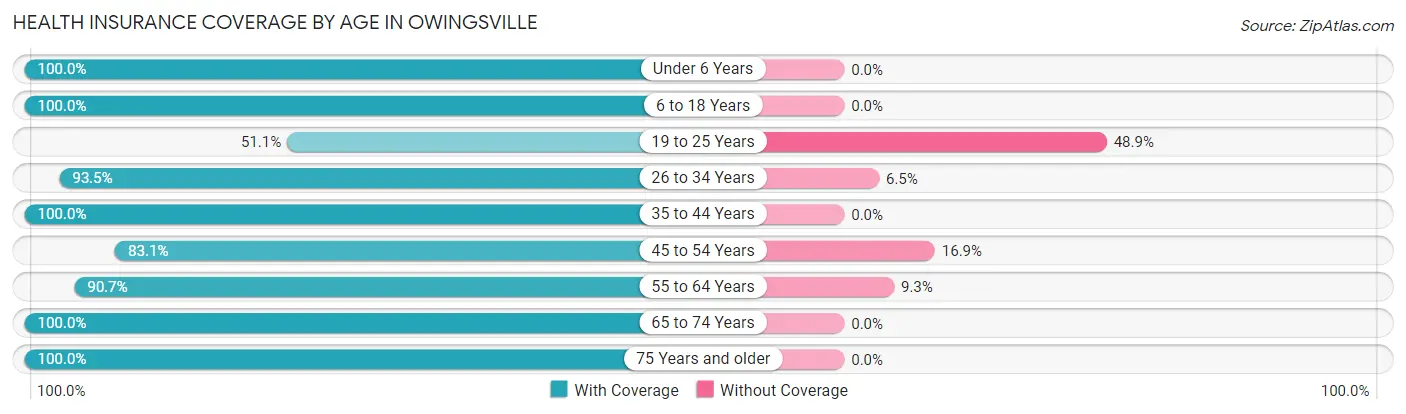
| Age Bracket | With Coverage | Without Coverage |
| Under 6 Years | 150 (100.0%) | 0 (0.0%) |
| 6 to 18 Years | 347 (100.0%) | 0 (0.0%) |
| 19 to 25 Years | 48 (51.1%) | 46 (48.9%) |
| 26 to 34 Years | 274 (93.5%) | 19 (6.5%) |
| 35 to 44 Years | 207 (100.0%) | 0 (0.0%) |
| 45 to 54 Years | 251 (83.1%) | 51 (16.9%) |
| 55 to 64 Years | 186 (90.7%) | 19 (9.3%) |
| 65 to 74 Years | 148 (100.0%) | 0 (0.0%) |
| 75 Years and older | 214 (100.0%) | 0 (0.0%) |
| Total | 1,825 (93.1%) | 135 (6.9%) |
Health Insurance Coverage by Citizenship Status in Owingsville
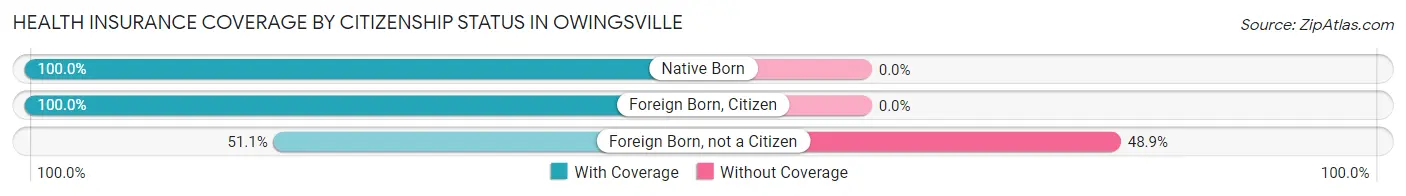
| Citizenship Status | With Coverage | Without Coverage |
| Native Born | 150 (100.0%) | 0 (0.0%) |
| Foreign Born, Citizen | 347 (100.0%) | 0 (0.0%) |
| Foreign Born, not a Citizen | 48 (51.1%) | 46 (48.9%) |
Health Insurance Coverage by Household Income in Owingsville
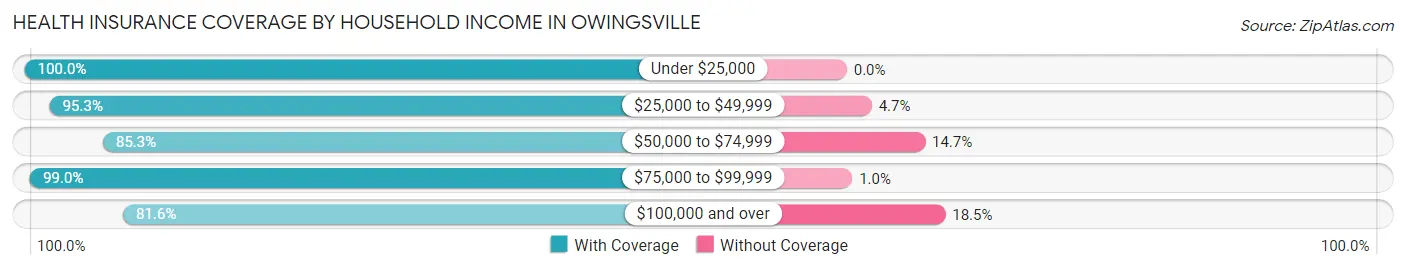
| Household Income | With Coverage | Without Coverage |
| Under $25,000 | 459 (100.0%) | 0 (0.0%) |
| $25,000 to $49,999 | 653 (95.3%) | 32 (4.7%) |
| $50,000 to $74,999 | 297 (85.3%) | 51 (14.7%) |
| $75,000 to $99,999 | 195 (99.0%) | 2 (1.0%) |
| $100,000 and over | 221 (81.6%) | 50 (18.4%) |
Public vs Private Health Insurance Coverage by Age in Owingsville
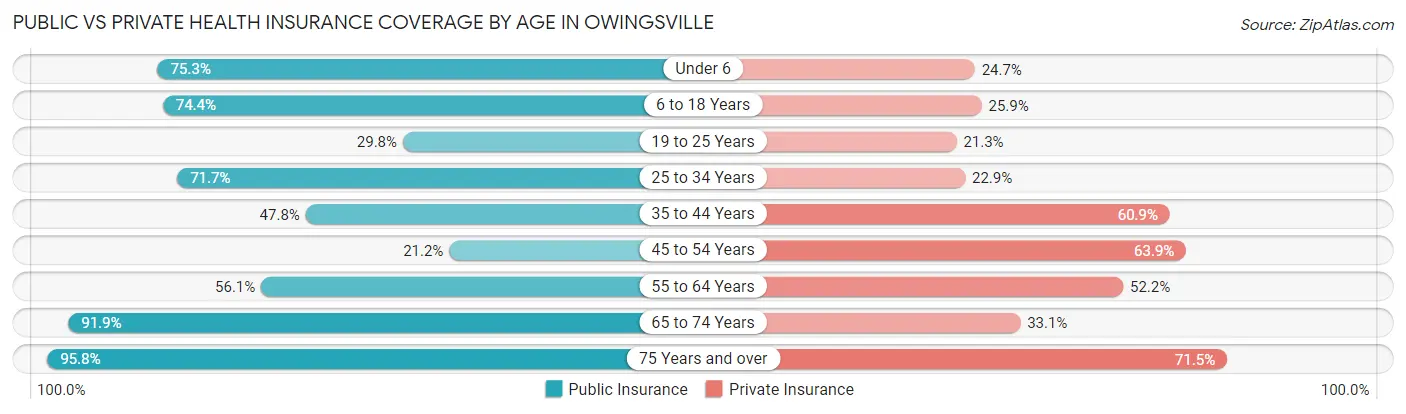
| Age Bracket | Public Insurance | Private Insurance |
| Under 6 | 113 (75.3%) | 37 (24.7%) |
| 6 to 18 Years | 258 (74.4%) | 90 (25.9%) |
| 19 to 25 Years | 28 (29.8%) | 20 (21.3%) |
| 25 to 34 Years | 210 (71.7%) | 67 (22.9%) |
| 35 to 44 Years | 99 (47.8%) | 126 (60.9%) |
| 45 to 54 Years | 64 (21.2%) | 193 (63.9%) |
| 55 to 64 Years | 115 (56.1%) | 107 (52.2%) |
| 65 to 74 Years | 136 (91.9%) | 49 (33.1%) |
| 75 Years and over | 205 (95.8%) | 153 (71.5%) |
| Total | 1,228 (62.6%) | 842 (43.0%) |
Disability Status by Sex by Age in Owingsville
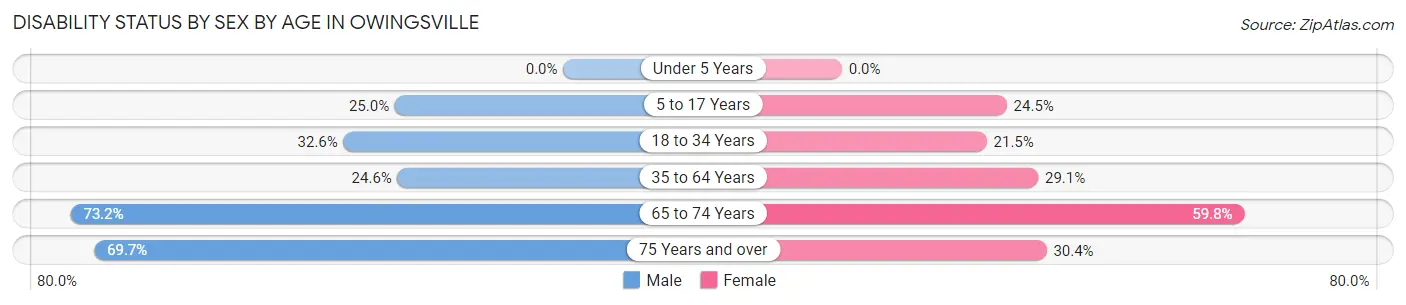
| Age Bracket | Male | Female |
| Under 5 Years | 0 (0.0%) | 0 (0.0%) |
| 5 to 17 Years | 50 (25.0%) | 35 (24.5%) |
| 18 to 34 Years | 62 (32.6%) | 46 (21.5%) |
| 35 to 64 Years | 76 (24.6%) | 118 (29.1%) |
| 65 to 74 Years | 41 (73.2%) | 55 (59.8%) |
| 75 Years and over | 23 (69.7%) | 55 (30.4%) |
Disability Class by Sex by Age in Owingsville
Disability Class: Hearing Difficulty
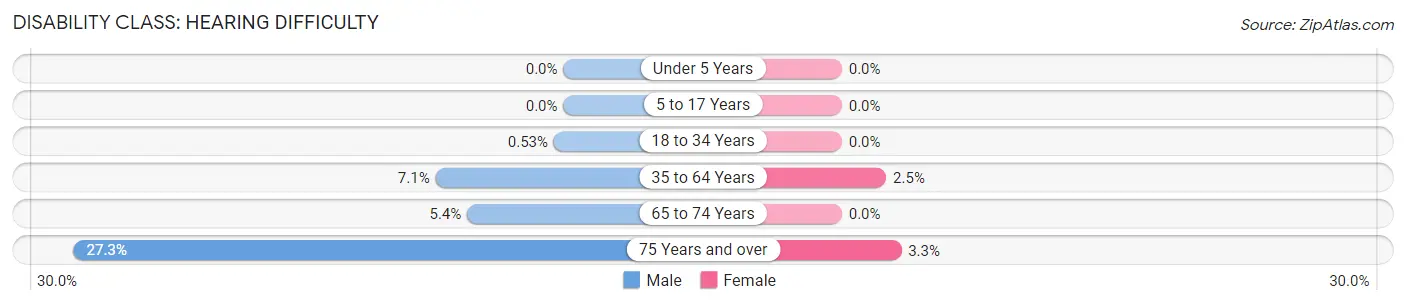
| Age Bracket | Male | Female |
| Under 5 Years | 0 (0.0%) | 0 (0.0%) |
| 5 to 17 Years | 0 (0.0%) | 0 (0.0%) |
| 18 to 34 Years | 1 (0.5%) | 0 (0.0%) |
| 35 to 64 Years | 22 (7.1%) | 10 (2.5%) |
| 65 to 74 Years | 3 (5.4%) | 0 (0.0%) |
| 75 Years and over | 9 (27.3%) | 6 (3.3%) |
Disability Class: Vision Difficulty
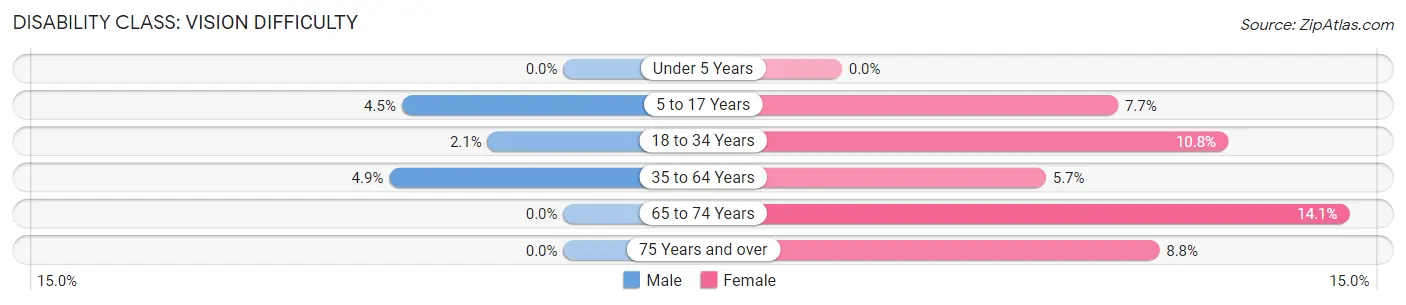
| Age Bracket | Male | Female |
| Under 5 Years | 0 (0.0%) | 0 (0.0%) |
| 5 to 17 Years | 9 (4.5%) | 11 (7.7%) |
| 18 to 34 Years | 4 (2.1%) | 23 (10.7%) |
| 35 to 64 Years | 15 (4.9%) | 23 (5.7%) |
| 65 to 74 Years | 0 (0.0%) | 13 (14.1%) |
| 75 Years and over | 0 (0.0%) | 16 (8.8%) |
Disability Class: Cognitive Difficulty
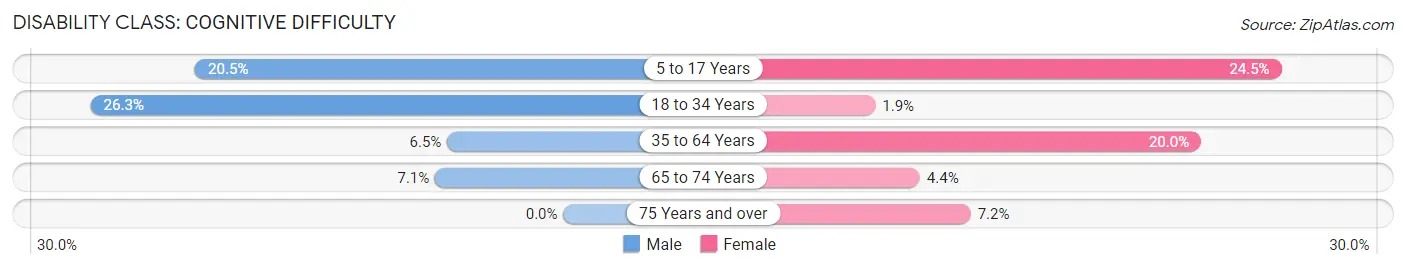
| Age Bracket | Male | Female |
| 5 to 17 Years | 41 (20.5%) | 35 (24.5%) |
| 18 to 34 Years | 50 (26.3%) | 4 (1.9%) |
| 35 to 64 Years | 20 (6.5%) | 81 (20.0%) |
| 65 to 74 Years | 4 (7.1%) | 4 (4.3%) |
| 75 Years and over | 0 (0.0%) | 13 (7.2%) |
Disability Class: Ambulatory Difficulty
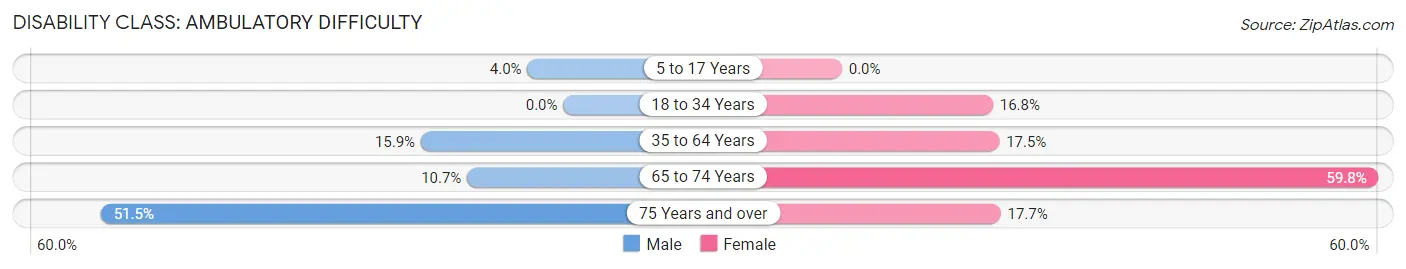
| Age Bracket | Male | Female |
| 5 to 17 Years | 8 (4.0%) | 0 (0.0%) |
| 18 to 34 Years | 0 (0.0%) | 36 (16.8%) |
| 35 to 64 Years | 49 (15.9%) | 71 (17.5%) |
| 65 to 74 Years | 6 (10.7%) | 55 (59.8%) |
| 75 Years and over | 17 (51.5%) | 32 (17.7%) |
Disability Class: Self-Care Difficulty
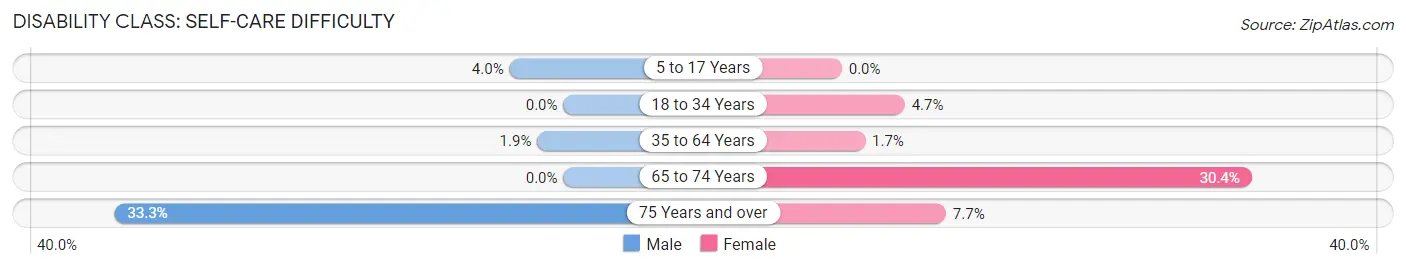
| Age Bracket | Male | Female |
| 5 to 17 Years | 8 (4.0%) | 0 (0.0%) |
| 18 to 34 Years | 0 (0.0%) | 10 (4.7%) |
| 35 to 64 Years | 6 (1.9%) | 7 (1.7%) |
| 65 to 74 Years | 0 (0.0%) | 28 (30.4%) |
| 75 Years and over | 11 (33.3%) | 14 (7.7%) |
Technology Access in Owingsville
Computing Device Access in Owingsville
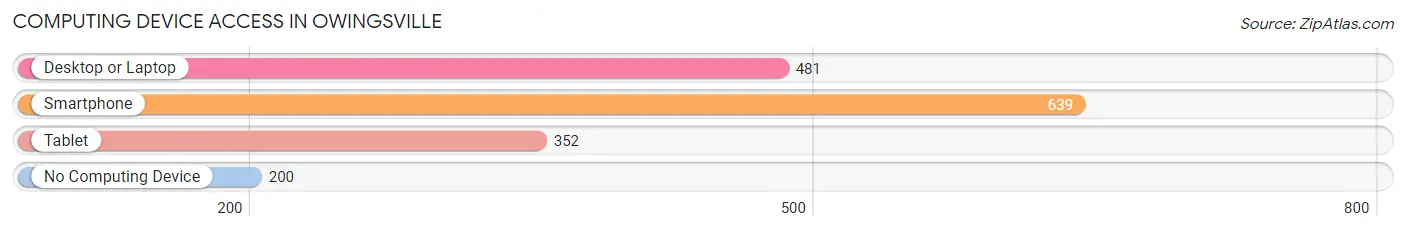
| Device Type | # Households | % Households |
| Desktop or Laptop | 481 | 54.5% |
| Smartphone | 639 | 72.5% |
| Tablet | 352 | 39.9% |
| No Computing Device | 200 | 22.7% |
| Total | 882 | 100.0% |
Internet Access in Owingsville
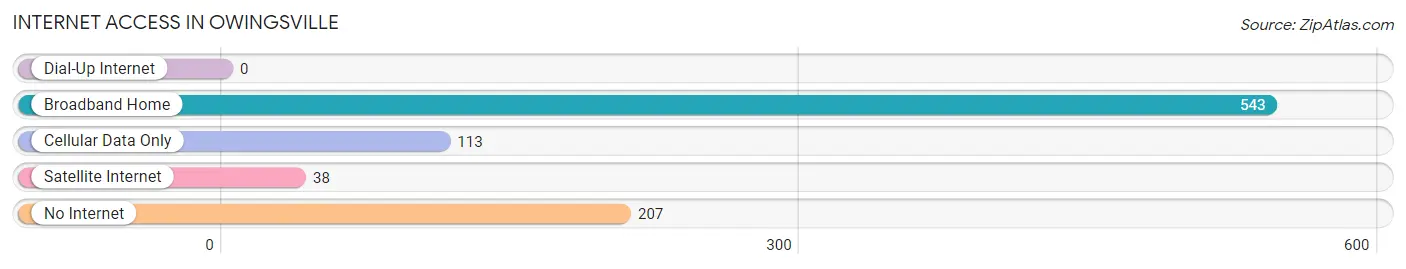
| Internet Type | # Households | % Households |
| Dial-Up Internet | 0 | 0.0% |
| Broadband Home | 543 | 61.6% |
| Cellular Data Only | 113 | 12.8% |
| Satellite Internet | 38 | 4.3% |
| No Internet | 207 | 23.5% |
| Total | 882 | 100.0% |
Owingsville Summary
Owingsville is a small town located in Bath County, Kentucky, United States. It is the county seat of Bath County and is located in the foothills of the Appalachian Mountains. The population was 1,717 at the 2010 census.
History
Owingsville was founded in 1797 by William Owings, a Revolutionary War veteran. Owings had been granted a large tract of land in the area by the state of Virginia in recognition of his service. He laid out the town and named it after himself. The town was incorporated in 1819.
Owingsville was an important stop on the Maysville and Lexington Turnpike, which connected the Ohio River to the interior of Kentucky. The turnpike was a major route for settlers and goods traveling between the two cities.
The town was also an important stop on the Kentucky Central Railroad, which connected the town to Lexington and Cincinnati. The railroad was completed in 1871 and was a major factor in the town's growth.
Geography
Owingsville is located in the foothills of the Appalachian Mountains in eastern Kentucky. The town is situated at the intersection of US Route 60 and Kentucky Route 36.
The town is located in a hilly area, with the highest point in the town being the summit of Owingsville Hill, which is 845 feet (258 m) above sea level. The town is located in the Eastern Coal Field region of Kentucky.
The climate in Owingsville is humid subtropical, with hot, humid summers and mild winters. The average annual temperature is 57.2 °F (14 °C). The average annual precipitation is 44.3 inches (112 cm).
Economy
The economy of Owingsville is largely based on agriculture and manufacturing. The town is home to several small businesses, including a furniture factory, a sawmill, and a feed mill.
The town is also home to several large employers, including a poultry processing plant, a plastics factory, and a metal fabrication plant.
Demographics
As of the 2010 census, the population of Owingsville was 1,717. The racial makeup of the town was 97.2% White, 0.9% African American, 0.2% Native American, 0.2% Asian, 0.1% Pacific Islander, 0.3% from other races, and 0.9% from two or more races. Hispanic or Latino of any race were 1.2% of the population.
The median income for a household in the town was $30,938, and the median income for a family was $37,917. The per capita income for the town was $17,845. About 17.2% of families and 20.2% of the population were below the poverty line, including 28.2% of those under age 18 and 16.2% of those age 65 or over.
Common Questions
What is Per Capita Income in Owingsville?
Per Capita income in Owingsville is $22,636.
What is the Median Family Income in Owingsville?
Median Family Income in Owingsville is $48,500.
What is the Median Household income in Owingsville?
Median Household Income in Owingsville is $38,255.
What is Income or Wage Gap in Owingsville?
Income or Wage Gap in Owingsville is 22.6%.
Women in Owingsville earn 77.4 cents for every dollar earned by a man.
What is Inequality or Gini Index in Owingsville?
Inequality or Gini Index in Owingsville is 0.45.
What is the Total Population of Owingsville?
Total Population of Owingsville is 1,960.
What is the Total Male Population of Owingsville?
Total Male Population of Owingsville is 842.
What is the Total Female Population of Owingsville?
Total Female Population of Owingsville is 1,118.
What is the Ratio of Males per 100 Females in Owingsville?
There are 75.31 Males per 100 Females in Owingsville.
What is the Ratio of Females per 100 Males in Owingsville?
There are 132.78 Females per 100 Males in Owingsville.
What is the Median Population Age in Owingsville?
Median Population Age in Owingsville is 38.1 Years.
What is the Average Family Size in Owingsville
Average Family Size in Owingsville is 3.1 People.
What is the Average Household Size in Owingsville
Average Household Size in Owingsville is 2.2 People.
How Large is the Labor Force in Owingsville?
There are 789 People in the Labor Forcein in Owingsville.
What is the Percentage of People in the Labor Force in Owingsville?
51.0% of People are in the Labor Force in Owingsville.
What is the Unemployment Rate in Owingsville?
Unemployment Rate in Owingsville is 5.2%.