Oak Grove, KY Map & Demographics
Oak Grove Map
Oak Grove Overview
$19,918
PER CAPITA INCOME
$42,458
AVG FAMILY INCOME
$40,740
AVG HOUSEHOLD INCOME
33.1%
WAGE / INCOME GAP [ % ]
66.9¢/ $1
WAGE / INCOME GAP [ $ ]
0.40
INEQUALITY / GINI INDEX
7,895
TOTAL POPULATION
4,135
MALE POPULATION
3,760
FEMALE POPULATION
109.97
MALES / 100 FEMALES
90.93
FEMALES / 100 MALES
24.6
MEDIAN AGE
3.5
AVG FAMILY SIZE
2.5
AVG HOUSEHOLD SIZE
3,536
LABOR FORCE [ PEOPLE ]
66.9%
PERCENT IN LABOR FORCE
12.2%
UNEMPLOYMENT RATE
Oak Grove Zip Codes
Oak Grove Area Codes
Income in Oak Grove
Income Overview in Oak Grove
Per Capita Income in Oak Grove is $19,918, while median incomes of families and households are $42,458 and $40,740 respectively.
| Characteristic | Number | Measure |
| Per Capita Income | 7,895 | $19,918 |
| Median Family Income | 1,757 | $42,458 |
| Mean Family Income | 1,757 | $55,248 |
| Median Household Income | 3,177 | $40,740 |
| Mean Household Income | 3,177 | $49,050 |
| Income Deficit | 1,757 | $0 |
| Wage / Income Gap (%) | 7,895 | 33.12% |
| Wage / Income Gap ($) | 7,895 | 66.88¢ per $1 |
| Gini / Inequality Index | 7,895 | 0.40 |
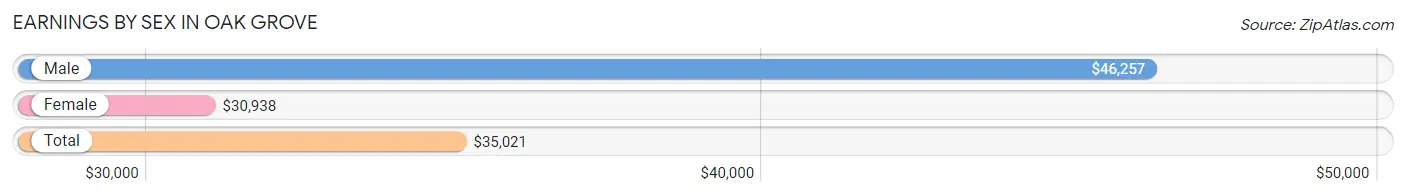
Earnings by Sex in Oak Grove
Average Earnings in Oak Grove are $35,021, $46,257 for men and $30,938 for women, a difference of 33.1%.
| Sex | Number | Average Earnings |
| Male | 1,848 (51.7%) | $46,257 |
| Female | 1,726 (48.3%) | $30,938 |
| Total | 3,574 (100.0%) | $35,021 |
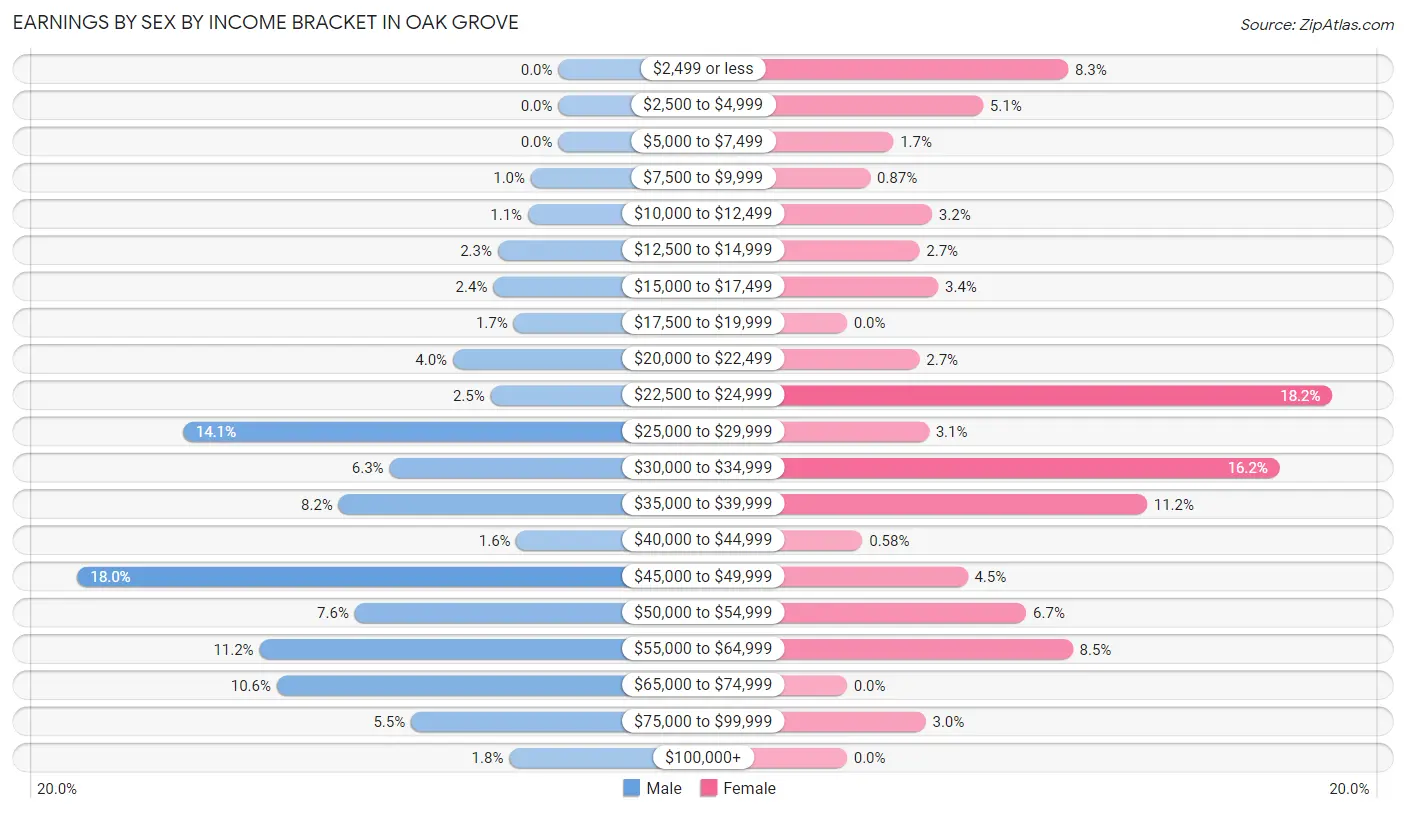
Earnings by Sex by Income Bracket in Oak Grove
The most common earnings brackets in Oak Grove are $45,000 to $49,999 for men (333 | 18.0%) and $22,500 to $24,999 for women (314 | 18.2%).
| Income | Male | Female |
| $2,499 or less | 0 (0.0%) | 143 (8.3%) |
| $2,500 to $4,999 | 0 (0.0%) | 88 (5.1%) |
| $5,000 to $7,499 | 0 (0.0%) | 30 (1.7%) |
| $7,500 to $9,999 | 19 (1.0%) | 15 (0.9%) |
| $10,000 to $12,499 | 21 (1.1%) | 55 (3.2%) |
| $12,500 to $14,999 | 42 (2.3%) | 47 (2.7%) |
| $15,000 to $17,499 | 45 (2.4%) | 59 (3.4%) |
| $17,500 to $19,999 | 31 (1.7%) | 0 (0.0%) |
| $20,000 to $22,499 | 73 (4.0%) | 47 (2.7%) |
| $22,500 to $24,999 | 47 (2.5%) | 314 (18.2%) |
| $25,000 to $29,999 | 260 (14.1%) | 53 (3.1%) |
| $30,000 to $34,999 | 117 (6.3%) | 280 (16.2%) |
| $35,000 to $39,999 | 152 (8.2%) | 194 (11.2%) |
| $40,000 to $44,999 | 29 (1.6%) | 10 (0.6%) |
| $45,000 to $49,999 | 333 (18.0%) | 78 (4.5%) |
| $50,000 to $54,999 | 141 (7.6%) | 116 (6.7%) |
| $55,000 to $64,999 | 207 (11.2%) | 146 (8.5%) |
| $65,000 to $74,999 | 195 (10.5%) | 0 (0.0%) |
| $75,000 to $99,999 | 102 (5.5%) | 51 (2.9%) |
| $100,000+ | 34 (1.8%) | 0 (0.0%) |
| Total | 1,848 (100.0%) | 1,726 (100.0%) |
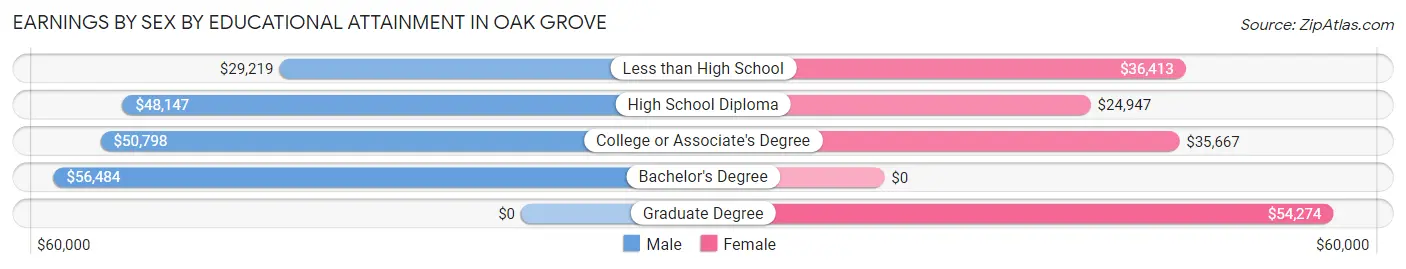
Earnings by Sex by Educational Attainment in Oak Grove
Average earnings in Oak Grove are $48,913 for men and $34,125 for women, a difference of 30.2%. Men with an educational attainment of bachelor's degree enjoy the highest average annual earnings of $56,484, while those with less than high school education earn the least with $29,219. Women with an educational attainment of graduate degree earn the most with the average annual earnings of $54,274, while those with high school diploma education have the smallest earnings of $24,947.
| Educational Attainment | Male Income | Female Income |
| Less than High School | $29,219 | $36,413 |
| High School Diploma | $48,147 | $24,947 |
| College or Associate's Degree | $50,798 | $35,667 |
| Bachelor's Degree | $56,484 | $0 |
| Graduate Degree | - | - |
| Total | $48,913 | $34,125 |
Family Income in Oak Grove
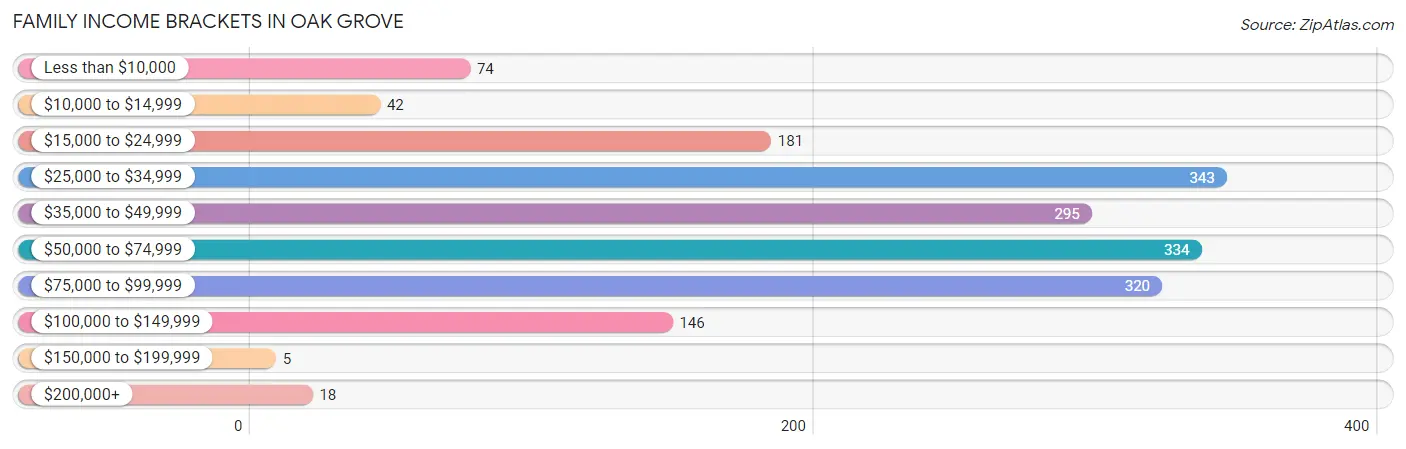
Family Income Brackets in Oak Grove
According to the Oak Grove family income data, there are 343 families falling into the $25,000 to $34,999 income range, which is the most common income bracket and makes up 19.5% of all families. Conversely, the $150,000 to $199,999 income bracket is the least frequent group with only 5 families (0.3%) belonging to this category.
| Income Bracket | # Families | % Families |
| Less than $10,000 | 74 | 4.2% |
| $10,000 to $14,999 | 42 | 2.4% |
| $15,000 to $24,999 | 181 | 10.3% |
| $25,000 to $34,999 | 343 | 19.5% |
| $35,000 to $49,999 | 295 | 16.8% |
| $50,000 to $74,999 | 334 | 19.0% |
| $75,000 to $99,999 | 320 | 18.2% |
| $100,000 to $149,999 | 146 | 8.3% |
| $150,000 to $199,999 | 5 | 0.3% |
| $200,000+ | 18 | 1.0% |
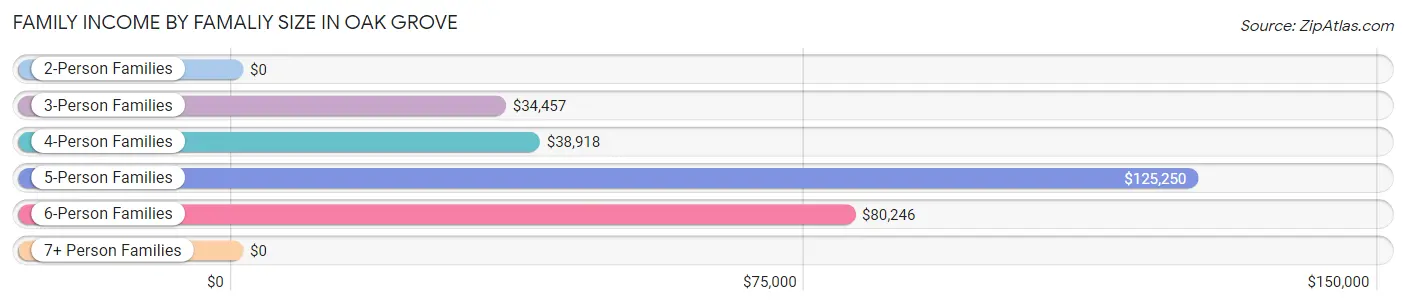
Family Income by Famaliy Size in Oak Grove
5-person families (140 | 8.0%) account for the highest median family income in Oak Grove with $125,250 per family, while 5-person families (140 | 8.0%) have the highest median income of $25,050 per family member.
| Income Bracket | # Families | Median Income |
| 2-Person Families | 724 (41.2%) | $0 |
| 3-Person Families | 286 (16.3%) | $34,457 |
| 4-Person Families | 387 (22.0%) | $38,918 |
| 5-Person Families | 140 (8.0%) | $125,250 |
| 6-Person Families | 220 (12.5%) | $80,246 |
| 7+ Person Families | 0 (0.0%) | $0 |
| Total | 1,757 (100.0%) | $42,458 |
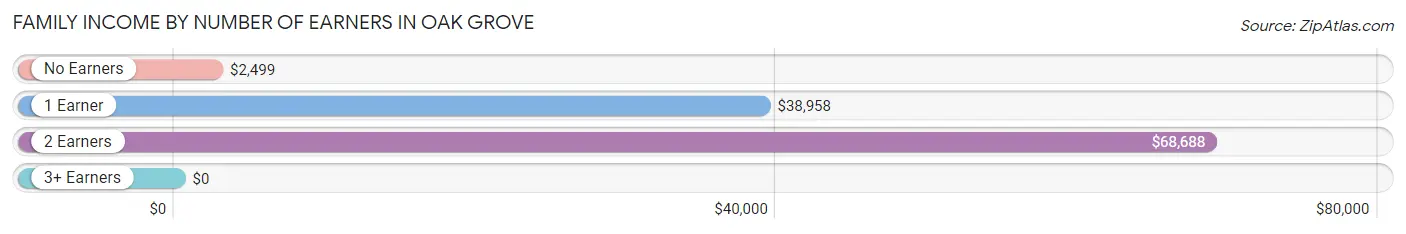
Family Income by Number of Earners in Oak Grove
| Number of Earners | # Families | Median Income |
| No Earners | 67 (3.8%) | $2,499 |
| 1 Earner | 1,029 (58.6%) | $38,958 |
| 2 Earners | 618 (35.2%) | $68,688 |
| 3+ Earners | 43 (2.5%) | $0 |
| Total | 1,757 (100.0%) | $42,458 |
Household Income in Oak Grove
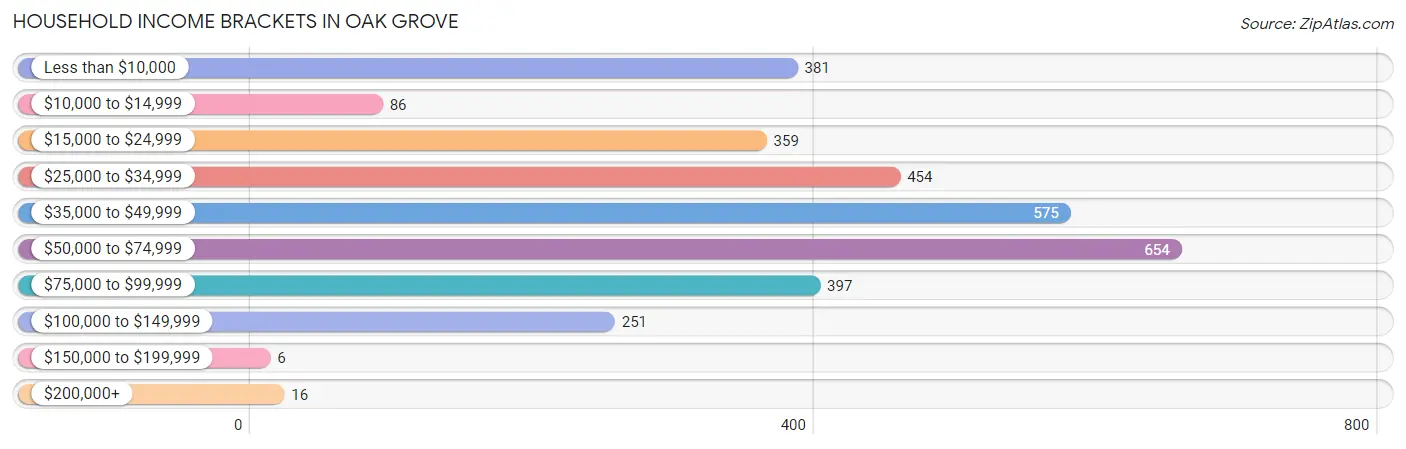
Household Income Brackets in Oak Grove
With 654 households falling in the category, the $50,000 to $74,999 income range is the most frequent in Oak Grove, accounting for 20.6% of all households. In contrast, only 6 households (0.2%) fall into the $150,000 to $199,999 income bracket, making it the least populous group.
| Income Bracket | # Households | % Households |
| Less than $10,000 | 381 | 12.0% |
| $10,000 to $14,999 | 86 | 2.7% |
| $15,000 to $24,999 | 359 | 11.3% |
| $25,000 to $34,999 | 454 | 14.3% |
| $35,000 to $49,999 | 575 | 18.1% |
| $50,000 to $74,999 | 654 | 20.6% |
| $75,000 to $99,999 | 397 | 12.5% |
| $100,000 to $149,999 | 251 | 7.9% |
| $150,000 to $199,999 | 6 | 0.2% |
| $200,000+ | 16 | 0.5% |
Household Income by Householder Age in Oak Grove
The median household income in Oak Grove is $40,740, with the highest median household income of $52,148 found in the 25 to 44 years age bracket for the primary householder. A total of 1,677 households (52.8%) fall into this category. Meanwhile, the 65+ years age bracket for the primary householder has the lowest median household income of $27,130, with 147 households (4.6%) in this group.
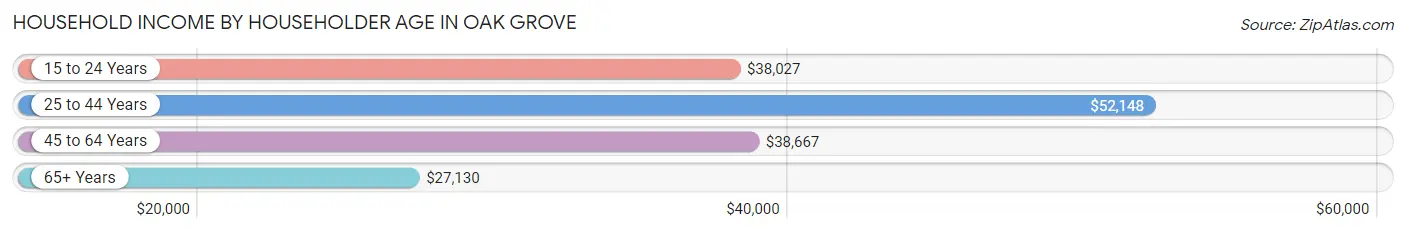
| Income Bracket | # Households | Median Income |
| 15 to 24 Years | 713 (22.4%) | $38,027 |
| 25 to 44 Years | 1,677 (52.8%) | $52,148 |
| 45 to 64 Years | 640 (20.1%) | $38,667 |
| 65+ Years | 147 (4.6%) | $27,130 |
| Total | 3,177 (100.0%) | $40,740 |
Poverty in Oak Grove
Income Below Poverty by Sex and Age in Oak Grove
With 15.6% poverty level for males and 13.6% for females among the residents of Oak Grove, 12 to 14 year old males and 55 to 64 year old females are the most vulnerable to poverty, with 61 males (100.0%) and 56 females (34.4%) in their respective age groups living below the poverty level.
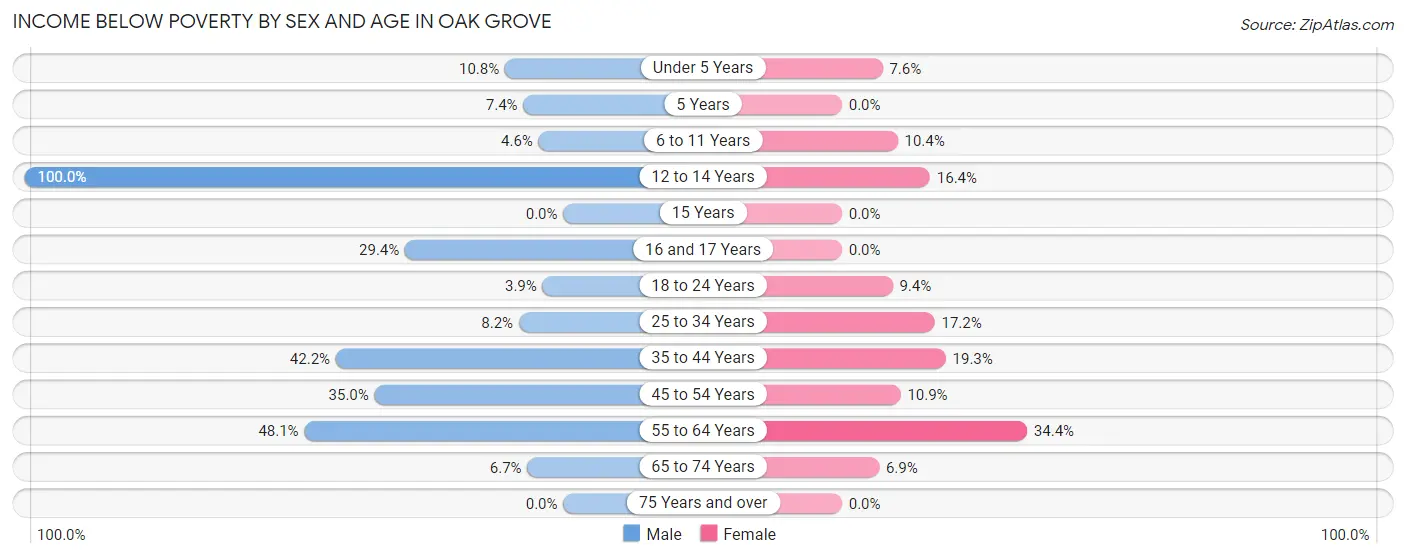
| Age Bracket | Male | Female |
| Under 5 Years | 53 (10.8%) | 33 (7.5%) |
| 5 Years | 8 (7.4%) | 0 (0.0%) |
| 6 to 11 Years | 31 (4.6%) | 38 (10.3%) |
| 12 to 14 Years | 61 (100.0%) | 52 (16.4%) |
| 15 Years | 0 (0.0%) | 0 (0.0%) |
| 16 and 17 Years | 42 (29.4%) | 0 (0.0%) |
| 18 to 24 Years | 21 (3.8%) | 74 (9.4%) |
| 25 to 34 Years | 87 (8.2%) | 114 (17.2%) |
| 35 to 44 Years | 198 (42.2%) | 100 (19.3%) |
| 45 to 54 Years | 69 (35.0%) | 38 (10.9%) |
| 55 to 64 Years | 62 (48.1%) | 56 (34.4%) |
| 65 to 74 Years | 8 (6.7%) | 8 (6.9%) |
| 75 Years and over | 0 (0.0%) | 0 (0.0%) |
| Total | 640 (15.6%) | 513 (13.6%) |
Income Above Poverty by Sex and Age in Oak Grove
According to the poverty statistics in Oak Grove, males aged 15 years and females aged 5 years are the age groups that are most secure financially, with 100.0% of males and 100.0% of females in these age groups living above the poverty line.
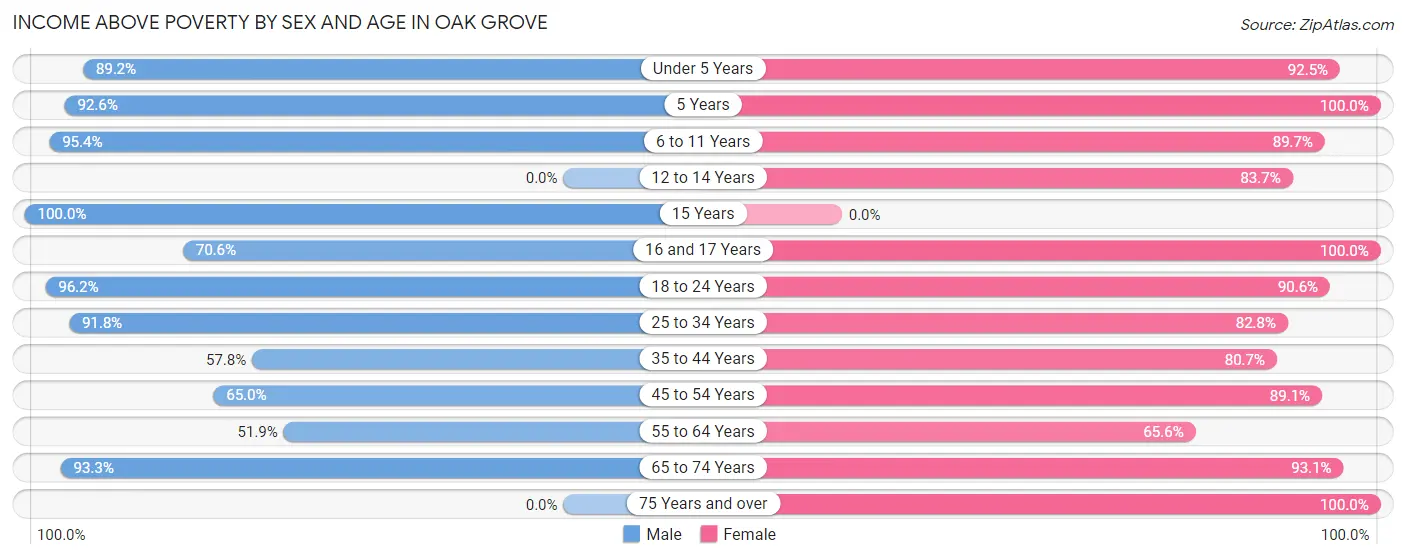
| Age Bracket | Male | Female |
| Under 5 Years | 437 (89.2%) | 404 (92.4%) |
| 5 Years | 100 (92.6%) | 12 (100.0%) |
| 6 to 11 Years | 646 (95.4%) | 329 (89.6%) |
| 12 to 14 Years | 0 (0.0%) | 266 (83.7%) |
| 15 Years | 107 (100.0%) | 0 (0.0%) |
| 16 and 17 Years | 101 (70.6%) | 13 (100.0%) |
| 18 to 24 Years | 524 (96.2%) | 713 (90.6%) |
| 25 to 34 Years | 969 (91.8%) | 548 (82.8%) |
| 35 to 44 Years | 271 (57.8%) | 419 (80.7%) |
| 45 to 54 Years | 128 (65.0%) | 311 (89.1%) |
| 55 to 64 Years | 67 (51.9%) | 107 (65.6%) |
| 65 to 74 Years | 112 (93.3%) | 108 (93.1%) |
| 75 Years and over | 0 (0.0%) | 17 (100.0%) |
| Total | 3,462 (84.4%) | 3,247 (86.4%) |
Income Below Poverty Among Married-Couple Families in Oak Grove
The poverty statistics for married-couple families in Oak Grove show that 6.1% or 60 of the total 989 families live below the poverty line. Families with 3 or 4 children have the highest poverty rate of 7.2%, comprising of 15 families. On the other hand, families with 1 or 2 children have the lowest poverty rate of 4.7%, which includes 21 families.
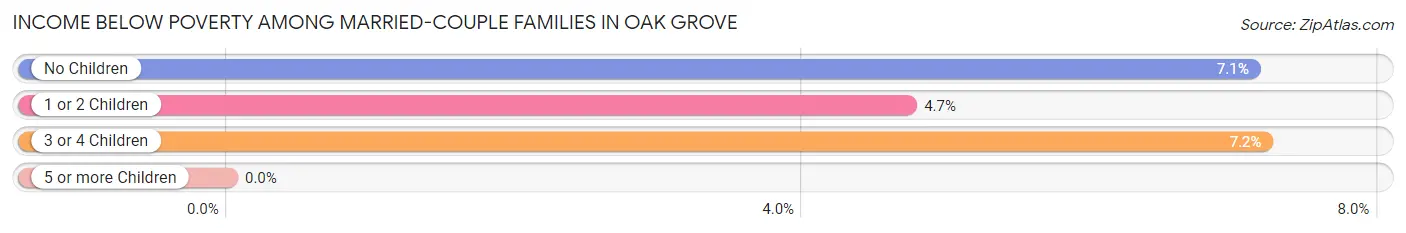
| Children | Above Poverty | Below Poverty |
| No Children | 313 (92.9%) | 24 (7.1%) |
| 1 or 2 Children | 423 (95.3%) | 21 (4.7%) |
| 3 or 4 Children | 193 (92.8%) | 15 (7.2%) |
| 5 or more Children | 0 (0.0%) | 0 (0.0%) |
| Total | 929 (93.9%) | 60 (6.1%) |
Income Below Poverty Among Single-Parent Households in Oak Grove
According to the poverty data in Oak Grove, 22.8% or 21 single-father households and 19.2% or 130 single-mother households are living below the poverty line. Among single-father households, those with 1 or 2 children have the highest poverty rate, with 21 households (28.0%) experiencing poverty. Likewise, among single-mother households, those with 3 or 4 children have the highest poverty rate, with 38 households (29.9%) falling below the poverty line.
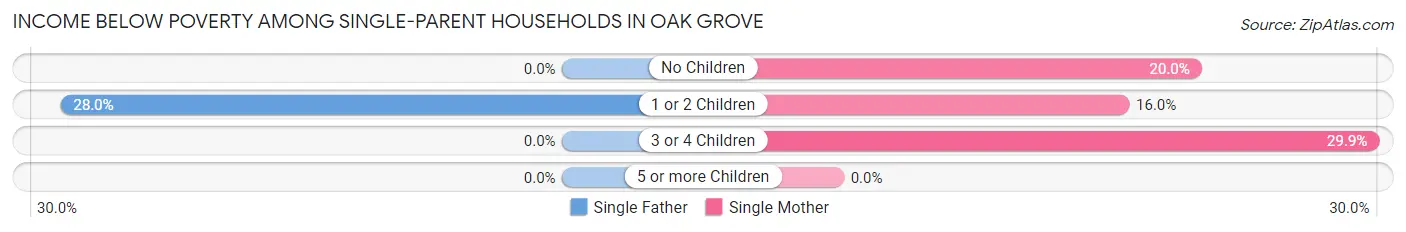
| Children | Single Father | Single Mother |
| No Children | 0 (0.0%) | 22 (20.0%) |
| 1 or 2 Children | 21 (28.0%) | 70 (16.0%) |
| 3 or 4 Children | 0 (0.0%) | 38 (29.9%) |
| 5 or more Children | 0 (0.0%) | 0 (0.0%) |
| Total | 21 (22.8%) | 130 (19.2%) |
Income Below Poverty Among Married-Couple vs Single-Parent Households in Oak Grove
The poverty data for Oak Grove shows that 60 of the married-couple family households (6.1%) and 151 of the single-parent households (19.7%) are living below the poverty level. Within the married-couple family households, those with 3 or 4 children have the highest poverty rate, with 15 households (7.2%) falling below the poverty line. Among the single-parent households, those with 3 or 4 children have the highest poverty rate, with 38 household (29.9%) living below poverty.
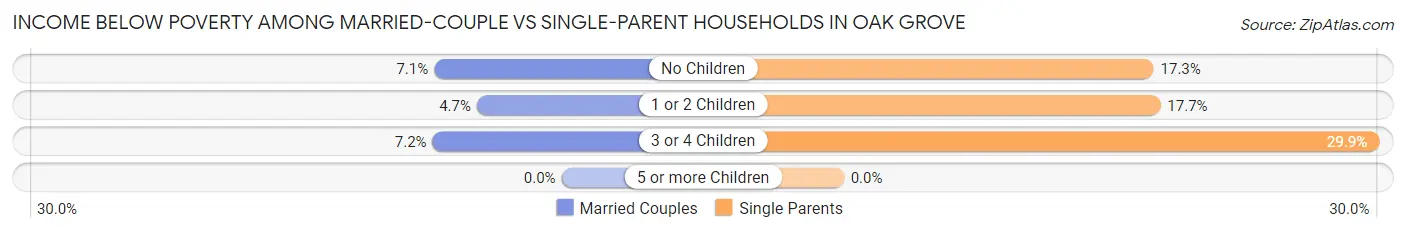
| Children | Married-Couple Families | Single-Parent Households |
| No Children | 24 (7.1%) | 22 (17.3%) |
| 1 or 2 Children | 21 (4.7%) | 91 (17.7%) |
| 3 or 4 Children | 15 (7.2%) | 38 (29.9%) |
| 5 or more Children | 0 (0.0%) | 0 (0.0%) |
| Total | 60 (6.1%) | 151 (19.7%) |
Race in Oak Grove
The most populous races in Oak Grove are White / Caucasian (4,693 | 59.4%), Black / African American (1,871 | 23.7%), and Two or more Races (1,174 | 14.9%).
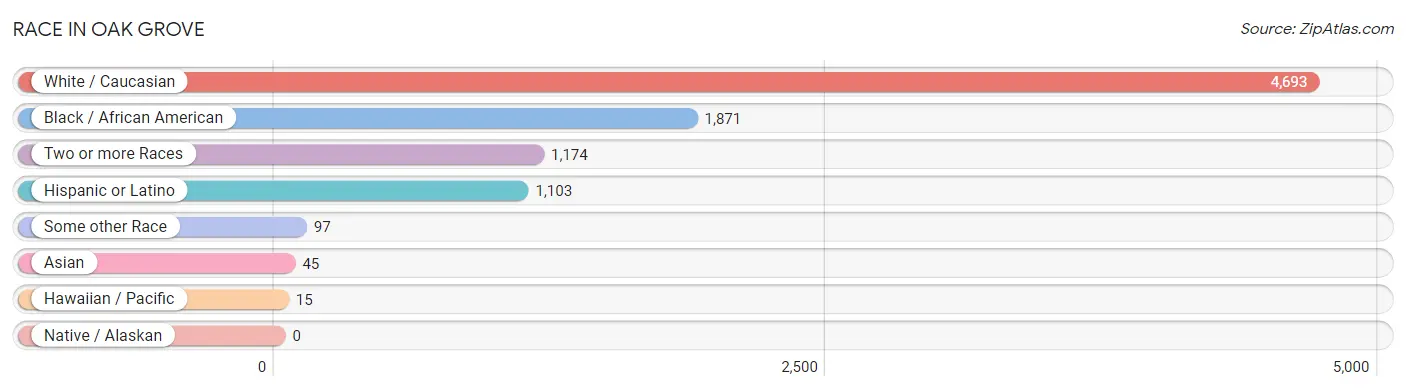
| Race | # Population | % Population |
| Asian | 45 | 0.6% |
| Black / African American | 1,871 | 23.7% |
| Hawaiian / Pacific | 15 | 0.2% |
| Hispanic or Latino | 1,103 | 14.0% |
| Native / Alaskan | 0 | 0.0% |
| White / Caucasian | 4,693 | 59.4% |
| Two or more Races | 1,174 | 14.9% |
| Some other Race | 97 | 1.2% |
| Total | 7,895 | 100.0% |
Ancestry in Oak Grove
The most populous ancestries reported in Oak Grove are German (1,033 | 13.1%), Mexican (754 | 9.6%), Irish (431 | 5.5%), Italian (428 | 5.4%), and Puerto Rican (349 | 4.4%), together accounting for 37.9% of all Oak Grove residents.
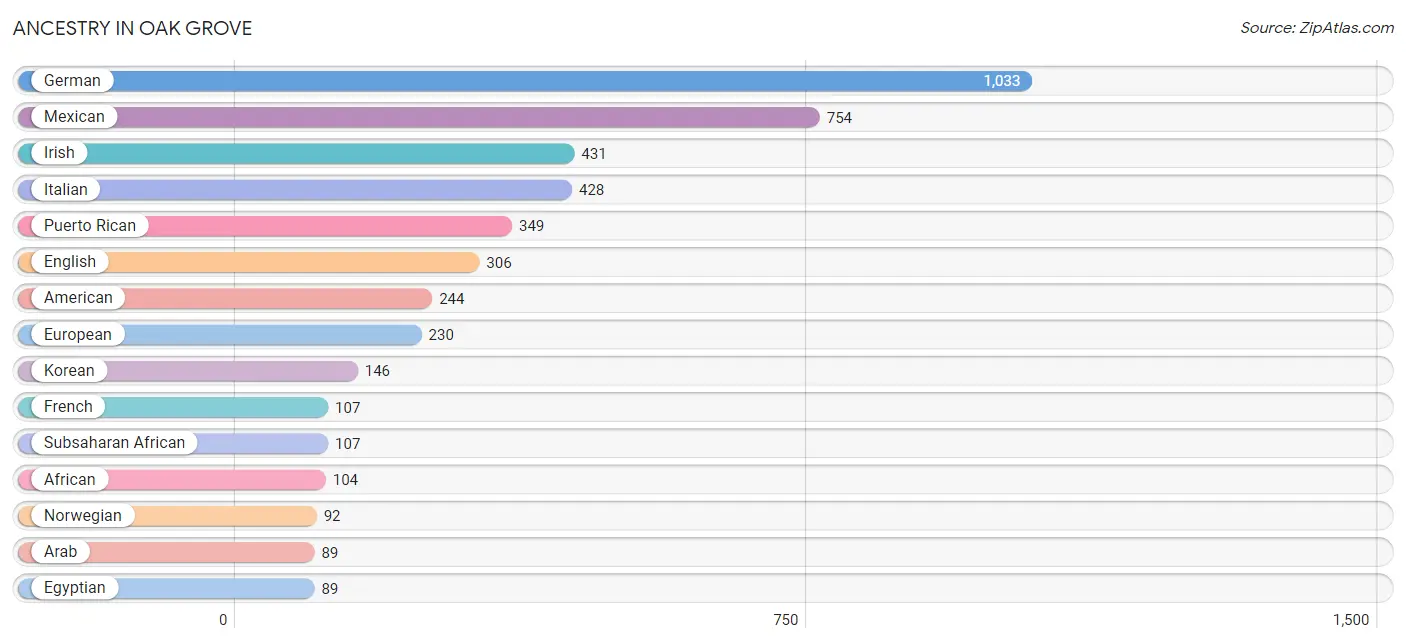
| Ancestry | # Population | % Population |
| African | 104 | 1.3% |
| American | 244 | 3.1% |
| Arab | 89 | 1.1% |
| Belgian | 43 | 0.5% |
| Bhutanese | 38 | 0.5% |
| Burmese | 12 | 0.2% |
| Cherokee | 48 | 0.6% |
| Dutch | 18 | 0.2% |
| Eastern European | 36 | 0.5% |
| Egyptian | 89 | 1.1% |
| English | 306 | 3.9% |
| European | 230 | 2.9% |
| French | 107 | 1.4% |
| French Canadian | 12 | 0.2% |
| German | 1,033 | 13.1% |
| Hungarian | 16 | 0.2% |
| Irish | 431 | 5.5% |
| Italian | 428 | 5.4% |
| Korean | 146 | 1.8% |
| Mexican | 754 | 9.6% |
| Native Hawaiian | 6 | 0.1% |
| Nigerian | 3 | 0.0% |
| Norwegian | 92 | 1.2% |
| Polish | 75 | 0.9% |
| Puerto Rican | 349 | 4.4% |
| Russian | 39 | 0.5% |
| Scandinavian | 21 | 0.3% |
| Scotch-Irish | 29 | 0.4% |
| Scottish | 31 | 0.4% |
| Slovene | 20 | 0.3% |
| Sri Lankan | 72 | 0.9% |
| Subsaharan African | 107 | 1.4% |
| Swedish | 7 | 0.1% |
| Welsh | 41 | 0.5% | View All 34 Rows |
Immigrants in Oak Grove
The most numerous immigrant groups reported in Oak Grove came from Latin America (144 | 1.8%), Central America (112 | 1.4%), Mexico (112 | 1.4%), Caribbean (32 | 0.4%), and Haiti (32 | 0.4%), together accounting for 5.5% of all Oak Grove residents.
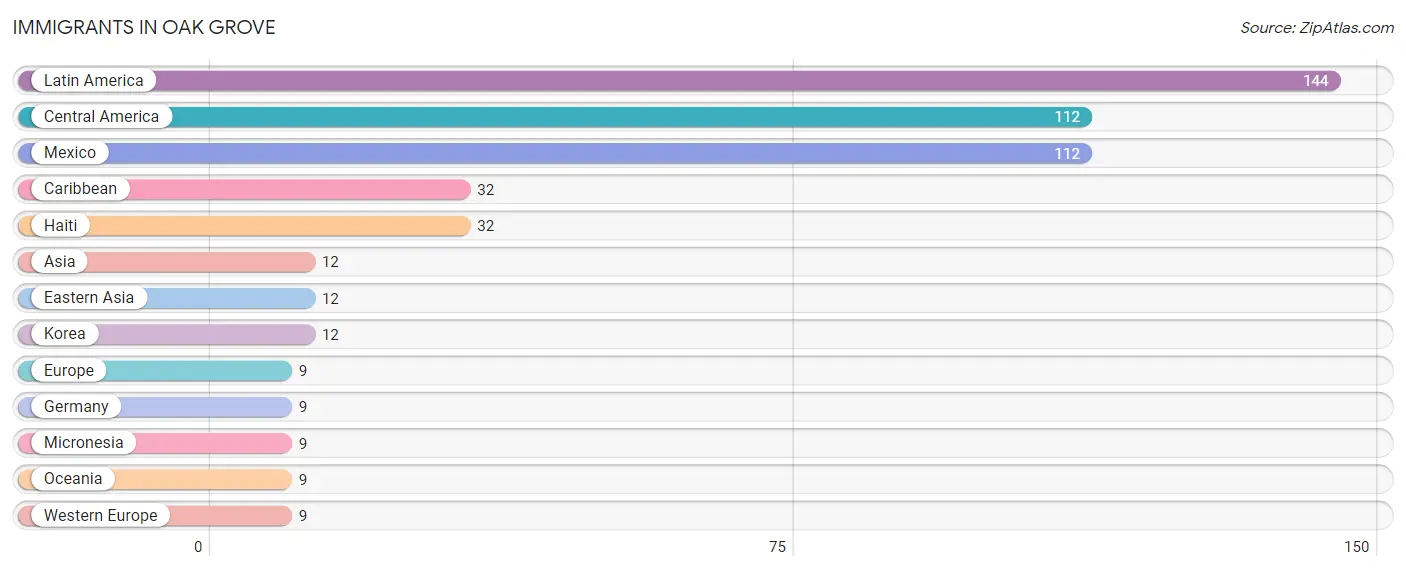
| Immigration Origin | # Population | % Population |
| Asia | 12 | 0.2% |
| Caribbean | 32 | 0.4% |
| Central America | 112 | 1.4% |
| Eastern Asia | 12 | 0.2% |
| Europe | 9 | 0.1% |
| Germany | 9 | 0.1% |
| Haiti | 32 | 0.4% |
| Korea | 12 | 0.2% |
| Latin America | 144 | 1.8% |
| Mexico | 112 | 1.4% |
| Micronesia | 9 | 0.1% |
| Oceania | 9 | 0.1% |
| Western Europe | 9 | 0.1% | View All 13 Rows |
Sex and Age in Oak Grove
Sex and Age in Oak Grove
The most populous age groups in Oak Grove are 25 to 29 Years (864 | 20.9%) for men and 20 to 24 Years (672 | 17.9%) for women.
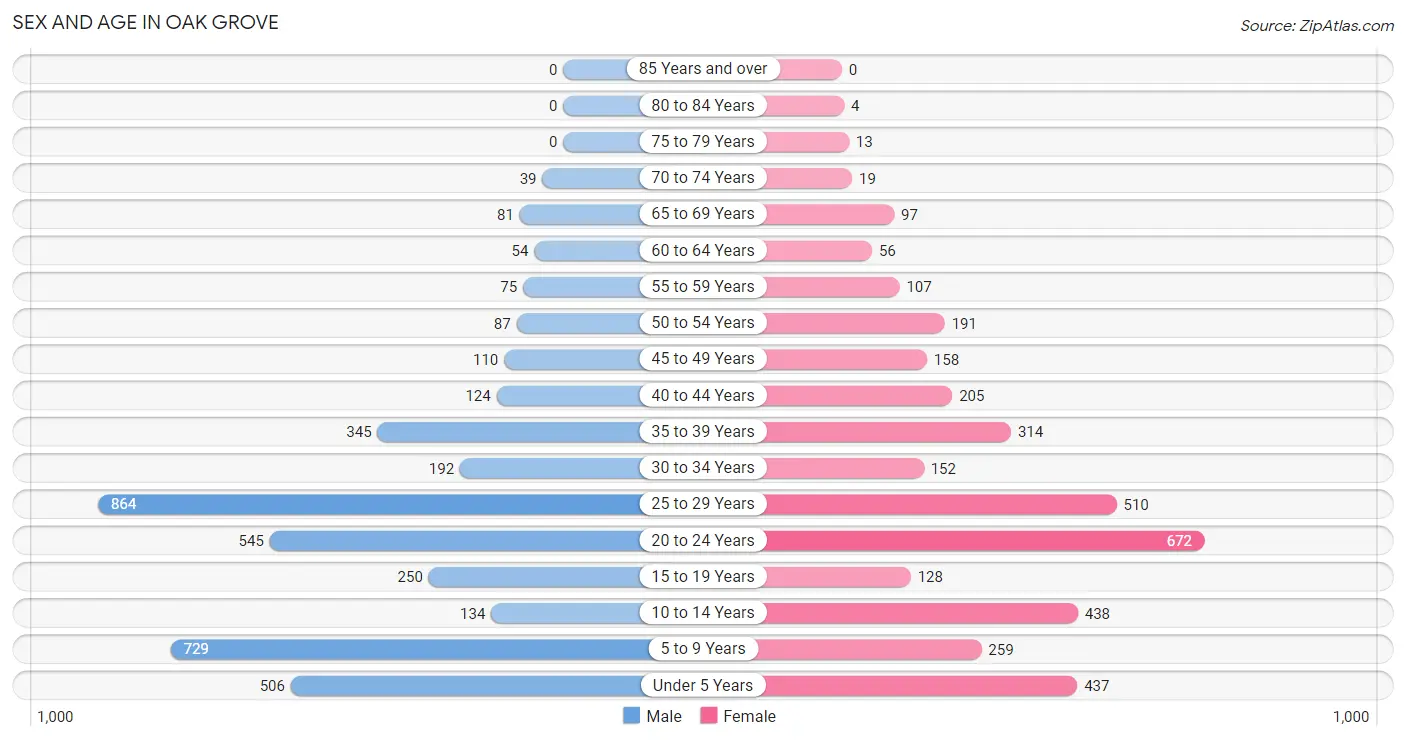
| Age Bracket | Male | Female |
| Under 5 Years | 506 (12.2%) | 437 (11.6%) |
| 5 to 9 Years | 729 (17.6%) | 259 (6.9%) |
| 10 to 14 Years | 134 (3.2%) | 438 (11.7%) |
| 15 to 19 Years | 250 (6.0%) | 128 (3.4%) |
| 20 to 24 Years | 545 (13.2%) | 672 (17.9%) |
| 25 to 29 Years | 864 (20.9%) | 510 (13.6%) |
| 30 to 34 Years | 192 (4.6%) | 152 (4.0%) |
| 35 to 39 Years | 345 (8.3%) | 314 (8.4%) |
| 40 to 44 Years | 124 (3.0%) | 205 (5.4%) |
| 45 to 49 Years | 110 (2.7%) | 158 (4.2%) |
| 50 to 54 Years | 87 (2.1%) | 191 (5.1%) |
| 55 to 59 Years | 75 (1.8%) | 107 (2.9%) |
| 60 to 64 Years | 54 (1.3%) | 56 (1.5%) |
| 65 to 69 Years | 81 (2.0%) | 97 (2.6%) |
| 70 to 74 Years | 39 (0.9%) | 19 (0.5%) |
| 75 to 79 Years | 0 (0.0%) | 13 (0.4%) |
| 80 to 84 Years | 0 (0.0%) | 4 (0.1%) |
| 85 Years and over | 0 (0.0%) | 0 (0.0%) |
| Total | 4,135 (100.0%) | 3,760 (100.0%) |
Families and Households in Oak Grove
Median Family Size in Oak Grove
The median family size in Oak Grove is 3.45 persons per family, with married-couple families (989 | 56.3%) accounting for the largest median family size of 3.84 persons per family. On the other hand, single male/father families (92 | 5.2%) represent the smallest median family size with 2.63 persons per family.
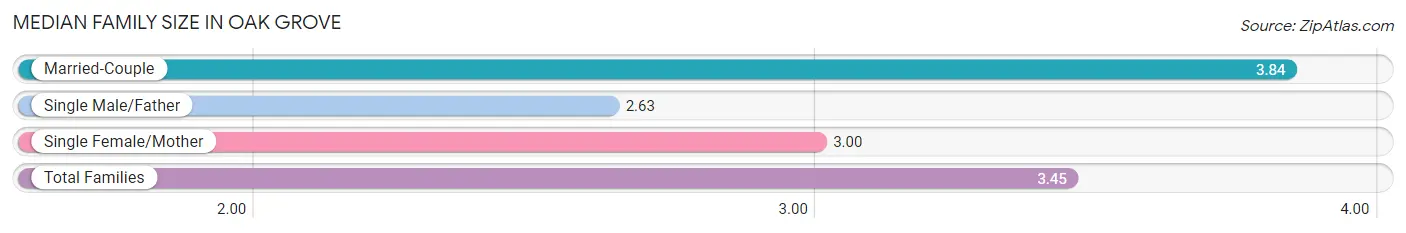
| Family Type | # Families | Family Size |
| Married-Couple | 989 (56.3%) | 3.84 |
| Single Male/Father | 92 (5.2%) | 2.63 |
| Single Female/Mother | 676 (38.5%) | 3.00 |
| Total Families | 1,757 (100.0%) | 3.45 |
Median Household Size in Oak Grove
The median household size in Oak Grove is 2.49 persons per household, with married-couple households (989 | 31.1%) accounting for the largest median household size of 3.84 persons per household. non-family households (1,420 | 44.7%) represent the smallest median household size with 1.22 persons per household.
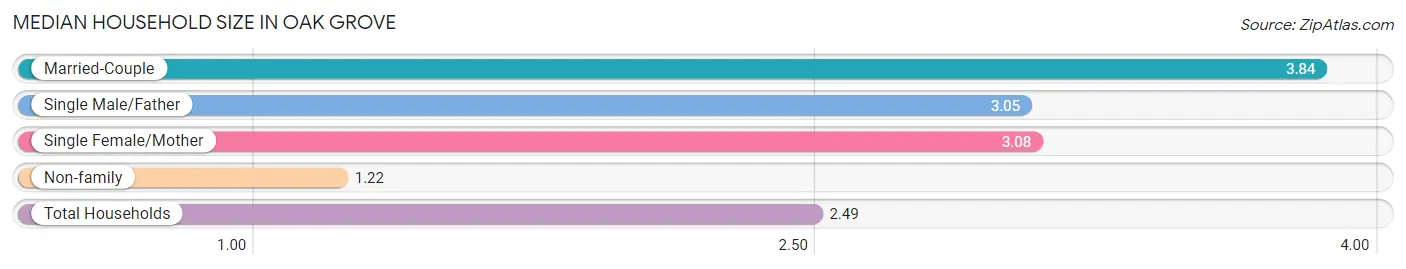
| Household Type | # Households | Household Size |
| Married-Couple | 989 (31.1%) | 3.84 |
| Single Male/Father | 92 (2.9%) | 3.05 |
| Single Female/Mother | 676 (21.3%) | 3.08 |
| Non-family | 1,420 (44.7%) | 1.22 |
| Total Households | 3,177 (100.0%) | 2.49 |
Household Size by Marriage Status in Oak Grove
Out of a total of 3,177 households in Oak Grove, 1,757 (55.3%) are family households, while 1,420 (44.7%) are nonfamily households. The most numerous type of family households are 2-person households, comprising 707, and the most common type of nonfamily households are 1-person households, comprising 1,125.
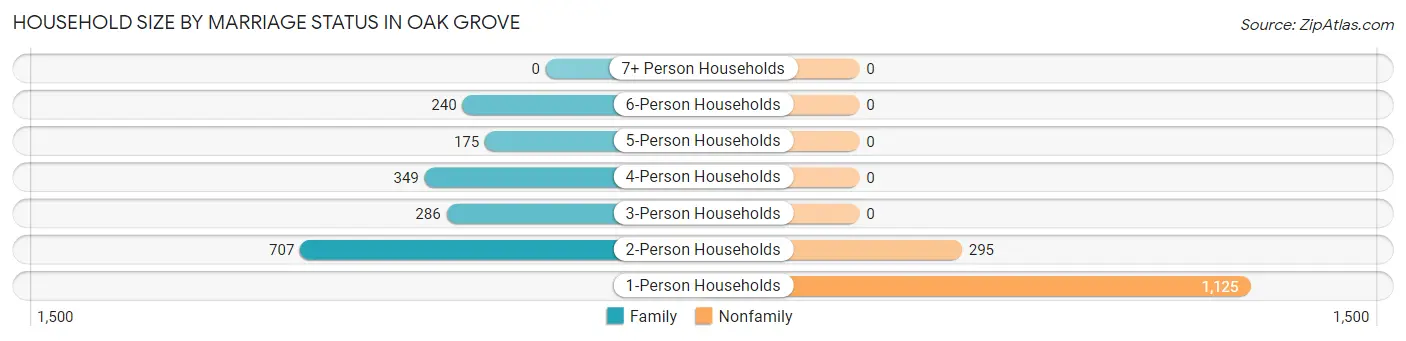
| Household Size | Family Households | Nonfamily Households |
| 1-Person Households | - | 1,125 (35.4%) |
| 2-Person Households | 707 (22.3%) | 295 (9.3%) |
| 3-Person Households | 286 (9.0%) | 0 (0.0%) |
| 4-Person Households | 349 (11.0%) | 0 (0.0%) |
| 5-Person Households | 175 (5.5%) | 0 (0.0%) |
| 6-Person Households | 240 (7.5%) | 0 (0.0%) |
| 7+ Person Households | 0 (0.0%) | 0 (0.0%) |
| Total | 1,757 (55.3%) | 1,420 (44.7%) |
Female Fertility in Oak Grove
Fertility by Age in Oak Grove
Average fertility rate in Oak Grove is 102.0 births per 1,000 women. Women in the age bracket of 20 to 34 years have the highest fertility rate with 166.0 births per 1,000 women. Women in the age bracket of 20 to 34 years acount for 100.0% of all women with births.
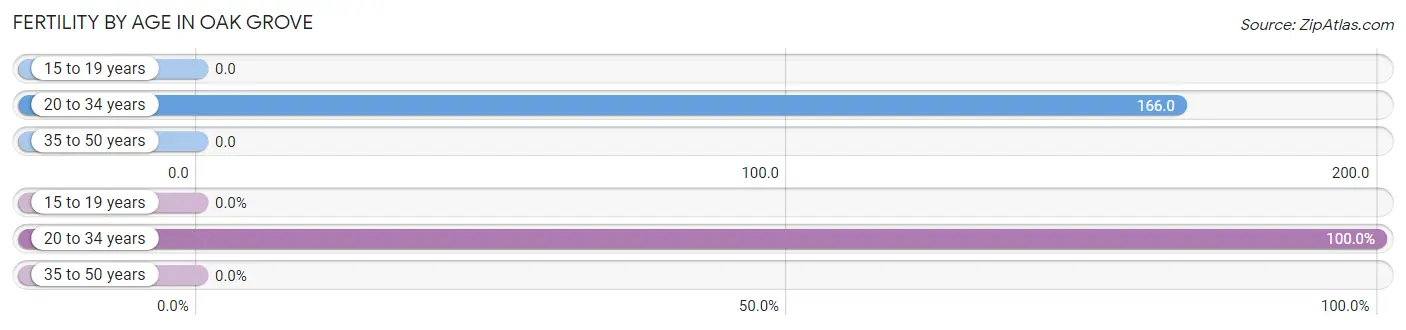
| Age Bracket | Women with Births | Births / 1,000 Women |
| 15 to 19 years | 0 (0.0%) | 0.0 |
| 20 to 34 years | 222 (100.0%) | 166.0 |
| 35 to 50 years | 0 (0.0%) | 0.0 |
| Total | 222 (100.0%) | 102.0 |
Fertility by Age by Marriage Status in Oak Grove
53.2% of women with births (222) in Oak Grove are married. The highest percentage of unmarried women with births falls into 20 to 34 years age bracket with 46.9% of them unmarried at the time of birth, while the lowest percentage of unmarried women with births belong to 20 to 34 years age bracket with 46.9% of them unmarried.
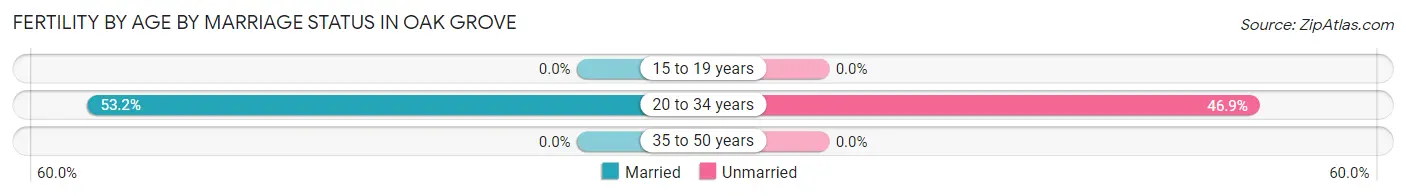
| Age Bracket | Married | Unmarried |
| 15 to 19 years | 0 (0.0%) | 0 (0.0%) |
| 20 to 34 years | 118 (53.1%) | 104 (46.9%) |
| 35 to 50 years | 0 (0.0%) | 0 (0.0%) |
| Total | 118 (53.1%) | 104 (46.9%) |
Fertility by Education in Oak Grove
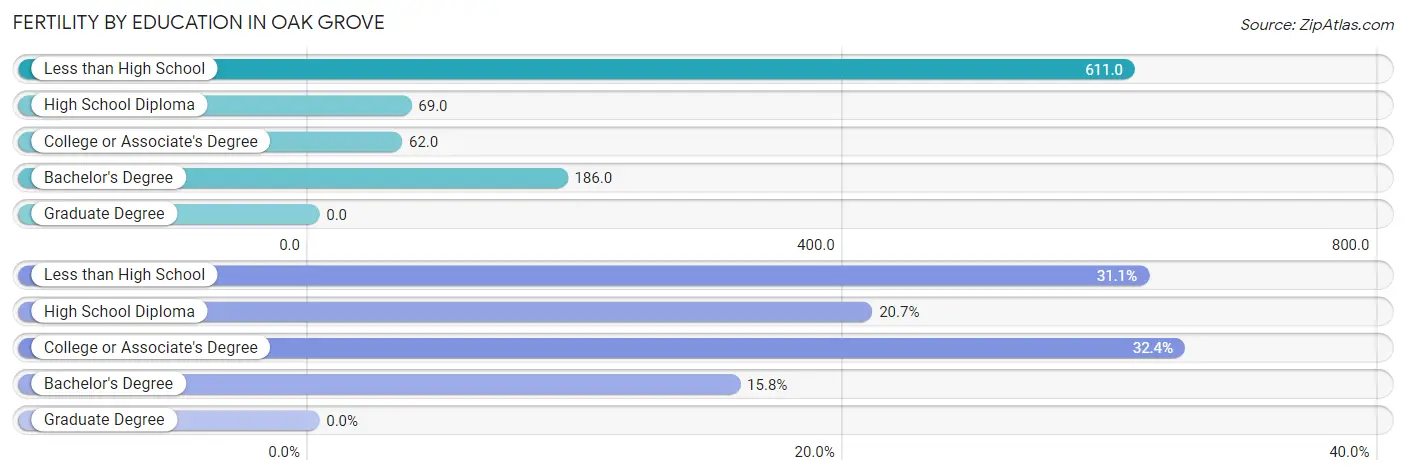
| Educational Attainment | Women with Births | Births / 1,000 Women |
| Less than High School | 69 (31.1%) | 611.0 |
| High School Diploma | 46 (20.7%) | 69.0 |
| College or Associate's Degree | 72 (32.4%) | 62.0 |
| Bachelor's Degree | 35 (15.8%) | 186.0 |
| Graduate Degree | 0 (0.0%) | 0.0 |
| Total | 222 (100.0%) | 102.0 |
Fertility by Education by Marriage Status in Oak Grove
46.9% of women with births in Oak Grove are unmarried. Women with the educational attainment of high school diploma are most likely to be married with 100.0% of them married at childbirth, while women with the educational attainment of less than high school are least likely to be married with 100.0% of them unmarried at childbirth.
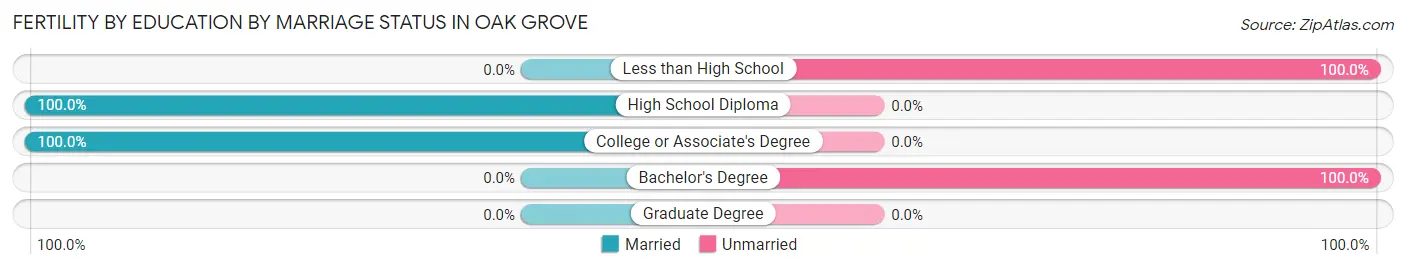
| Educational Attainment | Married | Unmarried |
| Less than High School | 0 (0.0%) | 69 (100.0%) |
| High School Diploma | 46 (100.0%) | 0 (0.0%) |
| College or Associate's Degree | 72 (100.0%) | 0 (0.0%) |
| Bachelor's Degree | 0 (0.0%) | 35 (100.0%) |
| Graduate Degree | 0 (0.0%) | 0 (0.0%) |
| Total | 118 (53.1%) | 104 (46.9%) |
Employment Characteristics in Oak Grove
Employment by Class of Employer in Oak Grove
Among the 3,145 employed individuals in Oak Grove, private company employees (2,016 | 64.1%), federal government employees (805 | 25.6%), and not-for-profit organizations (97 | 3.1%) make up the most common classes of employment.
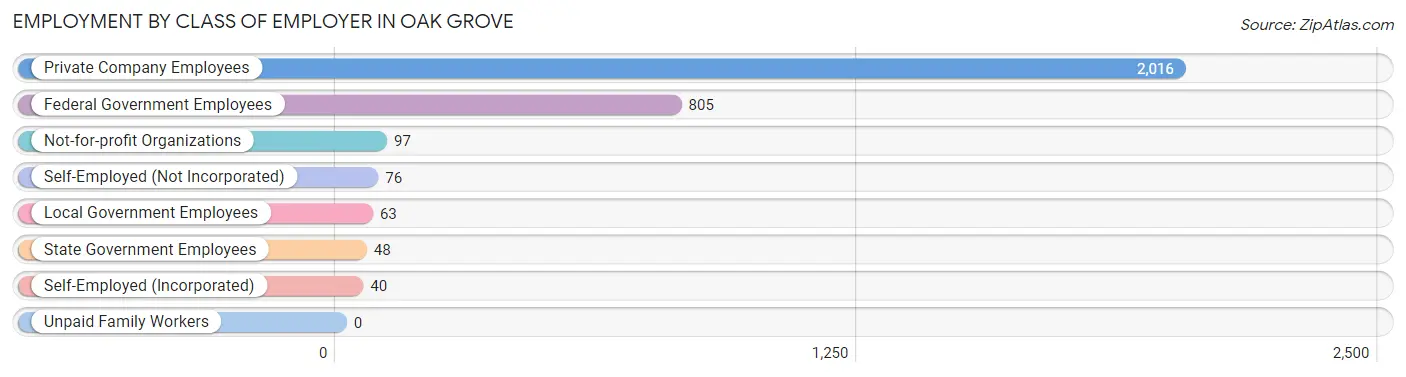
| Employer Class | # Employees | % Employees |
| Private Company Employees | 2,016 | 64.1% |
| Self-Employed (Incorporated) | 40 | 1.3% |
| Self-Employed (Not Incorporated) | 76 | 2.4% |
| Not-for-profit Organizations | 97 | 3.1% |
| Local Government Employees | 63 | 2.0% |
| State Government Employees | 48 | 1.5% |
| Federal Government Employees | 805 | 25.6% |
| Unpaid Family Workers | 0 | 0.0% |
| Total | 3,145 | 100.0% |
Employment Status by Age in Oak Grove
According to the labor force statistics for Oak Grove, out of the total population over 16 years of age (5,285), 66.9% or 3,536 individuals are in the labor force, with 12.2% or 431 of them unemployed. The age group with the highest labor force participation rate is 25 to 29 years, with 88.7% or 1,219 individuals in the labor force. Within the labor force, the 60 to 64 years age range has the highest percentage of unemployed individuals, with 36.8% or 28 of them being unemployed.
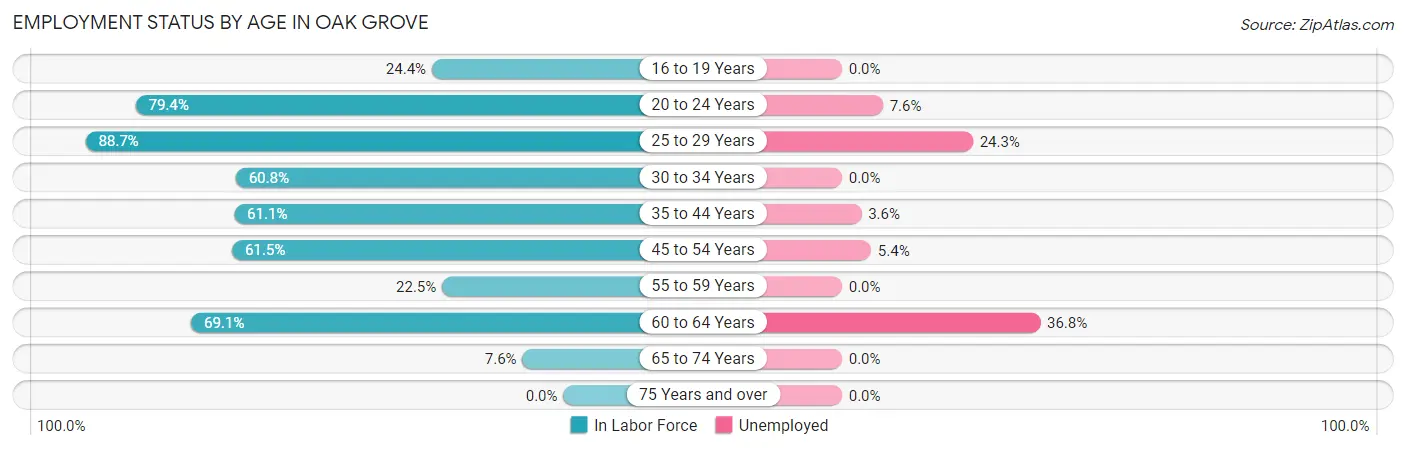
| Age Bracket | In Labor Force | Unemployed |
| 16 to 19 Years | 66 (24.4%) | 0 (0.0%) |
| 20 to 24 Years | 966 (79.4%) | 73 (7.6%) |
| 25 to 29 Years | 1,219 (88.7%) | 296 (24.3%) |
| 30 to 34 Years | 209 (60.8%) | 0 (0.0%) |
| 35 to 44 Years | 604 (61.1%) | 22 (3.6%) |
| 45 to 54 Years | 336 (61.5%) | 18 (5.4%) |
| 55 to 59 Years | 41 (22.5%) | 0 (0.0%) |
| 60 to 64 Years | 76 (69.1%) | 28 (36.8%) |
| 65 to 74 Years | 18 (7.6%) | 0 (0.0%) |
| 75 Years and over | 0 (0.0%) | 0 (0.0%) |
| Total | 3,536 (66.9%) | 431 (12.2%) |
Employment Status by Educational Attainment in Oak Grove
According to labor force statistics for Oak Grove, 70.1% of individuals (2,484) out of the total population between 25 and 64 years of age (3,544) are in the labor force, with 14.1% or 350 of them being unemployed. The group with the highest labor force participation rate are those with the educational attainment of bachelor's degree or higher, with 80.6% or 354 individuals in the labor force. Within the labor force, individuals with less than high school education have the highest percentage of unemployment, with 39.5% or 87 of them being unemployed.
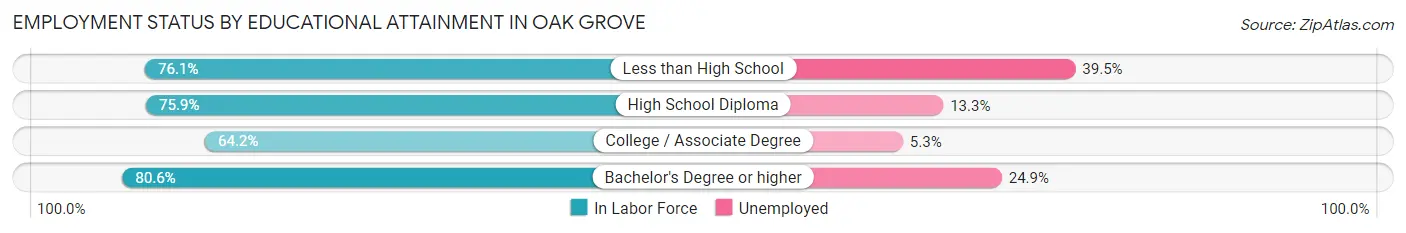
| Educational Attainment | In Labor Force | Unemployed |
| Less than High School | 220 (76.1%) | 114 (39.5%) |
| High School Diploma | 667 (75.9%) | 117 (13.3%) |
| College / Associate Degree | 1,244 (64.2%) | 103 (5.3%) |
| Bachelor's Degree or higher | 354 (80.6%) | 109 (24.9%) |
| Total | 2,484 (70.1%) | 500 (14.1%) |
Employment Occupations by Sex in Oak Grove
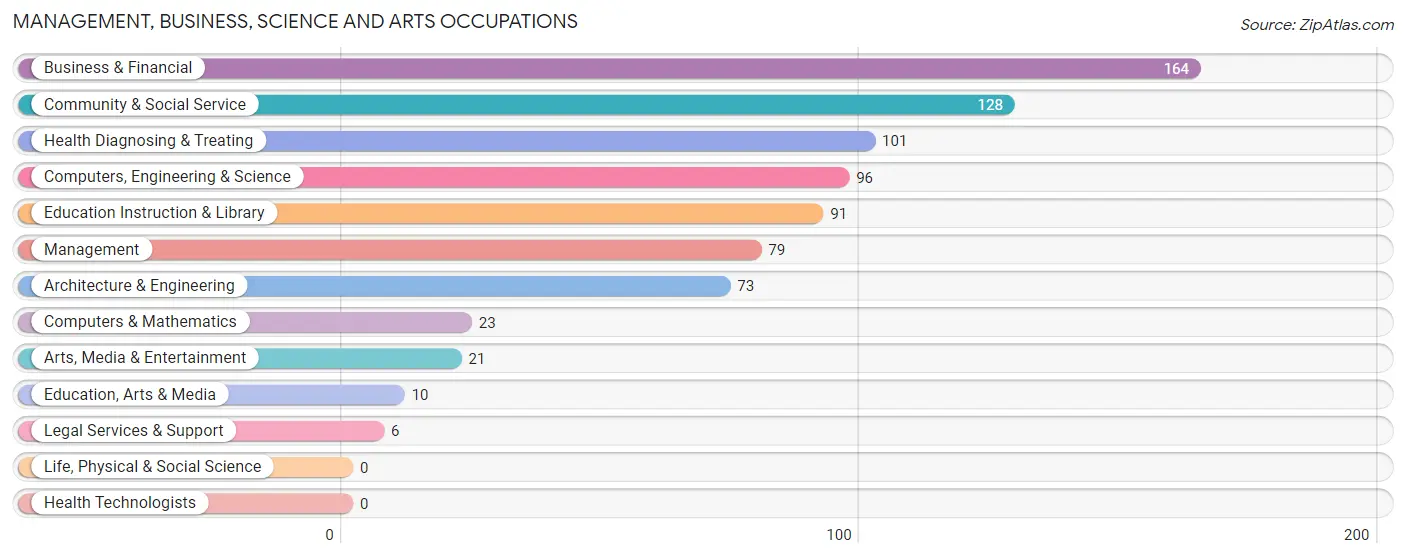
Management, Business, Science and Arts Occupations
The most common Management, Business, Science and Arts occupations in Oak Grove are Business & Financial (164 | 6.5%), Community & Social Service (128 | 5.1%), Health Diagnosing & Treating (101 | 4.0%), Computers, Engineering & Science (96 | 3.8%), and Education Instruction & Library (91 | 3.6%).
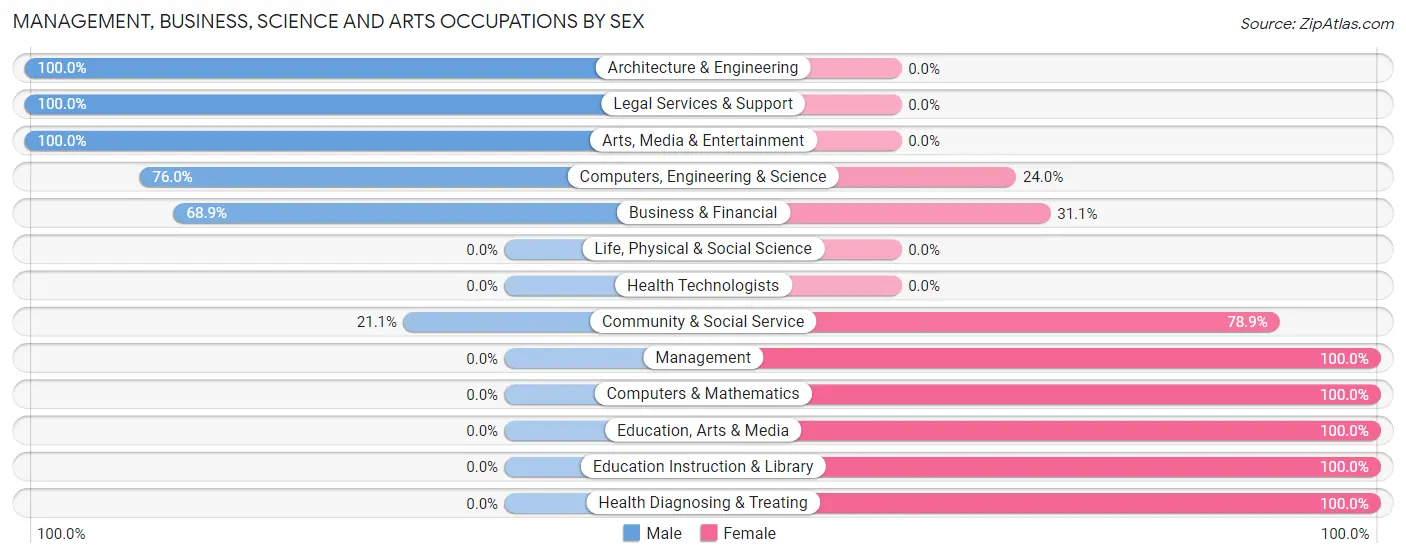
Management, Business, Science and Arts Occupations by Sex
Within the Management, Business, Science and Arts occupations in Oak Grove, the most male-oriented occupations are Architecture & Engineering (100.0%), Legal Services & Support (100.0%), and Arts, Media & Entertainment (100.0%), while the most female-oriented occupations are Management (100.0%), Computers & Mathematics (100.0%), and Education, Arts & Media (100.0%).
| Occupation | Male | Female |
| Management | 0 (0.0%) | 79 (100.0%) |
| Business & Financial | 113 (68.9%) | 51 (31.1%) |
| Computers, Engineering & Science | 73 (76.0%) | 23 (24.0%) |
| Computers & Mathematics | 0 (0.0%) | 23 (100.0%) |
| Architecture & Engineering | 73 (100.0%) | 0 (0.0%) |
| Life, Physical & Social Science | 0 (0.0%) | 0 (0.0%) |
| Community & Social Service | 27 (21.1%) | 101 (78.9%) |
| Education, Arts & Media | 0 (0.0%) | 10 (100.0%) |
| Legal Services & Support | 6 (100.0%) | 0 (0.0%) |
| Education Instruction & Library | 0 (0.0%) | 91 (100.0%) |
| Arts, Media & Entertainment | 21 (100.0%) | 0 (0.0%) |
| Health Diagnosing & Treating | 0 (0.0%) | 101 (100.0%) |
| Health Technologists | 0 (0.0%) | 0 (0.0%) |
| Total (Category) | 213 (37.5%) | 355 (62.5%) |
| Total (Overall) | 1,040 (41.1%) | 1,489 (58.9%) |
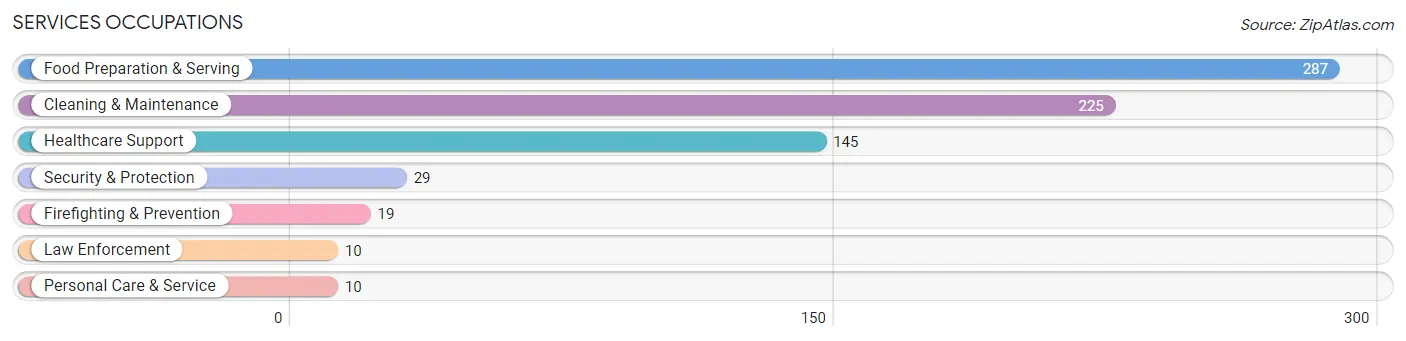
Services Occupations
The most common Services occupations in Oak Grove are Food Preparation & Serving (287 | 11.4%), Cleaning & Maintenance (225 | 8.9%), Healthcare Support (145 | 5.7%), Security & Protection (29 | 1.1%), and Firefighting & Prevention (19 | 0.7%).
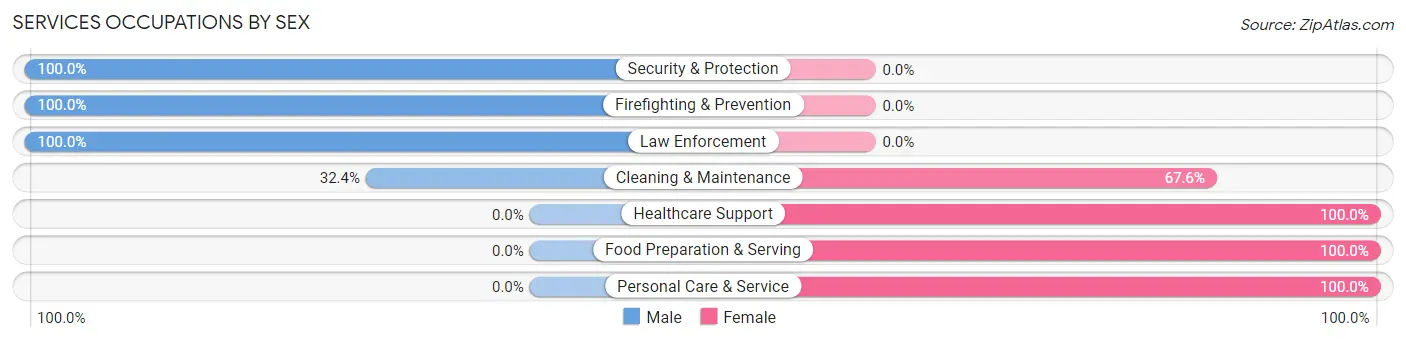
Services Occupations by Sex
Within the Services occupations in Oak Grove, the most male-oriented occupations are Security & Protection (100.0%), Firefighting & Prevention (100.0%), and Law Enforcement (100.0%), while the most female-oriented occupations are Healthcare Support (100.0%), Food Preparation & Serving (100.0%), and Personal Care & Service (100.0%).
| Occupation | Male | Female |
| Healthcare Support | 0 (0.0%) | 145 (100.0%) |
| Security & Protection | 29 (100.0%) | 0 (0.0%) |
| Firefighting & Prevention | 19 (100.0%) | 0 (0.0%) |
| Law Enforcement | 10 (100.0%) | 0 (0.0%) |
| Food Preparation & Serving | 0 (0.0%) | 287 (100.0%) |
| Cleaning & Maintenance | 73 (32.4%) | 152 (67.6%) |
| Personal Care & Service | 0 (0.0%) | 10 (100.0%) |
| Total (Category) | 102 (14.7%) | 594 (85.3%) |
| Total (Overall) | 1,040 (41.1%) | 1,489 (58.9%) |
Sales and Office Occupations
The most common Sales and Office occupations in Oak Grove are Sales & Related (218 | 8.6%), and Office & Administration (205 | 8.1%).

Sales and Office Occupations by Sex

| Occupation | Male | Female |
| Sales & Related | 0 (0.0%) | 218 (100.0%) |
| Office & Administration | 130 (63.4%) | 75 (36.6%) |
| Total (Category) | 130 (30.7%) | 293 (69.3%) |
| Total (Overall) | 1,040 (41.1%) | 1,489 (58.9%) |
Natural Resources, Construction and Maintenance Occupations
The most common Natural Resources, Construction and Maintenance occupations in Oak Grove are Installation, Maintenance & Repair (127 | 5.0%), and Construction & Extraction (26 | 1.0%).
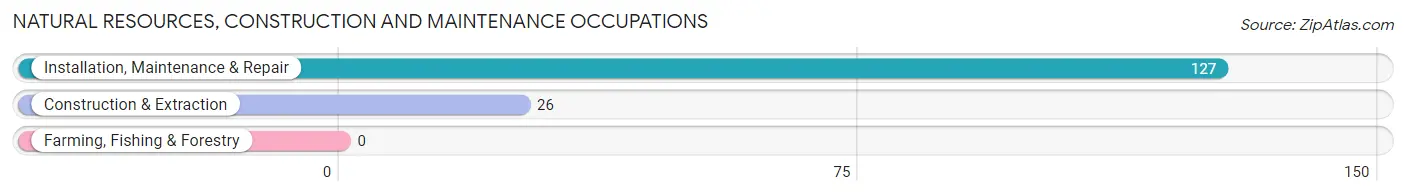
Natural Resources, Construction and Maintenance Occupations by Sex

| Occupation | Male | Female |
| Farming, Fishing & Forestry | 0 (0.0%) | 0 (0.0%) |
| Construction & Extraction | 26 (100.0%) | 0 (0.0%) |
| Installation, Maintenance & Repair | 127 (100.0%) | 0 (0.0%) |
| Total (Category) | 153 (100.0%) | 0 (0.0%) |
| Total (Overall) | 1,040 (41.1%) | 1,489 (58.9%) |
Production, Transportation and Moving Occupations
The most common Production, Transportation and Moving occupations in Oak Grove are Production (373 | 14.7%), Material Moving (192 | 7.6%), and Transportation (124 | 4.9%).
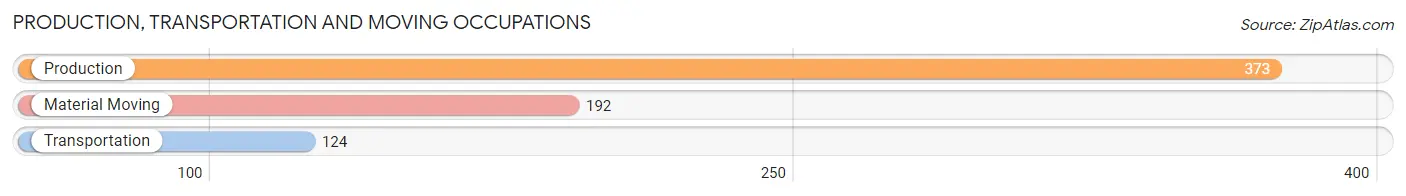
Production, Transportation and Moving Occupations by Sex
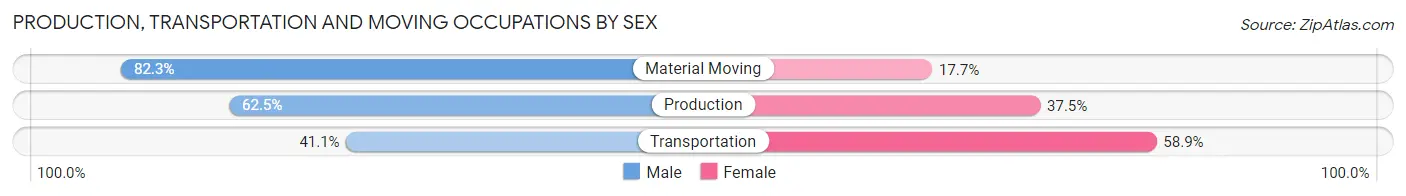
| Occupation | Male | Female |
| Production | 233 (62.5%) | 140 (37.5%) |
| Transportation | 51 (41.1%) | 73 (58.9%) |
| Material Moving | 158 (82.3%) | 34 (17.7%) |
| Total (Category) | 442 (64.1%) | 247 (35.8%) |
| Total (Overall) | 1,040 (41.1%) | 1,489 (58.9%) |
Employment Industries by Sex in Oak Grove
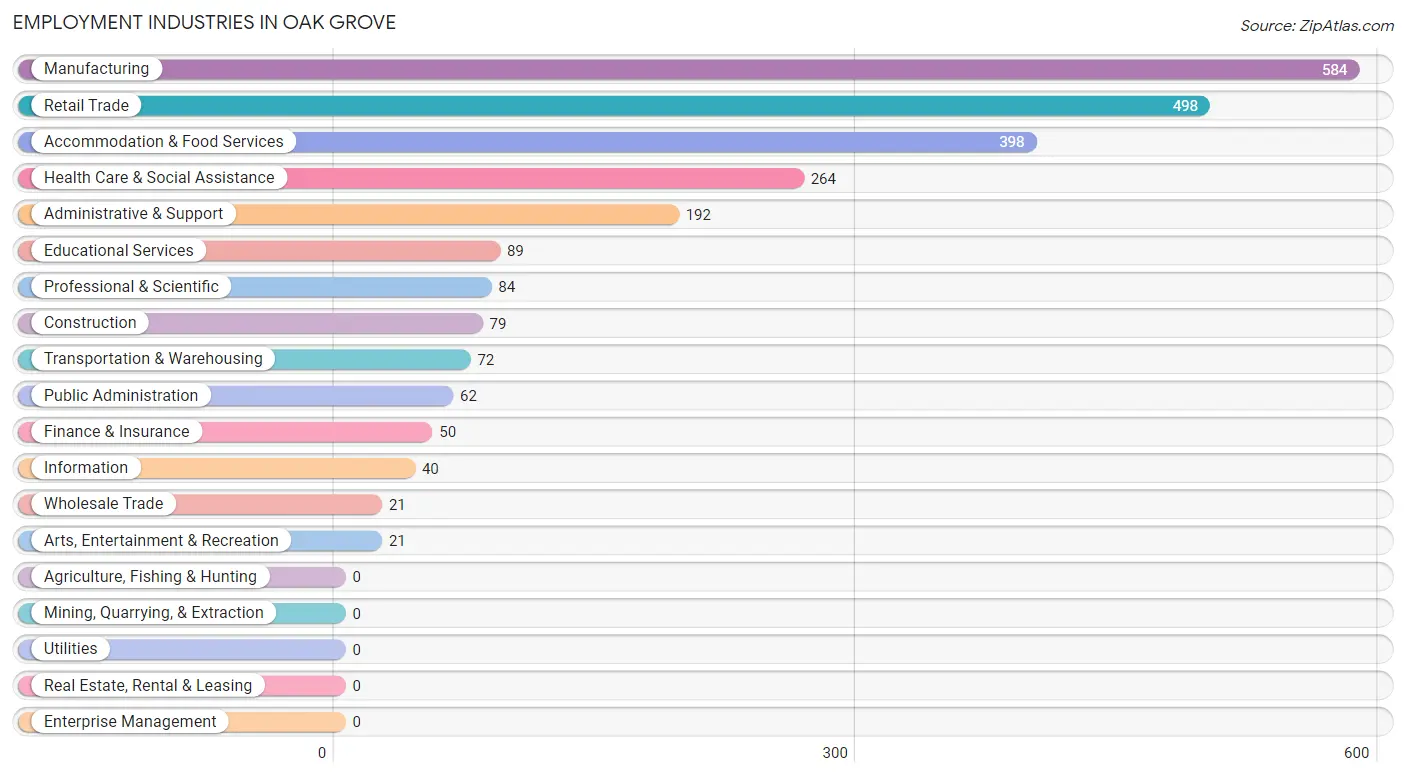
Employment Industries in Oak Grove
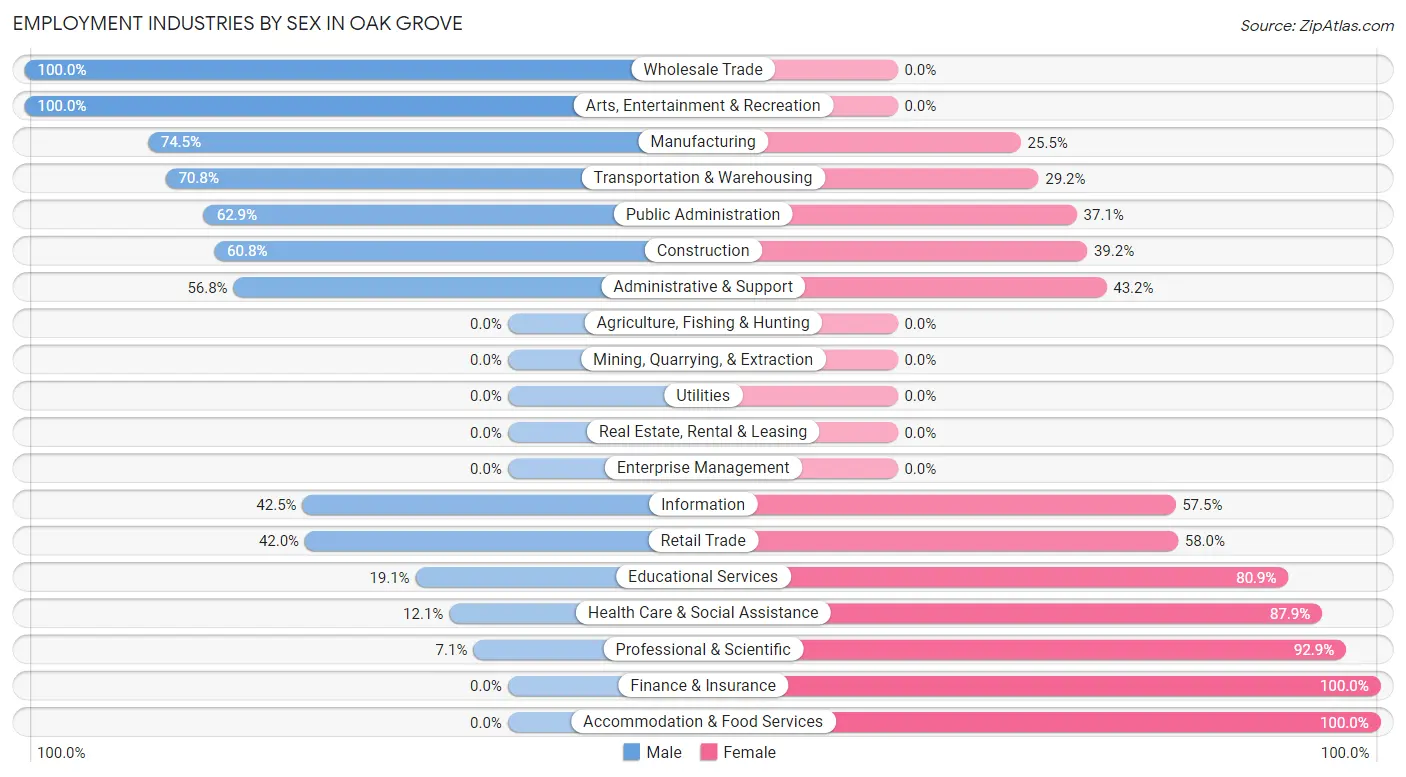
The major employment industries in Oak Grove include Manufacturing (584 | 23.1%), Retail Trade (498 | 19.7%), Accommodation & Food Services (398 | 15.7%), Health Care & Social Assistance (264 | 10.4%), and Administrative & Support (192 | 7.6%).
Employment Industries by Sex in Oak Grove
The Oak Grove industries that see more men than women are Wholesale Trade (100.0%), Arts, Entertainment & Recreation (100.0%), and Manufacturing (74.5%), whereas the industries that tend to have a higher number of women are Finance & Insurance (100.0%), Accommodation & Food Services (100.0%), and Professional & Scientific (92.9%).
| Industry | Male | Female |
| Agriculture, Fishing & Hunting | 0 (0.0%) | 0 (0.0%) |
| Mining, Quarrying, & Extraction | 0 (0.0%) | 0 (0.0%) |
| Construction | 48 (60.8%) | 31 (39.2%) |
| Manufacturing | 435 (74.5%) | 149 (25.5%) |
| Wholesale Trade | 21 (100.0%) | 0 (0.0%) |
| Retail Trade | 209 (42.0%) | 289 (58.0%) |
| Transportation & Warehousing | 51 (70.8%) | 21 (29.2%) |
| Utilities | 0 (0.0%) | 0 (0.0%) |
| Information | 17 (42.5%) | 23 (57.5%) |
| Finance & Insurance | 0 (0.0%) | 50 (100.0%) |
| Real Estate, Rental & Leasing | 0 (0.0%) | 0 (0.0%) |
| Professional & Scientific | 6 (7.1%) | 78 (92.9%) |
| Enterprise Management | 0 (0.0%) | 0 (0.0%) |
| Administrative & Support | 109 (56.8%) | 83 (43.2%) |
| Educational Services | 17 (19.1%) | 72 (80.9%) |
| Health Care & Social Assistance | 32 (12.1%) | 232 (87.9%) |
| Arts, Entertainment & Recreation | 21 (100.0%) | 0 (0.0%) |
| Accommodation & Food Services | 0 (0.0%) | 398 (100.0%) |
| Public Administration | 39 (62.9%) | 23 (37.1%) |
| Total | 1,040 (41.1%) | 1,489 (58.9%) |
Education in Oak Grove
School Enrollment in Oak Grove
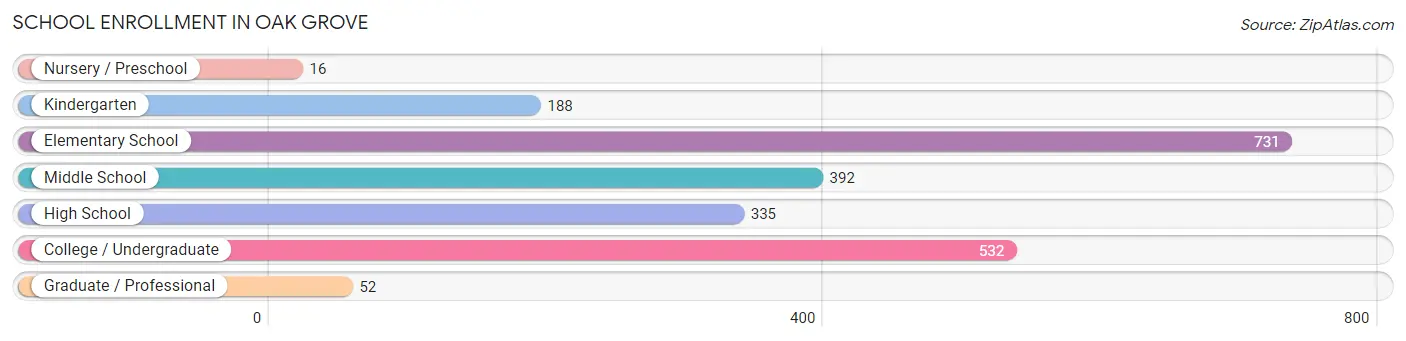
The most common levels of schooling among the 2,246 students in Oak Grove are elementary school (731 | 32.6%), college / undergraduate (532 | 23.7%), and middle school (392 | 17.4%).
| School Level | # Students | % Students |
| Nursery / Preschool | 16 | 0.7% |
| Kindergarten | 188 | 8.4% |
| Elementary School | 731 | 32.6% |
| Middle School | 392 | 17.4% |
| High School | 335 | 14.9% |
| College / Undergraduate | 532 | 23.7% |
| Graduate / Professional | 52 | 2.3% |
| Total | 2,246 | 100.0% |
School Enrollment by Age by Funding Source in Oak Grove
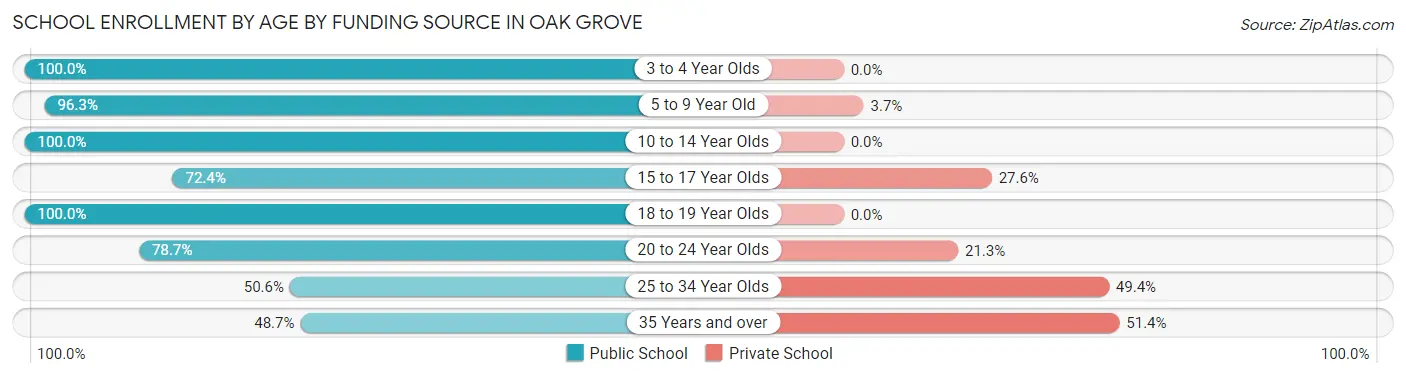
Out of a total of 2,246 students who are enrolled in schools in Oak Grove, 265 (11.8%) attend a private institution, while the remaining 1,981 (88.2%) are enrolled in public schools. The age group of 35 years and over has the highest likelihood of being enrolled in private schools, with 19 (51.3% in the age bracket) enrolled. Conversely, the age group of 3 to 4 year olds has the lowest likelihood of being enrolled in a private school, with 16 (100.0% in the age bracket) attending a public institution.
| Age Bracket | Public School | Private School |
| 3 to 4 Year Olds | 16 (100.0%) | 0 (0.0%) |
| 5 to 9 Year Old | 856 (96.3%) | 33 (3.7%) |
| 10 to 14 Year Olds | 572 (100.0%) | 0 (0.0%) |
| 15 to 17 Year Olds | 134 (72.4%) | 51 (27.6%) |
| 18 to 19 Year Olds | 115 (100.0%) | 0 (0.0%) |
| 20 to 24 Year Olds | 144 (78.7%) | 39 (21.3%) |
| 25 to 34 Year Olds | 126 (50.6%) | 123 (49.4%) |
| 35 Years and over | 18 (48.6%) | 19 (51.3%) |
| Total | 1,981 (88.2%) | 265 (11.8%) |
Educational Attainment by Field of Study in Oak Grove
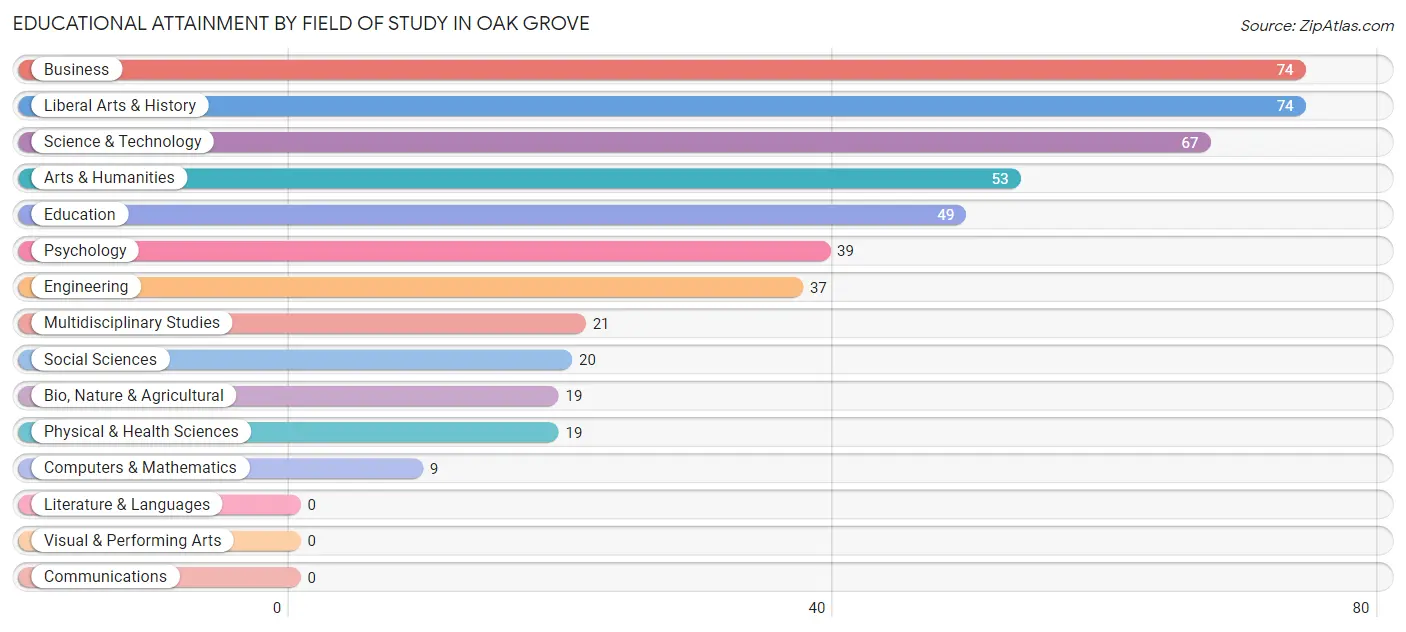
Business (74 | 15.4%), liberal arts & history (74 | 15.4%), science & technology (67 | 13.9%), arts & humanities (53 | 11.0%), and education (49 | 10.2%) are the most common fields of study among 481 individuals in Oak Grove who have obtained a bachelor's degree or higher.
| Field of Study | # Graduates | % Graduates |
| Computers & Mathematics | 9 | 1.9% |
| Bio, Nature & Agricultural | 19 | 4.0% |
| Physical & Health Sciences | 19 | 4.0% |
| Psychology | 39 | 8.1% |
| Social Sciences | 20 | 4.2% |
| Engineering | 37 | 7.7% |
| Multidisciplinary Studies | 21 | 4.4% |
| Science & Technology | 67 | 13.9% |
| Business | 74 | 15.4% |
| Education | 49 | 10.2% |
| Literature & Languages | 0 | 0.0% |
| Liberal Arts & History | 74 | 15.4% |
| Visual & Performing Arts | 0 | 0.0% |
| Communications | 0 | 0.0% |
| Arts & Humanities | 53 | 11.0% |
| Total | 481 | 100.0% |
Transportation & Commute in Oak Grove
Vehicle Availability by Sex in Oak Grove
The most prevalent vehicle ownership categories in Oak Grove are males with 2 vehicles (903, accounting for 56.0%) and females with 2 vehicles (629, making up 58.9%).
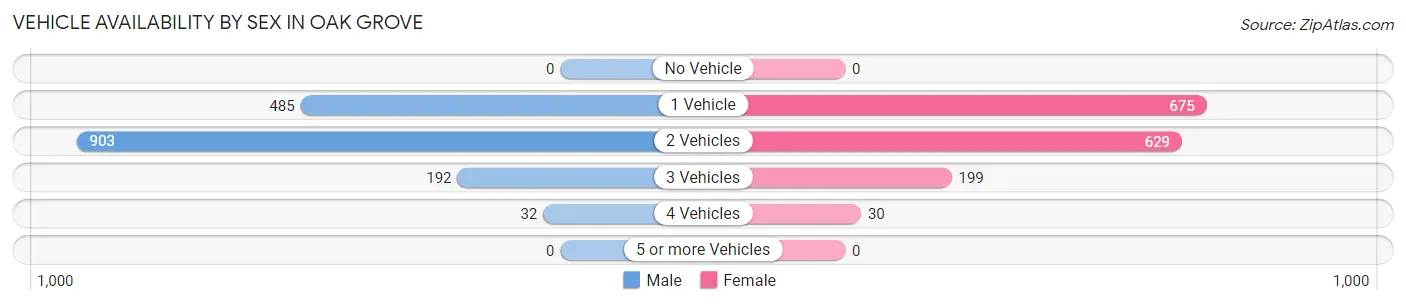
| Vehicles Available | Male | Female |
| No Vehicle | 0 (0.0%) | 0 (0.0%) |
| 1 Vehicle | 485 (30.1%) | 675 (44.0%) |
| 2 Vehicles | 903 (56.0%) | 629 (41.0%) |
| 3 Vehicles | 192 (11.9%) | 199 (13.0%) |
| 4 Vehicles | 32 (2.0%) | 30 (2.0%) |
| 5 or more Vehicles | 0 (0.0%) | 0 (0.0%) |
| Total | 1,612 (100.0%) | 1,533 (100.0%) |
Commute Time in Oak Grove
The most frequently occuring commute durations in Oak Grove are 20 to 24 minutes (957 commuters, 31.4%), 15 to 19 minutes (499 commuters, 16.4%), and 25 to 29 minutes (319 commuters, 10.5%).
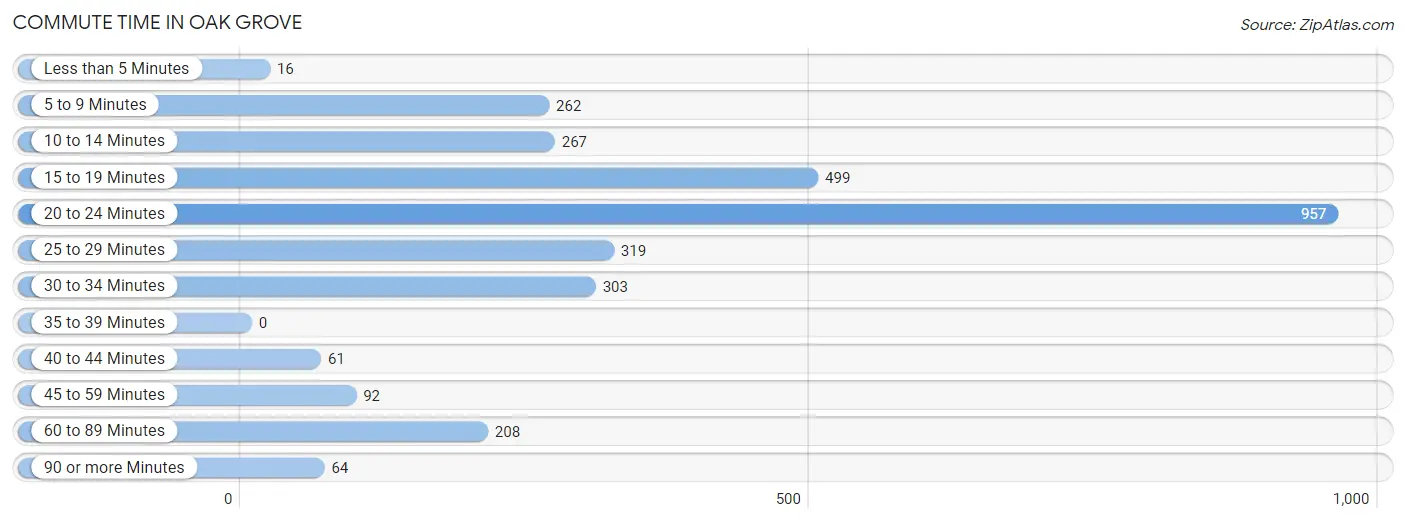
| Commute Time | # Commuters | % Commuters |
| Less than 5 Minutes | 16 | 0.5% |
| 5 to 9 Minutes | 262 | 8.6% |
| 10 to 14 Minutes | 267 | 8.8% |
| 15 to 19 Minutes | 499 | 16.4% |
| 20 to 24 Minutes | 957 | 31.4% |
| 25 to 29 Minutes | 319 | 10.5% |
| 30 to 34 Minutes | 303 | 9.9% |
| 35 to 39 Minutes | 0 | 0.0% |
| 40 to 44 Minutes | 61 | 2.0% |
| 45 to 59 Minutes | 92 | 3.0% |
| 60 to 89 Minutes | 208 | 6.8% |
| 90 or more Minutes | 64 | 2.1% |
Commute Time by Sex in Oak Grove
The most common commute times in Oak Grove are 20 to 24 minutes (614 commuters, 38.1%) for males and 20 to 24 minutes (343 commuters, 23.9%) for females.
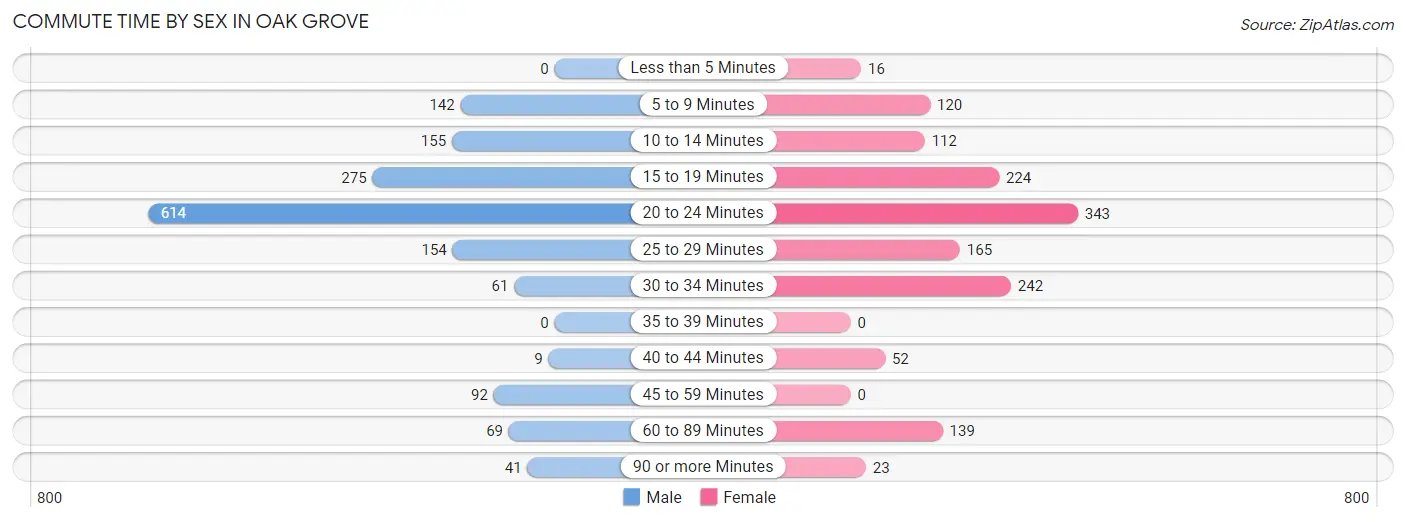
| Commute Time | Male | Female |
| Less than 5 Minutes | 0 (0.0%) | 16 (1.1%) |
| 5 to 9 Minutes | 142 (8.8%) | 120 (8.4%) |
| 10 to 14 Minutes | 155 (9.6%) | 112 (7.8%) |
| 15 to 19 Minutes | 275 (17.1%) | 224 (15.6%) |
| 20 to 24 Minutes | 614 (38.1%) | 343 (23.9%) |
| 25 to 29 Minutes | 154 (9.6%) | 165 (11.5%) |
| 30 to 34 Minutes | 61 (3.8%) | 242 (16.9%) |
| 35 to 39 Minutes | 0 (0.0%) | 0 (0.0%) |
| 40 to 44 Minutes | 9 (0.6%) | 52 (3.6%) |
| 45 to 59 Minutes | 92 (5.7%) | 0 (0.0%) |
| 60 to 89 Minutes | 69 (4.3%) | 139 (9.7%) |
| 90 or more Minutes | 41 (2.5%) | 23 (1.6%) |
Time of Departure to Work by Sex in Oak Grove
The most frequent times of departure to work in Oak Grove are 5:30 AM to 5:59 AM (295, 18.3%) for males and 6:00 AM to 6:29 AM (277, 19.3%) for females.
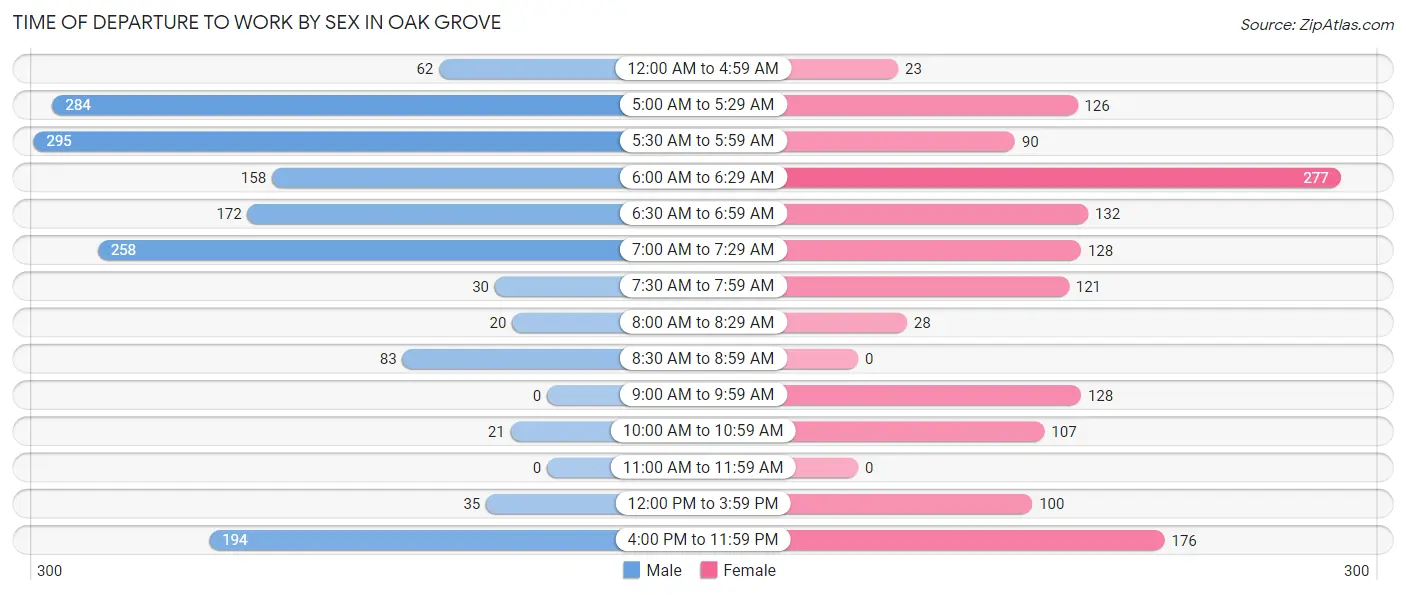
| Time of Departure | Male | Female |
| 12:00 AM to 4:59 AM | 62 (3.8%) | 23 (1.6%) |
| 5:00 AM to 5:29 AM | 284 (17.6%) | 126 (8.8%) |
| 5:30 AM to 5:59 AM | 295 (18.3%) | 90 (6.3%) |
| 6:00 AM to 6:29 AM | 158 (9.8%) | 277 (19.3%) |
| 6:30 AM to 6:59 AM | 172 (10.7%) | 132 (9.2%) |
| 7:00 AM to 7:29 AM | 258 (16.0%) | 128 (8.9%) |
| 7:30 AM to 7:59 AM | 30 (1.9%) | 121 (8.4%) |
| 8:00 AM to 8:29 AM | 20 (1.2%) | 28 (1.9%) |
| 8:30 AM to 8:59 AM | 83 (5.1%) | 0 (0.0%) |
| 9:00 AM to 9:59 AM | 0 (0.0%) | 128 (8.9%) |
| 10:00 AM to 10:59 AM | 21 (1.3%) | 107 (7.4%) |
| 11:00 AM to 11:59 AM | 0 (0.0%) | 0 (0.0%) |
| 12:00 PM to 3:59 PM | 35 (2.2%) | 100 (7.0%) |
| 4:00 PM to 11:59 PM | 194 (12.0%) | 176 (12.3%) |
| Total | 1,612 (100.0%) | 1,436 (100.0%) |
Housing Occupancy in Oak Grove
Occupancy by Ownership in Oak Grove
Of the total 3,177 dwellings in Oak Grove, owner-occupied units account for 1,256 (39.5%), while renter-occupied units make up 1,921 (60.5%).
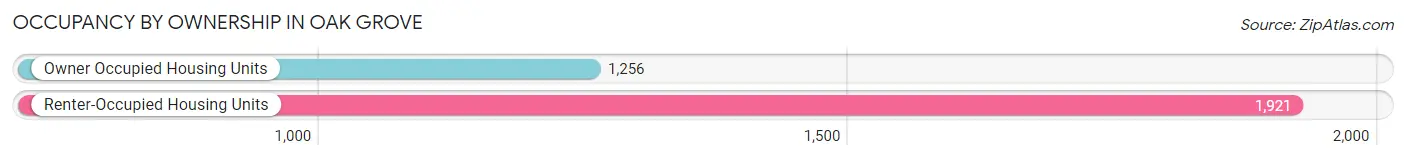
| Occupancy | # Housing Units | % Housing Units |
| Owner Occupied Housing Units | 1,256 | 39.5% |
| Renter-Occupied Housing Units | 1,921 | 60.5% |
| Total Occupied Housing Units | 3,177 | 100.0% |
Occupancy by Household Size in Oak Grove
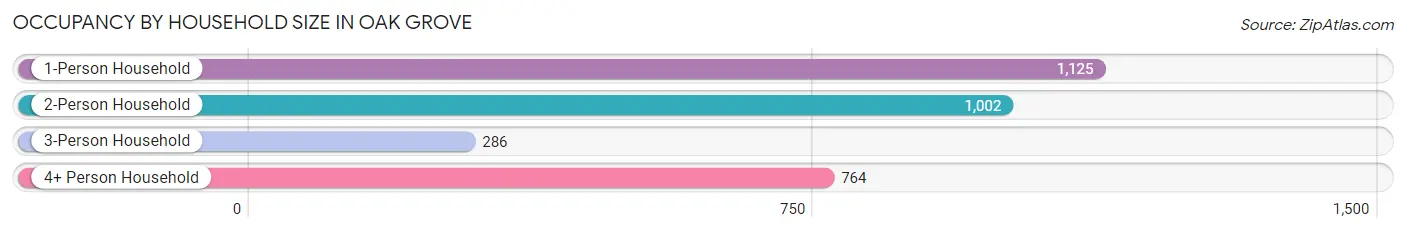
| Household Size | # Housing Units | % Housing Units |
| 1-Person Household | 1,125 | 35.4% |
| 2-Person Household | 1,002 | 31.5% |
| 3-Person Household | 286 | 9.0% |
| 4+ Person Household | 764 | 24.0% |
| Total Housing Units | 3,177 | 100.0% |
Occupancy by Ownership by Household Size in Oak Grove
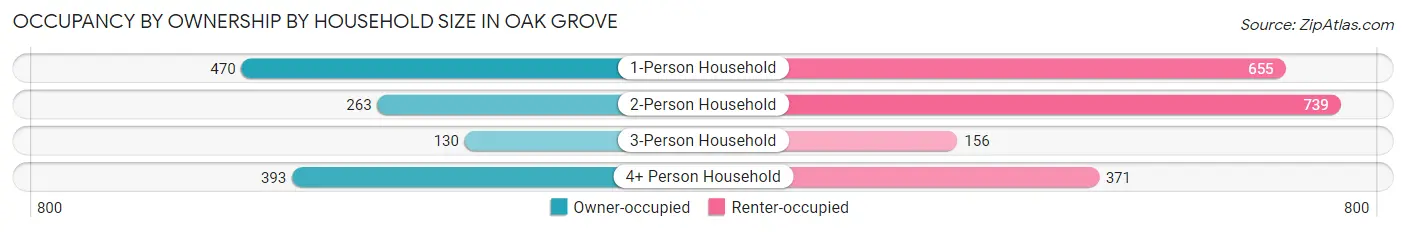
| Household Size | Owner-occupied | Renter-occupied |
| 1-Person Household | 470 (41.8%) | 655 (58.2%) |
| 2-Person Household | 263 (26.3%) | 739 (73.8%) |
| 3-Person Household | 130 (45.5%) | 156 (54.5%) |
| 4+ Person Household | 393 (51.4%) | 371 (48.6%) |
| Total Housing Units | 1,256 (39.5%) | 1,921 (60.5%) |
Occupancy by Educational Attainment in Oak Grove
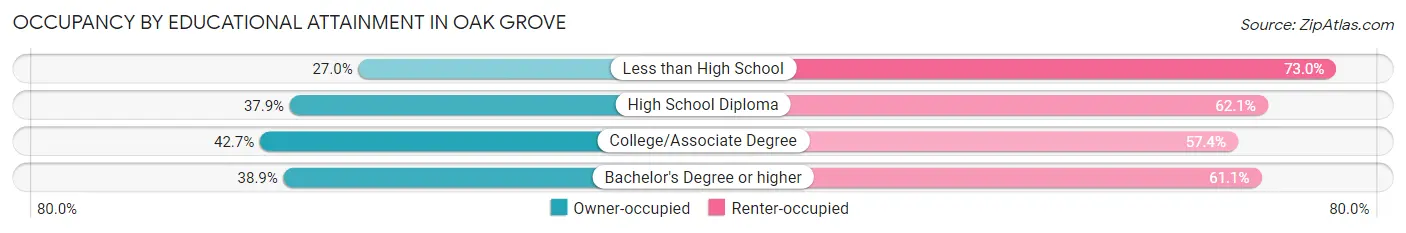
| Household Size | Owner-occupied | Renter-occupied |
| Less than High School | 73 (27.0%) | 197 (73.0%) |
| High School Diploma | 334 (37.9%) | 547 (62.1%) |
| College/Associate Degree | 691 (42.6%) | 929 (57.4%) |
| Bachelor's Degree or higher | 158 (38.9%) | 248 (61.1%) |
Occupancy by Age of Householder in Oak Grove
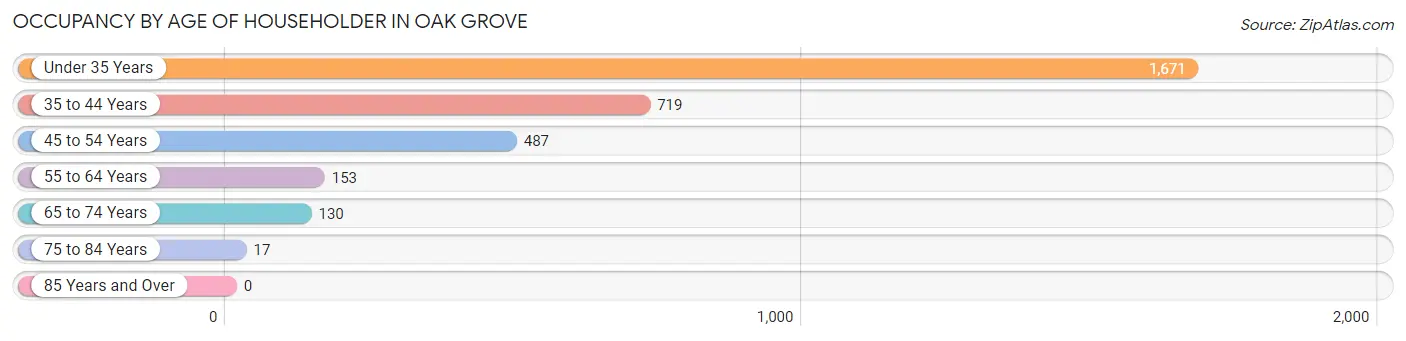
| Age Bracket | # Households | % Households |
| Under 35 Years | 1,671 | 52.6% |
| 35 to 44 Years | 719 | 22.6% |
| 45 to 54 Years | 487 | 15.3% |
| 55 to 64 Years | 153 | 4.8% |
| 65 to 74 Years | 130 | 4.1% |
| 75 to 84 Years | 17 | 0.5% |
| 85 Years and Over | 0 | 0.0% |
| Total | 3,177 | 100.0% |
Housing Finances in Oak Grove
Median Income by Occupancy in Oak Grove
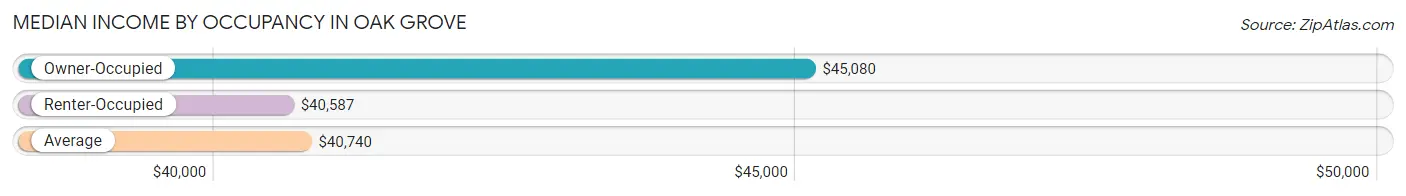
| Occupancy Type | # Households | Median Income |
| Owner-Occupied | 1,256 (39.5%) | $45,080 |
| Renter-Occupied | 1,921 (60.5%) | $40,587 |
| Average | 3,177 (100.0%) | $40,740 |
Occupancy by Householder Income Bracket in Oak Grove
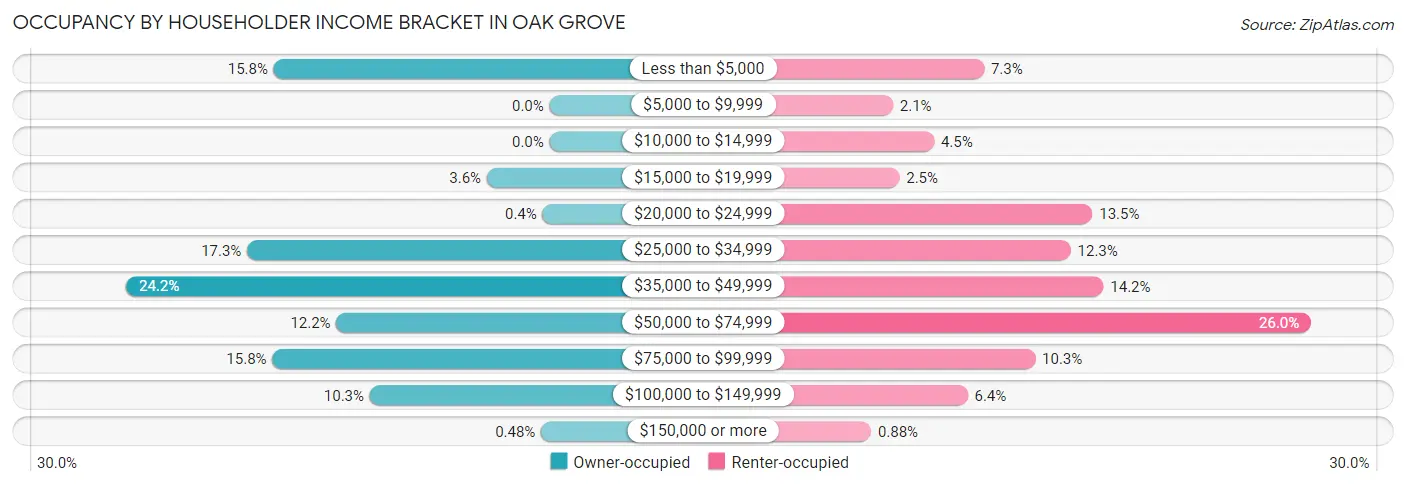
| Income Bracket | Owner-occupied | Renter-occupied |
| Less than $5,000 | 198 (15.8%) | 141 (7.3%) |
| $5,000 to $9,999 | 0 (0.0%) | 41 (2.1%) |
| $10,000 to $14,999 | 0 (0.0%) | 86 (4.5%) |
| $15,000 to $19,999 | 45 (3.6%) | 48 (2.5%) |
| $20,000 to $24,999 | 5 (0.4%) | 260 (13.5%) |
| $25,000 to $34,999 | 217 (17.3%) | 236 (12.3%) |
| $35,000 to $49,999 | 304 (24.2%) | 272 (14.2%) |
| $50,000 to $74,999 | 153 (12.2%) | 500 (26.0%) |
| $75,000 to $99,999 | 199 (15.8%) | 197 (10.3%) |
| $100,000 to $149,999 | 129 (10.3%) | 123 (6.4%) |
| $150,000 or more | 6 (0.5%) | 17 (0.9%) |
| Total | 1,256 (100.0%) | 1,921 (100.0%) |
Monthly Housing Cost Tiers in Oak Grove
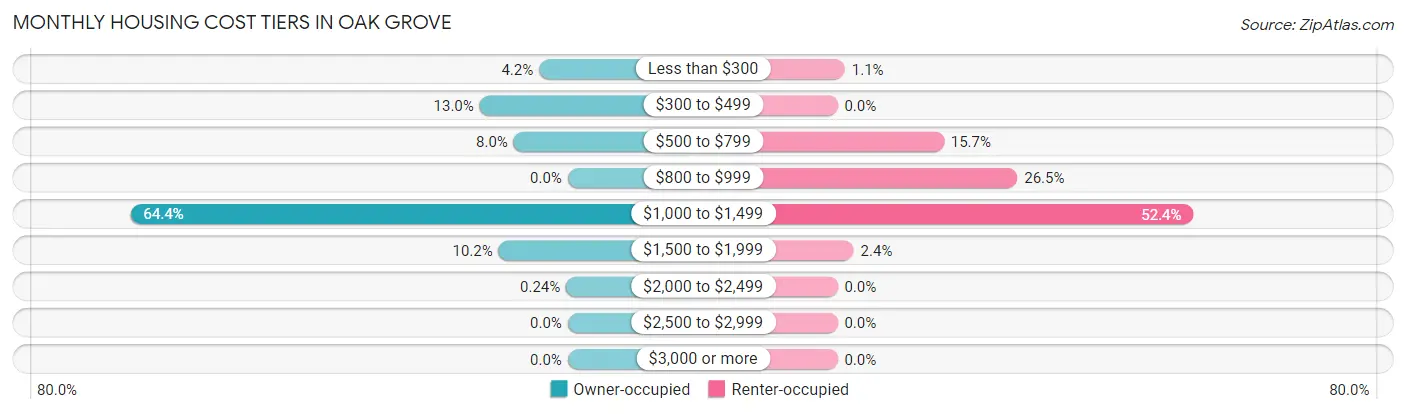
| Monthly Cost | Owner-occupied | Renter-occupied |
| Less than $300 | 53 (4.2%) | 21 (1.1%) |
| $300 to $499 | 163 (13.0%) | 0 (0.0%) |
| $500 to $799 | 100 (8.0%) | 301 (15.7%) |
| $800 to $999 | 0 (0.0%) | 509 (26.5%) |
| $1,000 to $1,499 | 809 (64.4%) | 1,007 (52.4%) |
| $1,500 to $1,999 | 128 (10.2%) | 46 (2.4%) |
| $2,000 to $2,499 | 3 (0.2%) | 0 (0.0%) |
| $2,500 to $2,999 | 0 (0.0%) | 0 (0.0%) |
| $3,000 or more | 0 (0.0%) | 0 (0.0%) |
| Total | 1,256 (100.0%) | 1,921 (100.0%) |
Physical Housing Characteristics in Oak Grove
Housing Structures in Oak Grove
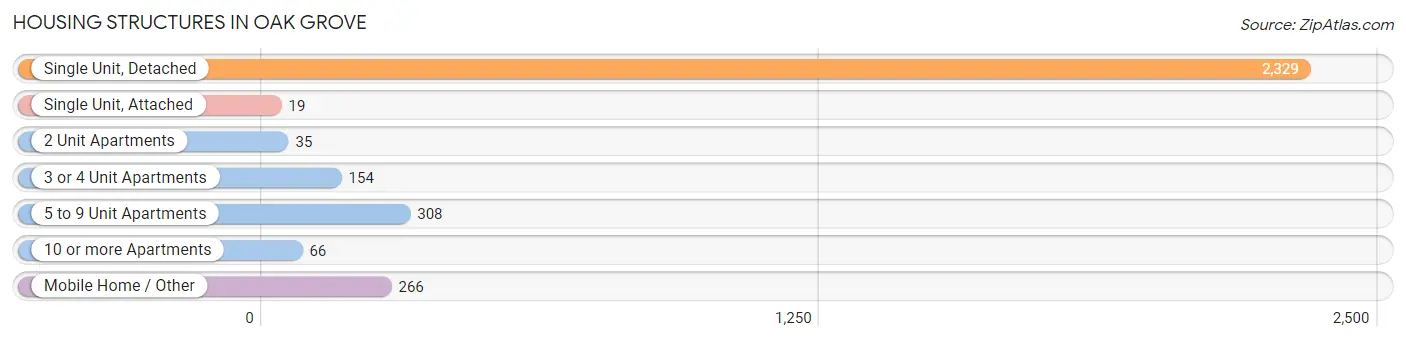
| Structure Type | # Housing Units | % Housing Units |
| Single Unit, Detached | 2,329 | 73.3% |
| Single Unit, Attached | 19 | 0.6% |
| 2 Unit Apartments | 35 | 1.1% |
| 3 or 4 Unit Apartments | 154 | 4.9% |
| 5 to 9 Unit Apartments | 308 | 9.7% |
| 10 or more Apartments | 66 | 2.1% |
| Mobile Home / Other | 266 | 8.4% |
| Total | 3,177 | 100.0% |
Housing Structures by Occupancy in Oak Grove
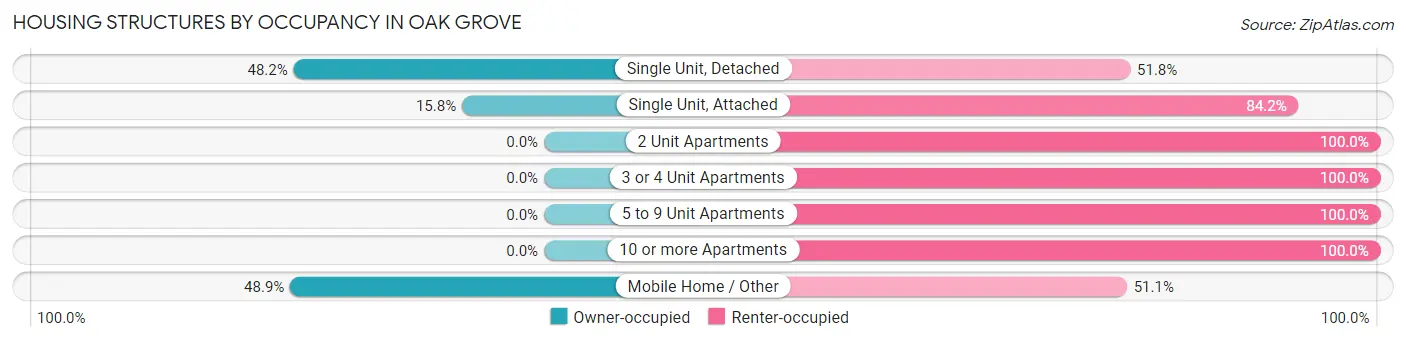
| Structure Type | Owner-occupied | Renter-occupied |
| Single Unit, Detached | 1,123 (48.2%) | 1,206 (51.8%) |
| Single Unit, Attached | 3 (15.8%) | 16 (84.2%) |
| 2 Unit Apartments | 0 (0.0%) | 35 (100.0%) |
| 3 or 4 Unit Apartments | 0 (0.0%) | 154 (100.0%) |
| 5 to 9 Unit Apartments | 0 (0.0%) | 308 (100.0%) |
| 10 or more Apartments | 0 (0.0%) | 66 (100.0%) |
| Mobile Home / Other | 130 (48.9%) | 136 (51.1%) |
| Total | 1,256 (39.5%) | 1,921 (60.5%) |
Housing Structures by Number of Rooms in Oak Grove
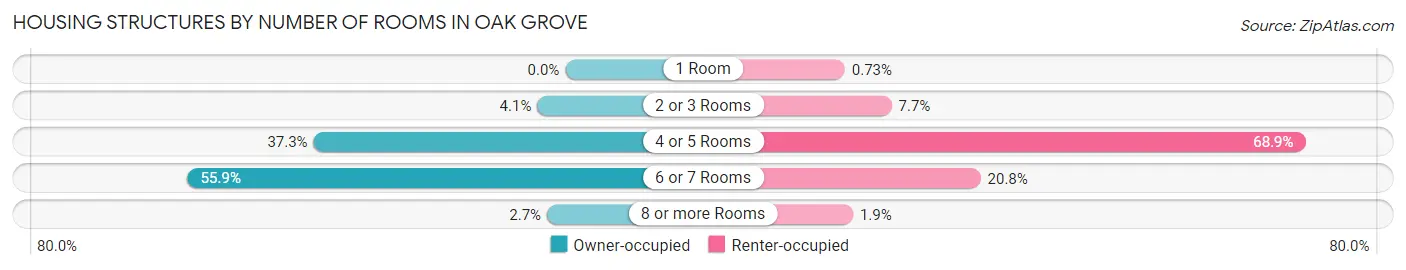
| Number of Rooms | Owner-occupied | Renter-occupied |
| 1 Room | 0 (0.0%) | 14 (0.7%) |
| 2 or 3 Rooms | 52 (4.1%) | 147 (7.6%) |
| 4 or 5 Rooms | 468 (37.3%) | 1,323 (68.9%) |
| 6 or 7 Rooms | 702 (55.9%) | 400 (20.8%) |
| 8 or more Rooms | 34 (2.7%) | 37 (1.9%) |
| Total | 1,256 (100.0%) | 1,921 (100.0%) |
Housing Structure by Heating Type in Oak Grove
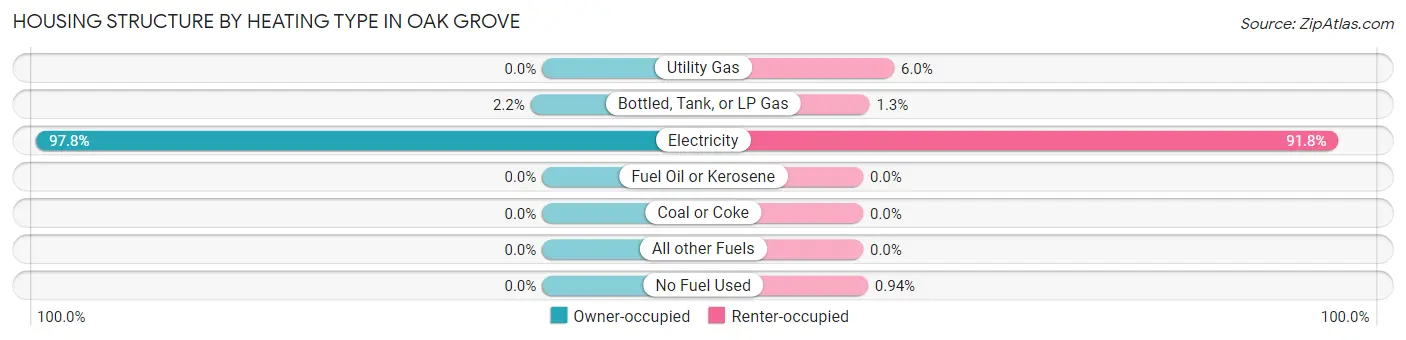
| Heating Type | Owner-occupied | Renter-occupied |
| Utility Gas | 0 (0.0%) | 115 (6.0%) |
| Bottled, Tank, or LP Gas | 28 (2.2%) | 24 (1.3%) |
| Electricity | 1,228 (97.8%) | 1,764 (91.8%) |
| Fuel Oil or Kerosene | 0 (0.0%) | 0 (0.0%) |
| Coal or Coke | 0 (0.0%) | 0 (0.0%) |
| All other Fuels | 0 (0.0%) | 0 (0.0%) |
| No Fuel Used | 0 (0.0%) | 18 (0.9%) |
| Total | 1,256 (100.0%) | 1,921 (100.0%) |
Household Vehicle Usage in Oak Grove
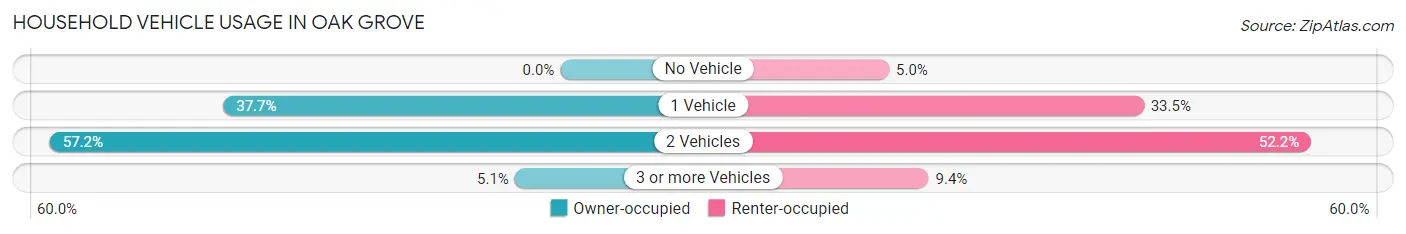
| Vehicles per Household | Owner-occupied | Renter-occupied |
| No Vehicle | 0 (0.0%) | 95 (5.0%) |
| 1 Vehicle | 474 (37.7%) | 643 (33.5%) |
| 2 Vehicles | 718 (57.2%) | 1,003 (52.2%) |
| 3 or more Vehicles | 64 (5.1%) | 180 (9.4%) |
| Total | 1,256 (100.0%) | 1,921 (100.0%) |
Real Estate & Mortgages in Oak Grove
Real Estate and Mortgage Overview in Oak Grove
| Characteristic | Without Mortgage | With Mortgage |
| Housing Units | 151 | 1,105 |
| Median Property Value | $130,500 | $133,800 |
| Median Household Income | $47,009 | $0 |
| Monthly Housing Costs | $371 | $0 |
| Real Estate Taxes | - | - |
Property Value by Mortgage Status in Oak Grove
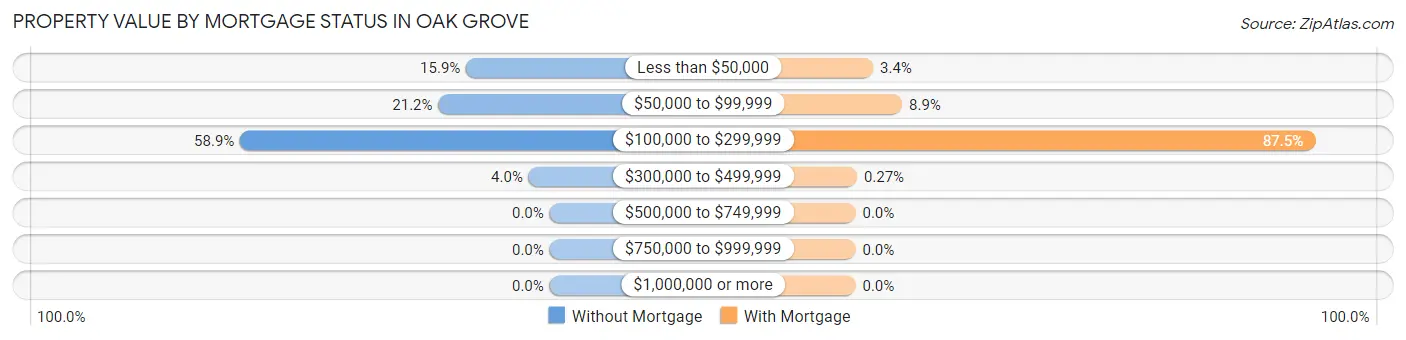
| Property Value | Without Mortgage | With Mortgage |
| Less than $50,000 | 24 (15.9%) | 37 (3.4%) |
| $50,000 to $99,999 | 32 (21.2%) | 98 (8.9%) |
| $100,000 to $299,999 | 89 (58.9%) | 967 (87.5%) |
| $300,000 to $499,999 | 6 (4.0%) | 3 (0.3%) |
| $500,000 to $749,999 | 0 (0.0%) | 0 (0.0%) |
| $750,000 to $999,999 | 0 (0.0%) | 0 (0.0%) |
| $1,000,000 or more | 0 (0.0%) | 0 (0.0%) |
| Total | 151 (100.0%) | 1,105 (100.0%) |
Household Income by Mortgage Status in Oak Grove
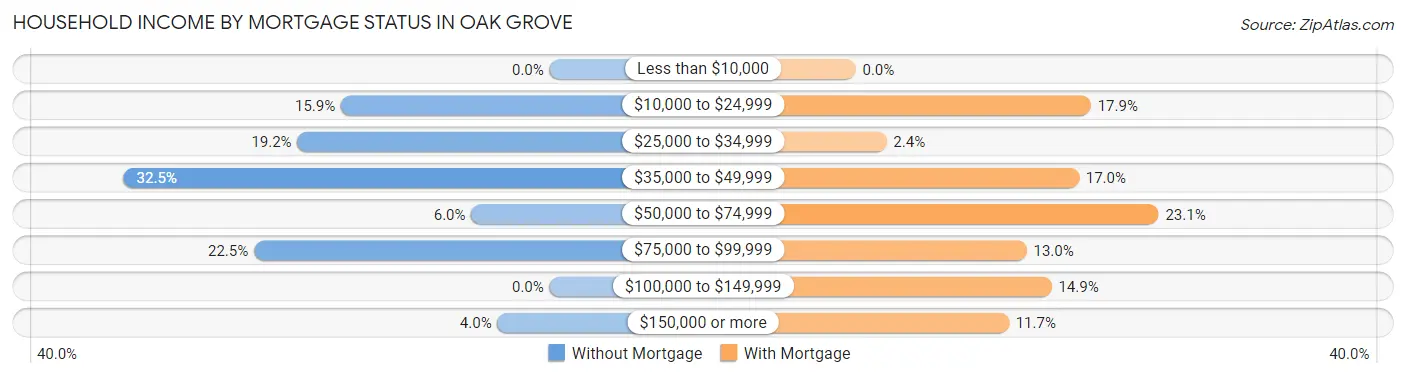
| Household Income | Without Mortgage | With Mortgage |
| Less than $10,000 | 0 (0.0%) | 0 (0.0%) |
| $10,000 to $24,999 | 24 (15.9%) | 198 (17.9%) |
| $25,000 to $34,999 | 29 (19.2%) | 26 (2.4%) |
| $35,000 to $49,999 | 49 (32.5%) | 188 (17.0%) |
| $50,000 to $74,999 | 9 (6.0%) | 255 (23.1%) |
| $75,000 to $99,999 | 34 (22.5%) | 144 (13.0%) |
| $100,000 to $149,999 | 0 (0.0%) | 165 (14.9%) |
| $150,000 or more | 6 (4.0%) | 129 (11.7%) |
| Total | 151 (100.0%) | 1,105 (100.0%) |
Property Value to Household Income Ratio in Oak Grove
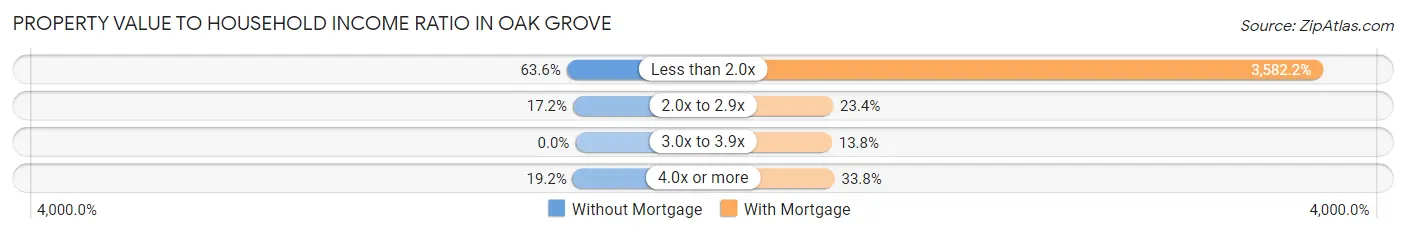
| Value-to-Income Ratio | Without Mortgage | With Mortgage |
| Less than 2.0x | 96 (63.6%) | 39,583 (3,582.2%) |
| 2.0x to 2.9x | 26 (17.2%) | 258 (23.4%) |
| 3.0x to 3.9x | 0 (0.0%) | 152 (13.8%) |
| 4.0x or more | 29 (19.2%) | 373 (33.8%) |
| Total | 151 (100.0%) | 1,105 (100.0%) |
Real Estate Taxes by Mortgage Status in Oak Grove
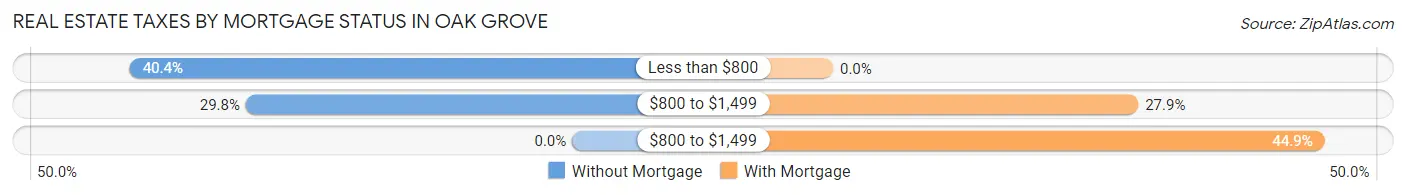
| Property Taxes | Without Mortgage | With Mortgage |
| Less than $800 | 61 (40.4%) | 0 (0.0%) |
| $800 to $1,499 | 45 (29.8%) | 308 (27.9%) |
| $800 to $1,499 | 0 (0.0%) | 496 (44.9%) |
| Total | 151 (100.0%) | 1,105 (100.0%) |
Health & Disability in Oak Grove
Health Insurance Coverage by Age in Oak Grove
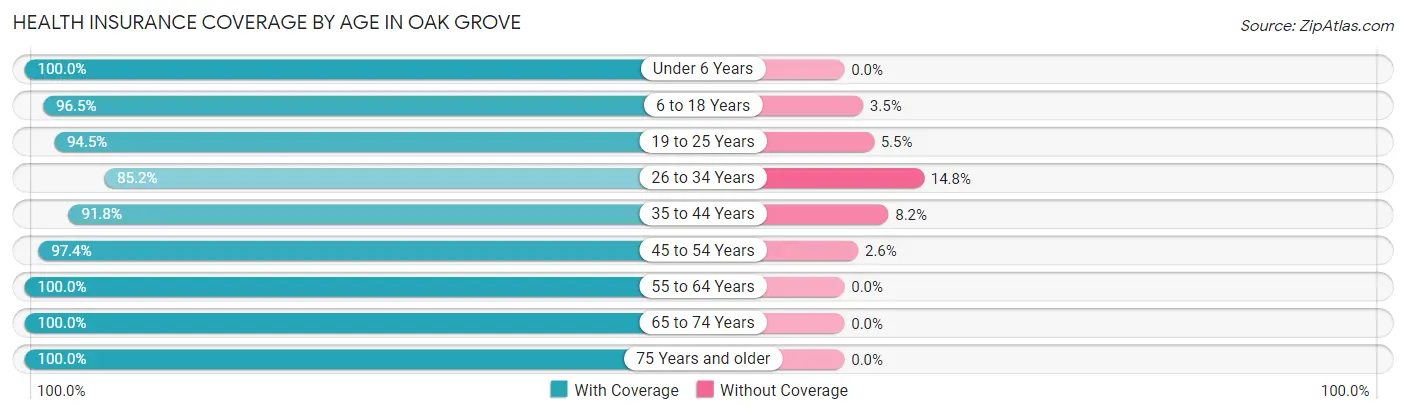
| Age Bracket | With Coverage | Without Coverage |
| Under 6 Years | 1,063 (100.0%) | 0 (0.0%) |
| 6 to 18 Years | 1,695 (96.5%) | 61 (3.5%) |
| 19 to 25 Years | 1,173 (94.5%) | 68 (5.5%) |
| 26 to 34 Years | 959 (85.2%) | 167 (14.8%) |
| 35 to 44 Years | 884 (91.8%) | 79 (8.2%) |
| 45 to 54 Years | 532 (97.4%) | 14 (2.6%) |
| 55 to 64 Years | 292 (100.0%) | 0 (0.0%) |
| 65 to 74 Years | 236 (100.0%) | 0 (0.0%) |
| 75 Years and older | 17 (100.0%) | 0 (0.0%) |
| Total | 6,851 (94.6%) | 389 (5.4%) |
Health Insurance Coverage by Citizenship Status in Oak Grove

| Citizenship Status | With Coverage | Without Coverage |
| Native Born | 1,063 (100.0%) | 0 (0.0%) |
| Foreign Born, Citizen | 1,695 (96.5%) | 61 (3.5%) |
| Foreign Born, not a Citizen | 1,173 (94.5%) | 68 (5.5%) |
Health Insurance Coverage by Household Income in Oak Grove
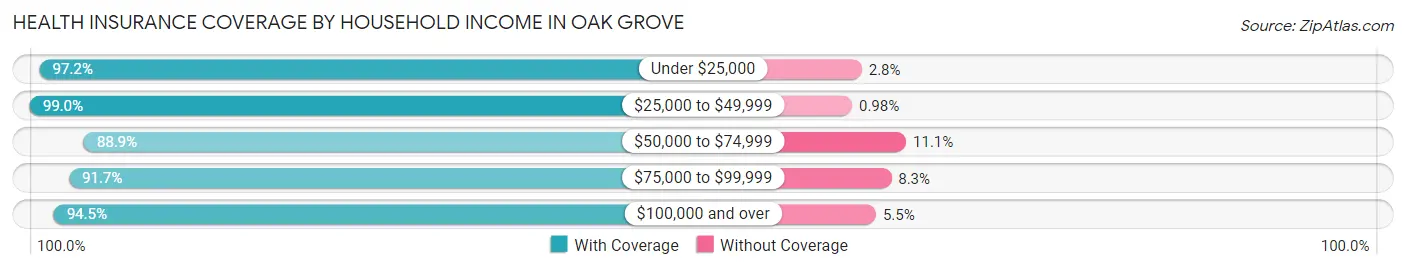
| Household Income | With Coverage | Without Coverage |
| Under $25,000 | 1,106 (97.2%) | 32 (2.8%) |
| $25,000 to $49,999 | 2,217 (99.0%) | 22 (1.0%) |
| $50,000 to $74,999 | 1,256 (88.9%) | 157 (11.1%) |
| $75,000 to $99,999 | 1,408 (91.7%) | 128 (8.3%) |
| $100,000 and over | 864 (94.5%) | 50 (5.5%) |
Public vs Private Health Insurance Coverage by Age in Oak Grove
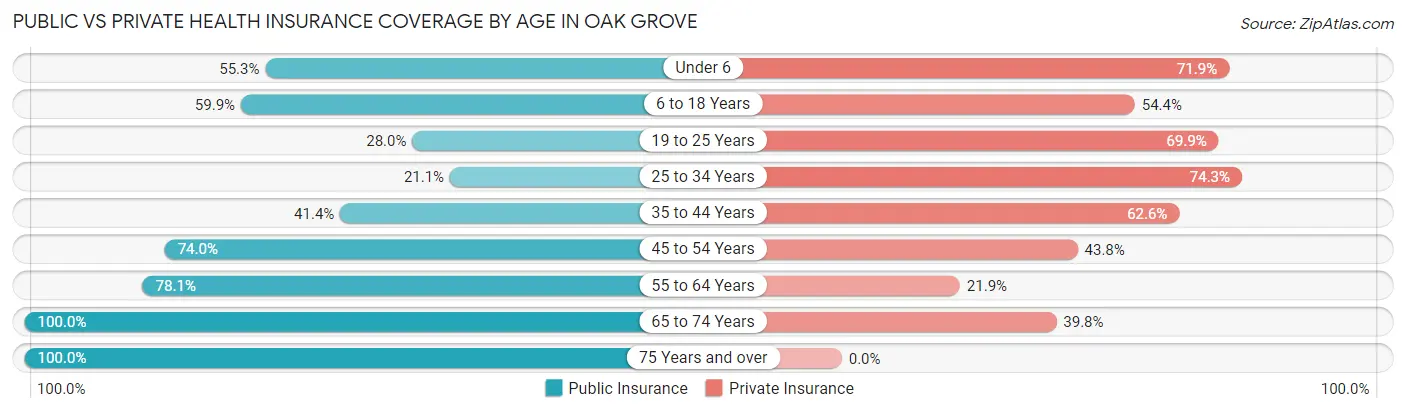
| Age Bracket | Public Insurance | Private Insurance |
| Under 6 | 588 (55.3%) | 764 (71.9%) |
| 6 to 18 Years | 1,051 (59.9%) | 955 (54.4%) |
| 19 to 25 Years | 348 (28.0%) | 868 (69.9%) |
| 25 to 34 Years | 237 (21.0%) | 836 (74.3%) |
| 35 to 44 Years | 399 (41.4%) | 603 (62.6%) |
| 45 to 54 Years | 404 (74.0%) | 239 (43.8%) |
| 55 to 64 Years | 228 (78.1%) | 64 (21.9%) |
| 65 to 74 Years | 236 (100.0%) | 94 (39.8%) |
| 75 Years and over | 17 (100.0%) | 0 (0.0%) |
| Total | 3,508 (48.4%) | 4,423 (61.1%) |
Disability Status by Sex by Age in Oak Grove
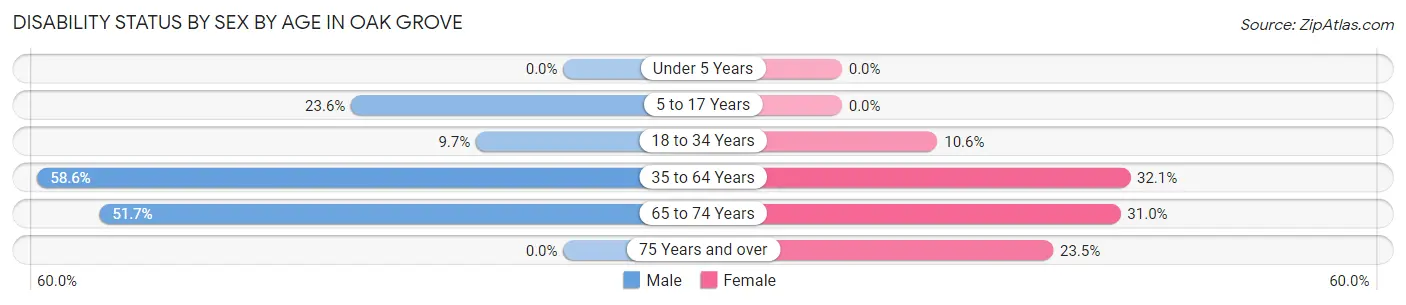
| Age Bracket | Male | Female |
| Under 5 Years | 0 (0.0%) | 0 (0.0%) |
| 5 to 17 Years | 263 (23.6%) | 0 (0.0%) |
| 18 to 34 Years | 101 (9.7%) | 147 (10.6%) |
| 35 to 64 Years | 451 (58.6%) | 331 (32.1%) |
| 65 to 74 Years | 62 (51.7%) | 36 (31.0%) |
| 75 Years and over | 0 (0.0%) | 4 (23.5%) |
Disability Class by Sex by Age in Oak Grove
Disability Class: Hearing Difficulty
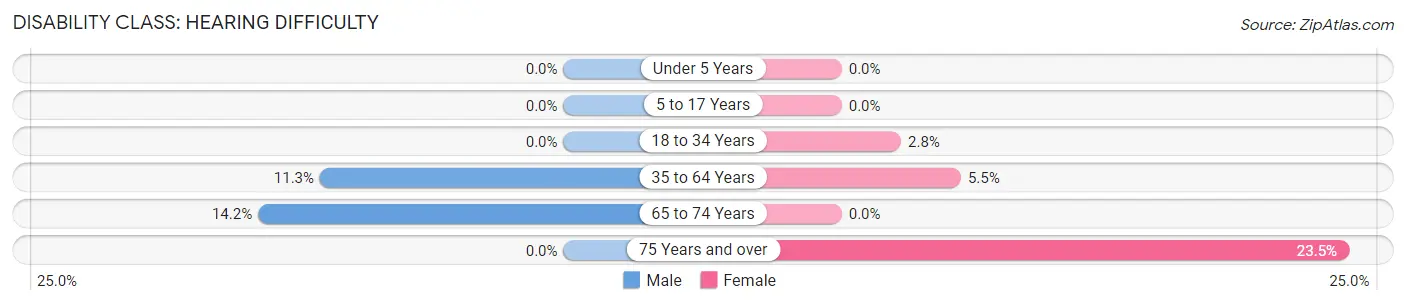
| Age Bracket | Male | Female |
| Under 5 Years | 0 (0.0%) | 0 (0.0%) |
| 5 to 17 Years | 0 (0.0%) | 0 (0.0%) |
| 18 to 34 Years | 0 (0.0%) | 38 (2.8%) |
| 35 to 64 Years | 87 (11.3%) | 57 (5.5%) |
| 65 to 74 Years | 17 (14.2%) | 0 (0.0%) |
| 75 Years and over | 0 (0.0%) | 4 (23.5%) |
Disability Class: Vision Difficulty
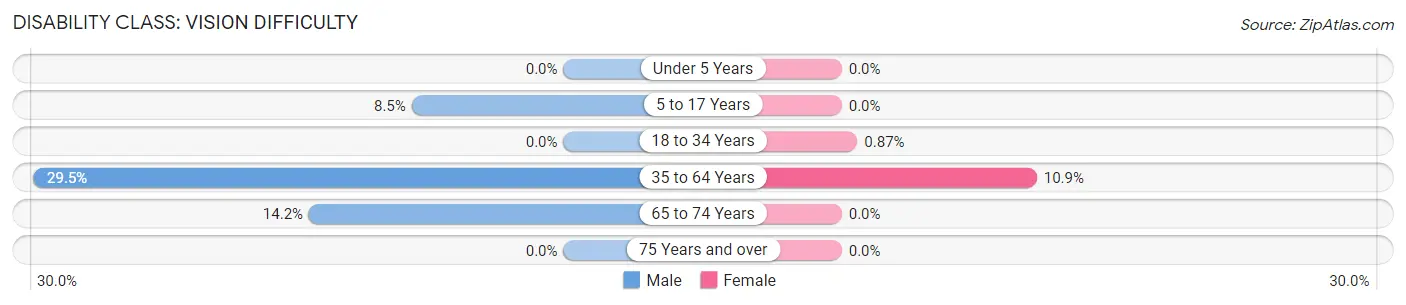
| Age Bracket | Male | Female |
| Under 5 Years | 0 (0.0%) | 0 (0.0%) |
| 5 to 17 Years | 94 (8.5%) | 0 (0.0%) |
| 18 to 34 Years | 0 (0.0%) | 12 (0.9%) |
| 35 to 64 Years | 227 (29.5%) | 112 (10.9%) |
| 65 to 74 Years | 17 (14.2%) | 0 (0.0%) |
| 75 Years and over | 0 (0.0%) | 0 (0.0%) |
Disability Class: Cognitive Difficulty
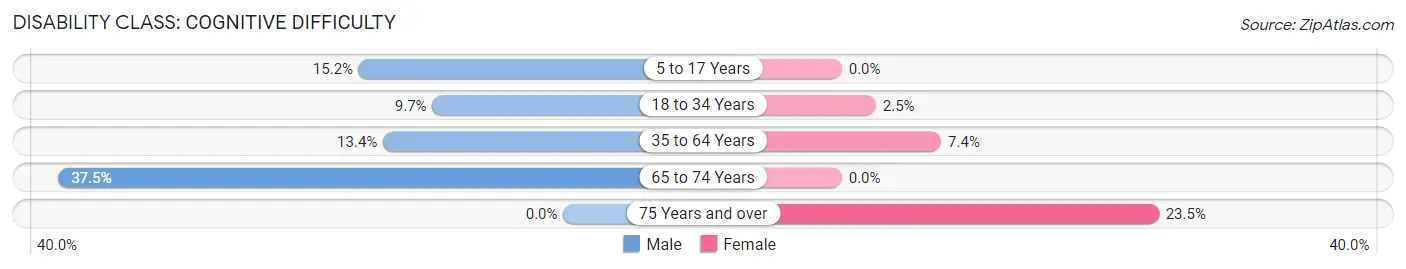
| Age Bracket | Male | Female |
| 5 to 17 Years | 169 (15.2%) | 0 (0.0%) |
| 18 to 34 Years | 101 (9.7%) | 35 (2.5%) |
| 35 to 64 Years | 103 (13.4%) | 76 (7.4%) |
| 65 to 74 Years | 45 (37.5%) | 0 (0.0%) |
| 75 Years and over | 0 (0.0%) | 4 (23.5%) |
Disability Class: Ambulatory Difficulty
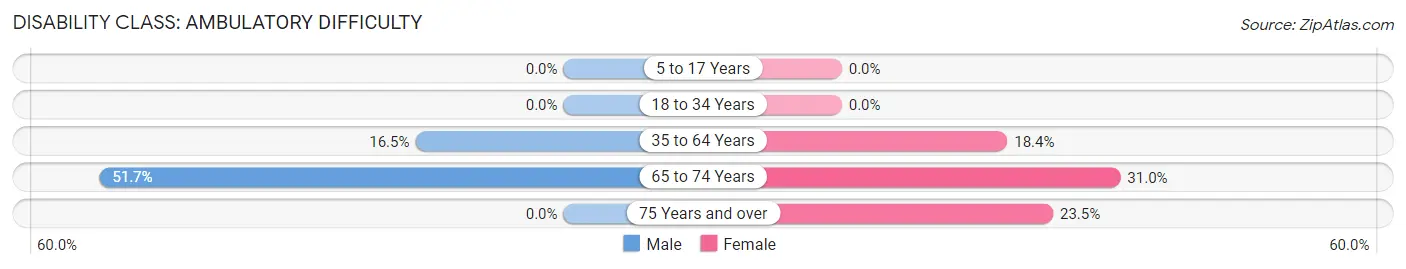
| Age Bracket | Male | Female |
| 5 to 17 Years | 0 (0.0%) | 0 (0.0%) |
| 18 to 34 Years | 0 (0.0%) | 0 (0.0%) |
| 35 to 64 Years | 127 (16.5%) | 190 (18.4%) |
| 65 to 74 Years | 62 (51.7%) | 36 (31.0%) |
| 75 Years and over | 0 (0.0%) | 4 (23.5%) |
Disability Class: Self-Care Difficulty
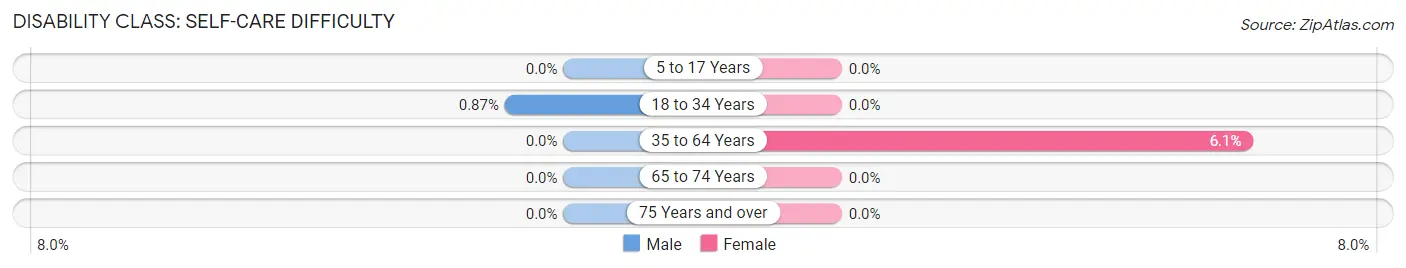
| Age Bracket | Male | Female |
| 5 to 17 Years | 0 (0.0%) | 0 (0.0%) |
| 18 to 34 Years | 9 (0.9%) | 0 (0.0%) |
| 35 to 64 Years | 0 (0.0%) | 63 (6.1%) |
| 65 to 74 Years | 0 (0.0%) | 0 (0.0%) |
| 75 Years and over | 0 (0.0%) | 0 (0.0%) |
Technology Access in Oak Grove
Computing Device Access in Oak Grove
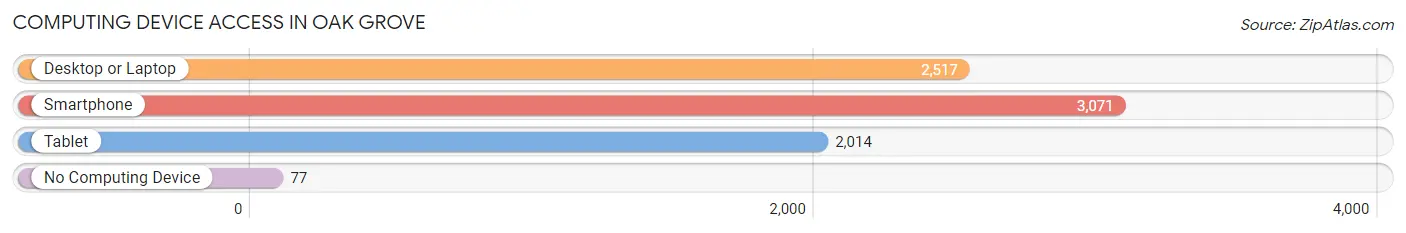
| Device Type | # Households | % Households |
| Desktop or Laptop | 2,517 | 79.2% |
| Smartphone | 3,071 | 96.7% |
| Tablet | 2,014 | 63.4% |
| No Computing Device | 77 | 2.4% |
| Total | 3,177 | 100.0% |
Internet Access in Oak Grove
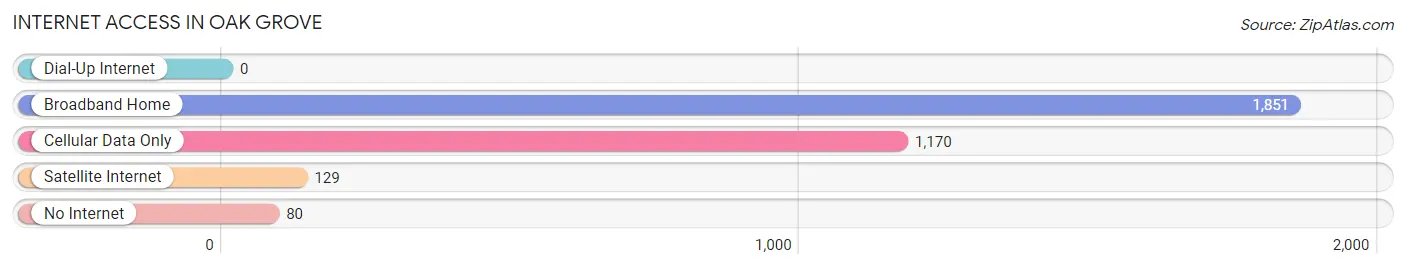
| Internet Type | # Households | % Households |
| Dial-Up Internet | 0 | 0.0% |
| Broadband Home | 1,851 | 58.3% |
| Cellular Data Only | 1,170 | 36.8% |
| Satellite Internet | 129 | 4.1% |
| No Internet | 80 | 2.5% |
| Total | 3,177 | 100.0% |
Oak Grove Summary
Oak Grove, Kentucky is a small city located in Christian County, Kentucky. It is situated on the western edge of the state, just south of the Tennessee border. The city is part of the Clarksville, Tennessee-Hopkinsville, Kentucky metropolitan area. As of the 2010 census, the population of Oak Grove was 6,730.
History
Oak Grove was first settled in the early 1800s by a group of settlers from Virginia. The town was originally known as “Oak Grove Station” and was a stop on the Louisville and Nashville Railroad. The town was officially incorporated in 1891.
In the early 1900s, Oak Grove was a thriving agricultural community. The town was known for its tobacco, corn, and wheat production. The town also had a thriving lumber industry, with several sawmills located in the area.
During World War II, Oak Grove was home to a large military base, Camp Campbell. The base was used to train soldiers for the war effort. After the war, the base was closed and the town returned to its agricultural roots.
Geography
Oak Grove is located in western Kentucky, just south of the Tennessee border. The city is situated in the Pennyrile region of the state, which is known for its rolling hills and lush forests. The city is located near the Cumberland River, which provides a source of recreation for the area.
The climate in Oak Grove is humid subtropical, with hot summers and mild winters. The average annual temperature is around 62 degrees Fahrenheit. The average annual precipitation is around 45 inches.
Economy
Oak Grove’s economy is largely based on agriculture and manufacturing. The city is home to several large manufacturing plants, including a General Motors plant and a Tyson Foods plant. The city is also home to several small businesses, including restaurants, retail stores, and service providers.
The city is also home to a large military base, Fort Campbell. The base is home to the 101st Airborne Division and provides a significant economic boost to the area.
Demographics
As of the 2010 census, the population of Oak Grove was 6,730. The racial makeup of the city was 79.3% White, 15.3% African American, 0.5% Native American, 0.7% Asian, 0.1% Pacific Islander, and 3.2% from other races. Hispanic or Latino of any race were 4.2% of the population.
The median household income in Oak Grove was $41,945, and the median family income was $50,945. The per capita income was $20,945. About 11.3% of the population was below the poverty line.
Oak Grove is a small city with a rich history and a diverse economy. The city is home to a large military base, which provides a significant economic boost to the area. The city is also home to several small businesses, which provide employment opportunities for the local population. The city has a diverse population, with a mix of races and ethnicities.
Common Questions
What is Per Capita Income in Oak Grove?
Per Capita income in Oak Grove is $19,918.
What is the Median Family Income in Oak Grove?
Median Family Income in Oak Grove is $42,458.
What is the Median Household income in Oak Grove?
Median Household Income in Oak Grove is $40,740.
What is Income or Wage Gap in Oak Grove?
Income or Wage Gap in Oak Grove is 33.1%.
Women in Oak Grove earn 66.9 cents for every dollar earned by a man.
What is Inequality or Gini Index in Oak Grove?
Inequality or Gini Index in Oak Grove is 0.40.
What is the Total Population of Oak Grove?
Total Population of Oak Grove is 7,895.
What is the Total Male Population of Oak Grove?
Total Male Population of Oak Grove is 4,135.
What is the Total Female Population of Oak Grove?
Total Female Population of Oak Grove is 3,760.
What is the Ratio of Males per 100 Females in Oak Grove?
There are 109.97 Males per 100 Females in Oak Grove.
What is the Ratio of Females per 100 Males in Oak Grove?
There are 90.93 Females per 100 Males in Oak Grove.
What is the Median Population Age in Oak Grove?
Median Population Age in Oak Grove is 24.6 Years.
What is the Average Family Size in Oak Grove
Average Family Size in Oak Grove is 3.5 People.
What is the Average Household Size in Oak Grove
Average Household Size in Oak Grove is 2.5 People.
How Large is the Labor Force in Oak Grove?
There are 3,536 People in the Labor Forcein in Oak Grove.
What is the Percentage of People in the Labor Force in Oak Grove?
66.9% of People are in the Labor Force in Oak Grove.
What is the Unemployment Rate in Oak Grove?
Unemployment Rate in Oak Grove is 12.2%.