Benton, KY Map & Demographics
Benton Map
Benton Overview
$29,759
PER CAPITA INCOME
$79,235
AVG FAMILY INCOME
$61,443
AVG HOUSEHOLD INCOME
1.2%
WAGE / INCOME GAP [ % ]
98.8¢/ $1
WAGE / INCOME GAP [ $ ]
$11,357
FAMILY INCOME DEFICIT
0.39
INEQUALITY / GINI INDEX
4,753
TOTAL POPULATION
2,203
MALE POPULATION
2,550
FEMALE POPULATION
86.39
MALES / 100 FEMALES
115.75
FEMALES / 100 MALES
44.0
MEDIAN AGE
2.8
AVG FAMILY SIZE
2.1
AVG HOUSEHOLD SIZE
2,175
LABOR FORCE [ PEOPLE ]
52.7%
PERCENT IN LABOR FORCE
1.8%
UNEMPLOYMENT RATE
Benton Zip Codes
Benton Area Codes
Income in Benton
Income Overview in Benton
Per Capita Income in Benton is $29,759, while median incomes of families and households are $79,235 and $61,443 respectively.
| Characteristic | Number | Measure |
| Per Capita Income | 4,753 | $29,759 |
| Median Family Income | 1,172 | $79,235 |
| Mean Family Income | 1,172 | $86,876 |
| Median Household Income | 2,105 | $61,443 |
| Mean Household Income | 2,105 | $67,122 |
| Income Deficit | 1,172 | $11,357 |
| Wage / Income Gap (%) | 4,753 | 1.17% |
| Wage / Income Gap ($) | 4,753 | 98.83¢ per $1 |
| Gini / Inequality Index | 4,753 | 0.39 |
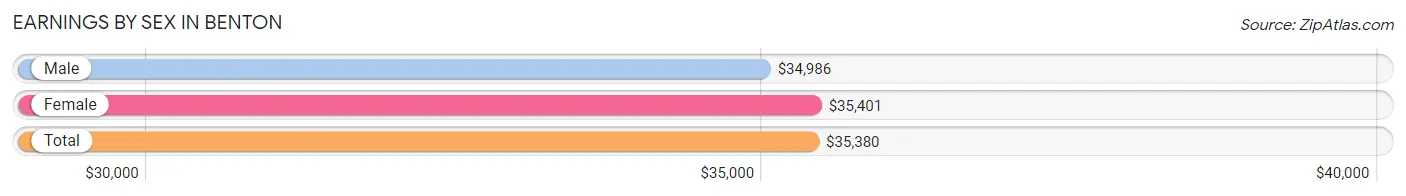
Earnings by Sex in Benton
Average Earnings in Benton are $35,380, $34,986 for men and $35,401 for women, a difference of 1.2%.
| Sex | Number | Average Earnings |
| Male | 1,195 (48.3%) | $34,986 |
| Female | 1,280 (51.7%) | $35,401 |
| Total | 2,475 (100.0%) | $35,380 |
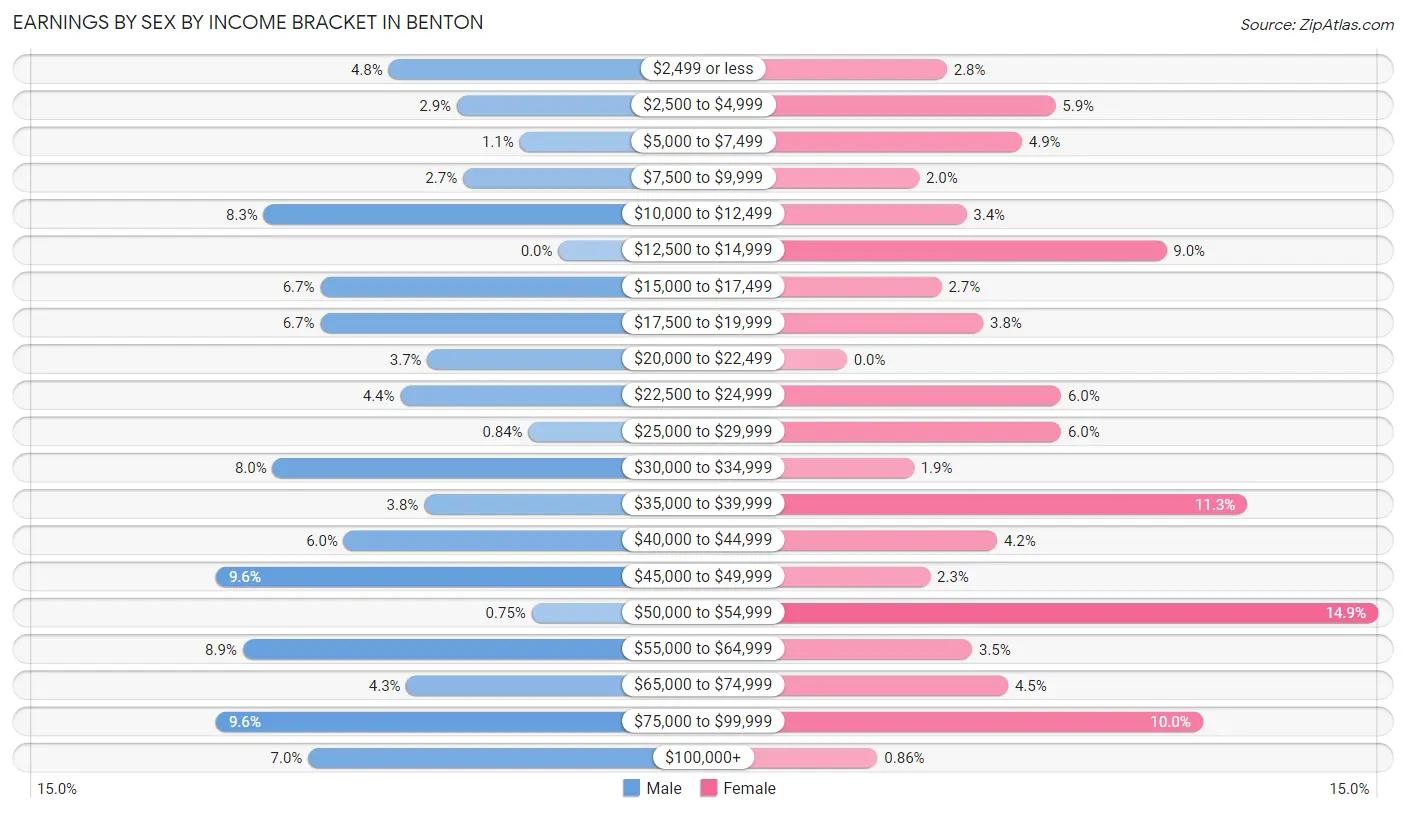
Earnings by Sex by Income Bracket in Benton
The most common earnings brackets in Benton are $45,000 to $49,999 for men (115 | 9.6%) and $50,000 to $54,999 for women (191 | 14.9%).
| Income | Male | Female |
| $2,499 or less | 57 (4.8%) | 36 (2.8%) |
| $2,500 to $4,999 | 34 (2.9%) | 75 (5.9%) |
| $5,000 to $7,499 | 13 (1.1%) | 63 (4.9%) |
| $7,500 to $9,999 | 32 (2.7%) | 26 (2.0%) |
| $10,000 to $12,499 | 99 (8.3%) | 43 (3.4%) |
| $12,500 to $14,999 | 0 (0.0%) | 115 (9.0%) |
| $15,000 to $17,499 | 80 (6.7%) | 34 (2.7%) |
| $17,500 to $19,999 | 80 (6.7%) | 49 (3.8%) |
| $20,000 to $22,499 | 44 (3.7%) | 0 (0.0%) |
| $22,500 to $24,999 | 53 (4.4%) | 77 (6.0%) |
| $25,000 to $29,999 | 10 (0.8%) | 77 (6.0%) |
| $30,000 to $34,999 | 96 (8.0%) | 24 (1.9%) |
| $35,000 to $39,999 | 45 (3.8%) | 144 (11.3%) |
| $40,000 to $44,999 | 72 (6.0%) | 54 (4.2%) |
| $45,000 to $49,999 | 115 (9.6%) | 30 (2.3%) |
| $50,000 to $54,999 | 9 (0.7%) | 191 (14.9%) |
| $55,000 to $64,999 | 106 (8.9%) | 45 (3.5%) |
| $65,000 to $74,999 | 51 (4.3%) | 58 (4.5%) |
| $75,000 to $99,999 | 115 (9.6%) | 128 (10.0%) |
| $100,000+ | 84 (7.0%) | 11 (0.9%) |
| Total | 1,195 (100.0%) | 1,280 (100.0%) |
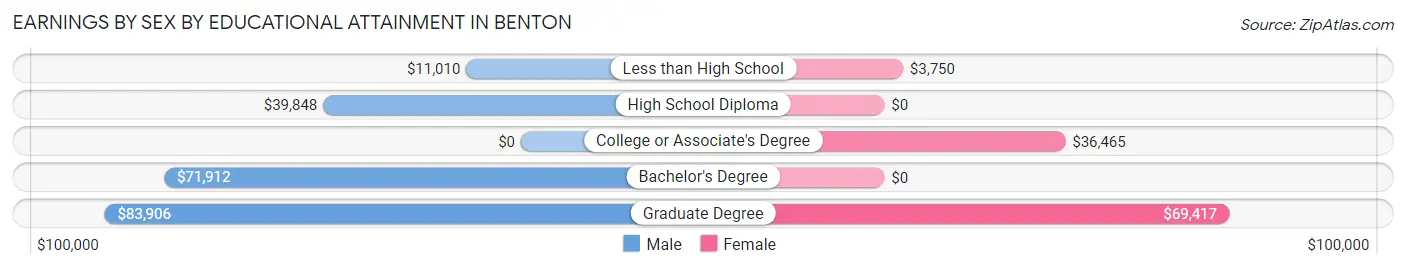
Earnings by Sex by Educational Attainment in Benton
Average earnings in Benton are $42,683 for men and $36,536 for women, a difference of 14.4%. Men with an educational attainment of graduate degree enjoy the highest average annual earnings of $83,906, while those with less than high school education earn the least with $11,010. Women with an educational attainment of graduate degree earn the most with the average annual earnings of $69,417, while those with less than high school education have the smallest earnings of $3,750.
| Educational Attainment | Male Income | Female Income |
| Less than High School | $11,010 | $3,750 |
| High School Diploma | $39,848 | $0 |
| College or Associate's Degree | - | - |
| Bachelor's Degree | $71,912 | $0 |
| Graduate Degree | $83,906 | $69,417 |
| Total | $42,683 | $36,536 |
Family Income in Benton
Family Income Brackets in Benton
According to the Benton family income data, there are 281 families falling into the $100,000 to $149,999 income range, which is the most common income bracket and makes up 24.0% of all families.
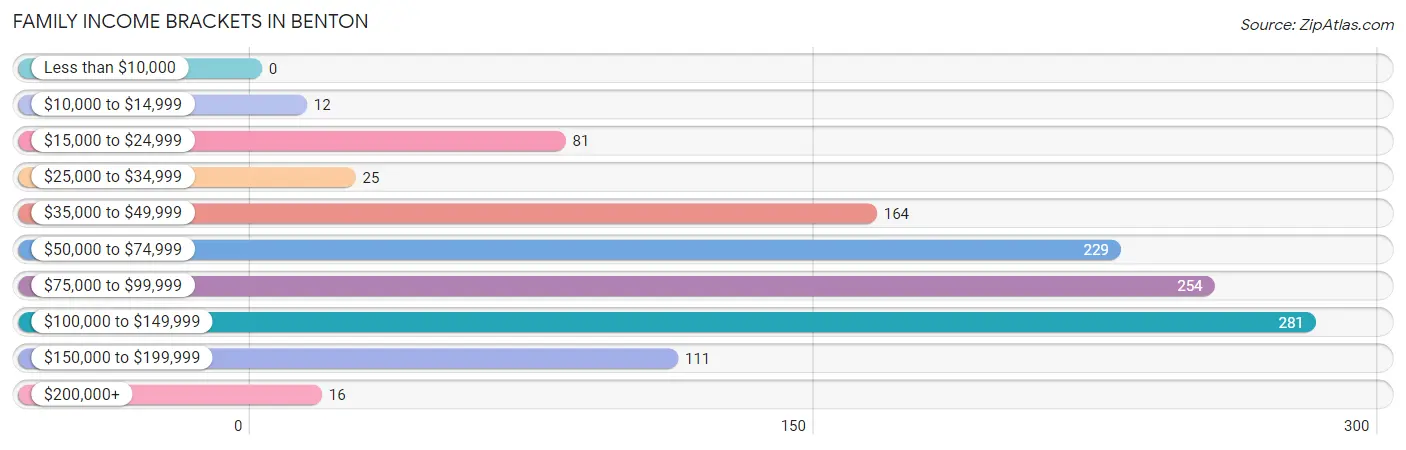
| Income Bracket | # Families | % Families |
| Less than $10,000 | 0 | 0.0% |
| $10,000 to $14,999 | 12 | 1.0% |
| $15,000 to $24,999 | 81 | 6.9% |
| $25,000 to $34,999 | 25 | 2.1% |
| $35,000 to $49,999 | 164 | 14.0% |
| $50,000 to $74,999 | 229 | 19.5% |
| $75,000 to $99,999 | 254 | 21.7% |
| $100,000 to $149,999 | 281 | 24.0% |
| $150,000 to $199,999 | 111 | 9.5% |
| $200,000+ | 16 | 1.4% |
Family Income by Famaliy Size in Benton
4-person families (142 | 12.1%) account for the highest median family income in Benton with $102,461 per family, while 2-person families (518 | 44.2%) have the highest median income of $29,190 per family member.
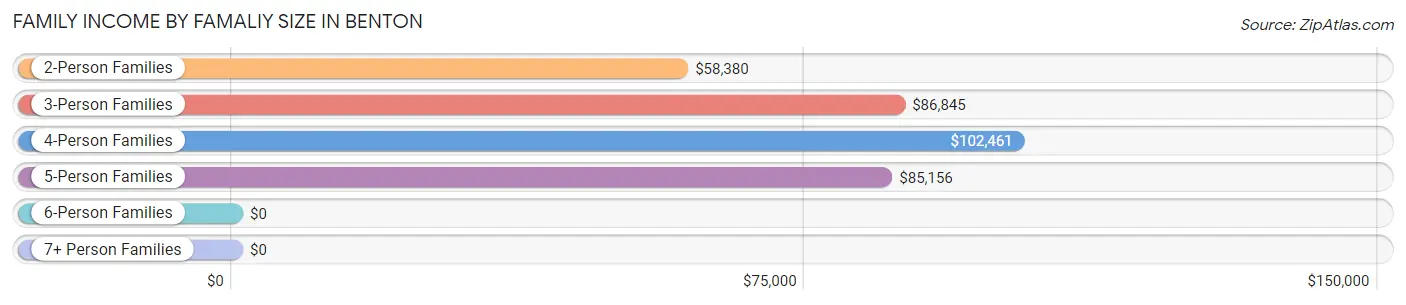
| Income Bracket | # Families | Median Income |
| 2-Person Families | 518 (44.2%) | $58,380 |
| 3-Person Families | 409 (34.9%) | $86,845 |
| 4-Person Families | 142 (12.1%) | $102,461 |
| 5-Person Families | 75 (6.4%) | $85,156 |
| 6-Person Families | 28 (2.4%) | $0 |
| 7+ Person Families | 0 (0.0%) | $0 |
| Total | 1,172 (100.0%) | $79,235 |
Family Income by Number of Earners in Benton
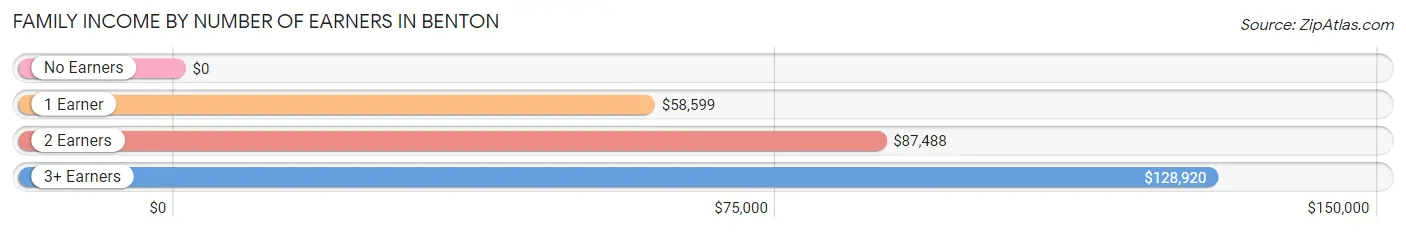
| Number of Earners | # Families | Median Income |
| No Earners | 307 (26.2%) | $0 |
| 1 Earner | 191 (16.3%) | $58,599 |
| 2 Earners | 521 (44.5%) | $87,488 |
| 3+ Earners | 153 (13.1%) | $128,920 |
| Total | 1,172 (100.0%) | $79,235 |
Household Income in Benton
Household Income Brackets in Benton
With 438 households falling in the category, the $75,000 to $99,999 income range is the most frequent in Benton, accounting for 20.8% of all households. In contrast, only 17 households (0.8%) fall into the $200,000+ income bracket, making it the least populous group.
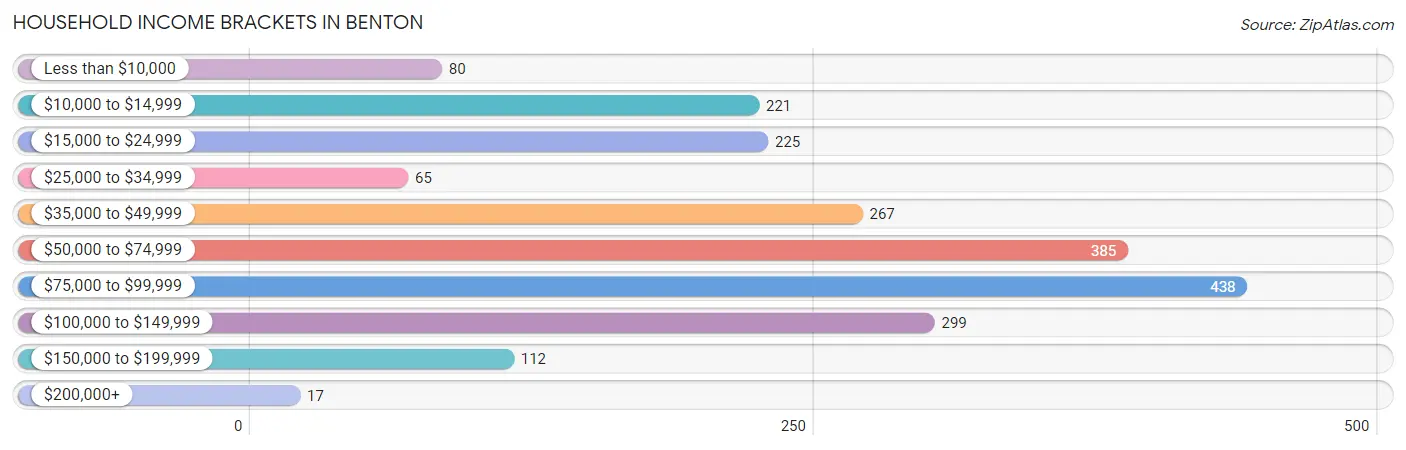
| Income Bracket | # Households | % Households |
| Less than $10,000 | 80 | 3.8% |
| $10,000 to $14,999 | 221 | 10.5% |
| $15,000 to $24,999 | 225 | 10.7% |
| $25,000 to $34,999 | 65 | 3.1% |
| $35,000 to $49,999 | 267 | 12.7% |
| $50,000 to $74,999 | 385 | 18.3% |
| $75,000 to $99,999 | 438 | 20.8% |
| $100,000 to $149,999 | 299 | 14.2% |
| $150,000 to $199,999 | 112 | 5.3% |
| $200,000+ | 17 | 0.8% |
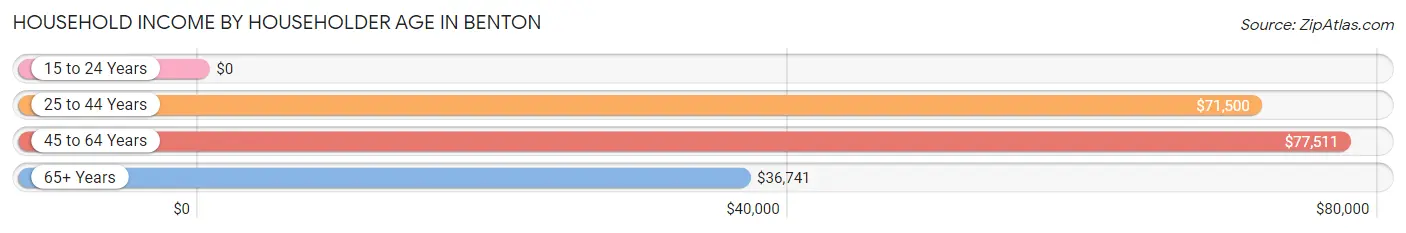
Household Income by Householder Age in Benton
The median household income in Benton is $61,443, with the highest median household income of $77,511 found in the 45 to 64 years age bracket for the primary householder. A total of 689 households (32.7%) fall into this category. Meanwhile, the 15 to 24 years age bracket for the primary householder has the lowest median household income of $0, with 32 households (1.5%) in this group.
| Income Bracket | # Households | Median Income |
| 15 to 24 Years | 32 (1.5%) | $0 |
| 25 to 44 Years | 514 (24.4%) | $71,500 |
| 45 to 64 Years | 689 (32.7%) | $77,511 |
| 65+ Years | 870 (41.3%) | $36,741 |
| Total | 2,105 (100.0%) | $61,443 |
Poverty in Benton
Income Below Poverty by Sex and Age in Benton
With 8.4% poverty level for males and 13.0% for females among the residents of Benton, 16 and 17 year old males and 16 and 17 year old females are the most vulnerable to poverty, with 20 males (27.0%) and 35 females (49.3%) in their respective age groups living below the poverty level.
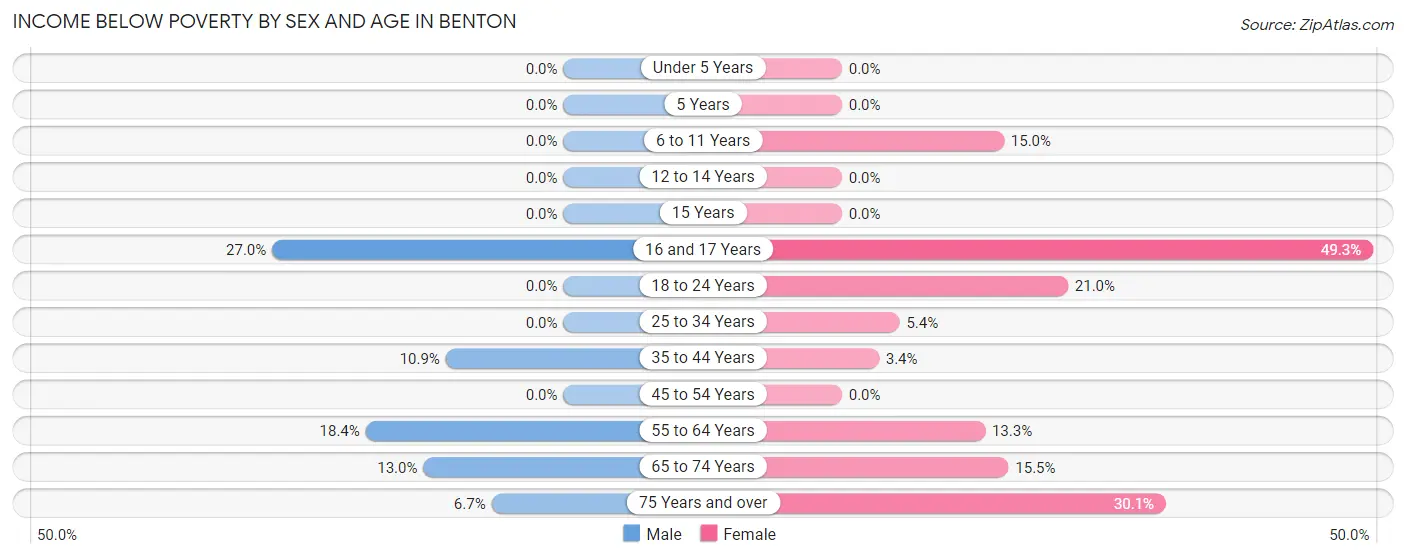
| Age Bracket | Male | Female |
| Under 5 Years | 0 (0.0%) | 0 (0.0%) |
| 5 Years | 0 (0.0%) | 0 (0.0%) |
| 6 to 11 Years | 0 (0.0%) | 20 (15.0%) |
| 12 to 14 Years | 0 (0.0%) | 0 (0.0%) |
| 15 Years | 0 (0.0%) | 0 (0.0%) |
| 16 and 17 Years | 20 (27.0%) | 35 (49.3%) |
| 18 to 24 Years | 0 (0.0%) | 30 (21.0%) |
| 25 to 34 Years | 0 (0.0%) | 16 (5.3%) |
| 35 to 44 Years | 32 (10.9%) | 12 (3.4%) |
| 45 to 54 Years | 0 (0.0%) | 0 (0.0%) |
| 55 to 64 Years | 58 (18.3%) | 59 (13.3%) |
| 65 to 74 Years | 39 (13.0%) | 30 (15.5%) |
| 75 Years and over | 12 (6.7%) | 114 (30.1%) |
| Total | 161 (8.4%) | 316 (13.0%) |
Income Above Poverty by Sex and Age in Benton
According to the poverty statistics in Benton, males aged under 5 years and females aged under 5 years are the age groups that are most secure financially, with 100.0% of males and 100.0% of females in these age groups living above the poverty line.
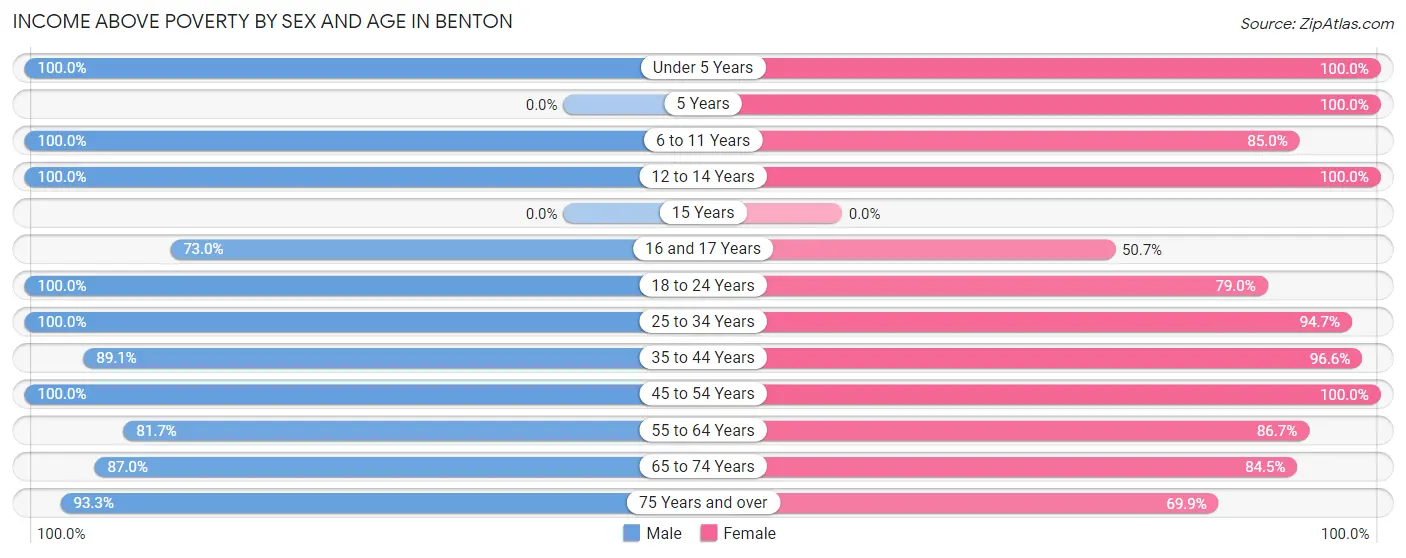
| Age Bracket | Male | Female |
| Under 5 Years | 170 (100.0%) | 54 (100.0%) |
| 5 Years | 0 (0.0%) | 48 (100.0%) |
| 6 to 11 Years | 118 (100.0%) | 113 (85.0%) |
| 12 to 14 Years | 74 (100.0%) | 28 (100.0%) |
| 15 Years | 0 (0.0%) | 0 (0.0%) |
| 16 and 17 Years | 54 (73.0%) | 36 (50.7%) |
| 18 to 24 Years | 120 (100.0%) | 113 (79.0%) |
| 25 to 34 Years | 197 (100.0%) | 283 (94.7%) |
| 35 to 44 Years | 261 (89.1%) | 338 (96.6%) |
| 45 to 54 Years | 79 (100.0%) | 282 (100.0%) |
| 55 to 64 Years | 258 (81.7%) | 385 (86.7%) |
| 65 to 74 Years | 261 (87.0%) | 164 (84.5%) |
| 75 Years and over | 168 (93.3%) | 265 (69.9%) |
| Total | 1,760 (91.6%) | 2,109 (87.0%) |
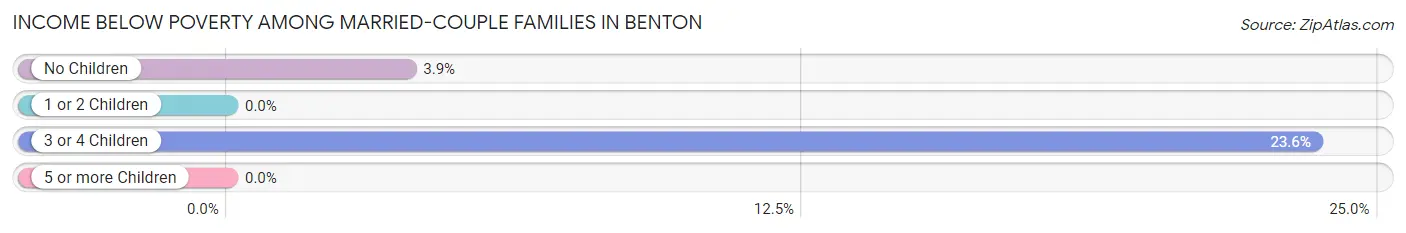
Income Below Poverty Among Married-Couple Families in Benton
The poverty statistics for married-couple families in Benton show that 4.9% or 46 of the total 941 families live below the poverty line. Families with 3 or 4 children have the highest poverty rate of 23.6%, comprising of 21 families. On the other hand, families with 1 or 2 children have the lowest poverty rate of 0.0%, which includes 0 families.
| Children | Above Poverty | Below Poverty |
| No Children | 620 (96.1%) | 25 (3.9%) |
| 1 or 2 Children | 207 (100.0%) | 0 (0.0%) |
| 3 or 4 Children | 68 (76.4%) | 21 (23.6%) |
| 5 or more Children | 0 (0.0%) | 0 (0.0%) |
| Total | 895 (95.1%) | 46 (4.9%) |
Income Below Poverty Among Single-Parent Households in Benton
| Children | Single Father | Single Mother |
| No Children | 0 (0.0%) | 0 (0.0%) |
| 1 or 2 Children | 0 (0.0%) | 0 (0.0%) |
| 3 or 4 Children | 0 (0.0%) | 0 (0.0%) |
| 5 or more Children | 0 (0.0%) | 0 (0.0%) |
| Total | 0 (0.0%) | 0 (0.0%) |
Income Below Poverty Among Married-Couple vs Single-Parent Households in Benton
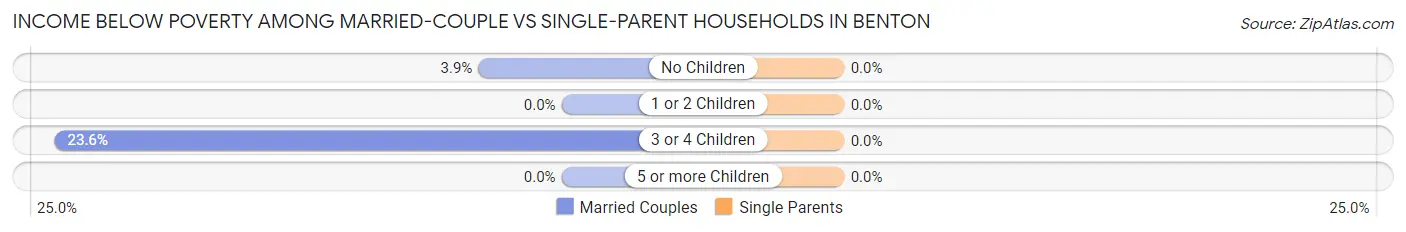
| Children | Married-Couple Families | Single-Parent Households |
| No Children | 25 (3.9%) | 0 (0.0%) |
| 1 or 2 Children | 0 (0.0%) | 0 (0.0%) |
| 3 or 4 Children | 21 (23.6%) | 0 (0.0%) |
| 5 or more Children | 0 (0.0%) | 0 (0.0%) |
| Total | 46 (4.9%) | 0 (0.0%) |
Race in Benton
The most populous races in Benton are White / Caucasian (4,341 | 91.3%), Hispanic or Latino (204 | 4.3%), and Two or more Races (168 | 3.5%).
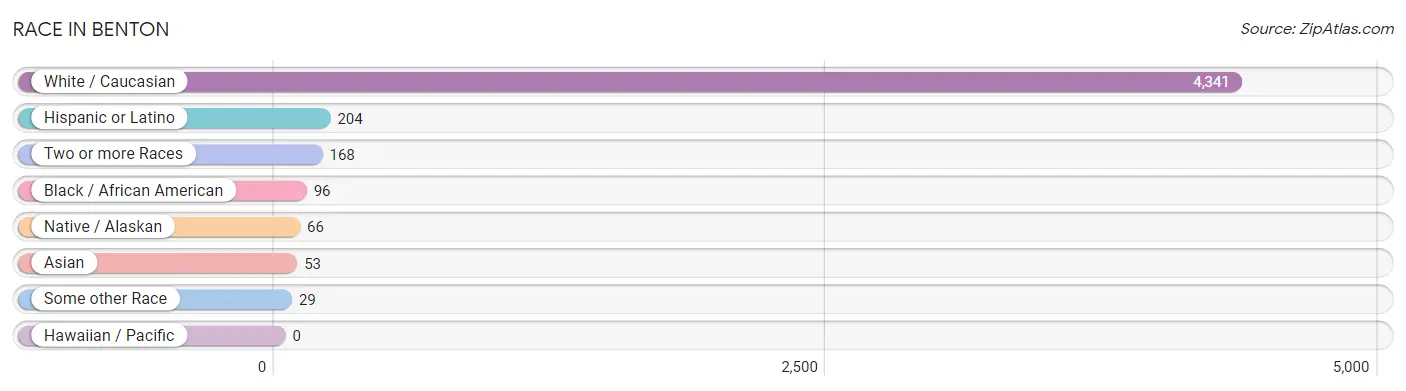
| Race | # Population | % Population |
| Asian | 53 | 1.1% |
| Black / African American | 96 | 2.0% |
| Hawaiian / Pacific | 0 | 0.0% |
| Hispanic or Latino | 204 | 4.3% |
| Native / Alaskan | 66 | 1.4% |
| White / Caucasian | 4,341 | 91.3% |
| Two or more Races | 168 | 3.5% |
| Some other Race | 29 | 0.6% |
| Total | 4,753 | 100.0% |
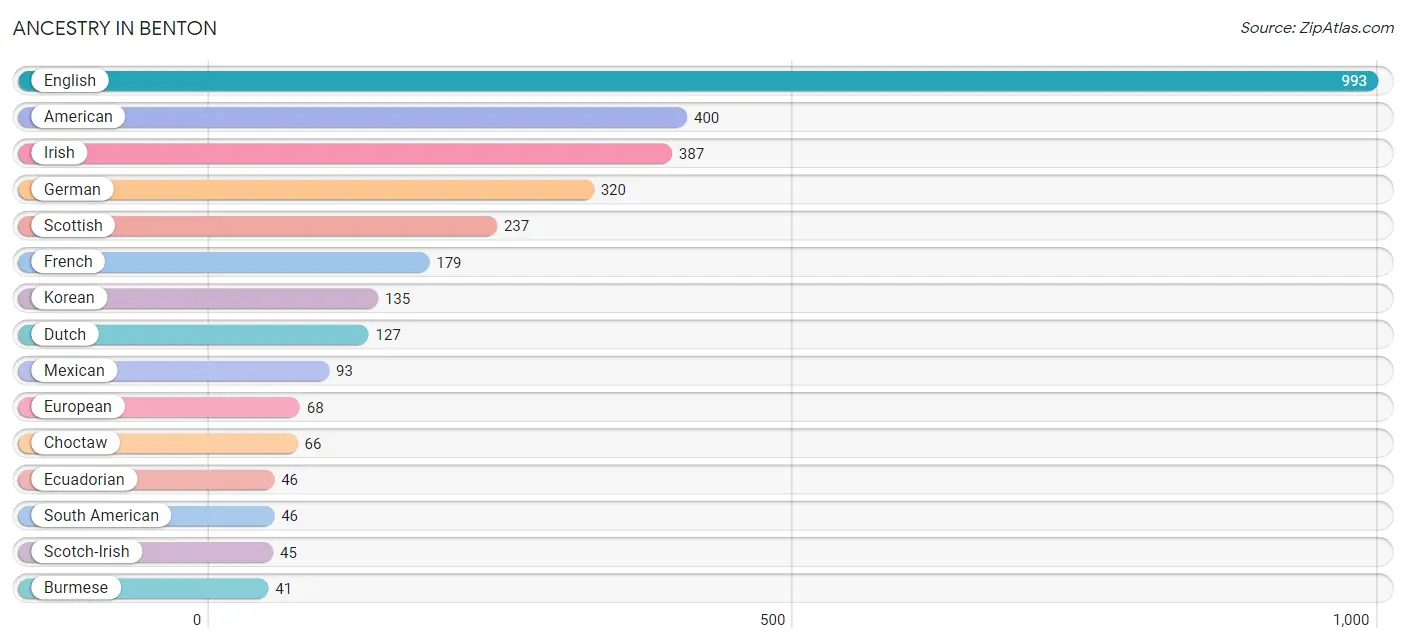
Ancestry in Benton
The most populous ancestries reported in Benton are English (993 | 20.9%), American (400 | 8.4%), Irish (387 | 8.1%), German (320 | 6.7%), and Scottish (237 | 5.0%), together accounting for 49.2% of all Benton residents.
| Ancestry | # Population | % Population |
| African | 6 | 0.1% |
| American | 400 | 8.4% |
| Blackfeet | 16 | 0.3% |
| Burmese | 41 | 0.9% |
| Cajun | 4 | 0.1% |
| Central American | 8 | 0.2% |
| Choctaw | 66 | 1.4% |
| Danish | 12 | 0.3% |
| Dutch | 127 | 2.7% |
| Ecuadorian | 46 | 1.0% |
| English | 993 | 20.9% |
| European | 68 | 1.4% |
| Finnish | 14 | 0.3% |
| French | 179 | 3.8% |
| German | 320 | 6.7% |
| Guatemalan | 8 | 0.2% |
| Indian (Asian) | 13 | 0.3% |
| Iranian | 10 | 0.2% |
| Irish | 387 | 8.1% |
| Italian | 30 | 0.6% |
| Korean | 135 | 2.8% |
| Mexican | 93 | 2.0% |
| Puerto Rican | 8 | 0.2% |
| Scotch-Irish | 45 | 0.9% |
| Scottish | 237 | 5.0% |
| South American | 46 | 1.0% |
| Subsaharan African | 6 | 0.1% |
| Welsh | 25 | 0.5% | View All 28 Rows |
Immigrants in Benton
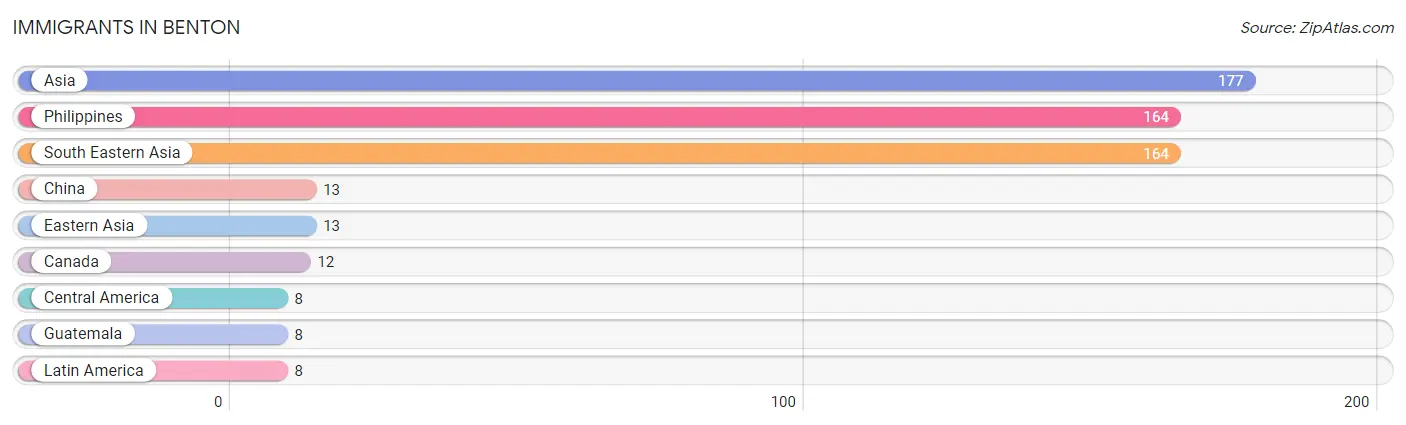
The most numerous immigrant groups reported in Benton came from Asia (177 | 3.7%), Philippines (164 | 3.5%), South Eastern Asia (164 | 3.5%), China (13 | 0.3%), and Eastern Asia (13 | 0.3%), together accounting for 11.2% of all Benton residents.
| Immigration Origin | # Population | % Population |
| Asia | 177 | 3.7% |
| Canada | 12 | 0.3% |
| Central America | 8 | 0.2% |
| China | 13 | 0.3% |
| Eastern Asia | 13 | 0.3% |
| Guatemala | 8 | 0.2% |
| Latin America | 8 | 0.2% |
| Philippines | 164 | 3.5% |
| South Eastern Asia | 164 | 3.5% | View All 9 Rows |
Sex and Age in Benton
Sex and Age in Benton
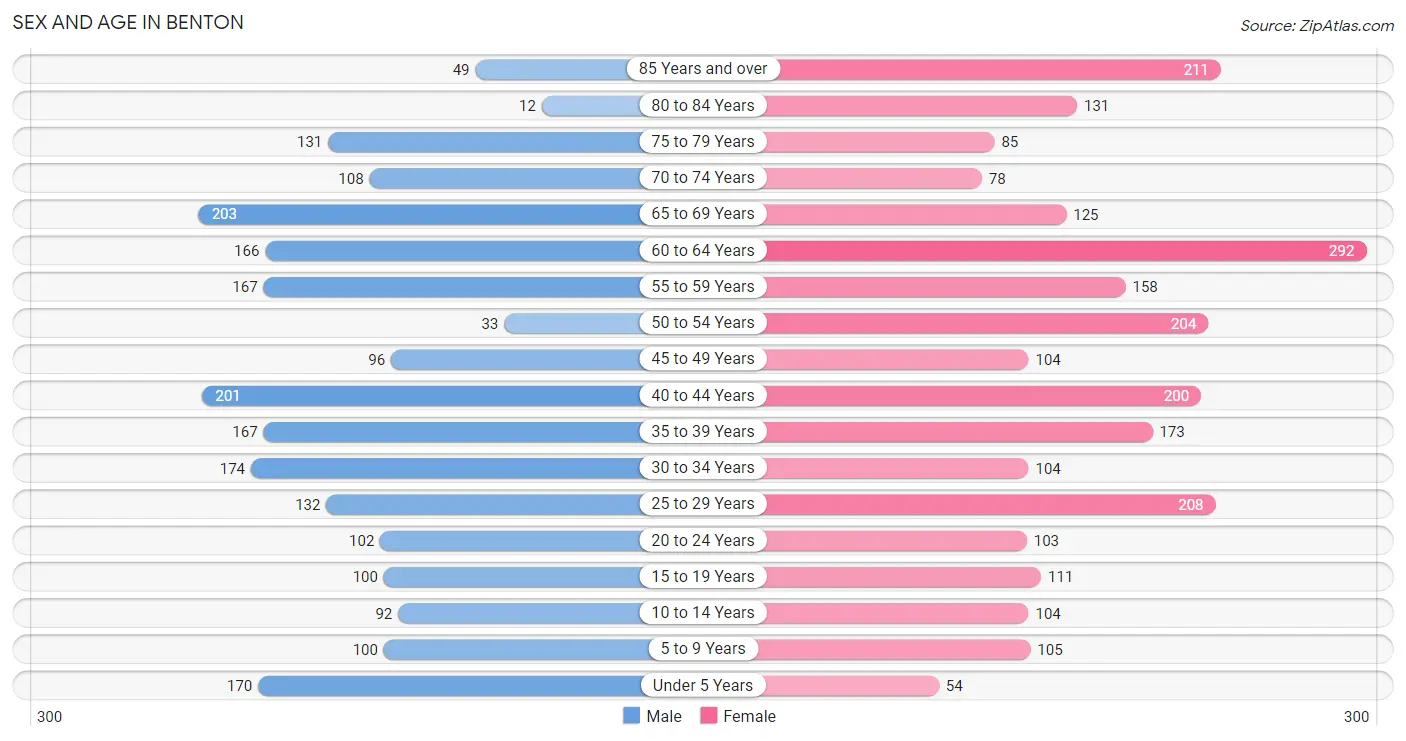
The most populous age groups in Benton are 65 to 69 Years (203 | 9.2%) for men and 60 to 64 Years (292 | 11.5%) for women.
| Age Bracket | Male | Female |
| Under 5 Years | 170 (7.7%) | 54 (2.1%) |
| 5 to 9 Years | 100 (4.5%) | 105 (4.1%) |
| 10 to 14 Years | 92 (4.2%) | 104 (4.1%) |
| 15 to 19 Years | 100 (4.5%) | 111 (4.3%) |
| 20 to 24 Years | 102 (4.6%) | 103 (4.0%) |
| 25 to 29 Years | 132 (6.0%) | 208 (8.2%) |
| 30 to 34 Years | 174 (7.9%) | 104 (4.1%) |
| 35 to 39 Years | 167 (7.6%) | 173 (6.8%) |
| 40 to 44 Years | 201 (9.1%) | 200 (7.8%) |
| 45 to 49 Years | 96 (4.4%) | 104 (4.1%) |
| 50 to 54 Years | 33 (1.5%) | 204 (8.0%) |
| 55 to 59 Years | 167 (7.6%) | 158 (6.2%) |
| 60 to 64 Years | 166 (7.5%) | 292 (11.5%) |
| 65 to 69 Years | 203 (9.2%) | 125 (4.9%) |
| 70 to 74 Years | 108 (4.9%) | 78 (3.1%) |
| 75 to 79 Years | 131 (5.9%) | 85 (3.3%) |
| 80 to 84 Years | 12 (0.5%) | 131 (5.1%) |
| 85 Years and over | 49 (2.2%) | 211 (8.3%) |
| Total | 2,203 (100.0%) | 2,550 (100.0%) |
Families and Households in Benton
Median Family Size in Benton
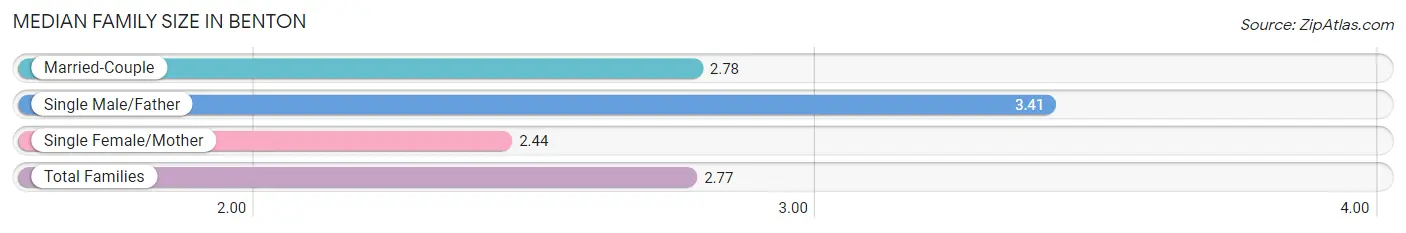
The median family size in Benton is 2.77 persons per family, with single male/father families (66 | 5.6%) accounting for the largest median family size of 3.41 persons per family. On the other hand, single female/mother families (165 | 14.1%) represent the smallest median family size with 2.44 persons per family.
| Family Type | # Families | Family Size |
| Married-Couple | 941 (80.3%) | 2.78 |
| Single Male/Father | 66 (5.6%) | 3.41 |
| Single Female/Mother | 165 (14.1%) | 2.44 |
| Total Families | 1,172 (100.0%) | 2.77 |
Median Household Size in Benton
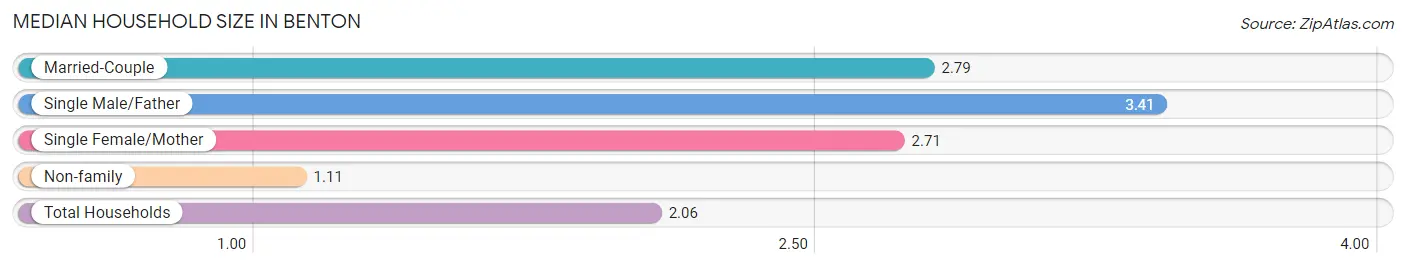
The median household size in Benton is 2.06 persons per household, with single male/father households (66 | 3.1%) accounting for the largest median household size of 3.41 persons per household. non-family households (933 | 44.3%) represent the smallest median household size with 1.11 persons per household.
| Household Type | # Households | Household Size |
| Married-Couple | 941 (44.7%) | 2.79 |
| Single Male/Father | 66 (3.1%) | 3.41 |
| Single Female/Mother | 165 (7.8%) | 2.71 |
| Non-family | 933 (44.3%) | 1.11 |
| Total Households | 2,105 (100.0%) | 2.06 |
Household Size by Marriage Status in Benton
Out of a total of 2,105 households in Benton, 1,172 (55.7%) are family households, while 933 (44.3%) are nonfamily households. The most numerous type of family households are 2-person households, comprising 518, and the most common type of nonfamily households are 1-person households, comprising 840.
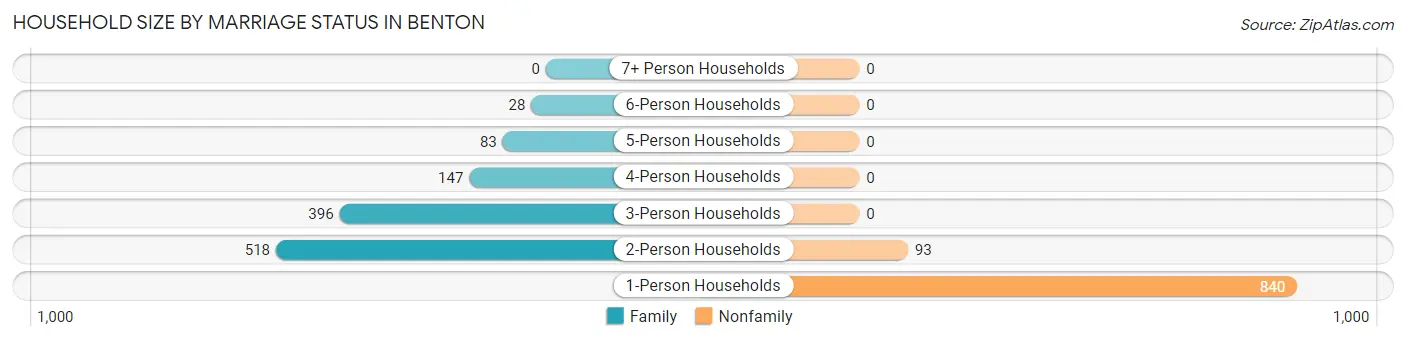
| Household Size | Family Households | Nonfamily Households |
| 1-Person Households | - | 840 (39.9%) |
| 2-Person Households | 518 (24.6%) | 93 (4.4%) |
| 3-Person Households | 396 (18.8%) | 0 (0.0%) |
| 4-Person Households | 147 (7.0%) | 0 (0.0%) |
| 5-Person Households | 83 (3.9%) | 0 (0.0%) |
| 6-Person Households | 28 (1.3%) | 0 (0.0%) |
| 7+ Person Households | 0 (0.0%) | 0 (0.0%) |
| Total | 1,172 (55.7%) | 933 (44.3%) |
Female Fertility in Benton
Fertility by Age in Benton
Average fertility rate in Benton is 23.0 births per 1,000 women. Women in the age bracket of 20 to 34 years have the highest fertility rate with 31.0 births per 1,000 women. Women in the age bracket of 20 to 34 years acount for 54.2% of all women with births.
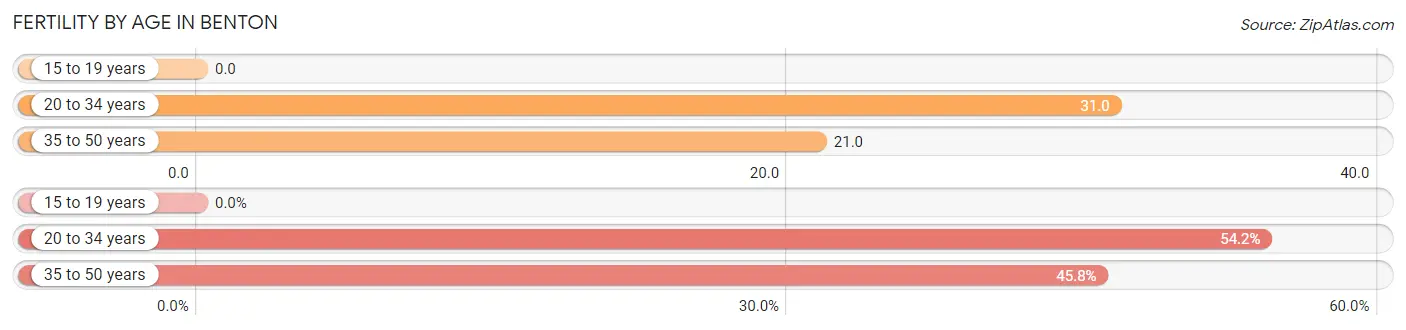
| Age Bracket | Women with Births | Births / 1,000 Women |
| 15 to 19 years | 0 (0.0%) | 0.0 |
| 20 to 34 years | 13 (54.2%) | 31.0 |
| 35 to 50 years | 11 (45.8%) | 21.0 |
| Total | 24 (100.0%) | 23.0 |
Fertility by Age by Marriage Status in Benton
45.8% of women with births (24) in Benton are married. The highest percentage of unmarried women with births falls into 20 to 34 years age bracket with 100.0% of them unmarried at the time of birth, while the lowest percentage of unmarried women with births belong to 35 to 50 years age bracket with 0.0% of them unmarried.
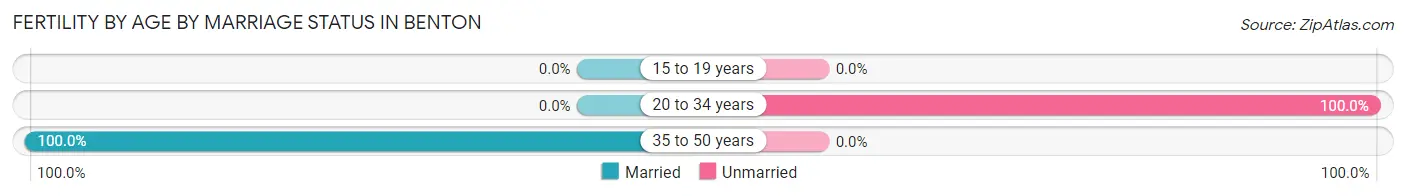
| Age Bracket | Married | Unmarried |
| 15 to 19 years | 0 (0.0%) | 0 (0.0%) |
| 20 to 34 years | 0 (0.0%) | 13 (100.0%) |
| 35 to 50 years | 11 (100.0%) | 0 (0.0%) |
| Total | 11 (45.8%) | 13 (54.2%) |
Fertility by Education in Benton
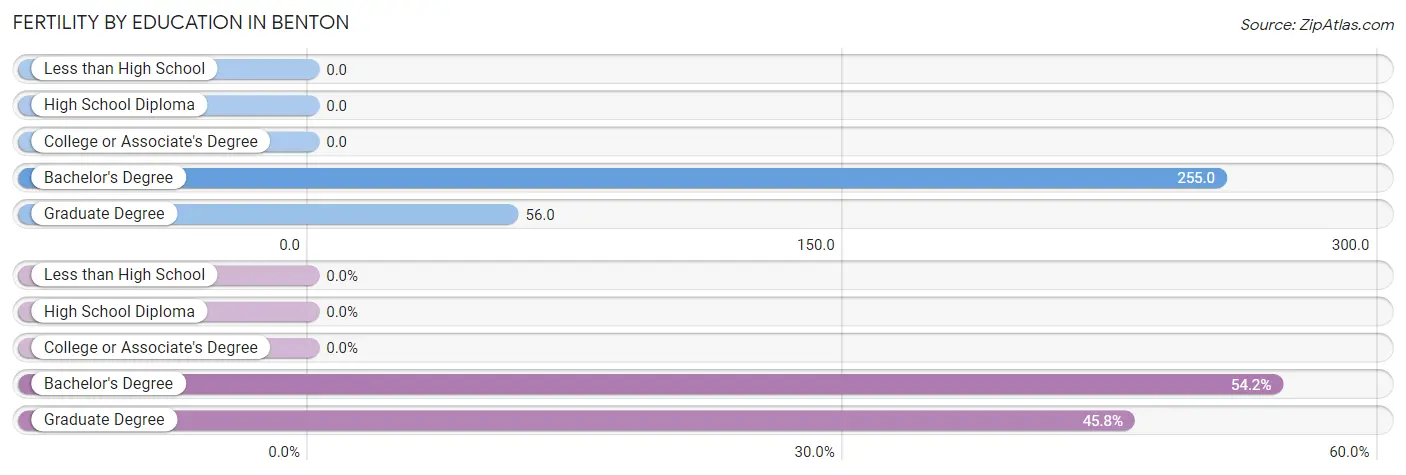
| Educational Attainment | Women with Births | Births / 1,000 Women |
| Less than High School | 0 (0.0%) | 0.0 |
| High School Diploma | 0 (0.0%) | 0.0 |
| College or Associate's Degree | 0 (0.0%) | 0.0 |
| Bachelor's Degree | 13 (54.2%) | 255.0 |
| Graduate Degree | 11 (45.8%) | 56.0 |
| Total | 24 (100.0%) | 23.0 |
Fertility by Education by Marriage Status in Benton
54.2% of women with births in Benton are unmarried. Women with the educational attainment of graduate degree are most likely to be married with 100.0% of them married at childbirth, while women with the educational attainment of bachelor's degree are least likely to be married with 100.0% of them unmarried at childbirth.
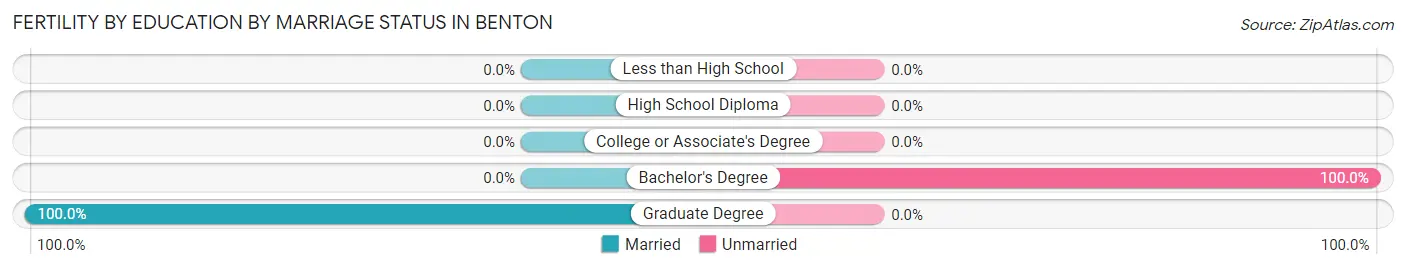
| Educational Attainment | Married | Unmarried |
| Less than High School | 0 (0.0%) | 0 (0.0%) |
| High School Diploma | 0 (0.0%) | 0 (0.0%) |
| College or Associate's Degree | 0 (0.0%) | 0 (0.0%) |
| Bachelor's Degree | 0 (0.0%) | 13 (100.0%) |
| Graduate Degree | 11 (100.0%) | 0 (0.0%) |
| Total | 11 (45.8%) | 13 (54.2%) |
Employment Characteristics in Benton
Employment by Class of Employer in Benton
Among the 2,060 employed individuals in Benton, private company employees (1,287 | 62.5%), self-employed (not incorporated) (218 | 10.6%), and not-for-profit organizations (203 | 9.9%) make up the most common classes of employment.
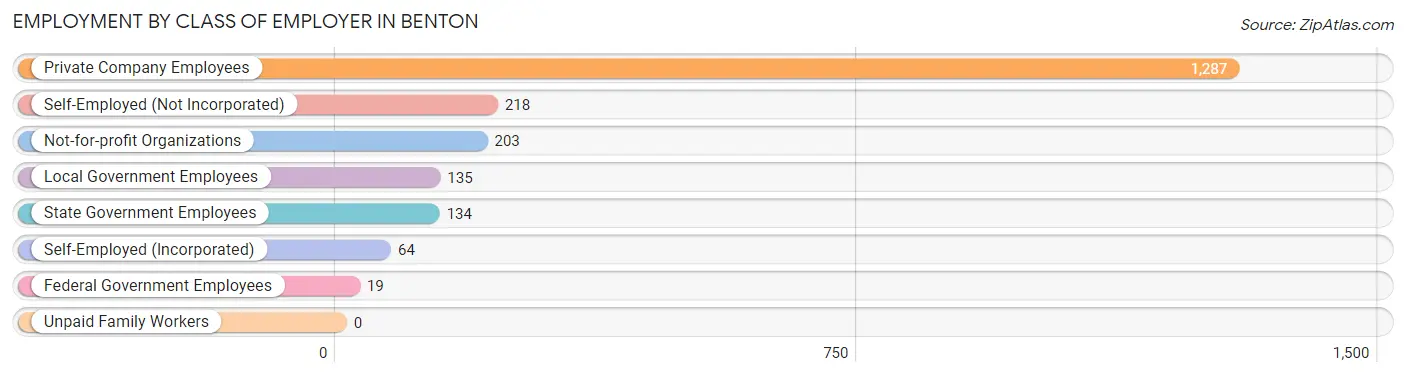
| Employer Class | # Employees | % Employees |
| Private Company Employees | 1,287 | 62.5% |
| Self-Employed (Incorporated) | 64 | 3.1% |
| Self-Employed (Not Incorporated) | 218 | 10.6% |
| Not-for-profit Organizations | 203 | 9.9% |
| Local Government Employees | 135 | 6.6% |
| State Government Employees | 134 | 6.5% |
| Federal Government Employees | 19 | 0.9% |
| Unpaid Family Workers | 0 | 0.0% |
| Total | 2,060 | 100.0% |
Employment Status by Age in Benton
According to the labor force statistics for Benton, out of the total population over 16 years of age (4,128), 52.7% or 2,175 individuals are in the labor force, with 1.8% or 39 of them unemployed. The age group with the highest labor force participation rate is 25 to 29 years, with 88.8% or 302 individuals in the labor force. Within the labor force, the 30 to 34 years age range has the highest percentage of unemployed individuals, with 20.6% or 40 of them being unemployed.
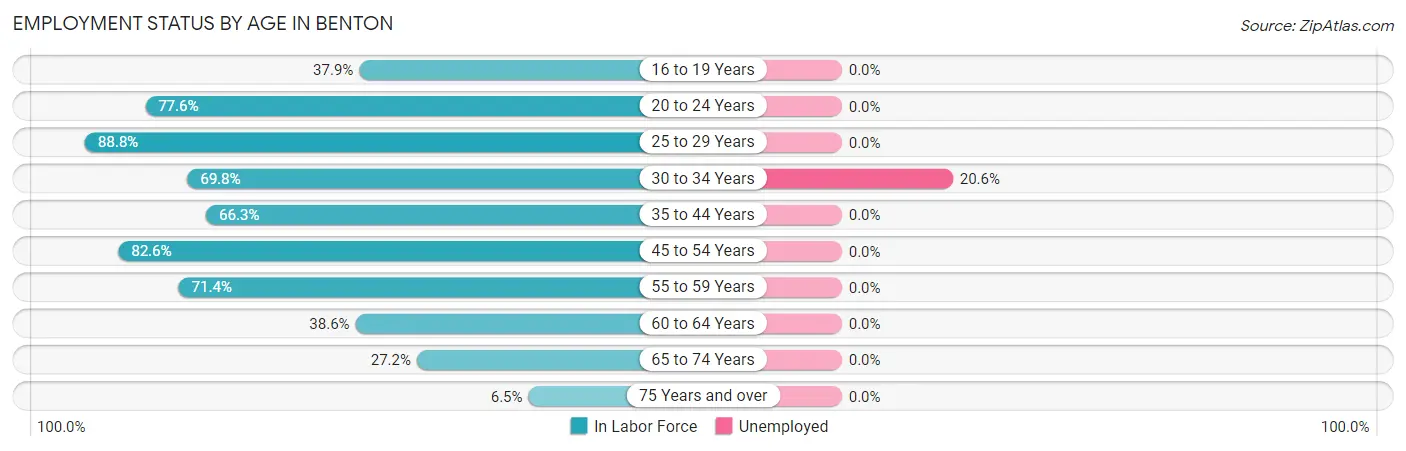
| Age Bracket | In Labor Force | Unemployed |
| 16 to 19 Years | 80 (37.9%) | 0 (0.0%) |
| 20 to 24 Years | 159 (77.6%) | 0 (0.0%) |
| 25 to 29 Years | 302 (88.8%) | 0 (0.0%) |
| 30 to 34 Years | 194 (69.8%) | 40 (20.6%) |
| 35 to 44 Years | 491 (66.3%) | 0 (0.0%) |
| 45 to 54 Years | 361 (82.6%) | 0 (0.0%) |
| 55 to 59 Years | 232 (71.4%) | 0 (0.0%) |
| 60 to 64 Years | 177 (38.6%) | 0 (0.0%) |
| 65 to 74 Years | 140 (27.2%) | 0 (0.0%) |
| 75 Years and over | 40 (6.5%) | 0 (0.0%) |
| Total | 2,175 (52.7%) | 39 (1.8%) |
Employment Status by Educational Attainment in Benton
According to labor force statistics for Benton, 68.1% of individuals (1,756) out of the total population between 25 and 64 years of age (2,579) are in the labor force, with 2.3% or 40 of them being unemployed. The group with the highest labor force participation rate are those with the educational attainment of bachelor's degree or higher, with 87.9% or 451 individuals in the labor force. Within the labor force, individuals with high school diploma education have the highest percentage of unemployment, with 6.8% or 40 of them being unemployed.
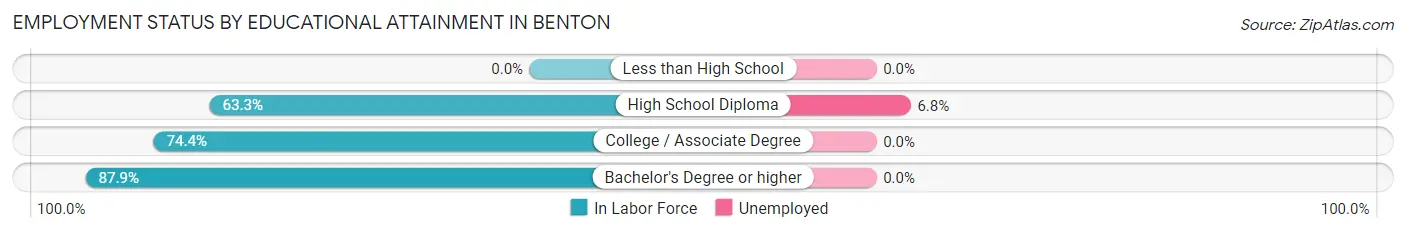
| Educational Attainment | In Labor Force | Unemployed |
| Less than High School | 0 (0.0%) | 0 (0.0%) |
| High School Diploma | 591 (63.3%) | 64 (6.8%) |
| College / Associate Degree | 715 (74.4%) | 0 (0.0%) |
| Bachelor's Degree or higher | 451 (87.9%) | 0 (0.0%) |
| Total | 1,756 (68.1%) | 59 (2.3%) |
Employment Occupations by Sex in Benton
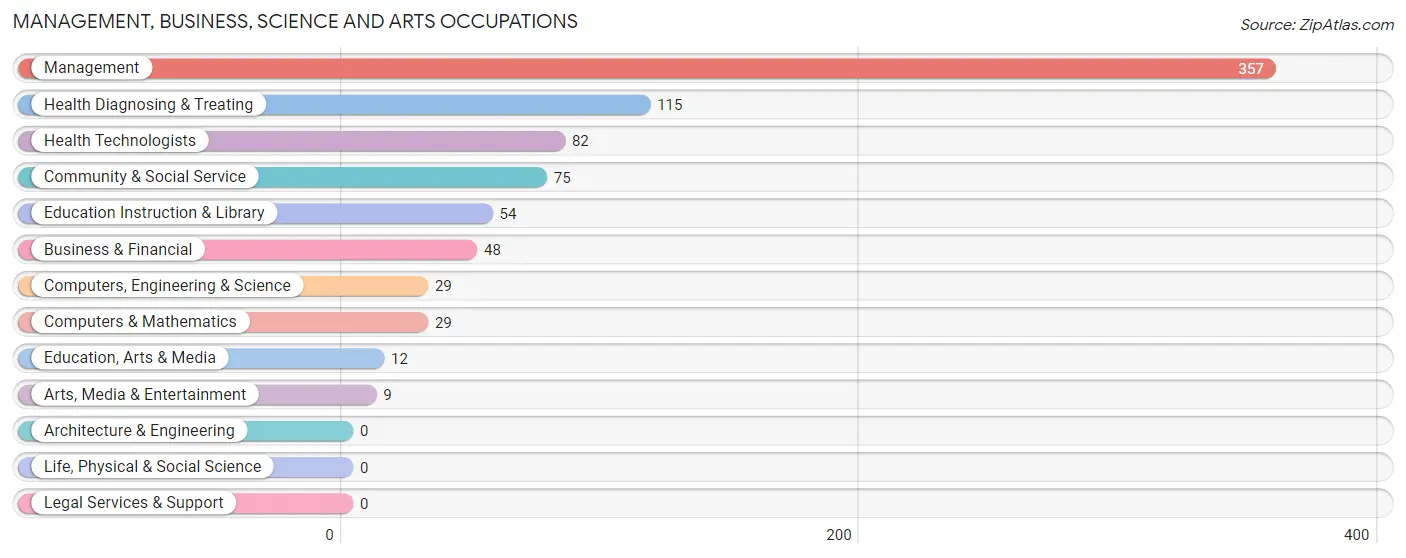
Management, Business, Science and Arts Occupations
The most common Management, Business, Science and Arts occupations in Benton are Management (357 | 16.7%), Health Diagnosing & Treating (115 | 5.4%), Health Technologists (82 | 3.8%), Community & Social Service (75 | 3.5%), and Education Instruction & Library (54 | 2.5%).
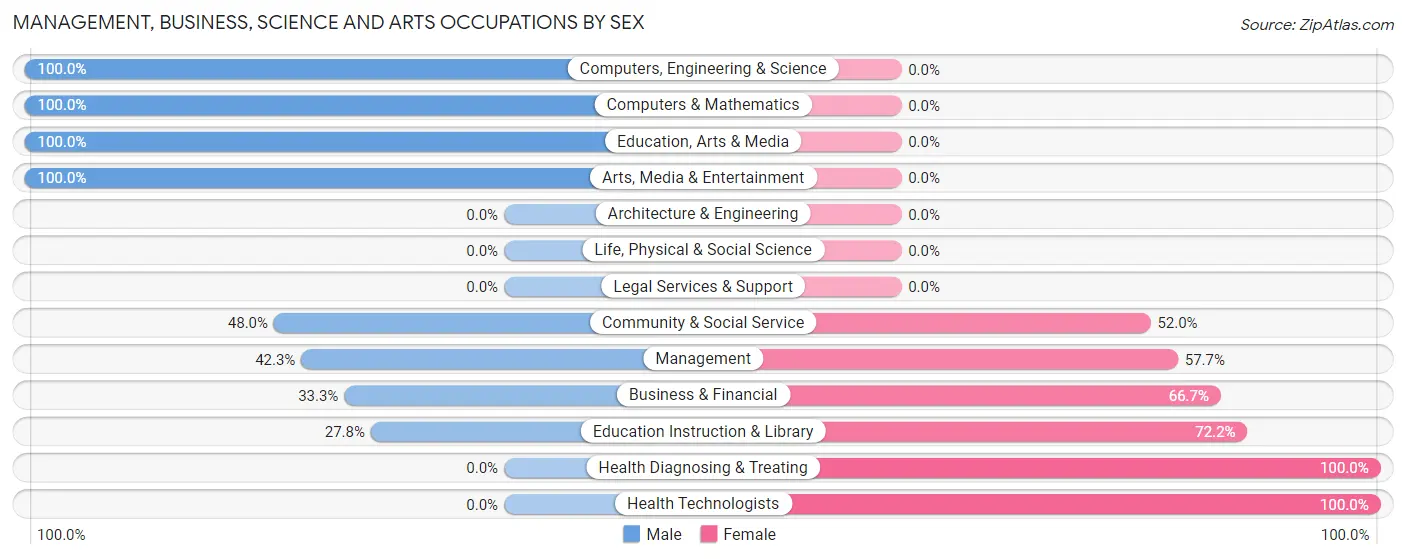
Management, Business, Science and Arts Occupations by Sex
Within the Management, Business, Science and Arts occupations in Benton, the most male-oriented occupations are Computers, Engineering & Science (100.0%), Computers & Mathematics (100.0%), and Education, Arts & Media (100.0%), while the most female-oriented occupations are Health Diagnosing & Treating (100.0%), Health Technologists (100.0%), and Education Instruction & Library (72.2%).
| Occupation | Male | Female |
| Management | 151 (42.3%) | 206 (57.7%) |
| Business & Financial | 16 (33.3%) | 32 (66.7%) |
| Computers, Engineering & Science | 29 (100.0%) | 0 (0.0%) |
| Computers & Mathematics | 29 (100.0%) | 0 (0.0%) |
| Architecture & Engineering | 0 (0.0%) | 0 (0.0%) |
| Life, Physical & Social Science | 0 (0.0%) | 0 (0.0%) |
| Community & Social Service | 36 (48.0%) | 39 (52.0%) |
| Education, Arts & Media | 12 (100.0%) | 0 (0.0%) |
| Legal Services & Support | 0 (0.0%) | 0 (0.0%) |
| Education Instruction & Library | 15 (27.8%) | 39 (72.2%) |
| Arts, Media & Entertainment | 9 (100.0%) | 0 (0.0%) |
| Health Diagnosing & Treating | 0 (0.0%) | 115 (100.0%) |
| Health Technologists | 0 (0.0%) | 82 (100.0%) |
| Total (Category) | 232 (37.2%) | 392 (62.8%) |
| Total (Overall) | 996 (46.6%) | 1,140 (53.4%) |
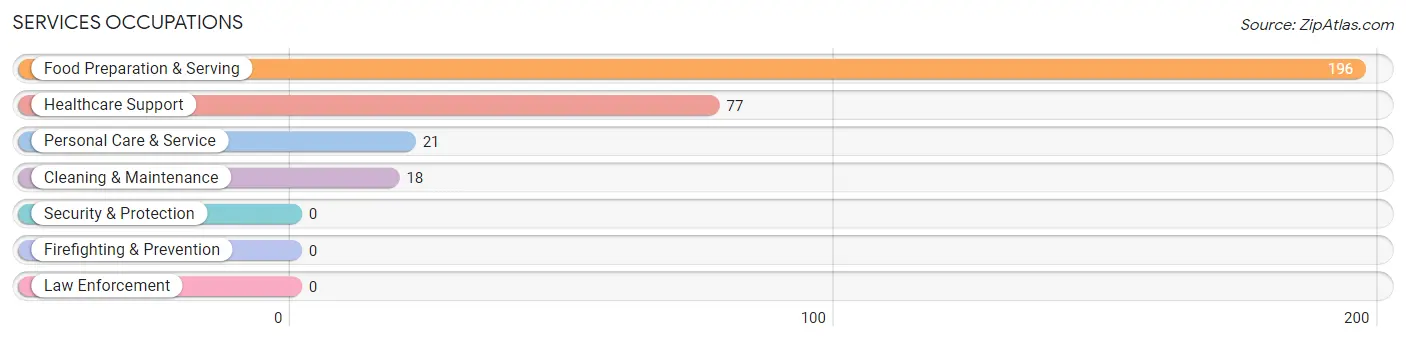
Services Occupations
The most common Services occupations in Benton are Food Preparation & Serving (196 | 9.2%), Healthcare Support (77 | 3.6%), Personal Care & Service (21 | 1.0%), and Cleaning & Maintenance (18 | 0.8%).
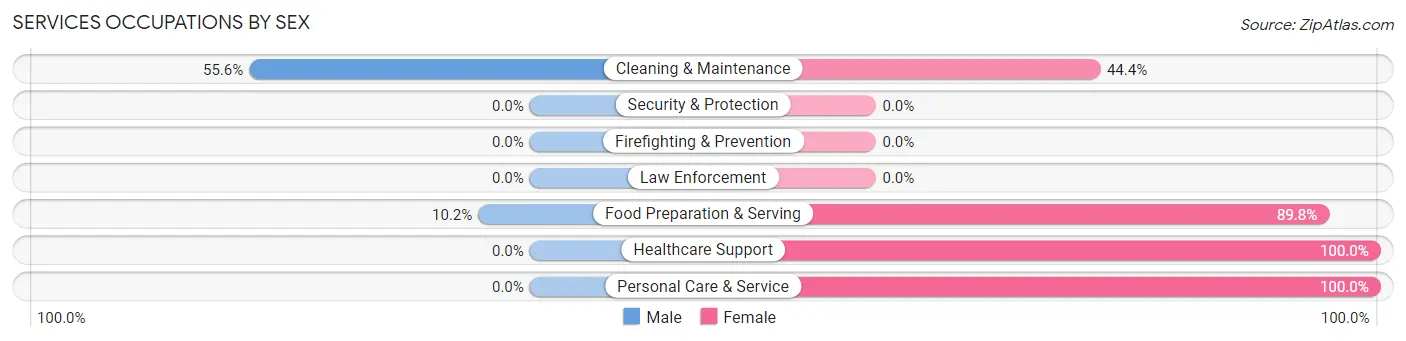
Services Occupations by Sex
Within the Services occupations in Benton, the most male-oriented occupations are Cleaning & Maintenance (55.6%), and Food Preparation & Serving (10.2%), while the most female-oriented occupations are Healthcare Support (100.0%), Personal Care & Service (100.0%), and Food Preparation & Serving (89.8%).
| Occupation | Male | Female |
| Healthcare Support | 0 (0.0%) | 77 (100.0%) |
| Security & Protection | 0 (0.0%) | 0 (0.0%) |
| Firefighting & Prevention | 0 (0.0%) | 0 (0.0%) |
| Law Enforcement | 0 (0.0%) | 0 (0.0%) |
| Food Preparation & Serving | 20 (10.2%) | 176 (89.8%) |
| Cleaning & Maintenance | 10 (55.6%) | 8 (44.4%) |
| Personal Care & Service | 0 (0.0%) | 21 (100.0%) |
| Total (Category) | 30 (9.6%) | 282 (90.4%) |
| Total (Overall) | 996 (46.6%) | 1,140 (53.4%) |
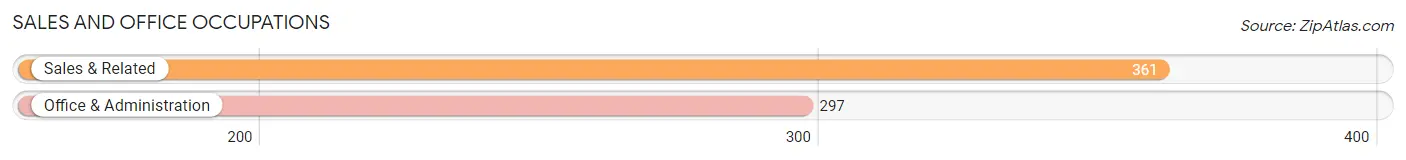
Sales and Office Occupations
The most common Sales and Office occupations in Benton are Sales & Related (361 | 16.9%), and Office & Administration (297 | 13.9%).
Sales and Office Occupations by Sex
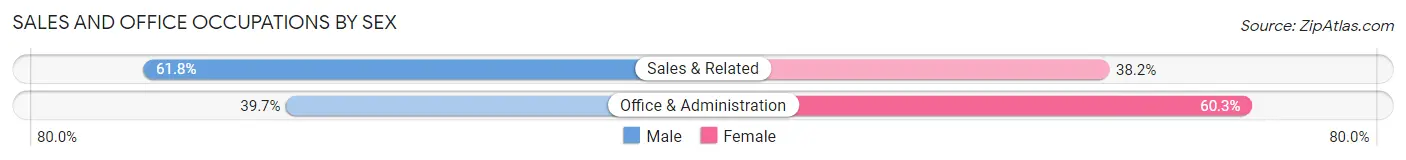
| Occupation | Male | Female |
| Sales & Related | 223 (61.8%) | 138 (38.2%) |
| Office & Administration | 118 (39.7%) | 179 (60.3%) |
| Total (Category) | 341 (51.8%) | 317 (48.2%) |
| Total (Overall) | 996 (46.6%) | 1,140 (53.4%) |
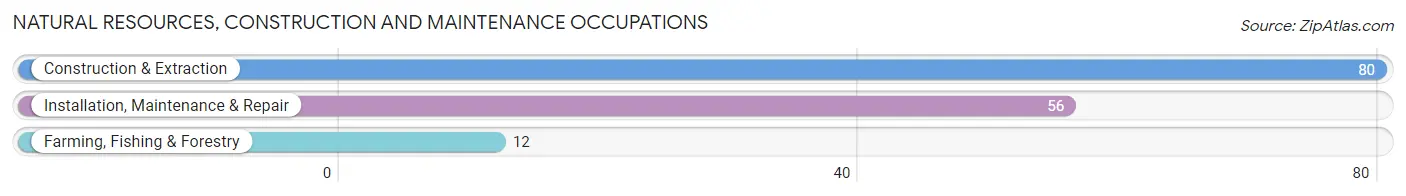
Natural Resources, Construction and Maintenance Occupations
The most common Natural Resources, Construction and Maintenance occupations in Benton are Construction & Extraction (80 | 3.7%), Installation, Maintenance & Repair (56 | 2.6%), and Farming, Fishing & Forestry (12 | 0.6%).
Natural Resources, Construction and Maintenance Occupations by Sex
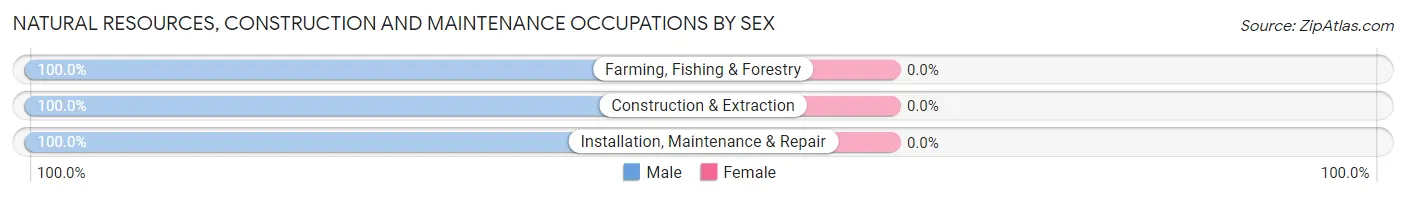
| Occupation | Male | Female |
| Farming, Fishing & Forestry | 12 (100.0%) | 0 (0.0%) |
| Construction & Extraction | 80 (100.0%) | 0 (0.0%) |
| Installation, Maintenance & Repair | 56 (100.0%) | 0 (0.0%) |
| Total (Category) | 148 (100.0%) | 0 (0.0%) |
| Total (Overall) | 996 (46.6%) | 1,140 (53.4%) |
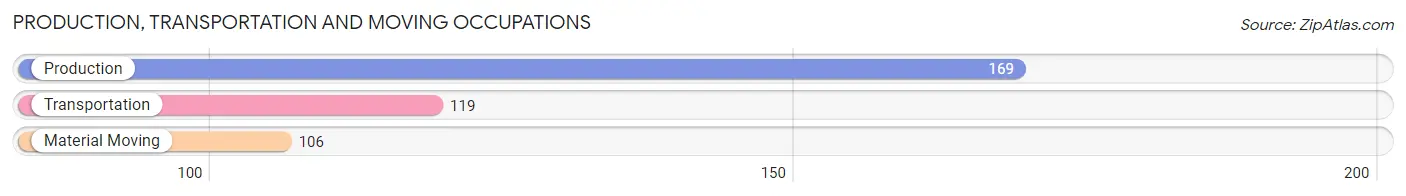
Production, Transportation and Moving Occupations
The most common Production, Transportation and Moving occupations in Benton are Production (169 | 7.9%), Transportation (119 | 5.6%), and Material Moving (106 | 5.0%).
Production, Transportation and Moving Occupations by Sex
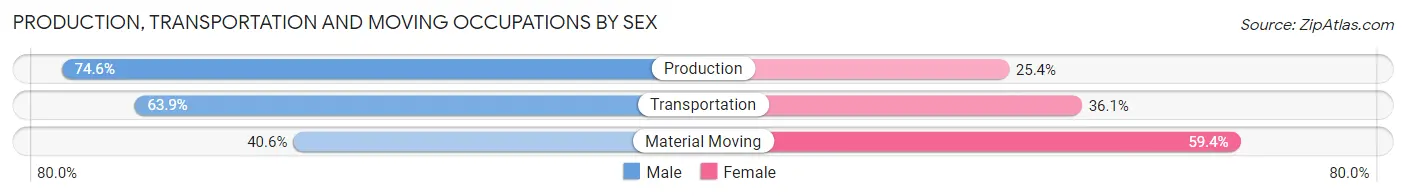
| Occupation | Male | Female |
| Production | 126 (74.6%) | 43 (25.4%) |
| Transportation | 76 (63.9%) | 43 (36.1%) |
| Material Moving | 43 (40.6%) | 63 (59.4%) |
| Total (Category) | 245 (62.2%) | 149 (37.8%) |
| Total (Overall) | 996 (46.6%) | 1,140 (53.4%) |
Employment Industries by Sex in Benton
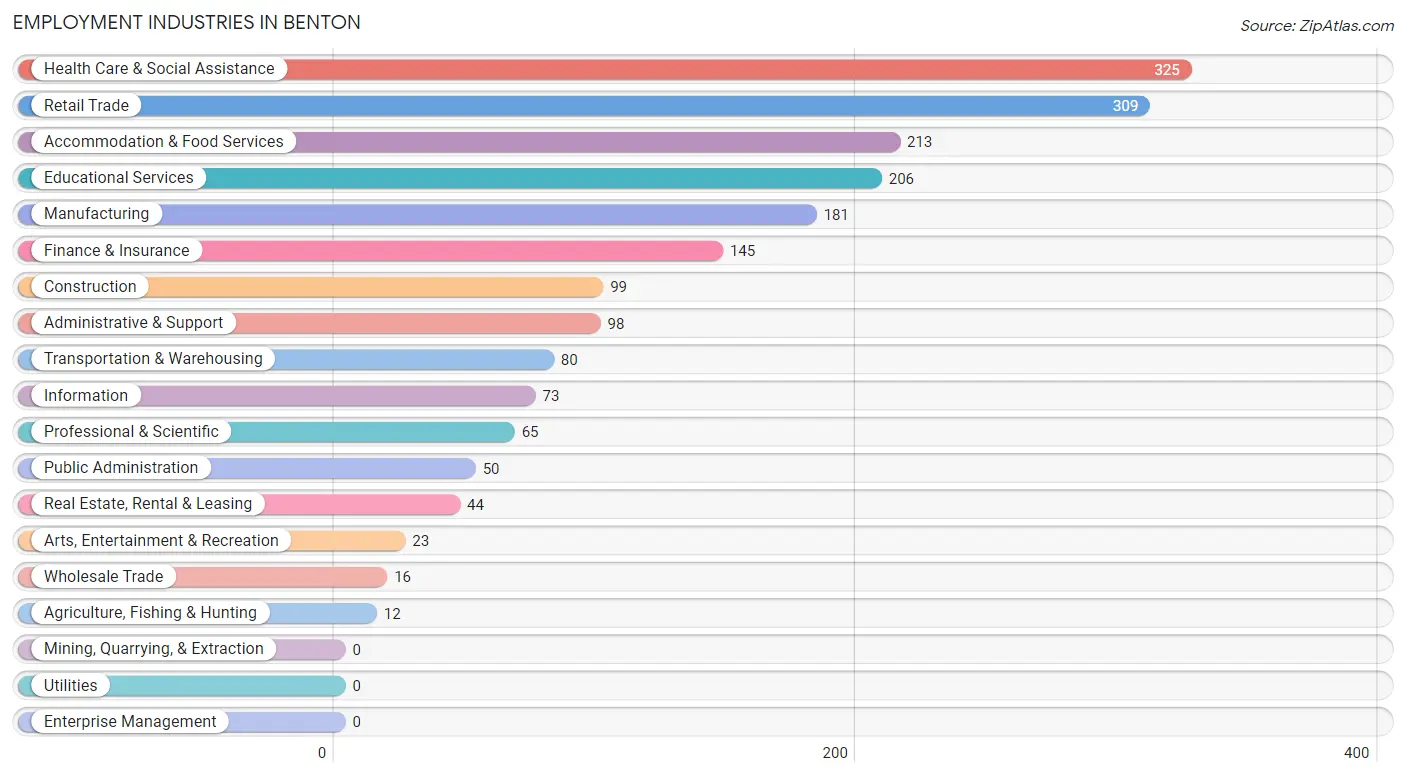
Employment Industries in Benton
The major employment industries in Benton include Health Care & Social Assistance (325 | 15.2%), Retail Trade (309 | 14.5%), Accommodation & Food Services (213 | 10.0%), Educational Services (206 | 9.6%), and Manufacturing (181 | 8.5%).
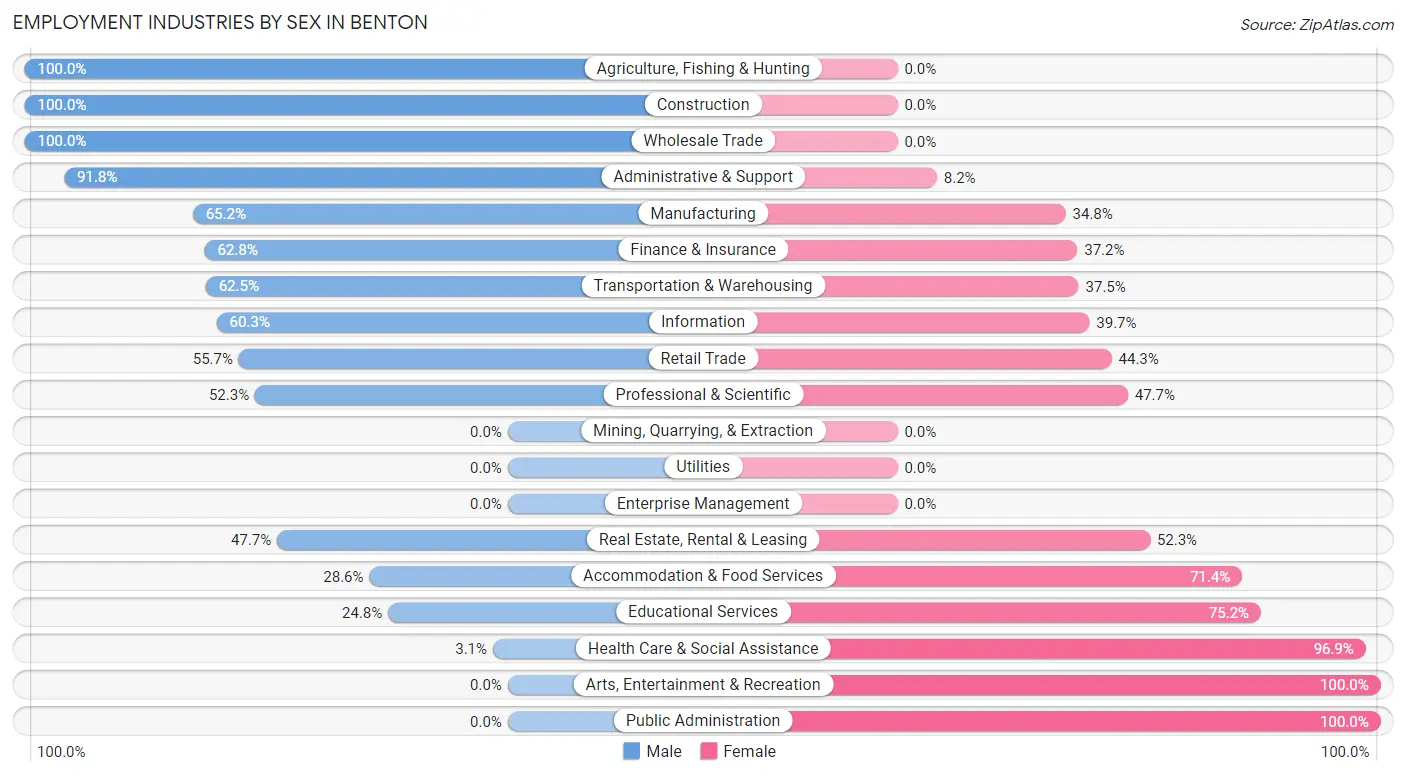
Employment Industries by Sex in Benton
The Benton industries that see more men than women are Agriculture, Fishing & Hunting (100.0%), Construction (100.0%), and Wholesale Trade (100.0%), whereas the industries that tend to have a higher number of women are Arts, Entertainment & Recreation (100.0%), Public Administration (100.0%), and Health Care & Social Assistance (96.9%).
| Industry | Male | Female |
| Agriculture, Fishing & Hunting | 12 (100.0%) | 0 (0.0%) |
| Mining, Quarrying, & Extraction | 0 (0.0%) | 0 (0.0%) |
| Construction | 99 (100.0%) | 0 (0.0%) |
| Manufacturing | 118 (65.2%) | 63 (34.8%) |
| Wholesale Trade | 16 (100.0%) | 0 (0.0%) |
| Retail Trade | 172 (55.7%) | 137 (44.3%) |
| Transportation & Warehousing | 50 (62.5%) | 30 (37.5%) |
| Utilities | 0 (0.0%) | 0 (0.0%) |
| Information | 44 (60.3%) | 29 (39.7%) |
| Finance & Insurance | 91 (62.8%) | 54 (37.2%) |
| Real Estate, Rental & Leasing | 21 (47.7%) | 23 (52.3%) |
| Professional & Scientific | 34 (52.3%) | 31 (47.7%) |
| Enterprise Management | 0 (0.0%) | 0 (0.0%) |
| Administrative & Support | 90 (91.8%) | 8 (8.2%) |
| Educational Services | 51 (24.8%) | 155 (75.2%) |
| Health Care & Social Assistance | 10 (3.1%) | 315 (96.9%) |
| Arts, Entertainment & Recreation | 0 (0.0%) | 23 (100.0%) |
| Accommodation & Food Services | 61 (28.6%) | 152 (71.4%) |
| Public Administration | 0 (0.0%) | 50 (100.0%) |
| Total | 996 (46.6%) | 1,140 (53.4%) |
Education in Benton
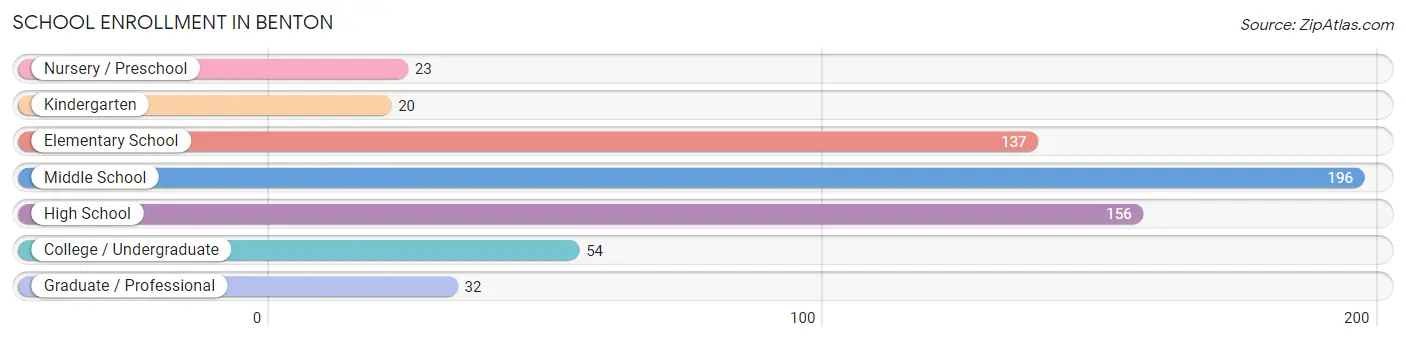
School Enrollment in Benton
The most common levels of schooling among the 618 students in Benton are middle school (196 | 31.7%), high school (156 | 25.2%), and elementary school (137 | 22.2%).
| School Level | # Students | % Students |
| Nursery / Preschool | 23 | 3.7% |
| Kindergarten | 20 | 3.2% |
| Elementary School | 137 | 22.2% |
| Middle School | 196 | 31.7% |
| High School | 156 | 25.2% |
| College / Undergraduate | 54 | 8.7% |
| Graduate / Professional | 32 | 5.2% |
| Total | 618 | 100.0% |
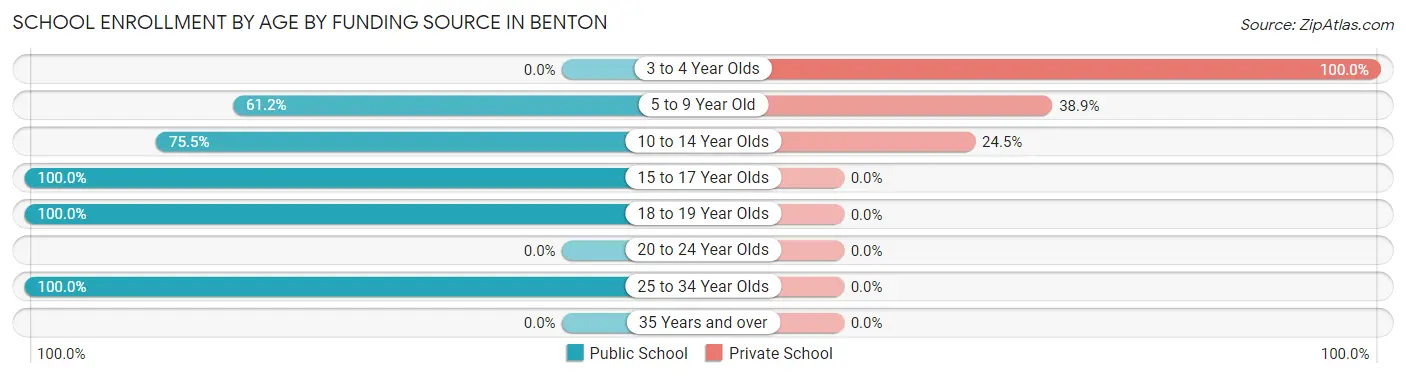
School Enrollment by Age by Funding Source in Benton
Out of a total of 618 students who are enrolled in schools in Benton, 132 (21.4%) attend a private institution, while the remaining 486 (78.6%) are enrolled in public schools. The age group of 3 to 4 year olds has the highest likelihood of being enrolled in private schools, with 23 (100.0% in the age bracket) enrolled. Conversely, the age group of 15 to 17 year olds has the lowest likelihood of being enrolled in a private school, with 130 (100.0% in the age bracket) attending a public institution.
| Age Bracket | Public School | Private School |
| 3 to 4 Year Olds | 0 (0.0%) | 23 (100.0%) |
| 5 to 9 Year Old | 96 (61.2%) | 61 (38.9%) |
| 10 to 14 Year Olds | 148 (75.5%) | 48 (24.5%) |
| 15 to 17 Year Olds | 130 (100.0%) | 0 (0.0%) |
| 18 to 19 Year Olds | 52 (100.0%) | 0 (0.0%) |
| 20 to 24 Year Olds | 0 (0.0%) | 0 (0.0%) |
| 25 to 34 Year Olds | 60 (100.0%) | 0 (0.0%) |
| 35 Years and over | 0 (0.0%) | 0 (0.0%) |
| Total | 486 (78.6%) | 132 (21.4%) |
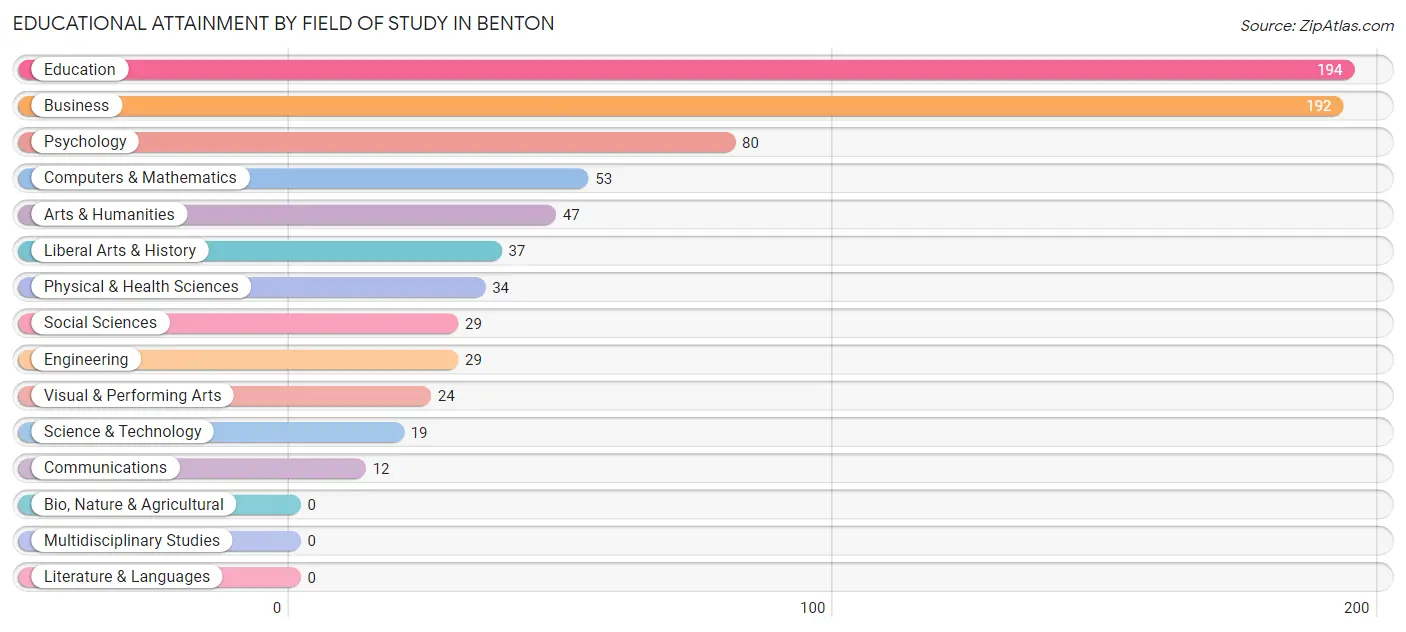
Educational Attainment by Field of Study in Benton
Education (194 | 25.9%), business (192 | 25.6%), psychology (80 | 10.7%), computers & mathematics (53 | 7.1%), and arts & humanities (47 | 6.3%) are the most common fields of study among 750 individuals in Benton who have obtained a bachelor's degree or higher.
| Field of Study | # Graduates | % Graduates |
| Computers & Mathematics | 53 | 7.1% |
| Bio, Nature & Agricultural | 0 | 0.0% |
| Physical & Health Sciences | 34 | 4.5% |
| Psychology | 80 | 10.7% |
| Social Sciences | 29 | 3.9% |
| Engineering | 29 | 3.9% |
| Multidisciplinary Studies | 0 | 0.0% |
| Science & Technology | 19 | 2.5% |
| Business | 192 | 25.6% |
| Education | 194 | 25.9% |
| Literature & Languages | 0 | 0.0% |
| Liberal Arts & History | 37 | 4.9% |
| Visual & Performing Arts | 24 | 3.2% |
| Communications | 12 | 1.6% |
| Arts & Humanities | 47 | 6.3% |
| Total | 750 | 100.0% |
Transportation & Commute in Benton
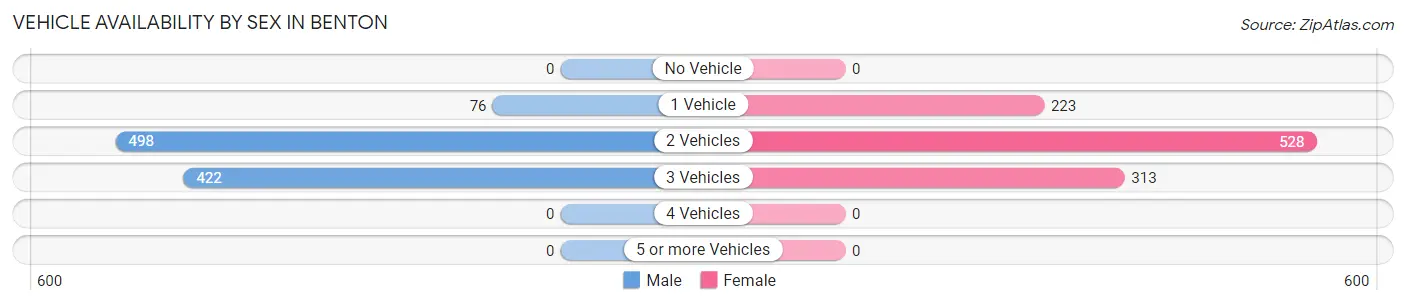
Vehicle Availability by Sex in Benton
The most prevalent vehicle ownership categories in Benton are males with 2 vehicles (498, accounting for 50.0%) and females with 2 vehicles (528, making up 46.8%).
| Vehicles Available | Male | Female |
| No Vehicle | 0 (0.0%) | 0 (0.0%) |
| 1 Vehicle | 76 (7.6%) | 223 (21.0%) |
| 2 Vehicles | 498 (50.0%) | 528 (49.6%) |
| 3 Vehicles | 422 (42.4%) | 313 (29.4%) |
| 4 Vehicles | 0 (0.0%) | 0 (0.0%) |
| 5 or more Vehicles | 0 (0.0%) | 0 (0.0%) |
| Total | 996 (100.0%) | 1,064 (100.0%) |
Commute Time in Benton
The most frequently occuring commute durations in Benton are 5 to 9 minutes (284 commuters, 15.0%), 30 to 34 minutes (284 commuters, 15.0%), and 10 to 14 minutes (275 commuters, 14.5%).
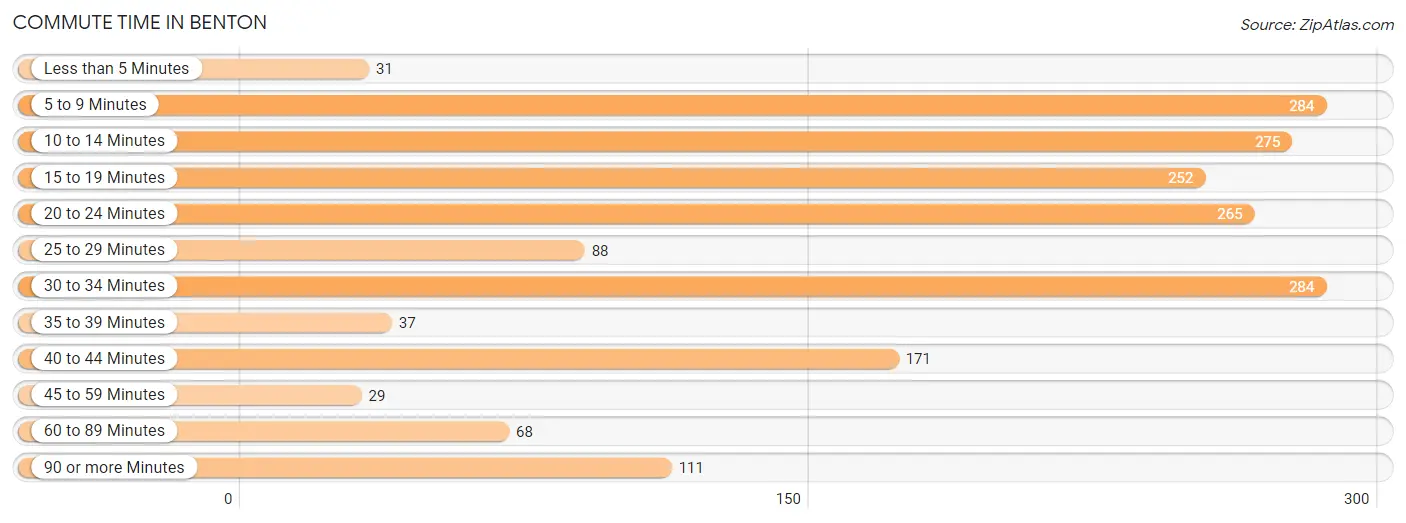
| Commute Time | # Commuters | % Commuters |
| Less than 5 Minutes | 31 | 1.6% |
| 5 to 9 Minutes | 284 | 15.0% |
| 10 to 14 Minutes | 275 | 14.5% |
| 15 to 19 Minutes | 252 | 13.3% |
| 20 to 24 Minutes | 265 | 14.0% |
| 25 to 29 Minutes | 88 | 4.6% |
| 30 to 34 Minutes | 284 | 15.0% |
| 35 to 39 Minutes | 37 | 1.9% |
| 40 to 44 Minutes | 171 | 9.0% |
| 45 to 59 Minutes | 29 | 1.5% |
| 60 to 89 Minutes | 68 | 3.6% |
| 90 or more Minutes | 111 | 5.9% |
Commute Time by Sex in Benton
The most common commute times in Benton are 30 to 34 minutes (198 commuters, 21.0%) for males and 5 to 9 minutes (201 commuters, 21.1%) for females.
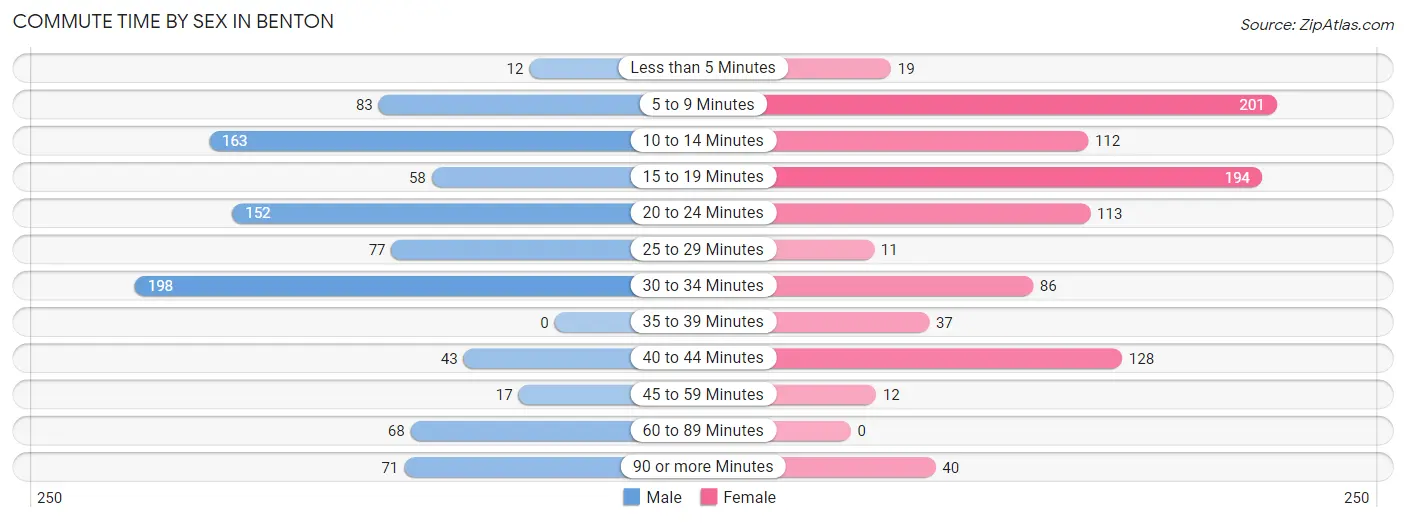
| Commute Time | Male | Female |
| Less than 5 Minutes | 12 (1.3%) | 19 (2.0%) |
| 5 to 9 Minutes | 83 (8.8%) | 201 (21.1%) |
| 10 to 14 Minutes | 163 (17.3%) | 112 (11.7%) |
| 15 to 19 Minutes | 58 (6.2%) | 194 (20.4%) |
| 20 to 24 Minutes | 152 (16.1%) | 113 (11.9%) |
| 25 to 29 Minutes | 77 (8.2%) | 11 (1.1%) |
| 30 to 34 Minutes | 198 (21.0%) | 86 (9.0%) |
| 35 to 39 Minutes | 0 (0.0%) | 37 (3.9%) |
| 40 to 44 Minutes | 43 (4.6%) | 128 (13.4%) |
| 45 to 59 Minutes | 17 (1.8%) | 12 (1.3%) |
| 60 to 89 Minutes | 68 (7.2%) | 0 (0.0%) |
| 90 or more Minutes | 71 (7.5%) | 40 (4.2%) |
Time of Departure to Work by Sex in Benton
The most frequent times of departure to work in Benton are 7:30 AM to 7:59 AM (200, 21.2%) for males and 12:00 PM to 3:59 PM (209, 21.9%) for females.
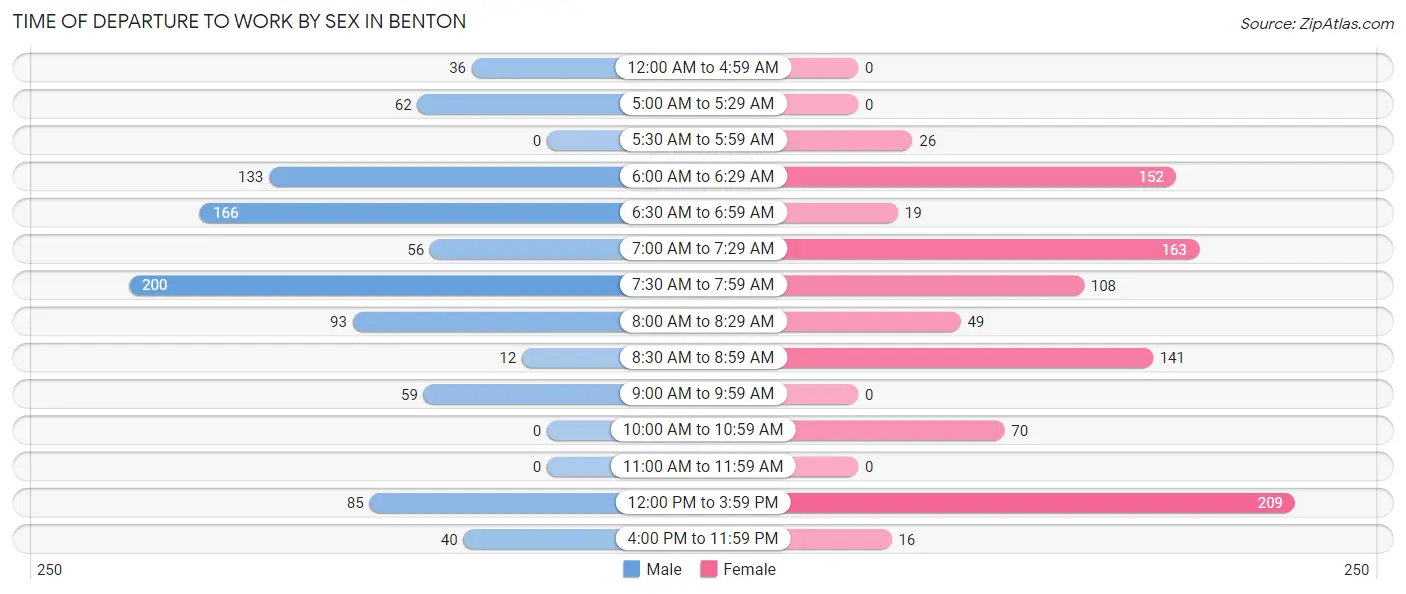
| Time of Departure | Male | Female |
| 12:00 AM to 4:59 AM | 36 (3.8%) | 0 (0.0%) |
| 5:00 AM to 5:29 AM | 62 (6.6%) | 0 (0.0%) |
| 5:30 AM to 5:59 AM | 0 (0.0%) | 26 (2.7%) |
| 6:00 AM to 6:29 AM | 133 (14.1%) | 152 (16.0%) |
| 6:30 AM to 6:59 AM | 166 (17.6%) | 19 (2.0%) |
| 7:00 AM to 7:29 AM | 56 (5.9%) | 163 (17.1%) |
| 7:30 AM to 7:59 AM | 200 (21.2%) | 108 (11.3%) |
| 8:00 AM to 8:29 AM | 93 (9.9%) | 49 (5.1%) |
| 8:30 AM to 8:59 AM | 12 (1.3%) | 141 (14.8%) |
| 9:00 AM to 9:59 AM | 59 (6.3%) | 0 (0.0%) |
| 10:00 AM to 10:59 AM | 0 (0.0%) | 70 (7.3%) |
| 11:00 AM to 11:59 AM | 0 (0.0%) | 0 (0.0%) |
| 12:00 PM to 3:59 PM | 85 (9.0%) | 209 (21.9%) |
| 4:00 PM to 11:59 PM | 40 (4.3%) | 16 (1.7%) |
| Total | 942 (100.0%) | 953 (100.0%) |
Housing Occupancy in Benton
Occupancy by Ownership in Benton
Of the total 2,105 dwellings in Benton, owner-occupied units account for 1,615 (76.7%), while renter-occupied units make up 490 (23.3%).
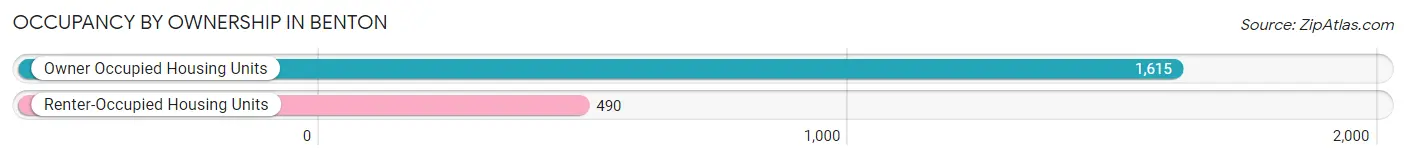
| Occupancy | # Housing Units | % Housing Units |
| Owner Occupied Housing Units | 1,615 | 76.7% |
| Renter-Occupied Housing Units | 490 | 23.3% |
| Total Occupied Housing Units | 2,105 | 100.0% |
Occupancy by Household Size in Benton
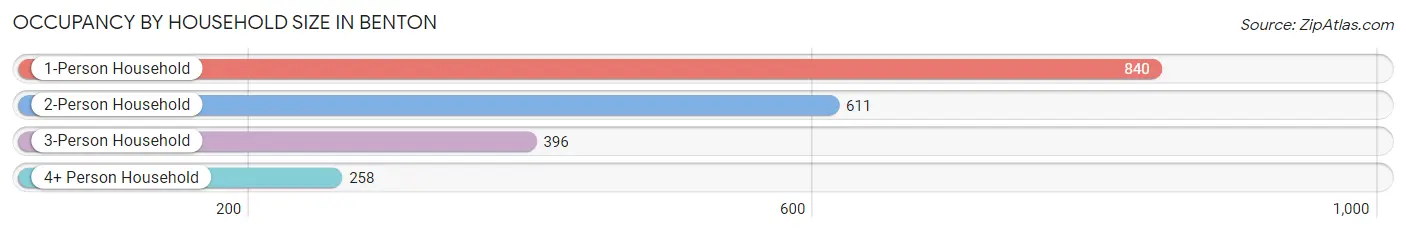
| Household Size | # Housing Units | % Housing Units |
| 1-Person Household | 840 | 39.9% |
| 2-Person Household | 611 | 29.0% |
| 3-Person Household | 396 | 18.8% |
| 4+ Person Household | 258 | 12.3% |
| Total Housing Units | 2,105 | 100.0% |
Occupancy by Ownership by Household Size in Benton
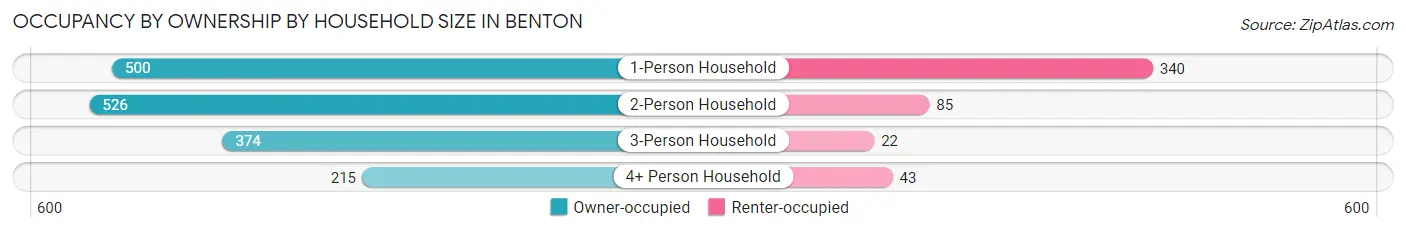
| Household Size | Owner-occupied | Renter-occupied |
| 1-Person Household | 500 (59.5%) | 340 (40.5%) |
| 2-Person Household | 526 (86.1%) | 85 (13.9%) |
| 3-Person Household | 374 (94.4%) | 22 (5.6%) |
| 4+ Person Household | 215 (83.3%) | 43 (16.7%) |
| Total Housing Units | 1,615 (76.7%) | 490 (23.3%) |
Occupancy by Educational Attainment in Benton
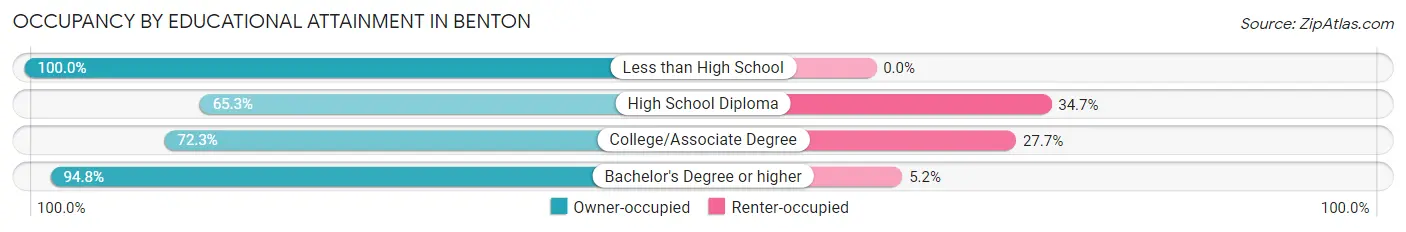
| Household Size | Owner-occupied | Renter-occupied |
| Less than High School | 89 (100.0%) | 0 (0.0%) |
| High School Diploma | 455 (65.3%) | 242 (34.7%) |
| College/Associate Degree | 576 (72.3%) | 221 (27.7%) |
| Bachelor's Degree or higher | 495 (94.8%) | 27 (5.2%) |
Occupancy by Age of Householder in Benton
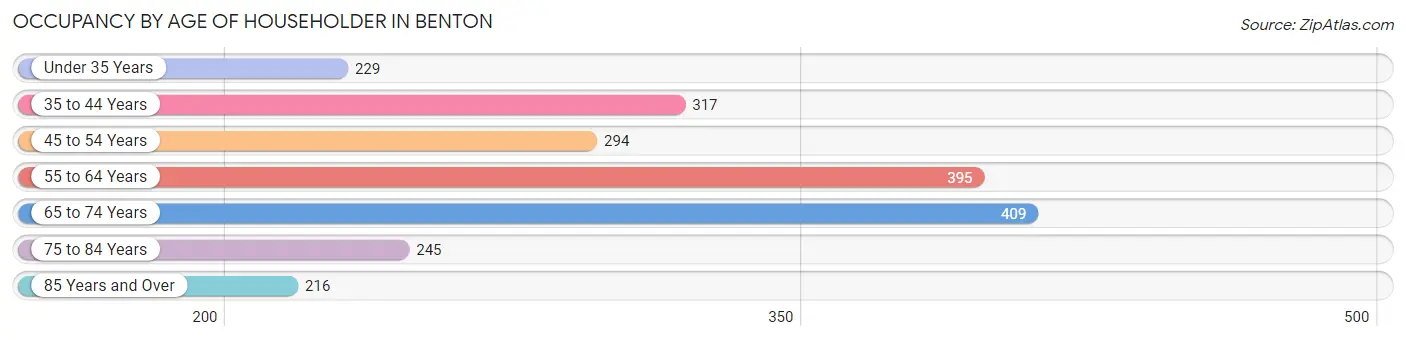
| Age Bracket | # Households | % Households |
| Under 35 Years | 229 | 10.9% |
| 35 to 44 Years | 317 | 15.1% |
| 45 to 54 Years | 294 | 14.0% |
| 55 to 64 Years | 395 | 18.8% |
| 65 to 74 Years | 409 | 19.4% |
| 75 to 84 Years | 245 | 11.6% |
| 85 Years and Over | 216 | 10.3% |
| Total | 2,105 | 100.0% |
Housing Finances in Benton
Median Income by Occupancy in Benton
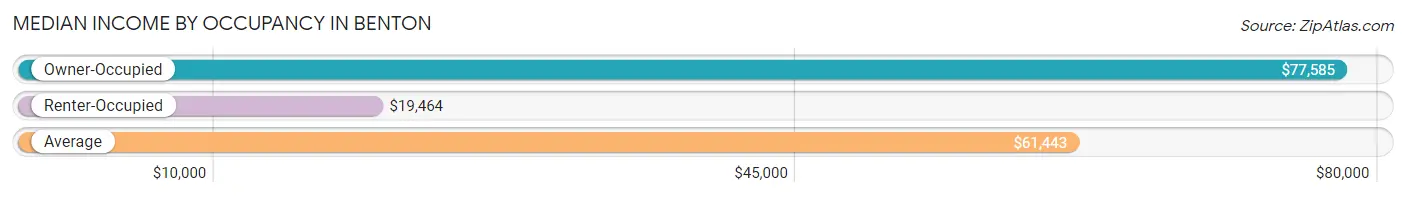
| Occupancy Type | # Households | Median Income |
| Owner-Occupied | 1,615 (76.7%) | $77,585 |
| Renter-Occupied | 490 (23.3%) | $19,464 |
| Average | 2,105 (100.0%) | $61,443 |
Occupancy by Householder Income Bracket in Benton
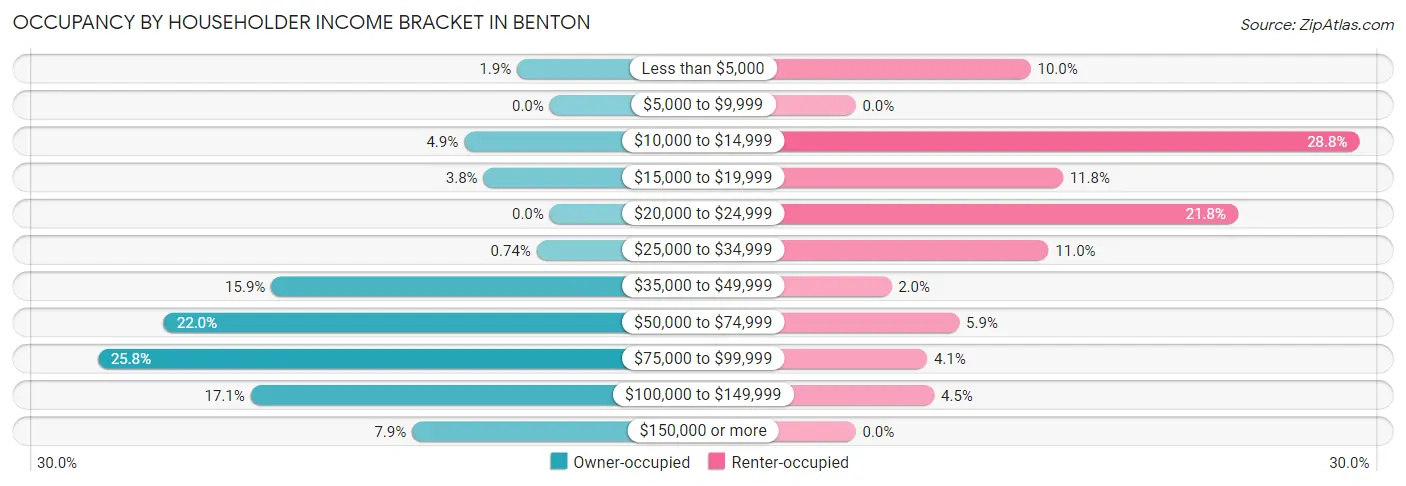
| Income Bracket | Owner-occupied | Renter-occupied |
| Less than $5,000 | 30 (1.9%) | 49 (10.0%) |
| $5,000 to $9,999 | 0 (0.0%) | 0 (0.0%) |
| $10,000 to $14,999 | 79 (4.9%) | 141 (28.8%) |
| $15,000 to $19,999 | 61 (3.8%) | 58 (11.8%) |
| $20,000 to $24,999 | 0 (0.0%) | 107 (21.8%) |
| $25,000 to $34,999 | 12 (0.7%) | 54 (11.0%) |
| $35,000 to $49,999 | 257 (15.9%) | 10 (2.0%) |
| $50,000 to $74,999 | 356 (22.0%) | 29 (5.9%) |
| $75,000 to $99,999 | 417 (25.8%) | 20 (4.1%) |
| $100,000 to $149,999 | 276 (17.1%) | 22 (4.5%) |
| $150,000 or more | 127 (7.9%) | 0 (0.0%) |
| Total | 1,615 (100.0%) | 490 (100.0%) |
Monthly Housing Cost Tiers in Benton
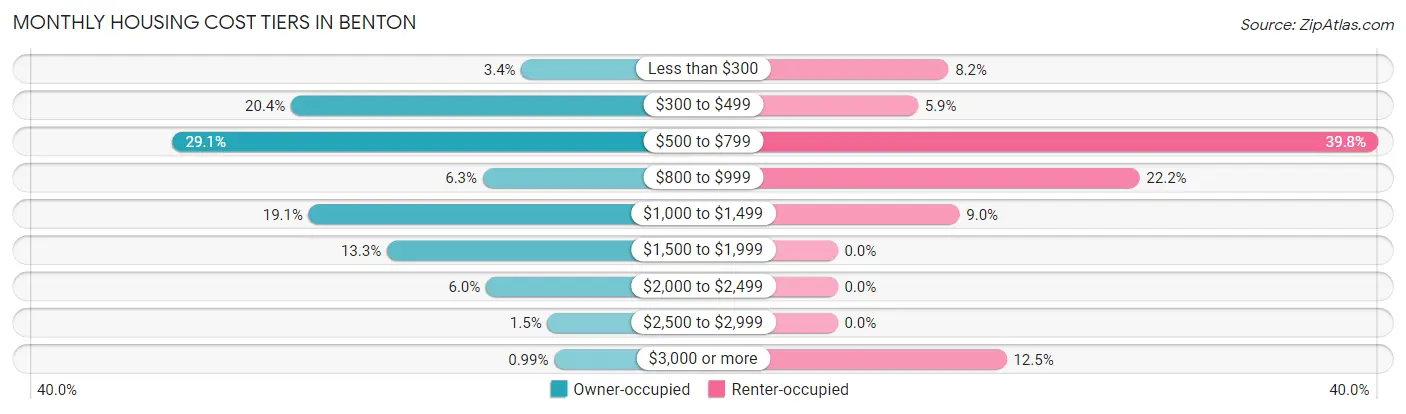
| Monthly Cost | Owner-occupied | Renter-occupied |
| Less than $300 | 55 (3.4%) | 40 (8.2%) |
| $300 to $499 | 329 (20.4%) | 29 (5.9%) |
| $500 to $799 | 470 (29.1%) | 195 (39.8%) |
| $800 to $999 | 101 (6.2%) | 109 (22.2%) |
| $1,000 to $1,499 | 308 (19.1%) | 44 (9.0%) |
| $1,500 to $1,999 | 215 (13.3%) | 0 (0.0%) |
| $2,000 to $2,499 | 97 (6.0%) | 0 (0.0%) |
| $2,500 to $2,999 | 24 (1.5%) | 0 (0.0%) |
| $3,000 or more | 16 (1.0%) | 61 (12.4%) |
| Total | 1,615 (100.0%) | 490 (100.0%) |
Physical Housing Characteristics in Benton
Housing Structures in Benton
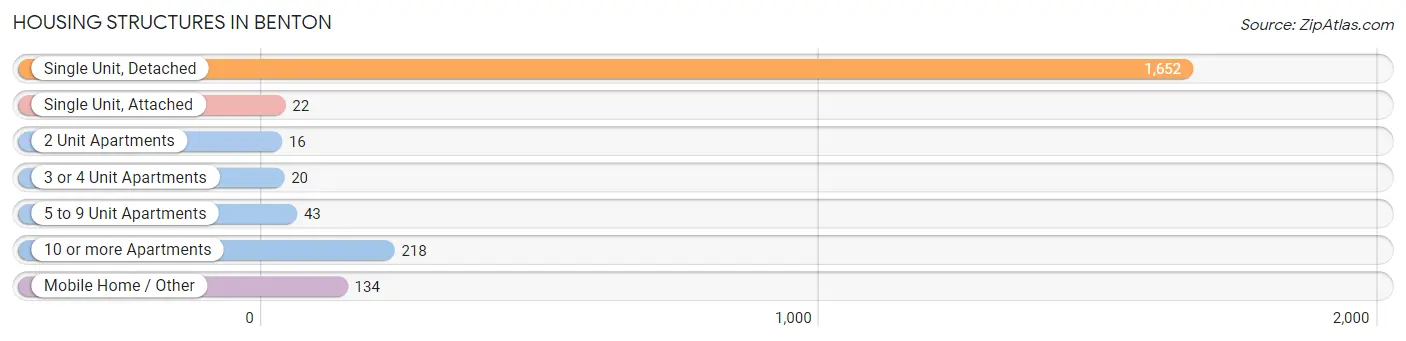
| Structure Type | # Housing Units | % Housing Units |
| Single Unit, Detached | 1,652 | 78.5% |
| Single Unit, Attached | 22 | 1.1% |
| 2 Unit Apartments | 16 | 0.8% |
| 3 or 4 Unit Apartments | 20 | 0.9% |
| 5 to 9 Unit Apartments | 43 | 2.0% |
| 10 or more Apartments | 218 | 10.4% |
| Mobile Home / Other | 134 | 6.4% |
| Total | 2,105 | 100.0% |
Housing Structures by Occupancy in Benton
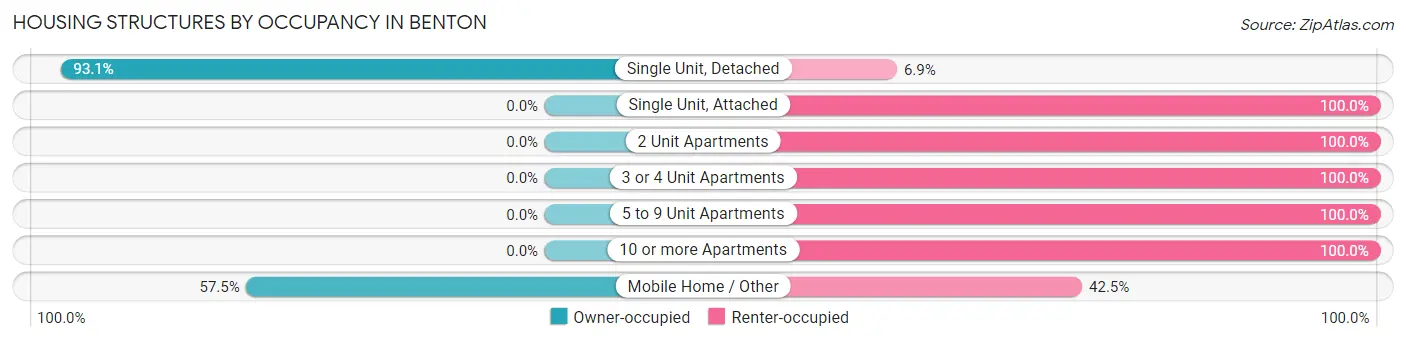
| Structure Type | Owner-occupied | Renter-occupied |
| Single Unit, Detached | 1,538 (93.1%) | 114 (6.9%) |
| Single Unit, Attached | 0 (0.0%) | 22 (100.0%) |
| 2 Unit Apartments | 0 (0.0%) | 16 (100.0%) |
| 3 or 4 Unit Apartments | 0 (0.0%) | 20 (100.0%) |
| 5 to 9 Unit Apartments | 0 (0.0%) | 43 (100.0%) |
| 10 or more Apartments | 0 (0.0%) | 218 (100.0%) |
| Mobile Home / Other | 77 (57.5%) | 57 (42.5%) |
| Total | 1,615 (76.7%) | 490 (23.3%) |
Housing Structures by Number of Rooms in Benton
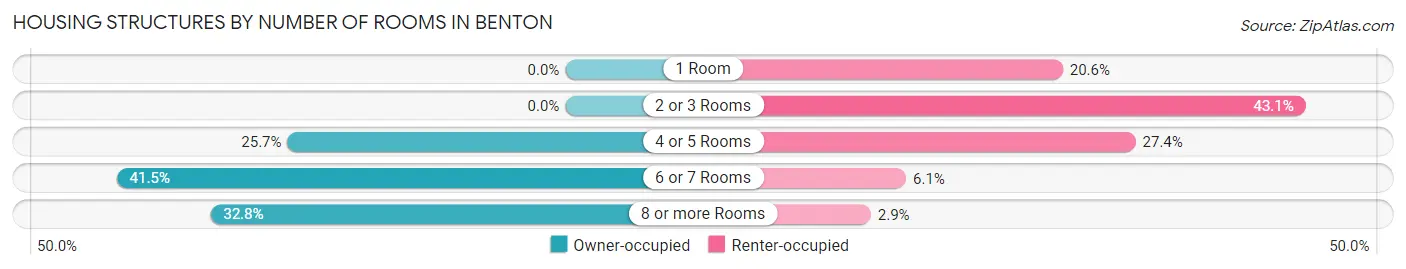
| Number of Rooms | Owner-occupied | Renter-occupied |
| 1 Room | 0 (0.0%) | 101 (20.6%) |
| 2 or 3 Rooms | 0 (0.0%) | 211 (43.1%) |
| 4 or 5 Rooms | 415 (25.7%) | 134 (27.4%) |
| 6 or 7 Rooms | 670 (41.5%) | 30 (6.1%) |
| 8 or more Rooms | 530 (32.8%) | 14 (2.9%) |
| Total | 1,615 (100.0%) | 490 (100.0%) |
Housing Structure by Heating Type in Benton
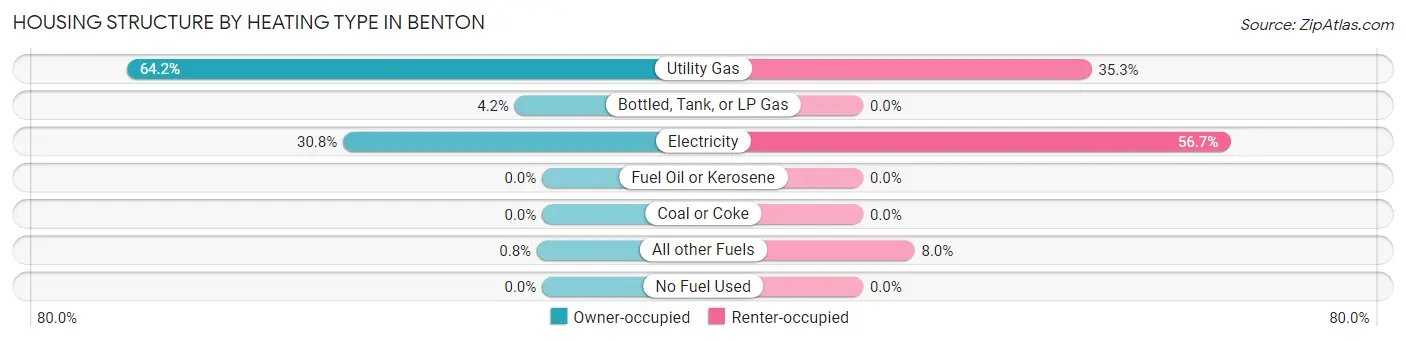
| Heating Type | Owner-occupied | Renter-occupied |
| Utility Gas | 1,037 (64.2%) | 173 (35.3%) |
| Bottled, Tank, or LP Gas | 68 (4.2%) | 0 (0.0%) |
| Electricity | 497 (30.8%) | 278 (56.7%) |
| Fuel Oil or Kerosene | 0 (0.0%) | 0 (0.0%) |
| Coal or Coke | 0 (0.0%) | 0 (0.0%) |
| All other Fuels | 13 (0.8%) | 39 (8.0%) |
| No Fuel Used | 0 (0.0%) | 0 (0.0%) |
| Total | 1,615 (100.0%) | 490 (100.0%) |
Household Vehicle Usage in Benton
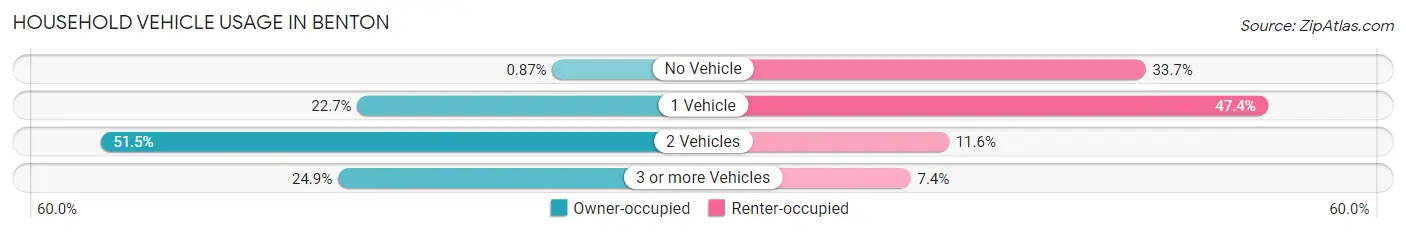
| Vehicles per Household | Owner-occupied | Renter-occupied |
| No Vehicle | 14 (0.9%) | 165 (33.7%) |
| 1 Vehicle | 367 (22.7%) | 232 (47.3%) |
| 2 Vehicles | 832 (51.5%) | 57 (11.6%) |
| 3 or more Vehicles | 402 (24.9%) | 36 (7.3%) |
| Total | 1,615 (100.0%) | 490 (100.0%) |
Real Estate & Mortgages in Benton
Real Estate and Mortgage Overview in Benton
| Characteristic | Without Mortgage | With Mortgage |
| Housing Units | 681 | 934 |
| Median Property Value | $157,500 | $160,600 |
| Median Household Income | $61,875 | $63 |
| Monthly Housing Costs | $484 | $16 |
| Real Estate Taxes | $1,091 | $0 |
Property Value by Mortgage Status in Benton
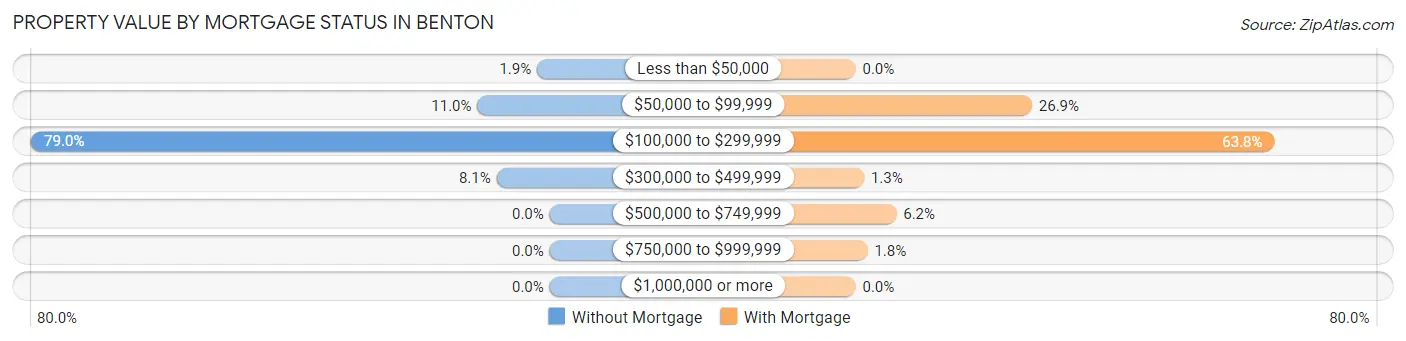
| Property Value | Without Mortgage | With Mortgage |
| Less than $50,000 | 13 (1.9%) | 0 (0.0%) |
| $50,000 to $99,999 | 75 (11.0%) | 251 (26.9%) |
| $100,000 to $299,999 | 538 (79.0%) | 596 (63.8%) |
| $300,000 to $499,999 | 55 (8.1%) | 12 (1.3%) |
| $500,000 to $749,999 | 0 (0.0%) | 58 (6.2%) |
| $750,000 to $999,999 | 0 (0.0%) | 17 (1.8%) |
| $1,000,000 or more | 0 (0.0%) | 0 (0.0%) |
| Total | 681 (100.0%) | 934 (100.0%) |
Household Income by Mortgage Status in Benton
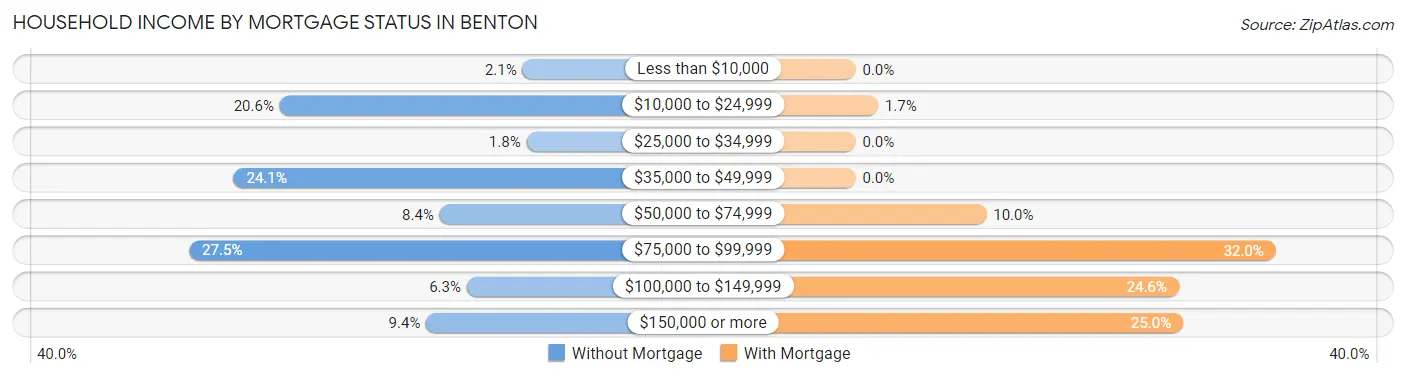
| Household Income | Without Mortgage | With Mortgage |
| Less than $10,000 | 14 (2.1%) | 0 (0.0%) |
| $10,000 to $24,999 | 140 (20.6%) | 16 (1.7%) |
| $25,000 to $34,999 | 12 (1.8%) | 0 (0.0%) |
| $35,000 to $49,999 | 164 (24.1%) | 0 (0.0%) |
| $50,000 to $74,999 | 57 (8.4%) | 93 (10.0%) |
| $75,000 to $99,999 | 187 (27.5%) | 299 (32.0%) |
| $100,000 to $149,999 | 43 (6.3%) | 230 (24.6%) |
| $150,000 or more | 64 (9.4%) | 233 (24.9%) |
| Total | 681 (100.0%) | 934 (100.0%) |
Property Value to Household Income Ratio in Benton
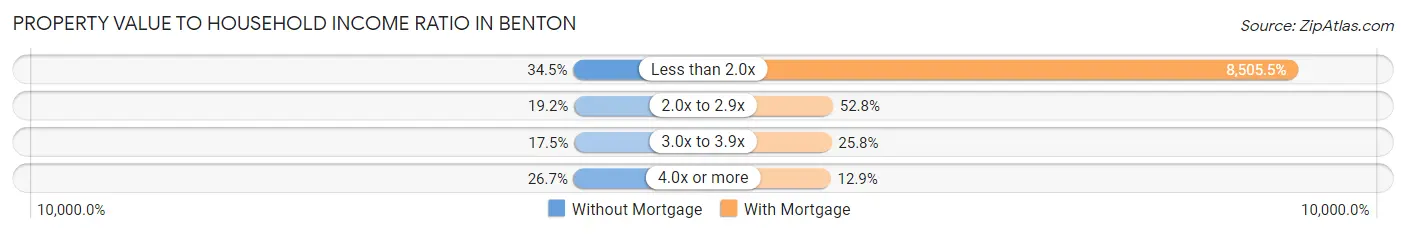
| Value-to-Income Ratio | Without Mortgage | With Mortgage |
| Less than 2.0x | 235 (34.5%) | 79,441 (8,505.5%) |
| 2.0x to 2.9x | 131 (19.2%) | 493 (52.8%) |
| 3.0x to 3.9x | 119 (17.5%) | 241 (25.8%) |
| 4.0x or more | 182 (26.7%) | 120 (12.9%) |
| Total | 681 (100.0%) | 934 (100.0%) |
Real Estate Taxes by Mortgage Status in Benton
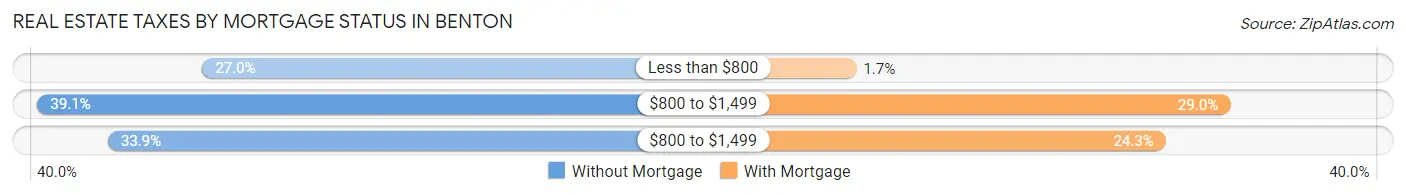
| Property Taxes | Without Mortgage | With Mortgage |
| Less than $800 | 184 (27.0%) | 16 (1.7%) |
| $800 to $1,499 | 266 (39.1%) | 271 (29.0%) |
| $800 to $1,499 | 231 (33.9%) | 227 (24.3%) |
| Total | 681 (100.0%) | 934 (100.0%) |
Health & Disability in Benton
Health Insurance Coverage by Age in Benton
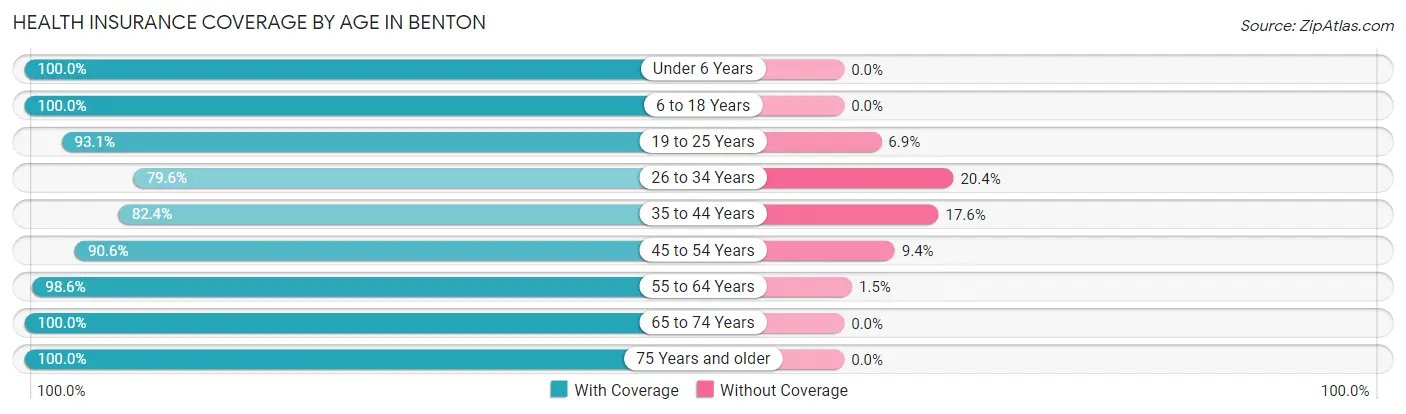
| Age Bracket | With Coverage | Without Coverage |
| Under 6 Years | 272 (100.0%) | 0 (0.0%) |
| 6 to 18 Years | 551 (100.0%) | 0 (0.0%) |
| 19 to 25 Years | 296 (93.1%) | 22 (6.9%) |
| 26 to 34 Years | 309 (79.6%) | 79 (20.4%) |
| 35 to 44 Years | 530 (82.4%) | 113 (17.6%) |
| 45 to 54 Years | 327 (90.6%) | 34 (9.4%) |
| 55 to 64 Years | 749 (98.6%) | 11 (1.5%) |
| 65 to 74 Years | 494 (100.0%) | 0 (0.0%) |
| 75 Years and older | 559 (100.0%) | 0 (0.0%) |
| Total | 4,087 (94.0%) | 259 (6.0%) |
Health Insurance Coverage by Citizenship Status in Benton
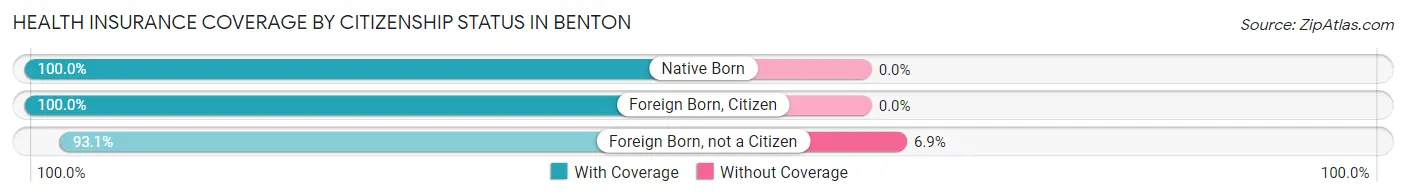
| Citizenship Status | With Coverage | Without Coverage |
| Native Born | 272 (100.0%) | 0 (0.0%) |
| Foreign Born, Citizen | 551 (100.0%) | 0 (0.0%) |
| Foreign Born, not a Citizen | 296 (93.1%) | 22 (6.9%) |
Health Insurance Coverage by Household Income in Benton
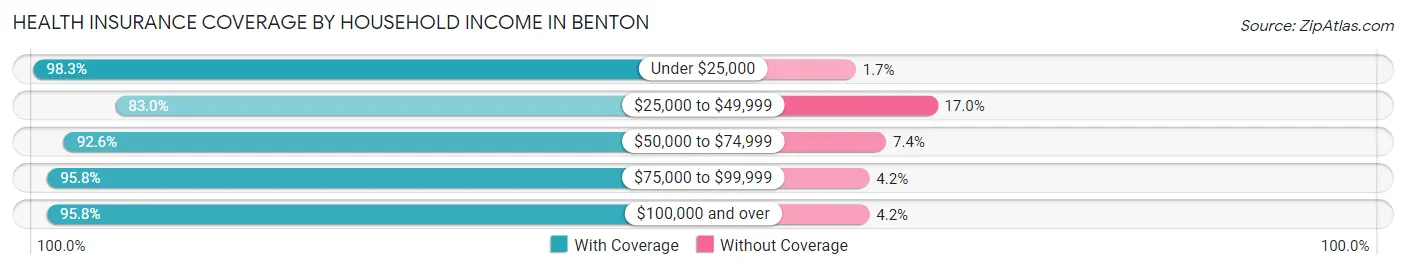
| Household Income | With Coverage | Without Coverage |
| Under $25,000 | 702 (98.3%) | 12 (1.7%) |
| $25,000 to $49,999 | 464 (83.0%) | 95 (17.0%) |
| $50,000 to $74,999 | 667 (92.6%) | 53 (7.4%) |
| $75,000 to $99,999 | 903 (95.8%) | 40 (4.2%) |
| $100,000 and over | 1,340 (95.8%) | 59 (4.2%) |
Public vs Private Health Insurance Coverage by Age in Benton
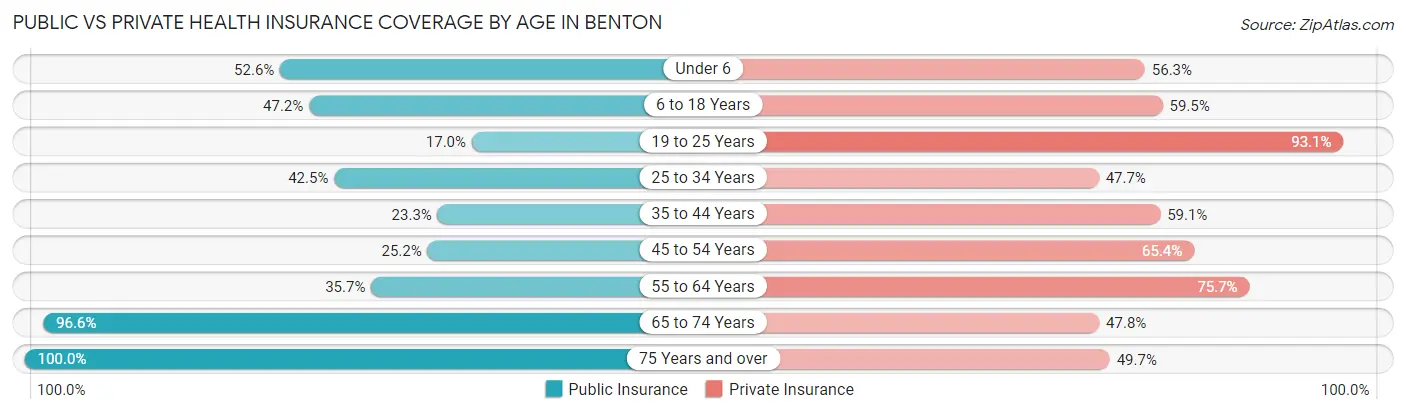
| Age Bracket | Public Insurance | Private Insurance |
| Under 6 | 143 (52.6%) | 153 (56.2%) |
| 6 to 18 Years | 260 (47.2%) | 328 (59.5%) |
| 19 to 25 Years | 54 (17.0%) | 296 (93.1%) |
| 25 to 34 Years | 165 (42.5%) | 185 (47.7%) |
| 35 to 44 Years | 150 (23.3%) | 380 (59.1%) |
| 45 to 54 Years | 91 (25.2%) | 236 (65.4%) |
| 55 to 64 Years | 271 (35.7%) | 575 (75.7%) |
| 65 to 74 Years | 477 (96.6%) | 236 (47.8%) |
| 75 Years and over | 559 (100.0%) | 278 (49.7%) |
| Total | 2,170 (49.9%) | 2,667 (61.4%) |
Disability Status by Sex by Age in Benton
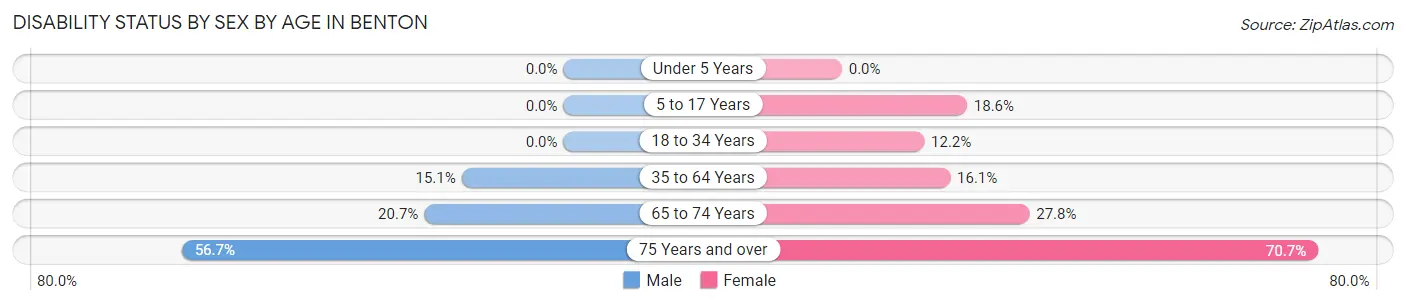
| Age Bracket | Male | Female |
| Under 5 Years | 0 (0.0%) | 0 (0.0%) |
| 5 to 17 Years | 0 (0.0%) | 52 (18.6%) |
| 18 to 34 Years | 0 (0.0%) | 54 (12.2%) |
| 35 to 64 Years | 104 (15.1%) | 173 (16.1%) |
| 65 to 74 Years | 62 (20.7%) | 54 (27.8%) |
| 75 Years and over | 102 (56.7%) | 268 (70.7%) |
Disability Class by Sex by Age in Benton
Disability Class: Hearing Difficulty
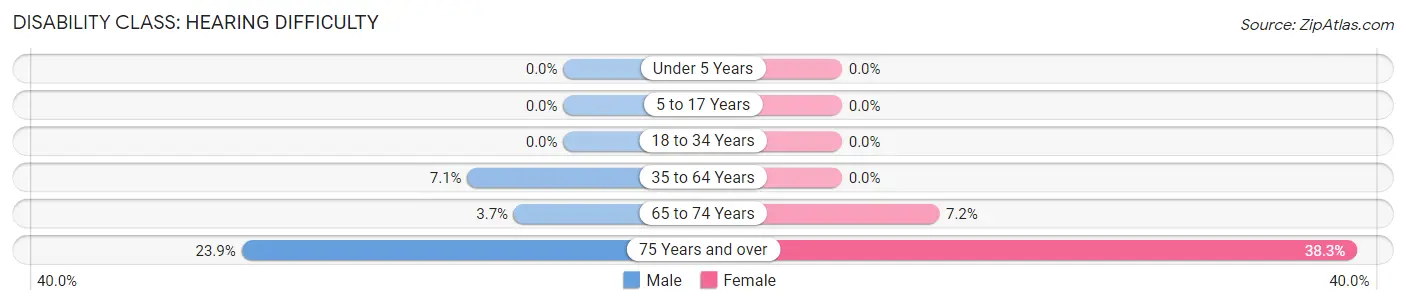
| Age Bracket | Male | Female |
| Under 5 Years | 0 (0.0%) | 0 (0.0%) |
| 5 to 17 Years | 0 (0.0%) | 0 (0.0%) |
| 18 to 34 Years | 0 (0.0%) | 0 (0.0%) |
| 35 to 64 Years | 49 (7.1%) | 0 (0.0%) |
| 65 to 74 Years | 11 (3.7%) | 14 (7.2%) |
| 75 Years and over | 43 (23.9%) | 145 (38.3%) |
Disability Class: Vision Difficulty
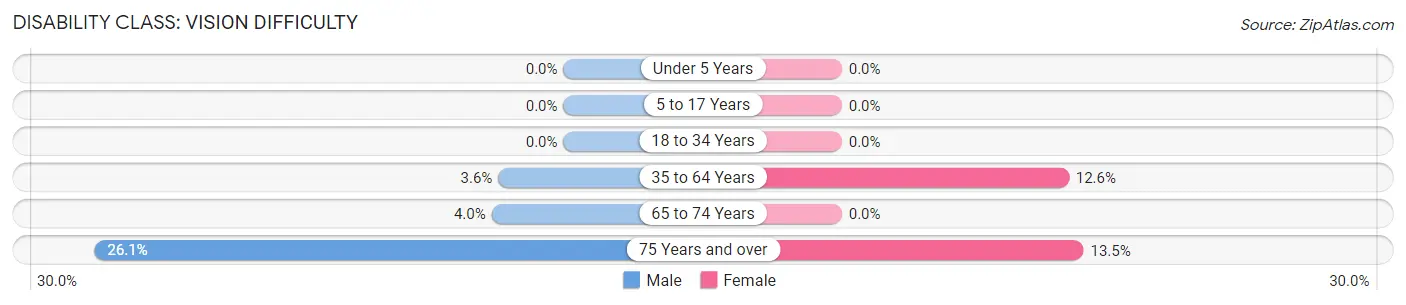
| Age Bracket | Male | Female |
| Under 5 Years | 0 (0.0%) | 0 (0.0%) |
| 5 to 17 Years | 0 (0.0%) | 0 (0.0%) |
| 18 to 34 Years | 0 (0.0%) | 0 (0.0%) |
| 35 to 64 Years | 25 (3.6%) | 136 (12.6%) |
| 65 to 74 Years | 12 (4.0%) | 0 (0.0%) |
| 75 Years and over | 47 (26.1%) | 51 (13.5%) |
Disability Class: Cognitive Difficulty
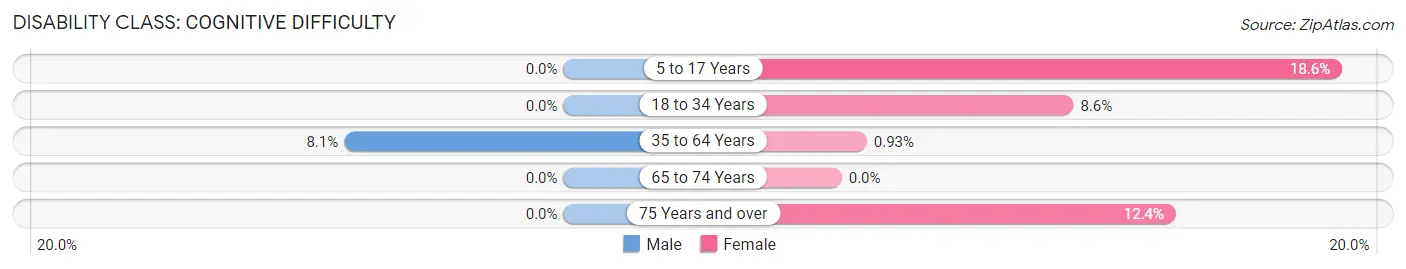
| Age Bracket | Male | Female |
| 5 to 17 Years | 0 (0.0%) | 52 (18.6%) |
| 18 to 34 Years | 0 (0.0%) | 38 (8.6%) |
| 35 to 64 Years | 56 (8.1%) | 10 (0.9%) |
| 65 to 74 Years | 0 (0.0%) | 0 (0.0%) |
| 75 Years and over | 0 (0.0%) | 47 (12.4%) |
Disability Class: Ambulatory Difficulty
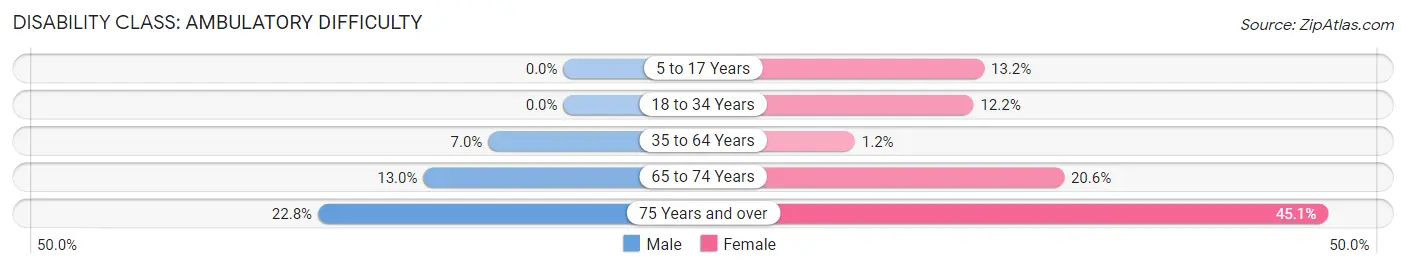
| Age Bracket | Male | Female |
| 5 to 17 Years | 0 (0.0%) | 37 (13.2%) |
| 18 to 34 Years | 0 (0.0%) | 54 (12.2%) |
| 35 to 64 Years | 48 (7.0%) | 13 (1.2%) |
| 65 to 74 Years | 39 (13.0%) | 40 (20.6%) |
| 75 Years and over | 41 (22.8%) | 171 (45.1%) |
Disability Class: Self-Care Difficulty
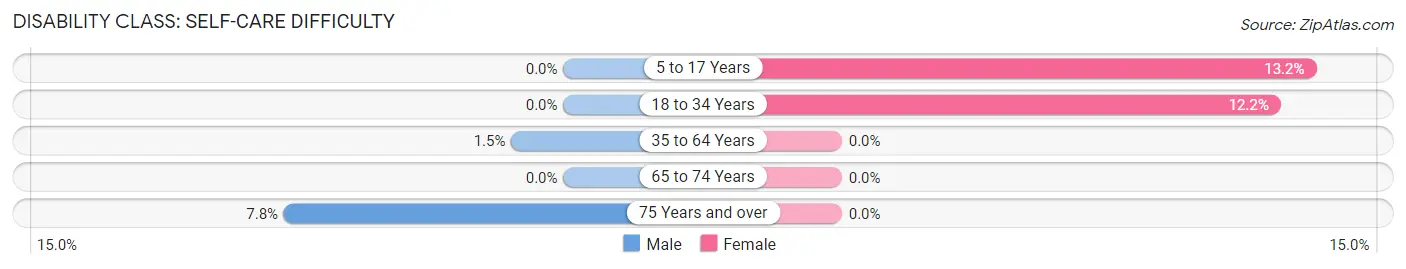
| Age Bracket | Male | Female |
| 5 to 17 Years | 0 (0.0%) | 37 (13.2%) |
| 18 to 34 Years | 0 (0.0%) | 54 (12.2%) |
| 35 to 64 Years | 10 (1.5%) | 0 (0.0%) |
| 65 to 74 Years | 0 (0.0%) | 0 (0.0%) |
| 75 Years and over | 14 (7.8%) | 0 (0.0%) |
Technology Access in Benton
Computing Device Access in Benton
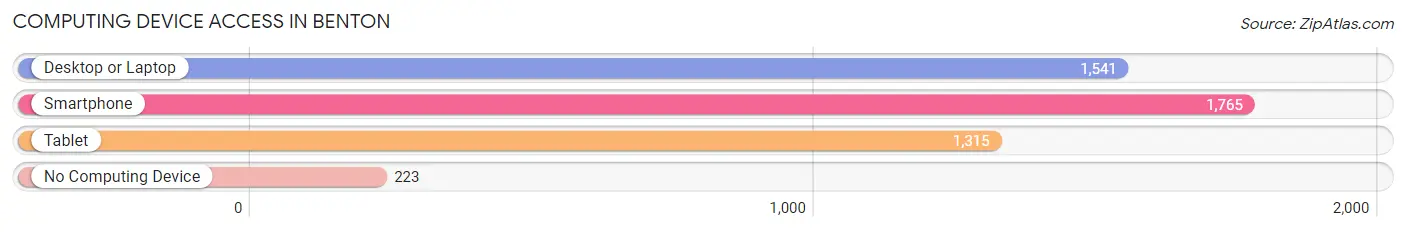
| Device Type | # Households | % Households |
| Desktop or Laptop | 1,541 | 73.2% |
| Smartphone | 1,765 | 83.9% |
| Tablet | 1,315 | 62.5% |
| No Computing Device | 223 | 10.6% |
| Total | 2,105 | 100.0% |
Internet Access in Benton
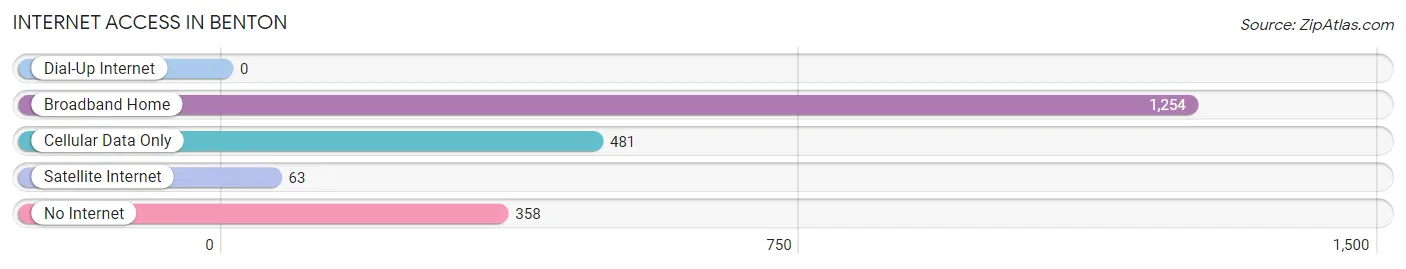
| Internet Type | # Households | % Households |
| Dial-Up Internet | 0 | 0.0% |
| Broadband Home | 1,254 | 59.6% |
| Cellular Data Only | 481 | 22.9% |
| Satellite Internet | 63 | 3.0% |
| No Internet | 358 | 17.0% |
| Total | 2,105 | 100.0% |
Benton Summary
Benton, Kentucky is a small city located in Marshall County, Kentucky. It is situated on the banks of the Kentucky River and is part of the Paducah, Kentucky metropolitan area. The city has a population of approximately 4,500 people and is the county seat of Marshall County.
History
Benton was founded in 1836 and was named after Thomas Hart Benton, a United States Senator from Missouri. The city was originally a trading post and was the site of a ferry crossing of the Kentucky River. In 1854, the city was incorporated and the first post office was established.
In the late 19th century, Benton was a major center for the production of tobacco. The city was also home to several large tobacco warehouses and factories. The city was also home to a large number of saloons and gambling establishments.
In the early 20th century, Benton was a major center for the production of coal. The city was home to several large coal mines and coal processing plants. The city was also home to several large steel mills and other industrial facilities.
Geography
Benton is located in Marshall County, Kentucky. The city is situated on the banks of the Kentucky River and is part of the Paducah, Kentucky metropolitan area. The city has a total area of 4.2 square miles, all of which is land.
The city is located in the Central Kentucky region and is part of the Jackson Purchase region. The city is located in the Eastern Time Zone and observes Daylight Saving Time.
Economy
Benton’s economy is largely based on agriculture and manufacturing. The city is home to several large agricultural operations, including cattle farms, poultry farms, and vegetable farms. The city is also home to several large manufacturing facilities, including a steel mill, a paper mill, and a plastics plant.
The city is also home to several retail stores, restaurants, and other businesses. The city is also home to several banks and other financial institutions.
Demographics
As of the 2010 census, the population of Benton was 4,541. The racial makeup of the city was 95.3% White, 1.7% African American, 0.3% Native American, 0.2% Asian, 0.1% Pacific Islander, 0.7% from other races, and 1.9% from two or more races. Hispanic or Latino of any race were 2.2% of the population.
The median income for a household in the city was $31,250, and the median income for a family was $37,500. The per capita income for the city was $17,845. About 17.2% of families and 20.2% of the population were below the poverty line, including 28.2% of those under age 18 and 16.2% of those age 65 or over.
Benton is a small city with a rich history and a diverse economy. The city is home to several large agricultural and manufacturing operations, as well as several retail stores, restaurants, and other businesses. The city has a population of approximately 4,500 people and is the county seat of Marshall County.
Common Questions
What is Per Capita Income in Benton?
Per Capita income in Benton is $29,759.
What is the Median Family Income in Benton?
Median Family Income in Benton is $79,235.
What is the Median Household income in Benton?
Median Household Income in Benton is $61,443.
What is Income or Wage Gap in Benton?
Income or Wage Gap in Benton is 1.2%.
Women in Benton earn 98.8 cents for every dollar earned by a man.
What is Family Income Deficit in Benton?
Family Income Deficit in Benton is $11,357.
Families that are below poverty line in Benton earn $11,357 less on average than the poverty threshold level.
What is Inequality or Gini Index in Benton?
Inequality or Gini Index in Benton is 0.39.
What is the Total Population of Benton?
Total Population of Benton is 4,753.
What is the Total Male Population of Benton?
Total Male Population of Benton is 2,203.
What is the Total Female Population of Benton?
Total Female Population of Benton is 2,550.
What is the Ratio of Males per 100 Females in Benton?
There are 86.39 Males per 100 Females in Benton.
What is the Ratio of Females per 100 Males in Benton?
There are 115.75 Females per 100 Males in Benton.
What is the Median Population Age in Benton?
Median Population Age in Benton is 44.0 Years.
What is the Average Family Size in Benton
Average Family Size in Benton is 2.8 People.
What is the Average Household Size in Benton
Average Household Size in Benton is 2.1 People.
How Large is the Labor Force in Benton?
There are 2,175 People in the Labor Forcein in Benton.
What is the Percentage of People in the Labor Force in Benton?
52.7% of People are in the Labor Force in Benton.
What is the Unemployment Rate in Benton?
Unemployment Rate in Benton is 1.8%.