Zip Codes with the Highest Percentage of Population Employed in Food Preparation & Serving in Berea, KY
RELATED REPORTS & OPTIONS
Food Preparation & Serving
Berea
Compare Zip Codes
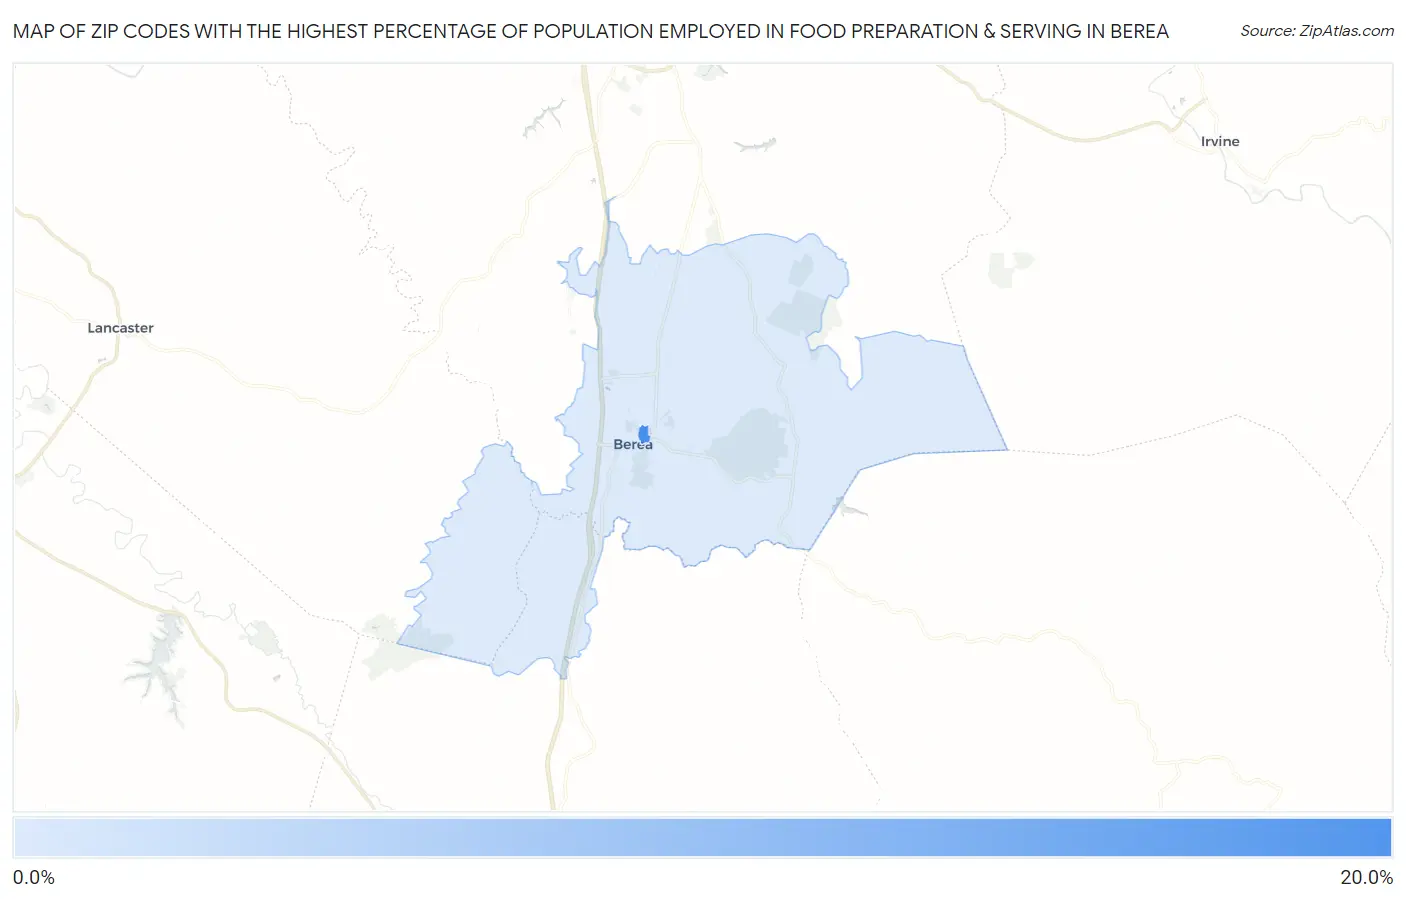
Map of Zip Codes with the Highest Percentage of Population Employed in Food Preparation & Serving in Berea
7.9%
19.3%
Zip Codes with the Highest Percentage of Population Employed in Food Preparation & Serving in Berea, KY
| Zip Code | % Employed | vs State | vs National | |
| 1. | 40404 | 19.3% | 5.1%(+14.2)#20 | 5.3%(+14.0)#548 |
| 2. | 40403 | 7.9% | 5.1%(+2.82)#126 | 5.3%(+2.62)#4,878 |
1
Common Questions
What are the Top Zip Codes with the Highest Percentage of Population Employed in Food Preparation & Serving in Berea, KY?
Top Zip Codes with the Highest Percentage of Population Employed in Food Preparation & Serving in Berea, KY are:
What zip code has the Highest Percentage of Population Employed in Food Preparation & Serving in Berea, KY?
40404 has the Highest Percentage of Population Employed in Food Preparation & Serving in Berea, KY with 19.3%.
What is the Percentage of Population Employed in Food Preparation & Serving in Berea, KY?
Percentage of Population Employed in Food Preparation & Serving in Berea is 7.0%.
What is the Percentage of Population Employed in Food Preparation & Serving in Kentucky?
Percentage of Population Employed in Food Preparation & Serving in Kentucky is 5.1%.
What is the Percentage of Population Employed in Food Preparation & Serving in the United States?
Percentage of Population Employed in Food Preparation & Serving in the United States is 5.3%.