Pippa Passes, KY Map & Demographics
Pippa Passes Map
Pippa Passes Overview
$14,813
PER CAPITA INCOME
$148,750
AVG FAMILY INCOME
7.5%
WAGE / INCOME GAP [ % ]
92.5¢/ $1
WAGE / INCOME GAP [ $ ]
0.61
INEQUALITY / GINI INDEX
543
TOTAL POPULATION
255
MALE POPULATION
288
FEMALE POPULATION
88.54
MALES / 100 FEMALES
112.94
FEMALES / 100 MALES
20.4
MEDIAN AGE
3.5
AVG FAMILY SIZE
1.9
AVG HOUSEHOLD SIZE
178
LABOR FORCE [ PEOPLE ]
33.6%
PERCENT IN LABOR FORCE
2.8%
UNEMPLOYMENT RATE
Pippa Passes Zip Codes
Pippa Passes Area Codes
Income in Pippa Passes
Income Overview in Pippa Passes
| Characteristic | Number | Measure |
| Per Capita Income | 543 | $14,813 |
| Median Family Income | 26 | $148,750 |
| Mean Family Income | 26 | $179,219 |
| Median Household Income | 69 | $0 |
| Mean Household Income | 69 | $80,806 |
| Income Deficit | 26 | $0 |
| Wage / Income Gap (%) | 543 | 7.48% |
| Wage / Income Gap ($) | 543 | 92.52¢ per $1 |
| Gini / Inequality Index | 543 | 0.61 |
Earnings by Sex in Pippa Passes
Average Earnings in Pippa Passes are $4,464, $4,279 for men and $4,625 for women, a difference of 7.5%.
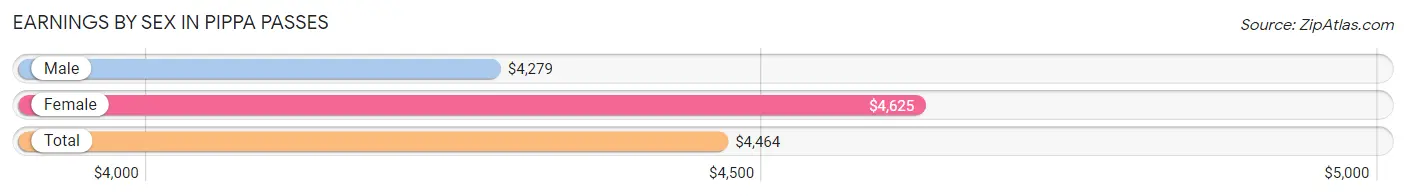
| Sex | Number | Average Earnings |
| Male | 188 (47.5%) | $4,279 |
| Female | 208 (52.5%) | $4,625 |
| Total | 396 (100.0%) | $4,464 |
Earnings by Sex by Income Bracket in Pippa Passes
The most common earnings brackets in Pippa Passes are $2,499 or less for men (57 | 30.3%) and $2,500 to $4,999 for women (60 | 28.8%).
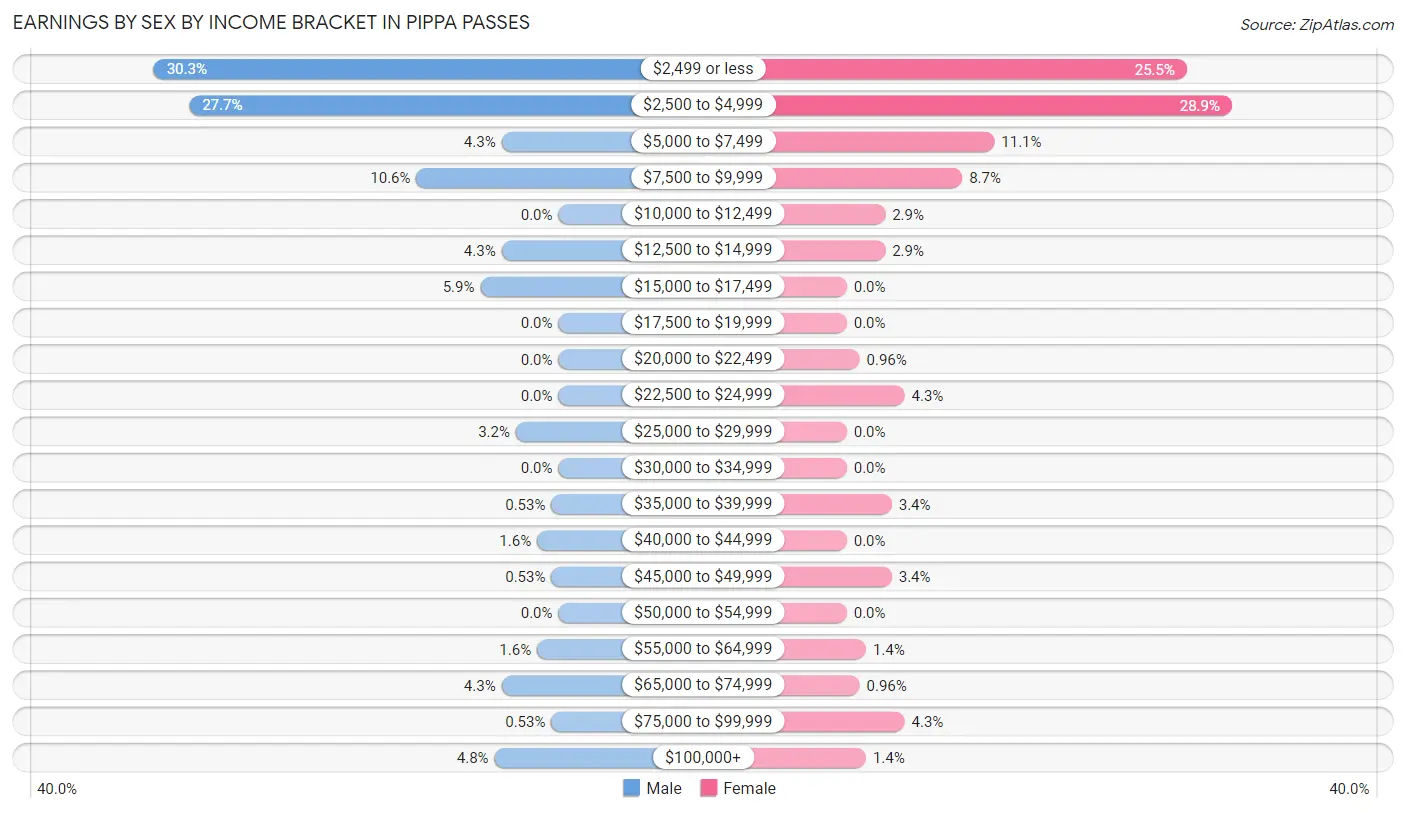
| Income | Male | Female |
| $2,499 or less | 57 (30.3%) | 53 (25.5%) |
| $2,500 to $4,999 | 52 (27.7%) | 60 (28.8%) |
| $5,000 to $7,499 | 8 (4.3%) | 23 (11.1%) |
| $7,500 to $9,999 | 20 (10.6%) | 18 (8.6%) |
| $10,000 to $12,499 | 0 (0.0%) | 6 (2.9%) |
| $12,500 to $14,999 | 8 (4.3%) | 6 (2.9%) |
| $15,000 to $17,499 | 11 (5.9%) | 0 (0.0%) |
| $17,500 to $19,999 | 0 (0.0%) | 0 (0.0%) |
| $20,000 to $22,499 | 0 (0.0%) | 2 (1.0%) |
| $22,500 to $24,999 | 0 (0.0%) | 9 (4.3%) |
| $25,000 to $29,999 | 6 (3.2%) | 0 (0.0%) |
| $30,000 to $34,999 | 0 (0.0%) | 0 (0.0%) |
| $35,000 to $39,999 | 1 (0.5%) | 7 (3.4%) |
| $40,000 to $44,999 | 3 (1.6%) | 0 (0.0%) |
| $45,000 to $49,999 | 1 (0.5%) | 7 (3.4%) |
| $50,000 to $54,999 | 0 (0.0%) | 0 (0.0%) |
| $55,000 to $64,999 | 3 (1.6%) | 3 (1.4%) |
| $65,000 to $74,999 | 8 (4.3%) | 2 (1.0%) |
| $75,000 to $99,999 | 1 (0.5%) | 9 (4.3%) |
| $100,000+ | 9 (4.8%) | 3 (1.4%) |
| Total | 188 (100.0%) | 208 (100.0%) |
Earnings by Sex by Educational Attainment in Pippa Passes
Average earnings in Pippa Passes are $57,917 for men and $62,083 for women, a difference of 6.7%. Men with an educational attainment of graduate degree enjoy the highest average annual earnings of $70,750, while those with graduate degree education earn the least with $70,750. Women with an educational attainment of graduate degree earn the most with the average annual earnings of $90,313, while those with graduate degree education have the smallest earnings of $90,313.
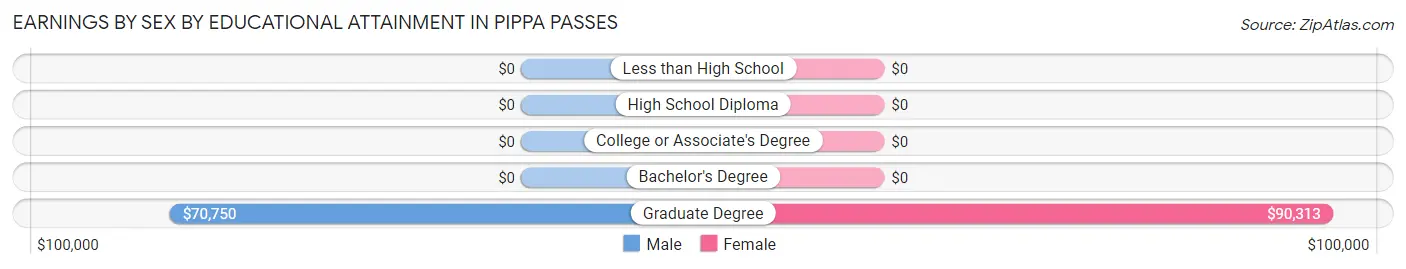
| Educational Attainment | Male Income | Female Income |
| Less than High School | - | - |
| High School Diploma | - | - |
| College or Associate's Degree | - | - |
| Bachelor's Degree | - | - |
| Graduate Degree | $70,750 | $90,313 |
| Total | $57,917 | $62,083 |
Family Income in Pippa Passes
Family Income Brackets in Pippa Passes
According to the Pippa Passes family income data, there are 9 families falling into the $200,000+ income range, which is the most common income bracket and makes up 34.6% of all families.
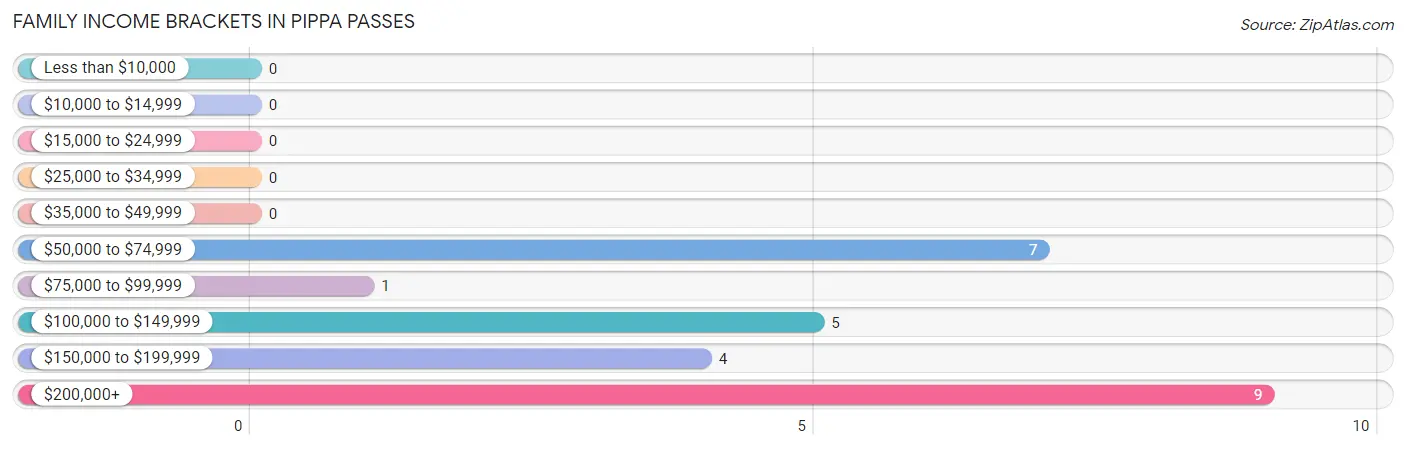
| Income Bracket | # Families | % Families |
| Less than $10,000 | 0 | 0.0% |
| $10,000 to $14,999 | 0 | 0.0% |
| $15,000 to $24,999 | 0 | 0.0% |
| $25,000 to $34,999 | 0 | 0.0% |
| $35,000 to $49,999 | 0 | 0.0% |
| $50,000 to $74,999 | 7 | 26.9% |
| $75,000 to $99,999 | 1 | 3.8% |
| $100,000 to $149,999 | 5 | 19.2% |
| $150,000 to $199,999 | 4 | 15.4% |
| $200,000+ | 9 | 34.6% |
Family Income by Famaliy Size in Pippa Passes
3-person families (11 | 42.3%) account for the highest median family income in Pippa Passes with $227,708 per family, while 3-person families (11 | 42.3%) have the highest median income of $75,903 per family member.
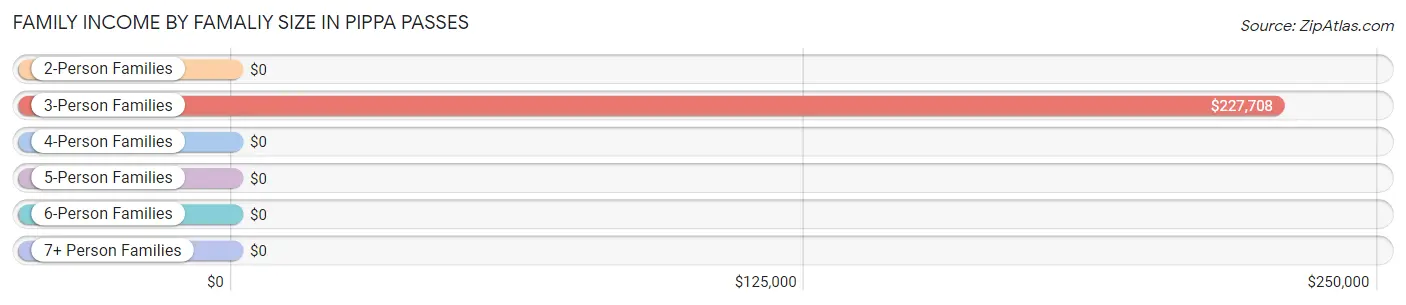
| Income Bracket | # Families | Median Income |
| 2-Person Families | 10 (38.5%) | $0 |
| 3-Person Families | 11 (42.3%) | $227,708 |
| 4-Person Families | 4 (15.4%) | $0 |
| 5-Person Families | 1 (3.8%) | $0 |
| 6-Person Families | 0 (0.0%) | $0 |
| 7+ Person Families | 0 (0.0%) | $0 |
| Total | 26 (100.0%) | $148,750 |
Family Income by Number of Earners in Pippa Passes
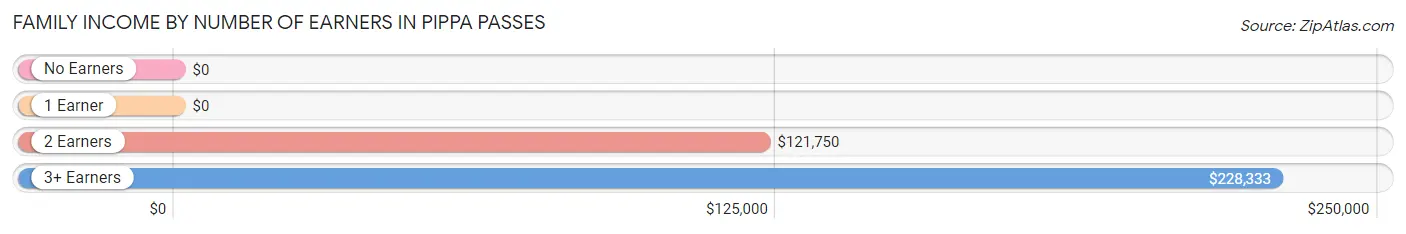
| Number of Earners | # Families | Median Income |
| No Earners | 2 (7.7%) | $0 |
| 1 Earner | 5 (19.2%) | $0 |
| 2 Earners | 11 (42.3%) | $121,750 |
| 3+ Earners | 8 (30.8%) | $228,333 |
| Total | 26 (100.0%) | $148,750 |
Household Income in Pippa Passes
Household Income Brackets in Pippa Passes
With 21 households falling in the category, the $10,000 to $14,999 income range is the most frequent in Pippa Passes, accounting for 30.4% of all households.
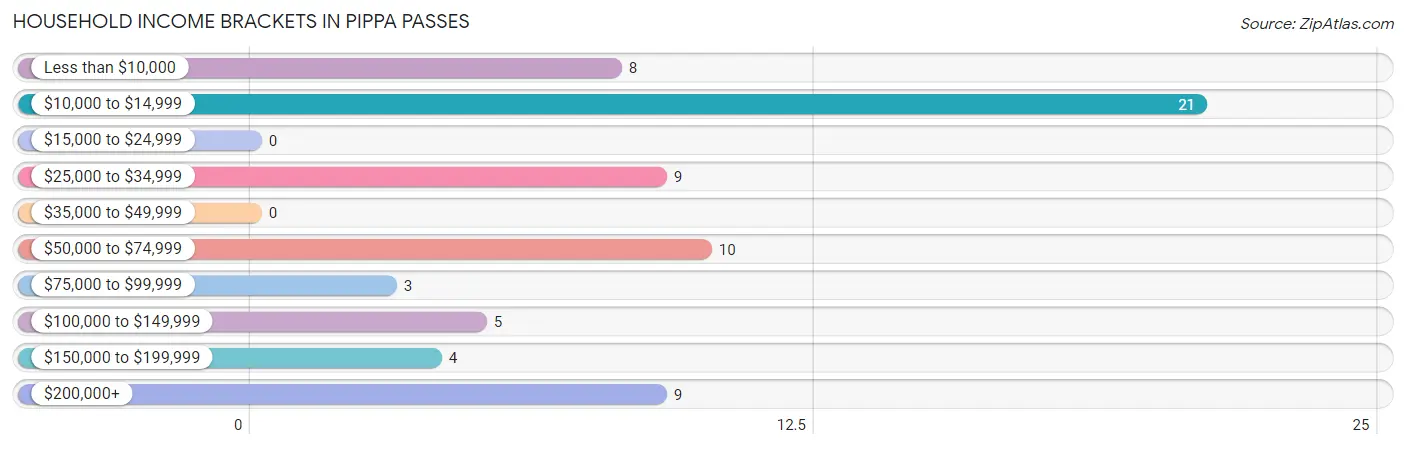
| Income Bracket | # Households | % Households |
| Less than $10,000 | 8 | 11.6% |
| $10,000 to $14,999 | 21 | 30.4% |
| $15,000 to $24,999 | 0 | 0.0% |
| $25,000 to $34,999 | 9 | 13.0% |
| $35,000 to $49,999 | 0 | 0.0% |
| $50,000 to $74,999 | 10 | 14.5% |
| $75,000 to $99,999 | 3 | 4.3% |
| $100,000 to $149,999 | 5 | 7.2% |
| $150,000 to $199,999 | 4 | 5.8% |
| $200,000+ | 9 | 13.0% |
Household Income by Householder Age in Pippa Passes
The median household income in Pippa Passes is $0, with the highest median household income of $73,438 found in the 25 to 44 years age bracket for the primary householder. A total of 5 households (7.2%) fall into this category.
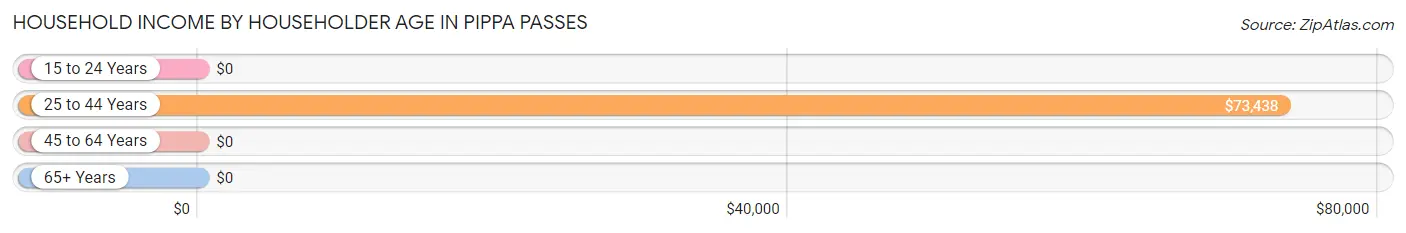
| Income Bracket | # Households | Median Income |
| 15 to 24 Years | 0 (0.0%) | $0 |
| 25 to 44 Years | 5 (7.2%) | $73,438 |
| 45 to 64 Years | 49 (71.0%) | $0 |
| 65+ Years | 15 (21.7%) | $0 |
| Total | 69 (100.0%) | $0 |
Poverty in Pippa Passes
Income Below Poverty by Sex and Age in Pippa Passes
With 21.5% poverty level for males and 21.7% for females among the residents of Pippa Passes, 65 to 74 year old males and 75 year old and over females are the most vulnerable to poverty, with 8 males (57.1%) and 1 females (100.0%) in their respective age groups living below the poverty level.
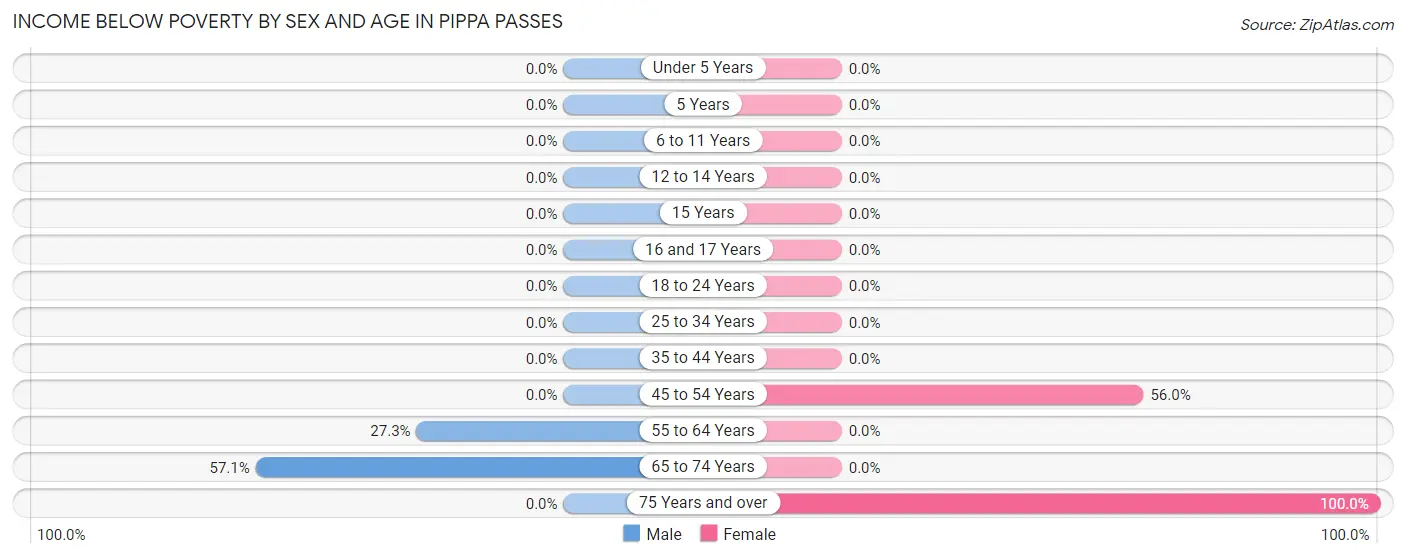
| Age Bracket | Male | Female |
| Under 5 Years | 0 (0.0%) | 0 (0.0%) |
| 5 Years | 0 (0.0%) | 0 (0.0%) |
| 6 to 11 Years | 0 (0.0%) | 0 (0.0%) |
| 12 to 14 Years | 0 (0.0%) | 0 (0.0%) |
| 15 Years | 0 (0.0%) | 0 (0.0%) |
| 16 and 17 Years | 0 (0.0%) | 0 (0.0%) |
| 18 to 24 Years | 0 (0.0%) | 0 (0.0%) |
| 25 to 34 Years | 0 (0.0%) | 0 (0.0%) |
| 35 to 44 Years | 0 (0.0%) | 0 (0.0%) |
| 45 to 54 Years | 0 (0.0%) | 14 (56.0%) |
| 55 to 64 Years | 6 (27.3%) | 0 (0.0%) |
| 65 to 74 Years | 8 (57.1%) | 0 (0.0%) |
| 75 Years and over | 0 (0.0%) | 1 (100.0%) |
| Total | 14 (21.5%) | 15 (21.7%) |
Income Above Poverty by Sex and Age in Pippa Passes
According to the poverty statistics in Pippa Passes, males aged under 5 years and females aged under 5 years are the age groups that are most secure financially, with 100.0% of males and 100.0% of females in these age groups living above the poverty line.
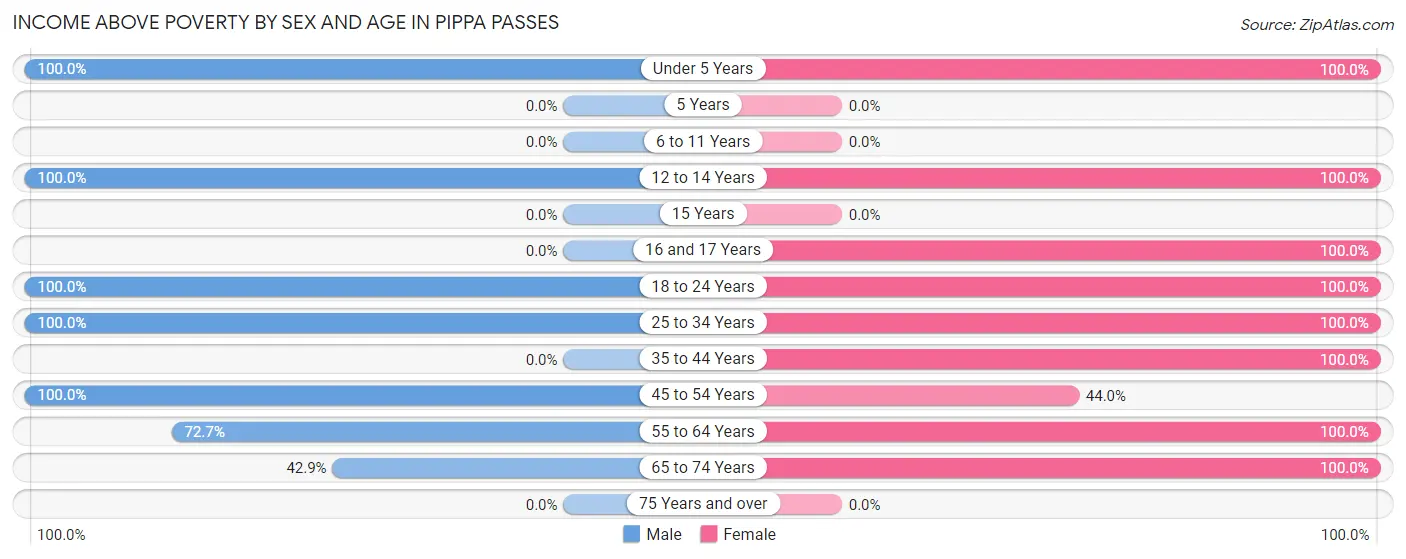
| Age Bracket | Male | Female |
| Under 5 Years | 5 (100.0%) | 4 (100.0%) |
| 5 Years | 0 (0.0%) | 0 (0.0%) |
| 6 to 11 Years | 0 (0.0%) | 0 (0.0%) |
| 12 to 14 Years | 2 (100.0%) | 3 (100.0%) |
| 15 Years | 0 (0.0%) | 0 (0.0%) |
| 16 and 17 Years | 0 (0.0%) | 7 (100.0%) |
| 18 to 24 Years | 5 (100.0%) | 2 (100.0%) |
| 25 to 34 Years | 7 (100.0%) | 6 (100.0%) |
| 35 to 44 Years | 0 (0.0%) | 13 (100.0%) |
| 45 to 54 Years | 10 (100.0%) | 11 (44.0%) |
| 55 to 64 Years | 16 (72.7%) | 6 (100.0%) |
| 65 to 74 Years | 6 (42.9%) | 2 (100.0%) |
| 75 Years and over | 0 (0.0%) | 0 (0.0%) |
| Total | 51 (78.5%) | 54 (78.3%) |
Income Below Poverty Among Married-Couple Families in Pippa Passes
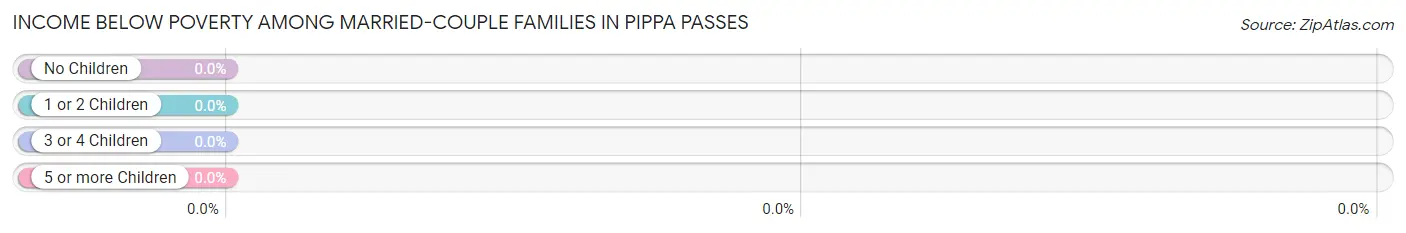
| Children | Above Poverty | Below Poverty |
| No Children | 12 (100.0%) | 0 (0.0%) |
| 1 or 2 Children | 14 (100.0%) | 0 (0.0%) |
| 3 or 4 Children | 0 (0.0%) | 0 (0.0%) |
| 5 or more Children | 0 (0.0%) | 0 (0.0%) |
| Total | 26 (100.0%) | 0 (0.0%) |
Income Below Poverty Among Single-Parent Households in Pippa Passes
| Children | Single Father | Single Mother |
| No Children | 0 (0.0%) | 0 (0.0%) |
| 1 or 2 Children | 0 (0.0%) | 0 (0.0%) |
| 3 or 4 Children | 0 (0.0%) | 0 (0.0%) |
| 5 or more Children | 0 (0.0%) | 0 (0.0%) |
| Total | 0 (0.0%) | 0 (0.0%) |
Income Below Poverty Among Married-Couple vs Single-Parent Households in Pippa Passes
| Children | Married-Couple Families | Single-Parent Households |
| No Children | 0 (0.0%) | 0 (0.0%) |
| 1 or 2 Children | 0 (0.0%) | 0 (0.0%) |
| 3 or 4 Children | 0 (0.0%) | 0 (0.0%) |
| 5 or more Children | 0 (0.0%) | 0 (0.0%) |
| Total | 0 (0.0%) | 0 (0.0%) |
Race in Pippa Passes
The most populous races in Pippa Passes are White / Caucasian (478 | 88.0%), Hispanic or Latino (31 | 5.7%), and Black / African American (29 | 5.3%).
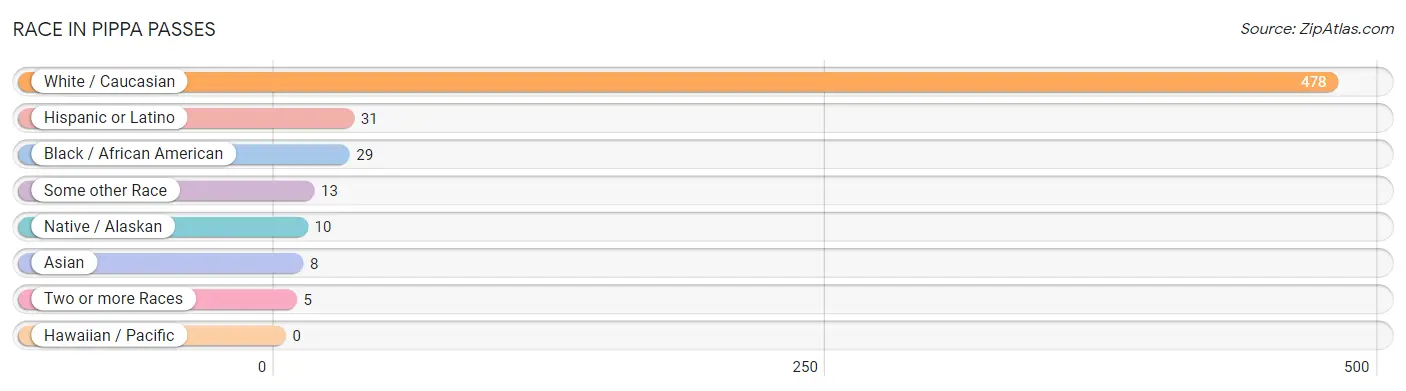
| Race | # Population | % Population |
| Asian | 8 | 1.5% |
| Black / African American | 29 | 5.3% |
| Hawaiian / Pacific | 0 | 0.0% |
| Hispanic or Latino | 31 | 5.7% |
| Native / Alaskan | 10 | 1.8% |
| White / Caucasian | 478 | 88.0% |
| Two or more Races | 5 | 0.9% |
| Some other Race | 13 | 2.4% |
| Total | 543 | 100.0% |
Ancestry in Pippa Passes
The most populous ancestries reported in Pippa Passes are German (97 | 17.9%), Irish (65 | 12.0%), American (54 | 9.9%), English (50 | 9.2%), and Scottish (28 | 5.2%), together accounting for 54.1% of all Pippa Passes residents.
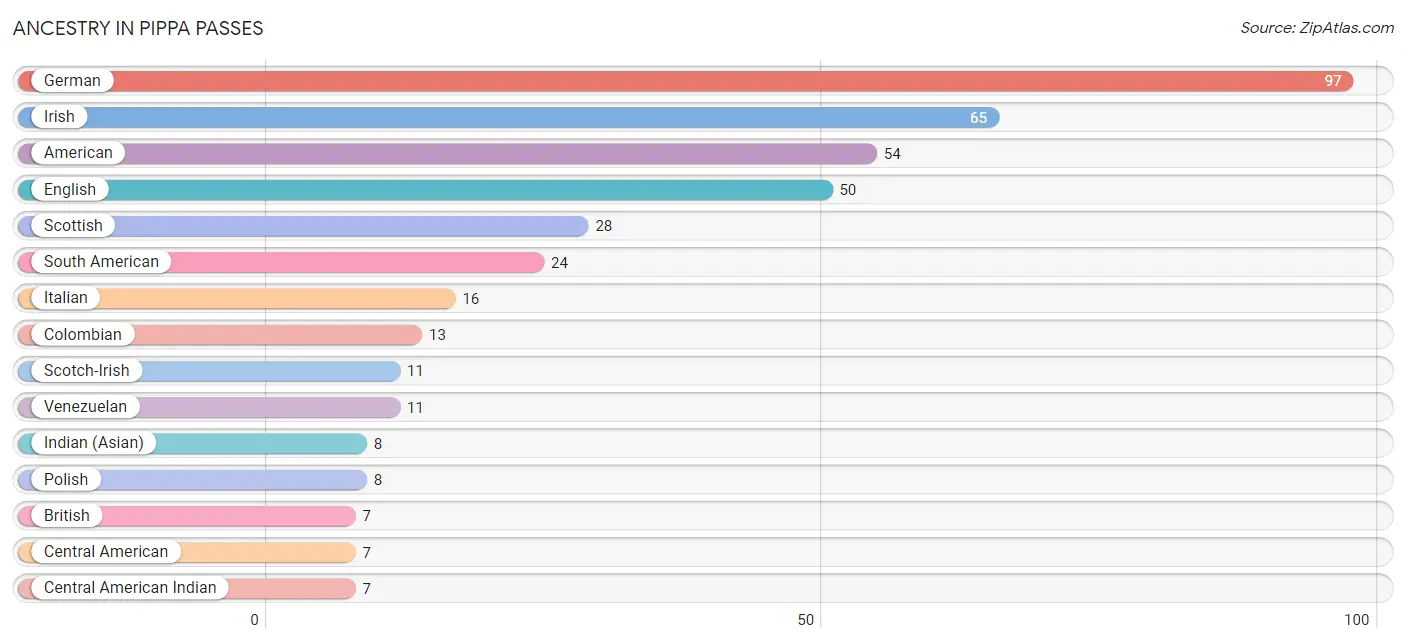
| Ancestry | # Population | % Population |
| American | 54 | 9.9% |
| Armenian | 3 | 0.5% |
| British | 7 | 1.3% |
| Central American | 7 | 1.3% |
| Central American Indian | 7 | 1.3% |
| Colombian | 13 | 2.4% |
| English | 50 | 9.2% |
| European | 1 | 0.2% |
| French | 6 | 1.1% |
| German | 97 | 17.9% |
| Guatemalan | 7 | 1.3% |
| Indian (Asian) | 8 | 1.5% |
| Irish | 65 | 12.0% |
| Italian | 16 | 2.9% |
| Polish | 8 | 1.5% |
| Scandinavian | 6 | 1.1% |
| Scotch-Irish | 11 | 2.0% |
| Scottish | 28 | 5.2% |
| South American | 24 | 4.4% |
| Venezuelan | 11 | 2.0% | View All 20 Rows |
Immigrants in Pippa Passes
The most numerous immigrant groups reported in Pippa Passes came from Latin America (18 | 3.3%), South America (11 | 2.0%), Venezuela (11 | 2.0%), Central America (7 | 1.3%), and Guatemala (7 | 1.3%), together accounting for 9.9% of all Pippa Passes residents.
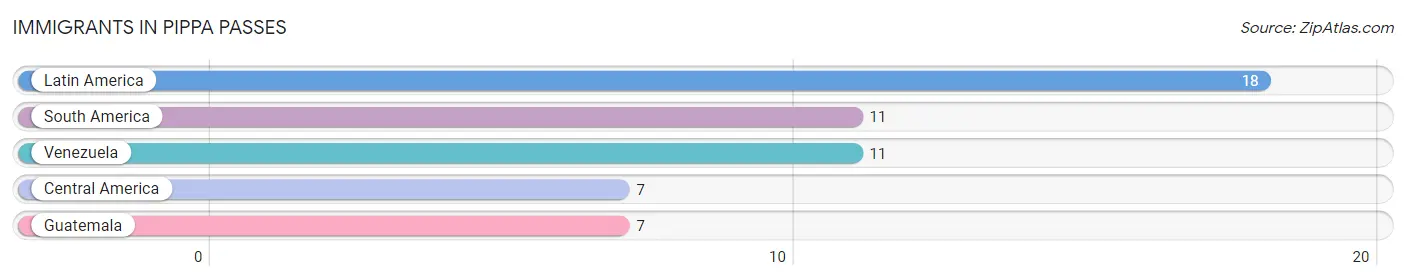
| Immigration Origin | # Population | % Population |
| Central America | 7 | 1.3% |
| Guatemala | 7 | 1.3% |
| Latin America | 18 | 3.3% |
| South America | 11 | 2.0% |
| Venezuela | 11 | 2.0% | View All 5 Rows |
Sex and Age in Pippa Passes
Sex and Age in Pippa Passes
The most populous age groups in Pippa Passes are 20 to 24 Years (109 | 42.7%) for men and 15 to 19 Years (129 | 44.8%) for women.
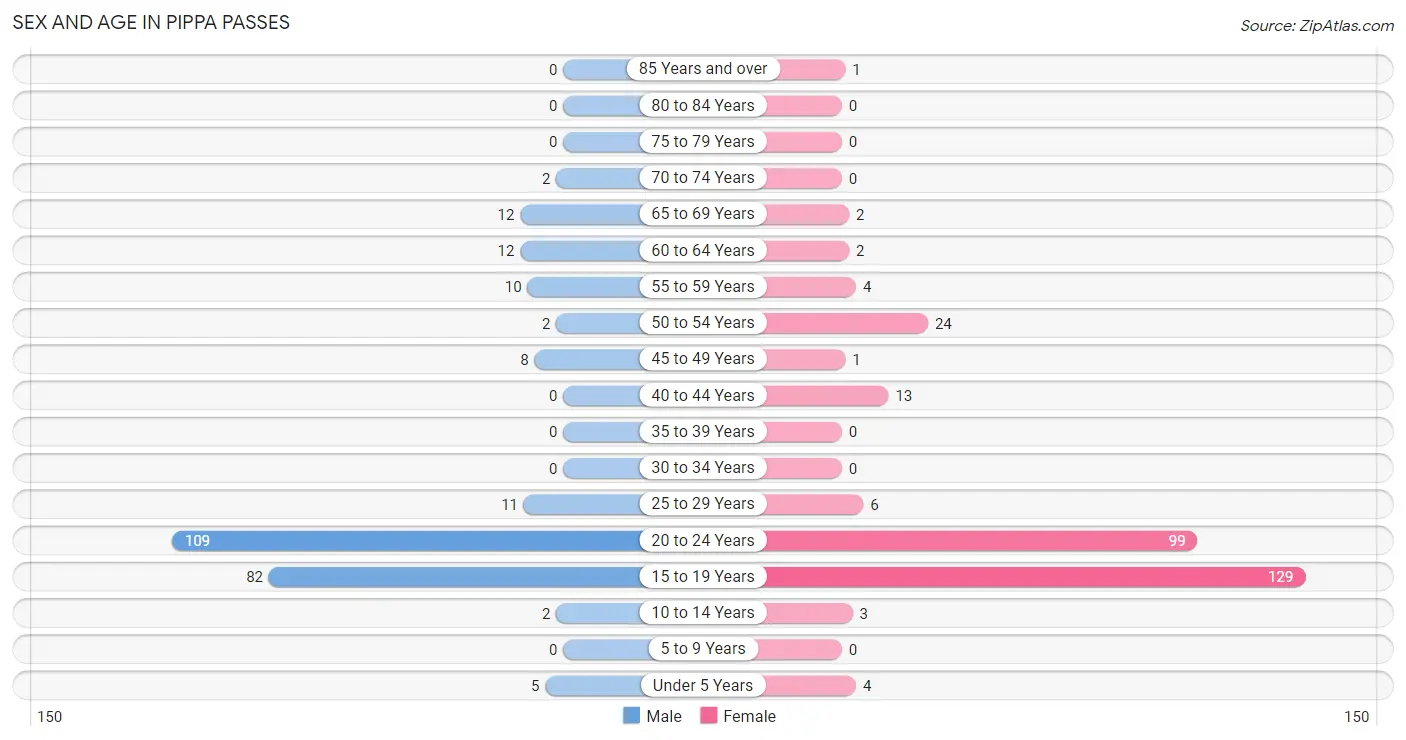
| Age Bracket | Male | Female |
| Under 5 Years | 5 (2.0%) | 4 (1.4%) |
| 5 to 9 Years | 0 (0.0%) | 0 (0.0%) |
| 10 to 14 Years | 2 (0.8%) | 3 (1.0%) |
| 15 to 19 Years | 82 (32.2%) | 129 (44.8%) |
| 20 to 24 Years | 109 (42.7%) | 99 (34.4%) |
| 25 to 29 Years | 11 (4.3%) | 6 (2.1%) |
| 30 to 34 Years | 0 (0.0%) | 0 (0.0%) |
| 35 to 39 Years | 0 (0.0%) | 0 (0.0%) |
| 40 to 44 Years | 0 (0.0%) | 13 (4.5%) |
| 45 to 49 Years | 8 (3.1%) | 1 (0.4%) |
| 50 to 54 Years | 2 (0.8%) | 24 (8.3%) |
| 55 to 59 Years | 10 (3.9%) | 4 (1.4%) |
| 60 to 64 Years | 12 (4.7%) | 2 (0.7%) |
| 65 to 69 Years | 12 (4.7%) | 2 (0.7%) |
| 70 to 74 Years | 2 (0.8%) | 0 (0.0%) |
| 75 to 79 Years | 0 (0.0%) | 0 (0.0%) |
| 80 to 84 Years | 0 (0.0%) | 0 (0.0%) |
| 85 Years and over | 0 (0.0%) | 1 (0.4%) |
| Total | 255 (100.0%) | 288 (100.0%) |
Families and Households in Pippa Passes
Median Family Size in Pippa Passes
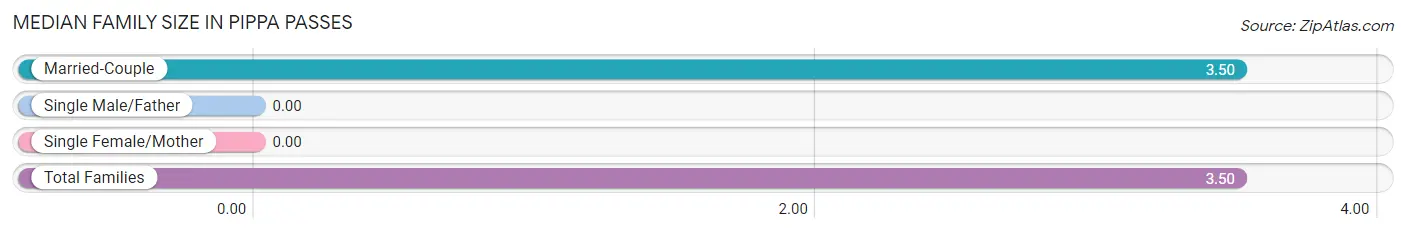
| Family Type | # Families | Family Size |
| Married-Couple | 26 (100.0%) | 3.50 |
| Single Male/Father | 0 (0.0%) | - |
| Single Female/Mother | 0 (0.0%) | - |
| Total Families | 26 (100.0%) | 3.50 |
Median Household Size in Pippa Passes
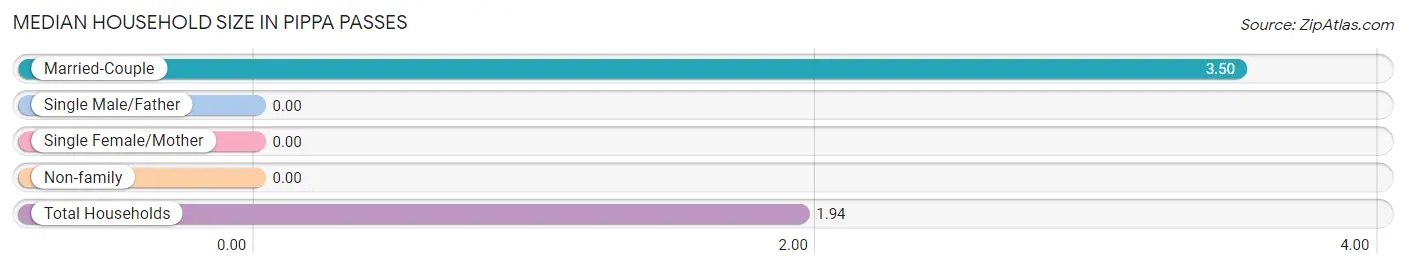
| Household Type | # Households | Household Size |
| Married-Couple | 26 (37.7%) | 3.50 |
| Single Male/Father | 0 (0.0%) | - |
| Single Female/Mother | 0 (0.0%) | - |
| Non-family | 43 (62.3%) | - |
| Total Households | 69 (100.0%) | 1.94 |
Household Size by Marriage Status in Pippa Passes
Out of a total of 69 households in Pippa Passes, 26 (37.7%) are family households, while 43 (62.3%) are nonfamily households. The most numerous type of family households are 3-person households, comprising 11, and the most common type of nonfamily households are 1-person households, comprising 43.
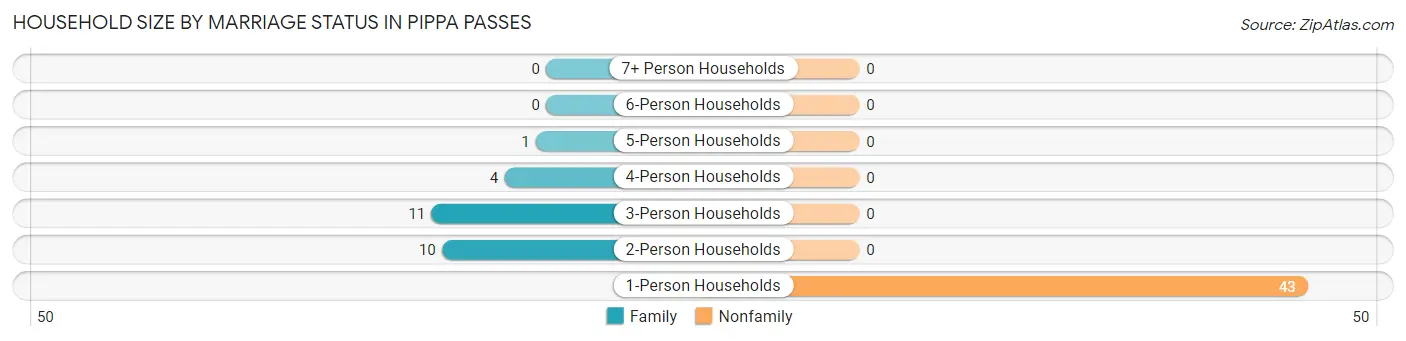
| Household Size | Family Households | Nonfamily Households |
| 1-Person Households | - | 43 (62.3%) |
| 2-Person Households | 10 (14.5%) | 0 (0.0%) |
| 3-Person Households | 11 (15.9%) | 0 (0.0%) |
| 4-Person Households | 4 (5.8%) | 0 (0.0%) |
| 5-Person Households | 1 (1.5%) | 0 (0.0%) |
| 6-Person Households | 0 (0.0%) | 0 (0.0%) |
| 7+ Person Households | 0 (0.0%) | 0 (0.0%) |
| Total | 26 (37.7%) | 43 (62.3%) |
Female Fertility in Pippa Passes
Fertility by Age in Pippa Passes
| Age Bracket | Women with Births | Births / 1,000 Women |
| 15 to 19 years | 0 (0.0%) | 0.0 |
| 20 to 34 years | 0 (0.0%) | 0.0 |
| 35 to 50 years | 0 (0.0%) | 0.0 |
| Total | 0 (0.0%) | 0.0 |
Fertility by Age by Marriage Status in Pippa Passes
| Age Bracket | Married | Unmarried |
| 15 to 19 years | 0 (0.0%) | 0 (0.0%) |
| 20 to 34 years | 0 (0.0%) | 0 (0.0%) |
| 35 to 50 years | 0 (0.0%) | 0 (0.0%) |
| Total | 0 (0.0%) | 0 (0.0%) |
Fertility by Education in Pippa Passes
| Educational Attainment | Women with Births | Births / 1,000 Women |
| Less than High School | 0 (0.0%) | 0.0 |
| High School Diploma | 0 (0.0%) | 0.0 |
| College or Associate's Degree | 0 (0.0%) | 0.0 |
| Bachelor's Degree | 0 (0.0%) | 0.0 |
| Graduate Degree | 0 (0.0%) | 0.0 |
| Total | 0 (0.0%) | 0.0 |
Fertility by Education by Marriage Status in Pippa Passes
| Educational Attainment | Married | Unmarried |
| Less than High School | 0 (0.0%) | 0 (0.0%) |
| High School Diploma | 0 (0.0%) | 0 (0.0%) |
| College or Associate's Degree | 0 (0.0%) | 0 (0.0%) |
| Bachelor's Degree | 0 (0.0%) | 0 (0.0%) |
| Graduate Degree | 0 (0.0%) | 0 (0.0%) |
| Total | 0 (0.0%) | 0 (0.0%) |
Employment Characteristics in Pippa Passes
Employment by Class of Employer in Pippa Passes
Among the 162 employed individuals in Pippa Passes, not-for-profit organizations (100 | 61.7%), private company employees (51 | 31.5%), and local government employees (9 | 5.6%) make up the most common classes of employment.
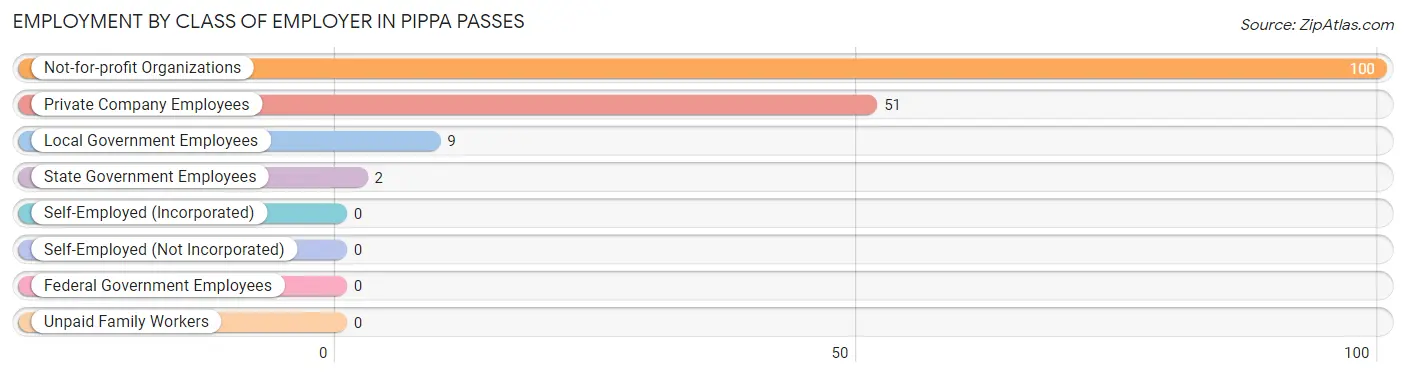
| Employer Class | # Employees | % Employees |
| Private Company Employees | 51 | 31.5% |
| Self-Employed (Incorporated) | 0 | 0.0% |
| Self-Employed (Not Incorporated) | 0 | 0.0% |
| Not-for-profit Organizations | 100 | 61.7% |
| Local Government Employees | 9 | 5.6% |
| State Government Employees | 2 | 1.2% |
| Federal Government Employees | 0 | 0.0% |
| Unpaid Family Workers | 0 | 0.0% |
| Total | 162 | 100.0% |
Employment Status by Age in Pippa Passes
According to the labor force statistics for Pippa Passes, out of the total population over 16 years of age (529), 33.6% or 178 individuals are in the labor force, with 2.8% or 5 of them unemployed. The age group with the highest labor force participation rate is 55 to 59 years, with 100.0% or 14 individuals in the labor force. Within the labor force, the 16 to 19 years age range has the highest percentage of unemployed individuals, with 7.8% or 5 of them being unemployed.
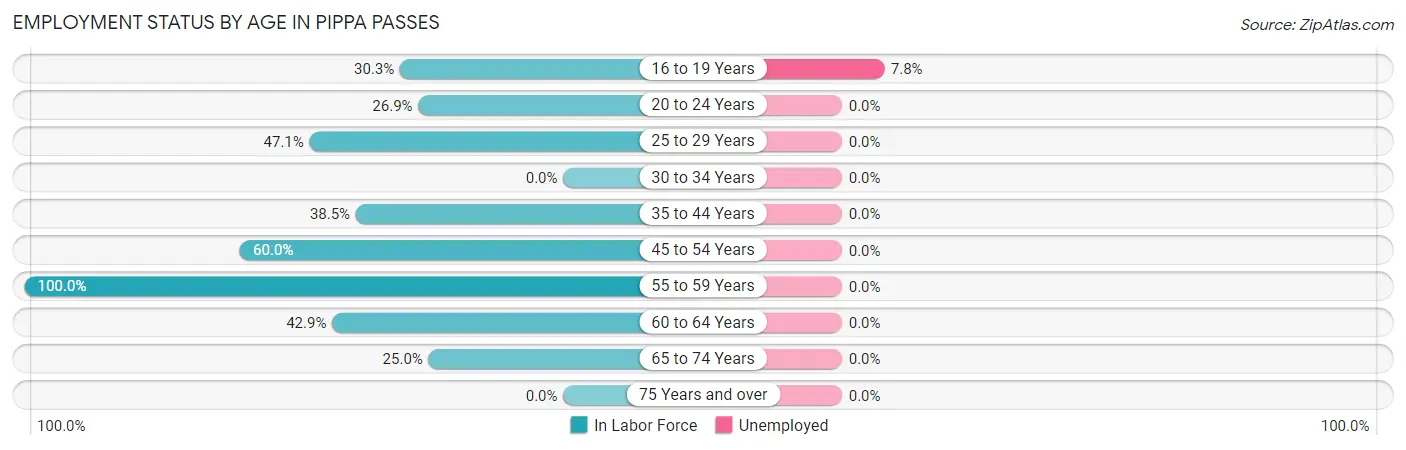
| Age Bracket | In Labor Force | Unemployed |
| 16 to 19 Years | 64 (30.3%) | 5 (7.8%) |
| 20 to 24 Years | 56 (26.9%) | 0 (0.0%) |
| 25 to 29 Years | 8 (47.1%) | 0 (0.0%) |
| 30 to 34 Years | 0 (0.0%) | 0 (0.0%) |
| 35 to 44 Years | 5 (38.5%) | 0 (0.0%) |
| 45 to 54 Years | 21 (60.0%) | 0 (0.0%) |
| 55 to 59 Years | 14 (100.0%) | 0 (0.0%) |
| 60 to 64 Years | 6 (42.9%) | 0 (0.0%) |
| 65 to 74 Years | 4 (25.0%) | 0 (0.0%) |
| 75 Years and over | 0 (0.0%) | 0 (0.0%) |
| Total | 178 (33.6%) | 5 (2.8%) |
Employment Status by Educational Attainment in Pippa Passes
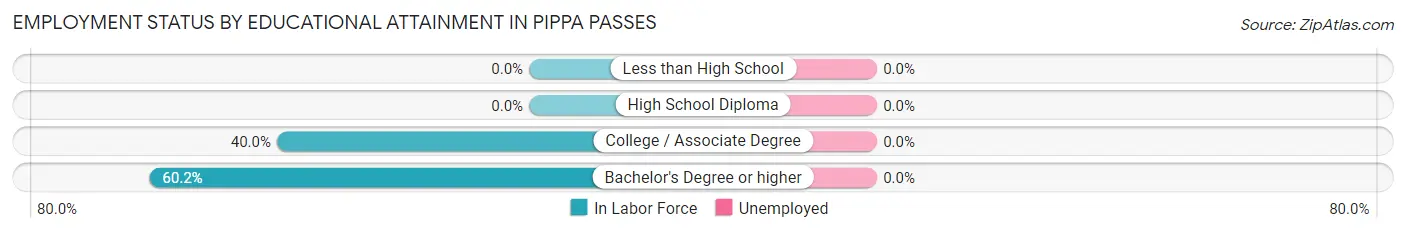
| Educational Attainment | In Labor Force | Unemployed |
| Less than High School | 0 (0.0%) | 0 (0.0%) |
| High School Diploma | 0 (0.0%) | 0 (0.0%) |
| College / Associate Degree | 4 (40.0%) | 0 (0.0%) |
| Bachelor's Degree or higher | 50 (60.2%) | 0 (0.0%) |
| Total | 54 (58.1%) | 0 (0.0%) |
Employment Occupations by Sex in Pippa Passes
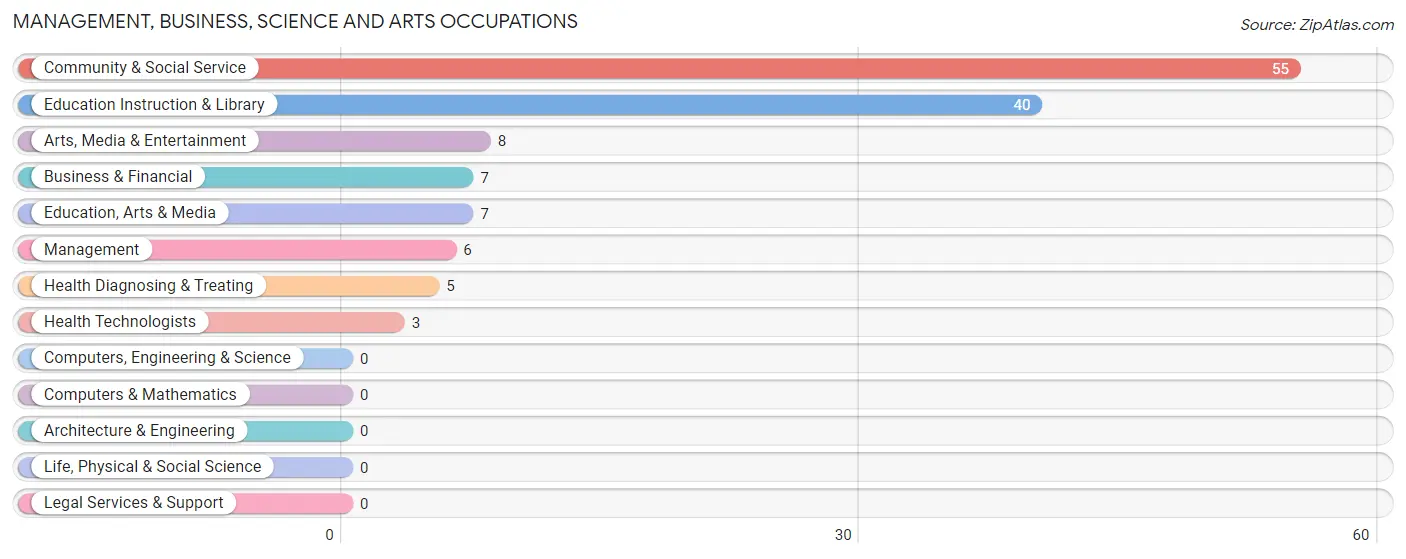
Management, Business, Science and Arts Occupations
The most common Management, Business, Science and Arts occupations in Pippa Passes are Community & Social Service (55 | 31.8%), Education Instruction & Library (40 | 23.1%), Arts, Media & Entertainment (8 | 4.6%), Business & Financial (7 | 4.1%), and Education, Arts & Media (7 | 4.1%).
Management, Business, Science and Arts Occupations by Sex
Within the Management, Business, Science and Arts occupations in Pippa Passes, the most male-oriented occupations are Arts, Media & Entertainment (100.0%), Management (83.3%), and Education Instruction & Library (70.0%), while the most female-oriented occupations are Education, Arts & Media (100.0%), Health Technologists (100.0%), and Business & Financial (85.7%).
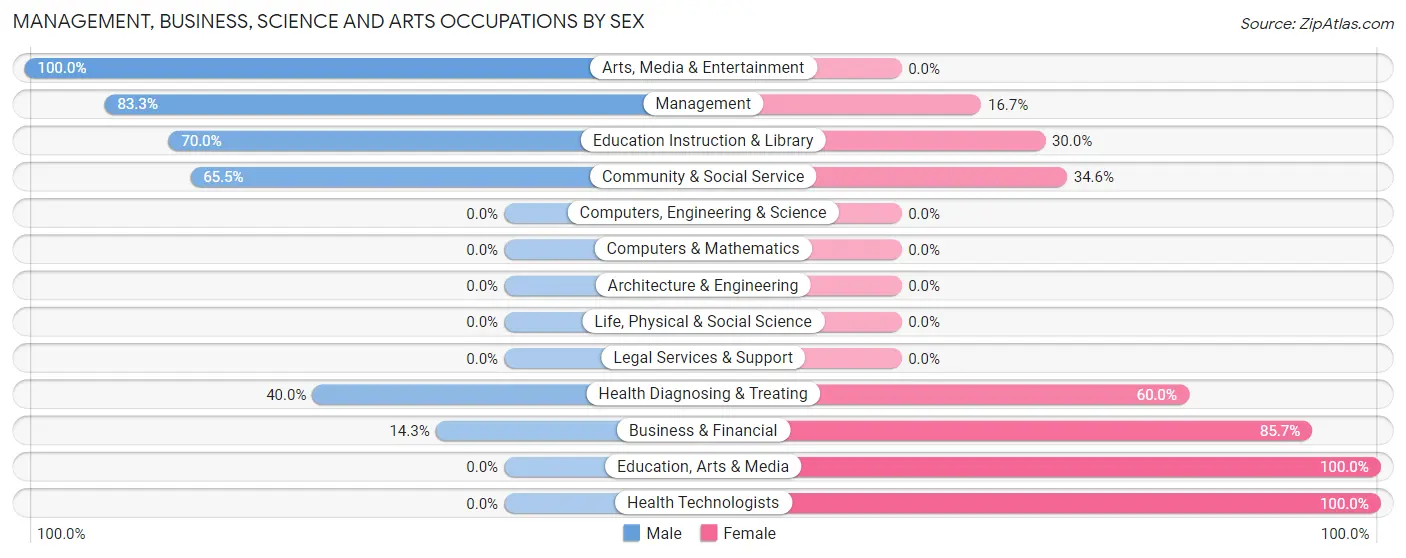
| Occupation | Male | Female |
| Management | 5 (83.3%) | 1 (16.7%) |
| Business & Financial | 1 (14.3%) | 6 (85.7%) |
| Computers, Engineering & Science | 0 (0.0%) | 0 (0.0%) |
| Computers & Mathematics | 0 (0.0%) | 0 (0.0%) |
| Architecture & Engineering | 0 (0.0%) | 0 (0.0%) |
| Life, Physical & Social Science | 0 (0.0%) | 0 (0.0%) |
| Community & Social Service | 36 (65.4%) | 19 (34.5%) |
| Education, Arts & Media | 0 (0.0%) | 7 (100.0%) |
| Legal Services & Support | 0 (0.0%) | 0 (0.0%) |
| Education Instruction & Library | 28 (70.0%) | 12 (30.0%) |
| Arts, Media & Entertainment | 8 (100.0%) | 0 (0.0%) |
| Health Diagnosing & Treating | 2 (40.0%) | 3 (60.0%) |
| Health Technologists | 0 (0.0%) | 3 (100.0%) |
| Total (Category) | 44 (60.3%) | 29 (39.7%) |
| Total (Overall) | 73 (42.2%) | 100 (57.8%) |
Services Occupations
The most common Services occupations in Pippa Passes are Food Preparation & Serving (28 | 16.2%), Personal Care & Service (22 | 12.7%), Healthcare Support (9 | 5.2%), Cleaning & Maintenance (9 | 5.2%), and Security & Protection (6 | 3.5%).
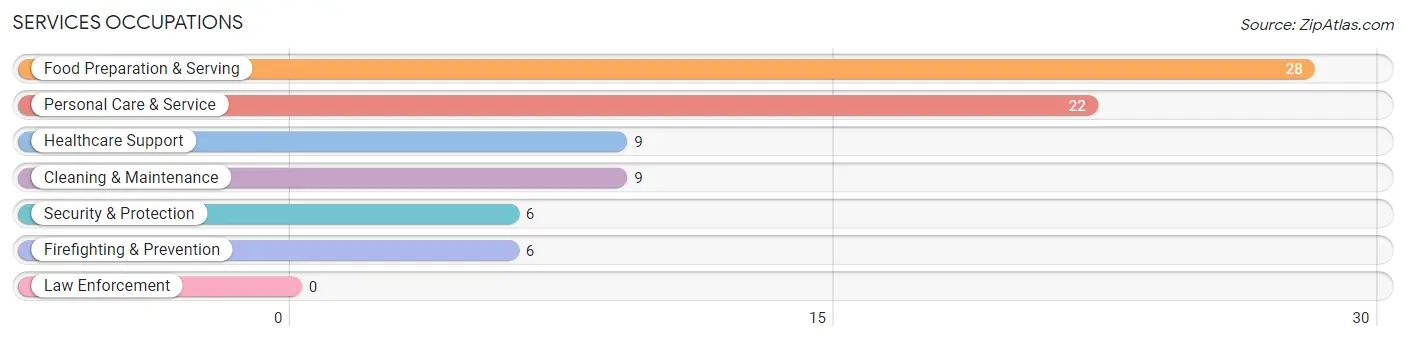
Services Occupations by Sex
Within the Services occupations in Pippa Passes, the most male-oriented occupations are Security & Protection (100.0%), Firefighting & Prevention (100.0%), and Cleaning & Maintenance (77.8%), while the most female-oriented occupations are Healthcare Support (100.0%), Personal Care & Service (81.8%), and Food Preparation & Serving (75.0%).
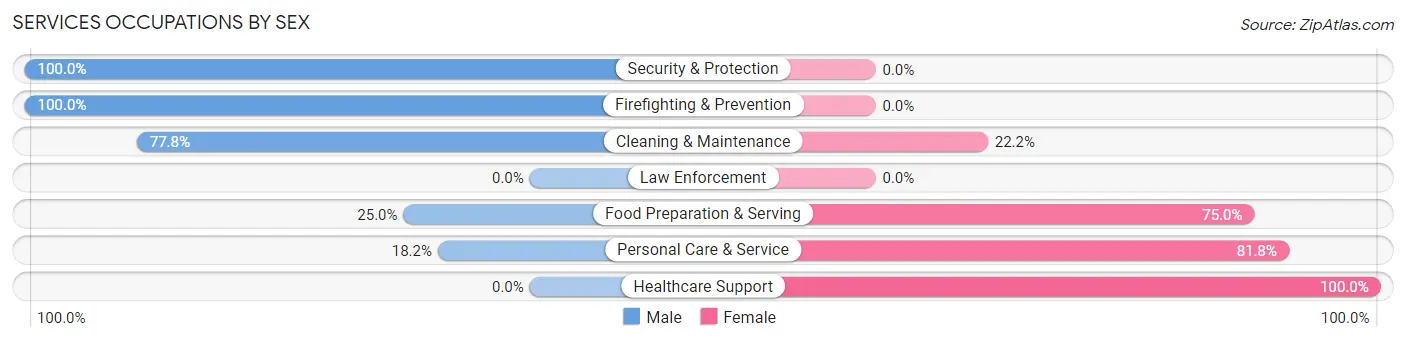
| Occupation | Male | Female |
| Healthcare Support | 0 (0.0%) | 9 (100.0%) |
| Security & Protection | 6 (100.0%) | 0 (0.0%) |
| Firefighting & Prevention | 6 (100.0%) | 0 (0.0%) |
| Law Enforcement | 0 (0.0%) | 0 (0.0%) |
| Food Preparation & Serving | 7 (25.0%) | 21 (75.0%) |
| Cleaning & Maintenance | 7 (77.8%) | 2 (22.2%) |
| Personal Care & Service | 4 (18.2%) | 18 (81.8%) |
| Total (Category) | 24 (32.4%) | 50 (67.6%) |
| Total (Overall) | 73 (42.2%) | 100 (57.8%) |
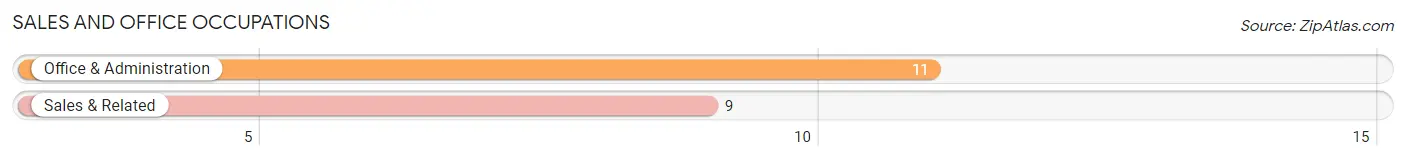
Sales and Office Occupations
The most common Sales and Office occupations in Pippa Passes are Office & Administration (11 | 6.4%), and Sales & Related (9 | 5.2%).
Sales and Office Occupations by Sex
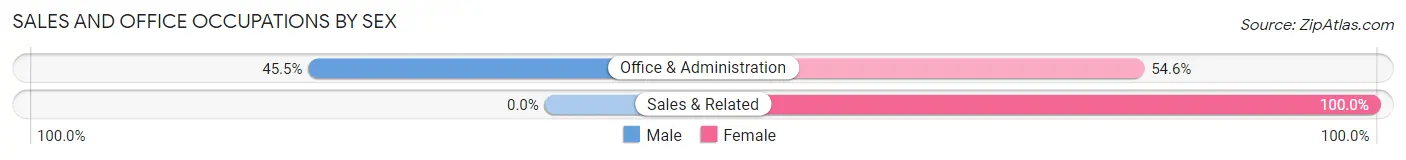
| Occupation | Male | Female |
| Sales & Related | 0 (0.0%) | 9 (100.0%) |
| Office & Administration | 5 (45.5%) | 6 (54.5%) |
| Total (Category) | 5 (25.0%) | 15 (75.0%) |
| Total (Overall) | 73 (42.2%) | 100 (57.8%) |
Natural Resources, Construction and Maintenance Occupations
Natural Resources, Construction and Maintenance Occupations by Sex
| Occupation | Male | Female |
| Farming, Fishing & Forestry | 0 (0.0%) | 0 (0.0%) |
| Construction & Extraction | 0 (0.0%) | 0 (0.0%) |
| Installation, Maintenance & Repair | 0 (0.0%) | 0 (0.0%) |
| Total (Category) | 0 (0.0%) | 0 (0.0%) |
| Total (Overall) | 73 (42.2%) | 100 (57.8%) |
Production, Transportation and Moving Occupations
The most common Production, Transportation and Moving occupations in Pippa Passes are , and Material Moving (6 | 3.5%).
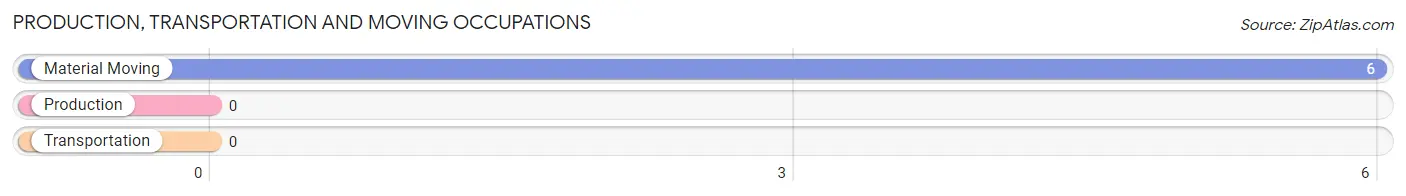
Production, Transportation and Moving Occupations by Sex
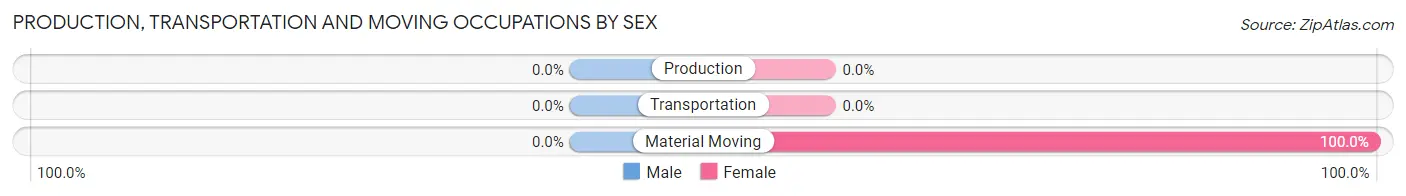
| Occupation | Male | Female |
| Production | 0 (0.0%) | 0 (0.0%) |
| Transportation | 0 (0.0%) | 0 (0.0%) |
| Material Moving | 0 (0.0%) | 6 (100.0%) |
| Total (Category) | 0 (0.0%) | 6 (100.0%) |
| Total (Overall) | 73 (42.2%) | 100 (57.8%) |
Employment Industries by Sex in Pippa Passes
Employment Industries in Pippa Passes
The major employment industries in Pippa Passes include Educational Services (106 | 61.3%), Accommodation & Food Services (11 | 6.4%), Transportation & Warehousing (9 | 5.2%), Retail Trade (8 | 4.6%), and Administrative & Support (7 | 4.1%).
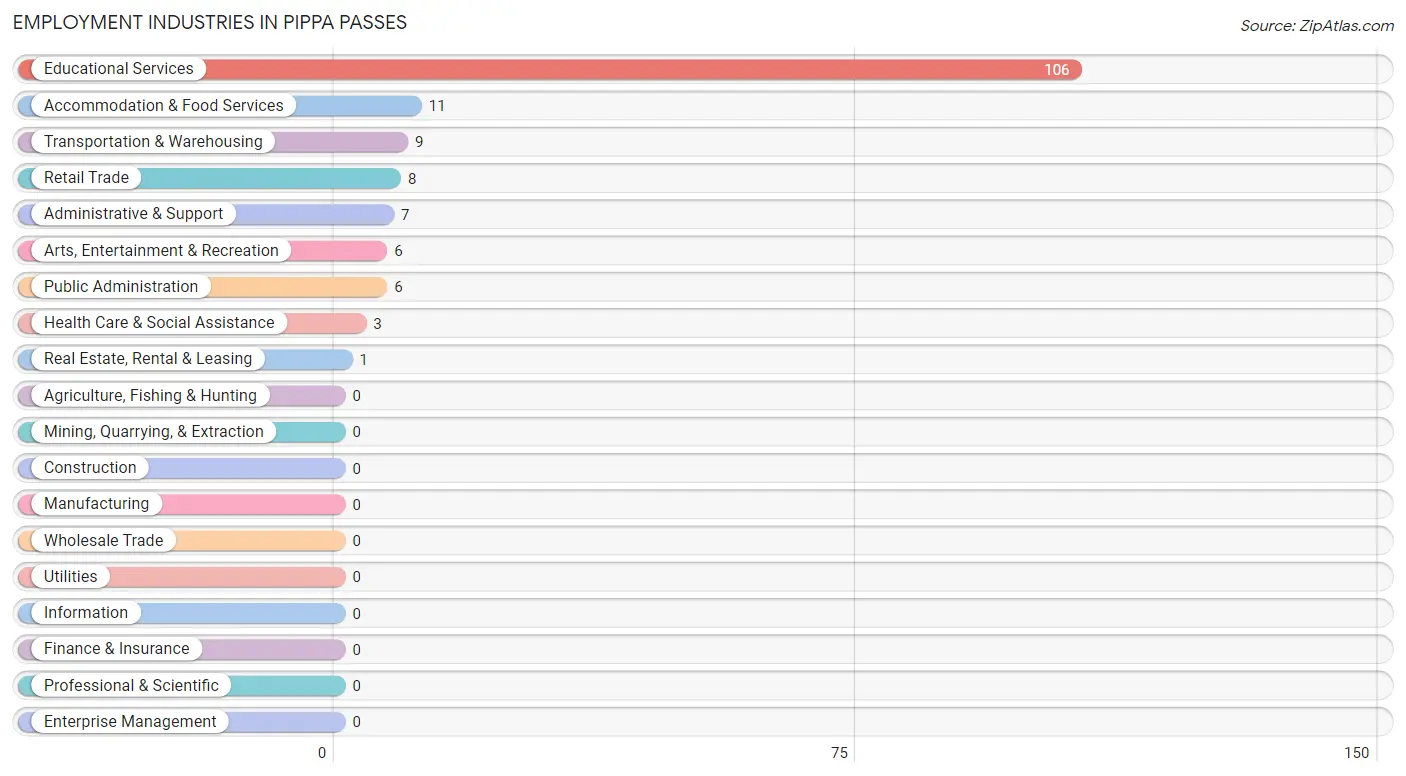
Employment Industries by Sex in Pippa Passes
The Pippa Passes industries that see more men than women are Real Estate, Rental & Leasing (100.0%), Public Administration (100.0%), and Administrative & Support (71.4%), whereas the industries that tend to have a higher number of women are Transportation & Warehousing (100.0%), Health Care & Social Assistance (100.0%), and Arts, Entertainment & Recreation (100.0%).
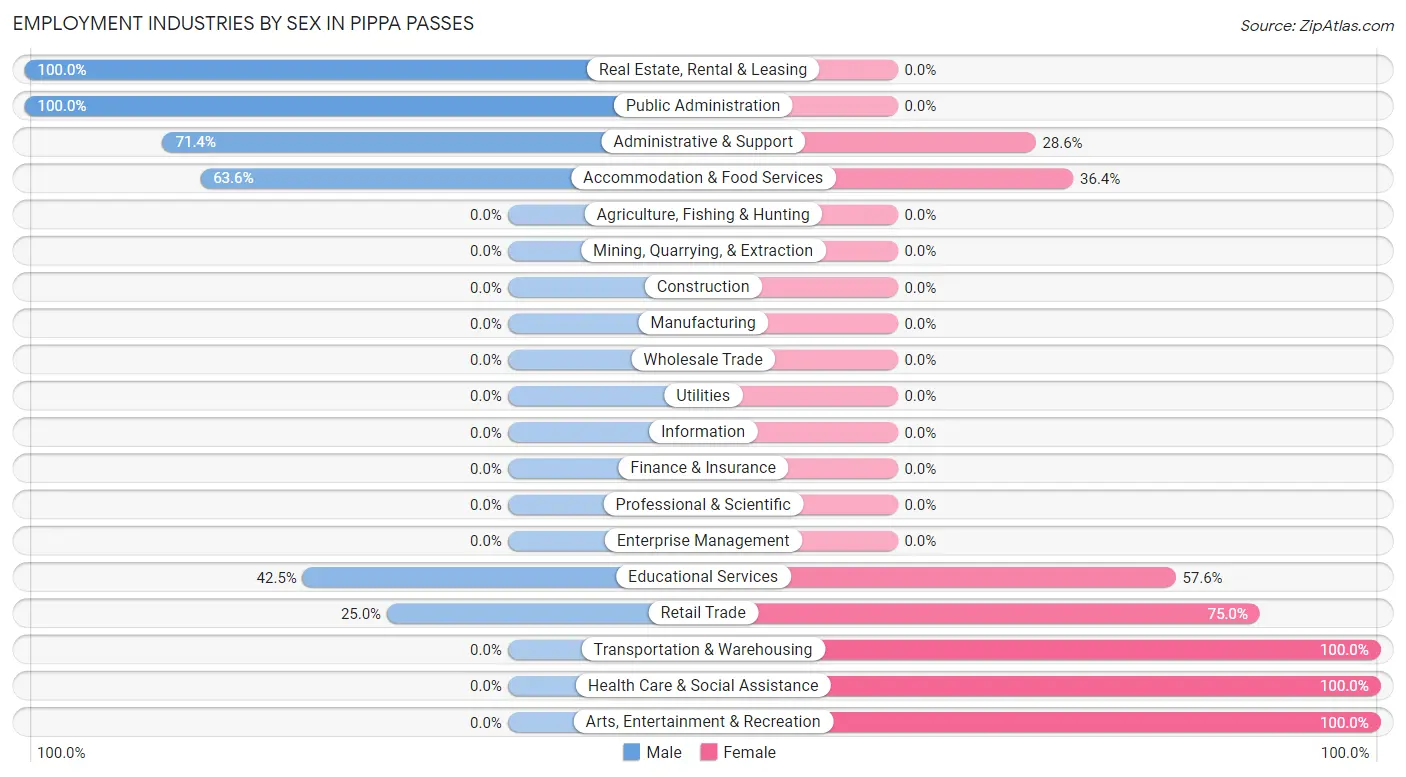
| Industry | Male | Female |
| Agriculture, Fishing & Hunting | 0 (0.0%) | 0 (0.0%) |
| Mining, Quarrying, & Extraction | 0 (0.0%) | 0 (0.0%) |
| Construction | 0 (0.0%) | 0 (0.0%) |
| Manufacturing | 0 (0.0%) | 0 (0.0%) |
| Wholesale Trade | 0 (0.0%) | 0 (0.0%) |
| Retail Trade | 2 (25.0%) | 6 (75.0%) |
| Transportation & Warehousing | 0 (0.0%) | 9 (100.0%) |
| Utilities | 0 (0.0%) | 0 (0.0%) |
| Information | 0 (0.0%) | 0 (0.0%) |
| Finance & Insurance | 0 (0.0%) | 0 (0.0%) |
| Real Estate, Rental & Leasing | 1 (100.0%) | 0 (0.0%) |
| Professional & Scientific | 0 (0.0%) | 0 (0.0%) |
| Enterprise Management | 0 (0.0%) | 0 (0.0%) |
| Administrative & Support | 5 (71.4%) | 2 (28.6%) |
| Educational Services | 45 (42.4%) | 61 (57.6%) |
| Health Care & Social Assistance | 0 (0.0%) | 3 (100.0%) |
| Arts, Entertainment & Recreation | 0 (0.0%) | 6 (100.0%) |
| Accommodation & Food Services | 7 (63.6%) | 4 (36.4%) |
| Public Administration | 6 (100.0%) | 0 (0.0%) |
| Total | 73 (42.2%) | 100 (57.8%) |
Education in Pippa Passes
School Enrollment in Pippa Passes
The most common levels of schooling among the 433 students in Pippa Passes are college / undergraduate (412 | 95.2%), graduate / professional (11 | 2.5%), and high school (7 | 1.6%).
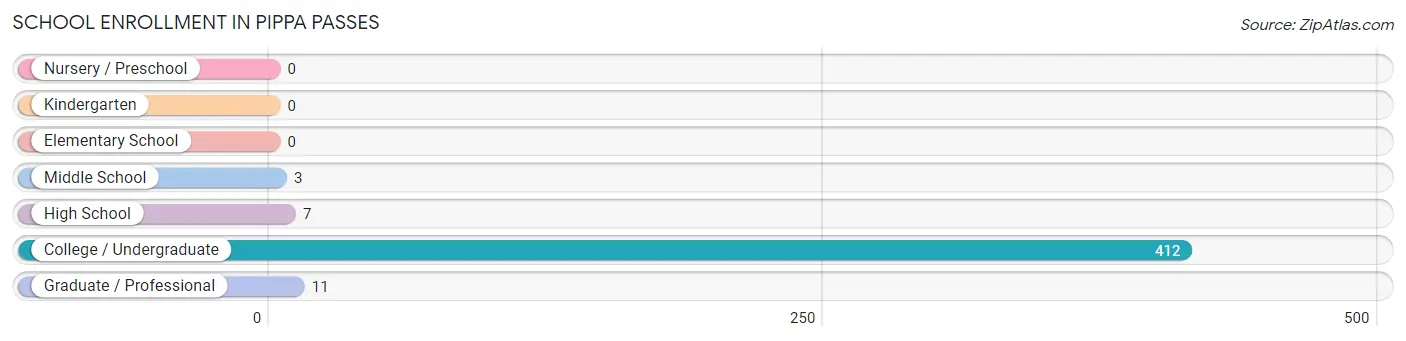
| School Level | # Students | % Students |
| Nursery / Preschool | 0 | 0.0% |
| Kindergarten | 0 | 0.0% |
| Elementary School | 0 | 0.0% |
| Middle School | 3 | 0.7% |
| High School | 7 | 1.6% |
| College / Undergraduate | 412 | 95.2% |
| Graduate / Professional | 11 | 2.5% |
| Total | 433 | 100.0% |
School Enrollment by Age by Funding Source in Pippa Passes
Out of a total of 433 students who are enrolled in schools in Pippa Passes, 218 (50.3%) attend a private institution, while the remaining 215 (49.7%) are enrolled in public schools. The age group of 25 to 34 year olds has the highest likelihood of being enrolled in private schools, with 8 (100.0% in the age bracket) enrolled. Conversely, the age group of 10 to 14 year olds has the lowest likelihood of being enrolled in a private school, with 3 (100.0% in the age bracket) attending a public institution.
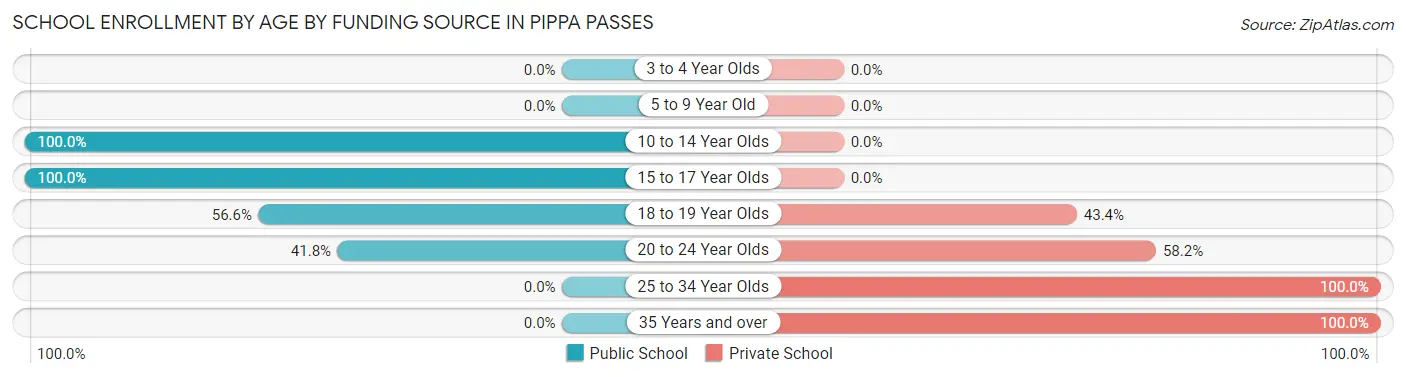
| Age Bracket | Public School | Private School |
| 3 to 4 Year Olds | 0 (0.0%) | 0 (0.0%) |
| 5 to 9 Year Old | 0 (0.0%) | 0 (0.0%) |
| 10 to 14 Year Olds | 3 (100.0%) | 0 (0.0%) |
| 15 to 17 Year Olds | 13 (100.0%) | 0 (0.0%) |
| 18 to 19 Year Olds | 112 (56.6%) | 86 (43.4%) |
| 20 to 24 Year Olds | 87 (41.8%) | 121 (58.2%) |
| 25 to 34 Year Olds | 0 (0.0%) | 8 (100.0%) |
| 35 Years and over | 0 (0.0%) | 3 (100.0%) |
| Total | 215 (49.7%) | 218 (50.3%) |
Educational Attainment by Field of Study in Pippa Passes
Liberal arts & history (22 | 23.2%), education (13 | 13.7%), literature & languages (10 | 10.5%), physical & health sciences (8 | 8.4%), and business (8 | 8.4%) are the most common fields of study among 95 individuals in Pippa Passes who have obtained a bachelor's degree or higher.
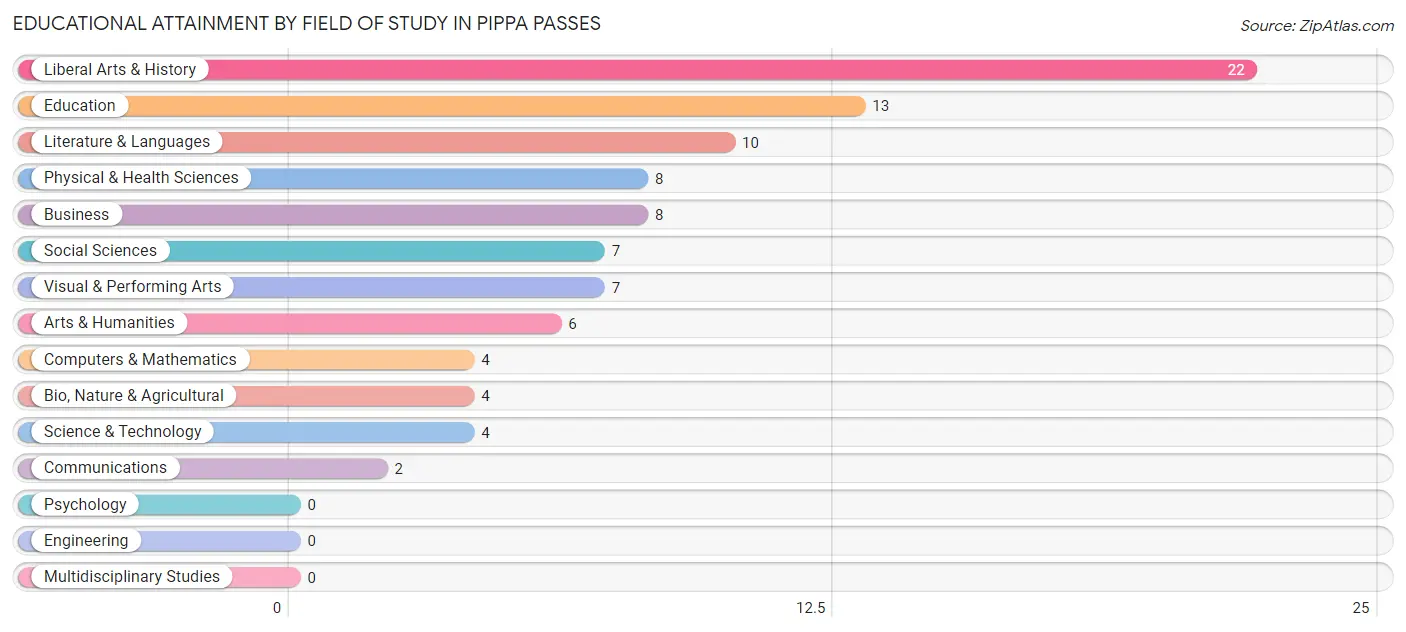
| Field of Study | # Graduates | % Graduates |
| Computers & Mathematics | 4 | 4.2% |
| Bio, Nature & Agricultural | 4 | 4.2% |
| Physical & Health Sciences | 8 | 8.4% |
| Psychology | 0 | 0.0% |
| Social Sciences | 7 | 7.4% |
| Engineering | 0 | 0.0% |
| Multidisciplinary Studies | 0 | 0.0% |
| Science & Technology | 4 | 4.2% |
| Business | 8 | 8.4% |
| Education | 13 | 13.7% |
| Literature & Languages | 10 | 10.5% |
| Liberal Arts & History | 22 | 23.2% |
| Visual & Performing Arts | 7 | 7.4% |
| Communications | 2 | 2.1% |
| Arts & Humanities | 6 | 6.3% |
| Total | 95 | 100.0% |
Transportation & Commute in Pippa Passes
Vehicle Availability by Sex in Pippa Passes
The most prevalent vehicle ownership categories in Pippa Passes are males with 2 vehicles (16, accounting for 43.2%) and females with 2 vehicles (15, making up 69.6%).
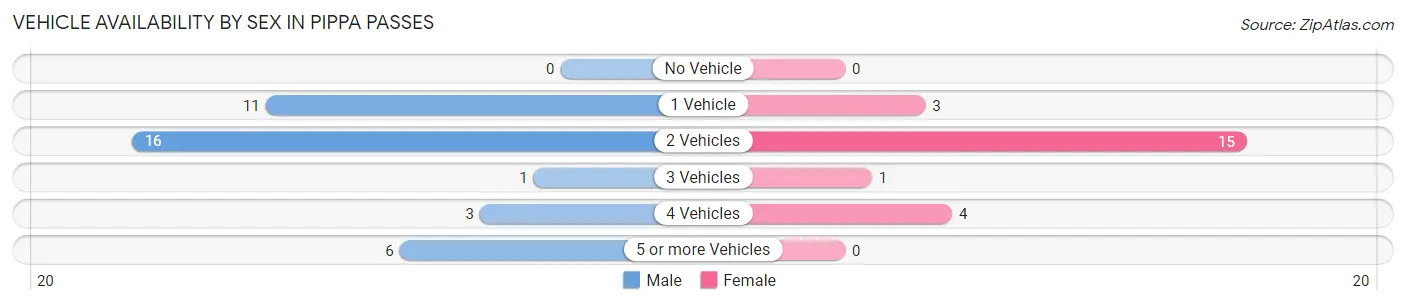
| Vehicles Available | Male | Female |
| No Vehicle | 0 (0.0%) | 0 (0.0%) |
| 1 Vehicle | 11 (29.7%) | 3 (13.0%) |
| 2 Vehicles | 16 (43.2%) | 15 (65.2%) |
| 3 Vehicles | 1 (2.7%) | 1 (4.3%) |
| 4 Vehicles | 3 (8.1%) | 4 (17.4%) |
| 5 or more Vehicles | 6 (16.2%) | 0 (0.0%) |
| Total | 37 (100.0%) | 23 (100.0%) |
Commute Time in Pippa Passes
The most frequently occuring commute durations in Pippa Passes are 5 to 9 minutes (71 commuters, 47.0%), less than 5 minutes (36 commuters, 23.8%), and 10 to 14 minutes (22 commuters, 14.6%).
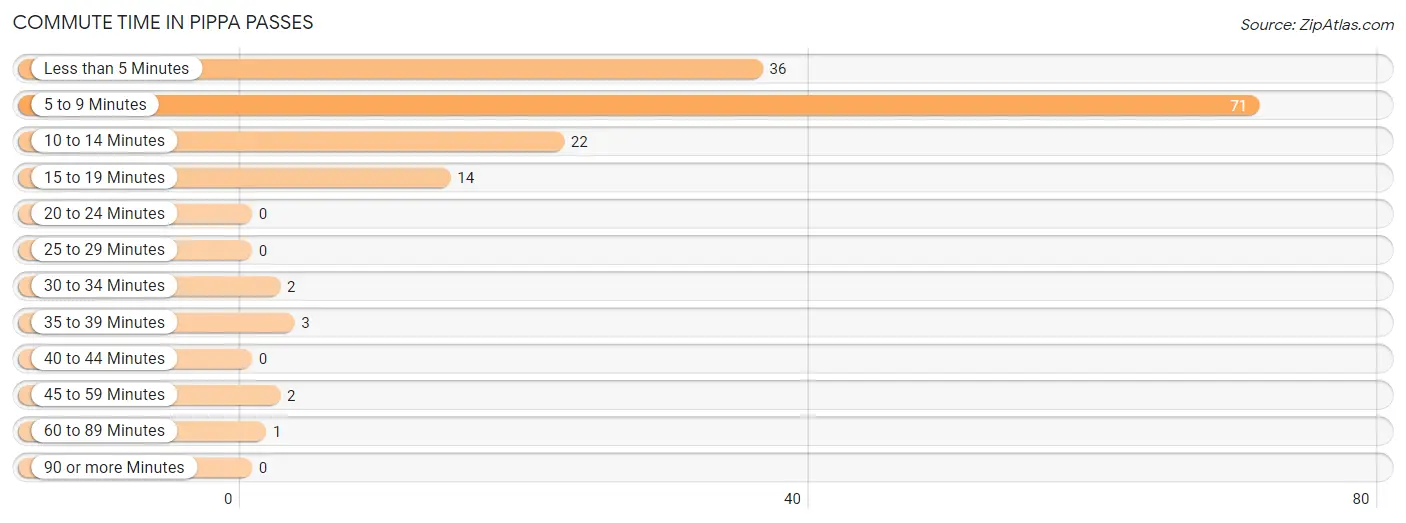
| Commute Time | # Commuters | % Commuters |
| Less than 5 Minutes | 36 | 23.8% |
| 5 to 9 Minutes | 71 | 47.0% |
| 10 to 14 Minutes | 22 | 14.6% |
| 15 to 19 Minutes | 14 | 9.3% |
| 20 to 24 Minutes | 0 | 0.0% |
| 25 to 29 Minutes | 0 | 0.0% |
| 30 to 34 Minutes | 2 | 1.3% |
| 35 to 39 Minutes | 3 | 2.0% |
| 40 to 44 Minutes | 0 | 0.0% |
| 45 to 59 Minutes | 2 | 1.3% |
| 60 to 89 Minutes | 1 | 0.7% |
| 90 or more Minutes | 0 | 0.0% |
Commute Time by Sex in Pippa Passes
The most common commute times in Pippa Passes are 5 to 9 minutes (30 commuters, 49.2%) for males and 5 to 9 minutes (41 commuters, 45.6%) for females.
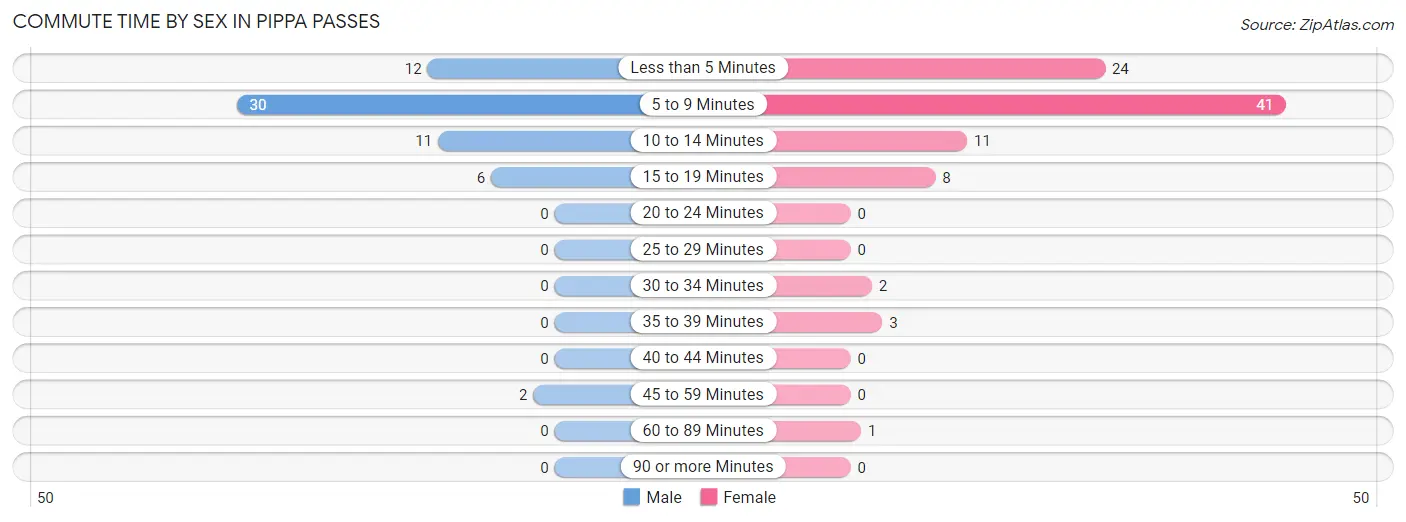
| Commute Time | Male | Female |
| Less than 5 Minutes | 12 (19.7%) | 24 (26.7%) |
| 5 to 9 Minutes | 30 (49.2%) | 41 (45.6%) |
| 10 to 14 Minutes | 11 (18.0%) | 11 (12.2%) |
| 15 to 19 Minutes | 6 (9.8%) | 8 (8.9%) |
| 20 to 24 Minutes | 0 (0.0%) | 0 (0.0%) |
| 25 to 29 Minutes | 0 (0.0%) | 0 (0.0%) |
| 30 to 34 Minutes | 0 (0.0%) | 2 (2.2%) |
| 35 to 39 Minutes | 0 (0.0%) | 3 (3.3%) |
| 40 to 44 Minutes | 0 (0.0%) | 0 (0.0%) |
| 45 to 59 Minutes | 2 (3.3%) | 0 (0.0%) |
| 60 to 89 Minutes | 0 (0.0%) | 1 (1.1%) |
| 90 or more Minutes | 0 (0.0%) | 0 (0.0%) |
Time of Departure to Work by Sex in Pippa Passes
The most frequent times of departure to work in Pippa Passes are 9:00 AM to 9:59 AM (16, 26.2%) for males and 12:00 PM to 3:59 PM (28, 31.1%) for females.
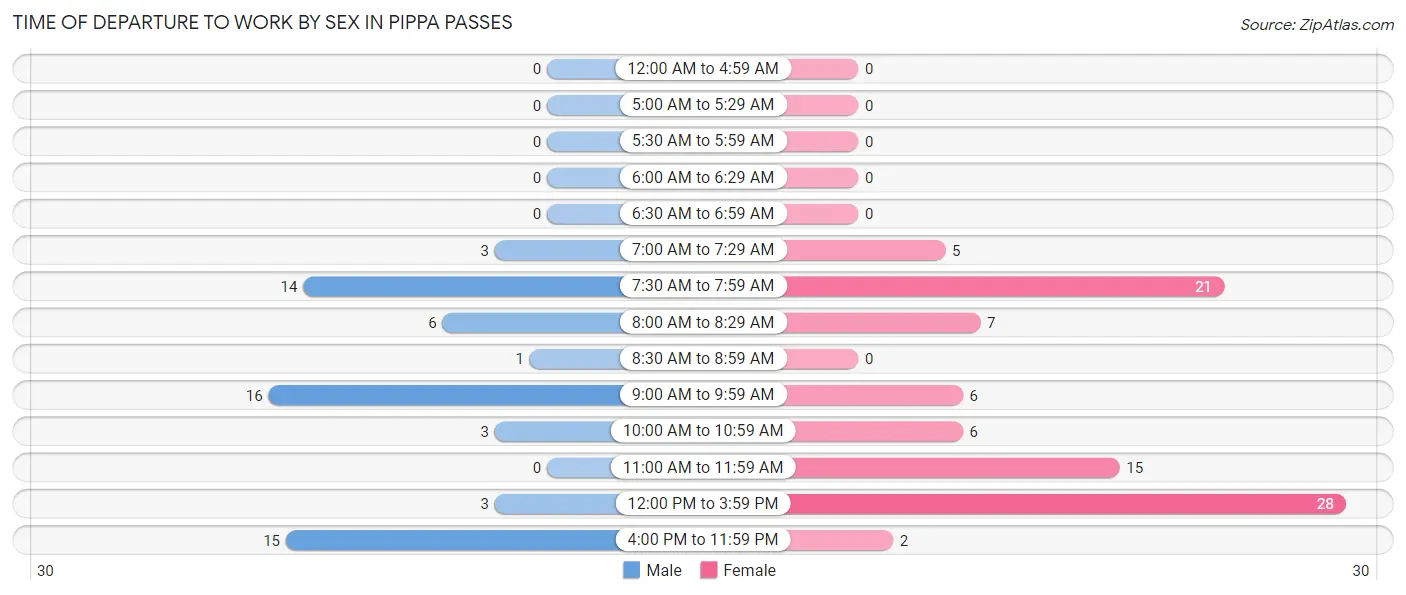
| Time of Departure | Male | Female |
| 12:00 AM to 4:59 AM | 0 (0.0%) | 0 (0.0%) |
| 5:00 AM to 5:29 AM | 0 (0.0%) | 0 (0.0%) |
| 5:30 AM to 5:59 AM | 0 (0.0%) | 0 (0.0%) |
| 6:00 AM to 6:29 AM | 0 (0.0%) | 0 (0.0%) |
| 6:30 AM to 6:59 AM | 0 (0.0%) | 0 (0.0%) |
| 7:00 AM to 7:29 AM | 3 (4.9%) | 5 (5.6%) |
| 7:30 AM to 7:59 AM | 14 (23.0%) | 21 (23.3%) |
| 8:00 AM to 8:29 AM | 6 (9.8%) | 7 (7.8%) |
| 8:30 AM to 8:59 AM | 1 (1.6%) | 0 (0.0%) |
| 9:00 AM to 9:59 AM | 16 (26.2%) | 6 (6.7%) |
| 10:00 AM to 10:59 AM | 3 (4.9%) | 6 (6.7%) |
| 11:00 AM to 11:59 AM | 0 (0.0%) | 15 (16.7%) |
| 12:00 PM to 3:59 PM | 3 (4.9%) | 28 (31.1%) |
| 4:00 PM to 11:59 PM | 15 (24.6%) | 2 (2.2%) |
| Total | 61 (100.0%) | 90 (100.0%) |
Housing Occupancy in Pippa Passes
Occupancy by Ownership in Pippa Passes
Of the total 69 dwellings in Pippa Passes, owner-occupied units account for 9 (13.0%), while renter-occupied units make up 60 (87.0%).
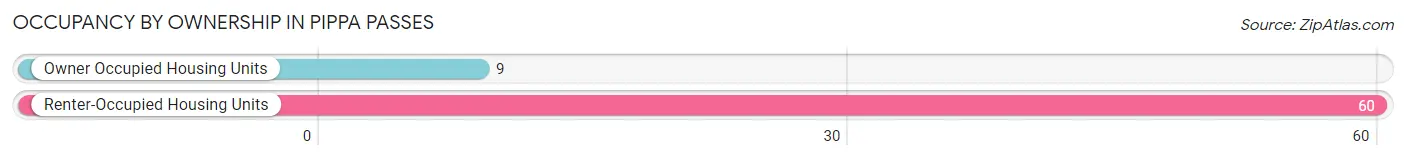
| Occupancy | # Housing Units | % Housing Units |
| Owner Occupied Housing Units | 9 | 13.0% |
| Renter-Occupied Housing Units | 60 | 87.0% |
| Total Occupied Housing Units | 69 | 100.0% |
Occupancy by Household Size in Pippa Passes
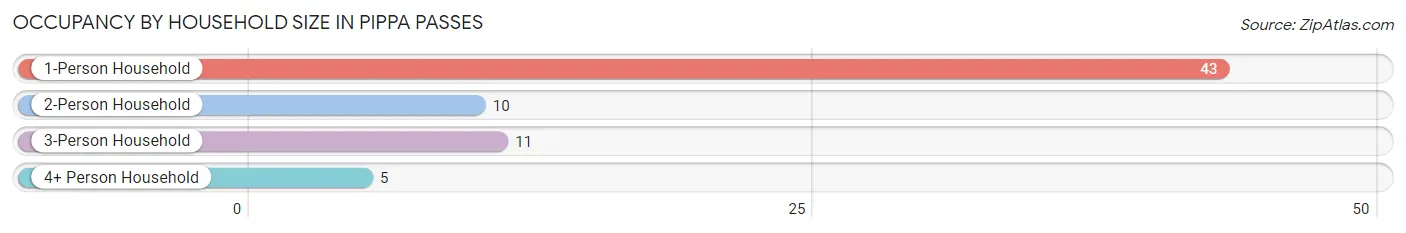
| Household Size | # Housing Units | % Housing Units |
| 1-Person Household | 43 | 62.3% |
| 2-Person Household | 10 | 14.5% |
| 3-Person Household | 11 | 15.9% |
| 4+ Person Household | 5 | 7.2% |
| Total Housing Units | 69 | 100.0% |
Occupancy by Ownership by Household Size in Pippa Passes
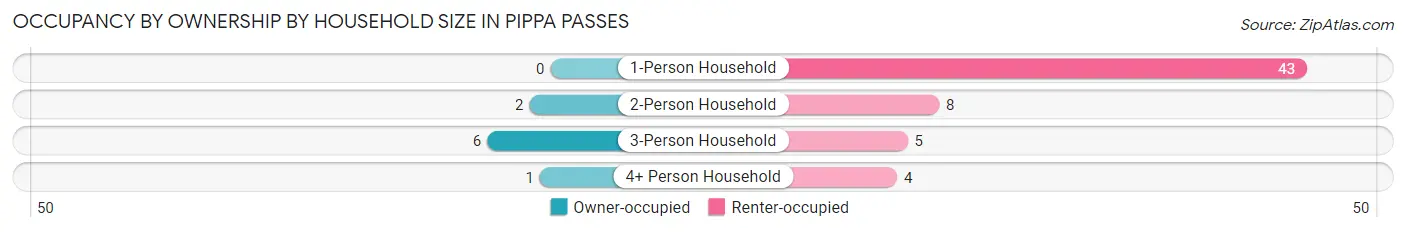
| Household Size | Owner-occupied | Renter-occupied |
| 1-Person Household | 0 (0.0%) | 43 (100.0%) |
| 2-Person Household | 2 (20.0%) | 8 (80.0%) |
| 3-Person Household | 6 (54.5%) | 5 (45.5%) |
| 4+ Person Household | 1 (20.0%) | 4 (80.0%) |
| Total Housing Units | 9 (13.0%) | 60 (87.0%) |
Occupancy by Educational Attainment in Pippa Passes
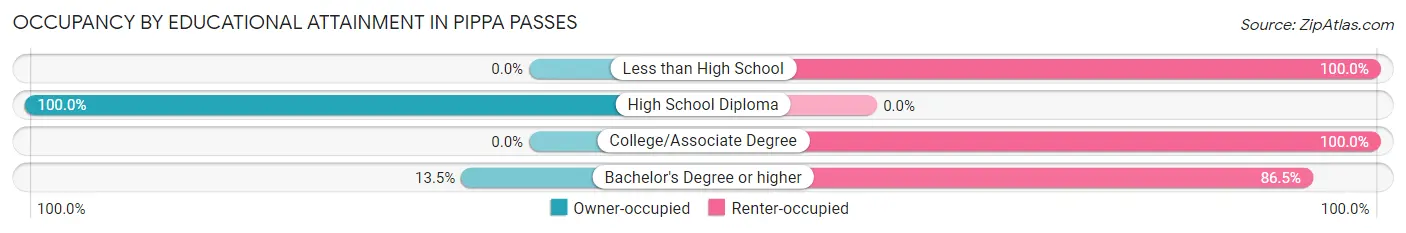
| Household Size | Owner-occupied | Renter-occupied |
| Less than High School | 0 (0.0%) | 1 (100.0%) |
| High School Diploma | 2 (100.0%) | 0 (0.0%) |
| College/Associate Degree | 0 (0.0%) | 14 (100.0%) |
| Bachelor's Degree or higher | 7 (13.5%) | 45 (86.5%) |
Occupancy by Age of Householder in Pippa Passes
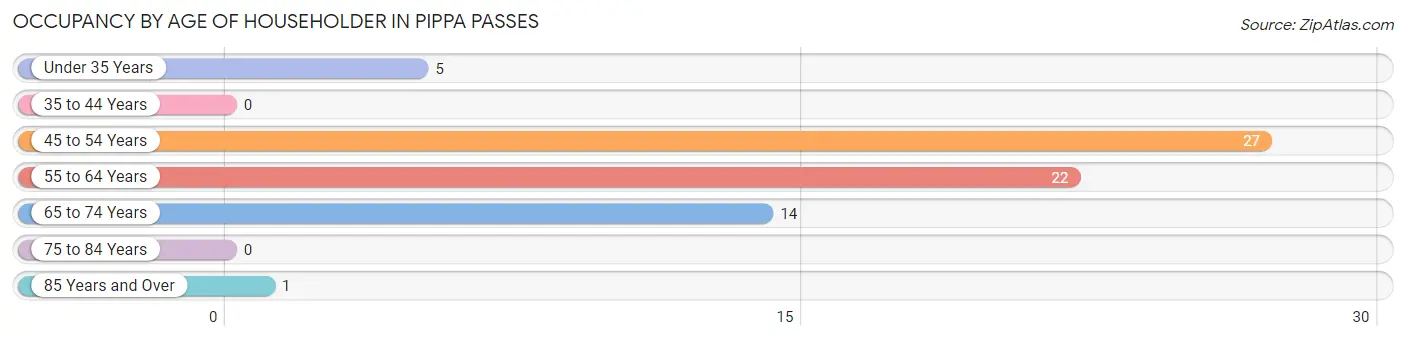
| Age Bracket | # Households | % Households |
| Under 35 Years | 5 | 7.2% |
| 35 to 44 Years | 0 | 0.0% |
| 45 to 54 Years | 27 | 39.1% |
| 55 to 64 Years | 22 | 31.9% |
| 65 to 74 Years | 14 | 20.3% |
| 75 to 84 Years | 0 | 0.0% |
| 85 Years and Over | 1 | 1.5% |
| Total | 69 | 100.0% |
Housing Finances in Pippa Passes
Median Income by Occupancy in Pippa Passes
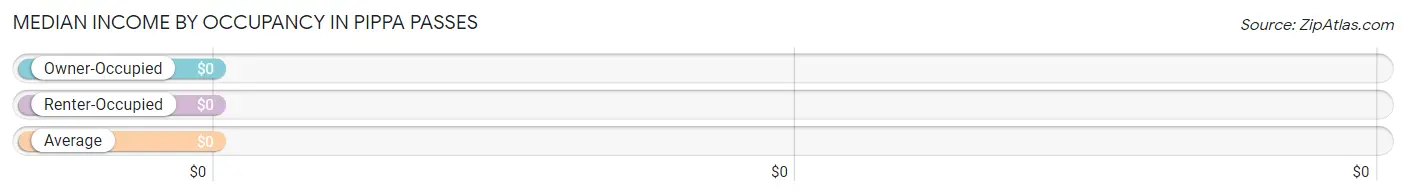
| Occupancy Type | # Households | Median Income |
| Owner-Occupied | 9 (13.0%) | $0 |
| Renter-Occupied | 60 (87.0%) | $0 |
| Average | 69 (100.0%) | $0 |
Occupancy by Householder Income Bracket in Pippa Passes
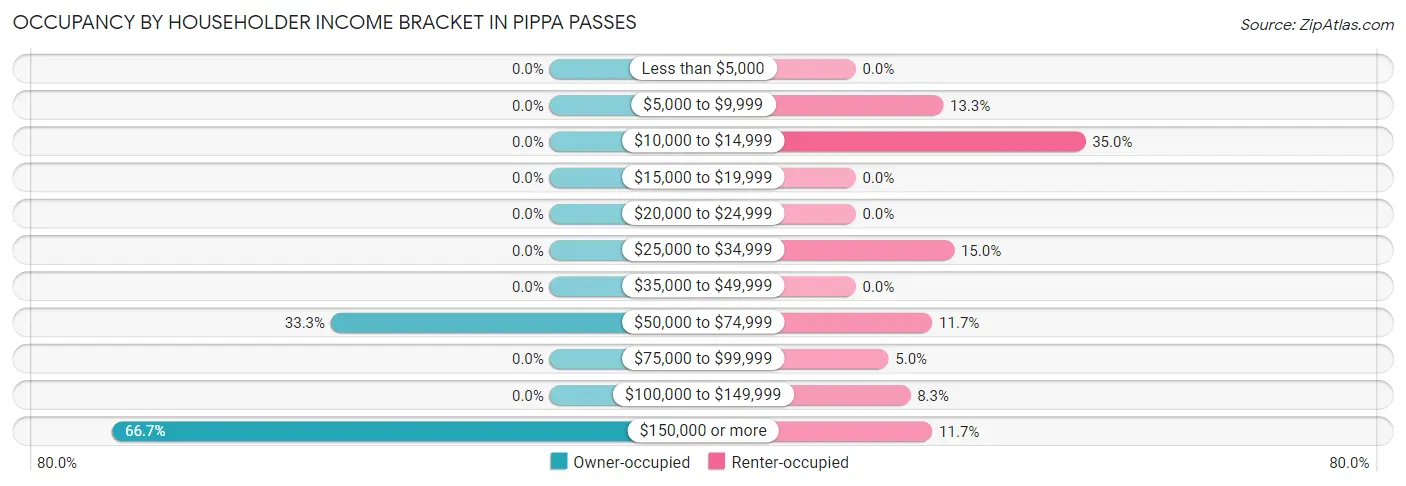
| Income Bracket | Owner-occupied | Renter-occupied |
| Less than $5,000 | 0 (0.0%) | 0 (0.0%) |
| $5,000 to $9,999 | 0 (0.0%) | 8 (13.3%) |
| $10,000 to $14,999 | 0 (0.0%) | 21 (35.0%) |
| $15,000 to $19,999 | 0 (0.0%) | 0 (0.0%) |
| $20,000 to $24,999 | 0 (0.0%) | 0 (0.0%) |
| $25,000 to $34,999 | 0 (0.0%) | 9 (15.0%) |
| $35,000 to $49,999 | 0 (0.0%) | 0 (0.0%) |
| $50,000 to $74,999 | 3 (33.3%) | 7 (11.7%) |
| $75,000 to $99,999 | 0 (0.0%) | 3 (5.0%) |
| $100,000 to $149,999 | 0 (0.0%) | 5 (8.3%) |
| $150,000 or more | 6 (66.7%) | 7 (11.7%) |
| Total | 9 (100.0%) | 60 (100.0%) |
Monthly Housing Cost Tiers in Pippa Passes
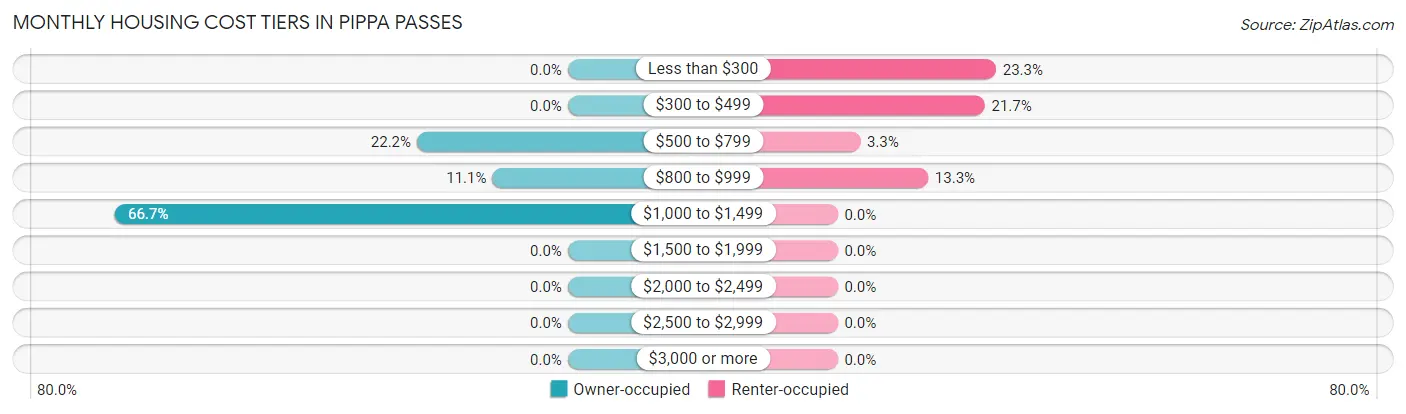
| Monthly Cost | Owner-occupied | Renter-occupied |
| Less than $300 | 0 (0.0%) | 14 (23.3%) |
| $300 to $499 | 0 (0.0%) | 13 (21.7%) |
| $500 to $799 | 2 (22.2%) | 2 (3.3%) |
| $800 to $999 | 1 (11.1%) | 8 (13.3%) |
| $1,000 to $1,499 | 6 (66.7%) | 0 (0.0%) |
| $1,500 to $1,999 | 0 (0.0%) | 0 (0.0%) |
| $2,000 to $2,499 | 0 (0.0%) | 0 (0.0%) |
| $2,500 to $2,999 | 0 (0.0%) | 0 (0.0%) |
| $3,000 or more | 0 (0.0%) | 0 (0.0%) |
| Total | 9 (100.0%) | 60 (100.0%) |
Physical Housing Characteristics in Pippa Passes
Housing Structures in Pippa Passes
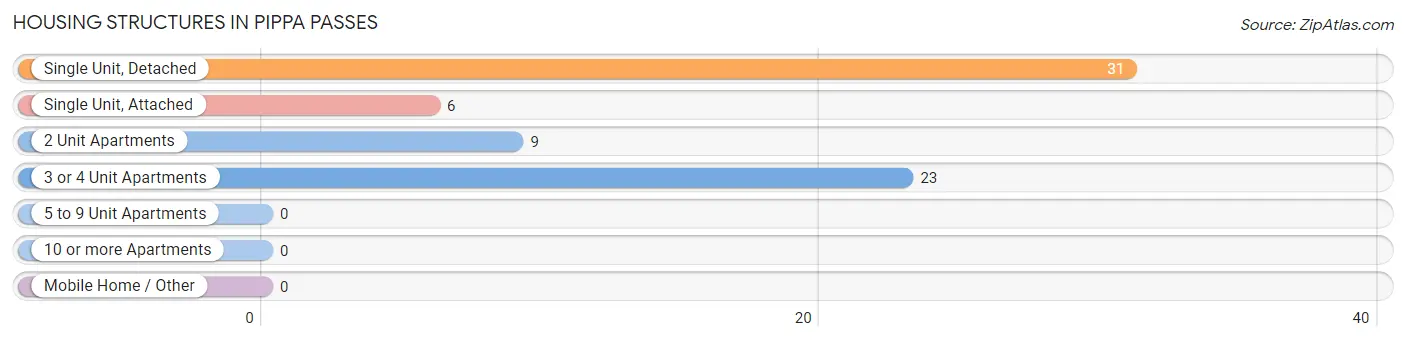
| Structure Type | # Housing Units | % Housing Units |
| Single Unit, Detached | 31 | 44.9% |
| Single Unit, Attached | 6 | 8.7% |
| 2 Unit Apartments | 9 | 13.0% |
| 3 or 4 Unit Apartments | 23 | 33.3% |
| 5 to 9 Unit Apartments | 0 | 0.0% |
| 10 or more Apartments | 0 | 0.0% |
| Mobile Home / Other | 0 | 0.0% |
| Total | 69 | 100.0% |
Housing Structures by Occupancy in Pippa Passes
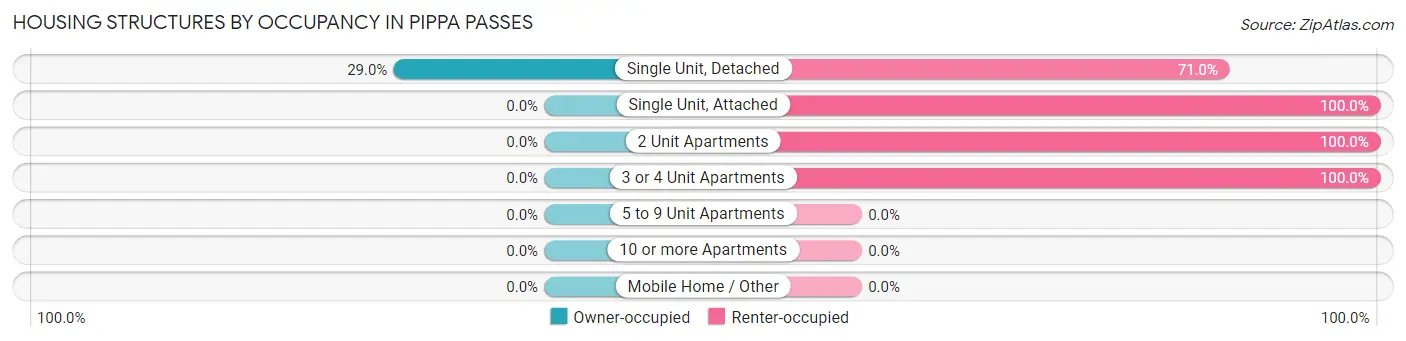
| Structure Type | Owner-occupied | Renter-occupied |
| Single Unit, Detached | 9 (29.0%) | 22 (71.0%) |
| Single Unit, Attached | 0 (0.0%) | 6 (100.0%) |
| 2 Unit Apartments | 0 (0.0%) | 9 (100.0%) |
| 3 or 4 Unit Apartments | 0 (0.0%) | 23 (100.0%) |
| 5 to 9 Unit Apartments | 0 (0.0%) | 0 (0.0%) |
| 10 or more Apartments | 0 (0.0%) | 0 (0.0%) |
| Mobile Home / Other | 0 (0.0%) | 0 (0.0%) |
| Total | 9 (13.0%) | 60 (87.0%) |
Housing Structures by Number of Rooms in Pippa Passes
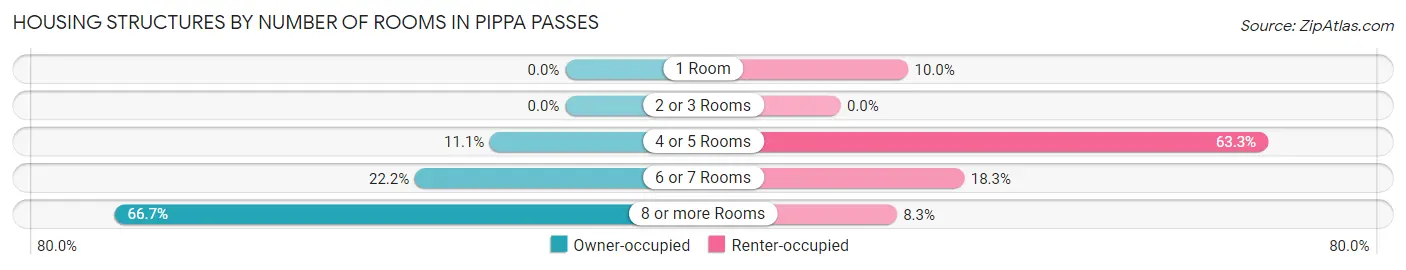
| Number of Rooms | Owner-occupied | Renter-occupied |
| 1 Room | 0 (0.0%) | 6 (10.0%) |
| 2 or 3 Rooms | 0 (0.0%) | 0 (0.0%) |
| 4 or 5 Rooms | 1 (11.1%) | 38 (63.3%) |
| 6 or 7 Rooms | 2 (22.2%) | 11 (18.3%) |
| 8 or more Rooms | 6 (66.7%) | 5 (8.3%) |
| Total | 9 (100.0%) | 60 (100.0%) |
Housing Structure by Heating Type in Pippa Passes
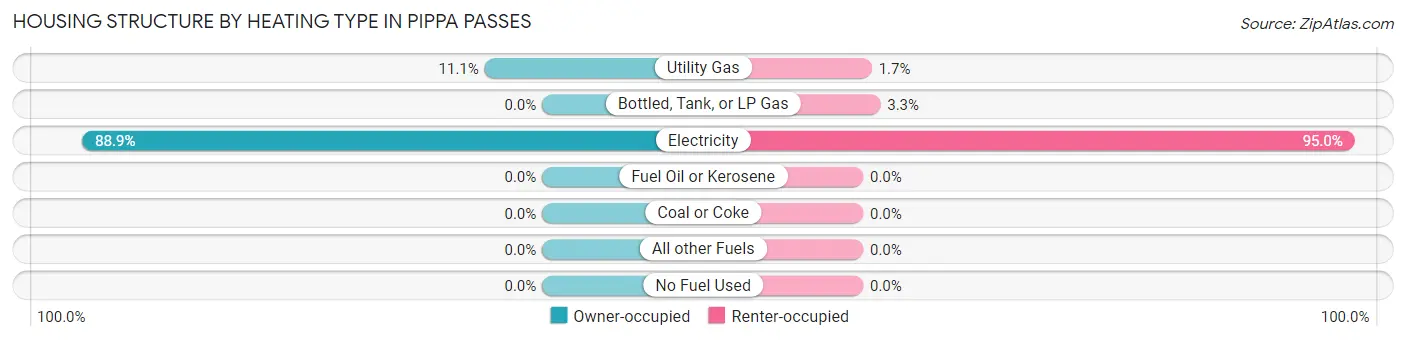
| Heating Type | Owner-occupied | Renter-occupied |
| Utility Gas | 1 (11.1%) | 1 (1.7%) |
| Bottled, Tank, or LP Gas | 0 (0.0%) | 2 (3.3%) |
| Electricity | 8 (88.9%) | 57 (95.0%) |
| Fuel Oil or Kerosene | 0 (0.0%) | 0 (0.0%) |
| Coal or Coke | 0 (0.0%) | 0 (0.0%) |
| All other Fuels | 0 (0.0%) | 0 (0.0%) |
| No Fuel Used | 0 (0.0%) | 0 (0.0%) |
| Total | 9 (100.0%) | 60 (100.0%) |
Household Vehicle Usage in Pippa Passes
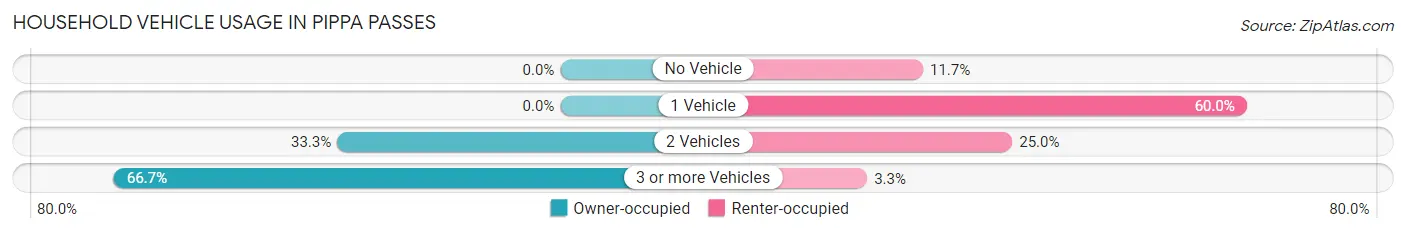
| Vehicles per Household | Owner-occupied | Renter-occupied |
| No Vehicle | 0 (0.0%) | 7 (11.7%) |
| 1 Vehicle | 0 (0.0%) | 36 (60.0%) |
| 2 Vehicles | 3 (33.3%) | 15 (25.0%) |
| 3 or more Vehicles | 6 (66.7%) | 2 (3.3%) |
| Total | 9 (100.0%) | 60 (100.0%) |
Real Estate & Mortgages in Pippa Passes
Real Estate and Mortgage Overview in Pippa Passes
| Characteristic | Without Mortgage | With Mortgage |
| Housing Units | 6 | 3 |
| Median Property Value | - | - |
| Median Household Income | - | - |
| Monthly Housing Costs | - | - |
| Real Estate Taxes | - | - |
Property Value by Mortgage Status in Pippa Passes
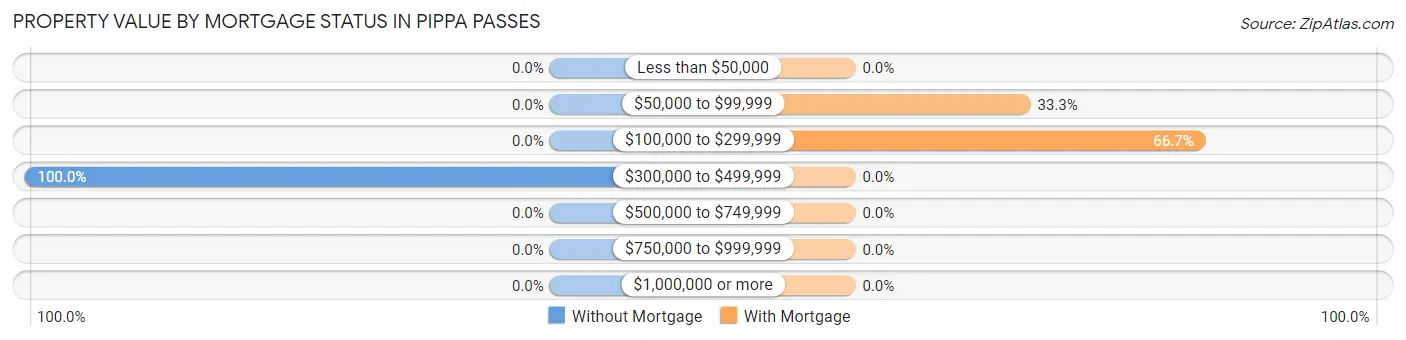
| Property Value | Without Mortgage | With Mortgage |
| Less than $50,000 | 0 (0.0%) | 0 (0.0%) |
| $50,000 to $99,999 | 0 (0.0%) | 1 (33.3%) |
| $100,000 to $299,999 | 0 (0.0%) | 2 (66.7%) |
| $300,000 to $499,999 | 6 (100.0%) | 0 (0.0%) |
| $500,000 to $749,999 | 0 (0.0%) | 0 (0.0%) |
| $750,000 to $999,999 | 0 (0.0%) | 0 (0.0%) |
| $1,000,000 or more | 0 (0.0%) | 0 (0.0%) |
| Total | 6 (100.0%) | 3 (100.0%) |
Household Income by Mortgage Status in Pippa Passes
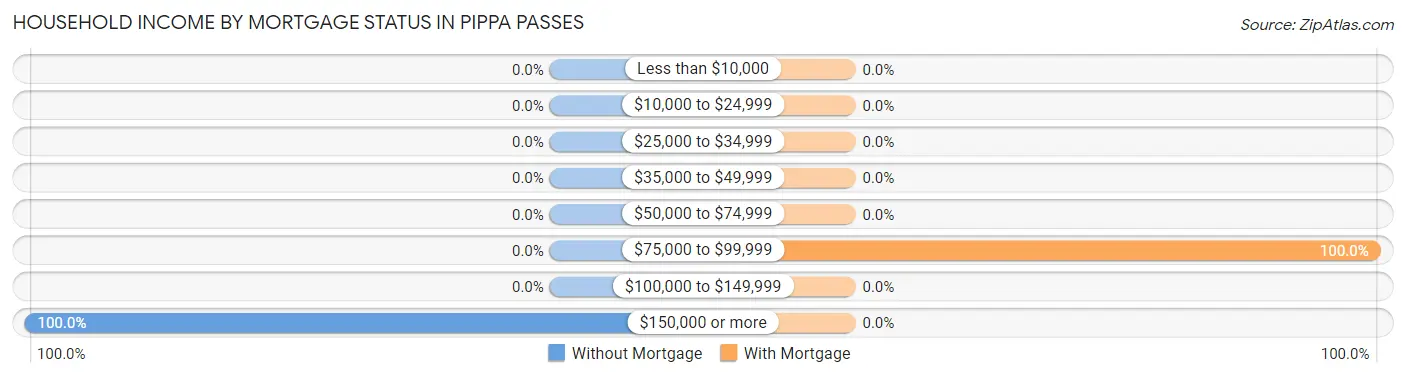
| Household Income | Without Mortgage | With Mortgage |
| Less than $10,000 | 0 (0.0%) | 0 (0.0%) |
| $10,000 to $24,999 | 0 (0.0%) | 0 (0.0%) |
| $25,000 to $34,999 | 0 (0.0%) | 0 (0.0%) |
| $35,000 to $49,999 | 0 (0.0%) | 0 (0.0%) |
| $50,000 to $74,999 | 0 (0.0%) | 0 (0.0%) |
| $75,000 to $99,999 | 0 (0.0%) | 3 (100.0%) |
| $100,000 to $149,999 | 0 (0.0%) | 0 (0.0%) |
| $150,000 or more | 6 (100.0%) | 0 (0.0%) |
| Total | 6 (100.0%) | 3 (100.0%) |
Property Value to Household Income Ratio in Pippa Passes
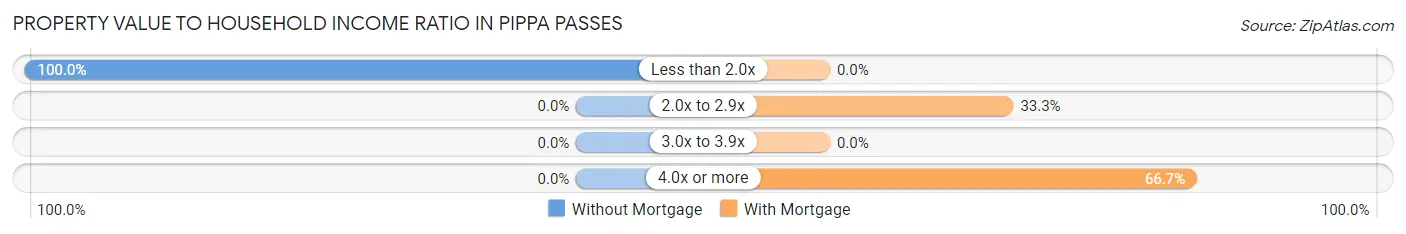
| Value-to-Income Ratio | Without Mortgage | With Mortgage |
| Less than 2.0x | 6 (100.0%) | 0 (0.0%) |
| 2.0x to 2.9x | 0 (0.0%) | 1 (33.3%) |
| 3.0x to 3.9x | 0 (0.0%) | 0 (0.0%) |
| 4.0x or more | 0 (0.0%) | 2 (66.7%) |
| Total | 6 (100.0%) | 3 (100.0%) |
Real Estate Taxes by Mortgage Status in Pippa Passes

| Property Taxes | Without Mortgage | With Mortgage |
| Less than $800 | 0 (0.0%) | 0 (0.0%) |
| $800 to $1,499 | 0 (0.0%) | 1 (33.3%) |
| $800 to $1,499 | 6 (100.0%) | 0 (0.0%) |
| Total | 6 (100.0%) | 3 (100.0%) |
Health & Disability in Pippa Passes
Health Insurance Coverage by Age in Pippa Passes
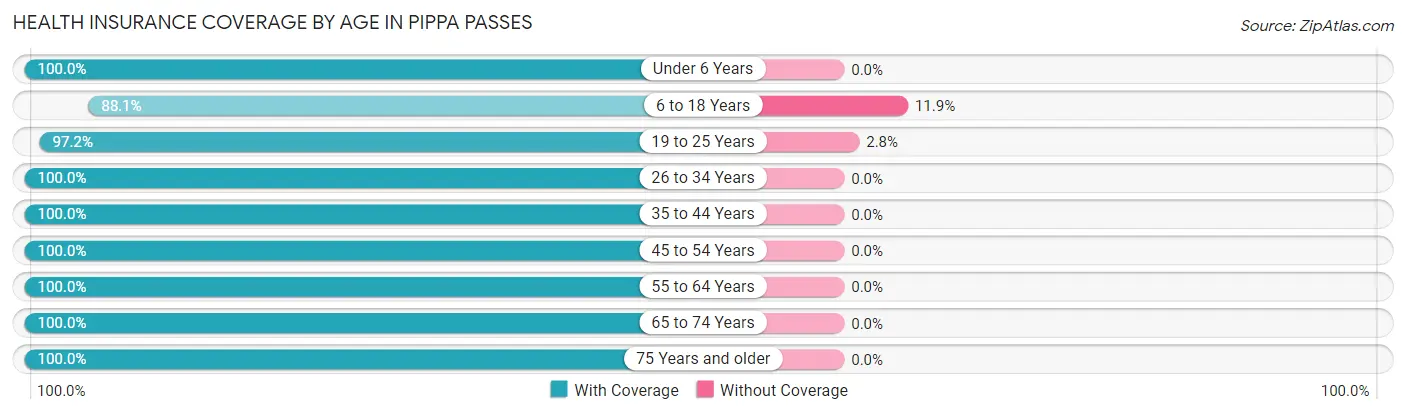
| Age Bracket | With Coverage | Without Coverage |
| Under 6 Years | 9 (100.0%) | 0 (0.0%) |
| 6 to 18 Years | 89 (88.1%) | 12 (11.9%) |
| 19 to 25 Years | 314 (97.2%) | 9 (2.8%) |
| 26 to 34 Years | 17 (100.0%) | 0 (0.0%) |
| 35 to 44 Years | 13 (100.0%) | 0 (0.0%) |
| 45 to 54 Years | 35 (100.0%) | 0 (0.0%) |
| 55 to 64 Years | 28 (100.0%) | 0 (0.0%) |
| 65 to 74 Years | 16 (100.0%) | 0 (0.0%) |
| 75 Years and older | 1 (100.0%) | 0 (0.0%) |
| Total | 522 (96.1%) | 21 (3.9%) |
Health Insurance Coverage by Citizenship Status in Pippa Passes
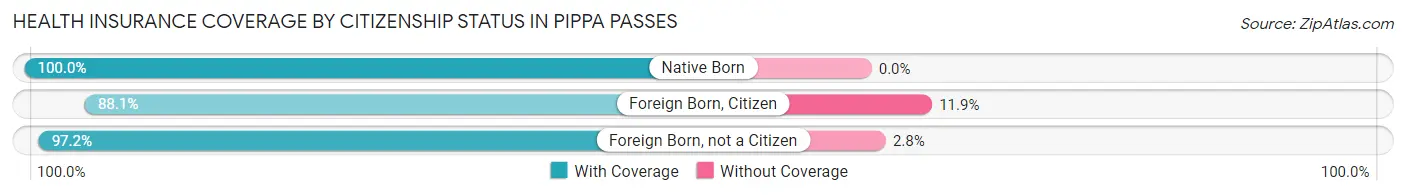
| Citizenship Status | With Coverage | Without Coverage |
| Native Born | 9 (100.0%) | 0 (0.0%) |
| Foreign Born, Citizen | 89 (88.1%) | 12 (11.9%) |
| Foreign Born, not a Citizen | 314 (97.2%) | 9 (2.8%) |
Health Insurance Coverage by Household Income in Pippa Passes
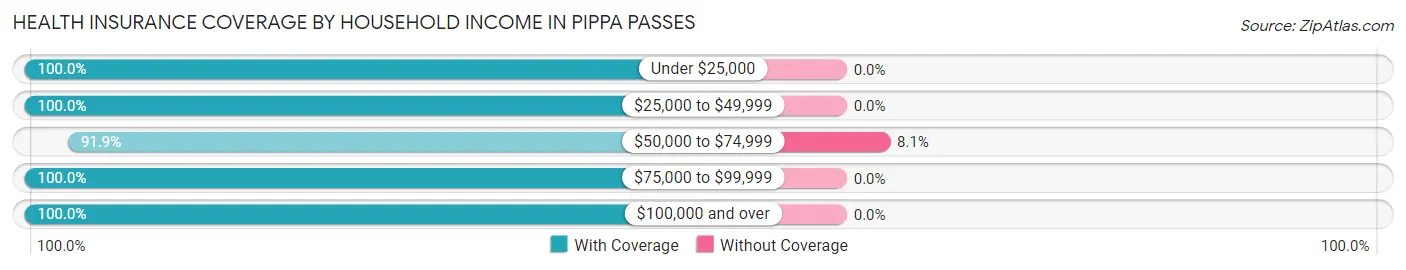
| Household Income | With Coverage | Without Coverage |
| Under $25,000 | 29 (100.0%) | 0 (0.0%) |
| $25,000 to $49,999 | 9 (100.0%) | 0 (0.0%) |
| $50,000 to $74,999 | 34 (91.9%) | 3 (8.1%) |
| $75,000 to $99,999 | 9 (100.0%) | 0 (0.0%) |
| $100,000 and over | 50 (100.0%) | 0 (0.0%) |
Public vs Private Health Insurance Coverage by Age in Pippa Passes
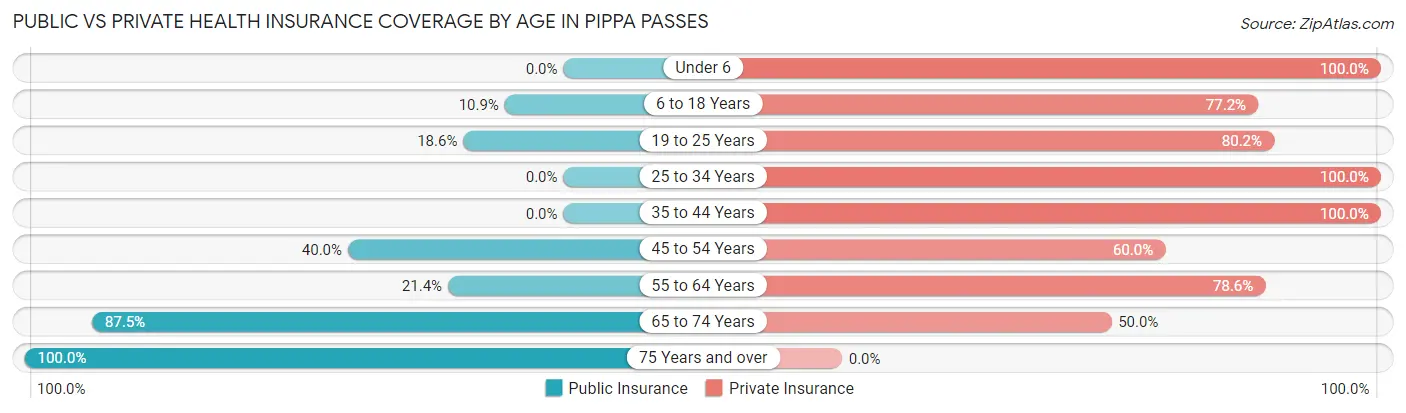
| Age Bracket | Public Insurance | Private Insurance |
| Under 6 | 0 (0.0%) | 9 (100.0%) |
| 6 to 18 Years | 11 (10.9%) | 78 (77.2%) |
| 19 to 25 Years | 60 (18.6%) | 259 (80.2%) |
| 25 to 34 Years | 0 (0.0%) | 17 (100.0%) |
| 35 to 44 Years | 0 (0.0%) | 13 (100.0%) |
| 45 to 54 Years | 14 (40.0%) | 21 (60.0%) |
| 55 to 64 Years | 6 (21.4%) | 22 (78.6%) |
| 65 to 74 Years | 14 (87.5%) | 8 (50.0%) |
| 75 Years and over | 1 (100.0%) | 0 (0.0%) |
| Total | 106 (19.5%) | 427 (78.6%) |
Disability Status by Sex by Age in Pippa Passes
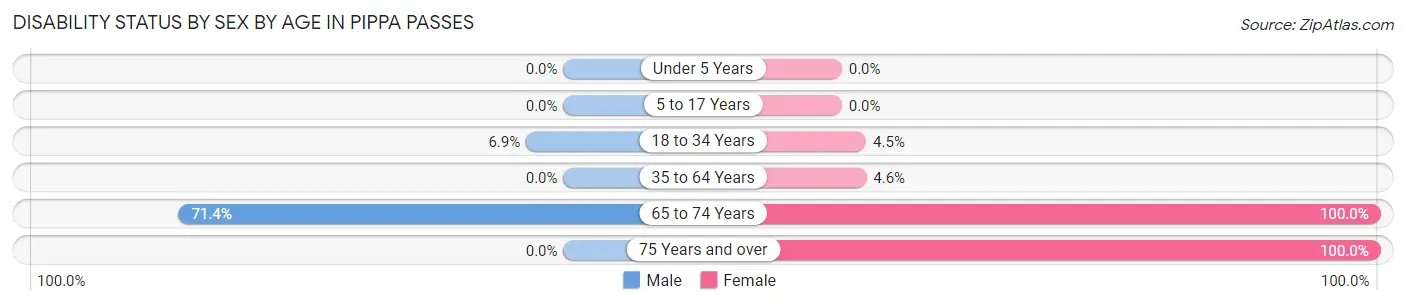
| Age Bracket | Male | Female |
| Under 5 Years | 0 (0.0%) | 0 (0.0%) |
| 5 to 17 Years | 0 (0.0%) | 0 (0.0%) |
| 18 to 34 Years | 14 (6.9%) | 10 (4.5%) |
| 35 to 64 Years | 0 (0.0%) | 2 (4.5%) |
| 65 to 74 Years | 10 (71.4%) | 2 (100.0%) |
| 75 Years and over | 0 (0.0%) | 1 (100.0%) |
Disability Class by Sex by Age in Pippa Passes
Disability Class: Hearing Difficulty
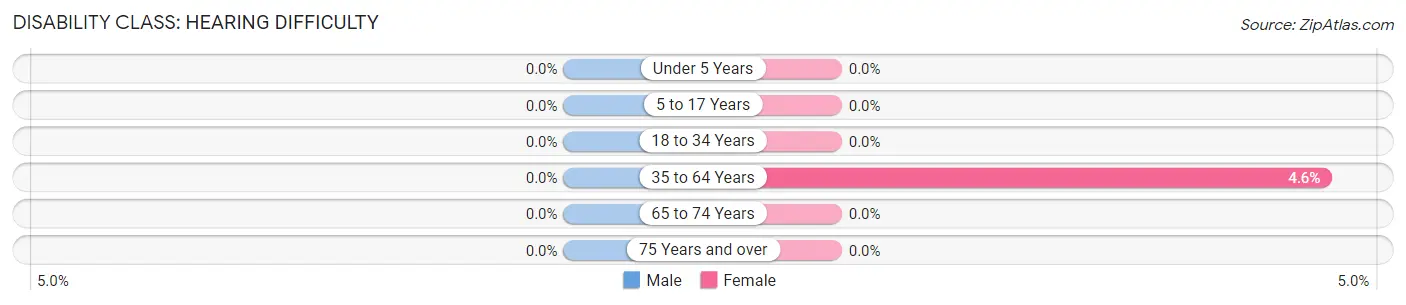
| Age Bracket | Male | Female |
| Under 5 Years | 0 (0.0%) | 0 (0.0%) |
| 5 to 17 Years | 0 (0.0%) | 0 (0.0%) |
| 18 to 34 Years | 0 (0.0%) | 0 (0.0%) |
| 35 to 64 Years | 0 (0.0%) | 2 (4.5%) |
| 65 to 74 Years | 0 (0.0%) | 0 (0.0%) |
| 75 Years and over | 0 (0.0%) | 0 (0.0%) |
Disability Class: Vision Difficulty
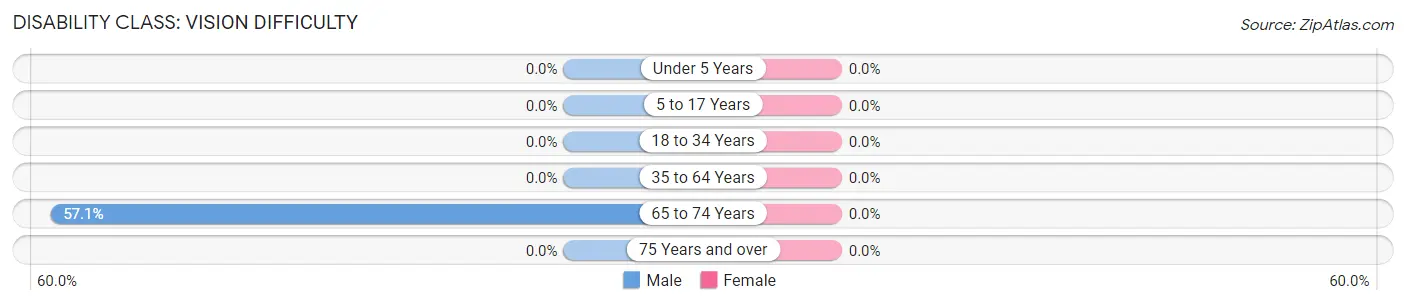
| Age Bracket | Male | Female |
| Under 5 Years | 0 (0.0%) | 0 (0.0%) |
| 5 to 17 Years | 0 (0.0%) | 0 (0.0%) |
| 18 to 34 Years | 0 (0.0%) | 0 (0.0%) |
| 35 to 64 Years | 0 (0.0%) | 0 (0.0%) |
| 65 to 74 Years | 8 (57.1%) | 0 (0.0%) |
| 75 Years and over | 0 (0.0%) | 0 (0.0%) |
Disability Class: Cognitive Difficulty
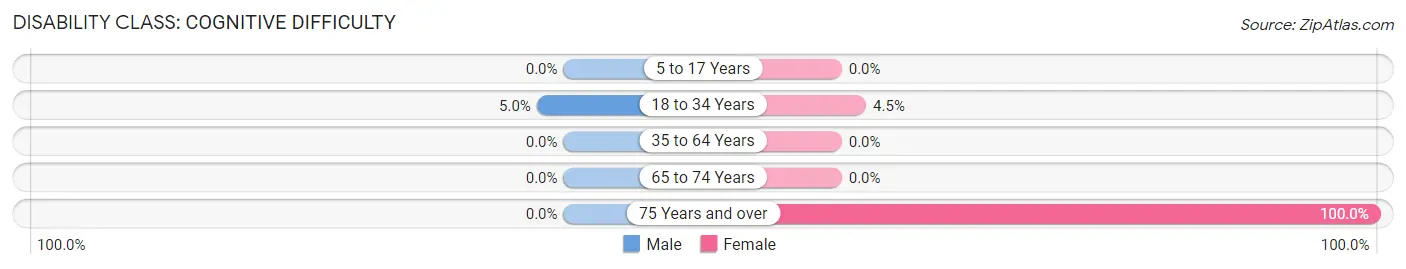
| Age Bracket | Male | Female |
| 5 to 17 Years | 0 (0.0%) | 0 (0.0%) |
| 18 to 34 Years | 10 (5.0%) | 10 (4.5%) |
| 35 to 64 Years | 0 (0.0%) | 0 (0.0%) |
| 65 to 74 Years | 0 (0.0%) | 0 (0.0%) |
| 75 Years and over | 0 (0.0%) | 1 (100.0%) |
Disability Class: Ambulatory Difficulty
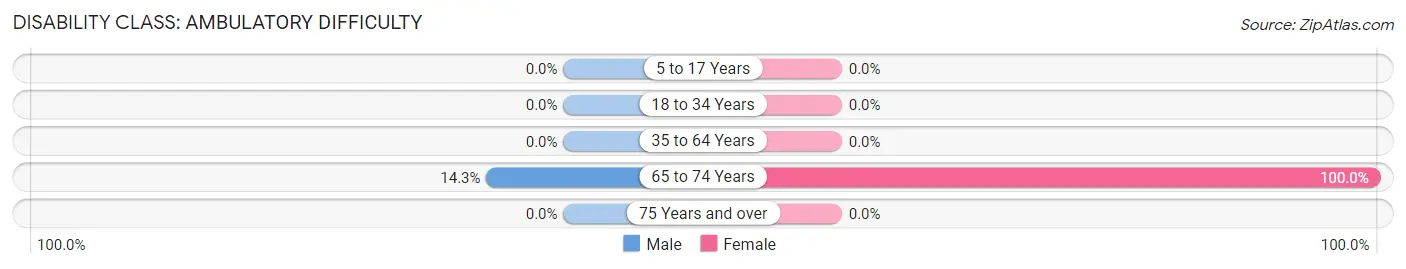
| Age Bracket | Male | Female |
| 5 to 17 Years | 0 (0.0%) | 0 (0.0%) |
| 18 to 34 Years | 0 (0.0%) | 0 (0.0%) |
| 35 to 64 Years | 0 (0.0%) | 0 (0.0%) |
| 65 to 74 Years | 2 (14.3%) | 2 (100.0%) |
| 75 Years and over | 0 (0.0%) | 0 (0.0%) |
Disability Class: Self-Care Difficulty
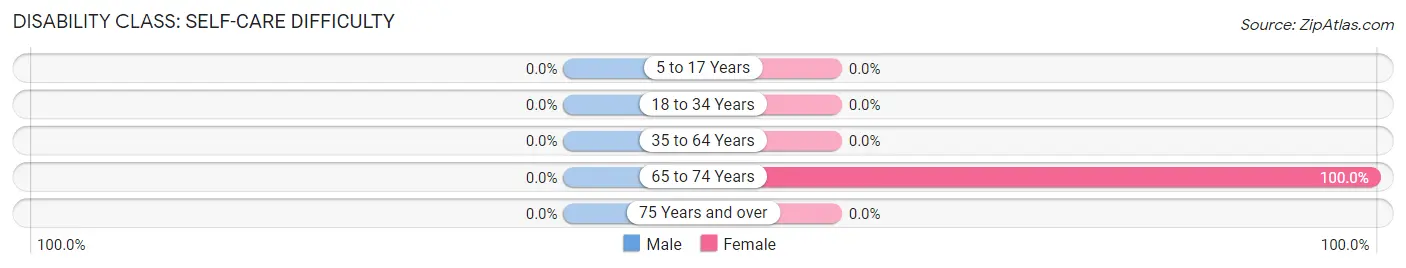
| Age Bracket | Male | Female |
| 5 to 17 Years | 0 (0.0%) | 0 (0.0%) |
| 18 to 34 Years | 0 (0.0%) | 0 (0.0%) |
| 35 to 64 Years | 0 (0.0%) | 0 (0.0%) |
| 65 to 74 Years | 0 (0.0%) | 2 (100.0%) |
| 75 Years and over | 0 (0.0%) | 0 (0.0%) |
Technology Access in Pippa Passes
Computing Device Access in Pippa Passes
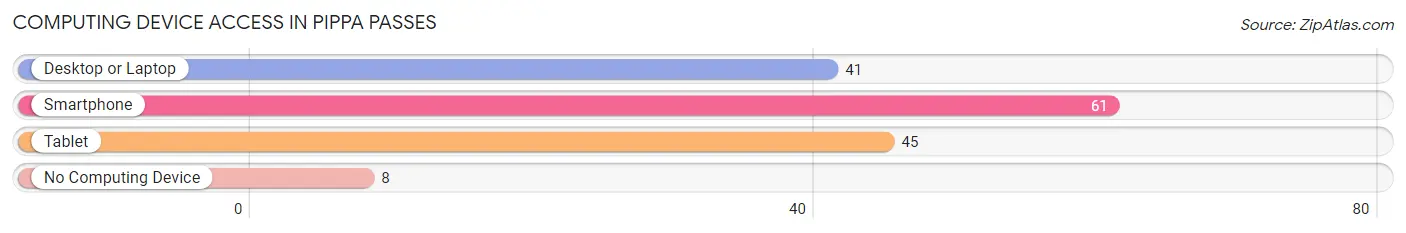
| Device Type | # Households | % Households |
| Desktop or Laptop | 41 | 59.4% |
| Smartphone | 61 | 88.4% |
| Tablet | 45 | 65.2% |
| No Computing Device | 8 | 11.6% |
| Total | 69 | 100.0% |
Internet Access in Pippa Passes
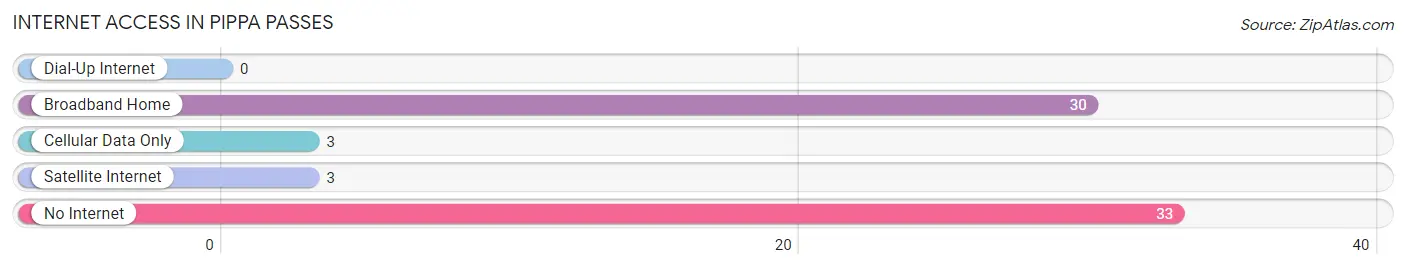
| Internet Type | # Households | % Households |
| Dial-Up Internet | 0 | 0.0% |
| Broadband Home | 30 | 43.5% |
| Cellular Data Only | 3 | 4.3% |
| Satellite Internet | 3 | 4.3% |
| No Internet | 33 | 47.8% |
| Total | 69 | 100.0% |
Pippa Passes Summary
Pippa Passes is a small unincorporated community located in Knott County, Kentucky. It is situated in the Appalachian Mountains and is part of the Appalachian Regional Commission. The town is located along the North Fork of the Kentucky River and is home to a population of approximately 1,000 people.
History
Pippa Passes was founded in 1883 by the Reverend John G. Fee, a Presbyterian minister from Ohio. He named the town after a poem by Robert Browning, “Pippa Passes”. The town was originally a coal mining town and was home to several coal mines. The town was also home to a number of churches, including the First Presbyterian Church, which was founded in 1883.
In the early 1900s, the town was home to a number of businesses, including a general store, a hotel, a post office, a bank, and a sawmill. The town also had a number of schools, including a high school, which was established in 1910.
In the late 1950s, the coal industry began to decline in the area and many of the businesses in the town closed. The town’s population began to decline as well, and by the 1970s, the population had dropped to just over 500 people.
Geography
Pippa Passes is located in the Appalachian Mountains in Knott County, Kentucky. The town is situated along the North Fork of the Kentucky River and is surrounded by the Daniel Boone National Forest. The town is located at an elevation of 1,400 feet and has a total area of 0.6 square miles.
The climate in Pippa Passes is classified as humid subtropical, with hot, humid summers and mild winters. The average annual temperature is around 57 degrees Fahrenheit, with an average high of 79 degrees in the summer and an average low of 35 degrees in the winter.
Economy
The economy of Pippa Passes is largely based on tourism. The town is home to a number of attractions, including the Pippa Passes Museum, which is dedicated to the history of the town and the surrounding area. The town is also home to a number of outdoor recreation activities, including hiking, fishing, and camping.
The town is also home to a number of small businesses, including restaurants, shops, and lodging. The town is also home to a number of churches, including the First Presbyterian Church, which was founded in 1883.
Demographics
As of the 2010 census, the population of Pippa Passes was 1,000 people. The racial makeup of the town was 97.2% White, 0.7% African American, 0.2% Native American, 0.2% Asian, 0.1% Pacific Islander, 0.2% from other races, and 1.6% from two or more races. The median household income in the town was $25,000, and the median family income was $30,000. The per capita income in the town was $14,000.
Conclusion
Pippa Passes is a small unincorporated community located in Knott County, Kentucky. It is situated in the Appalachian Mountains and is part of the Appalachian Regional Commission. The town is located along the North Fork of the Kentucky River and is home to a population of approximately 1,000 people. The economy of the town is largely based on tourism, and the town is home to a number of attractions, including the Pippa Passes Museum. The town is also home to a number of small businesses, including restaurants, shops, and lodging. The racial makeup of the town is 97.2% White, 0.7% African American, 0.2% Native American, 0.2% Asian, 0.1% Pacific Islander, 0.2% from other races, and 1.6% from two or more races. The median household income in the town was $25,000, and the median family income was $30,000.
Common Questions
What is Per Capita Income in Pippa Passes?
Per Capita income in Pippa Passes is $14,813.
What is the Median Family Income in Pippa Passes?
Median Family Income in Pippa Passes is $148,750.
What is Income or Wage Gap in Pippa Passes?
Income or Wage Gap in Pippa Passes is 7.5%.
Women in Pippa Passes earn 92.5 cents for every dollar earned by a man.
What is Inequality or Gini Index in Pippa Passes?
Inequality or Gini Index in Pippa Passes is 0.61.
What is the Total Population of Pippa Passes?
Total Population of Pippa Passes is 543.
What is the Total Male Population of Pippa Passes?
Total Male Population of Pippa Passes is 255.
What is the Total Female Population of Pippa Passes?
Total Female Population of Pippa Passes is 288.
What is the Ratio of Males per 100 Females in Pippa Passes?
There are 88.54 Males per 100 Females in Pippa Passes.
What is the Ratio of Females per 100 Males in Pippa Passes?
There are 112.94 Females per 100 Males in Pippa Passes.
What is the Median Population Age in Pippa Passes?
Median Population Age in Pippa Passes is 20.4 Years.
What is the Average Family Size in Pippa Passes
Average Family Size in Pippa Passes is 3.5 People.
What is the Average Household Size in Pippa Passes
Average Household Size in Pippa Passes is 1.9 People.
How Large is the Labor Force in Pippa Passes?
There are 178 People in the Labor Forcein in Pippa Passes.
What is the Percentage of People in the Labor Force in Pippa Passes?
33.6% of People are in the Labor Force in Pippa Passes.
What is the Unemployment Rate in Pippa Passes?
Unemployment Rate in Pippa Passes is 2.8%.