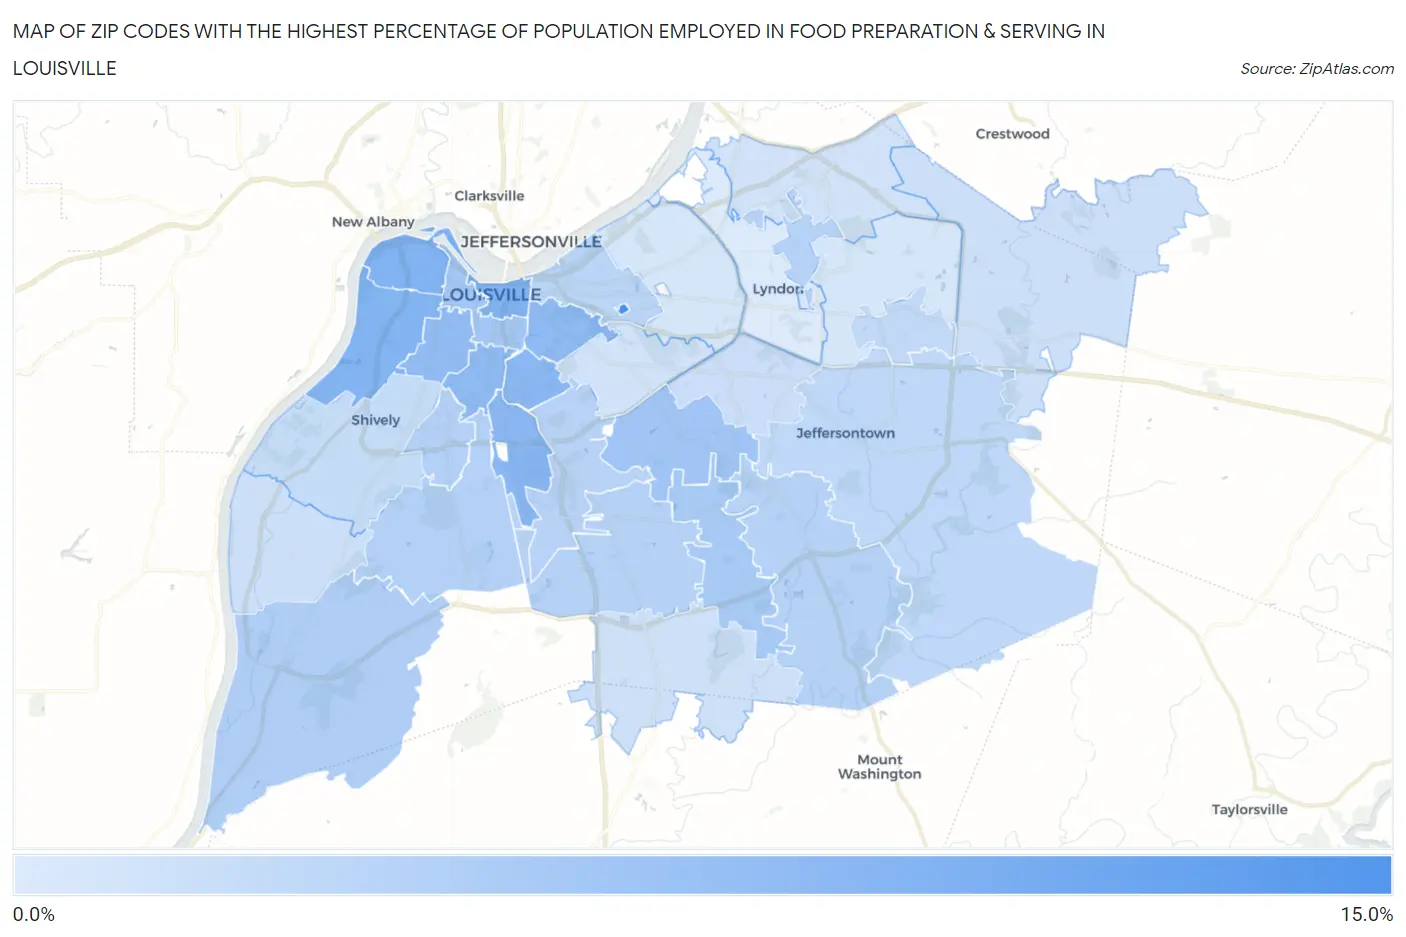
Zip Codes with the Highest Percentage of Population Employed in Food Preparation & Serving in Louisville, KY
RELATED REPORTS & OPTIONS
Food Preparation & Serving
Louisville
Compare Zip Codes
Map of Zip Codes with the Highest Percentage of Population Employed in Food Preparation & Serving in Louisville
2.7%
13.3%

Zip Codes with the Highest Percentage of Population Employed in Food Preparation & Serving in Louisville, KY
| Zip Code | % Employed | vs State | vs National | |
| 1. | 40280 | 13.3% | 5.1%(+8.21)#44 | 5.3%(+8.01)#1,321 |
| 2. | 40202 | 9.1% | 5.1%(+4.05)#85 | 5.3%(+3.85)#3,377 |
| 3. | 40212 | 9.1% | 5.1%(+3.97)#89 | 5.3%(+3.77)#3,468 |
| 4. | 40211 | 8.9% | 5.1%(+3.84)#91 | 5.3%(+3.64)#3,592 |
| 5. | 40209 | 8.5% | 5.1%(+3.43)#104 | 5.3%(+3.22)#4,061 |
| 6. | 40217 | 8.4% | 5.1%(+3.33)#107 | 5.3%(+3.13)#4,155 |
| 7. | 40208 | 8.2% | 5.1%(+3.10)#116 | 5.3%(+2.90)#4,458 |
| 8. | 40204 | 8.2% | 5.1%(+3.08)#118 | 5.3%(+2.88)#4,483 |
| 9. | 40210 | 8.0% | 5.1%(+2.89)#122 | 5.3%(+2.69)#4,754 |
| 10. | 40218 | 6.8% | 5.1%(+1.69)#157 | 5.3%(+1.48)#7,137 |
| 11. | 40203 | 6.6% | 5.1%(+1.56)#164 | 5.3%(+1.36)#7,491 |
| 12. | 40228 | 6.4% | 5.1%(+1.31)#175 | 5.3%(+1.11)#8,152 |
| 13. | 40272 | 5.8% | 5.1%(+0.729)#204 | 5.3%(+0.528)#9,988 |
| 14. | 40215 | 5.6% | 5.1%(+0.506)#210 | 5.3%(+0.305)#10,739 |
| 15. | 40214 | 5.6% | 5.1%(+0.482)#212 | 5.3%(+0.281)#10,819 |
| 16. | 40291 | 5.5% | 5.1%(+0.380)#219 | 5.3%(+0.179)#11,165 |
| 17. | 40242 | 5.4% | 5.1%(+0.348)#220 | 5.3%(+0.146)#11,295 |
| 18. | 40219 | 5.3% | 5.1%(+0.250)#225 | 5.3%(+0.049)#11,633 |
| 19. | 40213 | 5.3% | 5.1%(+0.193)#231 | 5.3%(-0.008)#11,845 |
| 20. | 40206 | 5.0% | 5.1%(-0.040)#249 | 5.3%(-0.241)#12,763 |
| 21. | 40299 | 4.7% | 5.1%(-0.364)#263 | 5.3%(-0.565)#14,077 |
| 22. | 40243 | 4.6% | 5.1%(-0.491)#275 | 5.3%(-0.692)#14,626 |
| 23. | 40216 | 4.3% | 5.1%(-0.800)#292 | 5.3%(-1.00)#15,949 |
| 24. | 40220 | 4.1% | 5.1%(-1.03)#314 | 5.3%(-1.23)#16,921 |
| 25. | 40258 | 3.9% | 5.1%(-1.19)#322 | 5.3%(-1.39)#17,539 |
| 26. | 40245 | 3.9% | 5.1%(-1.20)#324 | 5.3%(-1.40)#17,606 |
| 27. | 40229 | 3.7% | 5.1%(-1.41)#339 | 5.3%(-1.61)#18,472 |
| 28. | 40205 | 3.6% | 5.1%(-1.51)#345 | 5.3%(-1.71)#18,885 |
| 29. | 40241 | 3.5% | 5.1%(-1.59)#349 | 5.3%(-1.79)#19,232 |
| 30. | 40223 | 3.2% | 5.1%(-1.91)#371 | 5.3%(-2.11)#20,555 |
| 31. | 40207 | 3.2% | 5.1%(-1.92)#373 | 5.3%(-2.13)#20,626 |
| 32. | 40222 | 2.7% | 5.1%(-2.34)#399 | 5.3%(-2.54)#22,273 |
1
Common Questions
What are the Top 10 Zip Codes with the Highest Percentage of Population Employed in Food Preparation & Serving in Louisville, KY?
Top 10 Zip Codes with the Highest Percentage of Population Employed in Food Preparation & Serving in Louisville, KY are:
What zip code has the Highest Percentage of Population Employed in Food Preparation & Serving in Louisville, KY?
40280 has the Highest Percentage of Population Employed in Food Preparation & Serving in Louisville, KY with 13.3%.
What is the Percentage of Population Employed in Food Preparation & Serving in Louisville, KY?
Percentage of Population Employed in Food Preparation & Serving in Louisville is 5.3%.
What is the Percentage of Population Employed in Food Preparation & Serving in Kentucky?
Percentage of Population Employed in Food Preparation & Serving in Kentucky is 5.1%.
What is the Percentage of Population Employed in Food Preparation & Serving in the United States?
Percentage of Population Employed in Food Preparation & Serving in the United States is 5.3%.