Bromley, KY Map & Demographics
Bromley Map
Bromley Overview
$26,576
PER CAPITA INCOME
$75,893
AVG FAMILY INCOME
$49,432
AVG HOUSEHOLD INCOME
22.4%
WAGE / INCOME GAP [ % ]
77.6¢/ $1
WAGE / INCOME GAP [ $ ]
0.40
INEQUALITY / GINI INDEX
956
TOTAL POPULATION
519
MALE POPULATION
437
FEMALE POPULATION
118.76
MALES / 100 FEMALES
84.20
FEMALES / 100 MALES
34.4
MEDIAN AGE
3.4
AVG FAMILY SIZE
2.5
AVG HOUSEHOLD SIZE
495
LABOR FORCE [ PEOPLE ]
69.4%
PERCENT IN LABOR FORCE
10.1%
UNEMPLOYMENT RATE
Bromley Area Codes
Income in Bromley
Income Overview in Bromley
Per Capita Income in Bromley is $26,576, while median incomes of families and households are $75,893 and $49,432 respectively.
| Characteristic | Number | Measure |
| Per Capita Income | 956 | $26,576 |
| Median Family Income | 225 | $75,893 |
| Mean Family Income | 225 | $84,212 |
| Median Household Income | 383 | $49,432 |
| Mean Household Income | 383 | $69,787 |
| Income Deficit | 225 | $0 |
| Wage / Income Gap (%) | 956 | 22.39% |
| Wage / Income Gap ($) | 956 | 77.61¢ per $1 |
| Gini / Inequality Index | 956 | 0.40 |
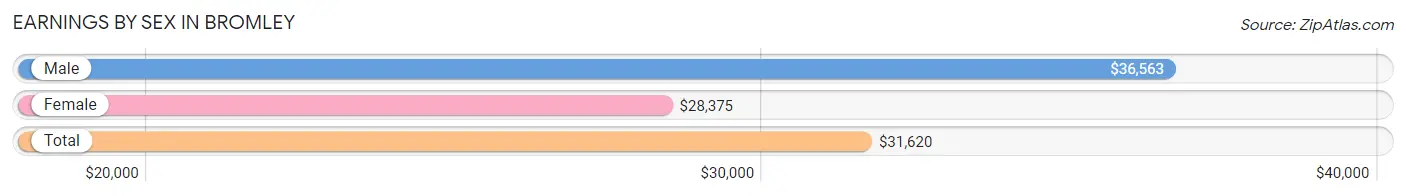
Earnings by Sex in Bromley
Average Earnings in Bromley are $31,620, $36,563 for men and $28,375 for women, a difference of 22.4%.
| Sex | Number | Average Earnings |
| Male | 339 (64.8%) | $36,563 |
| Female | 184 (35.2%) | $28,375 |
| Total | 523 (100.0%) | $31,620 |
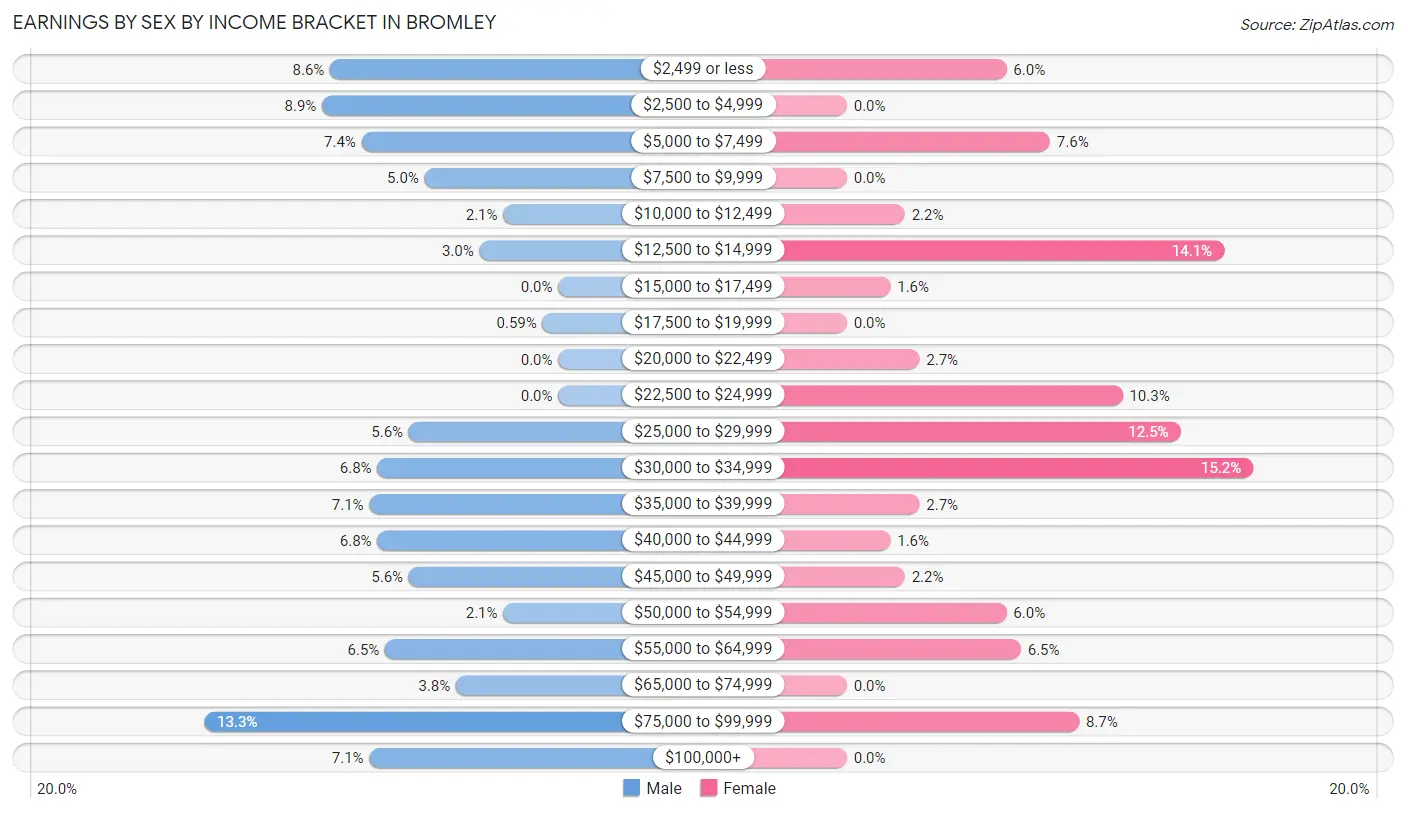
Earnings by Sex by Income Bracket in Bromley
The most common earnings brackets in Bromley are $75,000 to $99,999 for men (45 | 13.3%) and $30,000 to $34,999 for women (28 | 15.2%).
| Income | Male | Female |
| $2,499 or less | 29 (8.6%) | 11 (6.0%) |
| $2,500 to $4,999 | 30 (8.8%) | 0 (0.0%) |
| $5,000 to $7,499 | 25 (7.4%) | 14 (7.6%) |
| $7,500 to $9,999 | 17 (5.0%) | 0 (0.0%) |
| $10,000 to $12,499 | 7 (2.1%) | 4 (2.2%) |
| $12,500 to $14,999 | 10 (2.9%) | 26 (14.1%) |
| $15,000 to $17,499 | 0 (0.0%) | 3 (1.6%) |
| $17,500 to $19,999 | 2 (0.6%) | 0 (0.0%) |
| $20,000 to $22,499 | 0 (0.0%) | 5 (2.7%) |
| $22,500 to $24,999 | 0 (0.0%) | 19 (10.3%) |
| $25,000 to $29,999 | 19 (5.6%) | 23 (12.5%) |
| $30,000 to $34,999 | 23 (6.8%) | 28 (15.2%) |
| $35,000 to $39,999 | 24 (7.1%) | 5 (2.7%) |
| $40,000 to $44,999 | 23 (6.8%) | 3 (1.6%) |
| $45,000 to $49,999 | 19 (5.6%) | 4 (2.2%) |
| $50,000 to $54,999 | 7 (2.1%) | 11 (6.0%) |
| $55,000 to $64,999 | 22 (6.5%) | 12 (6.5%) |
| $65,000 to $74,999 | 13 (3.8%) | 0 (0.0%) |
| $75,000 to $99,999 | 45 (13.3%) | 16 (8.7%) |
| $100,000+ | 24 (7.1%) | 0 (0.0%) |
| Total | 339 (100.0%) | 184 (100.0%) |
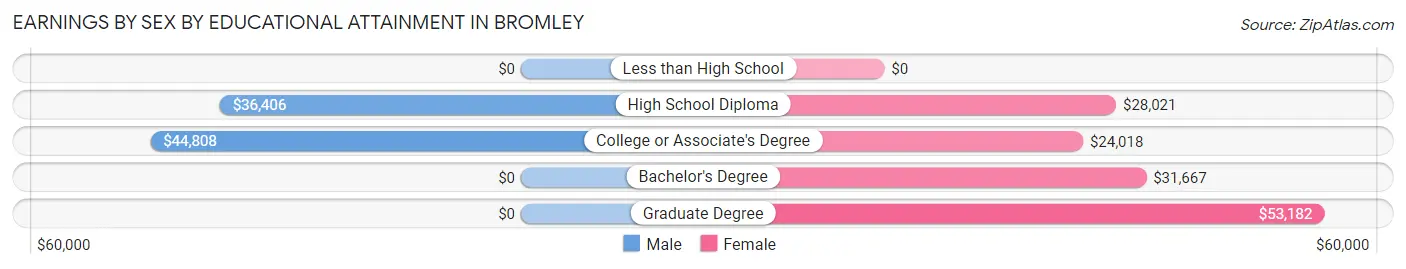
Earnings by Sex by Educational Attainment in Bromley
Average earnings in Bromley are $39,167 for men and $29,188 for women, a difference of 25.5%. Men with an educational attainment of college or associate's degree enjoy the highest average annual earnings of $44,808, while those with high school diploma education earn the least with $36,406. Women with an educational attainment of graduate degree earn the most with the average annual earnings of $53,182, while those with college or associate's degree education have the smallest earnings of $24,018.
| Educational Attainment | Male Income | Female Income |
| Less than High School | - | - |
| High School Diploma | $36,406 | $28,021 |
| College or Associate's Degree | $44,808 | $24,018 |
| Bachelor's Degree | - | - |
| Graduate Degree | - | - |
| Total | $39,167 | $29,188 |
Family Income in Bromley
Family Income Brackets in Bromley
According to the Bromley family income data, there are 50 families falling into the $100,000 to $149,999 income range, which is the most common income bracket and makes up 22.2% of all families. Conversely, the $10,000 to $14,999 income bracket is the least frequent group with only 4 families (1.8%) belonging to this category.
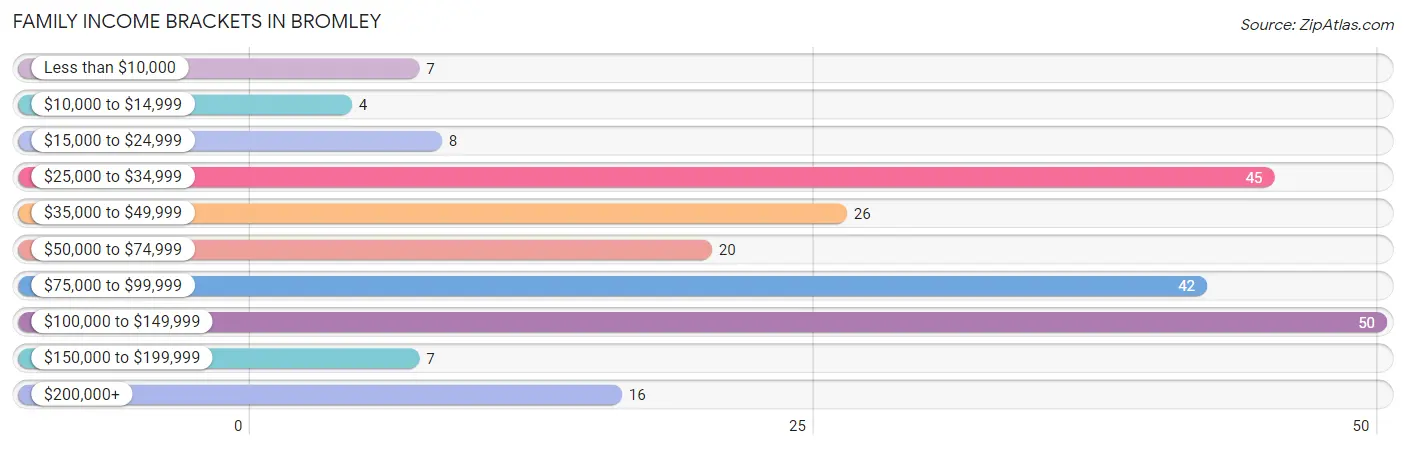
| Income Bracket | # Families | % Families |
| Less than $10,000 | 7 | 3.1% |
| $10,000 to $14,999 | 4 | 1.8% |
| $15,000 to $24,999 | 8 | 3.6% |
| $25,000 to $34,999 | 45 | 20.0% |
| $35,000 to $49,999 | 26 | 11.6% |
| $50,000 to $74,999 | 20 | 8.9% |
| $75,000 to $99,999 | 42 | 18.7% |
| $100,000 to $149,999 | 50 | 22.2% |
| $150,000 to $199,999 | 7 | 3.1% |
| $200,000+ | 16 | 7.1% |
Family Income by Famaliy Size in Bromley
5-person families (59 | 26.2%) account for the highest median family income in Bromley with $118,977 per family, while 5-person families (59 | 26.2%) have the highest median income of $23,795 per family member.
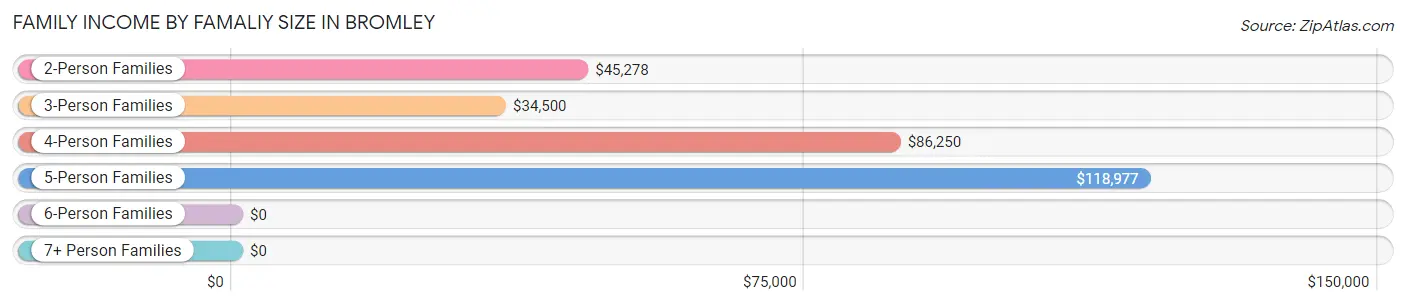
| Income Bracket | # Families | Median Income |
| 2-Person Families | 92 (40.9%) | $45,278 |
| 3-Person Families | 34 (15.1%) | $34,500 |
| 4-Person Families | 25 (11.1%) | $86,250 |
| 5-Person Families | 59 (26.2%) | $118,977 |
| 6-Person Families | 1 (0.4%) | $0 |
| 7+ Person Families | 14 (6.2%) | $0 |
| Total | 225 (100.0%) | $75,893 |
Family Income by Number of Earners in Bromley
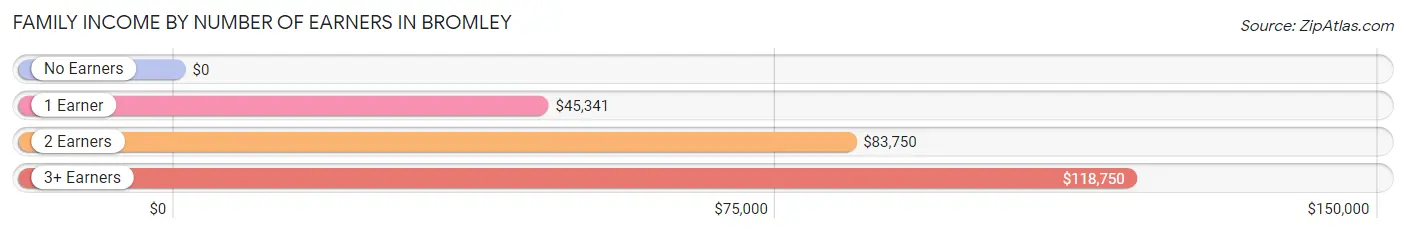
| Number of Earners | # Families | Median Income |
| No Earners | 9 (4.0%) | $0 |
| 1 Earner | 70 (31.1%) | $45,341 |
| 2 Earners | 109 (48.4%) | $83,750 |
| 3+ Earners | 37 (16.4%) | $118,750 |
| Total | 225 (100.0%) | $75,893 |
Household Income in Bromley
Household Income Brackets in Bromley
With 72 households falling in the category, the $35,000 to $49,999 income range is the most frequent in Bromley, accounting for 18.8% of all households. In contrast, only 7 households (1.8%) fall into the $150,000 to $199,999 income bracket, making it the least populous group.
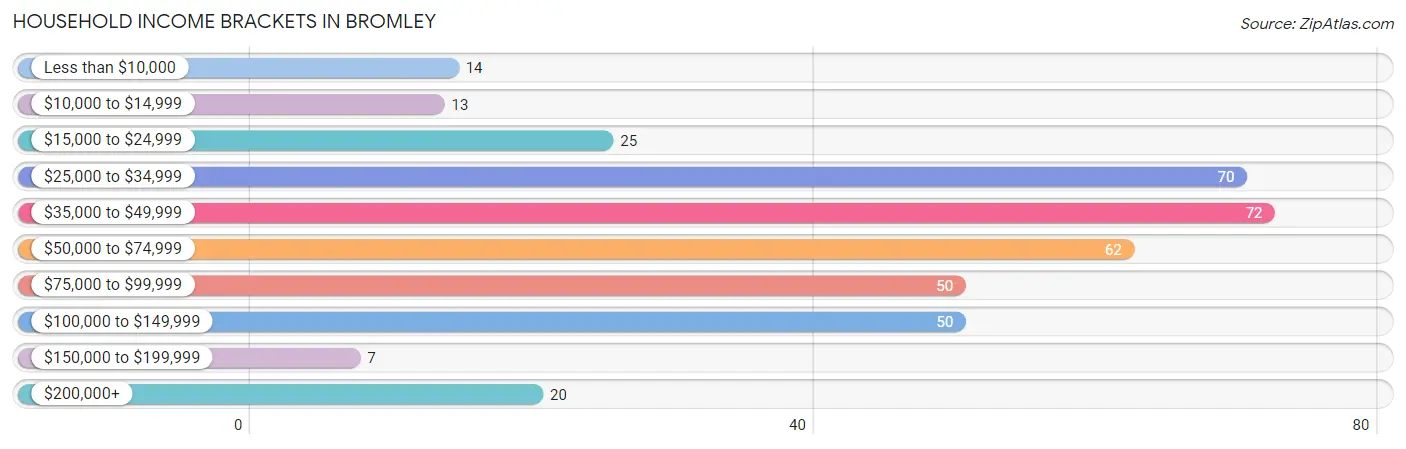
| Income Bracket | # Households | % Households |
| Less than $10,000 | 14 | 3.7% |
| $10,000 to $14,999 | 13 | 3.4% |
| $15,000 to $24,999 | 25 | 6.5% |
| $25,000 to $34,999 | 70 | 18.3% |
| $35,000 to $49,999 | 72 | 18.8% |
| $50,000 to $74,999 | 62 | 16.2% |
| $75,000 to $99,999 | 50 | 13.1% |
| $100,000 to $149,999 | 50 | 13.1% |
| $150,000 to $199,999 | 7 | 1.8% |
| $200,000+ | 20 | 5.2% |
Household Income by Householder Age in Bromley
The median household income in Bromley is $49,432, with the highest median household income of $63,500 found in the 25 to 44 years age bracket for the primary householder. A total of 198 households (51.7%) fall into this category. Meanwhile, the 15 to 24 years age bracket for the primary householder has the lowest median household income of $0, with 3 households (0.8%) in this group.
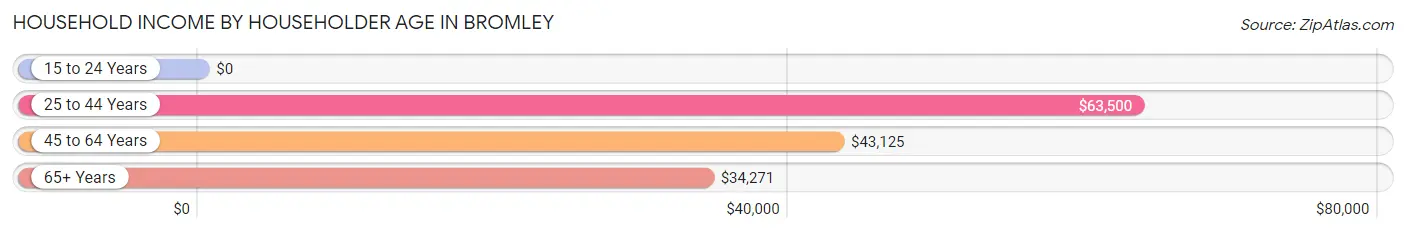
| Income Bracket | # Households | Median Income |
| 15 to 24 Years | 3 (0.8%) | $0 |
| 25 to 44 Years | 198 (51.7%) | $63,500 |
| 45 to 64 Years | 103 (26.9%) | $43,125 |
| 65+ Years | 79 (20.6%) | $34,271 |
| Total | 383 (100.0%) | $49,432 |
Poverty in Bromley
Income Below Poverty by Sex and Age in Bromley
With 2.7% poverty level for males and 12.5% for females among the residents of Bromley, 45 to 54 year old males and 55 to 64 year old females are the most vulnerable to poverty, with 3 males (12.0%) and 18 females (34.0%) in their respective age groups living below the poverty level.
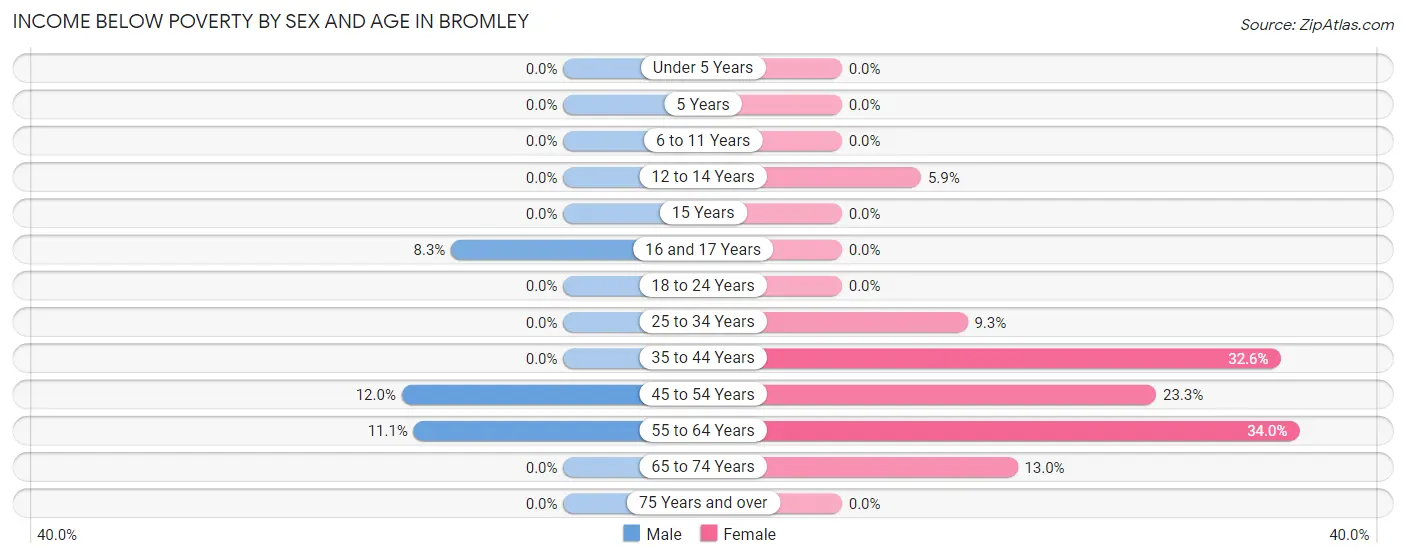
| Age Bracket | Male | Female |
| Under 5 Years | 0 (0.0%) | 0 (0.0%) |
| 5 Years | 0 (0.0%) | 0 (0.0%) |
| 6 to 11 Years | 0 (0.0%) | 0 (0.0%) |
| 12 to 14 Years | 0 (0.0%) | 2 (5.9%) |
| 15 Years | 0 (0.0%) | 0 (0.0%) |
| 16 and 17 Years | 4 (8.3%) | 0 (0.0%) |
| 18 to 24 Years | 0 (0.0%) | 0 (0.0%) |
| 25 to 34 Years | 0 (0.0%) | 7 (9.3%) |
| 35 to 44 Years | 0 (0.0%) | 14 (32.6%) |
| 45 to 54 Years | 3 (12.0%) | 7 (23.3%) |
| 55 to 64 Years | 7 (11.1%) | 18 (34.0%) |
| 65 to 74 Years | 0 (0.0%) | 6 (13.0%) |
| 75 Years and over | 0 (0.0%) | 0 (0.0%) |
| Total | 14 (2.7%) | 54 (12.5%) |
Income Above Poverty by Sex and Age in Bromley
According to the poverty statistics in Bromley, males aged under 5 years and females aged under 5 years are the age groups that are most secure financially, with 100.0% of males and 100.0% of females in these age groups living above the poverty line.
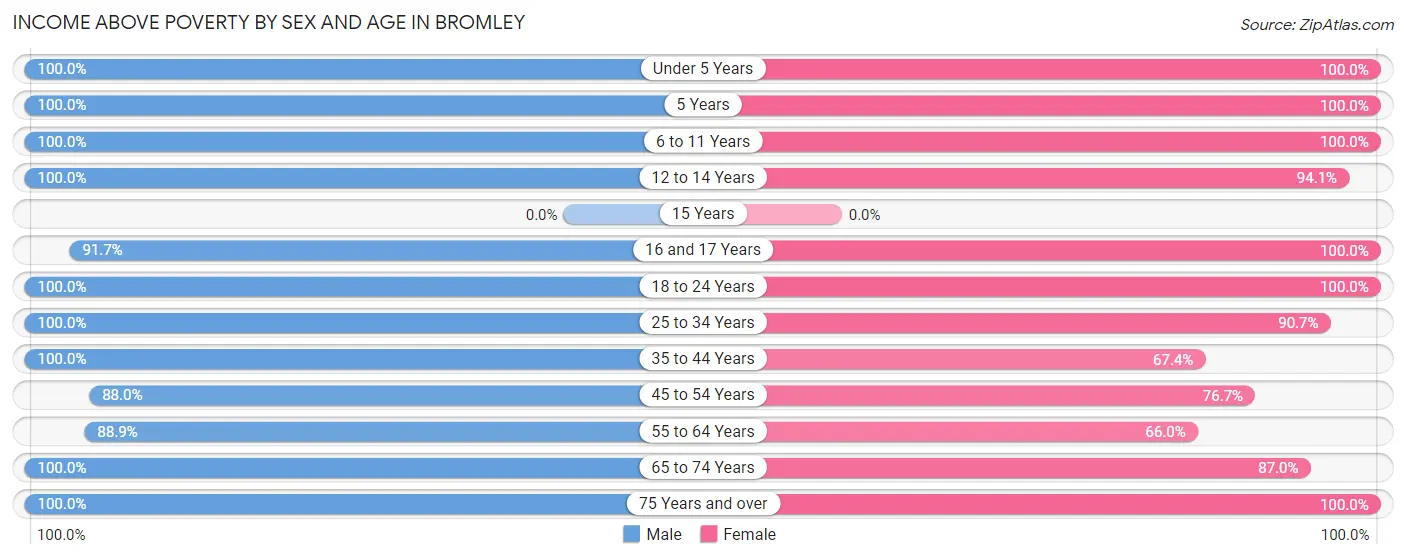
| Age Bracket | Male | Female |
| Under 5 Years | 33 (100.0%) | 67 (100.0%) |
| 5 Years | 11 (100.0%) | 3 (100.0%) |
| 6 to 11 Years | 41 (100.0%) | 49 (100.0%) |
| 12 to 14 Years | 1 (100.0%) | 32 (94.1%) |
| 15 Years | 0 (0.0%) | 0 (0.0%) |
| 16 and 17 Years | 44 (91.7%) | 4 (100.0%) |
| 18 to 24 Years | 14 (100.0%) | 19 (100.0%) |
| 25 to 34 Years | 104 (100.0%) | 68 (90.7%) |
| 35 to 44 Years | 132 (100.0%) | 29 (67.4%) |
| 45 to 54 Years | 22 (88.0%) | 23 (76.7%) |
| 55 to 64 Years | 56 (88.9%) | 35 (66.0%) |
| 65 to 74 Years | 42 (100.0%) | 40 (87.0%) |
| 75 Years and over | 5 (100.0%) | 10 (100.0%) |
| Total | 505 (97.3%) | 379 (87.5%) |
Income Below Poverty Among Married-Couple Families in Bromley
The poverty statistics for married-couple families in Bromley show that 4.4% or 6 of the total 137 families live below the poverty line. Families with no children have the highest poverty rate of 10.3%, comprising of 4 families. On the other hand, families with 3 or 4 children have the lowest poverty rate of 0.0%, which includes 0 families.
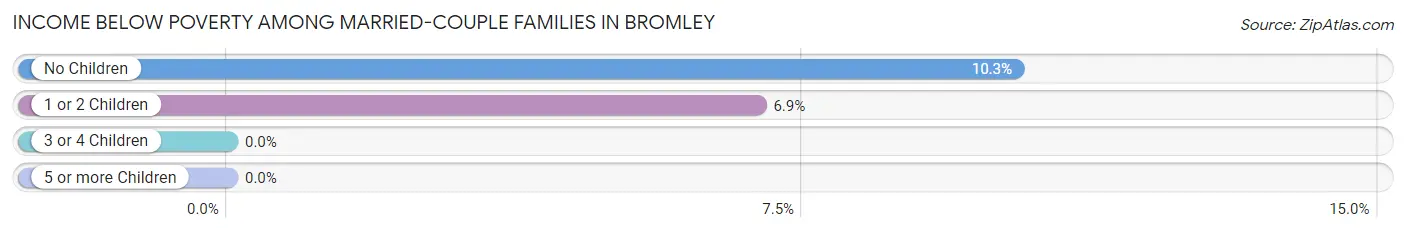
| Children | Above Poverty | Below Poverty |
| No Children | 35 (89.7%) | 4 (10.3%) |
| 1 or 2 Children | 27 (93.1%) | 2 (6.9%) |
| 3 or 4 Children | 69 (100.0%) | 0 (0.0%) |
| 5 or more Children | 0 (0.0%) | 0 (0.0%) |
| Total | 131 (95.6%) | 6 (4.4%) |
Income Below Poverty Among Single-Parent Households in Bromley
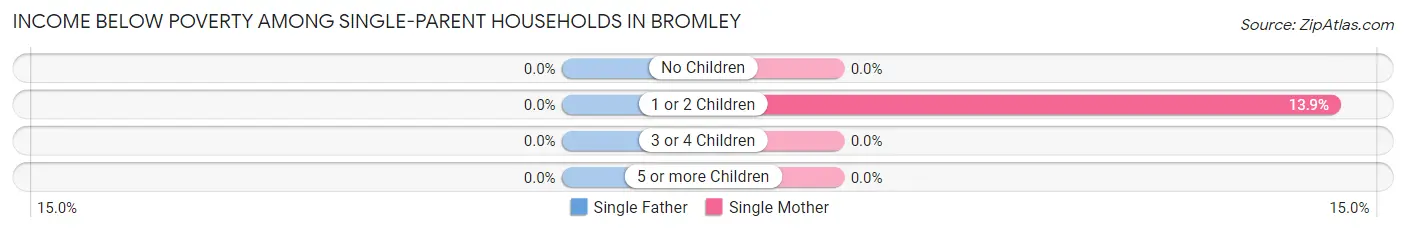
| Children | Single Father | Single Mother |
| No Children | 0 (0.0%) | 0 (0.0%) |
| 1 or 2 Children | 0 (0.0%) | 5 (13.9%) |
| 3 or 4 Children | 0 (0.0%) | 0 (0.0%) |
| 5 or more Children | 0 (0.0%) | 0 (0.0%) |
| Total | 0 (0.0%) | 5 (10.2%) |
Income Below Poverty Among Married-Couple vs Single-Parent Households in Bromley
The poverty data for Bromley shows that 6 of the married-couple family households (4.4%) and 5 of the single-parent households (5.7%) are living below the poverty level. Within the married-couple family households, those with no children have the highest poverty rate, with 4 households (10.3%) falling below the poverty line. Among the single-parent households, those with 1 or 2 children have the highest poverty rate, with 5 household (11.6%) living below poverty.
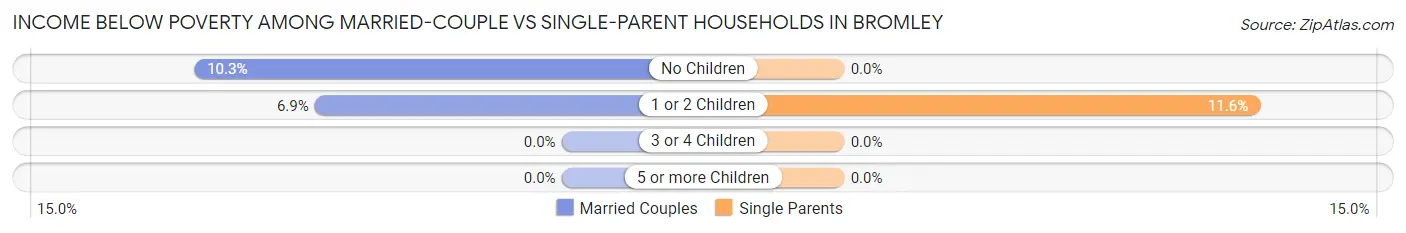
| Children | Married-Couple Families | Single-Parent Households |
| No Children | 4 (10.3%) | 0 (0.0%) |
| 1 or 2 Children | 2 (6.9%) | 5 (11.6%) |
| 3 or 4 Children | 0 (0.0%) | 0 (0.0%) |
| 5 or more Children | 0 (0.0%) | 0 (0.0%) |
| Total | 6 (4.4%) | 5 (5.7%) |
Race in Bromley
The most populous races in Bromley are White / Caucasian (861 | 90.1%), Black / African American (73 | 7.6%), and Two or more Races (20 | 2.1%).
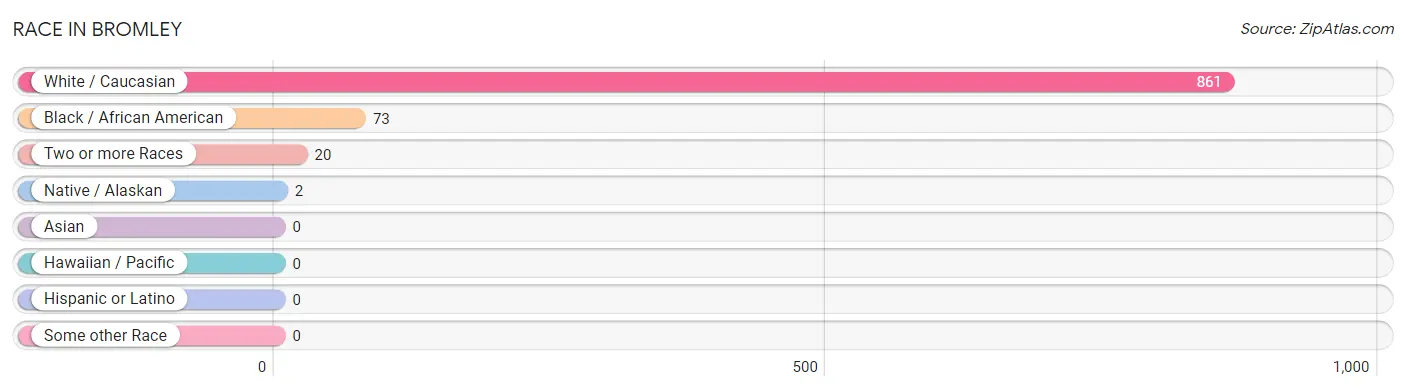
| Race | # Population | % Population |
| Asian | 0 | 0.0% |
| Black / African American | 73 | 7.6% |
| Hawaiian / Pacific | 0 | 0.0% |
| Hispanic or Latino | 0 | 0.0% |
| Native / Alaskan | 2 | 0.2% |
| White / Caucasian | 861 | 90.1% |
| Two or more Races | 20 | 2.1% |
| Some other Race | 0 | 0.0% |
| Total | 956 | 100.0% |
Ancestry in Bromley
The most populous ancestries reported in Bromley are German (223 | 23.3%), American (183 | 19.1%), Irish (175 | 18.3%), Italian (100 | 10.5%), and English (65 | 6.8%), together accounting for 78.0% of all Bromley residents.
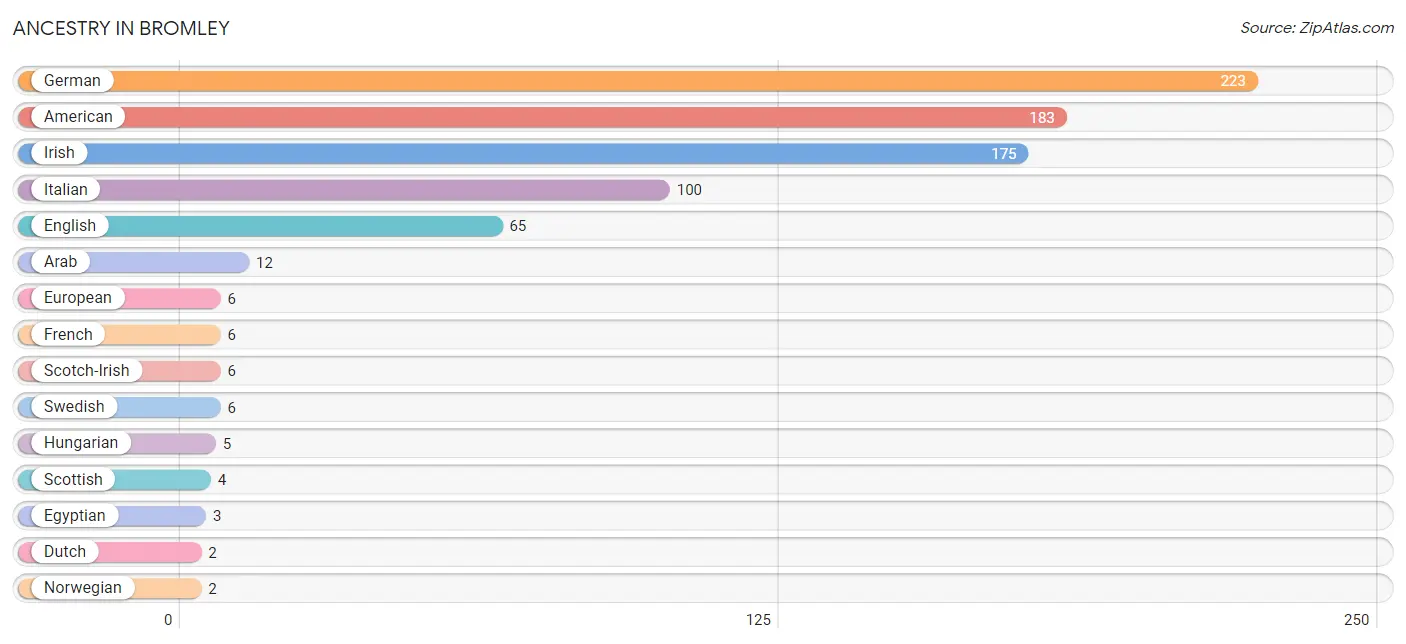
| Ancestry | # Population | % Population |
| American | 183 | 19.1% |
| Apache | 1 | 0.1% |
| Arab | 12 | 1.3% |
| Dutch | 2 | 0.2% |
| Egyptian | 3 | 0.3% |
| English | 65 | 6.8% |
| European | 6 | 0.6% |
| French | 6 | 0.6% |
| German | 223 | 23.3% |
| Hungarian | 5 | 0.5% |
| Inupiat | 1 | 0.1% |
| Irish | 175 | 18.3% |
| Italian | 100 | 10.5% |
| Norwegian | 2 | 0.2% |
| Scotch-Irish | 6 | 0.6% |
| Scottish | 4 | 0.4% |
| Swedish | 6 | 0.6% |
| Welsh | 2 | 0.2% | View All 18 Rows |
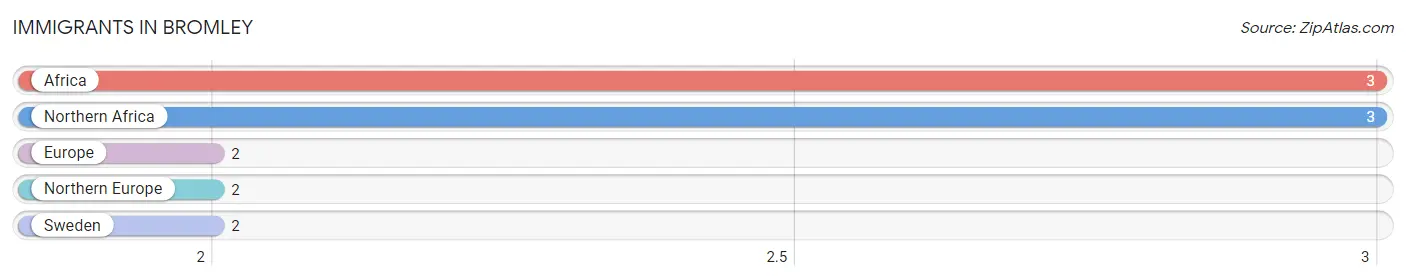
Immigrants in Bromley
The most numerous immigrant groups reported in Bromley came from Africa (3 | 0.3%), Northern Africa (3 | 0.3%), Europe (2 | 0.2%), Northern Europe (2 | 0.2%), and Sweden (2 | 0.2%), together accounting for 1.2% of all Bromley residents.
| Immigration Origin | # Population | % Population |
| Africa | 3 | 0.3% |
| Europe | 2 | 0.2% |
| Northern Africa | 3 | 0.3% |
| Northern Europe | 2 | 0.2% |
| Sweden | 2 | 0.2% | View All 5 Rows |
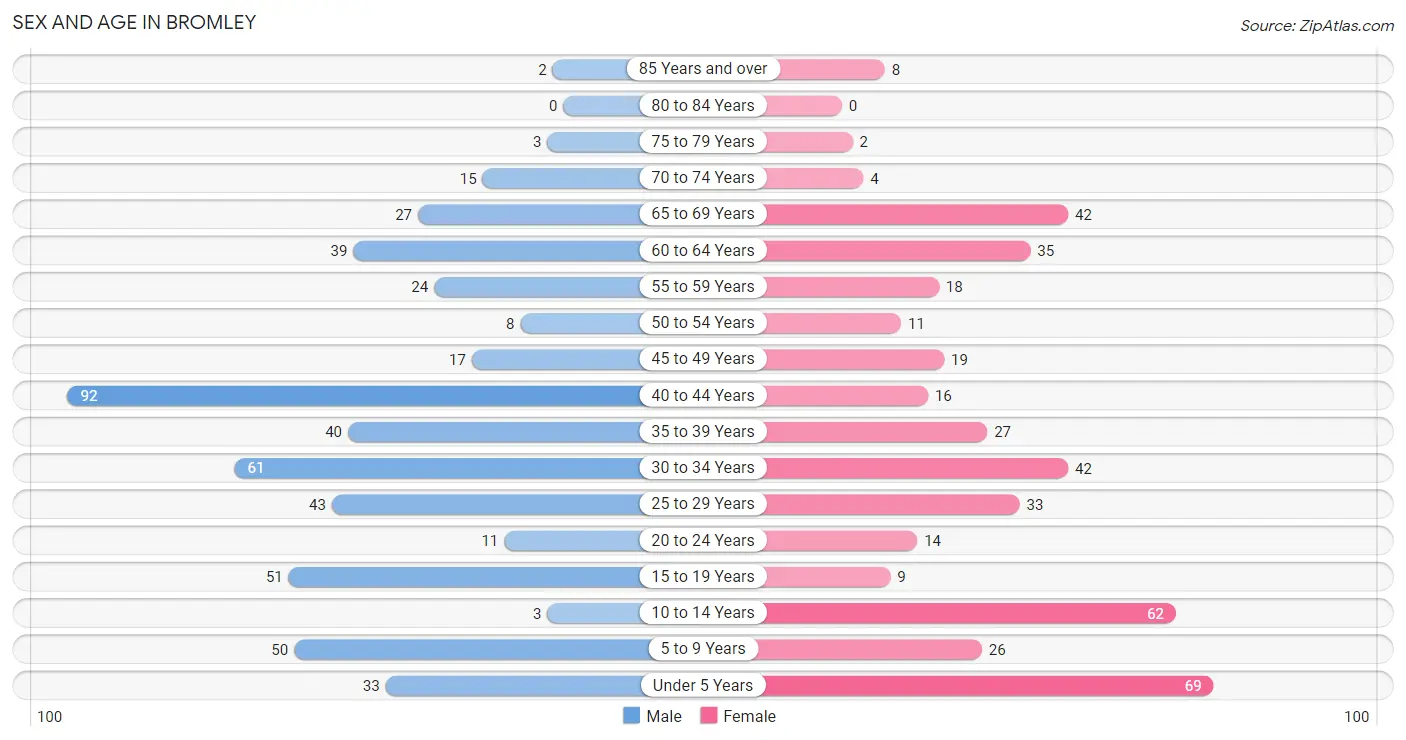
Sex and Age in Bromley
Sex and Age in Bromley
The most populous age groups in Bromley are 40 to 44 Years (92 | 17.7%) for men and Under 5 Years (69 | 15.8%) for women.
| Age Bracket | Male | Female |
| Under 5 Years | 33 (6.4%) | 69 (15.8%) |
| 5 to 9 Years | 50 (9.6%) | 26 (5.9%) |
| 10 to 14 Years | 3 (0.6%) | 62 (14.2%) |
| 15 to 19 Years | 51 (9.8%) | 9 (2.1%) |
| 20 to 24 Years | 11 (2.1%) | 14 (3.2%) |
| 25 to 29 Years | 43 (8.3%) | 33 (7.5%) |
| 30 to 34 Years | 61 (11.7%) | 42 (9.6%) |
| 35 to 39 Years | 40 (7.7%) | 27 (6.2%) |
| 40 to 44 Years | 92 (17.7%) | 16 (3.7%) |
| 45 to 49 Years | 17 (3.3%) | 19 (4.3%) |
| 50 to 54 Years | 8 (1.5%) | 11 (2.5%) |
| 55 to 59 Years | 24 (4.6%) | 18 (4.1%) |
| 60 to 64 Years | 39 (7.5%) | 35 (8.0%) |
| 65 to 69 Years | 27 (5.2%) | 42 (9.6%) |
| 70 to 74 Years | 15 (2.9%) | 4 (0.9%) |
| 75 to 79 Years | 3 (0.6%) | 2 (0.5%) |
| 80 to 84 Years | 0 (0.0%) | 0 (0.0%) |
| 85 Years and over | 2 (0.4%) | 8 (1.8%) |
| Total | 519 (100.0%) | 437 (100.0%) |
Families and Households in Bromley
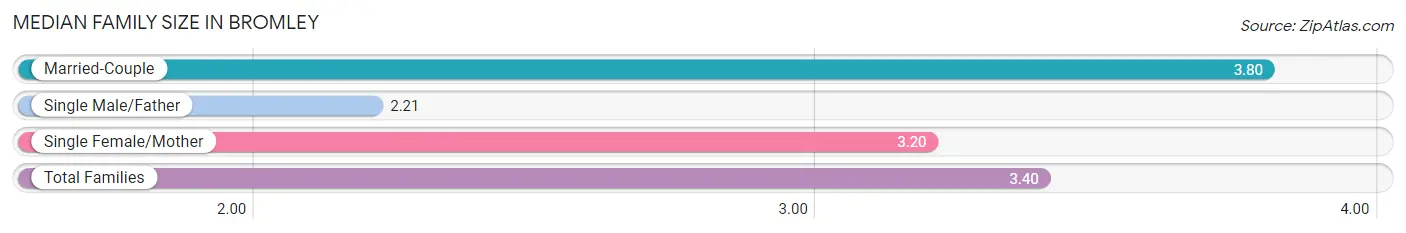
Median Family Size in Bromley
The median family size in Bromley is 3.40 persons per family, with married-couple families (137 | 60.9%) accounting for the largest median family size of 3.8 persons per family. On the other hand, single male/father families (39 | 17.3%) represent the smallest median family size with 2.21 persons per family.
| Family Type | # Families | Family Size |
| Married-Couple | 137 (60.9%) | 3.80 |
| Single Male/Father | 39 (17.3%) | 2.21 |
| Single Female/Mother | 49 (21.8%) | 3.20 |
| Total Families | 225 (100.0%) | 3.40 |
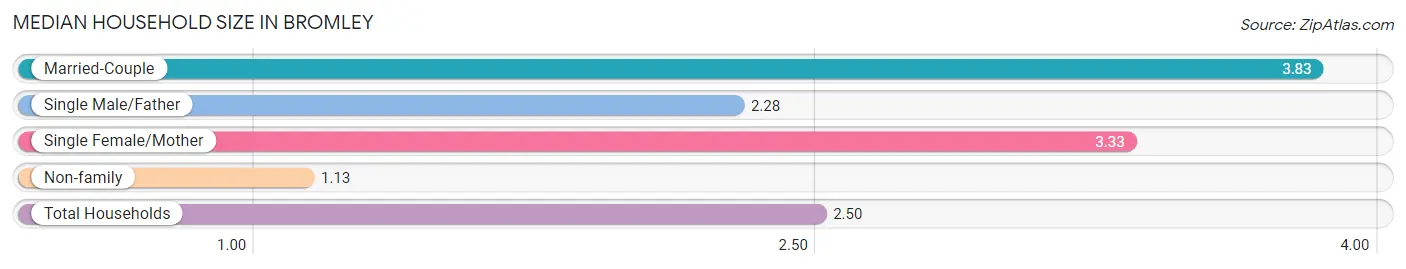
Median Household Size in Bromley
The median household size in Bromley is 2.50 persons per household, with married-couple households (137 | 35.8%) accounting for the largest median household size of 3.83 persons per household. non-family households (158 | 41.2%) represent the smallest median household size with 1.13 persons per household.
| Household Type | # Households | Household Size |
| Married-Couple | 137 (35.8%) | 3.83 |
| Single Male/Father | 39 (10.2%) | 2.28 |
| Single Female/Mother | 49 (12.8%) | 3.33 |
| Non-family | 158 (41.2%) | 1.13 |
| Total Households | 383 (100.0%) | 2.50 |
Household Size by Marriage Status in Bromley
Out of a total of 383 households in Bromley, 225 (58.8%) are family households, while 158 (41.2%) are nonfamily households. The most numerous type of family households are 2-person households, comprising 82, and the most common type of nonfamily households are 1-person households, comprising 137.
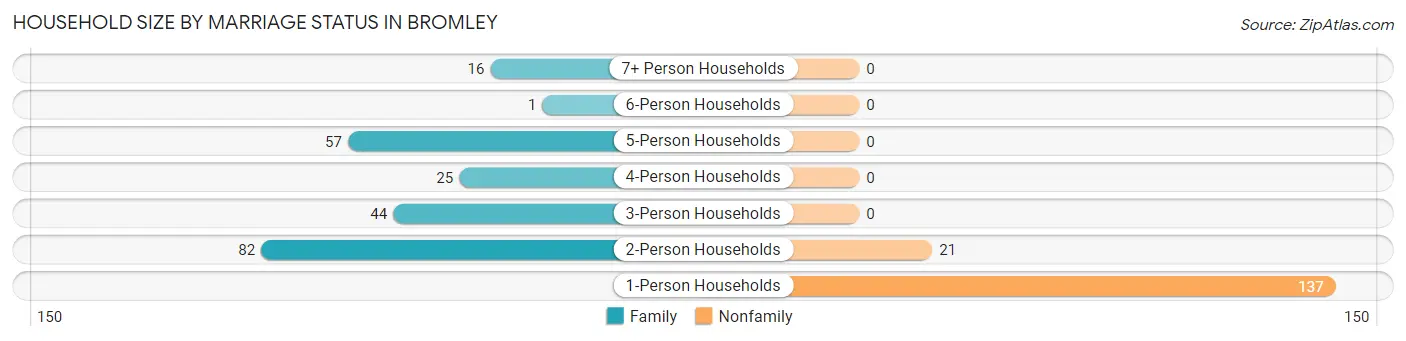
| Household Size | Family Households | Nonfamily Households |
| 1-Person Households | - | 137 (35.8%) |
| 2-Person Households | 82 (21.4%) | 21 (5.5%) |
| 3-Person Households | 44 (11.5%) | 0 (0.0%) |
| 4-Person Households | 25 (6.5%) | 0 (0.0%) |
| 5-Person Households | 57 (14.9%) | 0 (0.0%) |
| 6-Person Households | 1 (0.3%) | 0 (0.0%) |
| 7+ Person Households | 16 (4.2%) | 0 (0.0%) |
| Total | 225 (58.8%) | 158 (41.2%) |
Female Fertility in Bromley
Fertility by Age in Bromley
Average fertility rate in Bromley is 146.0 births per 1,000 women. Women in the age bracket of 20 to 34 years have the highest fertility rate with 225.0 births per 1,000 women. Women in the age bracket of 20 to 34 years acount for 83.3% of all women with births.
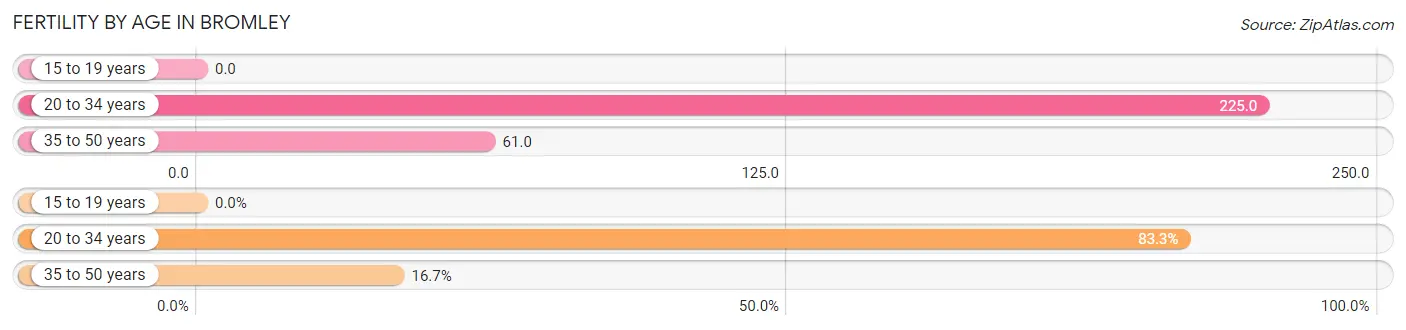
| Age Bracket | Women with Births | Births / 1,000 Women |
| 15 to 19 years | 0 (0.0%) | 0.0 |
| 20 to 34 years | 20 (83.3%) | 225.0 |
| 35 to 50 years | 4 (16.7%) | 61.0 |
| Total | 24 (100.0%) | 146.0 |
Fertility by Age by Marriage Status in Bromley
83.3% of women with births (24) in Bromley are married. The highest percentage of unmarried women with births falls into 20 to 34 years age bracket with 20.0% of them unmarried at the time of birth, while the lowest percentage of unmarried women with births belong to 35 to 50 years age bracket with 0.0% of them unmarried.
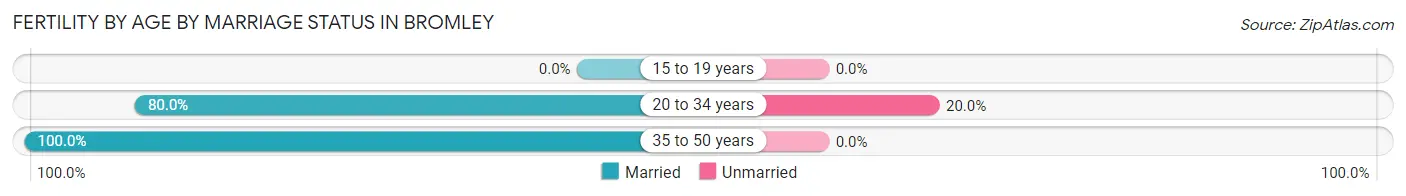
| Age Bracket | Married | Unmarried |
| 15 to 19 years | 0 (0.0%) | 0 (0.0%) |
| 20 to 34 years | 16 (80.0%) | 4 (20.0%) |
| 35 to 50 years | 4 (100.0%) | 0 (0.0%) |
| Total | 20 (83.3%) | 4 (16.7%) |
Fertility by Education in Bromley
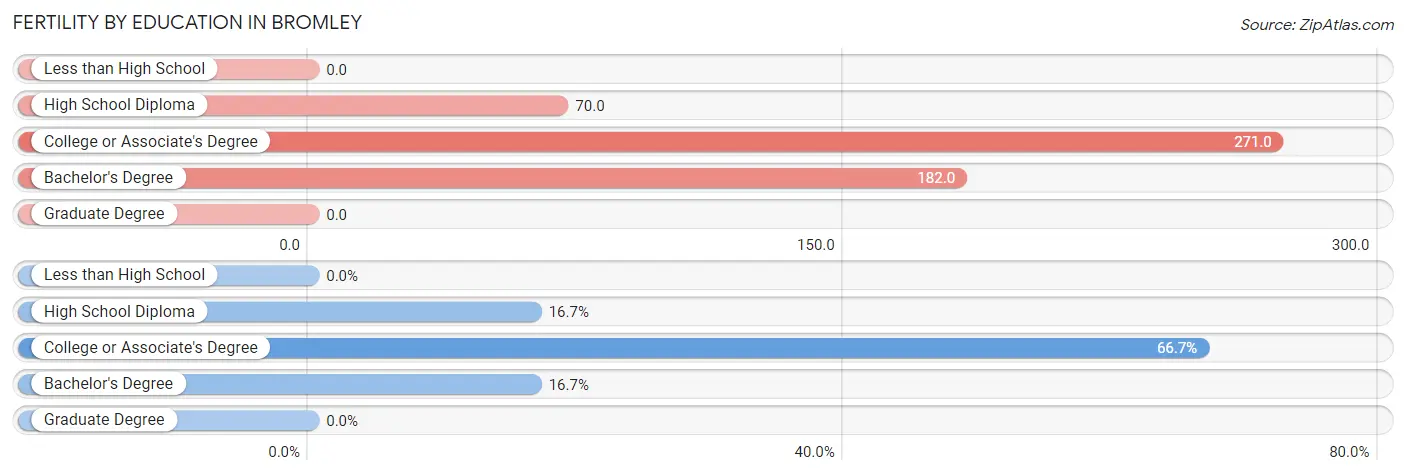
| Educational Attainment | Women with Births | Births / 1,000 Women |
| Less than High School | 0 (0.0%) | 0.0 |
| High School Diploma | 4 (16.7%) | 70.0 |
| College or Associate's Degree | 16 (66.7%) | 271.0 |
| Bachelor's Degree | 4 (16.7%) | 182.0 |
| Graduate Degree | 0 (0.0%) | 0.0 |
| Total | 24 (100.0%) | 146.0 |
Fertility by Education by Marriage Status in Bromley
16.7% of women with births in Bromley are unmarried. Women with the educational attainment of high school diploma are most likely to be married with 100.0% of them married at childbirth, while women with the educational attainment of bachelor's degree are least likely to be married with 100.0% of them unmarried at childbirth.
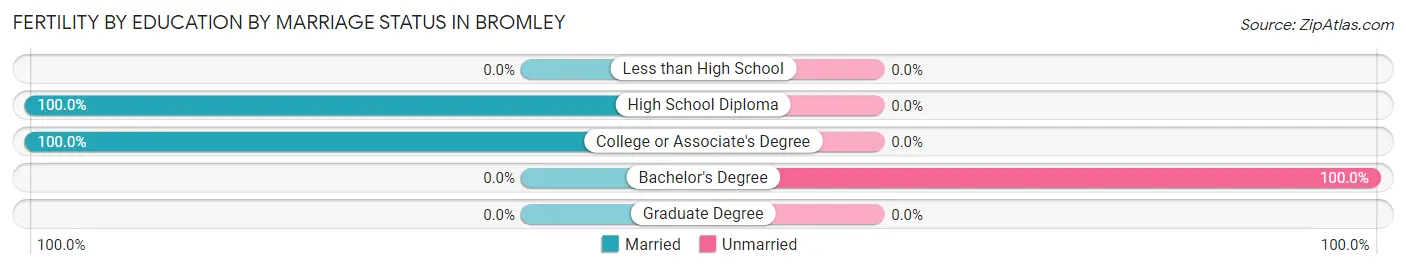
| Educational Attainment | Married | Unmarried |
| Less than High School | 0 (0.0%) | 0 (0.0%) |
| High School Diploma | 4 (100.0%) | 0 (0.0%) |
| College or Associate's Degree | 16 (100.0%) | 0 (0.0%) |
| Bachelor's Degree | 0 (0.0%) | 4 (100.0%) |
| Graduate Degree | 0 (0.0%) | 0 (0.0%) |
| Total | 20 (83.3%) | 4 (16.7%) |
Employment Characteristics in Bromley
Employment by Class of Employer in Bromley
Among the 440 employed individuals in Bromley, private company employees (378 | 85.9%), local government employees (33 | 7.5%), and self-employed (not incorporated) (16 | 3.6%) make up the most common classes of employment.
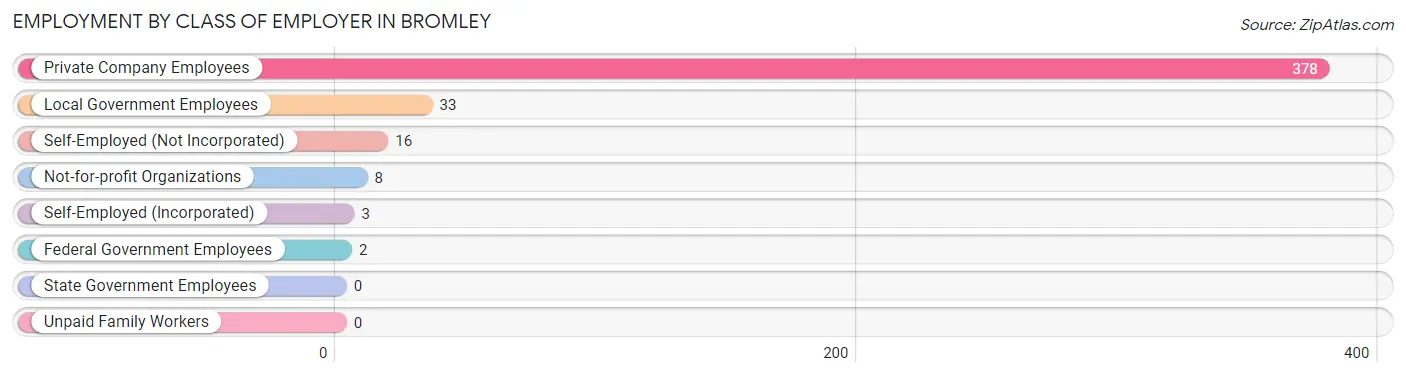
| Employer Class | # Employees | % Employees |
| Private Company Employees | 378 | 85.9% |
| Self-Employed (Incorporated) | 3 | 0.7% |
| Self-Employed (Not Incorporated) | 16 | 3.6% |
| Not-for-profit Organizations | 8 | 1.8% |
| Local Government Employees | 33 | 7.5% |
| State Government Employees | 0 | 0.0% |
| Federal Government Employees | 2 | 0.4% |
| Unpaid Family Workers | 0 | 0.0% |
| Total | 440 | 100.0% |
Employment Status by Age in Bromley
According to the labor force statistics for Bromley, out of the total population over 16 years of age (713), 69.4% or 495 individuals are in the labor force, with 10.1% or 50 of them unemployed. The age group with the highest labor force participation rate is 25 to 29 years, with 100.0% or 76 individuals in the labor force. Within the labor force, the 25 to 29 years age range has the highest percentage of unemployed individuals, with 36.8% or 28 of them being unemployed.
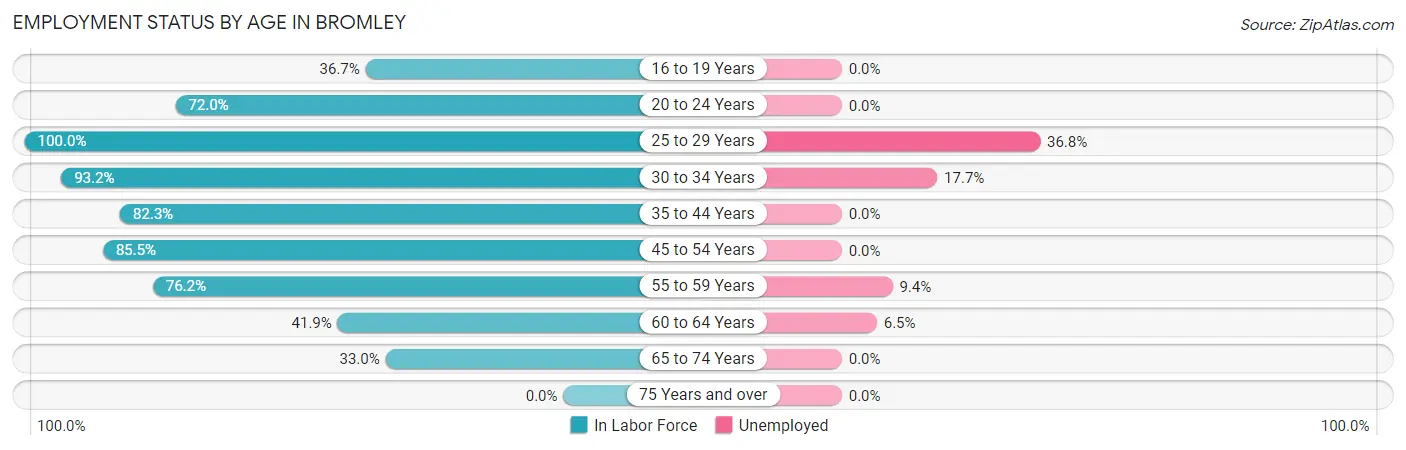
| Age Bracket | In Labor Force | Unemployed |
| 16 to 19 Years | 22 (36.7%) | 0 (0.0%) |
| 20 to 24 Years | 18 (72.0%) | 0 (0.0%) |
| 25 to 29 Years | 76 (100.0%) | 28 (36.8%) |
| 30 to 34 Years | 96 (93.2%) | 17 (17.7%) |
| 35 to 44 Years | 144 (82.3%) | 0 (0.0%) |
| 45 to 54 Years | 47 (85.5%) | 0 (0.0%) |
| 55 to 59 Years | 32 (76.2%) | 3 (9.4%) |
| 60 to 64 Years | 31 (41.9%) | 2 (6.5%) |
| 65 to 74 Years | 29 (33.0%) | 0 (0.0%) |
| 75 Years and over | 0 (0.0%) | 0 (0.0%) |
| Total | 495 (69.4%) | 50 (10.1%) |
Employment Status by Educational Attainment in Bromley
According to labor force statistics for Bromley, 81.1% of individuals (426) out of the total population between 25 and 64 years of age (525) are in the labor force, with 11.7% or 50 of them being unemployed. The group with the highest labor force participation rate are those with the educational attainment of bachelor's degree or higher, with 91.4% or 74 individuals in the labor force. Within the labor force, individuals with high school diploma education have the highest percentage of unemployment, with 21.7% or 47 of them being unemployed.
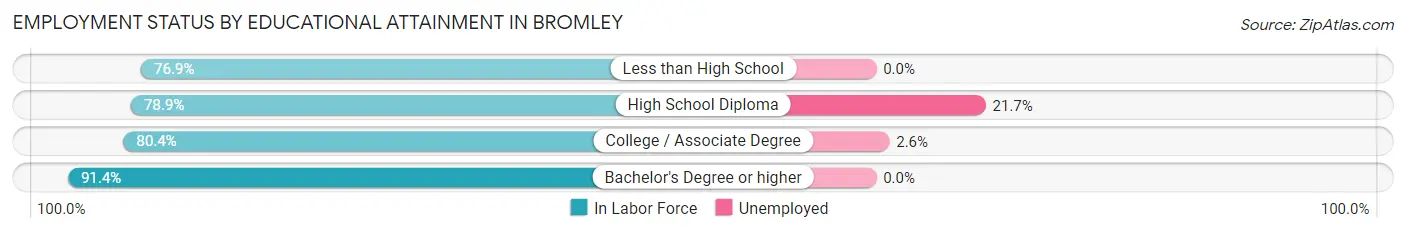
| Educational Attainment | In Labor Force | Unemployed |
| Less than High School | 20 (76.9%) | 0 (0.0%) |
| High School Diploma | 217 (78.9%) | 60 (21.7%) |
| College / Associate Degree | 115 (80.4%) | 4 (2.6%) |
| Bachelor's Degree or higher | 74 (91.4%) | 0 (0.0%) |
| Total | 426 (81.1%) | 61 (11.7%) |
Employment Occupations by Sex in Bromley
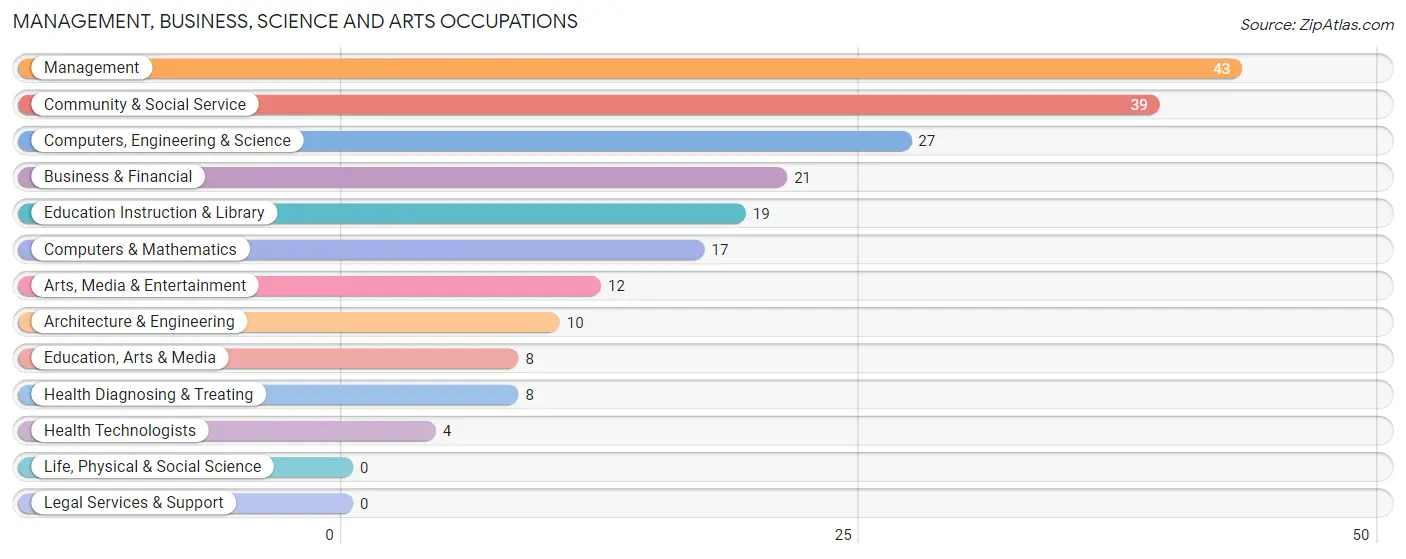
Management, Business, Science and Arts Occupations
The most common Management, Business, Science and Arts occupations in Bromley are Management (43 | 9.7%), Community & Social Service (39 | 8.8%), Computers, Engineering & Science (27 | 6.1%), Business & Financial (21 | 4.7%), and Education Instruction & Library (19 | 4.3%).
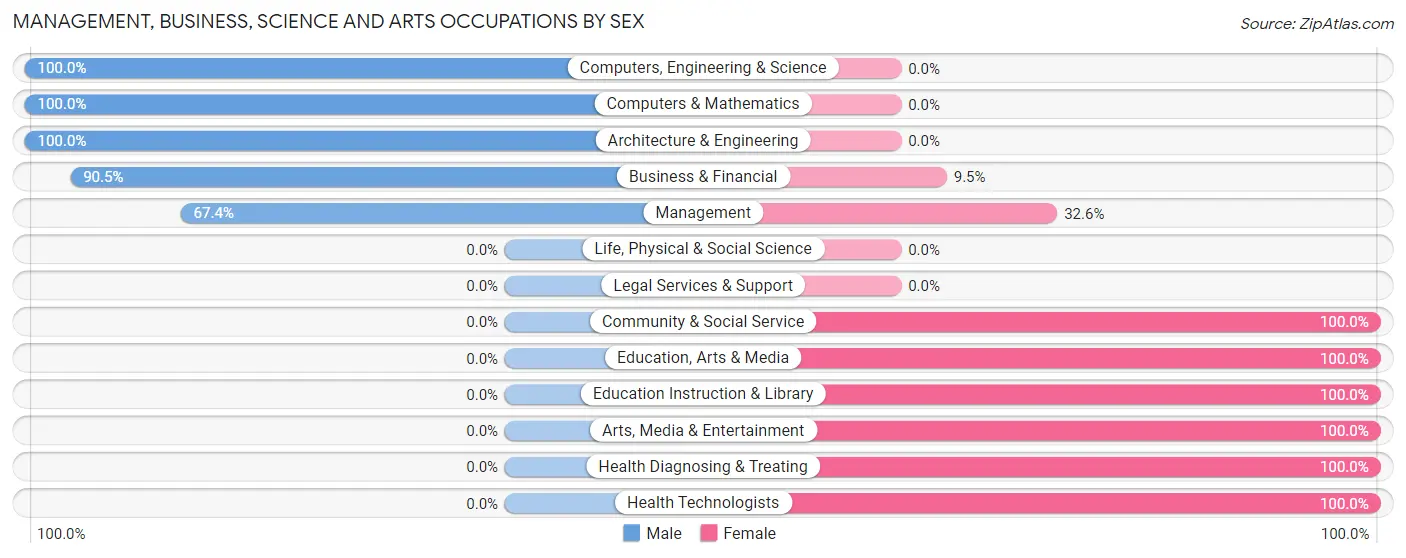
Management, Business, Science and Arts Occupations by Sex
Within the Management, Business, Science and Arts occupations in Bromley, the most male-oriented occupations are Computers, Engineering & Science (100.0%), Computers & Mathematics (100.0%), and Architecture & Engineering (100.0%), while the most female-oriented occupations are Community & Social Service (100.0%), Education, Arts & Media (100.0%), and Education Instruction & Library (100.0%).
| Occupation | Male | Female |
| Management | 29 (67.4%) | 14 (32.6%) |
| Business & Financial | 19 (90.5%) | 2 (9.5%) |
| Computers, Engineering & Science | 27 (100.0%) | 0 (0.0%) |
| Computers & Mathematics | 17 (100.0%) | 0 (0.0%) |
| Architecture & Engineering | 10 (100.0%) | 0 (0.0%) |
| Life, Physical & Social Science | 0 (0.0%) | 0 (0.0%) |
| Community & Social Service | 0 (0.0%) | 39 (100.0%) |
| Education, Arts & Media | 0 (0.0%) | 8 (100.0%) |
| Legal Services & Support | 0 (0.0%) | 0 (0.0%) |
| Education Instruction & Library | 0 (0.0%) | 19 (100.0%) |
| Arts, Media & Entertainment | 0 (0.0%) | 12 (100.0%) |
| Health Diagnosing & Treating | 0 (0.0%) | 8 (100.0%) |
| Health Technologists | 0 (0.0%) | 4 (100.0%) |
| Total (Category) | 75 (54.3%) | 63 (45.7%) |
| Total (Overall) | 263 (59.1%) | 182 (40.9%) |
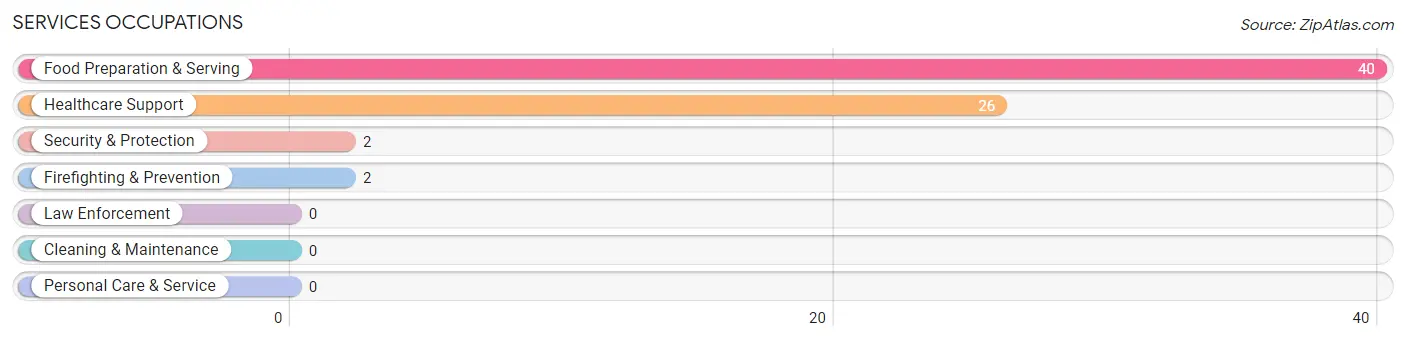
Services Occupations
The most common Services occupations in Bromley are Food Preparation & Serving (40 | 9.0%), Healthcare Support (26 | 5.8%), Security & Protection (2 | 0.4%), and Firefighting & Prevention (2 | 0.4%).
Services Occupations by Sex
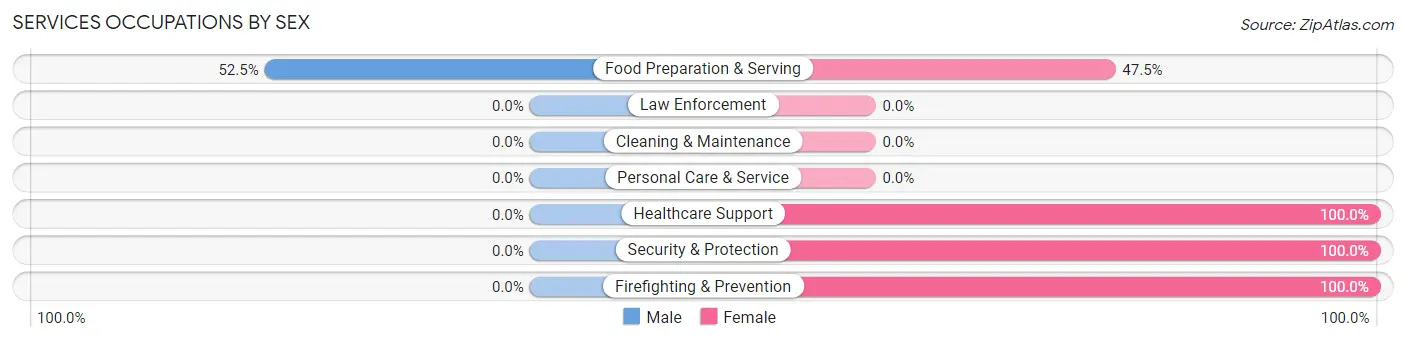
| Occupation | Male | Female |
| Healthcare Support | 0 (0.0%) | 26 (100.0%) |
| Security & Protection | 0 (0.0%) | 2 (100.0%) |
| Firefighting & Prevention | 0 (0.0%) | 2 (100.0%) |
| Law Enforcement | 0 (0.0%) | 0 (0.0%) |
| Food Preparation & Serving | 21 (52.5%) | 19 (47.5%) |
| Cleaning & Maintenance | 0 (0.0%) | 0 (0.0%) |
| Personal Care & Service | 0 (0.0%) | 0 (0.0%) |
| Total (Category) | 21 (30.9%) | 47 (69.1%) |
| Total (Overall) | 263 (59.1%) | 182 (40.9%) |
Sales and Office Occupations
The most common Sales and Office occupations in Bromley are Sales & Related (36 | 8.1%), and Office & Administration (27 | 6.1%).
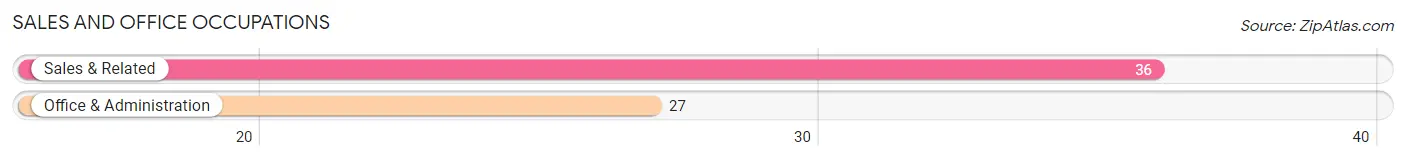
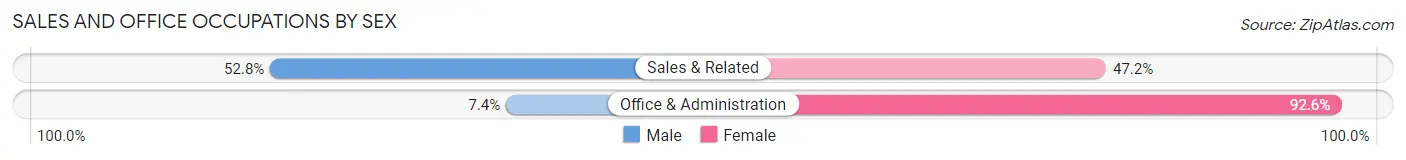
Sales and Office Occupations by Sex
| Occupation | Male | Female |
| Sales & Related | 19 (52.8%) | 17 (47.2%) |
| Office & Administration | 2 (7.4%) | 25 (92.6%) |
| Total (Category) | 21 (33.3%) | 42 (66.7%) |
| Total (Overall) | 263 (59.1%) | 182 (40.9%) |
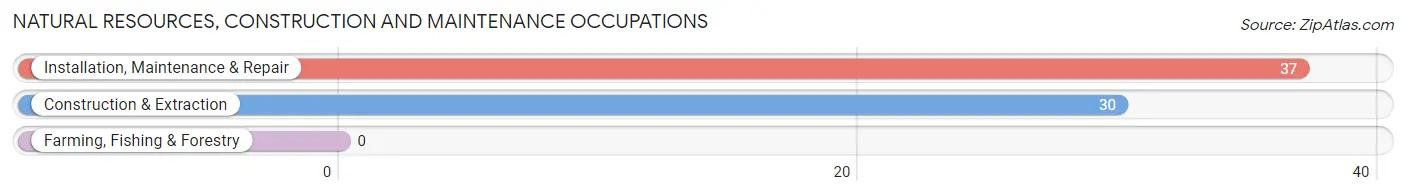
Natural Resources, Construction and Maintenance Occupations
The most common Natural Resources, Construction and Maintenance occupations in Bromley are Installation, Maintenance & Repair (37 | 8.3%), and Construction & Extraction (30 | 6.7%).
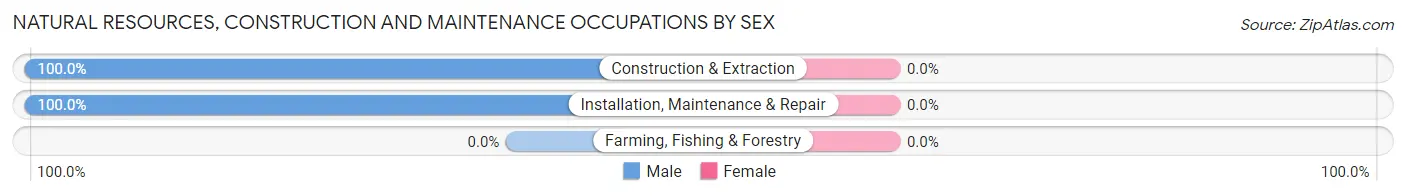
Natural Resources, Construction and Maintenance Occupations by Sex
| Occupation | Male | Female |
| Farming, Fishing & Forestry | 0 (0.0%) | 0 (0.0%) |
| Construction & Extraction | 30 (100.0%) | 0 (0.0%) |
| Installation, Maintenance & Repair | 37 (100.0%) | 0 (0.0%) |
| Total (Category) | 67 (100.0%) | 0 (0.0%) |
| Total (Overall) | 263 (59.1%) | 182 (40.9%) |
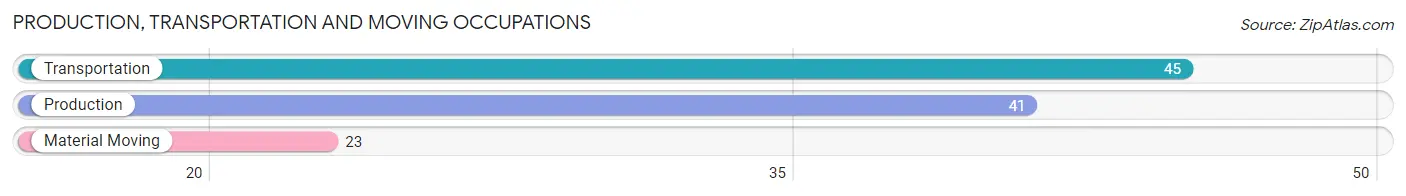
Production, Transportation and Moving Occupations
The most common Production, Transportation and Moving occupations in Bromley are Transportation (45 | 10.1%), Production (41 | 9.2%), and Material Moving (23 | 5.2%).
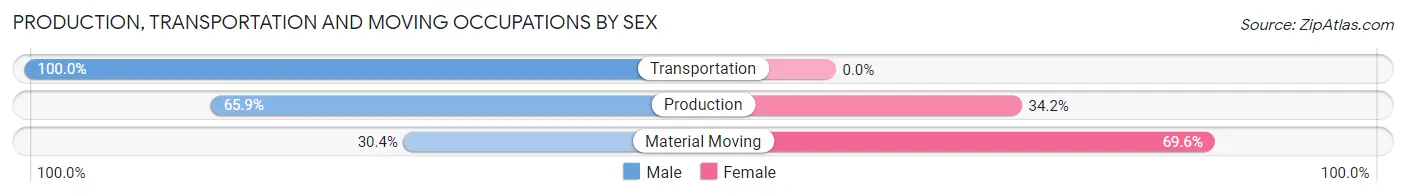
Production, Transportation and Moving Occupations by Sex
| Occupation | Male | Female |
| Production | 27 (65.8%) | 14 (34.2%) |
| Transportation | 45 (100.0%) | 0 (0.0%) |
| Material Moving | 7 (30.4%) | 16 (69.6%) |
| Total (Category) | 79 (72.5%) | 30 (27.5%) |
| Total (Overall) | 263 (59.1%) | 182 (40.9%) |
Employment Industries by Sex in Bromley
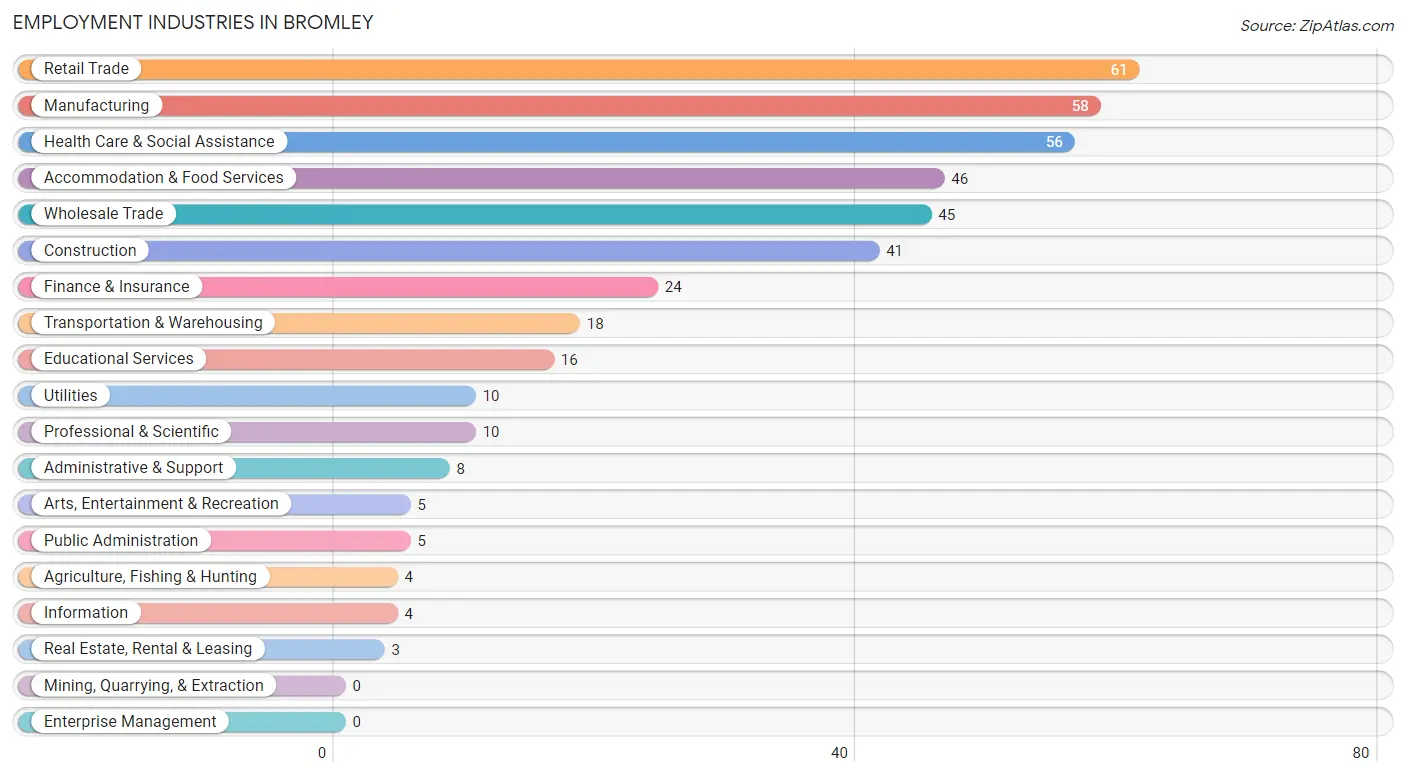
Employment Industries in Bromley
The major employment industries in Bromley include Retail Trade (61 | 13.7%), Manufacturing (58 | 13.0%), Health Care & Social Assistance (56 | 12.6%), Accommodation & Food Services (46 | 10.3%), and Wholesale Trade (45 | 10.1%).
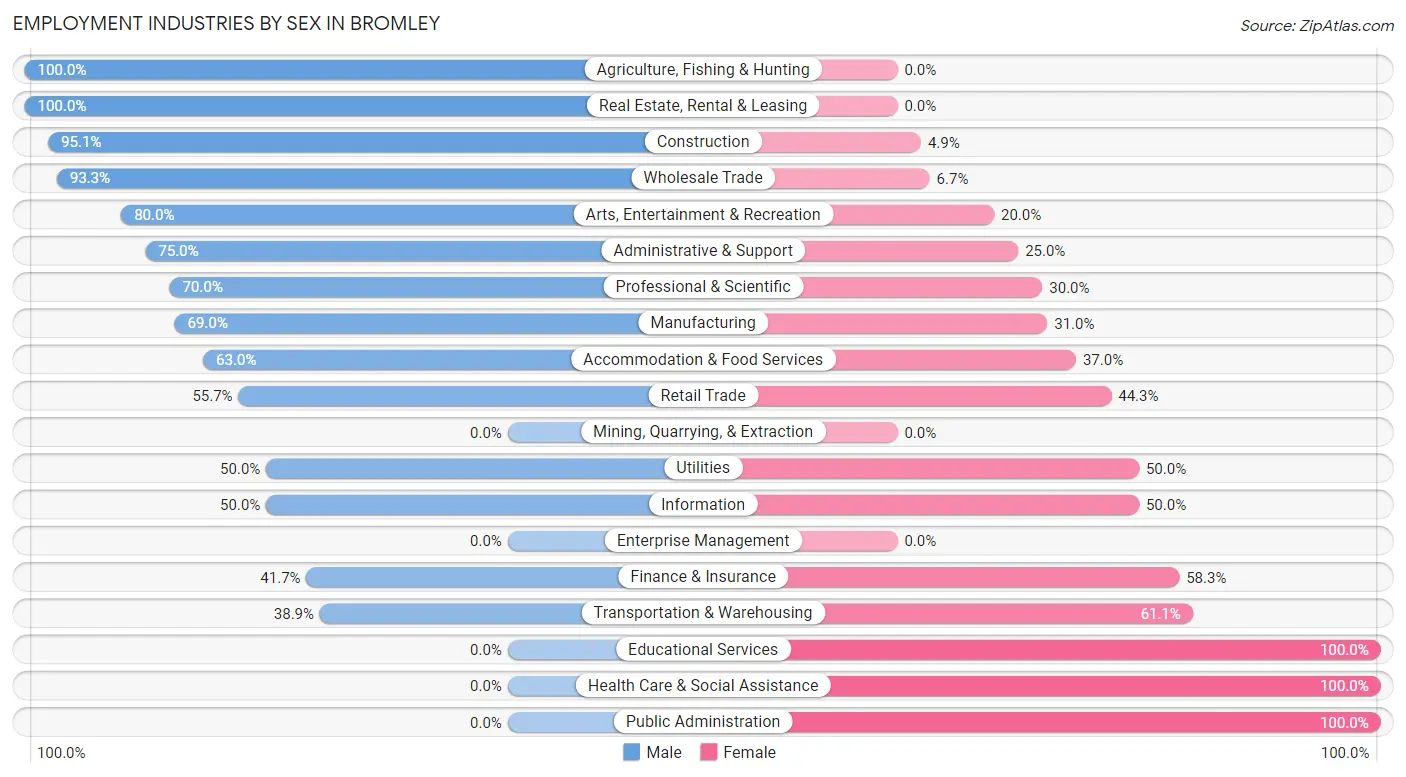
Employment Industries by Sex in Bromley
The Bromley industries that see more men than women are Agriculture, Fishing & Hunting (100.0%), Real Estate, Rental & Leasing (100.0%), and Construction (95.1%), whereas the industries that tend to have a higher number of women are Educational Services (100.0%), Health Care & Social Assistance (100.0%), and Public Administration (100.0%).
| Industry | Male | Female |
| Agriculture, Fishing & Hunting | 4 (100.0%) | 0 (0.0%) |
| Mining, Quarrying, & Extraction | 0 (0.0%) | 0 (0.0%) |
| Construction | 39 (95.1%) | 2 (4.9%) |
| Manufacturing | 40 (69.0%) | 18 (31.0%) |
| Wholesale Trade | 42 (93.3%) | 3 (6.7%) |
| Retail Trade | 34 (55.7%) | 27 (44.3%) |
| Transportation & Warehousing | 7 (38.9%) | 11 (61.1%) |
| Utilities | 5 (50.0%) | 5 (50.0%) |
| Information | 2 (50.0%) | 2 (50.0%) |
| Finance & Insurance | 10 (41.7%) | 14 (58.3%) |
| Real Estate, Rental & Leasing | 3 (100.0%) | 0 (0.0%) |
| Professional & Scientific | 7 (70.0%) | 3 (30.0%) |
| Enterprise Management | 0 (0.0%) | 0 (0.0%) |
| Administrative & Support | 6 (75.0%) | 2 (25.0%) |
| Educational Services | 0 (0.0%) | 16 (100.0%) |
| Health Care & Social Assistance | 0 (0.0%) | 56 (100.0%) |
| Arts, Entertainment & Recreation | 4 (80.0%) | 1 (20.0%) |
| Accommodation & Food Services | 29 (63.0%) | 17 (37.0%) |
| Public Administration | 0 (0.0%) | 5 (100.0%) |
| Total | 263 (59.1%) | 182 (40.9%) |
Education in Bromley
School Enrollment in Bromley
The most common levels of schooling among the 249 students in Bromley are elementary school (70 | 28.1%), high school (68 | 27.3%), and nursery / preschool (44 | 17.7%).
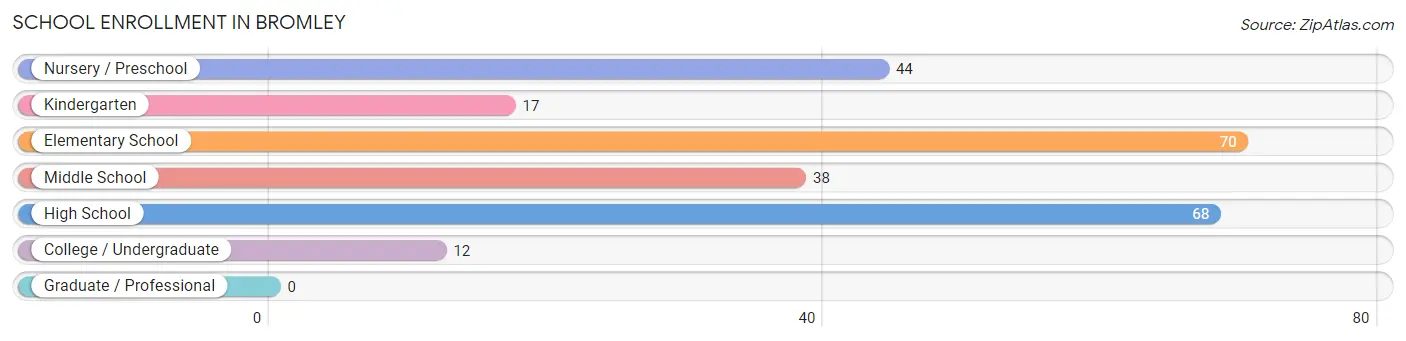
| School Level | # Students | % Students |
| Nursery / Preschool | 44 | 17.7% |
| Kindergarten | 17 | 6.8% |
| Elementary School | 70 | 28.1% |
| Middle School | 38 | 15.3% |
| High School | 68 | 27.3% |
| College / Undergraduate | 12 | 4.8% |
| Graduate / Professional | 0 | 0.0% |
| Total | 249 | 100.0% |
School Enrollment by Age by Funding Source in Bromley
Out of a total of 249 students who are enrolled in schools in Bromley, 46 (18.5%) attend a private institution, while the remaining 203 (81.5%) are enrolled in public schools. The age group of 3 to 4 year olds has the highest likelihood of being enrolled in private schools, with 21 (63.6% in the age bracket) enrolled. Conversely, the age group of 15 to 17 year olds has the lowest likelihood of being enrolled in a private school, with 52 (100.0% in the age bracket) attending a public institution.
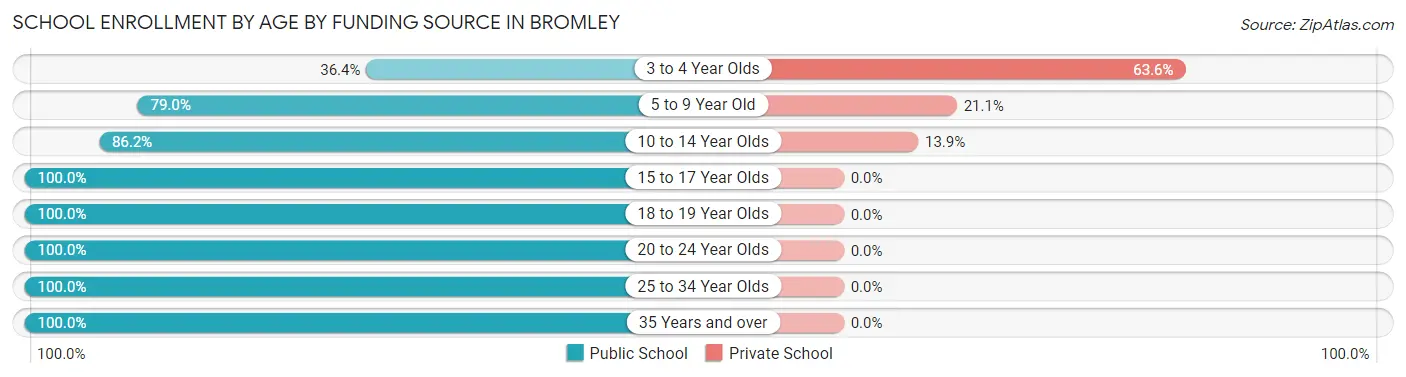
| Age Bracket | Public School | Private School |
| 3 to 4 Year Olds | 12 (36.4%) | 21 (63.6%) |
| 5 to 9 Year Old | 60 (78.9%) | 16 (21.0%) |
| 10 to 14 Year Olds | 56 (86.2%) | 9 (13.9%) |
| 15 to 17 Year Olds | 52 (100.0%) | 0 (0.0%) |
| 18 to 19 Year Olds | 2 (100.0%) | 0 (0.0%) |
| 20 to 24 Year Olds | 4 (100.0%) | 0 (0.0%) |
| 25 to 34 Year Olds | 8 (100.0%) | 0 (0.0%) |
| 35 Years and over | 9 (100.0%) | 0 (0.0%) |
| Total | 203 (81.5%) | 46 (18.5%) |
Educational Attainment by Field of Study in Bromley
Business (21 | 23.1%), education (18 | 19.8%), multidisciplinary studies (17 | 18.7%), arts & humanities (7 | 7.7%), and computers & mathematics (4 | 4.4%) are the most common fields of study among 91 individuals in Bromley who have obtained a bachelor's degree or higher.
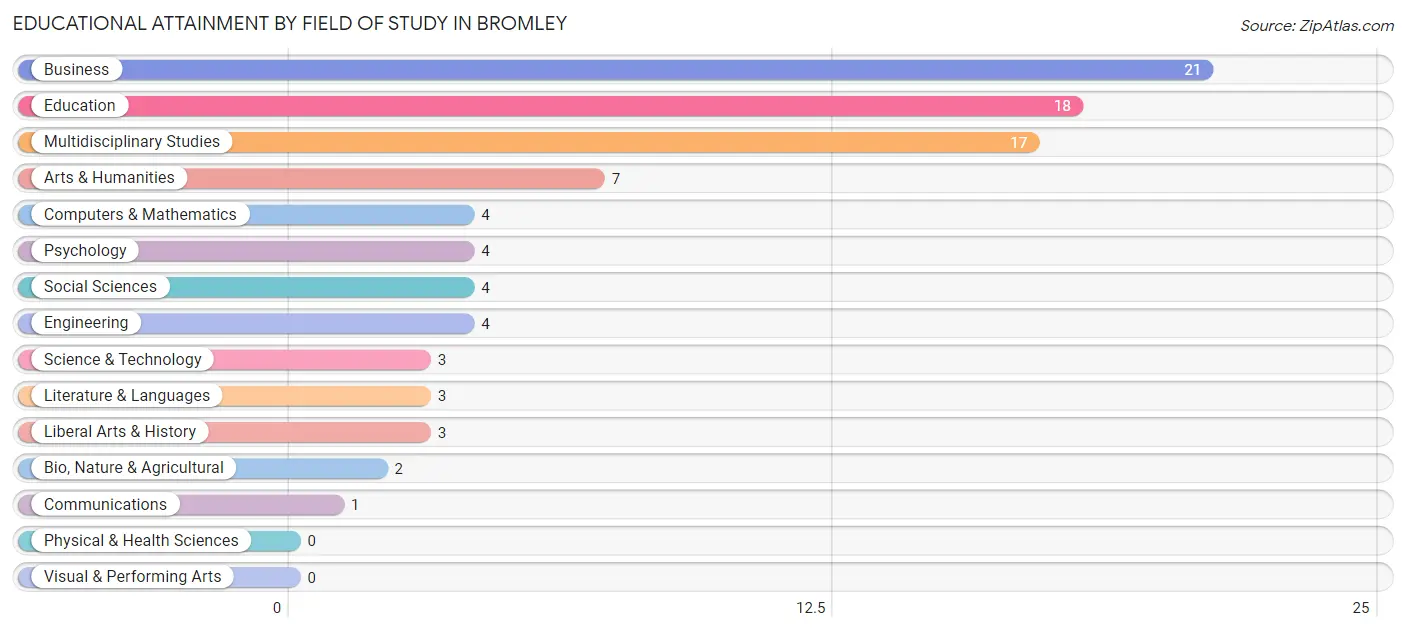
| Field of Study | # Graduates | % Graduates |
| Computers & Mathematics | 4 | 4.4% |
| Bio, Nature & Agricultural | 2 | 2.2% |
| Physical & Health Sciences | 0 | 0.0% |
| Psychology | 4 | 4.4% |
| Social Sciences | 4 | 4.4% |
| Engineering | 4 | 4.4% |
| Multidisciplinary Studies | 17 | 18.7% |
| Science & Technology | 3 | 3.3% |
| Business | 21 | 23.1% |
| Education | 18 | 19.8% |
| Literature & Languages | 3 | 3.3% |
| Liberal Arts & History | 3 | 3.3% |
| Visual & Performing Arts | 0 | 0.0% |
| Communications | 1 | 1.1% |
| Arts & Humanities | 7 | 7.7% |
| Total | 91 | 100.0% |
Transportation & Commute in Bromley
Vehicle Availability by Sex in Bromley
The most prevalent vehicle ownership categories in Bromley are males with 2 vehicles (75, accounting for 28.5%) and females with 2 vehicles (63, making up 42.4%).
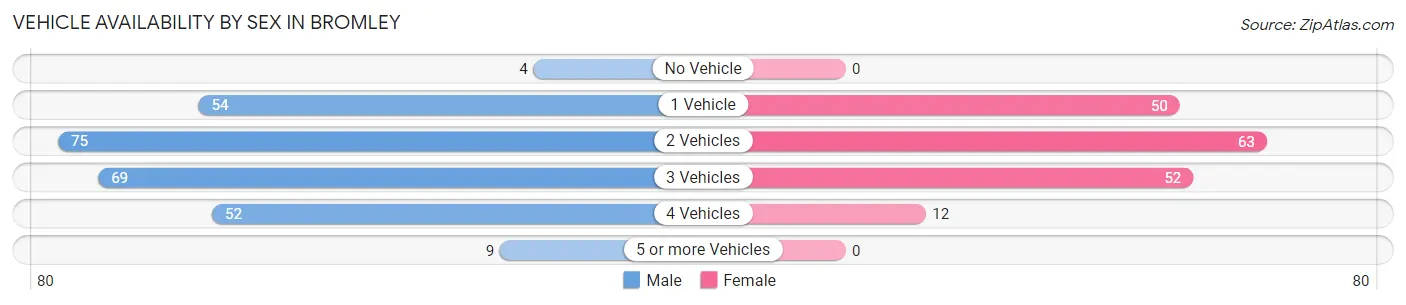
| Vehicles Available | Male | Female |
| No Vehicle | 4 (1.5%) | 0 (0.0%) |
| 1 Vehicle | 54 (20.5%) | 50 (28.2%) |
| 2 Vehicles | 75 (28.5%) | 63 (35.6%) |
| 3 Vehicles | 69 (26.2%) | 52 (29.4%) |
| 4 Vehicles | 52 (19.8%) | 12 (6.8%) |
| 5 or more Vehicles | 9 (3.4%) | 0 (0.0%) |
| Total | 263 (100.0%) | 177 (100.0%) |
Commute Time in Bromley
The most frequently occuring commute durations in Bromley are 15 to 19 minutes (103 commuters, 24.7%), 10 to 14 minutes (76 commuters, 18.2%), and 30 to 34 minutes (75 commuters, 18.0%).
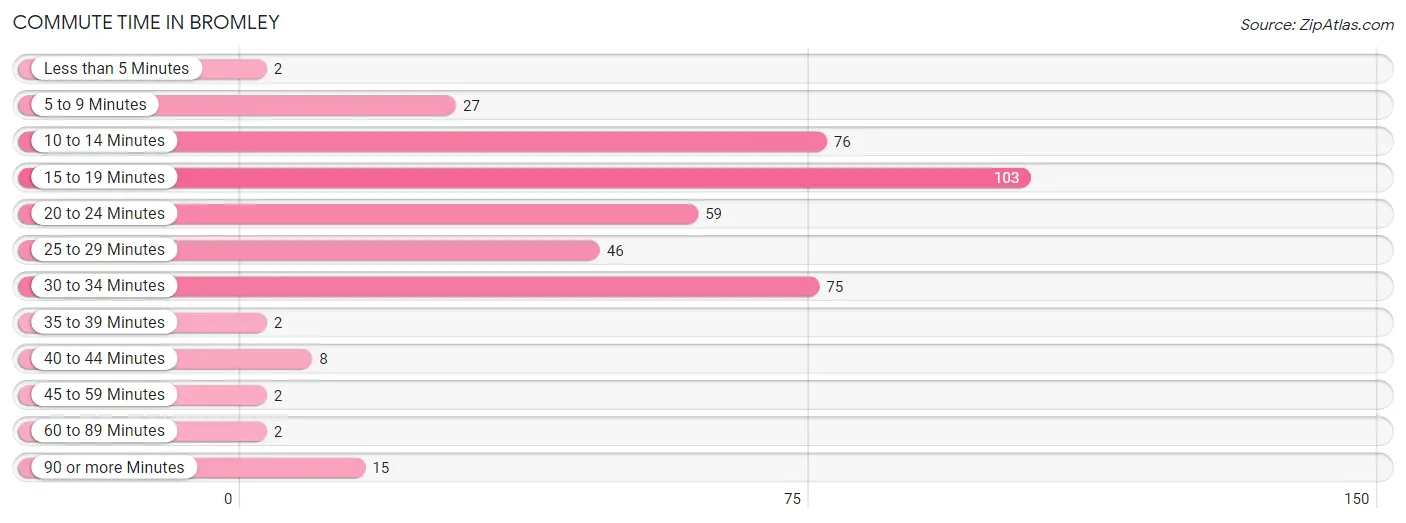
| Commute Time | # Commuters | % Commuters |
| Less than 5 Minutes | 2 | 0.5% |
| 5 to 9 Minutes | 27 | 6.5% |
| 10 to 14 Minutes | 76 | 18.2% |
| 15 to 19 Minutes | 103 | 24.7% |
| 20 to 24 Minutes | 59 | 14.1% |
| 25 to 29 Minutes | 46 | 11.0% |
| 30 to 34 Minutes | 75 | 18.0% |
| 35 to 39 Minutes | 2 | 0.5% |
| 40 to 44 Minutes | 8 | 1.9% |
| 45 to 59 Minutes | 2 | 0.5% |
| 60 to 89 Minutes | 2 | 0.5% |
| 90 or more Minutes | 15 | 3.6% |
Commute Time by Sex in Bromley
The most common commute times in Bromley are 30 to 34 minutes (55 commuters, 22.1%) for males and 15 to 19 minutes (86 commuters, 51.2%) for females.
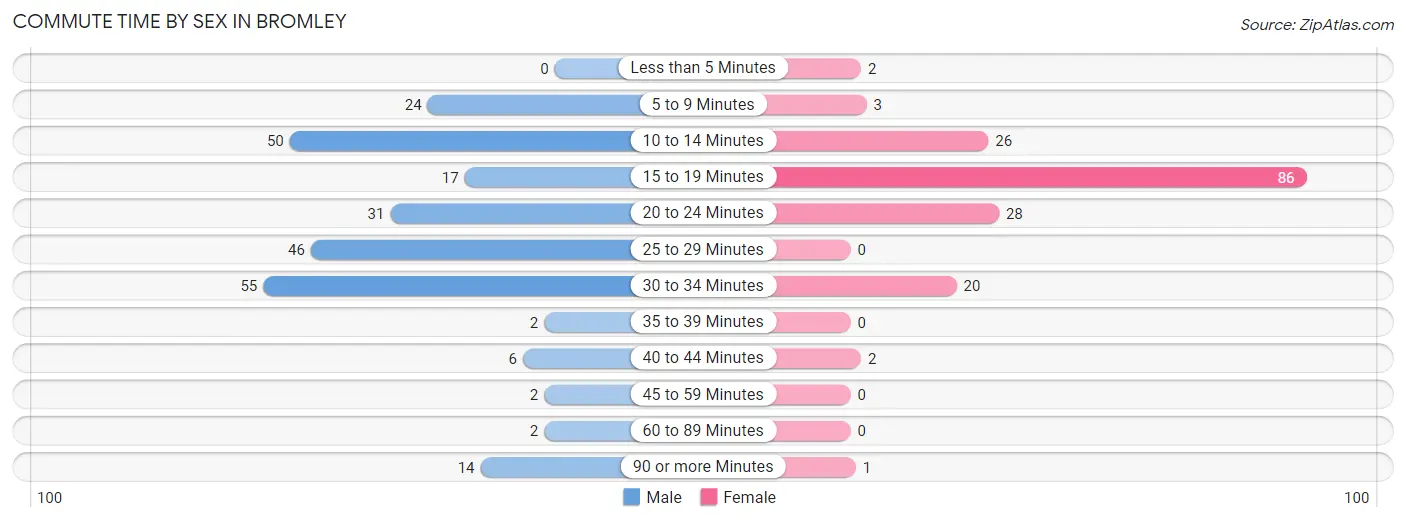
| Commute Time | Male | Female |
| Less than 5 Minutes | 0 (0.0%) | 2 (1.2%) |
| 5 to 9 Minutes | 24 (9.6%) | 3 (1.8%) |
| 10 to 14 Minutes | 50 (20.1%) | 26 (15.5%) |
| 15 to 19 Minutes | 17 (6.8%) | 86 (51.2%) |
| 20 to 24 Minutes | 31 (12.4%) | 28 (16.7%) |
| 25 to 29 Minutes | 46 (18.5%) | 0 (0.0%) |
| 30 to 34 Minutes | 55 (22.1%) | 20 (11.9%) |
| 35 to 39 Minutes | 2 (0.8%) | 0 (0.0%) |
| 40 to 44 Minutes | 6 (2.4%) | 2 (1.2%) |
| 45 to 59 Minutes | 2 (0.8%) | 0 (0.0%) |
| 60 to 89 Minutes | 2 (0.8%) | 0 (0.0%) |
| 90 or more Minutes | 14 (5.6%) | 1 (0.6%) |
Time of Departure to Work by Sex in Bromley
The most frequent times of departure to work in Bromley are 6:00 AM to 6:29 AM (63, 25.3%) for males and 6:30 AM to 6:59 AM (43, 25.6%) for females.
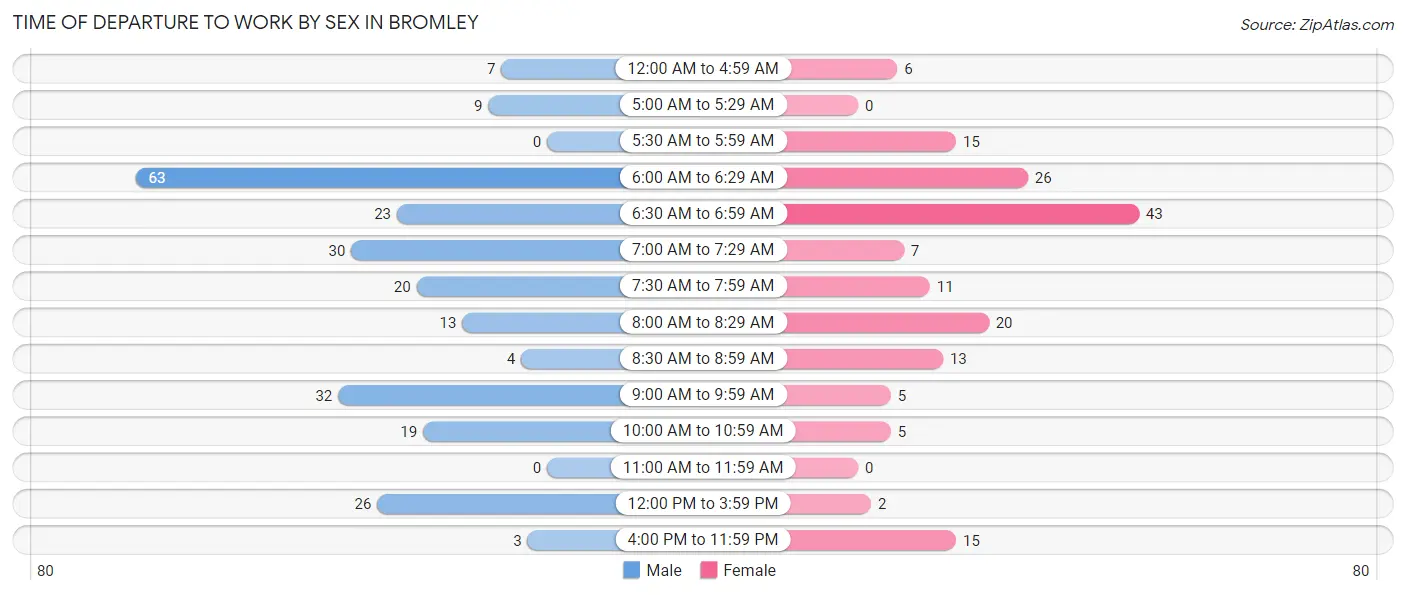
| Time of Departure | Male | Female |
| 12:00 AM to 4:59 AM | 7 (2.8%) | 6 (3.6%) |
| 5:00 AM to 5:29 AM | 9 (3.6%) | 0 (0.0%) |
| 5:30 AM to 5:59 AM | 0 (0.0%) | 15 (8.9%) |
| 6:00 AM to 6:29 AM | 63 (25.3%) | 26 (15.5%) |
| 6:30 AM to 6:59 AM | 23 (9.2%) | 43 (25.6%) |
| 7:00 AM to 7:29 AM | 30 (12.0%) | 7 (4.2%) |
| 7:30 AM to 7:59 AM | 20 (8.0%) | 11 (6.6%) |
| 8:00 AM to 8:29 AM | 13 (5.2%) | 20 (11.9%) |
| 8:30 AM to 8:59 AM | 4 (1.6%) | 13 (7.7%) |
| 9:00 AM to 9:59 AM | 32 (12.9%) | 5 (3.0%) |
| 10:00 AM to 10:59 AM | 19 (7.6%) | 5 (3.0%) |
| 11:00 AM to 11:59 AM | 0 (0.0%) | 0 (0.0%) |
| 12:00 PM to 3:59 PM | 26 (10.4%) | 2 (1.2%) |
| 4:00 PM to 11:59 PM | 3 (1.2%) | 15 (8.9%) |
| Total | 249 (100.0%) | 168 (100.0%) |
Housing Occupancy in Bromley
Occupancy by Ownership in Bromley
Of the total 383 dwellings in Bromley, owner-occupied units account for 282 (73.6%), while renter-occupied units make up 101 (26.4%).
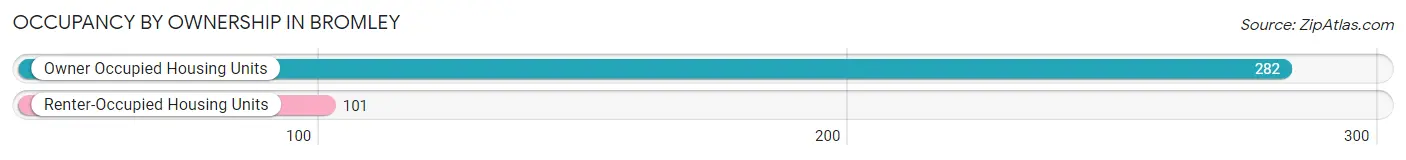
| Occupancy | # Housing Units | % Housing Units |
| Owner Occupied Housing Units | 282 | 73.6% |
| Renter-Occupied Housing Units | 101 | 26.4% |
| Total Occupied Housing Units | 383 | 100.0% |
Occupancy by Household Size in Bromley
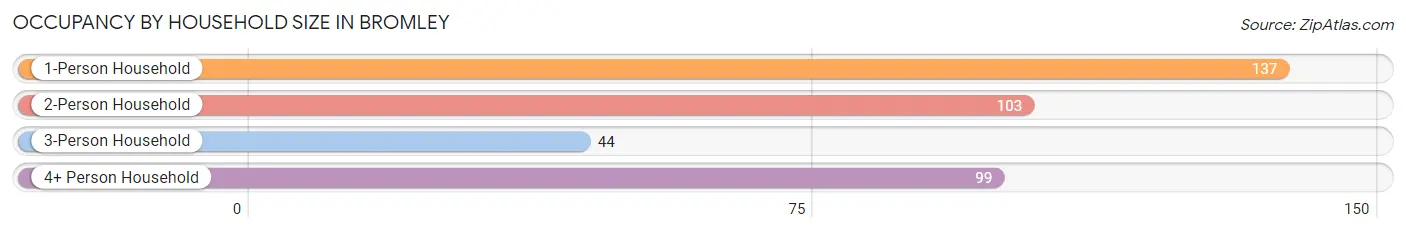
| Household Size | # Housing Units | % Housing Units |
| 1-Person Household | 137 | 35.8% |
| 2-Person Household | 103 | 26.9% |
| 3-Person Household | 44 | 11.5% |
| 4+ Person Household | 99 | 25.9% |
| Total Housing Units | 383 | 100.0% |
Occupancy by Ownership by Household Size in Bromley
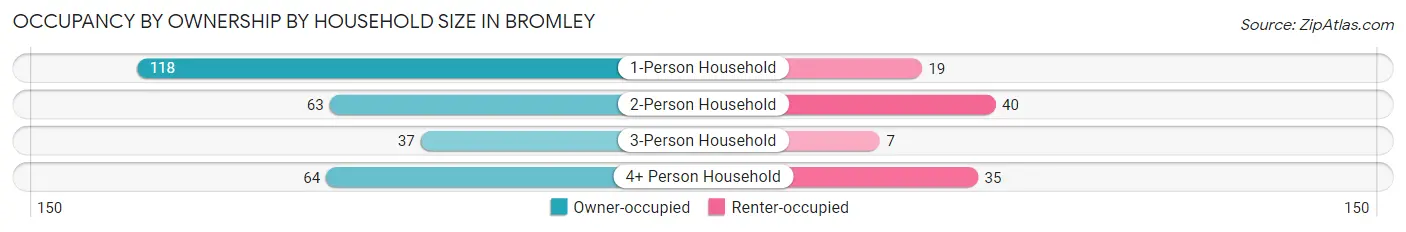
| Household Size | Owner-occupied | Renter-occupied |
| 1-Person Household | 118 (86.1%) | 19 (13.9%) |
| 2-Person Household | 63 (61.2%) | 40 (38.8%) |
| 3-Person Household | 37 (84.1%) | 7 (15.9%) |
| 4+ Person Household | 64 (64.6%) | 35 (35.3%) |
| Total Housing Units | 282 (73.6%) | 101 (26.4%) |
Occupancy by Educational Attainment in Bromley
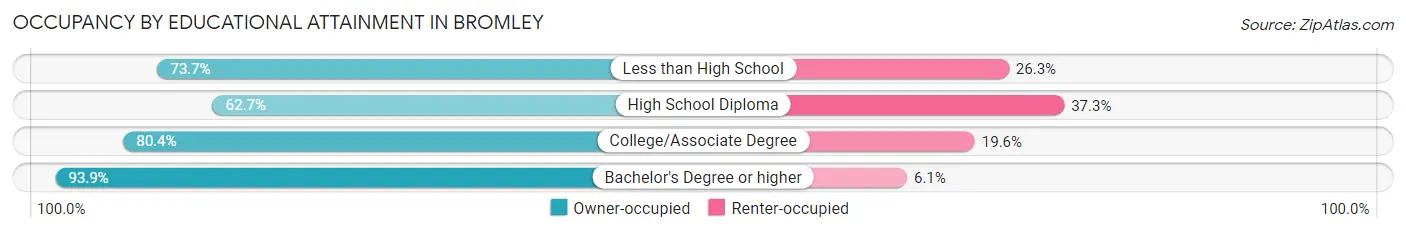
| Household Size | Owner-occupied | Renter-occupied |
| Less than High School | 14 (73.7%) | 5 (26.3%) |
| High School Diploma | 111 (62.7%) | 66 (37.3%) |
| College/Associate Degree | 111 (80.4%) | 27 (19.6%) |
| Bachelor's Degree or higher | 46 (93.9%) | 3 (6.1%) |
Occupancy by Age of Householder in Bromley
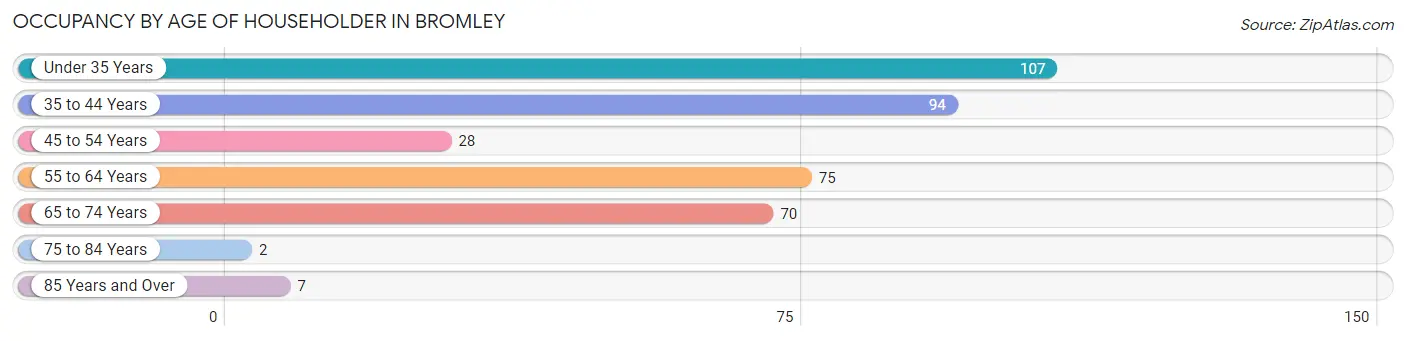
| Age Bracket | # Households | % Households |
| Under 35 Years | 107 | 27.9% |
| 35 to 44 Years | 94 | 24.5% |
| 45 to 54 Years | 28 | 7.3% |
| 55 to 64 Years | 75 | 19.6% |
| 65 to 74 Years | 70 | 18.3% |
| 75 to 84 Years | 2 | 0.5% |
| 85 Years and Over | 7 | 1.8% |
| Total | 383 | 100.0% |
Housing Finances in Bromley
Median Income by Occupancy in Bromley
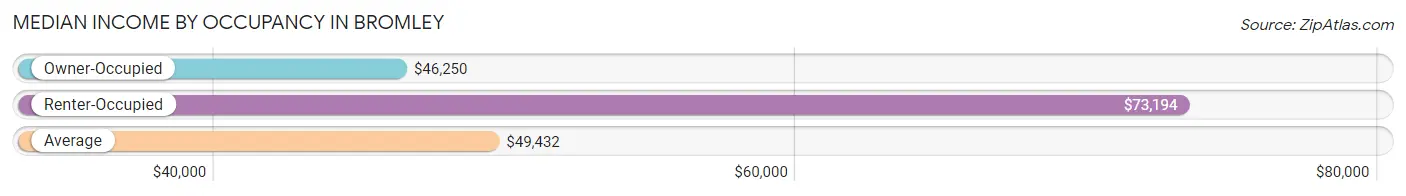
| Occupancy Type | # Households | Median Income |
| Owner-Occupied | 282 (73.6%) | $46,250 |
| Renter-Occupied | 101 (26.4%) | $73,194 |
| Average | 383 (100.0%) | $49,432 |
Occupancy by Householder Income Bracket in Bromley
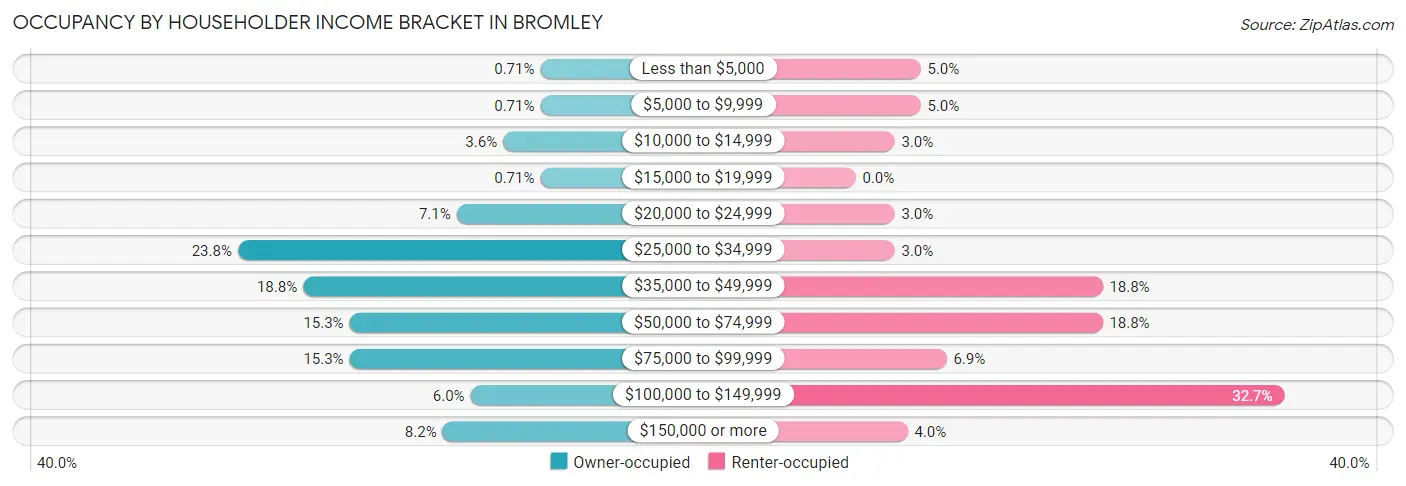
| Income Bracket | Owner-occupied | Renter-occupied |
| Less than $5,000 | 2 (0.7%) | 5 (5.0%) |
| $5,000 to $9,999 | 2 (0.7%) | 5 (5.0%) |
| $10,000 to $14,999 | 10 (3.5%) | 3 (3.0%) |
| $15,000 to $19,999 | 2 (0.7%) | 0 (0.0%) |
| $20,000 to $24,999 | 20 (7.1%) | 3 (3.0%) |
| $25,000 to $34,999 | 67 (23.8%) | 3 (3.0%) |
| $35,000 to $49,999 | 53 (18.8%) | 19 (18.8%) |
| $50,000 to $74,999 | 43 (15.2%) | 19 (18.8%) |
| $75,000 to $99,999 | 43 (15.2%) | 7 (6.9%) |
| $100,000 to $149,999 | 17 (6.0%) | 33 (32.7%) |
| $150,000 or more | 23 (8.2%) | 4 (4.0%) |
| Total | 282 (100.0%) | 101 (100.0%) |
Monthly Housing Cost Tiers in Bromley
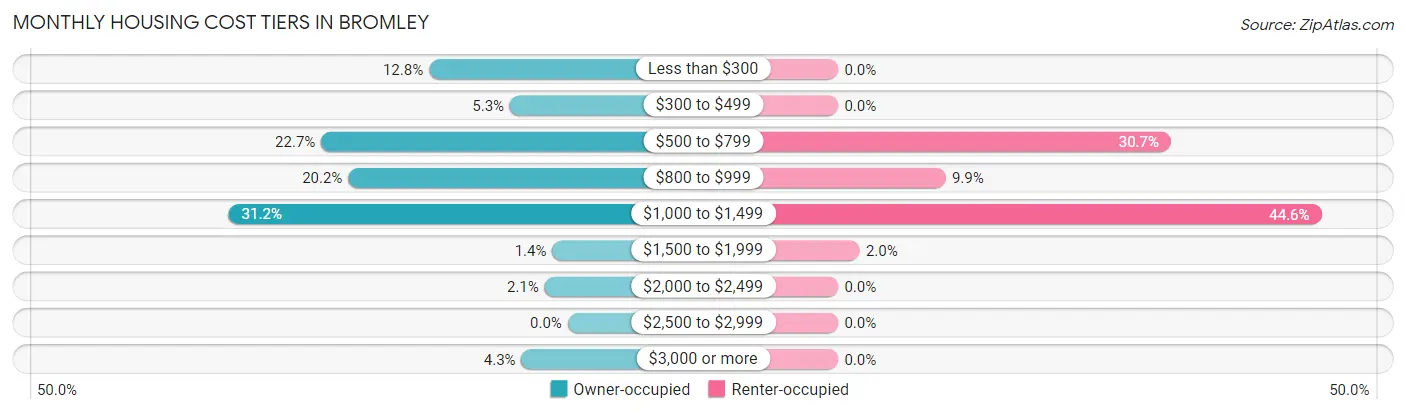
| Monthly Cost | Owner-occupied | Renter-occupied |
| Less than $300 | 36 (12.8%) | 0 (0.0%) |
| $300 to $499 | 15 (5.3%) | 0 (0.0%) |
| $500 to $799 | 64 (22.7%) | 31 (30.7%) |
| $800 to $999 | 57 (20.2%) | 10 (9.9%) |
| $1,000 to $1,499 | 88 (31.2%) | 45 (44.6%) |
| $1,500 to $1,999 | 4 (1.4%) | 2 (2.0%) |
| $2,000 to $2,499 | 6 (2.1%) | 0 (0.0%) |
| $2,500 to $2,999 | 0 (0.0%) | 0 (0.0%) |
| $3,000 or more | 12 (4.3%) | 0 (0.0%) |
| Total | 282 (100.0%) | 101 (100.0%) |
Physical Housing Characteristics in Bromley
Housing Structures in Bromley
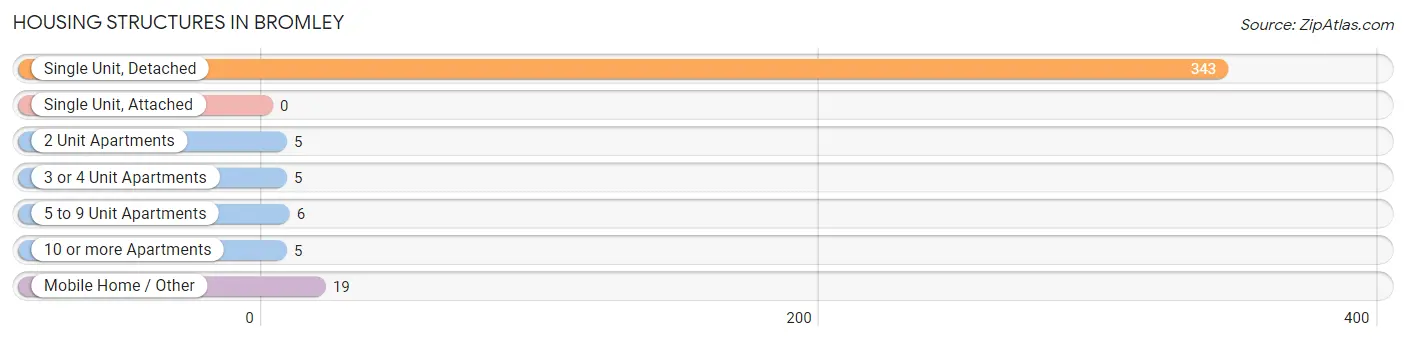
| Structure Type | # Housing Units | % Housing Units |
| Single Unit, Detached | 343 | 89.6% |
| Single Unit, Attached | 0 | 0.0% |
| 2 Unit Apartments | 5 | 1.3% |
| 3 or 4 Unit Apartments | 5 | 1.3% |
| 5 to 9 Unit Apartments | 6 | 1.6% |
| 10 or more Apartments | 5 | 1.3% |
| Mobile Home / Other | 19 | 5.0% |
| Total | 383 | 100.0% |
Housing Structures by Occupancy in Bromley
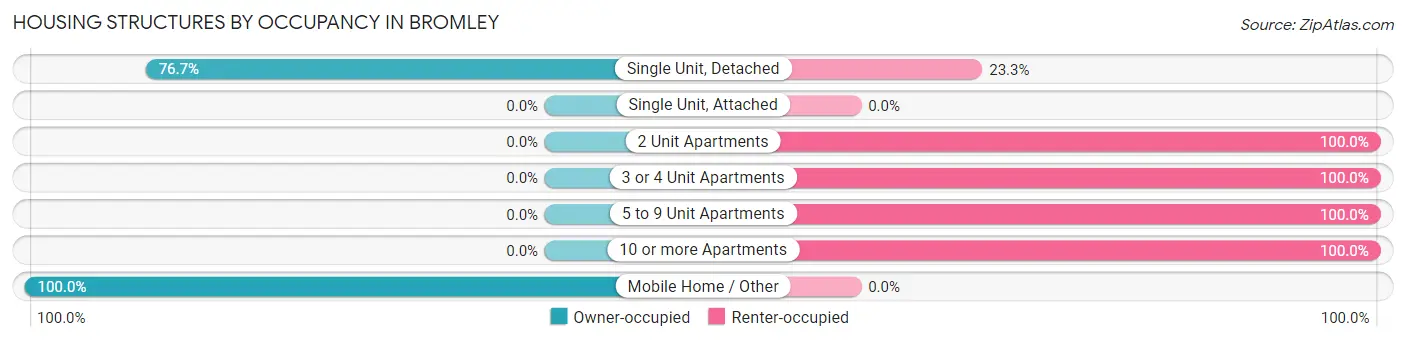
| Structure Type | Owner-occupied | Renter-occupied |
| Single Unit, Detached | 263 (76.7%) | 80 (23.3%) |
| Single Unit, Attached | 0 (0.0%) | 0 (0.0%) |
| 2 Unit Apartments | 0 (0.0%) | 5 (100.0%) |
| 3 or 4 Unit Apartments | 0 (0.0%) | 5 (100.0%) |
| 5 to 9 Unit Apartments | 0 (0.0%) | 6 (100.0%) |
| 10 or more Apartments | 0 (0.0%) | 5 (100.0%) |
| Mobile Home / Other | 19 (100.0%) | 0 (0.0%) |
| Total | 282 (73.6%) | 101 (26.4%) |
Housing Structures by Number of Rooms in Bromley
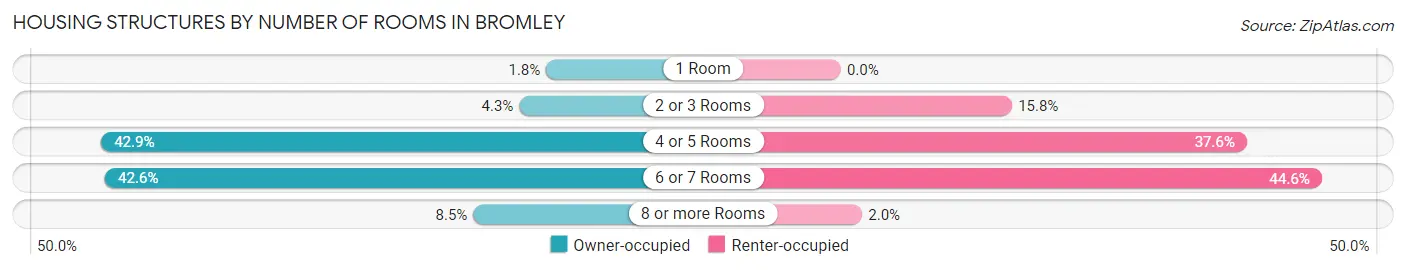
| Number of Rooms | Owner-occupied | Renter-occupied |
| 1 Room | 5 (1.8%) | 0 (0.0%) |
| 2 or 3 Rooms | 12 (4.3%) | 16 (15.8%) |
| 4 or 5 Rooms | 121 (42.9%) | 38 (37.6%) |
| 6 or 7 Rooms | 120 (42.5%) | 45 (44.6%) |
| 8 or more Rooms | 24 (8.5%) | 2 (2.0%) |
| Total | 282 (100.0%) | 101 (100.0%) |
Housing Structure by Heating Type in Bromley
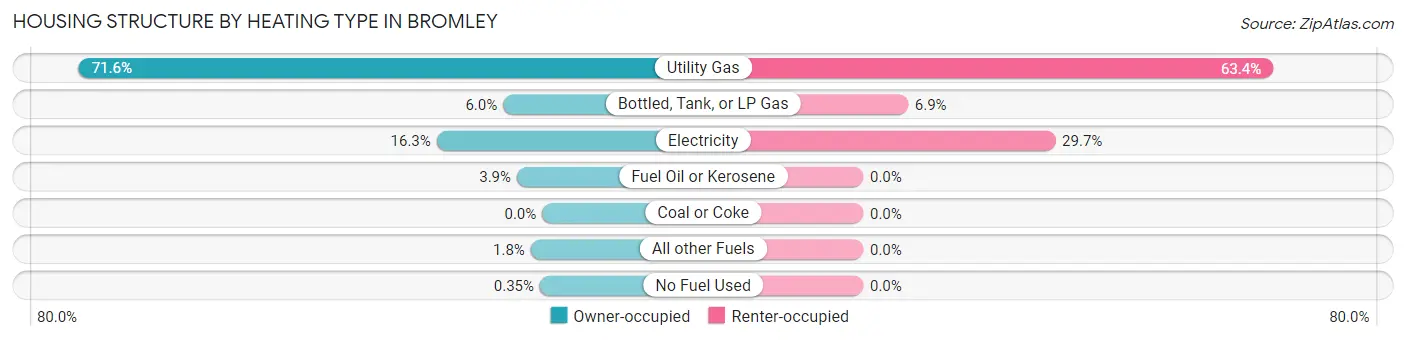
| Heating Type | Owner-occupied | Renter-occupied |
| Utility Gas | 202 (71.6%) | 64 (63.4%) |
| Bottled, Tank, or LP Gas | 17 (6.0%) | 7 (6.9%) |
| Electricity | 46 (16.3%) | 30 (29.7%) |
| Fuel Oil or Kerosene | 11 (3.9%) | 0 (0.0%) |
| Coal or Coke | 0 (0.0%) | 0 (0.0%) |
| All other Fuels | 5 (1.8%) | 0 (0.0%) |
| No Fuel Used | 1 (0.4%) | 0 (0.0%) |
| Total | 282 (100.0%) | 101 (100.0%) |
Household Vehicle Usage in Bromley
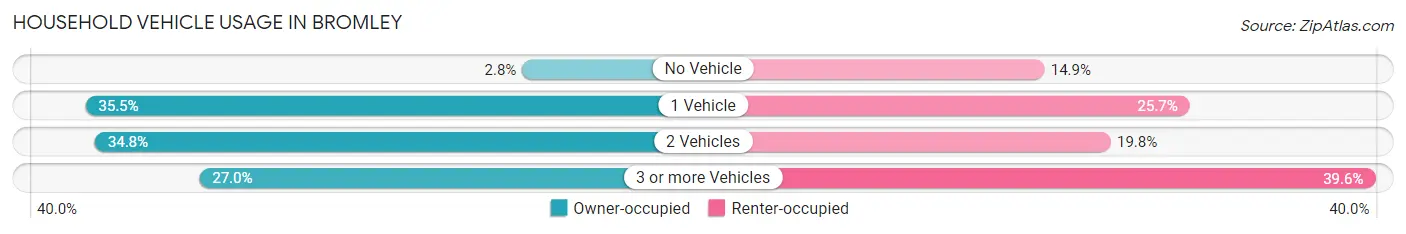
| Vehicles per Household | Owner-occupied | Renter-occupied |
| No Vehicle | 8 (2.8%) | 15 (14.8%) |
| 1 Vehicle | 100 (35.5%) | 26 (25.7%) |
| 2 Vehicles | 98 (34.7%) | 20 (19.8%) |
| 3 or more Vehicles | 76 (27.0%) | 40 (39.6%) |
| Total | 282 (100.0%) | 101 (100.0%) |
Real Estate & Mortgages in Bromley
Real Estate and Mortgage Overview in Bromley
| Characteristic | Without Mortgage | With Mortgage |
| Housing Units | 87 | 195 |
| Median Property Value | $124,300 | $131,300 |
| Median Household Income | $34,023 | $23 |
| Monthly Housing Costs | $450 | $12 |
| Real Estate Taxes | $1,133 | $16 |
Property Value by Mortgage Status in Bromley
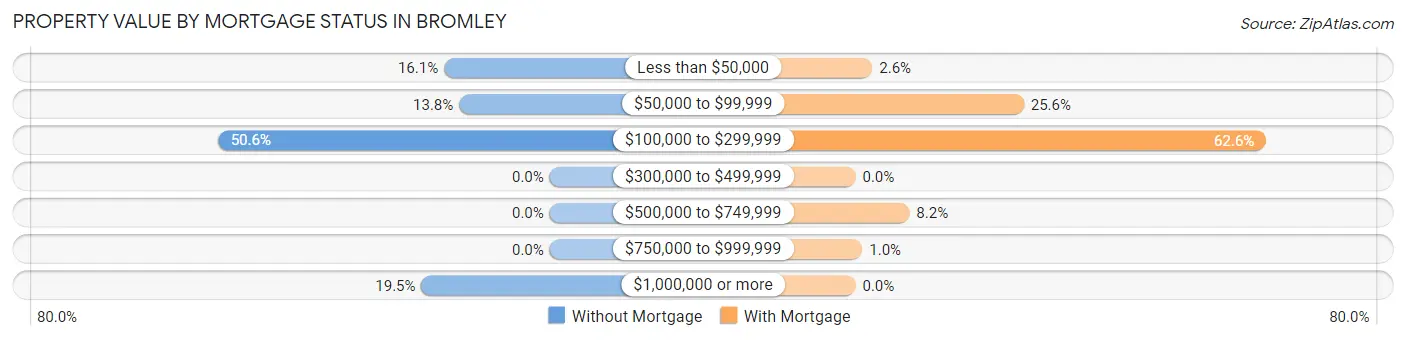
| Property Value | Without Mortgage | With Mortgage |
| Less than $50,000 | 14 (16.1%) | 5 (2.6%) |
| $50,000 to $99,999 | 12 (13.8%) | 50 (25.6%) |
| $100,000 to $299,999 | 44 (50.6%) | 122 (62.6%) |
| $300,000 to $499,999 | 0 (0.0%) | 0 (0.0%) |
| $500,000 to $749,999 | 0 (0.0%) | 16 (8.2%) |
| $750,000 to $999,999 | 0 (0.0%) | 2 (1.0%) |
| $1,000,000 or more | 17 (19.5%) | 0 (0.0%) |
| Total | 87 (100.0%) | 195 (100.0%) |
Household Income by Mortgage Status in Bromley
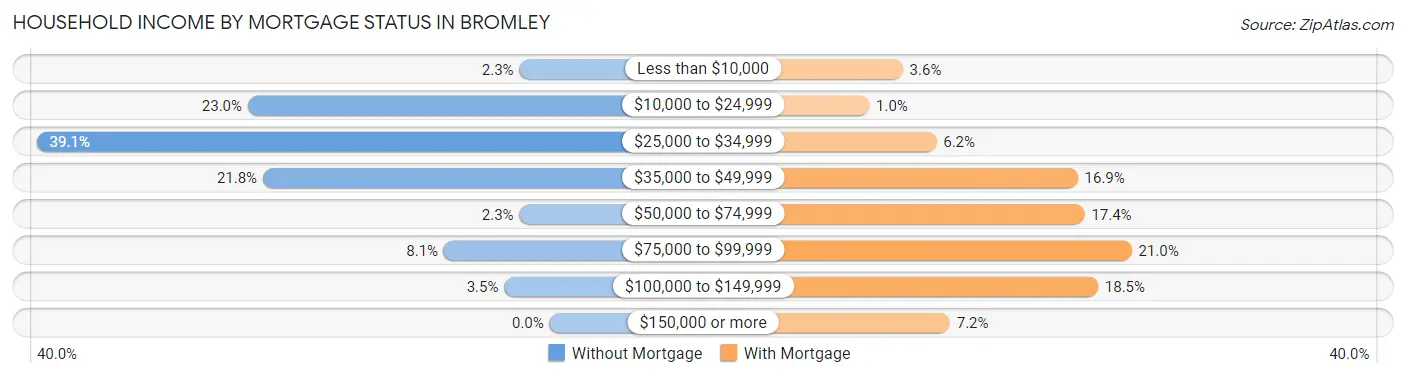
| Household Income | Without Mortgage | With Mortgage |
| Less than $10,000 | 2 (2.3%) | 7 (3.6%) |
| $10,000 to $24,999 | 20 (23.0%) | 2 (1.0%) |
| $25,000 to $34,999 | 34 (39.1%) | 12 (6.1%) |
| $35,000 to $49,999 | 19 (21.8%) | 33 (16.9%) |
| $50,000 to $74,999 | 2 (2.3%) | 34 (17.4%) |
| $75,000 to $99,999 | 7 (8.1%) | 41 (21.0%) |
| $100,000 to $149,999 | 3 (3.5%) | 36 (18.5%) |
| $150,000 or more | 0 (0.0%) | 14 (7.2%) |
| Total | 87 (100.0%) | 195 (100.0%) |
Property Value to Household Income Ratio in Bromley
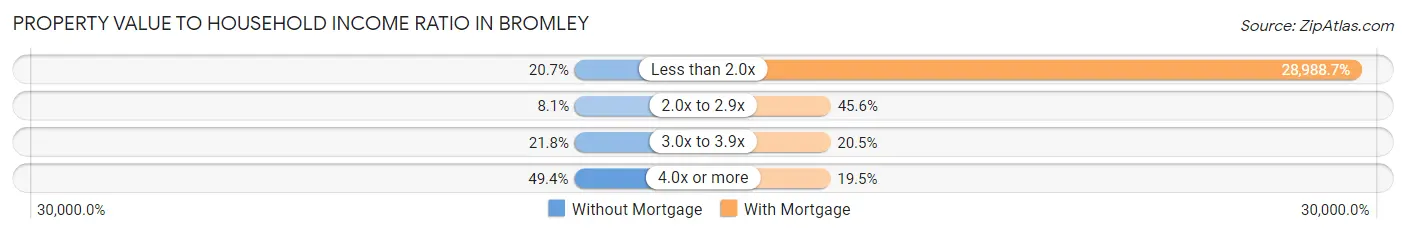
| Value-to-Income Ratio | Without Mortgage | With Mortgage |
| Less than 2.0x | 18 (20.7%) | 56,528 (28,988.7%) |
| 2.0x to 2.9x | 7 (8.1%) | 89 (45.6%) |
| 3.0x to 3.9x | 19 (21.8%) | 40 (20.5%) |
| 4.0x or more | 43 (49.4%) | 38 (19.5%) |
| Total | 87 (100.0%) | 195 (100.0%) |
Real Estate Taxes by Mortgage Status in Bromley
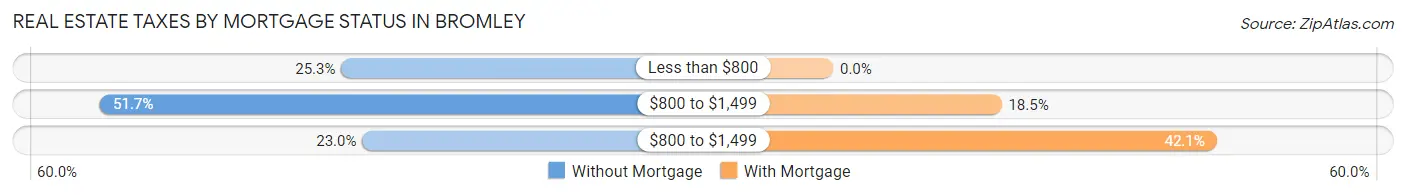
| Property Taxes | Without Mortgage | With Mortgage |
| Less than $800 | 22 (25.3%) | 0 (0.0%) |
| $800 to $1,499 | 45 (51.7%) | 36 (18.5%) |
| $800 to $1,499 | 20 (23.0%) | 82 (42.0%) |
| Total | 87 (100.0%) | 195 (100.0%) |
Health & Disability in Bromley
Health Insurance Coverage by Age in Bromley
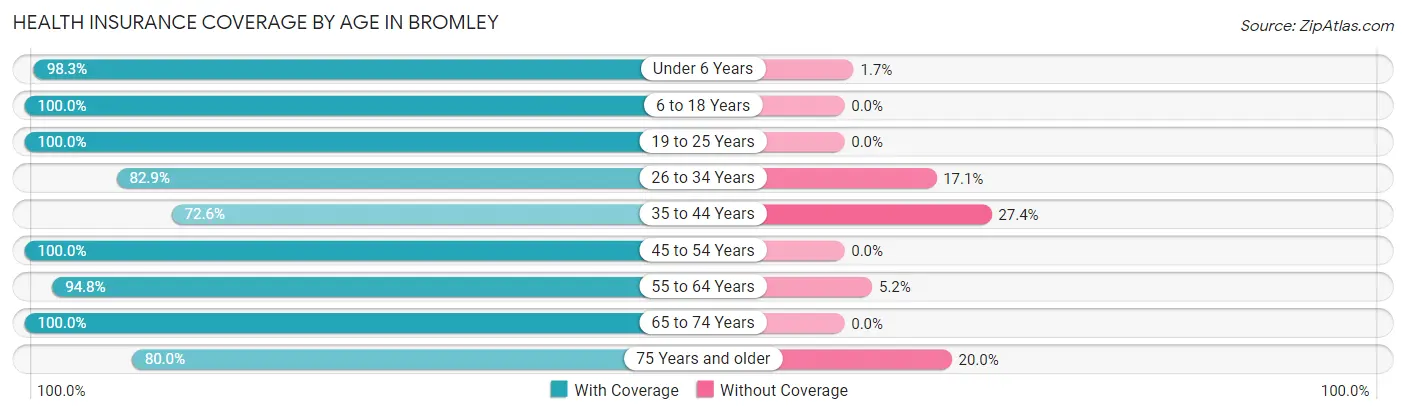
| Age Bracket | With Coverage | Without Coverage |
| Under 6 Years | 114 (98.3%) | 2 (1.7%) |
| 6 to 18 Years | 181 (100.0%) | 0 (0.0%) |
| 19 to 25 Years | 35 (100.0%) | 0 (0.0%) |
| 26 to 34 Years | 145 (82.9%) | 30 (17.1%) |
| 35 to 44 Years | 127 (72.6%) | 48 (27.4%) |
| 45 to 54 Years | 55 (100.0%) | 0 (0.0%) |
| 55 to 64 Years | 110 (94.8%) | 6 (5.2%) |
| 65 to 74 Years | 88 (100.0%) | 0 (0.0%) |
| 75 Years and older | 12 (80.0%) | 3 (20.0%) |
| Total | 867 (90.7%) | 89 (9.3%) |
Health Insurance Coverage by Citizenship Status in Bromley
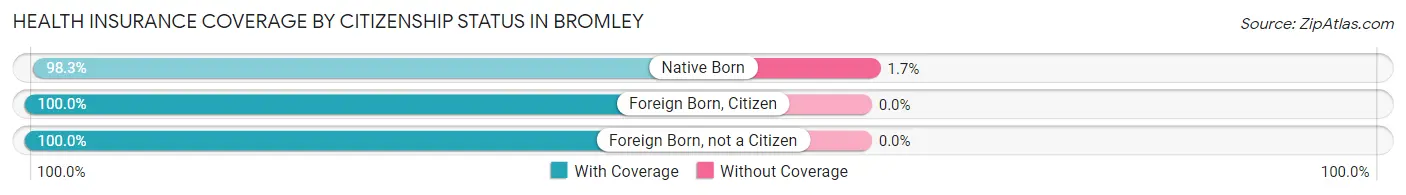
| Citizenship Status | With Coverage | Without Coverage |
| Native Born | 114 (98.3%) | 2 (1.7%) |
| Foreign Born, Citizen | 181 (100.0%) | 0 (0.0%) |
| Foreign Born, not a Citizen | 35 (100.0%) | 0 (0.0%) |
Health Insurance Coverage by Household Income in Bromley
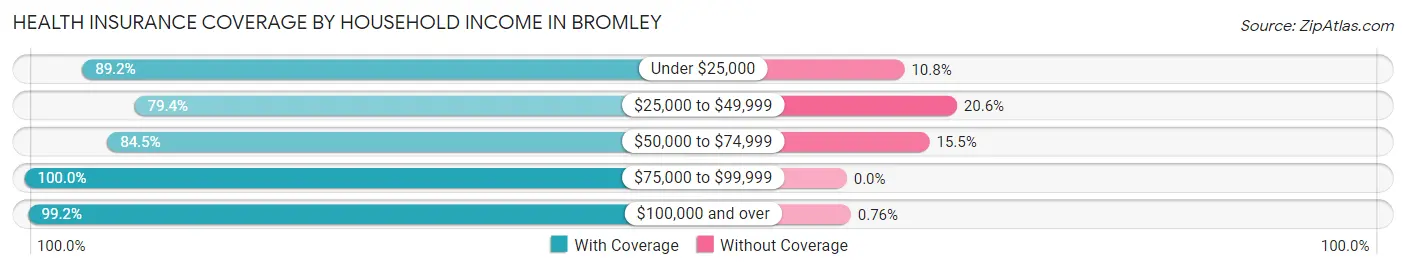
| Household Income | With Coverage | Without Coverage |
| Under $25,000 | 66 (89.2%) | 8 (10.8%) |
| $25,000 to $49,999 | 227 (79.4%) | 59 (20.6%) |
| $50,000 to $74,999 | 109 (84.5%) | 20 (15.5%) |
| $75,000 to $99,999 | 203 (100.0%) | 0 (0.0%) |
| $100,000 and over | 262 (99.2%) | 2 (0.8%) |
Public vs Private Health Insurance Coverage by Age in Bromley
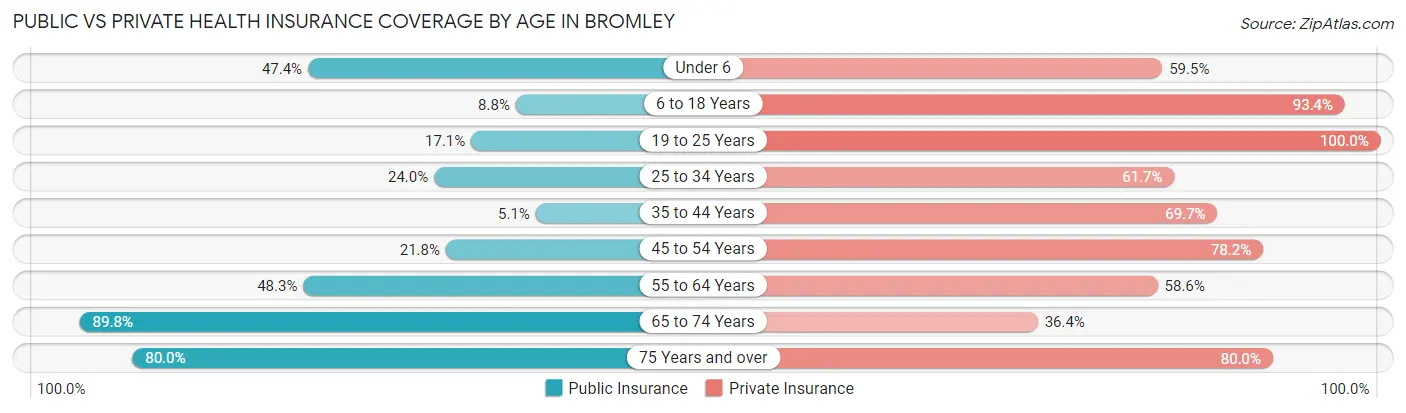
| Age Bracket | Public Insurance | Private Insurance |
| Under 6 | 55 (47.4%) | 69 (59.5%) |
| 6 to 18 Years | 16 (8.8%) | 169 (93.4%) |
| 19 to 25 Years | 6 (17.1%) | 35 (100.0%) |
| 25 to 34 Years | 42 (24.0%) | 108 (61.7%) |
| 35 to 44 Years | 9 (5.1%) | 122 (69.7%) |
| 45 to 54 Years | 12 (21.8%) | 43 (78.2%) |
| 55 to 64 Years | 56 (48.3%) | 68 (58.6%) |
| 65 to 74 Years | 79 (89.8%) | 32 (36.4%) |
| 75 Years and over | 12 (80.0%) | 12 (80.0%) |
| Total | 287 (30.0%) | 658 (68.8%) |
Disability Status by Sex by Age in Bromley
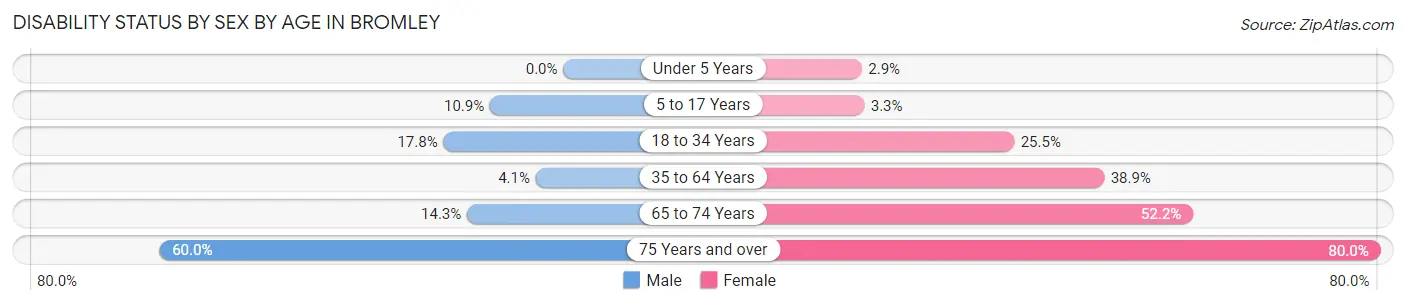
| Age Bracket | Male | Female |
| Under 5 Years | 0 (0.0%) | 2 (2.9%) |
| 5 to 17 Years | 11 (10.9%) | 3 (3.3%) |
| 18 to 34 Years | 21 (17.8%) | 24 (25.5%) |
| 35 to 64 Years | 9 (4.1%) | 49 (38.9%) |
| 65 to 74 Years | 6 (14.3%) | 24 (52.2%) |
| 75 Years and over | 3 (60.0%) | 8 (80.0%) |
Disability Class by Sex by Age in Bromley
Disability Class: Hearing Difficulty
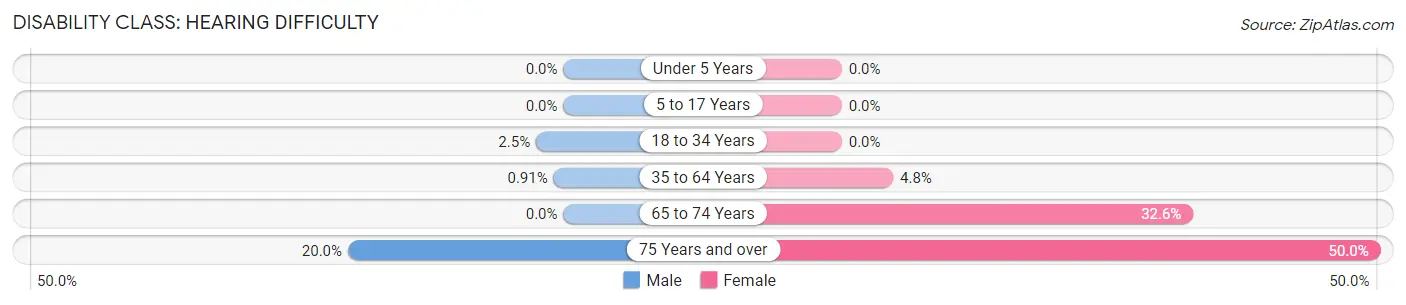
| Age Bracket | Male | Female |
| Under 5 Years | 0 (0.0%) | 0 (0.0%) |
| 5 to 17 Years | 0 (0.0%) | 0 (0.0%) |
| 18 to 34 Years | 3 (2.5%) | 0 (0.0%) |
| 35 to 64 Years | 2 (0.9%) | 6 (4.8%) |
| 65 to 74 Years | 0 (0.0%) | 15 (32.6%) |
| 75 Years and over | 1 (20.0%) | 5 (50.0%) |
Disability Class: Vision Difficulty
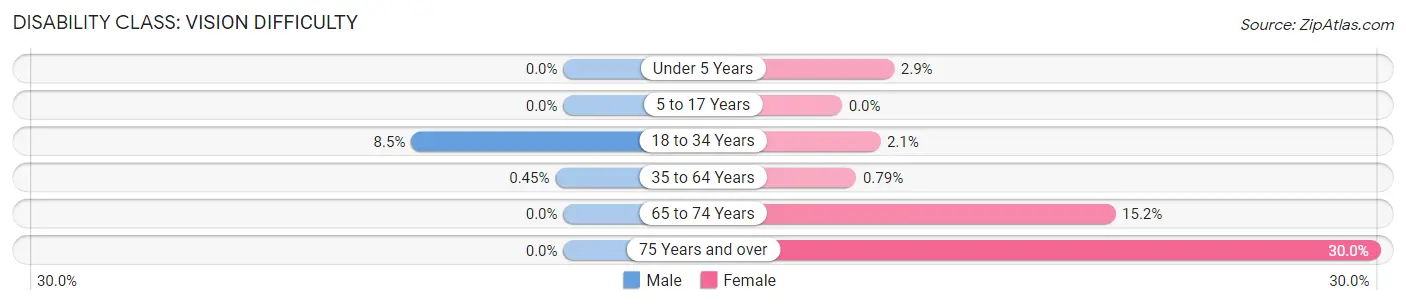
| Age Bracket | Male | Female |
| Under 5 Years | 0 (0.0%) | 2 (2.9%) |
| 5 to 17 Years | 0 (0.0%) | 0 (0.0%) |
| 18 to 34 Years | 10 (8.5%) | 2 (2.1%) |
| 35 to 64 Years | 1 (0.4%) | 1 (0.8%) |
| 65 to 74 Years | 0 (0.0%) | 7 (15.2%) |
| 75 Years and over | 0 (0.0%) | 3 (30.0%) |
Disability Class: Cognitive Difficulty
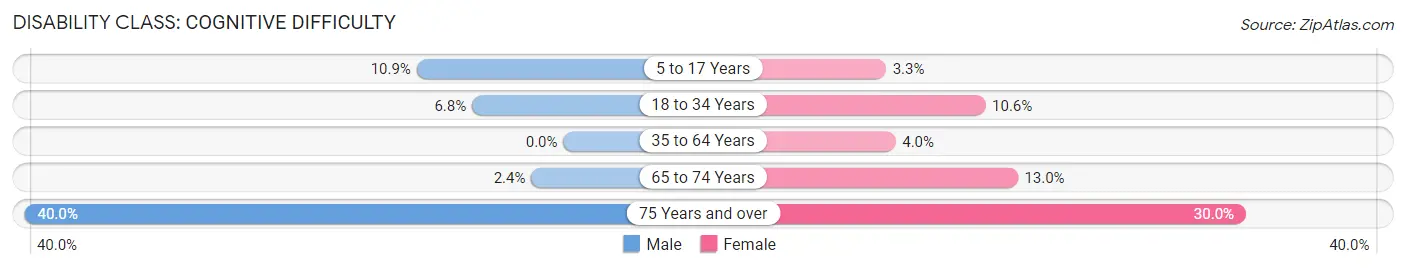
| Age Bracket | Male | Female |
| 5 to 17 Years | 11 (10.9%) | 3 (3.3%) |
| 18 to 34 Years | 8 (6.8%) | 10 (10.6%) |
| 35 to 64 Years | 0 (0.0%) | 5 (4.0%) |
| 65 to 74 Years | 1 (2.4%) | 6 (13.0%) |
| 75 Years and over | 2 (40.0%) | 3 (30.0%) |
Disability Class: Ambulatory Difficulty
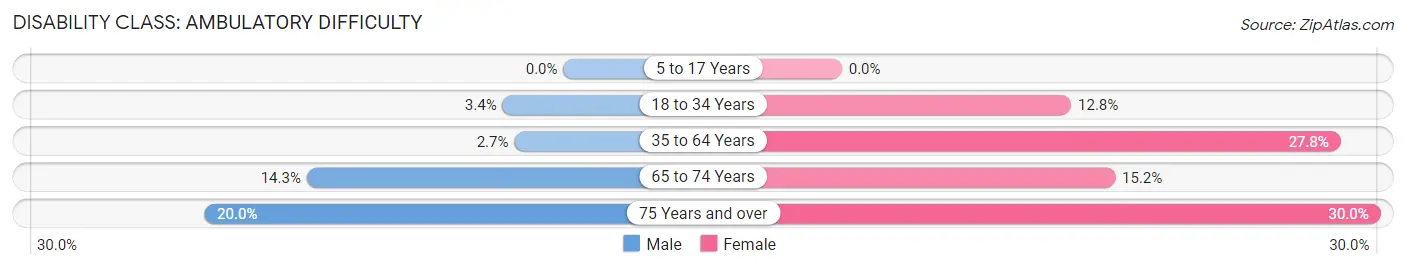
| Age Bracket | Male | Female |
| 5 to 17 Years | 0 (0.0%) | 0 (0.0%) |
| 18 to 34 Years | 4 (3.4%) | 12 (12.8%) |
| 35 to 64 Years | 6 (2.7%) | 35 (27.8%) |
| 65 to 74 Years | 6 (14.3%) | 7 (15.2%) |
| 75 Years and over | 1 (20.0%) | 3 (30.0%) |
Disability Class: Self-Care Difficulty
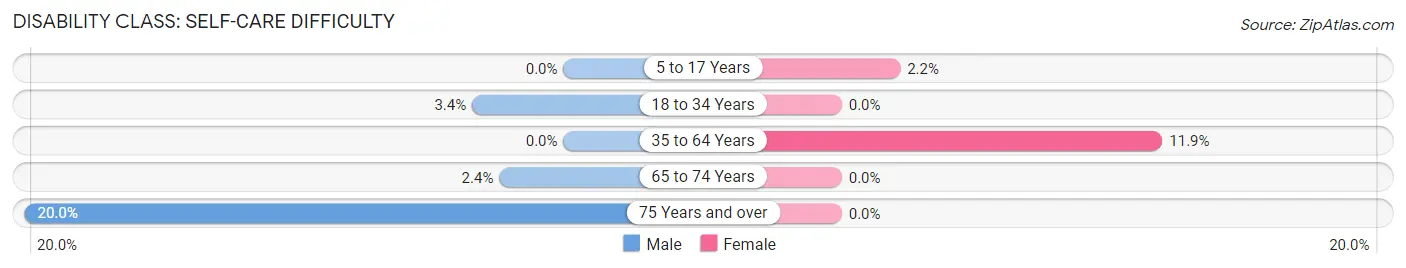
| Age Bracket | Male | Female |
| 5 to 17 Years | 0 (0.0%) | 2 (2.2%) |
| 18 to 34 Years | 4 (3.4%) | 0 (0.0%) |
| 35 to 64 Years | 0 (0.0%) | 15 (11.9%) |
| 65 to 74 Years | 1 (2.4%) | 0 (0.0%) |
| 75 Years and over | 1 (20.0%) | 0 (0.0%) |
Technology Access in Bromley
Computing Device Access in Bromley
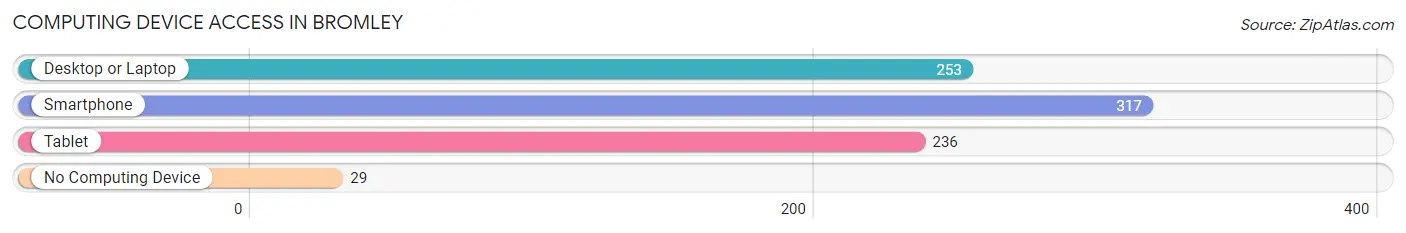
| Device Type | # Households | % Households |
| Desktop or Laptop | 253 | 66.1% |
| Smartphone | 317 | 82.8% |
| Tablet | 236 | 61.6% |
| No Computing Device | 29 | 7.6% |
| Total | 383 | 100.0% |
Internet Access in Bromley
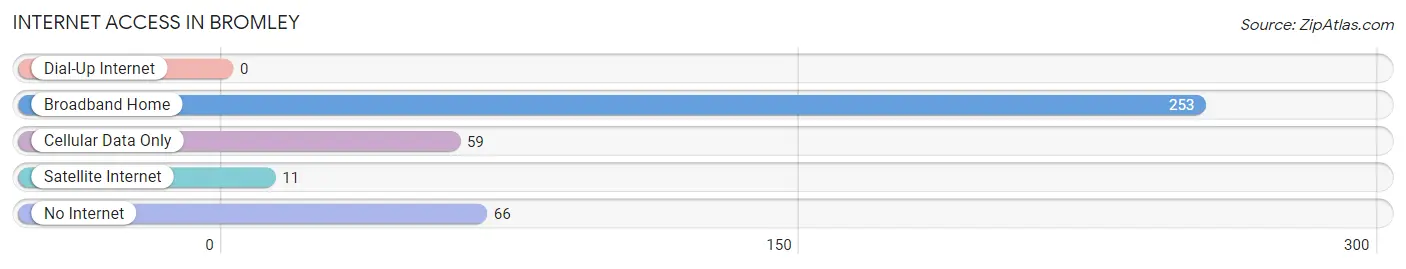
| Internet Type | # Households | % Households |
| Dial-Up Internet | 0 | 0.0% |
| Broadband Home | 253 | 66.1% |
| Cellular Data Only | 59 | 15.4% |
| Satellite Internet | 11 | 2.9% |
| No Internet | 66 | 17.2% |
| Total | 383 | 100.0% |
Bromley Summary
Bromley is a small town located in the state of Kentucky, United States. It is situated in the northern part of the state, in the county of Kenton. The town has a population of around 1,000 people, and is part of the Cincinnati metropolitan area.
History
Bromley was founded in 1817 by a group of settlers from Pennsylvania. The town was named after a local creek, which was named after a man named Bromley. The town was originally a farming community, and the main crops grown were corn, wheat, and tobacco. The town was also known for its brickyards, which produced bricks for the construction of homes and businesses in the area.
In the late 19th century, Bromley began to experience a period of growth. The town was connected to the Cincinnati and Northern Kentucky Railroad, which allowed for the transportation of goods and people to and from the town. This led to the development of several businesses, including a flour mill, a sawmill, and a brickyard.
In the early 20th century, Bromley experienced a period of decline. The railroad was abandoned, and the town's businesses began to close. The population of the town decreased, and by the 1950s, the town had become a ghost town.
In the late 20th century, Bromley began to experience a period of revitalization. The town was connected to the Cincinnati and Northern Kentucky Railroad once again, and businesses began to open in the town. The population of the town began to increase, and by the 2000s, the town had become a thriving community.
Geography
Bromley is located in the northern part of the state of Kentucky, in the county of Kenton. The town is situated on the banks of the Ohio River, and is part of the Cincinnati metropolitan area. The town is located at an elevation of 845 feet above sea level.
The climate in Bromley is humid subtropical, with hot summers and cold winters. The average annual temperature is around 57 degrees Fahrenheit, and the average annual precipitation is around 41 inches.
Economy
The economy of Bromley is largely based on agriculture and tourism. The town is home to several farms, which produce corn, wheat, and tobacco. The town is also home to several wineries, which produce a variety of wines.
Tourism is an important part of the economy of Bromley. The town is home to several historic sites, including the Bromley Historic District, which is listed on the National Register of Historic Places. The town is also home to several parks, including the Bromley Nature Preserve, which is a popular destination for hikers and nature lovers.
Demographics
As of the 2010 census, the population of Bromley was 1,000 people. The racial makeup of the town was 97.2% White, 0.7% African American, 0.3% Native American, 0.3% Asian, and 1.5% from other races. The median household income in the town was $41,250, and the median family income was $50,000. The per capita income in the town was $20,000.
Common Questions
What is Per Capita Income in Bromley?
Per Capita income in Bromley is $26,576.
What is the Median Family Income in Bromley?
Median Family Income in Bromley is $75,893.
What is the Median Household income in Bromley?
Median Household Income in Bromley is $49,432.
What is Income or Wage Gap in Bromley?
Income or Wage Gap in Bromley is 22.4%.
Women in Bromley earn 77.6 cents for every dollar earned by a man.
What is Inequality or Gini Index in Bromley?
Inequality or Gini Index in Bromley is 0.40.
What is the Total Population of Bromley?
Total Population of Bromley is 956.
What is the Total Male Population of Bromley?
Total Male Population of Bromley is 519.
What is the Total Female Population of Bromley?
Total Female Population of Bromley is 437.
What is the Ratio of Males per 100 Females in Bromley?
There are 118.76 Males per 100 Females in Bromley.
What is the Ratio of Females per 100 Males in Bromley?
There are 84.20 Females per 100 Males in Bromley.
What is the Median Population Age in Bromley?
Median Population Age in Bromley is 34.4 Years.
What is the Average Family Size in Bromley
Average Family Size in Bromley is 3.4 People.
What is the Average Household Size in Bromley
Average Household Size in Bromley is 2.5 People.
How Large is the Labor Force in Bromley?
There are 495 People in the Labor Forcein in Bromley.
What is the Percentage of People in the Labor Force in Bromley?
69.4% of People are in the Labor Force in Bromley.
What is the Unemployment Rate in Bromley?
Unemployment Rate in Bromley is 10.1%.