Sanders, KY Map & Demographics
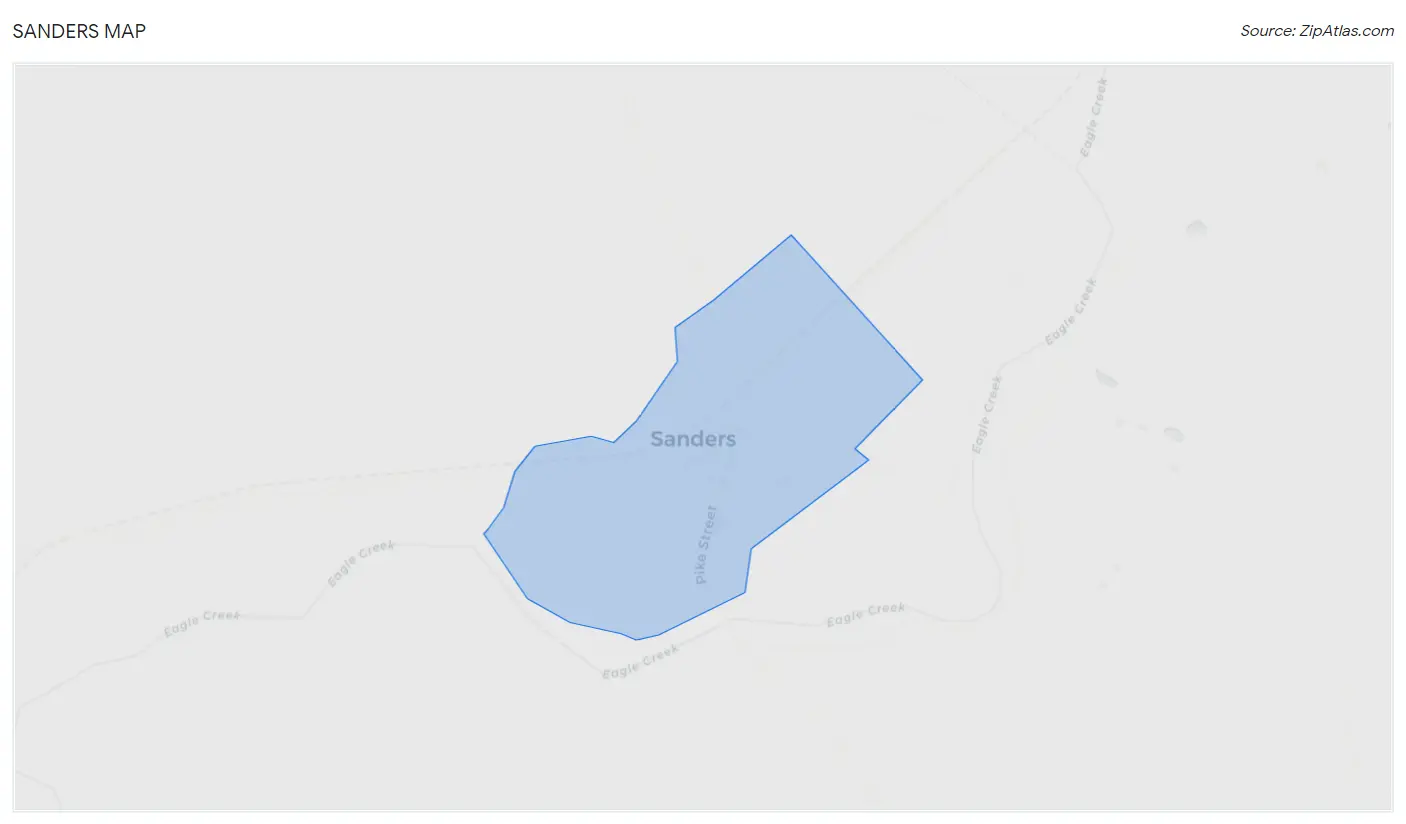
Sanders Map
Sanders Overview
$16,888
PER CAPITA INCOME
$36,842
AVG FAMILY INCOME
$36,557
AVG HOUSEHOLD INCOME
$1,452
FAMILY INCOME DEFICIT
0.37
INEQUALITY / GINI INDEX
385
TOTAL POPULATION
185
MALE POPULATION
200
FEMALE POPULATION
92.50
MALES / 100 FEMALES
108.11
FEMALES / 100 MALES
52.5
MEDIAN AGE
3.1
AVG FAMILY SIZE
2.8
AVG HOUSEHOLD SIZE
235
LABOR FORCE [ PEOPLE ]
73.7%
PERCENT IN LABOR FORCE
Sanders Zip Codes
Income in Sanders
Income Overview in Sanders
Per Capita Income in Sanders is $16,888, while median incomes of families and households are $36,842 and $36,557 respectively.
| Characteristic | Number | Measure |
| Per Capita Income | 385 | $16,888 |
| Median Family Income | 104 | $36,842 |
| Mean Family Income | 104 | $58,407 |
| Median Household Income | 121 | $36,557 |
| Mean Household Income | 121 | $53,317 |
| Income Deficit | 104 | $1,452 |
| Wage / Income Gap (%) | 385 | 0.00% |
| Wage / Income Gap ($) | 385 | 100.00¢ per $1 |
| Gini / Inequality Index | 385 | 0.37 |
Earnings by Sex in Sanders
| Sex | Number | Average Earnings |
| Male | 102 (43.4%) | $0 |
| Female | 133 (56.6%) | $0 |
| Total | 235 (100.0%) | $0 |
Earnings by Sex by Income Bracket in Sanders
The most common earnings brackets in Sanders are $2,500 to $4,999 for men (59 | 57.8%) and $2,499 or less for women (61 | 45.9%).
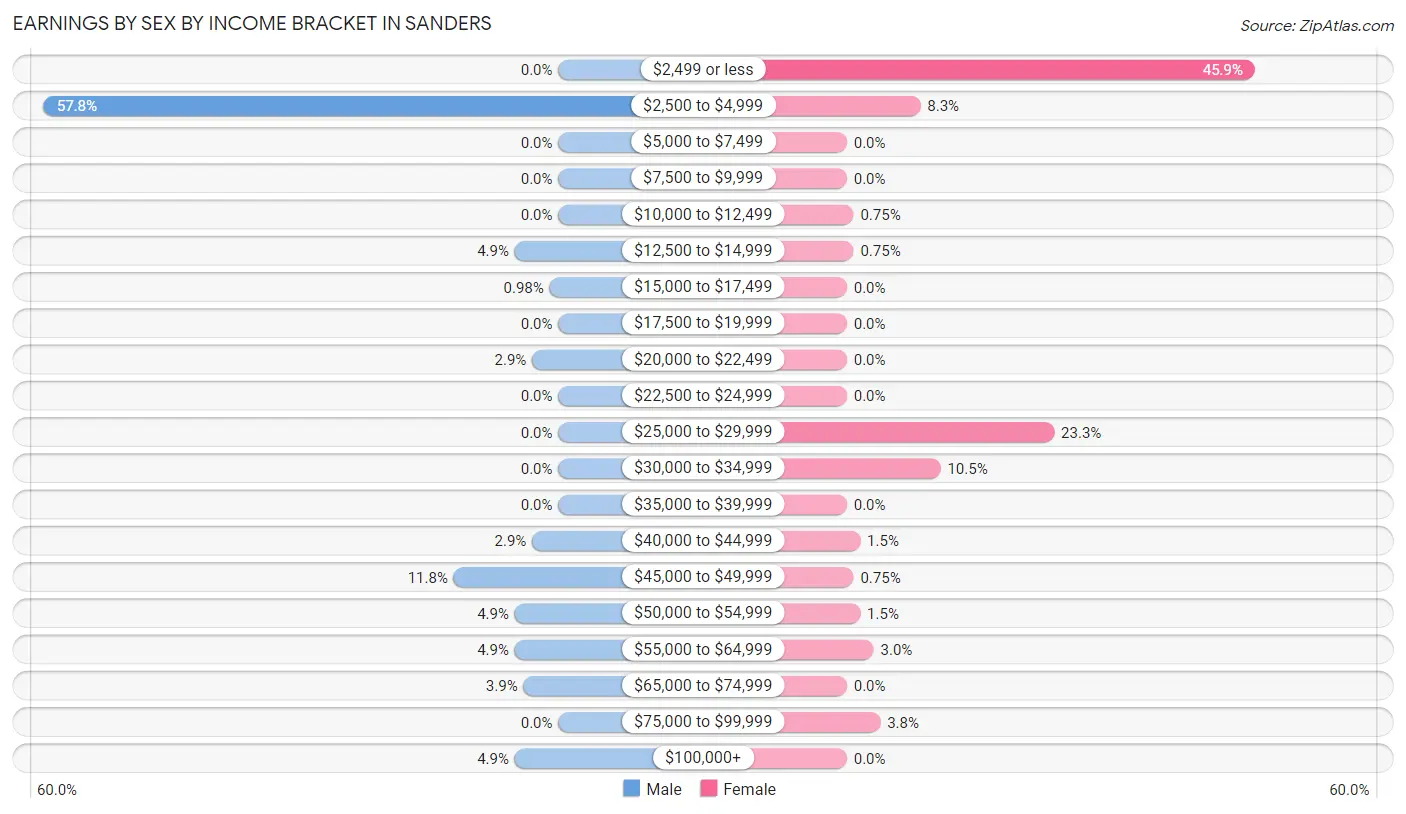
| Income | Male | Female |
| $2,499 or less | 0 (0.0%) | 61 (45.9%) |
| $2,500 to $4,999 | 59 (57.8%) | 11 (8.3%) |
| $5,000 to $7,499 | 0 (0.0%) | 0 (0.0%) |
| $7,500 to $9,999 | 0 (0.0%) | 0 (0.0%) |
| $10,000 to $12,499 | 0 (0.0%) | 1 (0.7%) |
| $12,500 to $14,999 | 5 (4.9%) | 1 (0.7%) |
| $15,000 to $17,499 | 1 (1.0%) | 0 (0.0%) |
| $17,500 to $19,999 | 0 (0.0%) | 0 (0.0%) |
| $20,000 to $22,499 | 3 (2.9%) | 0 (0.0%) |
| $22,500 to $24,999 | 0 (0.0%) | 0 (0.0%) |
| $25,000 to $29,999 | 0 (0.0%) | 31 (23.3%) |
| $30,000 to $34,999 | 0 (0.0%) | 14 (10.5%) |
| $35,000 to $39,999 | 0 (0.0%) | 0 (0.0%) |
| $40,000 to $44,999 | 3 (2.9%) | 2 (1.5%) |
| $45,000 to $49,999 | 12 (11.8%) | 1 (0.7%) |
| $50,000 to $54,999 | 5 (4.9%) | 2 (1.5%) |
| $55,000 to $64,999 | 5 (4.9%) | 4 (3.0%) |
| $65,000 to $74,999 | 4 (3.9%) | 0 (0.0%) |
| $75,000 to $99,999 | 0 (0.0%) | 5 (3.8%) |
| $100,000+ | 5 (4.9%) | 0 (0.0%) |
| Total | 102 (100.0%) | 133 (100.0%) |
Earnings by Sex by Educational Attainment in Sanders
| Educational Attainment | Male Income | Female Income |
| Less than High School | - | - |
| High School Diploma | - | - |
| College or Associate's Degree | - | - |
| Bachelor's Degree | - | - |
| Graduate Degree | - | - |
| Total | - | - |
Family Income in Sanders
Family Income Brackets in Sanders
According to the Sanders family income data, there are 59 families falling into the $35,000 to $49,999 income range, which is the most common income bracket and makes up 56.7% of all families.
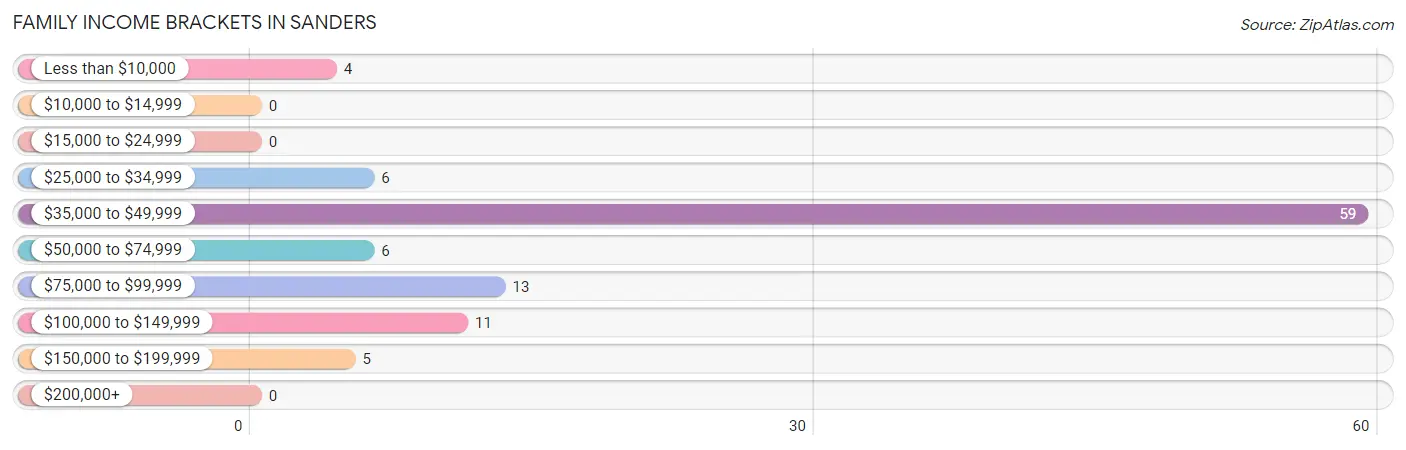
| Income Bracket | # Families | % Families |
| Less than $10,000 | 4 | 3.8% |
| $10,000 to $14,999 | 0 | 0.0% |
| $15,000 to $24,999 | 0 | 0.0% |
| $25,000 to $34,999 | 6 | 5.8% |
| $35,000 to $49,999 | 59 | 56.7% |
| $50,000 to $74,999 | 6 | 5.8% |
| $75,000 to $99,999 | 13 | 12.5% |
| $100,000 to $149,999 | 11 | 10.6% |
| $150,000 to $199,999 | 5 | 4.8% |
| $200,000+ | 0 | 0.0% |
Family Income by Famaliy Size in Sanders
3-person families (16 | 15.4%) account for the highest median family income in Sanders with $90,000 per family, while 2-person families (29 | 27.9%) have the highest median income of $41,458 per family member.
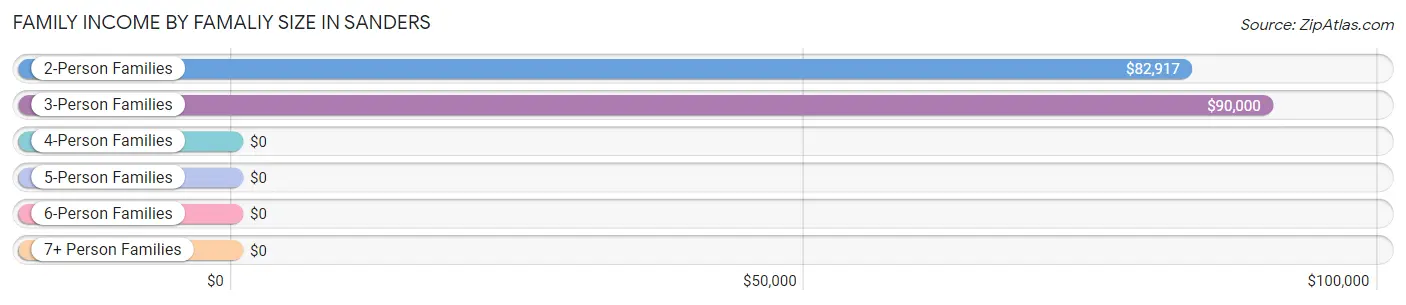
| Income Bracket | # Families | Median Income |
| 2-Person Families | 29 (27.9%) | $82,917 |
| 3-Person Families | 16 (15.4%) | $90,000 |
| 4-Person Families | 0 (0.0%) | $0 |
| 5-Person Families | 59 (56.7%) | $0 |
| 6-Person Families | 0 (0.0%) | $0 |
| 7+ Person Families | 0 (0.0%) | $0 |
| Total | 104 (100.0%) | $36,842 |
Family Income by Number of Earners in Sanders
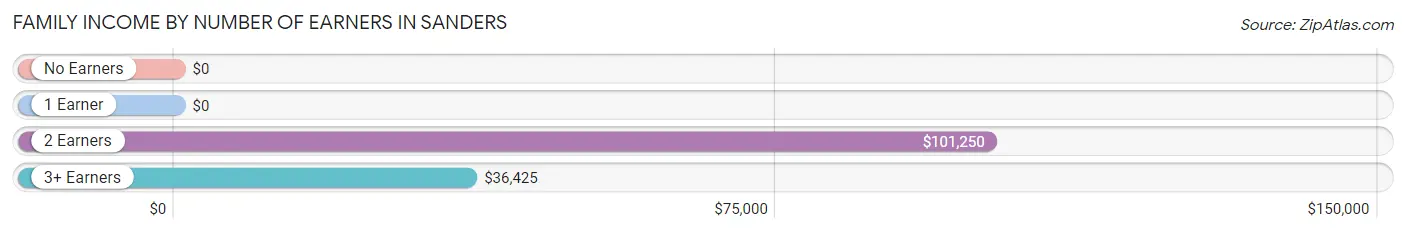
| Number of Earners | # Families | Median Income |
| No Earners | 11 (10.6%) | $0 |
| 1 Earner | 4 (3.8%) | $0 |
| 2 Earners | 24 (23.1%) | $101,250 |
| 3+ Earners | 65 (62.5%) | $36,425 |
| Total | 104 (100.0%) | $36,842 |
Household Income in Sanders
Household Income Brackets in Sanders
With 60 households falling in the category, the $35,000 to $49,999 income range is the most frequent in Sanders, accounting for 49.6% of all households.
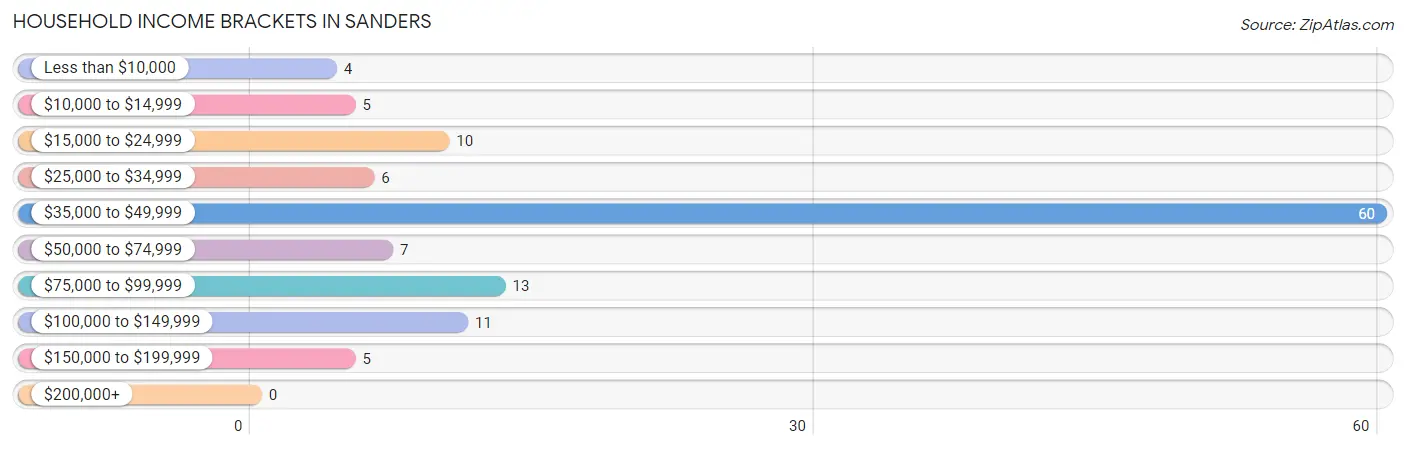
| Income Bracket | # Households | % Households |
| Less than $10,000 | 4 | 3.3% |
| $10,000 to $14,999 | 5 | 4.1% |
| $15,000 to $24,999 | 10 | 8.3% |
| $25,000 to $34,999 | 6 | 5.0% |
| $35,000 to $49,999 | 60 | 49.6% |
| $50,000 to $74,999 | 7 | 5.8% |
| $75,000 to $99,999 | 13 | 10.7% |
| $100,000 to $149,999 | 11 | 9.1% |
| $150,000 to $199,999 | 5 | 4.1% |
| $200,000+ | 0 | 0.0% |
Household Income by Householder Age in Sanders
The median household income in Sanders is $36,557, with the highest median household income of $36,053 found in the 65+ years age bracket for the primary householder. A total of 78 households (64.5%) fall into this category. Meanwhile, the 15 to 24 years age bracket for the primary householder has the lowest median household income of $0, with 9 households (7.4%) in this group.
| Income Bracket | # Households | Median Income |
| 15 to 24 Years | 9 (7.4%) | $0 |
| 25 to 44 Years | 3 (2.5%) | $0 |
| 45 to 64 Years | 31 (25.6%) | $0 |
| 65+ Years | 78 (64.5%) | $36,053 |
| Total | 121 (100.0%) | $36,557 |
Poverty in Sanders
Income Below Poverty by Sex and Age in Sanders
With 61.0% poverty level for males and 62.0% for females among the residents of Sanders, under 5 year old males and 6 to 11 year old females are the most vulnerable to poverty, with 20 males (100.0%) and 39 females (100.0%) in their respective age groups living below the poverty level.
| Age Bracket | Male | Female |
| Under 5 Years | 20 (100.0%) | 0 (0.0%) |
| 5 Years | 0 (0.0%) | 0 (0.0%) |
| 6 to 11 Years | 0 (0.0%) | 39 (100.0%) |
| 12 to 14 Years | 0 (0.0%) | 0 (0.0%) |
| 15 Years | 0 (0.0%) | 0 (0.0%) |
| 16 and 17 Years | 0 (0.0%) | 3 (50.0%) |
| 18 to 24 Years | 5 (100.0%) | 0 (0.0%) |
| 25 to 34 Years | 0 (0.0%) | 58 (92.1%) |
| 35 to 44 Years | 0 (0.0%) | 0 (0.0%) |
| 45 to 54 Years | 0 (0.0%) | 2 (13.3%) |
| 55 to 64 Years | 4 (18.2%) | 22 (81.5%) |
| 65 to 74 Years | 57 (90.5%) | 0 (0.0%) |
| 75 Years and over | 0 (0.0%) | 0 (0.0%) |
| Total | 86 (61.0%) | 124 (62.0%) |
Income Above Poverty by Sex and Age in Sanders
According to the poverty statistics in Sanders, males aged 6 to 11 years and females aged 5 years are the age groups that are most secure financially, with 100.0% of males and 100.0% of females in these age groups living above the poverty line.
| Age Bracket | Male | Female |
| Under 5 Years | 0 (0.0%) | 0 (0.0%) |
| 5 Years | 0 (0.0%) | 2 (100.0%) |
| 6 to 11 Years | 2 (100.0%) | 0 (0.0%) |
| 12 to 14 Years | 3 (100.0%) | 0 (0.0%) |
| 15 Years | 0 (0.0%) | 0 (0.0%) |
| 16 and 17 Years | 3 (100.0%) | 3 (50.0%) |
| 18 to 24 Years | 0 (0.0%) | 14 (100.0%) |
| 25 to 34 Years | 5 (100.0%) | 5 (7.9%) |
| 35 to 44 Years | 0 (0.0%) | 6 (100.0%) |
| 45 to 54 Years | 14 (100.0%) | 13 (86.7%) |
| 55 to 64 Years | 18 (81.8%) | 5 (18.5%) |
| 65 to 74 Years | 6 (9.5%) | 9 (100.0%) |
| 75 Years and over | 4 (100.0%) | 19 (100.0%) |
| Total | 55 (39.0%) | 76 (38.0%) |
Income Below Poverty Among Married-Couple Families in Sanders
The poverty statistics for married-couple families in Sanders show that 67.8% or 61 of the total 90 families live below the poverty line. Families with 1 or 2 children have the highest poverty rate of 100.0%, comprising of 59 families. On the other hand, families with no children have the lowest poverty rate of 6.5%, which includes 2 families.
| Children | Above Poverty | Below Poverty |
| No Children | 29 (93.5%) | 2 (6.5%) |
| 1 or 2 Children | 0 (0.0%) | 59 (100.0%) |
| 3 or 4 Children | 0 (0.0%) | 0 (0.0%) |
| 5 or more Children | 0 (0.0%) | 0 (0.0%) |
| Total | 29 (32.2%) | 61 (67.8%) |
Income Below Poverty Among Single-Parent Households in Sanders
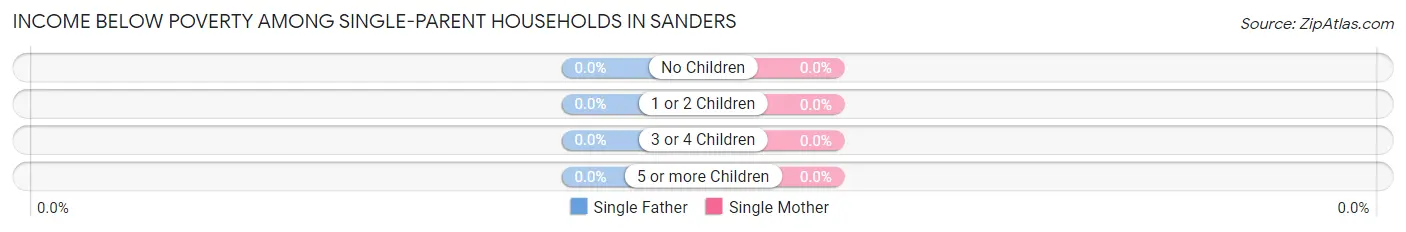
| Children | Single Father | Single Mother |
| No Children | 0 (0.0%) | 0 (0.0%) |
| 1 or 2 Children | 0 (0.0%) | 0 (0.0%) |
| 3 or 4 Children | 0 (0.0%) | 0 (0.0%) |
| 5 or more Children | 0 (0.0%) | 0 (0.0%) |
| Total | 0 (0.0%) | 0 (0.0%) |
Income Below Poverty Among Married-Couple vs Single-Parent Households in Sanders
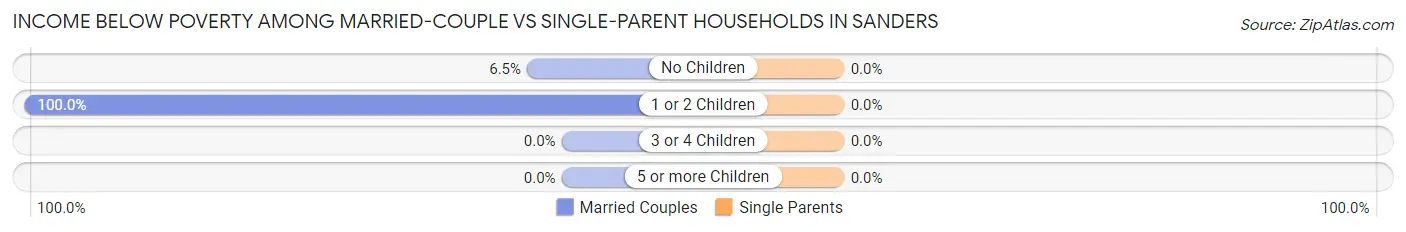
| Children | Married-Couple Families | Single-Parent Households |
| No Children | 2 (6.5%) | 0 (0.0%) |
| 1 or 2 Children | 59 (100.0%) | 0 (0.0%) |
| 3 or 4 Children | 0 (0.0%) | 0 (0.0%) |
| 5 or more Children | 0 (0.0%) | 0 (0.0%) |
| Total | 61 (67.8%) | 0 (0.0%) |
Race in Sanders
The most populous races in Sanders are White / Caucasian (367 | 95.3%), and Black / African American (18 | 4.7%).
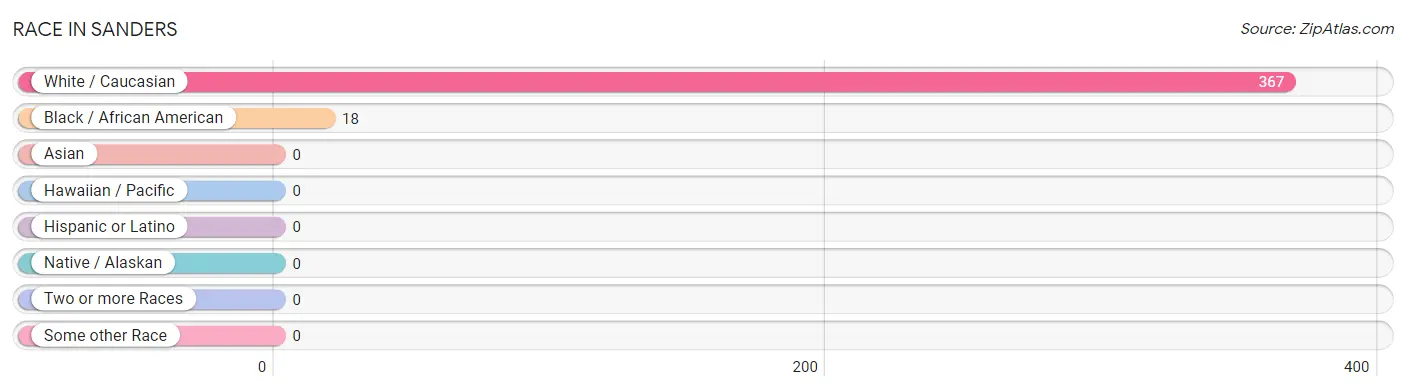
| Race | # Population | % Population |
| Asian | 0 | 0.0% |
| Black / African American | 18 | 4.7% |
| Hawaiian / Pacific | 0 | 0.0% |
| Hispanic or Latino | 0 | 0.0% |
| Native / Alaskan | 0 | 0.0% |
| White / Caucasian | 367 | 95.3% |
| Two or more Races | 0 | 0.0% |
| Some other Race | 0 | 0.0% |
| Total | 385 | 100.0% |
Ancestry in Sanders
The most populous ancestries reported in Sanders are Irish (25 | 6.5%), German (19 | 4.9%), Welsh (15 | 3.9%), Dutch (11 | 2.9%), and English (11 | 2.9%), together accounting for 21.1% of all Sanders residents.
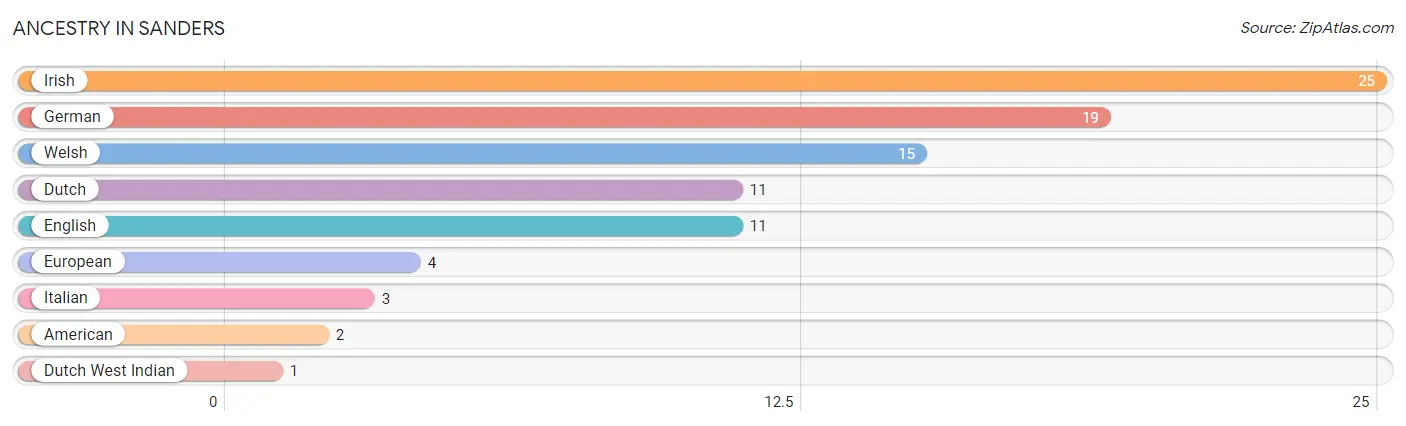
| Ancestry | # Population | % Population |
| American | 2 | 0.5% |
| Dutch | 11 | 2.9% |
| Dutch West Indian | 1 | 0.3% |
| English | 11 | 2.9% |
| European | 4 | 1.0% |
| German | 19 | 4.9% |
| Irish | 25 | 6.5% |
| Italian | 3 | 0.8% |
| Welsh | 15 | 3.9% | View All 9 Rows |
Immigrants in Sanders

| Immigration Origin | # Population | % Population | View All 0 Rows |
Sex and Age in Sanders
Sex and Age in Sanders
The most populous age groups in Sanders are 65 to 69 Years (63 | 34.1%) for men and 30 to 34 Years (58 | 29.0%) for women.
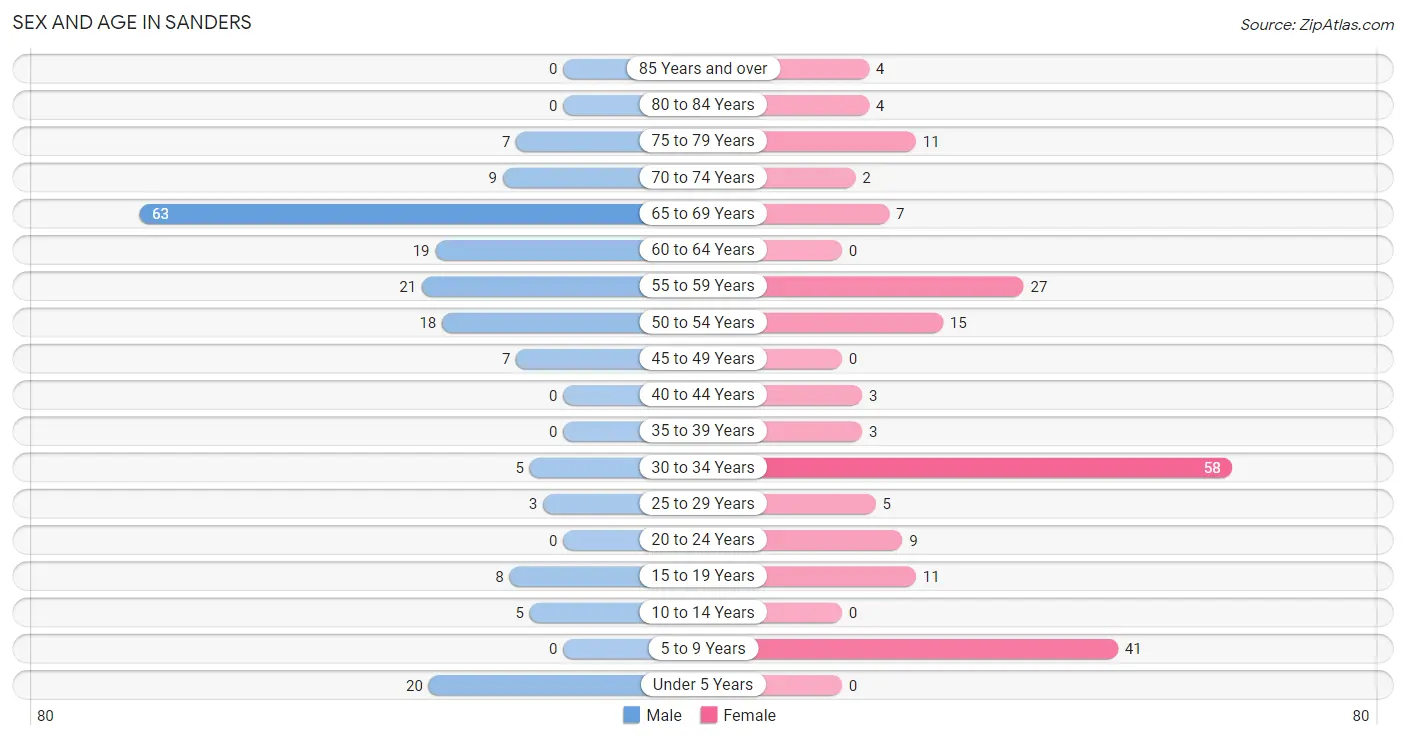
| Age Bracket | Male | Female |
| Under 5 Years | 20 (10.8%) | 0 (0.0%) |
| 5 to 9 Years | 0 (0.0%) | 41 (20.5%) |
| 10 to 14 Years | 5 (2.7%) | 0 (0.0%) |
| 15 to 19 Years | 8 (4.3%) | 11 (5.5%) |
| 20 to 24 Years | 0 (0.0%) | 9 (4.5%) |
| 25 to 29 Years | 3 (1.6%) | 5 (2.5%) |
| 30 to 34 Years | 5 (2.7%) | 58 (29.0%) |
| 35 to 39 Years | 0 (0.0%) | 3 (1.5%) |
| 40 to 44 Years | 0 (0.0%) | 3 (1.5%) |
| 45 to 49 Years | 7 (3.8%) | 0 (0.0%) |
| 50 to 54 Years | 18 (9.7%) | 15 (7.5%) |
| 55 to 59 Years | 21 (11.4%) | 27 (13.5%) |
| 60 to 64 Years | 19 (10.3%) | 0 (0.0%) |
| 65 to 69 Years | 63 (34.1%) | 7 (3.5%) |
| 70 to 74 Years | 9 (4.9%) | 2 (1.0%) |
| 75 to 79 Years | 7 (3.8%) | 11 (5.5%) |
| 80 to 84 Years | 0 (0.0%) | 4 (2.0%) |
| 85 Years and over | 0 (0.0%) | 4 (2.0%) |
| Total | 185 (100.0%) | 200 (100.0%) |
Families and Households in Sanders
Median Family Size in Sanders
The median family size in Sanders is 3.12 persons per family, with single female/mother families (11 | 10.6%) accounting for the largest median family size of 3.73 persons per family. On the other hand, single male/father families (3 | 2.9%) represent the smallest median family size with 3.00 persons per family.
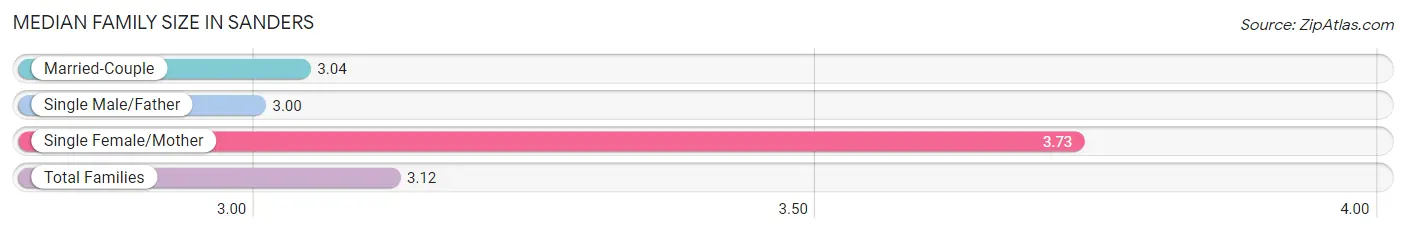
| Family Type | # Families | Family Size |
| Married-Couple | 90 (86.5%) | 3.04 |
| Single Male/Father | 3 (2.9%) | 3.00 |
| Single Female/Mother | 11 (10.6%) | 3.73 |
| Total Families | 104 (100.0%) | 3.12 |
Median Household Size in Sanders
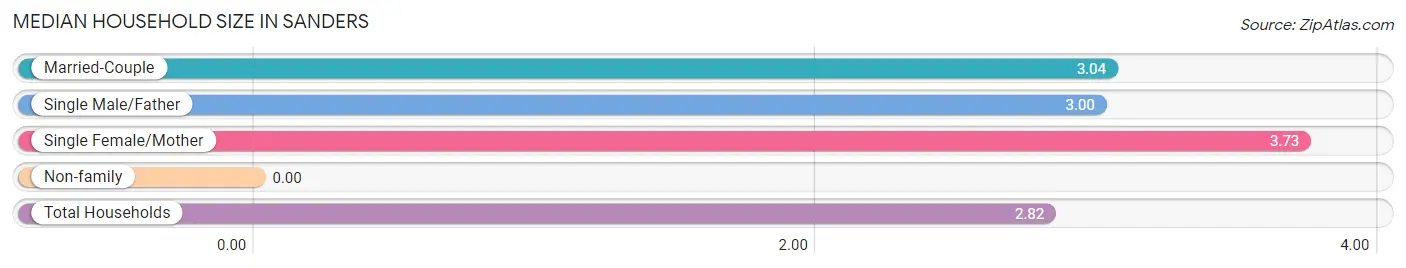
| Household Type | # Households | Household Size |
| Married-Couple | 90 (74.4%) | 3.04 |
| Single Male/Father | 3 (2.5%) | 3.00 |
| Single Female/Mother | 11 (9.1%) | 3.73 |
| Non-family | 17 (14.1%) | - |
| Total Households | 121 (100.0%) | 2.82 |
Household Size by Marriage Status in Sanders
Out of a total of 121 households in Sanders, 104 (86.0%) are family households, while 17 (14.1%) are nonfamily households. The most numerous type of family households are 5-person households, comprising 59, and the most common type of nonfamily households are 1-person households, comprising 17.
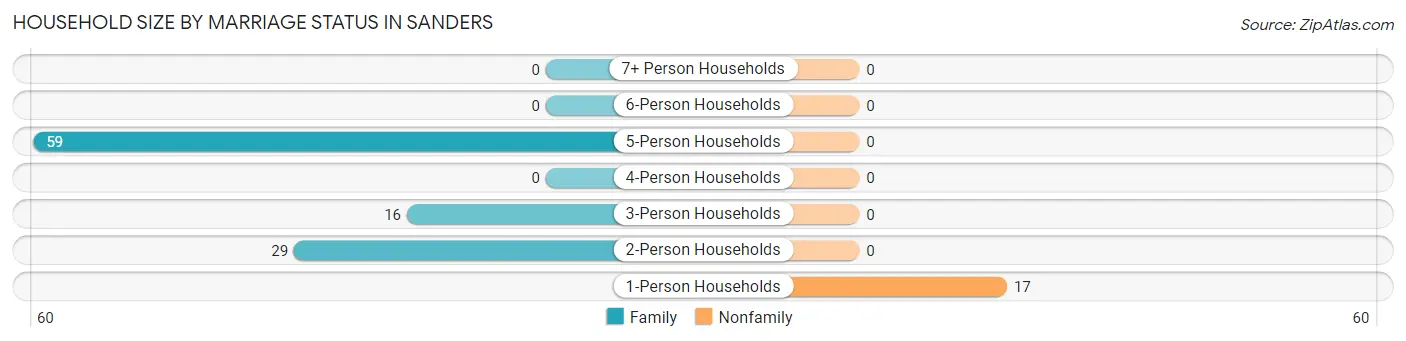
| Household Size | Family Households | Nonfamily Households |
| 1-Person Households | - | 17 (14.1%) |
| 2-Person Households | 29 (24.0%) | 0 (0.0%) |
| 3-Person Households | 16 (13.2%) | 0 (0.0%) |
| 4-Person Households | 0 (0.0%) | 0 (0.0%) |
| 5-Person Households | 59 (48.8%) | 0 (0.0%) |
| 6-Person Households | 0 (0.0%) | 0 (0.0%) |
| 7+ Person Households | 0 (0.0%) | 0 (0.0%) |
| Total | 104 (86.0%) | 17 (14.1%) |
Female Fertility in Sanders
Fertility by Age in Sanders
Average fertility rate in Sanders is 652.0 births per 1,000 women. Women in the age bracket of 20 to 34 years have the highest fertility rate with 806.0 births per 1,000 women. Women in the age bracket of 20 to 34 years acount for 100.0% of all women with births.
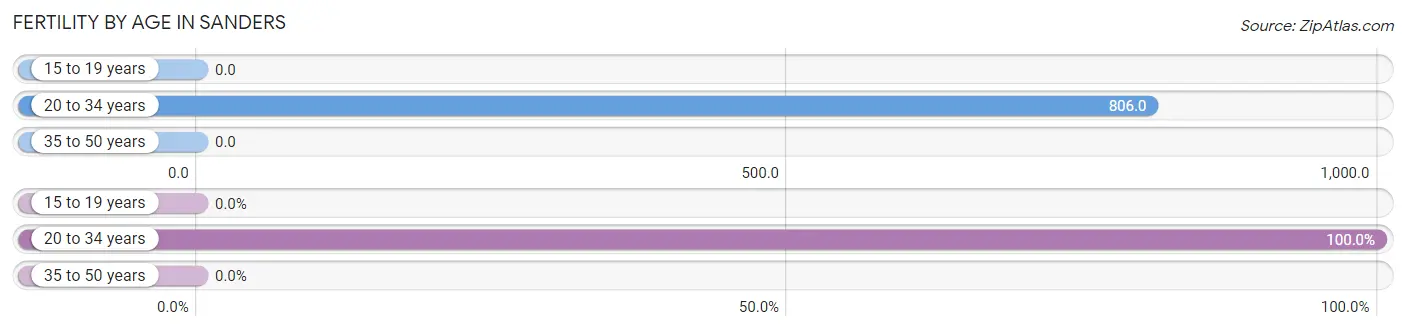
| Age Bracket | Women with Births | Births / 1,000 Women |
| 15 to 19 years | 0 (0.0%) | 0.0 |
| 20 to 34 years | 58 (100.0%) | 806.0 |
| 35 to 50 years | 0 (0.0%) | 0.0 |
| Total | 58 (100.0%) | 652.0 |
Fertility by Age by Marriage Status in Sanders
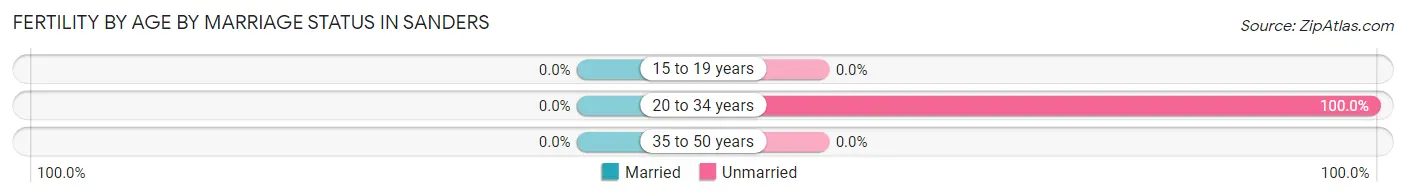
| Age Bracket | Married | Unmarried |
| 15 to 19 years | 0 (0.0%) | 0 (0.0%) |
| 20 to 34 years | 0 (0.0%) | 58 (100.0%) |
| 35 to 50 years | 0 (0.0%) | 0 (0.0%) |
| Total | 0 (0.0%) | 58 (100.0%) |
Fertility by Education in Sanders
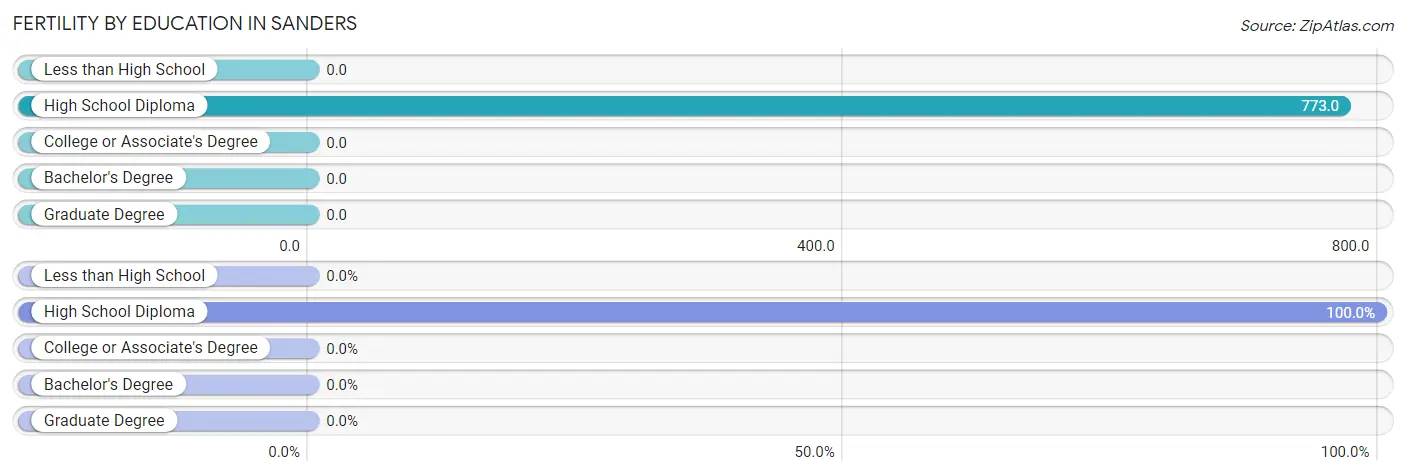
| Educational Attainment | Women with Births | Births / 1,000 Women |
| Less than High School | 0 (0.0%) | 0.0 |
| High School Diploma | 58 (100.0%) | 773.0 |
| College or Associate's Degree | 0 (0.0%) | 0.0 |
| Bachelor's Degree | 0 (0.0%) | 0.0 |
| Graduate Degree | 0 (0.0%) | 0.0 |
| Total | 58 (100.0%) | 652.0 |
Fertility by Education by Marriage Status in Sanders
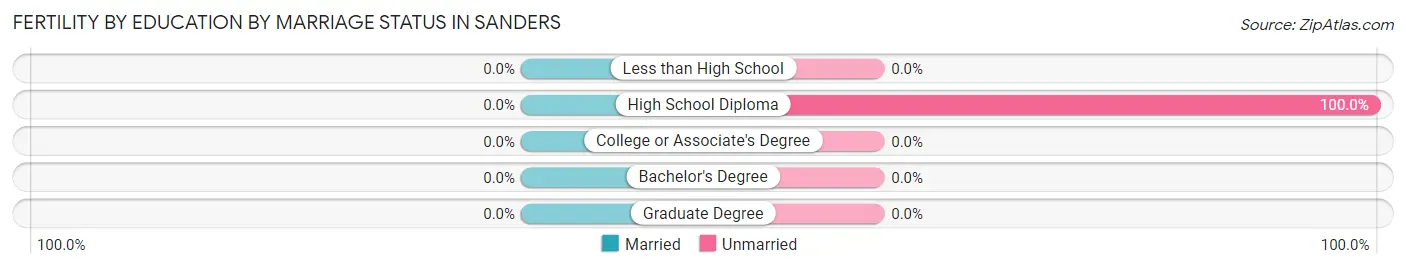
| Educational Attainment | Married | Unmarried |
| Less than High School | 0 (0.0%) | 0 (0.0%) |
| High School Diploma | 0 (0.0%) | 58 (100.0%) |
| College or Associate's Degree | 0 (0.0%) | 0 (0.0%) |
| Bachelor's Degree | 0 (0.0%) | 0 (0.0%) |
| Graduate Degree | 0 (0.0%) | 0 (0.0%) |
| Total | 0 (0.0%) | 58 (100.0%) |
Employment Characteristics in Sanders
Employment by Class of Employer in Sanders
Among the 235 employed individuals in Sanders, private company employees (161 | 68.5%), self-employed (not incorporated) (63 | 26.8%), and not-for-profit organizations (7 | 3.0%) make up the most common classes of employment.
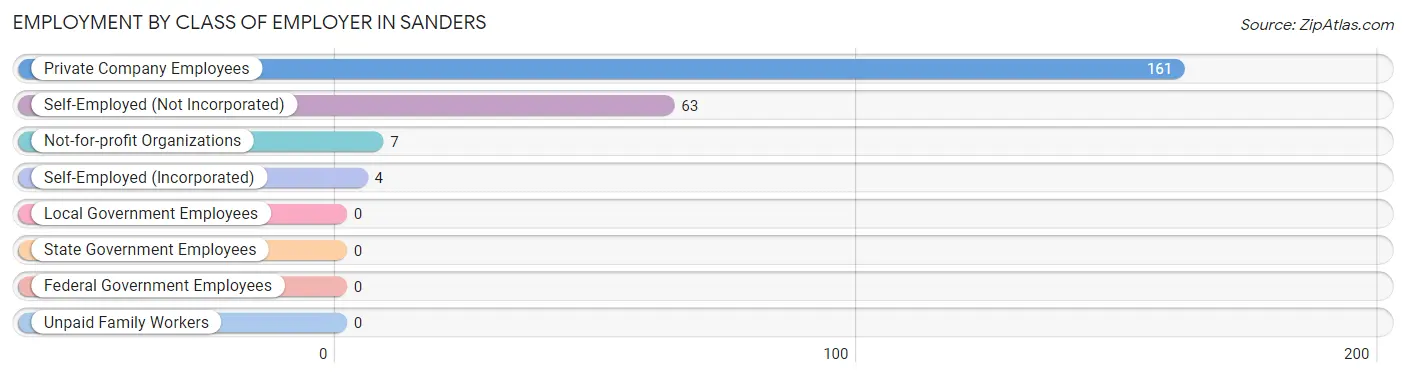
| Employer Class | # Employees | % Employees |
| Private Company Employees | 161 | 68.5% |
| Self-Employed (Incorporated) | 4 | 1.7% |
| Self-Employed (Not Incorporated) | 63 | 26.8% |
| Not-for-profit Organizations | 7 | 3.0% |
| Local Government Employees | 0 | 0.0% |
| State Government Employees | 0 | 0.0% |
| Federal Government Employees | 0 | 0.0% |
| Unpaid Family Workers | 0 | 0.0% |
| Total | 235 | 100.0% |
Employment Status by Age in Sanders
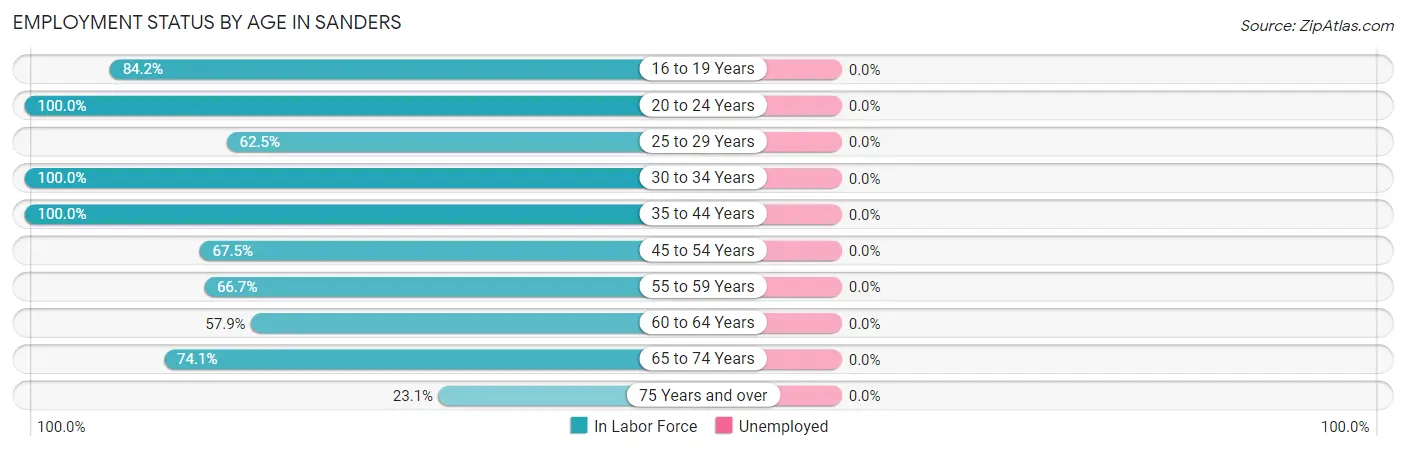
| Age Bracket | In Labor Force | Unemployed |
| 16 to 19 Years | 16 (84.2%) | 0 (0.0%) |
| 20 to 24 Years | 9 (100.0%) | 0 (0.0%) |
| 25 to 29 Years | 5 (62.5%) | 0 (0.0%) |
| 30 to 34 Years | 63 (100.0%) | 0 (0.0%) |
| 35 to 44 Years | 6 (100.0%) | 0 (0.0%) |
| 45 to 54 Years | 27 (67.5%) | 0 (0.0%) |
| 55 to 59 Years | 32 (66.7%) | 0 (0.0%) |
| 60 to 64 Years | 11 (57.9%) | 0 (0.0%) |
| 65 to 74 Years | 60 (74.1%) | 0 (0.0%) |
| 75 Years and over | 6 (23.1%) | 0 (0.0%) |
| Total | 235 (73.7%) | 0 (0.0%) |
Employment Status by Educational Attainment in Sanders
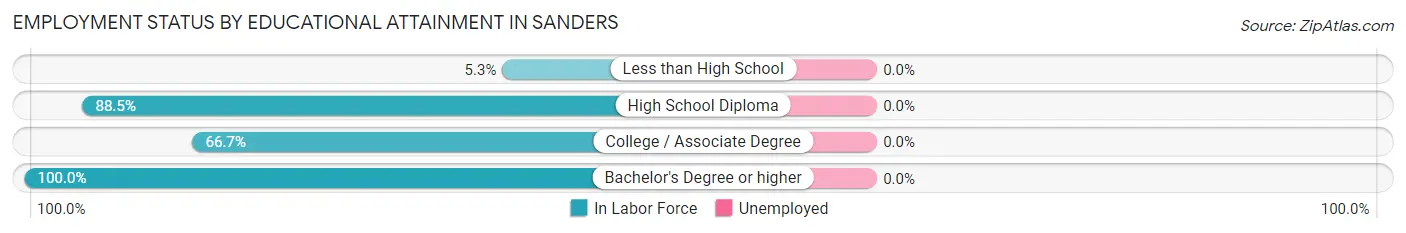
| Educational Attainment | In Labor Force | Unemployed |
| Less than High School | 1 (5.3%) | 0 (0.0%) |
| High School Diploma | 123 (88.5%) | 0 (0.0%) |
| College / Associate Degree | 12 (66.7%) | 0 (0.0%) |
| Bachelor's Degree or higher | 8 (100.0%) | 0 (0.0%) |
| Total | 144 (78.3%) | 0 (0.0%) |
Employment Occupations by Sex in Sanders
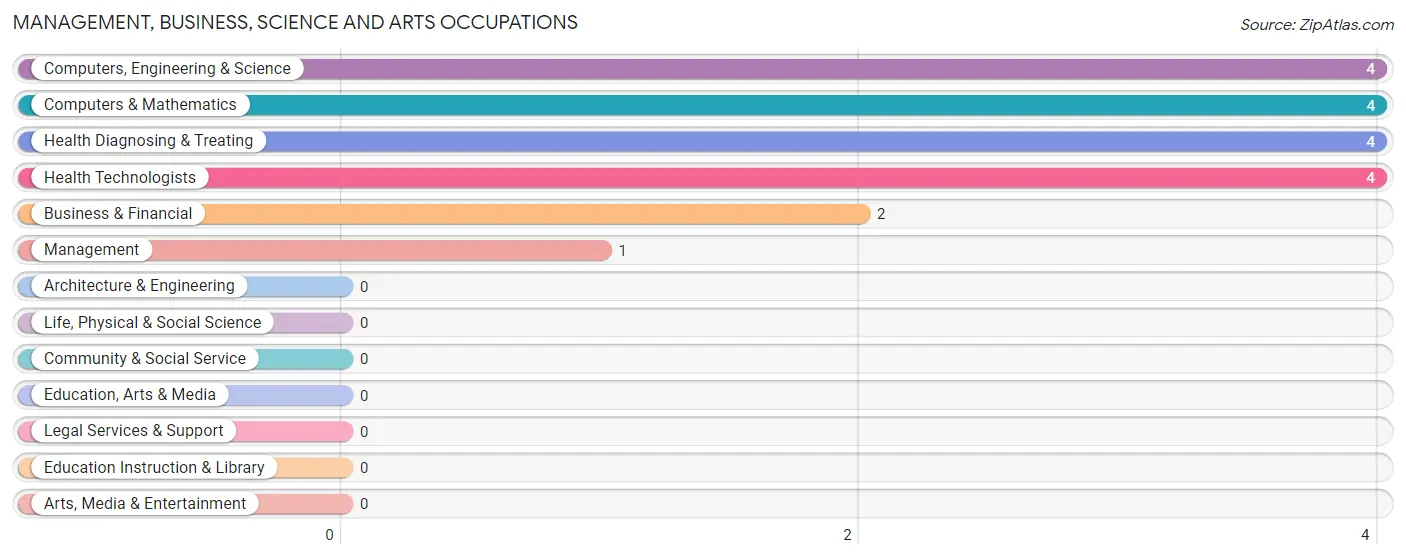
Management, Business, Science and Arts Occupations
The most common Management, Business, Science and Arts occupations in Sanders are Computers, Engineering & Science (4 | 1.7%), Computers & Mathematics (4 | 1.7%), Health Diagnosing & Treating (4 | 1.7%), Health Technologists (4 | 1.7%), and Business & Financial (2 | 0.9%).
Management, Business, Science and Arts Occupations by Sex
Within the Management, Business, Science and Arts occupations in Sanders, the most male-oriented occupations are Management (100.0%), Computers, Engineering & Science (100.0%), and Computers & Mathematics (100.0%), while the most female-oriented occupations are Business & Financial (100.0%), Health Diagnosing & Treating (100.0%), and Health Technologists (100.0%).
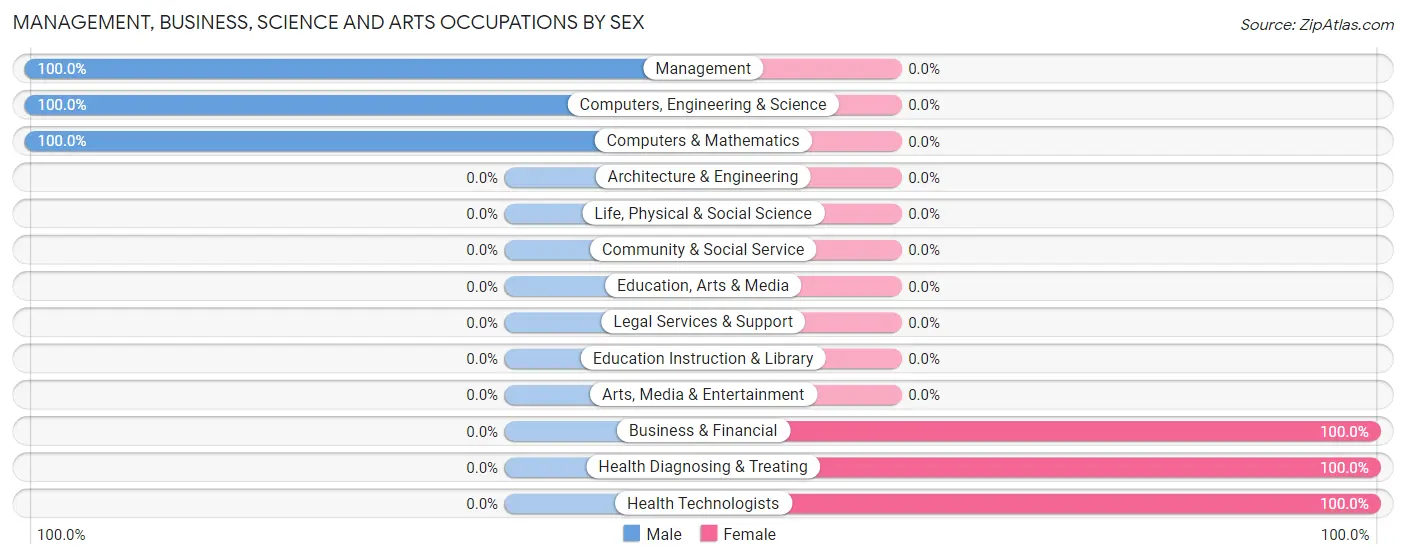
| Occupation | Male | Female |
| Management | 1 (100.0%) | 0 (0.0%) |
| Business & Financial | 0 (0.0%) | 2 (100.0%) |
| Computers, Engineering & Science | 4 (100.0%) | 0 (0.0%) |
| Computers & Mathematics | 4 (100.0%) | 0 (0.0%) |
| Architecture & Engineering | 0 (0.0%) | 0 (0.0%) |
| Life, Physical & Social Science | 0 (0.0%) | 0 (0.0%) |
| Community & Social Service | 0 (0.0%) | 0 (0.0%) |
| Education, Arts & Media | 0 (0.0%) | 0 (0.0%) |
| Legal Services & Support | 0 (0.0%) | 0 (0.0%) |
| Education Instruction & Library | 0 (0.0%) | 0 (0.0%) |
| Arts, Media & Entertainment | 0 (0.0%) | 0 (0.0%) |
| Health Diagnosing & Treating | 0 (0.0%) | 4 (100.0%) |
| Health Technologists | 0 (0.0%) | 4 (100.0%) |
| Total (Category) | 5 (45.5%) | 6 (54.5%) |
| Total (Overall) | 102 (43.4%) | 133 (56.6%) |
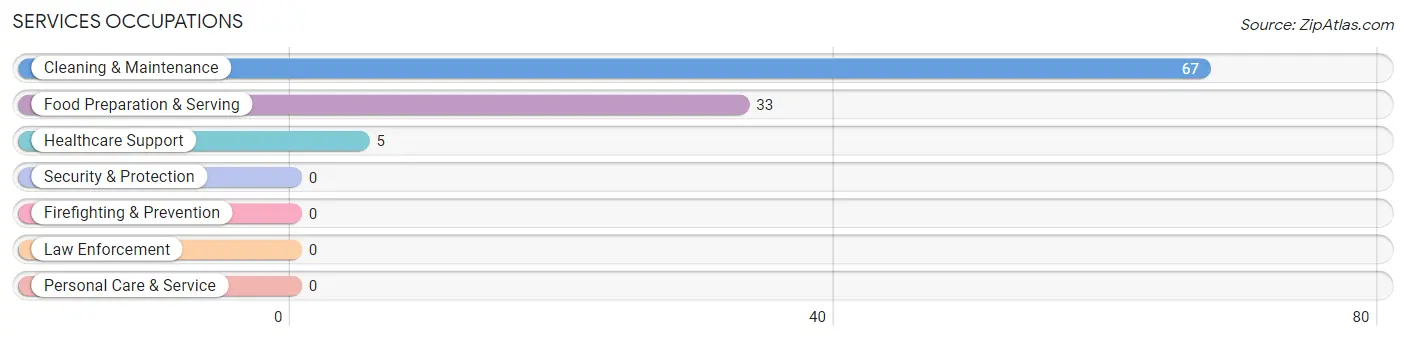
Services Occupations
The most common Services occupations in Sanders are Cleaning & Maintenance (67 | 28.5%), Food Preparation & Serving (33 | 14.0%), and Healthcare Support (5 | 2.1%).
Services Occupations by Sex
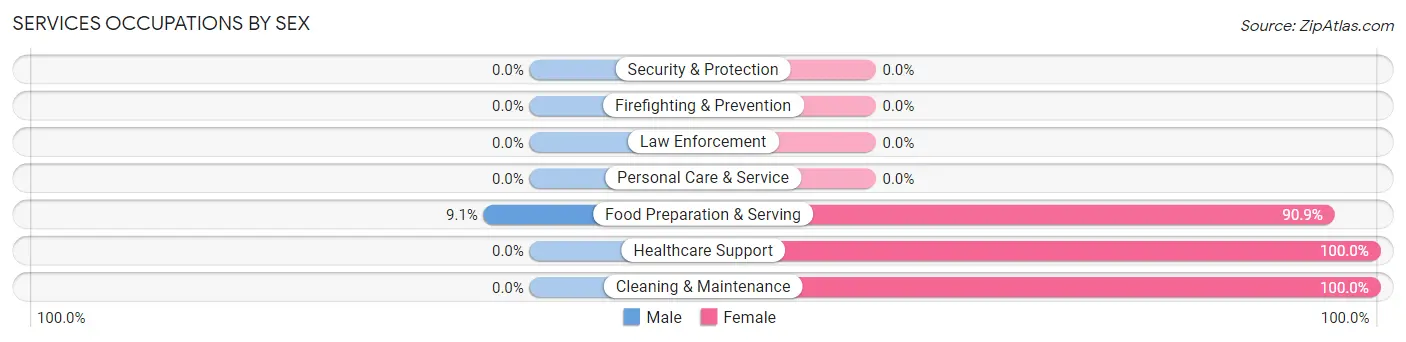
| Occupation | Male | Female |
| Healthcare Support | 0 (0.0%) | 5 (100.0%) |
| Security & Protection | 0 (0.0%) | 0 (0.0%) |
| Firefighting & Prevention | 0 (0.0%) | 0 (0.0%) |
| Law Enforcement | 0 (0.0%) | 0 (0.0%) |
| Food Preparation & Serving | 3 (9.1%) | 30 (90.9%) |
| Cleaning & Maintenance | 0 (0.0%) | 67 (100.0%) |
| Personal Care & Service | 0 (0.0%) | 0 (0.0%) |
| Total (Category) | 3 (2.9%) | 102 (97.1%) |
| Total (Overall) | 102 (43.4%) | 133 (56.6%) |
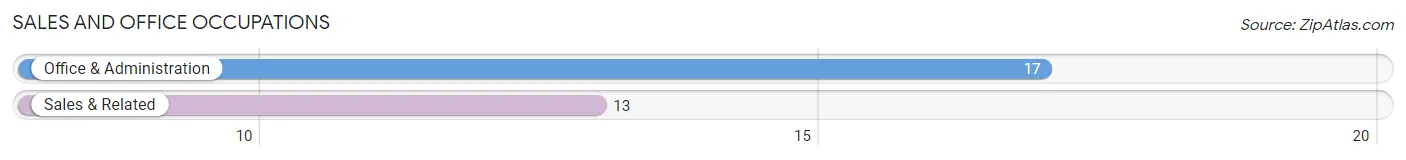
Sales and Office Occupations
The most common Sales and Office occupations in Sanders are Office & Administration (17 | 7.2%), and Sales & Related (13 | 5.5%).
Sales and Office Occupations by Sex
| Occupation | Male | Female |
| Sales & Related | 3 (23.1%) | 10 (76.9%) |
| Office & Administration | 3 (17.6%) | 14 (82.4%) |
| Total (Category) | 6 (20.0%) | 24 (80.0%) |
| Total (Overall) | 102 (43.4%) | 133 (56.6%) |
Natural Resources, Construction and Maintenance Occupations
The most common Natural Resources, Construction and Maintenance occupations in Sanders are Installation, Maintenance & Repair (63 | 26.8%), and Construction & Extraction (4 | 1.7%).
Natural Resources, Construction and Maintenance Occupations by Sex
| Occupation | Male | Female |
| Farming, Fishing & Forestry | 0 (0.0%) | 0 (0.0%) |
| Construction & Extraction | 4 (100.0%) | 0 (0.0%) |
| Installation, Maintenance & Repair | 63 (100.0%) | 0 (0.0%) |
| Total (Category) | 67 (100.0%) | 0 (0.0%) |
| Total (Overall) | 102 (43.4%) | 133 (56.6%) |
Production, Transportation and Moving Occupations
The most common Production, Transportation and Moving occupations in Sanders are Production (12 | 5.1%), Material Moving (6 | 2.5%), and Transportation (4 | 1.7%).
Production, Transportation and Moving Occupations by Sex
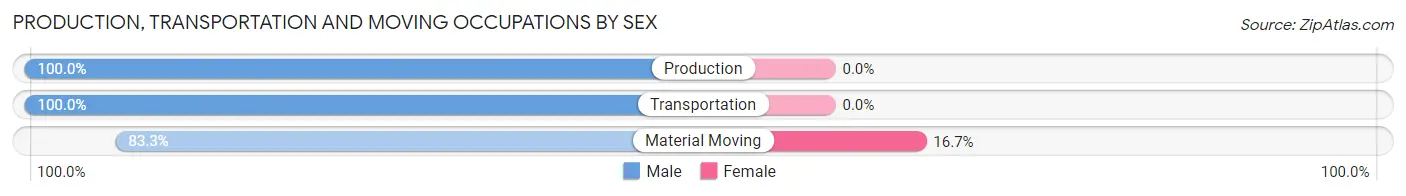
| Occupation | Male | Female |
| Production | 12 (100.0%) | 0 (0.0%) |
| Transportation | 4 (100.0%) | 0 (0.0%) |
| Material Moving | 5 (83.3%) | 1 (16.7%) |
| Total (Category) | 21 (95.5%) | 1 (4.5%) |
| Total (Overall) | 102 (43.4%) | 133 (56.6%) |
Employment Industries by Sex in Sanders
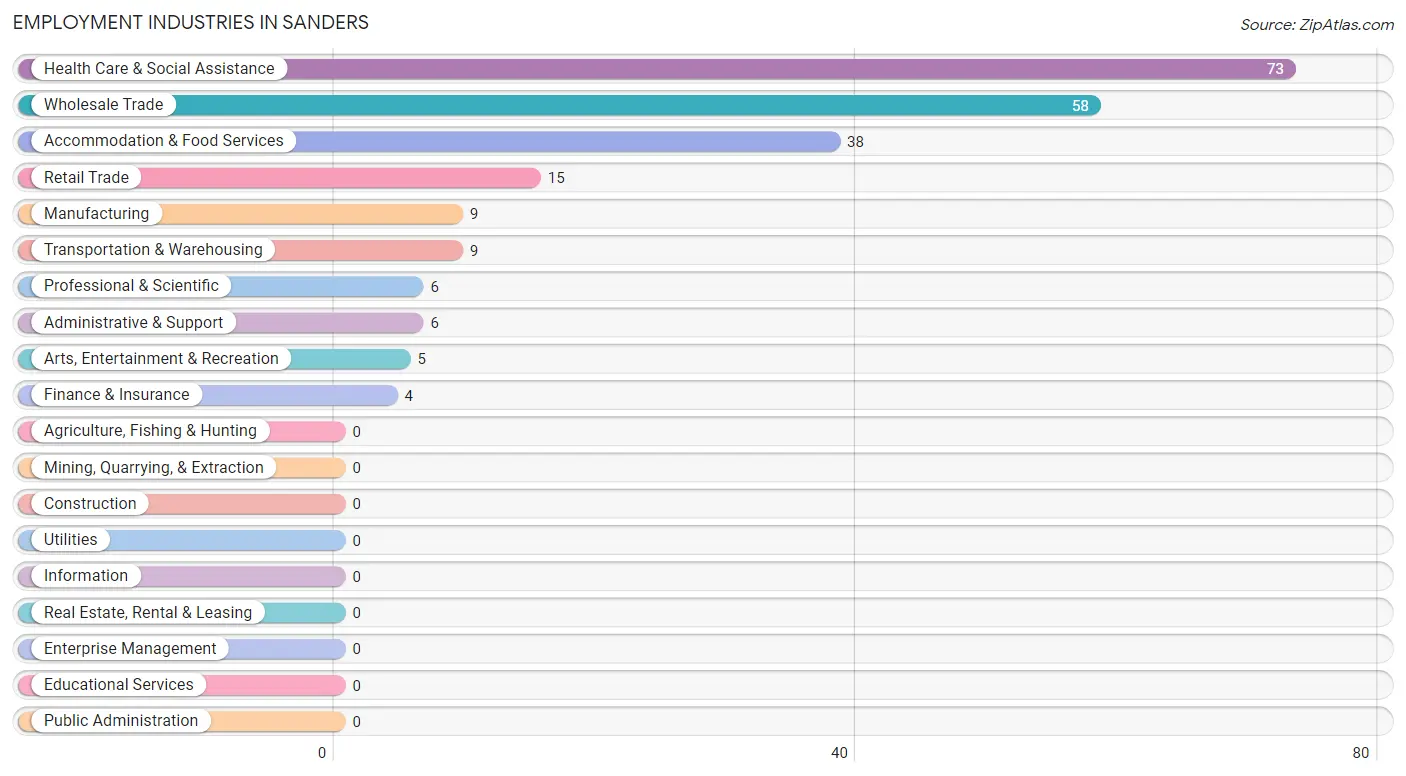
Employment Industries in Sanders
The major employment industries in Sanders include Health Care & Social Assistance (73 | 31.1%), Wholesale Trade (58 | 24.7%), Accommodation & Food Services (38 | 16.2%), Retail Trade (15 | 6.4%), and Manufacturing (9 | 3.8%).
Employment Industries by Sex in Sanders
The Sanders industries that see more men than women are Transportation & Warehousing (100.0%), Finance & Insurance (100.0%), and Wholesale Trade (98.3%), whereas the industries that tend to have a higher number of women are Professional & Scientific (100.0%), Health Care & Social Assistance (100.0%), and Arts, Entertainment & Recreation (100.0%).
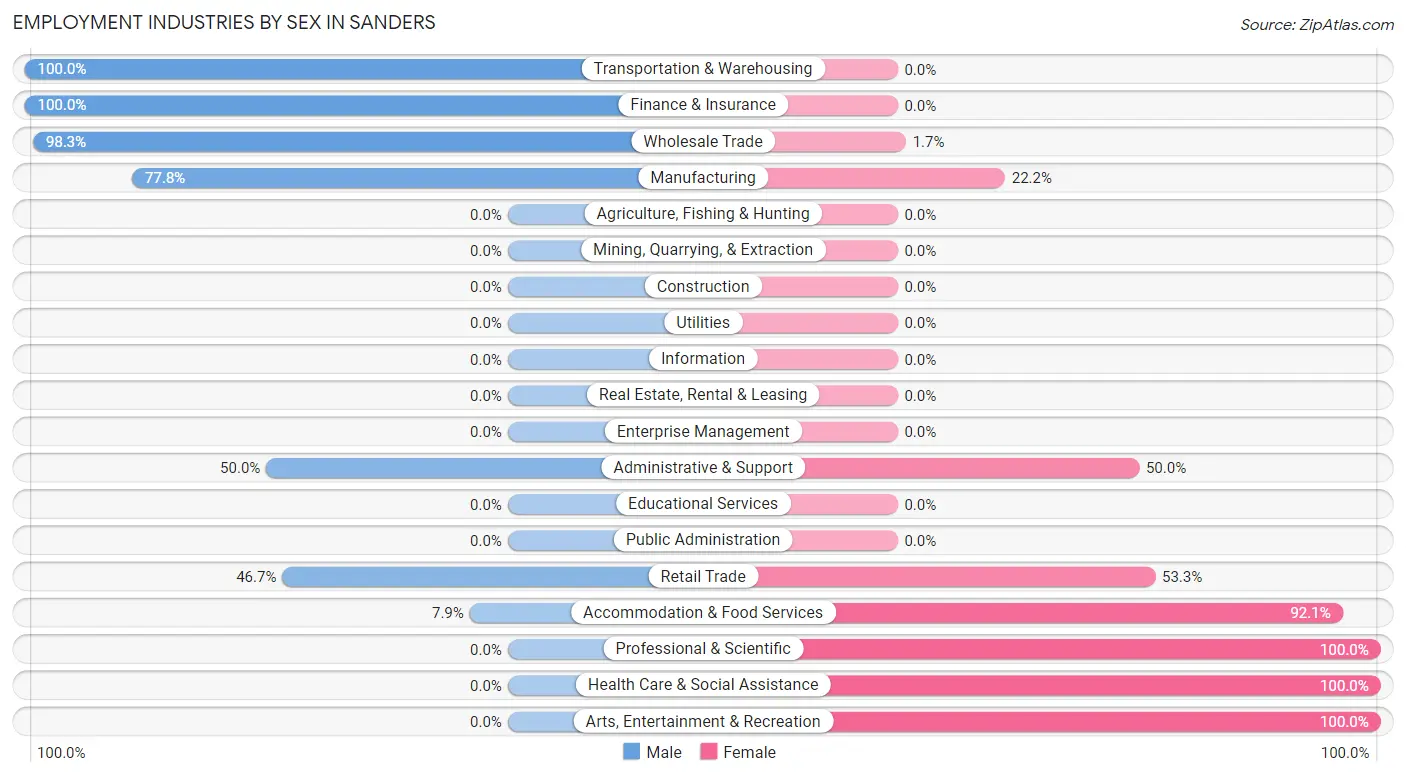
| Industry | Male | Female |
| Agriculture, Fishing & Hunting | 0 (0.0%) | 0 (0.0%) |
| Mining, Quarrying, & Extraction | 0 (0.0%) | 0 (0.0%) |
| Construction | 0 (0.0%) | 0 (0.0%) |
| Manufacturing | 7 (77.8%) | 2 (22.2%) |
| Wholesale Trade | 57 (98.3%) | 1 (1.7%) |
| Retail Trade | 7 (46.7%) | 8 (53.3%) |
| Transportation & Warehousing | 9 (100.0%) | 0 (0.0%) |
| Utilities | 0 (0.0%) | 0 (0.0%) |
| Information | 0 (0.0%) | 0 (0.0%) |
| Finance & Insurance | 4 (100.0%) | 0 (0.0%) |
| Real Estate, Rental & Leasing | 0 (0.0%) | 0 (0.0%) |
| Professional & Scientific | 0 (0.0%) | 6 (100.0%) |
| Enterprise Management | 0 (0.0%) | 0 (0.0%) |
| Administrative & Support | 3 (50.0%) | 3 (50.0%) |
| Educational Services | 0 (0.0%) | 0 (0.0%) |
| Health Care & Social Assistance | 0 (0.0%) | 73 (100.0%) |
| Arts, Entertainment & Recreation | 0 (0.0%) | 5 (100.0%) |
| Accommodation & Food Services | 3 (7.9%) | 35 (92.1%) |
| Public Administration | 0 (0.0%) | 0 (0.0%) |
| Total | 102 (43.4%) | 133 (56.6%) |
Education in Sanders
School Enrollment in Sanders
The most common levels of schooling among the 60 students in Sanders are elementary school (41 | 68.3%), high school (15 | 25.0%), and nursery / preschool (2 | 3.3%).
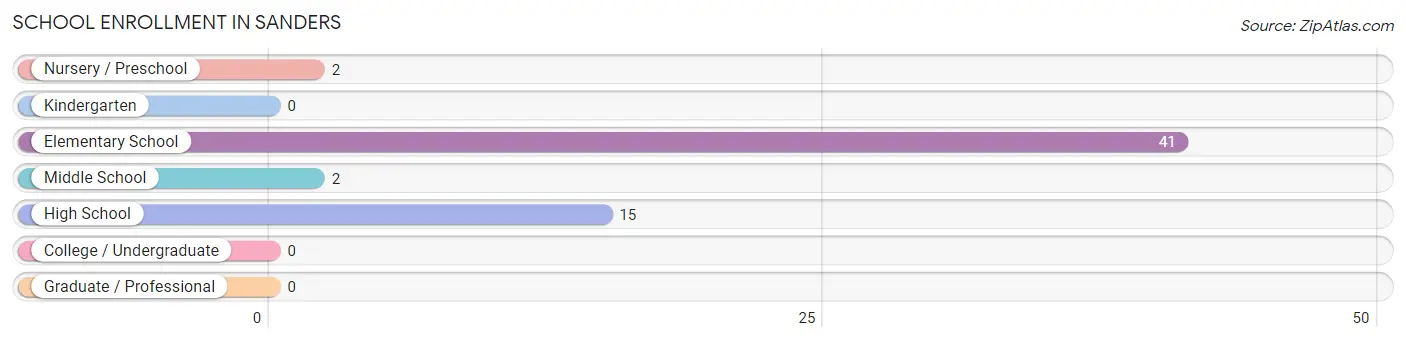
| School Level | # Students | % Students |
| Nursery / Preschool | 2 | 3.3% |
| Kindergarten | 0 | 0.0% |
| Elementary School | 41 | 68.3% |
| Middle School | 2 | 3.3% |
| High School | 15 | 25.0% |
| College / Undergraduate | 0 | 0.0% |
| Graduate / Professional | 0 | 0.0% |
| Total | 60 | 100.0% |
School Enrollment by Age by Funding Source in Sanders
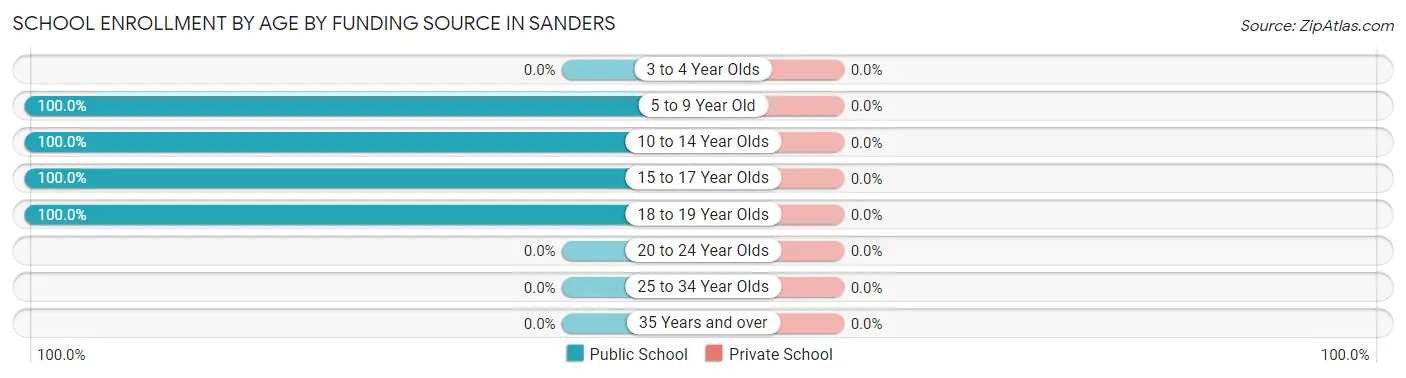
| Age Bracket | Public School | Private School |
| 3 to 4 Year Olds | 0 (0.0%) | 0 (0.0%) |
| 5 to 9 Year Old | 41 (100.0%) | 0 (0.0%) |
| 10 to 14 Year Olds | 5 (100.0%) | 0 (0.0%) |
| 15 to 17 Year Olds | 9 (100.0%) | 0 (0.0%) |
| 18 to 19 Year Olds | 5 (100.0%) | 0 (0.0%) |
| 20 to 24 Year Olds | 0 (0.0%) | 0 (0.0%) |
| 25 to 34 Year Olds | 0 (0.0%) | 0 (0.0%) |
| 35 Years and over | 0 (0.0%) | 0 (0.0%) |
| Total | 60 (100.0%) | 0 (0.0%) |
Educational Attainment by Field of Study in Sanders
Physical & health sciences (4 | 50.0%), and science & technology (4 | 50.0%) are the most common fields of study among 8 individuals in Sanders who have obtained a bachelor's degree or higher.
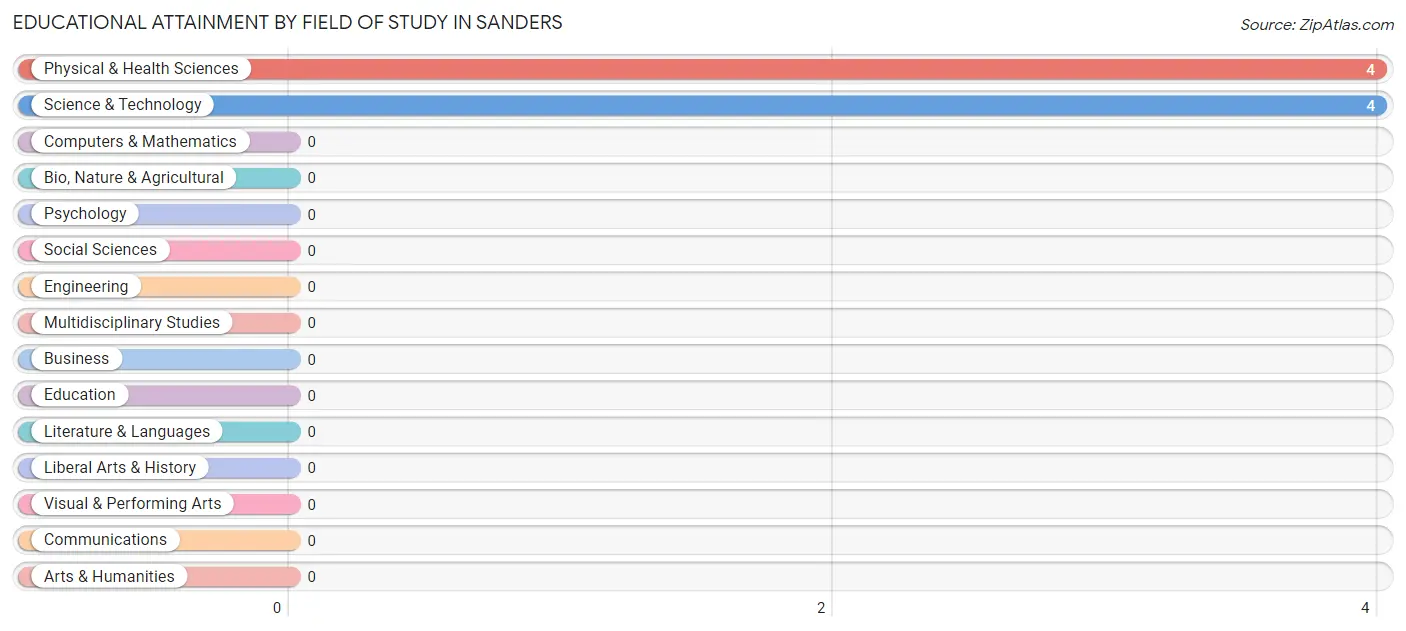
| Field of Study | # Graduates | % Graduates |
| Computers & Mathematics | 0 | 0.0% |
| Bio, Nature & Agricultural | 0 | 0.0% |
| Physical & Health Sciences | 4 | 50.0% |
| Psychology | 0 | 0.0% |
| Social Sciences | 0 | 0.0% |
| Engineering | 0 | 0.0% |
| Multidisciplinary Studies | 0 | 0.0% |
| Science & Technology | 4 | 50.0% |
| Business | 0 | 0.0% |
| Education | 0 | 0.0% |
| Literature & Languages | 0 | 0.0% |
| Liberal Arts & History | 0 | 0.0% |
| Visual & Performing Arts | 0 | 0.0% |
| Communications | 0 | 0.0% |
| Arts & Humanities | 0 | 0.0% |
| Total | 8 | 100.0% |
Transportation & Commute in Sanders
Vehicle Availability by Sex in Sanders
The most prevalent vehicle ownership categories in Sanders are males with 4 vehicles (76, accounting for 74.5%) and females with 4 vehicles (90, making up 57.1%).
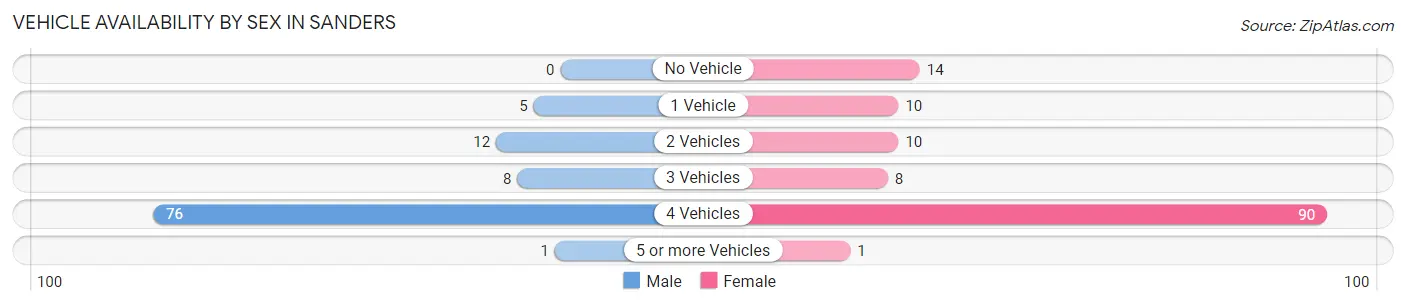
| Vehicles Available | Male | Female |
| No Vehicle | 0 (0.0%) | 14 (10.5%) |
| 1 Vehicle | 5 (4.9%) | 10 (7.5%) |
| 2 Vehicles | 12 (11.8%) | 10 (7.5%) |
| 3 Vehicles | 8 (7.8%) | 8 (6.0%) |
| 4 Vehicles | 76 (74.5%) | 90 (67.7%) |
| 5 or more Vehicles | 1 (1.0%) | 1 (0.7%) |
| Total | 102 (100.0%) | 133 (100.0%) |
Commute Time in Sanders
The most frequently occuring commute durations in Sanders are 25 to 29 minutes (101 commuters, 59.1%), 20 to 24 minutes (17 commuters, 9.9%), and 45 to 59 minutes (15 commuters, 8.8%).
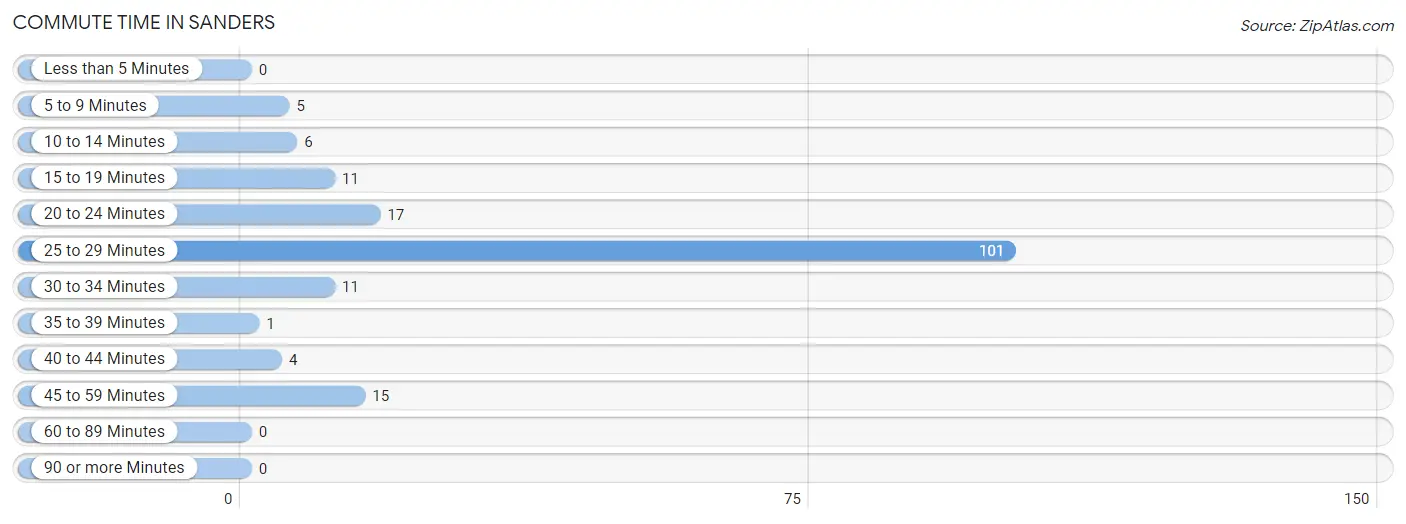
| Commute Time | # Commuters | % Commuters |
| Less than 5 Minutes | 0 | 0.0% |
| 5 to 9 Minutes | 5 | 2.9% |
| 10 to 14 Minutes | 6 | 3.5% |
| 15 to 19 Minutes | 11 | 6.4% |
| 20 to 24 Minutes | 17 | 9.9% |
| 25 to 29 Minutes | 101 | 59.1% |
| 30 to 34 Minutes | 11 | 6.4% |
| 35 to 39 Minutes | 1 | 0.6% |
| 40 to 44 Minutes | 4 | 2.3% |
| 45 to 59 Minutes | 15 | 8.8% |
| 60 to 89 Minutes | 0 | 0.0% |
| 90 or more Minutes | 0 | 0.0% |
Commute Time by Sex in Sanders
The most common commute times in Sanders are 20 to 24 minutes (17 commuters, 37.8%) for males and 25 to 29 minutes (98 commuters, 77.8%) for females.
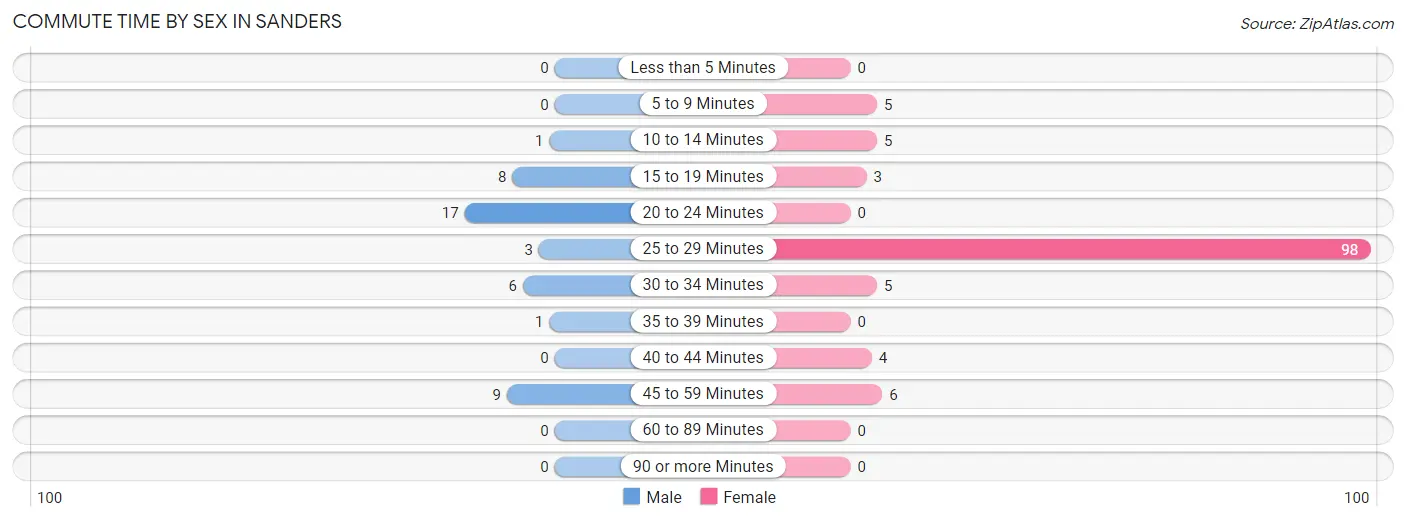
| Commute Time | Male | Female |
| Less than 5 Minutes | 0 (0.0%) | 0 (0.0%) |
| 5 to 9 Minutes | 0 (0.0%) | 5 (4.0%) |
| 10 to 14 Minutes | 1 (2.2%) | 5 (4.0%) |
| 15 to 19 Minutes | 8 (17.8%) | 3 (2.4%) |
| 20 to 24 Minutes | 17 (37.8%) | 0 (0.0%) |
| 25 to 29 Minutes | 3 (6.7%) | 98 (77.8%) |
| 30 to 34 Minutes | 6 (13.3%) | 5 (4.0%) |
| 35 to 39 Minutes | 1 (2.2%) | 0 (0.0%) |
| 40 to 44 Minutes | 0 (0.0%) | 4 (3.2%) |
| 45 to 59 Minutes | 9 (20.0%) | 6 (4.8%) |
| 60 to 89 Minutes | 0 (0.0%) | 0 (0.0%) |
| 90 or more Minutes | 0 (0.0%) | 0 (0.0%) |
Time of Departure to Work by Sex in Sanders
The most frequent times of departure to work in Sanders are 6:00 AM to 6:29 AM (13, 28.9%) for males and 7:00 AM to 7:29 AM (64, 50.8%) for females.
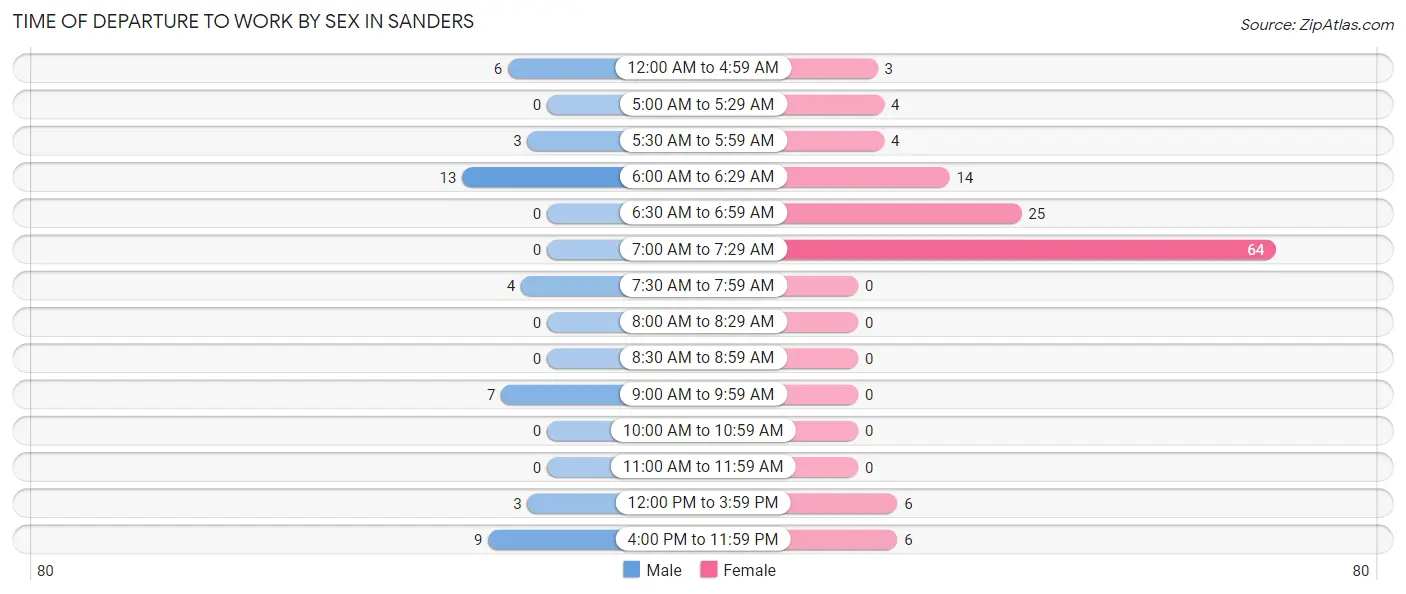
| Time of Departure | Male | Female |
| 12:00 AM to 4:59 AM | 6 (13.3%) | 3 (2.4%) |
| 5:00 AM to 5:29 AM | 0 (0.0%) | 4 (3.2%) |
| 5:30 AM to 5:59 AM | 3 (6.7%) | 4 (3.2%) |
| 6:00 AM to 6:29 AM | 13 (28.9%) | 14 (11.1%) |
| 6:30 AM to 6:59 AM | 0 (0.0%) | 25 (19.8%) |
| 7:00 AM to 7:29 AM | 0 (0.0%) | 64 (50.8%) |
| 7:30 AM to 7:59 AM | 4 (8.9%) | 0 (0.0%) |
| 8:00 AM to 8:29 AM | 0 (0.0%) | 0 (0.0%) |
| 8:30 AM to 8:59 AM | 0 (0.0%) | 0 (0.0%) |
| 9:00 AM to 9:59 AM | 7 (15.6%) | 0 (0.0%) |
| 10:00 AM to 10:59 AM | 0 (0.0%) | 0 (0.0%) |
| 11:00 AM to 11:59 AM | 0 (0.0%) | 0 (0.0%) |
| 12:00 PM to 3:59 PM | 3 (6.7%) | 6 (4.8%) |
| 4:00 PM to 11:59 PM | 9 (20.0%) | 6 (4.8%) |
| Total | 45 (100.0%) | 126 (100.0%) |
Housing Occupancy in Sanders
Occupancy by Ownership in Sanders
Of the total 121 dwellings in Sanders, owner-occupied units account for 111 (91.7%), while renter-occupied units make up 10 (8.3%).
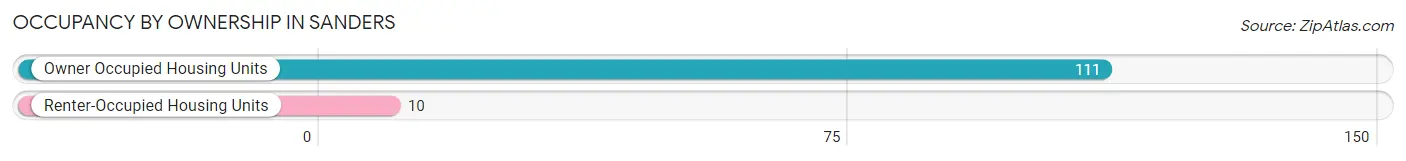
| Occupancy | # Housing Units | % Housing Units |
| Owner Occupied Housing Units | 111 | 91.7% |
| Renter-Occupied Housing Units | 10 | 8.3% |
| Total Occupied Housing Units | 121 | 100.0% |
Occupancy by Household Size in Sanders
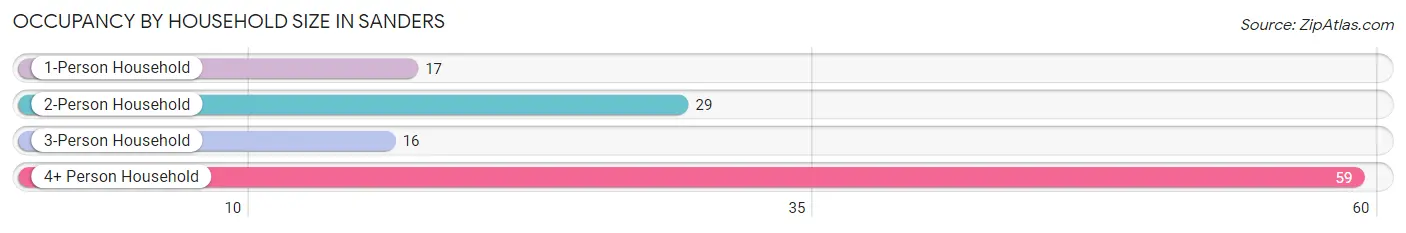
| Household Size | # Housing Units | % Housing Units |
| 1-Person Household | 17 | 14.1% |
| 2-Person Household | 29 | 24.0% |
| 3-Person Household | 16 | 13.2% |
| 4+ Person Household | 59 | 48.8% |
| Total Housing Units | 121 | 100.0% |
Occupancy by Ownership by Household Size in Sanders
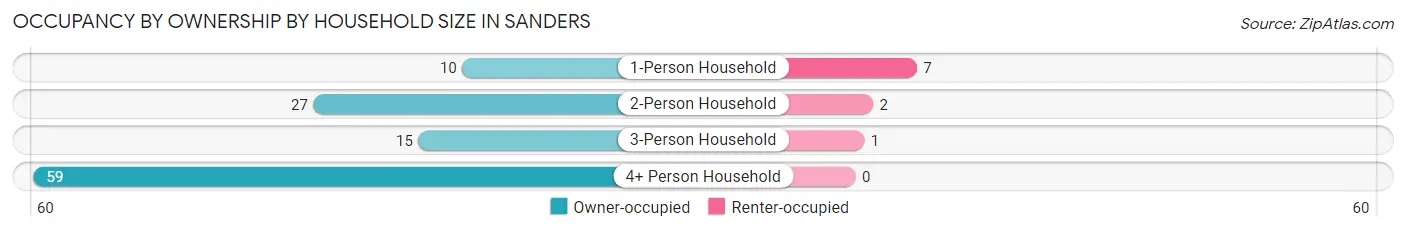
| Household Size | Owner-occupied | Renter-occupied |
| 1-Person Household | 10 (58.8%) | 7 (41.2%) |
| 2-Person Household | 27 (93.1%) | 2 (6.9%) |
| 3-Person Household | 15 (93.8%) | 1 (6.2%) |
| 4+ Person Household | 59 (100.0%) | 0 (0.0%) |
| Total Housing Units | 111 (91.7%) | 10 (8.3%) |
Occupancy by Educational Attainment in Sanders
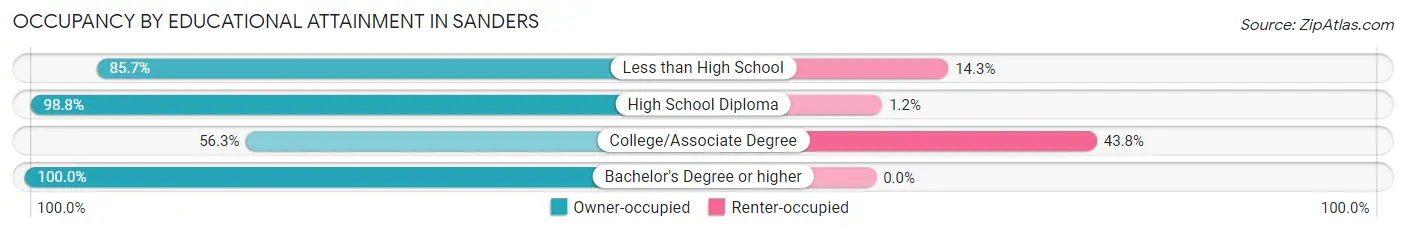
| Household Size | Owner-occupied | Renter-occupied |
| Less than High School | 12 (85.7%) | 2 (14.3%) |
| High School Diploma | 82 (98.8%) | 1 (1.2%) |
| College/Associate Degree | 9 (56.2%) | 7 (43.8%) |
| Bachelor's Degree or higher | 8 (100.0%) | 0 (0.0%) |
Occupancy by Age of Householder in Sanders
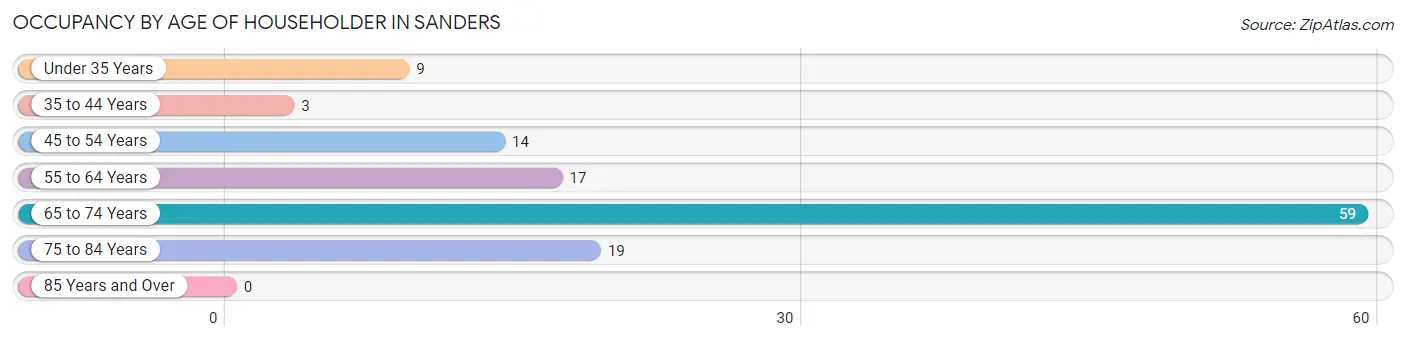
| Age Bracket | # Households | % Households |
| Under 35 Years | 9 | 7.4% |
| 35 to 44 Years | 3 | 2.5% |
| 45 to 54 Years | 14 | 11.6% |
| 55 to 64 Years | 17 | 14.1% |
| 65 to 74 Years | 59 | 48.8% |
| 75 to 84 Years | 19 | 15.7% |
| 85 Years and Over | 0 | 0.0% |
| Total | 121 | 100.0% |
Housing Finances in Sanders
Median Income by Occupancy in Sanders
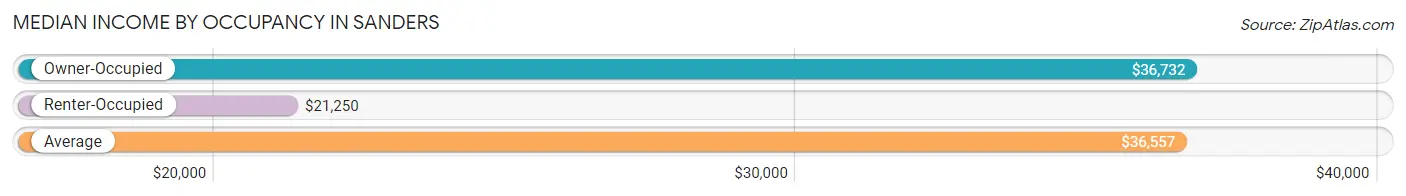
| Occupancy Type | # Households | Median Income |
| Owner-Occupied | 111 (91.7%) | $36,732 |
| Renter-Occupied | 10 (8.3%) | $21,250 |
| Average | 121 (100.0%) | $36,557 |
Occupancy by Householder Income Bracket in Sanders
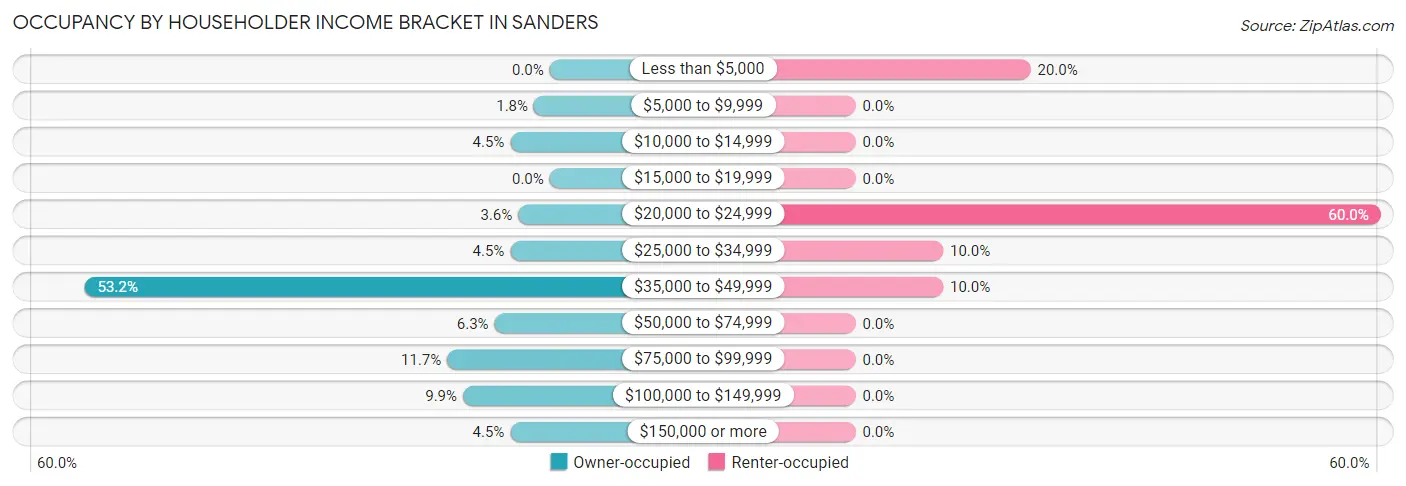
| Income Bracket | Owner-occupied | Renter-occupied |
| Less than $5,000 | 0 (0.0%) | 2 (20.0%) |
| $5,000 to $9,999 | 2 (1.8%) | 0 (0.0%) |
| $10,000 to $14,999 | 5 (4.5%) | 0 (0.0%) |
| $15,000 to $19,999 | 0 (0.0%) | 0 (0.0%) |
| $20,000 to $24,999 | 4 (3.6%) | 6 (60.0%) |
| $25,000 to $34,999 | 5 (4.5%) | 1 (10.0%) |
| $35,000 to $49,999 | 59 (53.1%) | 1 (10.0%) |
| $50,000 to $74,999 | 7 (6.3%) | 0 (0.0%) |
| $75,000 to $99,999 | 13 (11.7%) | 0 (0.0%) |
| $100,000 to $149,999 | 11 (9.9%) | 0 (0.0%) |
| $150,000 or more | 5 (4.5%) | 0 (0.0%) |
| Total | 111 (100.0%) | 10 (100.0%) |
Monthly Housing Cost Tiers in Sanders
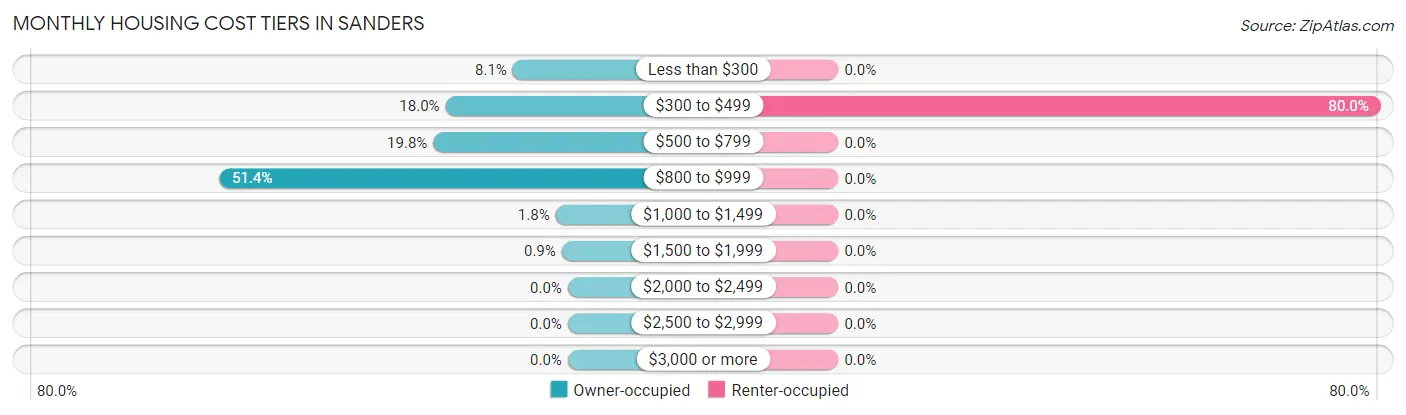
| Monthly Cost | Owner-occupied | Renter-occupied |
| Less than $300 | 9 (8.1%) | 0 (0.0%) |
| $300 to $499 | 20 (18.0%) | 8 (80.0%) |
| $500 to $799 | 22 (19.8%) | 0 (0.0%) |
| $800 to $999 | 57 (51.3%) | 0 (0.0%) |
| $1,000 to $1,499 | 2 (1.8%) | 0 (0.0%) |
| $1,500 to $1,999 | 1 (0.9%) | 0 (0.0%) |
| $2,000 to $2,499 | 0 (0.0%) | 0 (0.0%) |
| $2,500 to $2,999 | 0 (0.0%) | 0 (0.0%) |
| $3,000 or more | 0 (0.0%) | 0 (0.0%) |
| Total | 111 (100.0%) | 10 (100.0%) |
Physical Housing Characteristics in Sanders
Housing Structures in Sanders
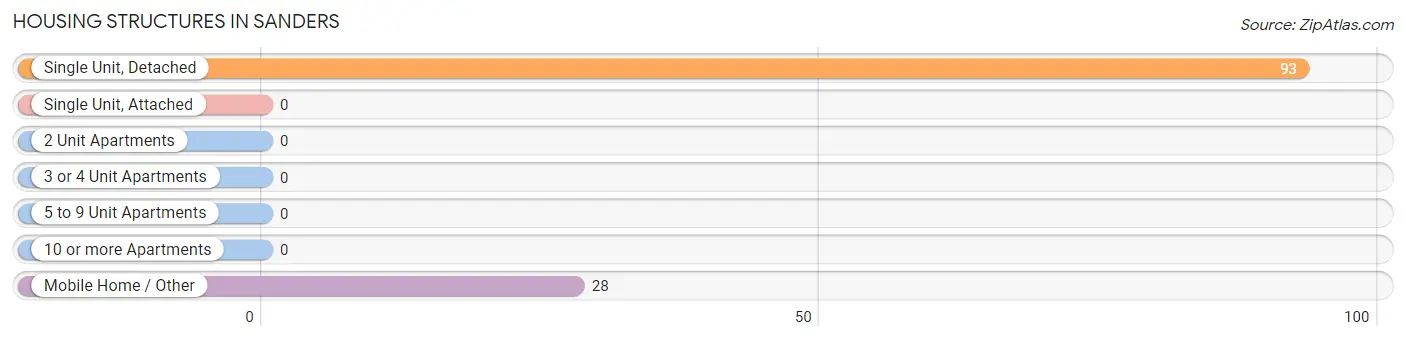
| Structure Type | # Housing Units | % Housing Units |
| Single Unit, Detached | 93 | 76.9% |
| Single Unit, Attached | 0 | 0.0% |
| 2 Unit Apartments | 0 | 0.0% |
| 3 or 4 Unit Apartments | 0 | 0.0% |
| 5 to 9 Unit Apartments | 0 | 0.0% |
| 10 or more Apartments | 0 | 0.0% |
| Mobile Home / Other | 28 | 23.1% |
| Total | 121 | 100.0% |
Housing Structures by Occupancy in Sanders
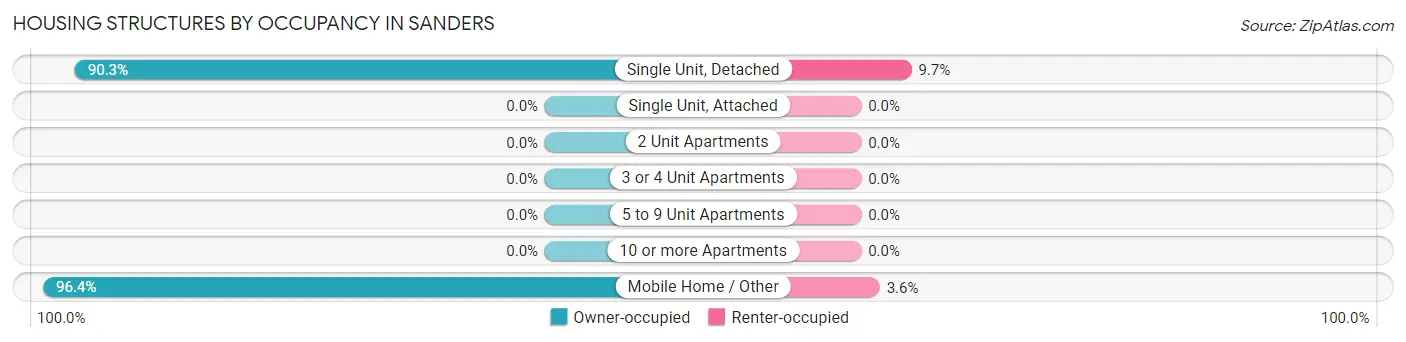
| Structure Type | Owner-occupied | Renter-occupied |
| Single Unit, Detached | 84 (90.3%) | 9 (9.7%) |
| Single Unit, Attached | 0 (0.0%) | 0 (0.0%) |
| 2 Unit Apartments | 0 (0.0%) | 0 (0.0%) |
| 3 or 4 Unit Apartments | 0 (0.0%) | 0 (0.0%) |
| 5 to 9 Unit Apartments | 0 (0.0%) | 0 (0.0%) |
| 10 or more Apartments | 0 (0.0%) | 0 (0.0%) |
| Mobile Home / Other | 27 (96.4%) | 1 (3.6%) |
| Total | 111 (91.7%) | 10 (8.3%) |
Housing Structures by Number of Rooms in Sanders
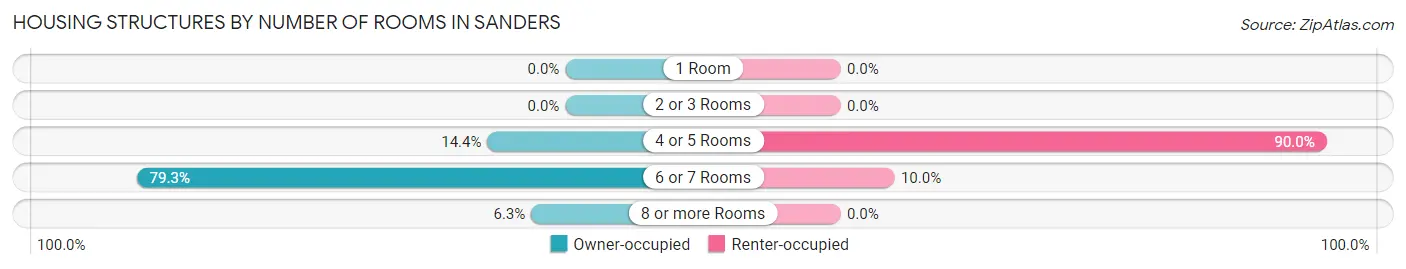
| Number of Rooms | Owner-occupied | Renter-occupied |
| 1 Room | 0 (0.0%) | 0 (0.0%) |
| 2 or 3 Rooms | 0 (0.0%) | 0 (0.0%) |
| 4 or 5 Rooms | 16 (14.4%) | 9 (90.0%) |
| 6 or 7 Rooms | 88 (79.3%) | 1 (10.0%) |
| 8 or more Rooms | 7 (6.3%) | 0 (0.0%) |
| Total | 111 (100.0%) | 10 (100.0%) |
Housing Structure by Heating Type in Sanders
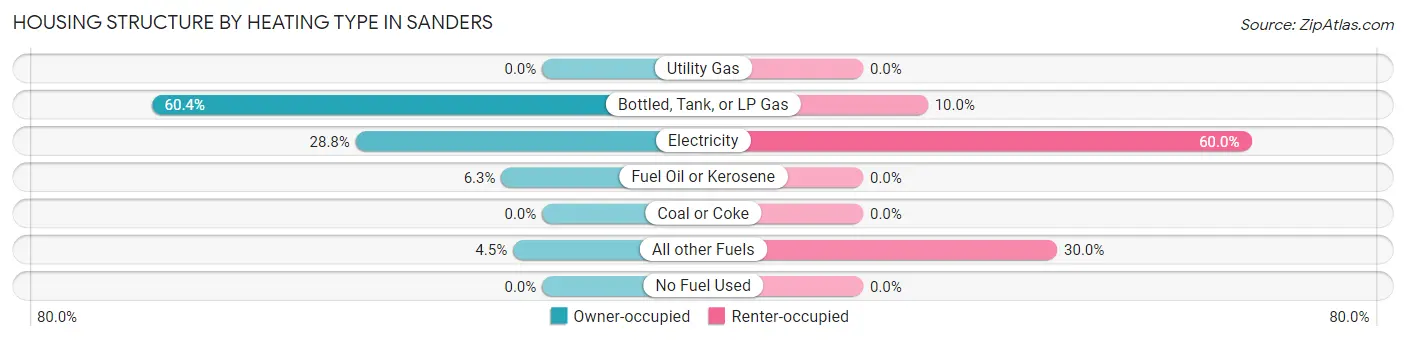
| Heating Type | Owner-occupied | Renter-occupied |
| Utility Gas | 0 (0.0%) | 0 (0.0%) |
| Bottled, Tank, or LP Gas | 67 (60.4%) | 1 (10.0%) |
| Electricity | 32 (28.8%) | 6 (60.0%) |
| Fuel Oil or Kerosene | 7 (6.3%) | 0 (0.0%) |
| Coal or Coke | 0 (0.0%) | 0 (0.0%) |
| All other Fuels | 5 (4.5%) | 3 (30.0%) |
| No Fuel Used | 0 (0.0%) | 0 (0.0%) |
| Total | 111 (100.0%) | 10 (100.0%) |
Household Vehicle Usage in Sanders
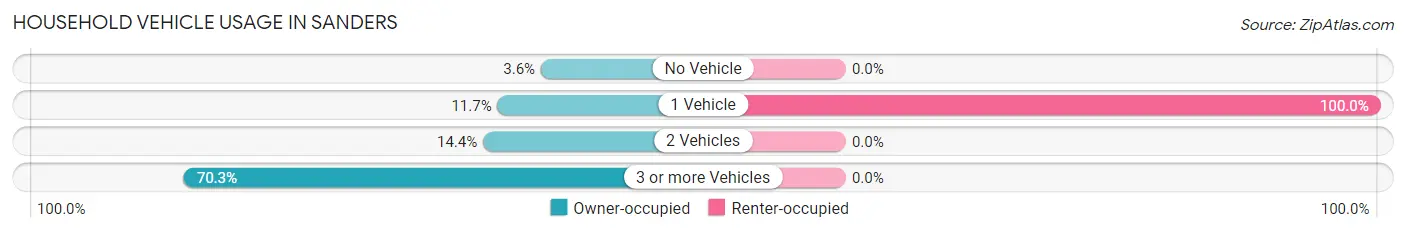
| Vehicles per Household | Owner-occupied | Renter-occupied |
| No Vehicle | 4 (3.6%) | 0 (0.0%) |
| 1 Vehicle | 13 (11.7%) | 10 (100.0%) |
| 2 Vehicles | 16 (14.4%) | 0 (0.0%) |
| 3 or more Vehicles | 78 (70.3%) | 0 (0.0%) |
| Total | 111 (100.0%) | 10 (100.0%) |
Real Estate & Mortgages in Sanders
Real Estate and Mortgage Overview in Sanders
| Characteristic | Without Mortgage | With Mortgage |
| Housing Units | 104 | 7 |
| Median Property Value | $76,500 | $0 |
| Median Household Income | $36,842 | $0 |
| Monthly Housing Costs | $809 | $0 |
| Real Estate Taxes | $3,132 | $6 |
Property Value by Mortgage Status in Sanders
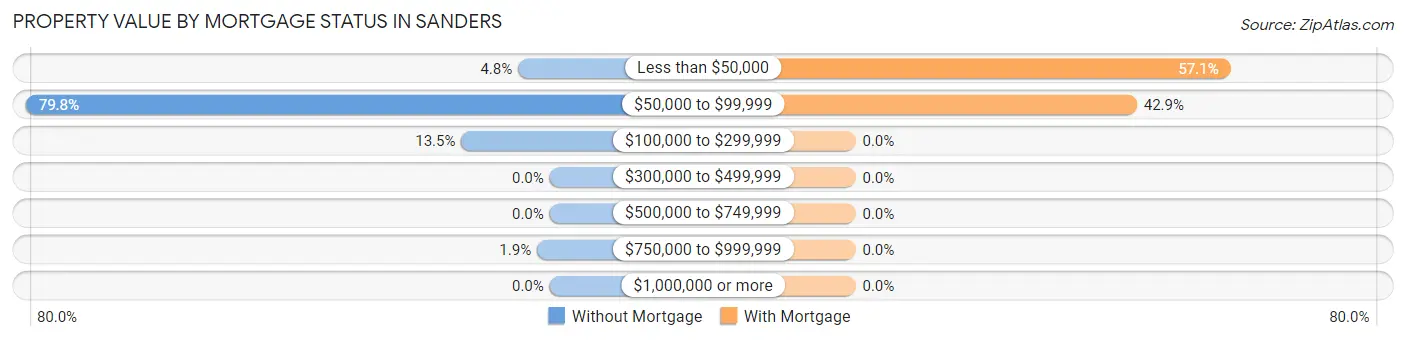
| Property Value | Without Mortgage | With Mortgage |
| Less than $50,000 | 5 (4.8%) | 4 (57.1%) |
| $50,000 to $99,999 | 83 (79.8%) | 3 (42.9%) |
| $100,000 to $299,999 | 14 (13.5%) | 0 (0.0%) |
| $300,000 to $499,999 | 0 (0.0%) | 0 (0.0%) |
| $500,000 to $749,999 | 0 (0.0%) | 0 (0.0%) |
| $750,000 to $999,999 | 2 (1.9%) | 0 (0.0%) |
| $1,000,000 or more | 0 (0.0%) | 0 (0.0%) |
| Total | 104 (100.0%) | 7 (100.0%) |
Household Income by Mortgage Status in Sanders
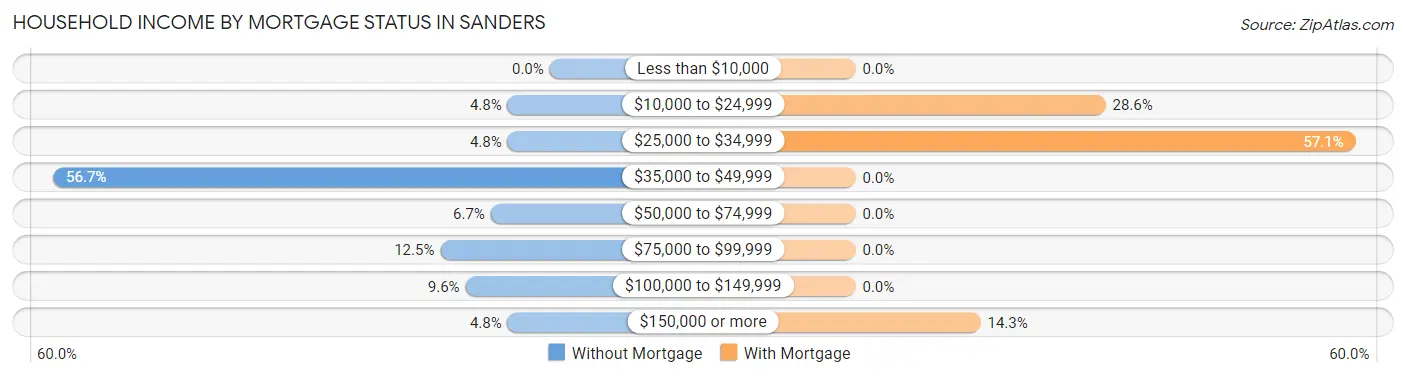
| Household Income | Without Mortgage | With Mortgage |
| Less than $10,000 | 0 (0.0%) | 0 (0.0%) |
| $10,000 to $24,999 | 5 (4.8%) | 2 (28.6%) |
| $25,000 to $34,999 | 5 (4.8%) | 4 (57.1%) |
| $35,000 to $49,999 | 59 (56.7%) | 0 (0.0%) |
| $50,000 to $74,999 | 7 (6.7%) | 0 (0.0%) |
| $75,000 to $99,999 | 13 (12.5%) | 0 (0.0%) |
| $100,000 to $149,999 | 10 (9.6%) | 0 (0.0%) |
| $150,000 or more | 5 (4.8%) | 1 (14.3%) |
| Total | 104 (100.0%) | 7 (100.0%) |
Property Value to Household Income Ratio in Sanders
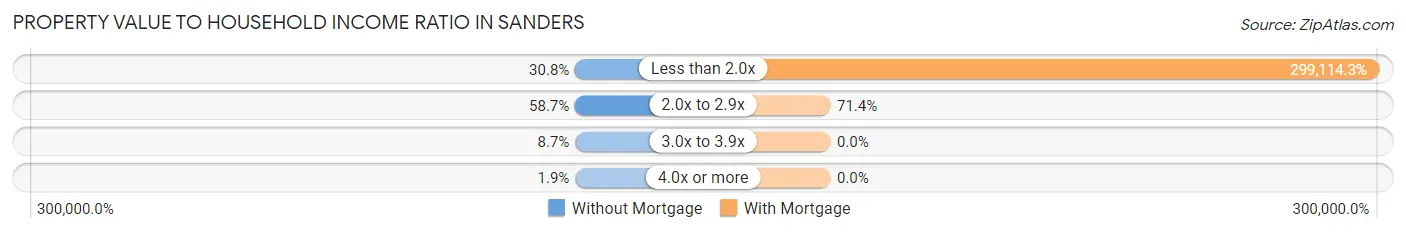
| Value-to-Income Ratio | Without Mortgage | With Mortgage |
| Less than 2.0x | 32 (30.8%) | 20,938 (299,114.3%) |
| 2.0x to 2.9x | 61 (58.7%) | 5 (71.4%) |
| 3.0x to 3.9x | 9 (8.6%) | 0 (0.0%) |
| 4.0x or more | 2 (1.9%) | 0 (0.0%) |
| Total | 104 (100.0%) | 7 (100.0%) |
Real Estate Taxes by Mortgage Status in Sanders
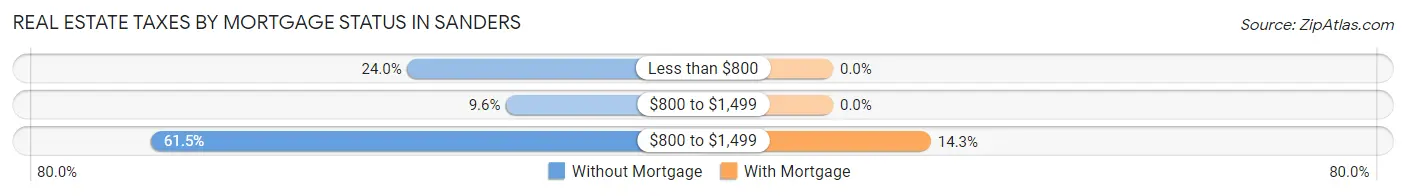
| Property Taxes | Without Mortgage | With Mortgage |
| Less than $800 | 25 (24.0%) | 0 (0.0%) |
| $800 to $1,499 | 10 (9.6%) | 0 (0.0%) |
| $800 to $1,499 | 64 (61.5%) | 1 (14.3%) |
| Total | 104 (100.0%) | 7 (100.0%) |
Health & Disability in Sanders
Health Insurance Coverage by Age in Sanders
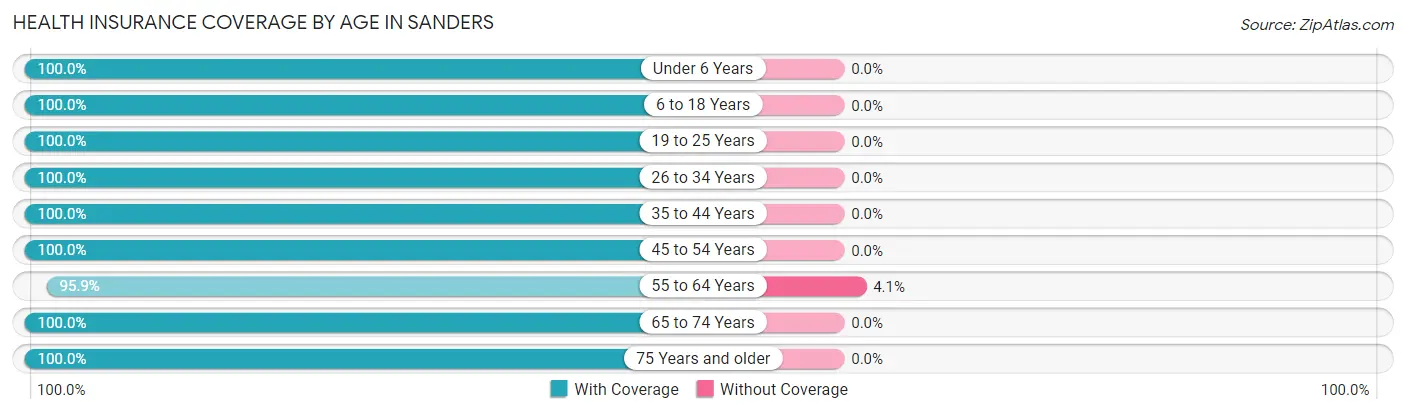
| Age Bracket | With Coverage | Without Coverage |
| Under 6 Years | 22 (100.0%) | 0 (0.0%) |
| 6 to 18 Years | 58 (100.0%) | 0 (0.0%) |
| 19 to 25 Years | 14 (100.0%) | 0 (0.0%) |
| 26 to 34 Years | 68 (100.0%) | 0 (0.0%) |
| 35 to 44 Years | 6 (100.0%) | 0 (0.0%) |
| 45 to 54 Years | 29 (100.0%) | 0 (0.0%) |
| 55 to 64 Years | 47 (95.9%) | 2 (4.1%) |
| 65 to 74 Years | 72 (100.0%) | 0 (0.0%) |
| 75 Years and older | 23 (100.0%) | 0 (0.0%) |
| Total | 339 (99.4%) | 2 (0.6%) |
Health Insurance Coverage by Citizenship Status in Sanders
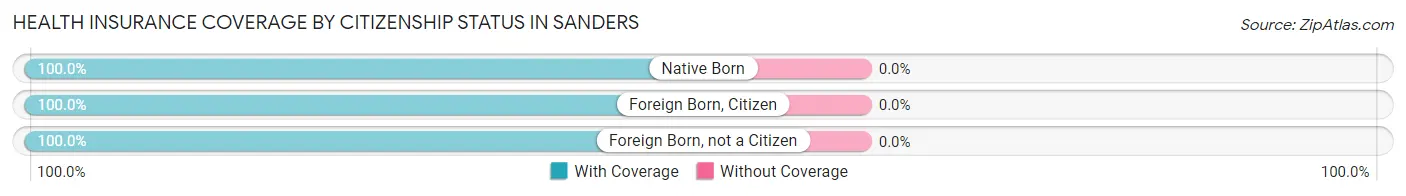
| Citizenship Status | With Coverage | Without Coverage |
| Native Born | 22 (100.0%) | 0 (0.0%) |
| Foreign Born, Citizen | 58 (100.0%) | 0 (0.0%) |
| Foreign Born, not a Citizen | 14 (100.0%) | 0 (0.0%) |
Health Insurance Coverage by Household Income in Sanders
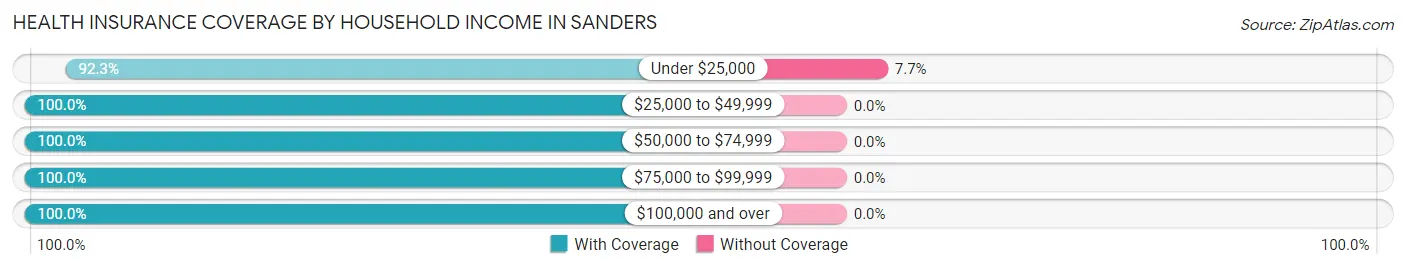
| Household Income | With Coverage | Without Coverage |
| Under $25,000 | 24 (92.3%) | 2 (7.7%) |
| $25,000 to $49,999 | 217 (100.0%) | 0 (0.0%) |
| $50,000 to $74,999 | 17 (100.0%) | 0 (0.0%) |
| $75,000 to $99,999 | 34 (100.0%) | 0 (0.0%) |
| $100,000 and over | 47 (100.0%) | 0 (0.0%) |
Public vs Private Health Insurance Coverage by Age in Sanders
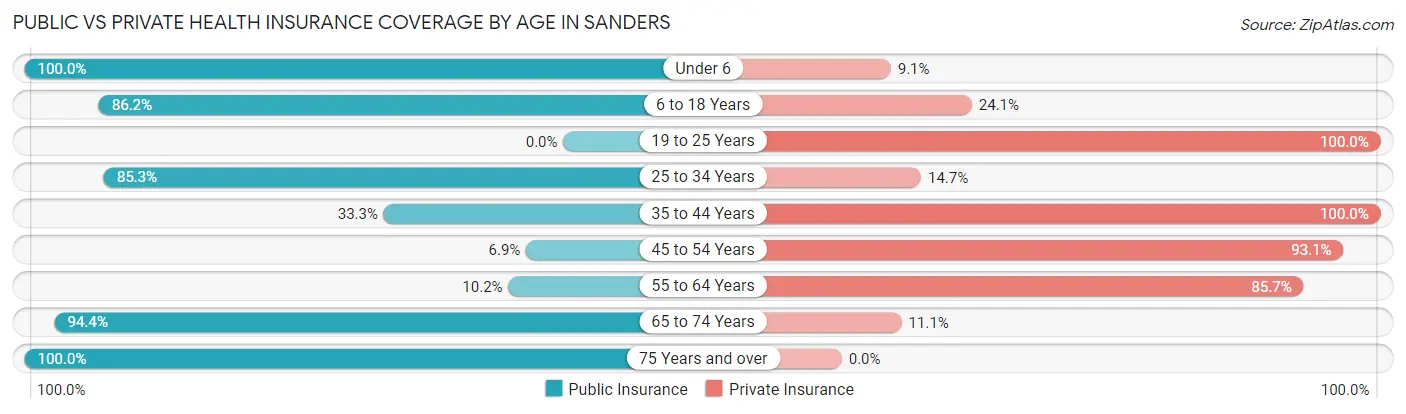
| Age Bracket | Public Insurance | Private Insurance |
| Under 6 | 22 (100.0%) | 2 (9.1%) |
| 6 to 18 Years | 50 (86.2%) | 14 (24.1%) |
| 19 to 25 Years | 0 (0.0%) | 14 (100.0%) |
| 25 to 34 Years | 58 (85.3%) | 10 (14.7%) |
| 35 to 44 Years | 2 (33.3%) | 6 (100.0%) |
| 45 to 54 Years | 2 (6.9%) | 27 (93.1%) |
| 55 to 64 Years | 5 (10.2%) | 42 (85.7%) |
| 65 to 74 Years | 68 (94.4%) | 8 (11.1%) |
| 75 Years and over | 23 (100.0%) | 0 (0.0%) |
| Total | 230 (67.4%) | 123 (36.1%) |
Disability Status by Sex by Age in Sanders
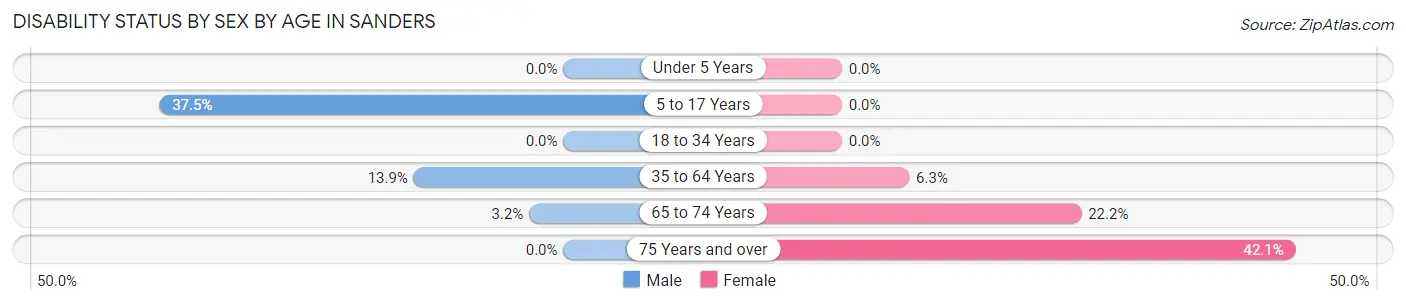
| Age Bracket | Male | Female |
| Under 5 Years | 0 (0.0%) | 0 (0.0%) |
| 5 to 17 Years | 3 (37.5%) | 0 (0.0%) |
| 18 to 34 Years | 0 (0.0%) | 0 (0.0%) |
| 35 to 64 Years | 5 (13.9%) | 3 (6.2%) |
| 65 to 74 Years | 2 (3.2%) | 2 (22.2%) |
| 75 Years and over | 0 (0.0%) | 8 (42.1%) |
Disability Class by Sex by Age in Sanders
Disability Class: Hearing Difficulty
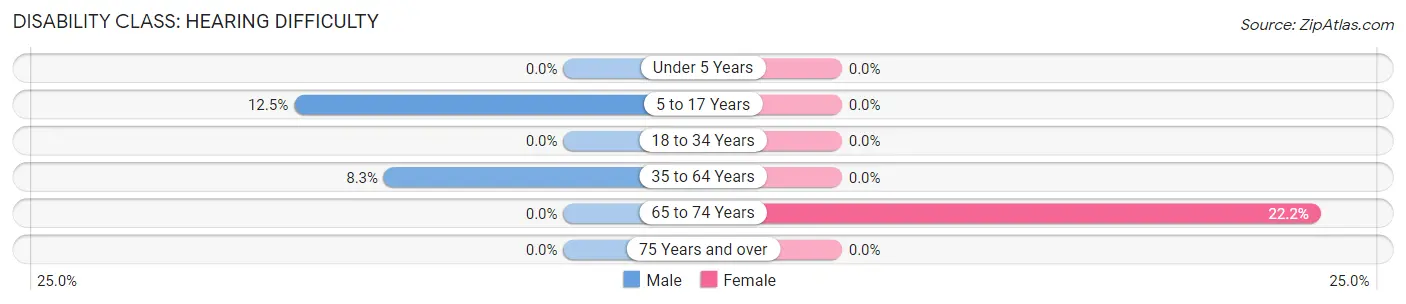
| Age Bracket | Male | Female |
| Under 5 Years | 0 (0.0%) | 0 (0.0%) |
| 5 to 17 Years | 1 (12.5%) | 0 (0.0%) |
| 18 to 34 Years | 0 (0.0%) | 0 (0.0%) |
| 35 to 64 Years | 3 (8.3%) | 0 (0.0%) |
| 65 to 74 Years | 0 (0.0%) | 2 (22.2%) |
| 75 Years and over | 0 (0.0%) | 0 (0.0%) |
Disability Class: Vision Difficulty
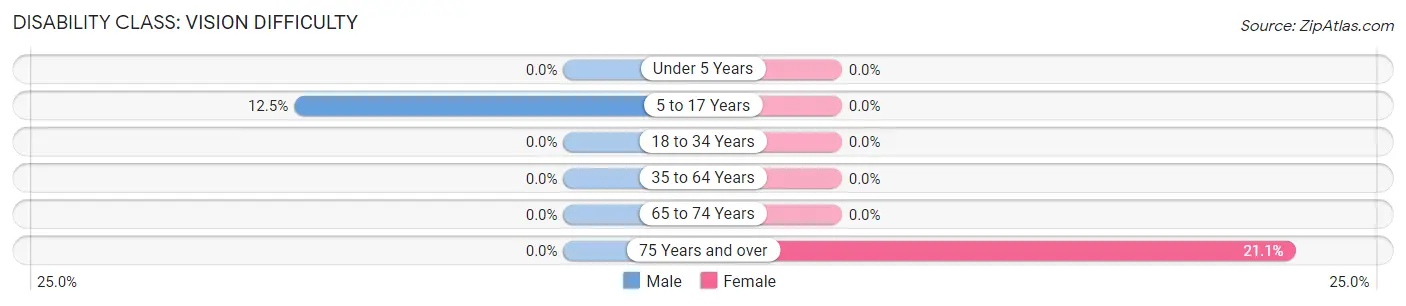
| Age Bracket | Male | Female |
| Under 5 Years | 0 (0.0%) | 0 (0.0%) |
| 5 to 17 Years | 1 (12.5%) | 0 (0.0%) |
| 18 to 34 Years | 0 (0.0%) | 0 (0.0%) |
| 35 to 64 Years | 0 (0.0%) | 0 (0.0%) |
| 65 to 74 Years | 0 (0.0%) | 0 (0.0%) |
| 75 Years and over | 0 (0.0%) | 4 (21.0%) |
Disability Class: Cognitive Difficulty
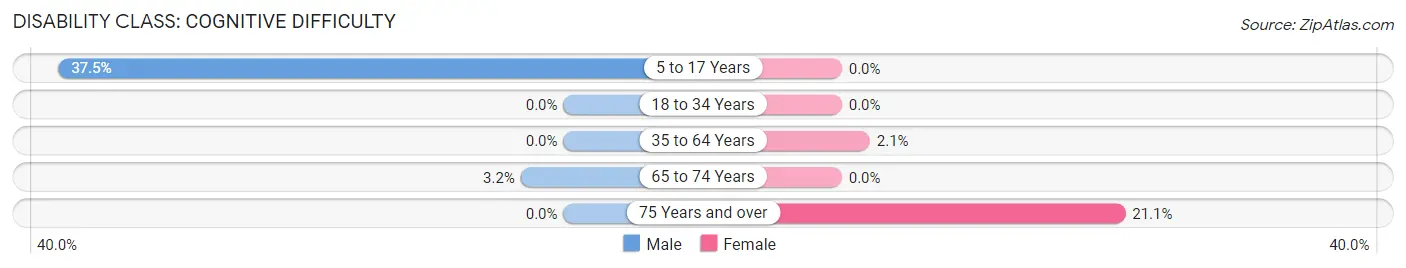
| Age Bracket | Male | Female |
| 5 to 17 Years | 3 (37.5%) | 0 (0.0%) |
| 18 to 34 Years | 0 (0.0%) | 0 (0.0%) |
| 35 to 64 Years | 0 (0.0%) | 1 (2.1%) |
| 65 to 74 Years | 2 (3.2%) | 0 (0.0%) |
| 75 Years and over | 0 (0.0%) | 4 (21.0%) |
Disability Class: Ambulatory Difficulty
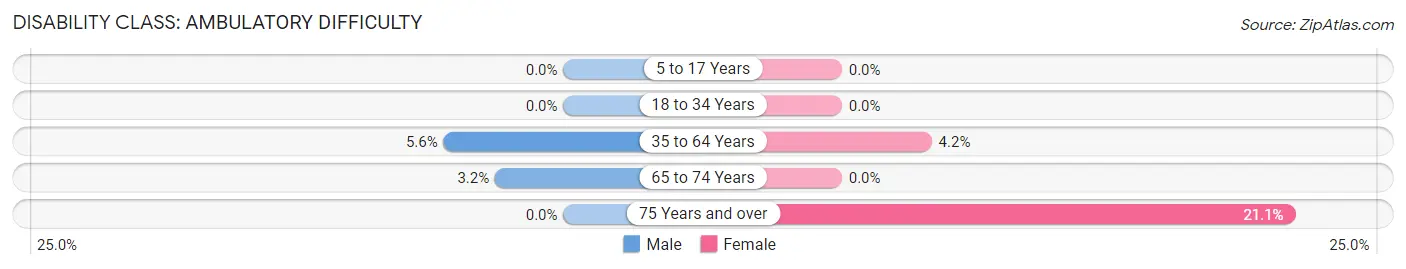
| Age Bracket | Male | Female |
| 5 to 17 Years | 0 (0.0%) | 0 (0.0%) |
| 18 to 34 Years | 0 (0.0%) | 0 (0.0%) |
| 35 to 64 Years | 2 (5.6%) | 2 (4.2%) |
| 65 to 74 Years | 2 (3.2%) | 0 (0.0%) |
| 75 Years and over | 0 (0.0%) | 4 (21.0%) |
Disability Class: Self-Care Difficulty
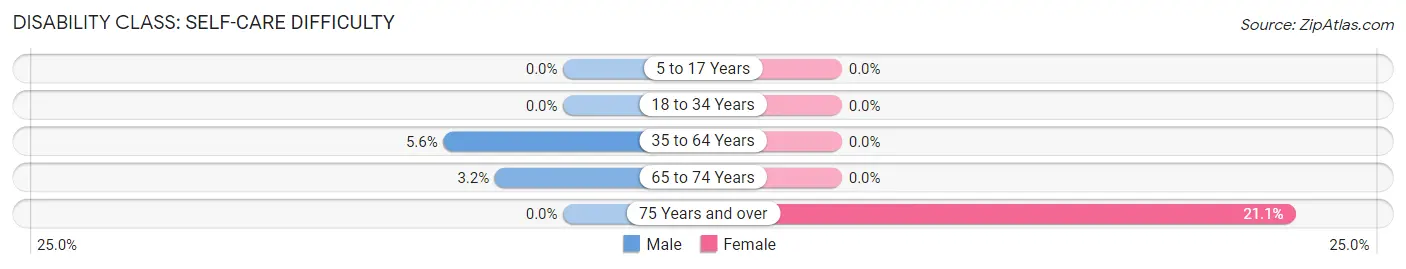
| Age Bracket | Male | Female |
| 5 to 17 Years | 0 (0.0%) | 0 (0.0%) |
| 18 to 34 Years | 0 (0.0%) | 0 (0.0%) |
| 35 to 64 Years | 2 (5.6%) | 0 (0.0%) |
| 65 to 74 Years | 2 (3.2%) | 0 (0.0%) |
| 75 Years and over | 0 (0.0%) | 4 (21.0%) |
Technology Access in Sanders
Computing Device Access in Sanders
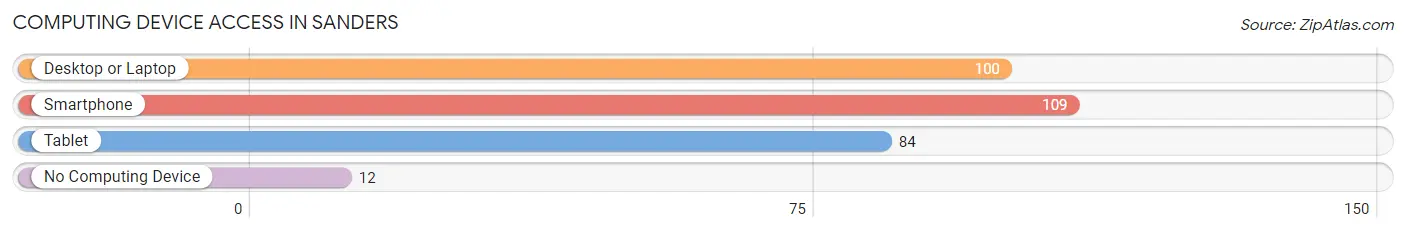
| Device Type | # Households | % Households |
| Desktop or Laptop | 100 | 82.6% |
| Smartphone | 109 | 90.1% |
| Tablet | 84 | 69.4% |
| No Computing Device | 12 | 9.9% |
| Total | 121 | 100.0% |
Internet Access in Sanders
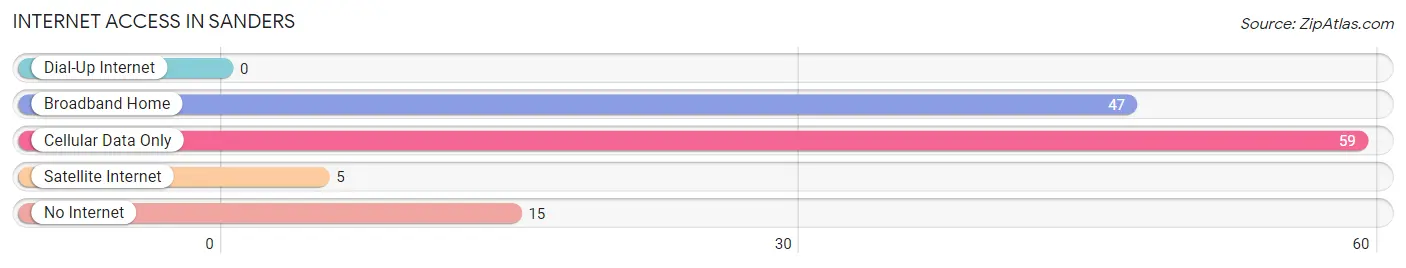
| Internet Type | # Households | % Households |
| Dial-Up Internet | 0 | 0.0% |
| Broadband Home | 47 | 38.8% |
| Cellular Data Only | 59 | 48.8% |
| Satellite Internet | 5 | 4.1% |
| No Internet | 15 | 12.4% |
| Total | 121 | 100.0% |
Sanders Summary
Sanders, Kentucky is a small unincorporated community located in the southeastern corner of the state, in the foothills of the Appalachian Mountains. It is situated in the county of Pike, and is part of the larger city of Pikeville. The population of Sanders in 2000 was estimated to be around 500 people.
History
The area that is now Sanders was first settled in the late 1700s by a group of settlers from North Carolina. The settlement was originally known as “Sandersville”, and was named after the Sanders family who were among the first settlers. The town was officially incorporated in 1820, and was the first town in Pike County.
In the early 1900s, the town began to grow and develop, and by the mid-1900s it had become a thriving community. The town was home to several businesses, including a general store, a post office, a blacksmith shop, and a sawmill. The town also had a school, a church, and a few other small businesses.
Geography
Sanders is located in the southeastern corner of Kentucky, in the foothills of the Appalachian Mountains. The town is situated in the county of Pike, and is part of the larger city of Pikeville. The terrain of the area is mostly hilly, with some flat areas. The climate is generally mild, with hot summers and cold winters.
Economy
The economy of Sanders is largely based on agriculture and forestry. The town is home to several farms, and the surrounding area is known for its timber production. The town also has a few small businesses, including a general store, a post office, and a few other small businesses.
Demographics
The population of Sanders in 2000 was estimated to be around 500 people. The majority of the population is white, with a small percentage of African Americans and Native Americans. The median household income in 2000 was $25,000, and the median age was 37. The town is served by the Pike County School District, and the nearest hospital is located in Pikeville.
Conclusion
Sanders, Kentucky is a small unincorporated community located in the southeastern corner of the state, in the foothills of the Appalachian Mountains. It is situated in the county of Pike, and is part of the larger city of Pikeville. The population of Sanders in 2000 was estimated to be around 500 people. The economy of Sanders is largely based on agriculture and forestry, and the town is home to several farms and small businesses. The majority of the population is white, with a small percentage of African Americans and Native Americans. The median household income in 2000 was $25,000, and the median age was 37.
Common Questions
What is Per Capita Income in Sanders?
Per Capita income in Sanders is $16,888.
What is the Median Family Income in Sanders?
Median Family Income in Sanders is $36,842.
What is the Median Household income in Sanders?
Median Household Income in Sanders is $36,557.
What is Family Income Deficit in Sanders?
Family Income Deficit in Sanders is $1,452.
Families that are below poverty line in Sanders earn $1,452 less on average than the poverty threshold level.
What is Inequality or Gini Index in Sanders?
Inequality or Gini Index in Sanders is 0.37.
What is the Total Population of Sanders?
Total Population of Sanders is 385.
What is the Total Male Population of Sanders?
Total Male Population of Sanders is 185.
What is the Total Female Population of Sanders?
Total Female Population of Sanders is 200.
What is the Ratio of Males per 100 Females in Sanders?
There are 92.50 Males per 100 Females in Sanders.
What is the Ratio of Females per 100 Males in Sanders?
There are 108.11 Females per 100 Males in Sanders.
What is the Median Population Age in Sanders?
Median Population Age in Sanders is 52.5 Years.
What is the Average Family Size in Sanders
Average Family Size in Sanders is 3.1 People.
What is the Average Household Size in Sanders
Average Household Size in Sanders is 2.8 People.
How Large is the Labor Force in Sanders?
There are 235 People in the Labor Forcein in Sanders.
What is the Percentage of People in the Labor Force in Sanders?
73.7% of People are in the Labor Force in Sanders.