Zip Codes with the Highest Percentage of Population Employed in Food Preparation & Serving in Bowling Green, KY
RELATED REPORTS & OPTIONS
Food Preparation & Serving
Bowling Green
Compare Zip Codes
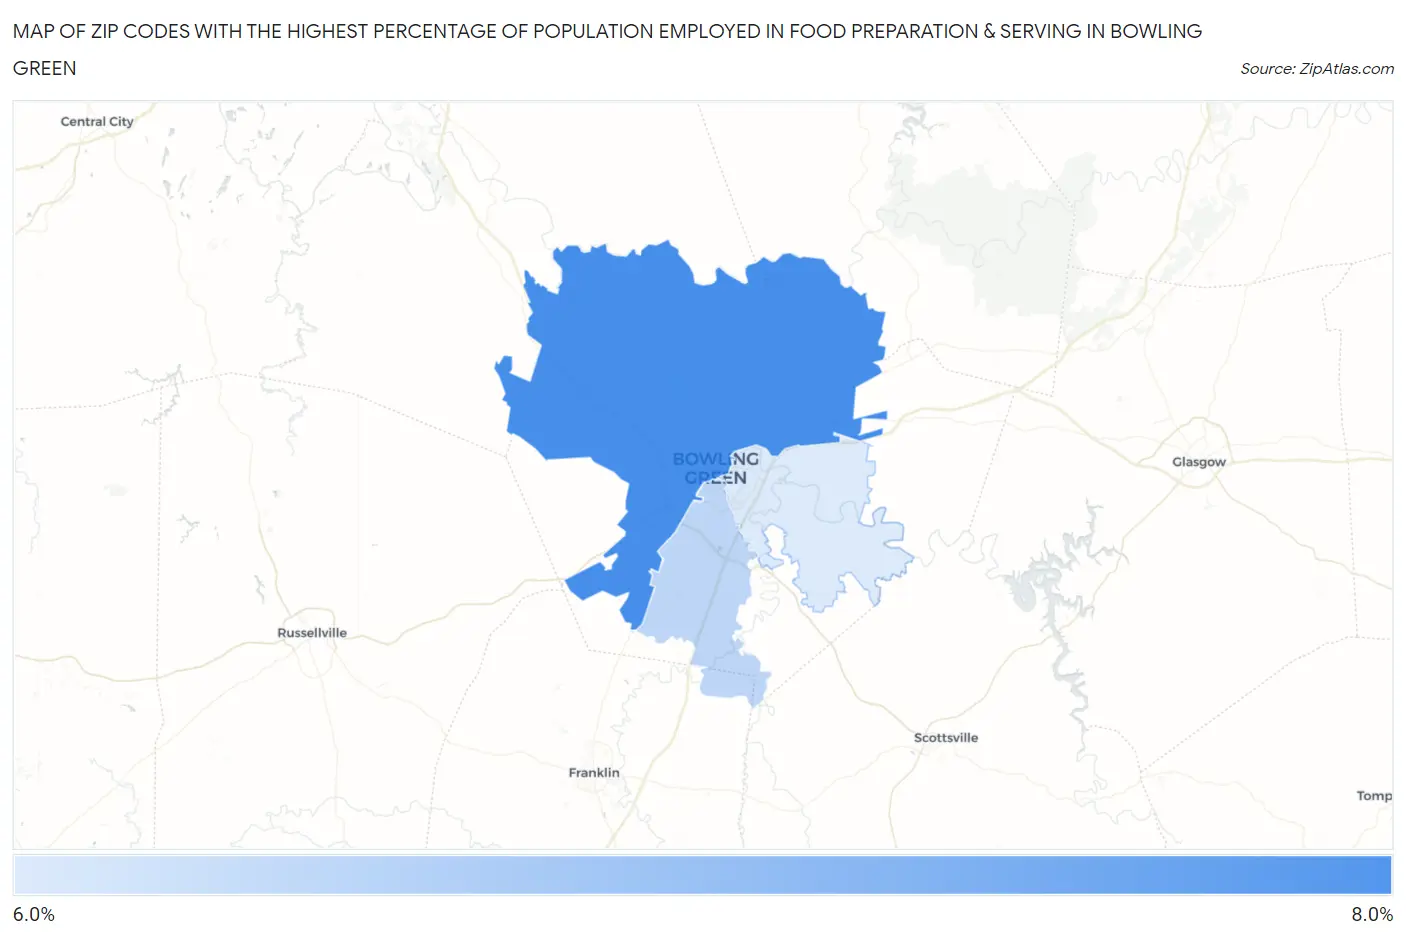
Map of Zip Codes with the Highest Percentage of Population Employed in Food Preparation & Serving in Bowling Green
6.6%
7.8%
Zip Codes with the Highest Percentage of Population Employed in Food Preparation & Serving in Bowling Green, KY
| Zip Code | % Employed | vs State | vs National | |
| 1. | 42101 | 7.8% | 5.1%(+2.71)#127 | 5.3%(+2.51)#5,066 |
| 2. | 42104 | 6.8% | 5.1%(+1.74)#155 | 5.3%(+1.54)#6,993 |
| 3. | 42103 | 6.6% | 5.1%(+1.48)#168 | 5.3%(+1.28)#7,696 |
1
Common Questions
What are the Top Zip Codes with the Highest Percentage of Population Employed in Food Preparation & Serving in Bowling Green, KY?
Top Zip Codes with the Highest Percentage of Population Employed in Food Preparation & Serving in Bowling Green, KY are:
What zip code has the Highest Percentage of Population Employed in Food Preparation & Serving in Bowling Green, KY?
42101 has the Highest Percentage of Population Employed in Food Preparation & Serving in Bowling Green, KY with 7.8%.
What is the Percentage of Population Employed in Food Preparation & Serving in Bowling Green, KY?
Percentage of Population Employed in Food Preparation & Serving in Bowling Green is 8.7%.
What is the Percentage of Population Employed in Food Preparation & Serving in Kentucky?
Percentage of Population Employed in Food Preparation & Serving in Kentucky is 5.1%.
What is the Percentage of Population Employed in Food Preparation & Serving in the United States?
Percentage of Population Employed in Food Preparation & Serving in the United States is 5.3%.