Manchester, KY Map & Demographics
Manchester Map
Manchester Overview
$19,003
PER CAPITA INCOME
$40,972
AVG FAMILY INCOME
$30,474
AVG HOUSEHOLD INCOME
12.2%
WAGE / INCOME GAP [ % ]
87.8¢/ $1
WAGE / INCOME GAP [ $ ]
$12,185
FAMILY INCOME DEFICIT
0.54
INEQUALITY / GINI INDEX
2,195
TOTAL POPULATION
1,145
MALE POPULATION
1,050
FEMALE POPULATION
109.05
MALES / 100 FEMALES
91.70
FEMALES / 100 MALES
40.8
MEDIAN AGE
3.7
AVG FAMILY SIZE
2.8
AVG HOUSEHOLD SIZE
786
LABOR FORCE [ PEOPLE ]
43.5%
PERCENT IN LABOR FORCE
3.6%
UNEMPLOYMENT RATE
Manchester Zip Codes
Manchester Area Codes
Income in Manchester
Income Overview in Manchester
Per Capita Income in Manchester is $19,003, while median incomes of families and households are $40,972 and $30,474 respectively.
| Characteristic | Number | Measure |
| Per Capita Income | 2,195 | $19,003 |
| Median Family Income | 489 | $40,972 |
| Mean Family Income | 489 | $59,927 |
| Median Household Income | 775 | $30,474 |
| Mean Household Income | 775 | $48,021 |
| Income Deficit | 489 | $12,185 |
| Wage / Income Gap (%) | 2,195 | 12.21% |
| Wage / Income Gap ($) | 2,195 | 87.79¢ per $1 |
| Gini / Inequality Index | 2,195 | 0.54 |
Earnings by Sex in Manchester
Average Earnings in Manchester are $30,524, $28,375 for men and $32,321 for women, a difference of 12.2%.
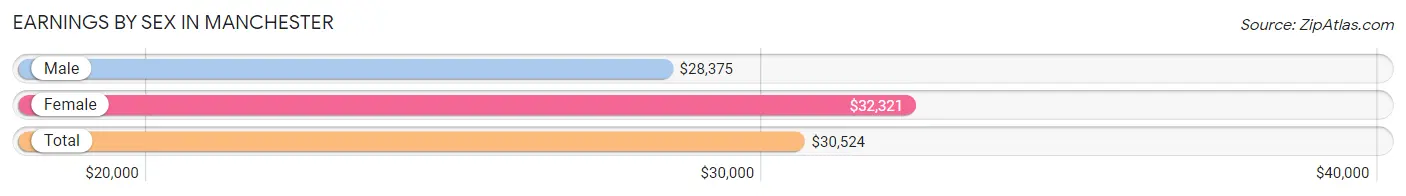
| Sex | Number | Average Earnings |
| Male | 355 (42.8%) | $28,375 |
| Female | 474 (57.2%) | $32,321 |
| Total | 829 (100.0%) | $30,524 |
Earnings by Sex by Income Bracket in Manchester
The most common earnings brackets in Manchester are $17,500 to $19,999 for men (67 | 18.9%) and $40,000 to $44,999 for women (105 | 22.2%).
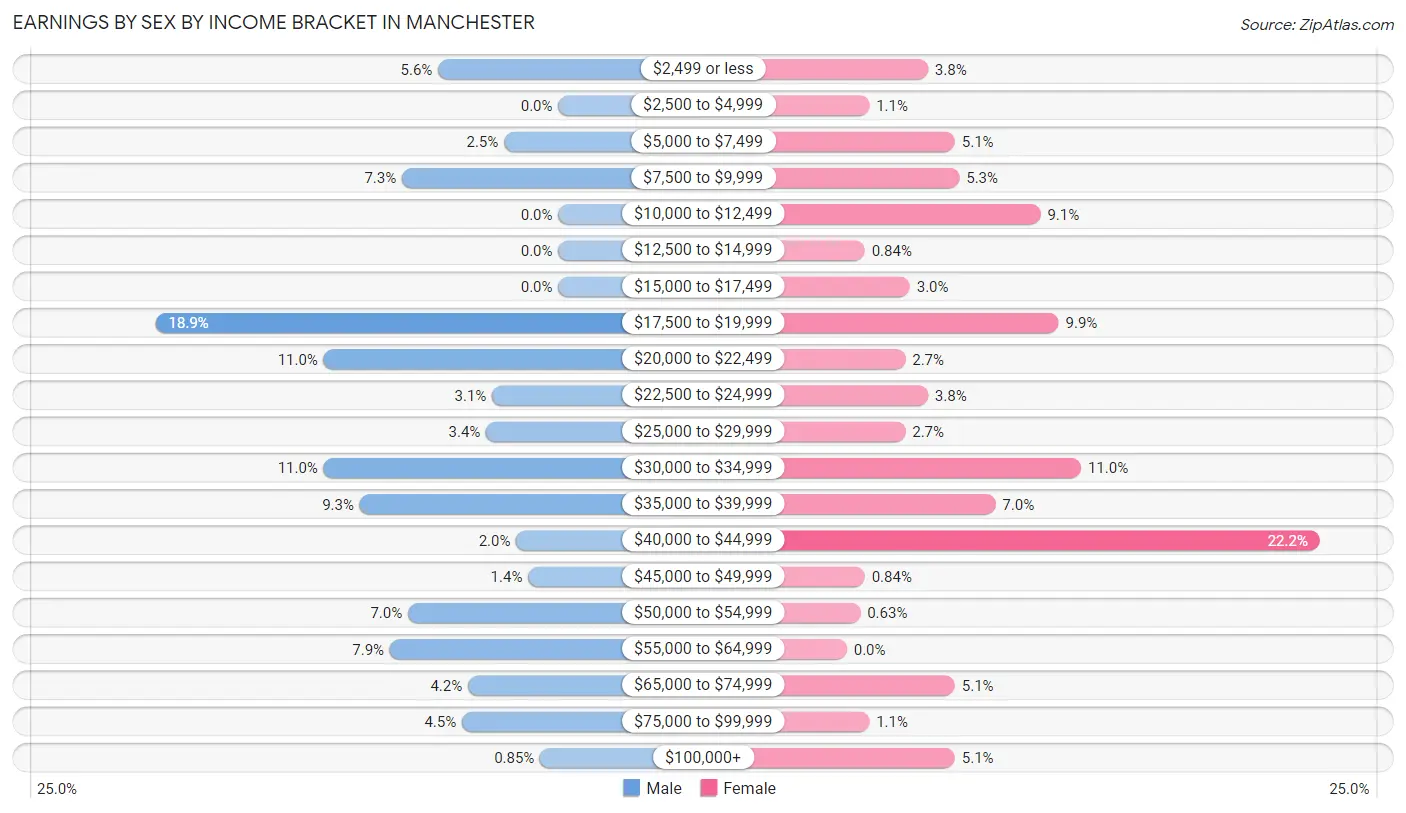
| Income | Male | Female |
| $2,499 or less | 20 (5.6%) | 18 (3.8%) |
| $2,500 to $4,999 | 0 (0.0%) | 5 (1.1%) |
| $5,000 to $7,499 | 9 (2.5%) | 24 (5.1%) |
| $7,500 to $9,999 | 26 (7.3%) | 25 (5.3%) |
| $10,000 to $12,499 | 0 (0.0%) | 43 (9.1%) |
| $12,500 to $14,999 | 0 (0.0%) | 4 (0.8%) |
| $15,000 to $17,499 | 0 (0.0%) | 14 (2.9%) |
| $17,500 to $19,999 | 67 (18.9%) | 47 (9.9%) |
| $20,000 to $22,499 | 39 (11.0%) | 13 (2.7%) |
| $22,500 to $24,999 | 11 (3.1%) | 18 (3.8%) |
| $25,000 to $29,999 | 12 (3.4%) | 13 (2.7%) |
| $30,000 to $34,999 | 39 (11.0%) | 52 (11.0%) |
| $35,000 to $39,999 | 33 (9.3%) | 33 (7.0%) |
| $40,000 to $44,999 | 7 (2.0%) | 105 (22.2%) |
| $45,000 to $49,999 | 5 (1.4%) | 4 (0.8%) |
| $50,000 to $54,999 | 25 (7.0%) | 3 (0.6%) |
| $55,000 to $64,999 | 28 (7.9%) | 0 (0.0%) |
| $65,000 to $74,999 | 15 (4.2%) | 24 (5.1%) |
| $75,000 to $99,999 | 16 (4.5%) | 5 (1.1%) |
| $100,000+ | 3 (0.9%) | 24 (5.1%) |
| Total | 355 (100.0%) | 474 (100.0%) |
Earnings by Sex by Educational Attainment in Manchester
Average earnings in Manchester are $27,875 for men and $33,717 for women, a difference of 17.3%. Men with an educational attainment of bachelor's degree enjoy the highest average annual earnings of $63,750, while those with high school diploma education earn the least with $21,316. Women with an educational attainment of bachelor's degree earn the most with the average annual earnings of $41,217, while those with less than high school education have the smallest earnings of $7,188.
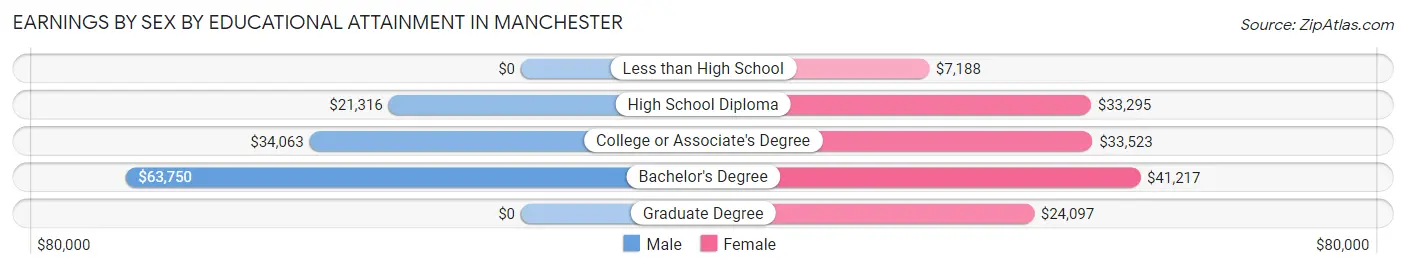
| Educational Attainment | Male Income | Female Income |
| Less than High School | - | - |
| High School Diploma | $21,316 | $33,295 |
| College or Associate's Degree | $34,063 | $33,523 |
| Bachelor's Degree | $63,750 | $41,217 |
| Graduate Degree | - | - |
| Total | $27,875 | $33,717 |
Family Income in Manchester
Family Income Brackets in Manchester
According to the Manchester family income data, there are 93 families falling into the $75,000 to $99,999 income range, which is the most common income bracket and makes up 19.0% of all families. Conversely, the $150,000 to $199,999 income bracket is the least frequent group with only 16 families (3.3%) belonging to this category.
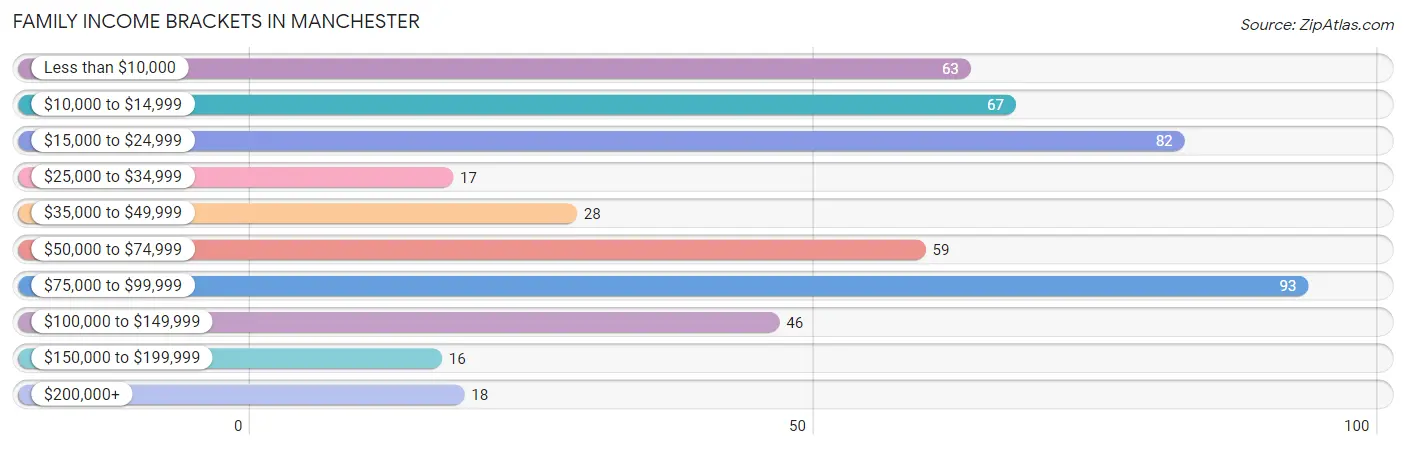
| Income Bracket | # Families | % Families |
| Less than $10,000 | 63 | 12.9% |
| $10,000 to $14,999 | 67 | 13.7% |
| $15,000 to $24,999 | 82 | 16.8% |
| $25,000 to $34,999 | 17 | 3.5% |
| $35,000 to $49,999 | 28 | 5.7% |
| $50,000 to $74,999 | 59 | 12.1% |
| $75,000 to $99,999 | 93 | 19.0% |
| $100,000 to $149,999 | 46 | 9.4% |
| $150,000 to $199,999 | 16 | 3.3% |
| $200,000+ | 18 | 3.7% |
Family Income by Famaliy Size in Manchester
| Income Bracket | # Families | Median Income |
| 2-Person Families | 189 (38.7%) | $0 |
| 3-Person Families | 169 (34.6%) | $0 |
| 4-Person Families | 100 (20.4%) | $0 |
| 5-Person Families | 17 (3.5%) | $0 |
| 6-Person Families | 14 (2.9%) | $0 |
| 7+ Person Families | 0 (0.0%) | $0 |
| Total | 489 (100.0%) | $40,972 |
Family Income by Number of Earners in Manchester
The median family income in Manchester is $40,972, with families comprising 3+ earners (28) having the highest median family income of $116,250, while families with no earners (212) have the lowest median family income of $14,250, accounting for 5.7% and 43.3% of families, respectively.
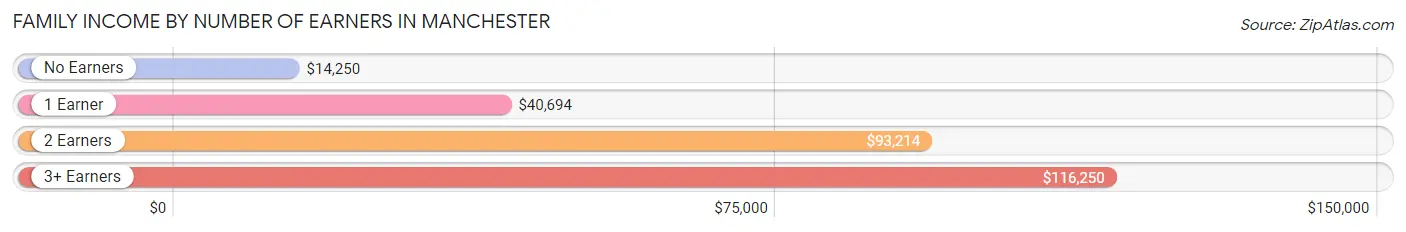
| Number of Earners | # Families | Median Income |
| No Earners | 212 (43.3%) | $14,250 |
| 1 Earner | 111 (22.7%) | $40,694 |
| 2 Earners | 138 (28.2%) | $93,214 |
| 3+ Earners | 28 (5.7%) | $116,250 |
| Total | 489 (100.0%) | $40,972 |
Household Income in Manchester
Household Income Brackets in Manchester
With 125 households falling in the category, the $10,000 to $14,999 income range is the most frequent in Manchester, accounting for 16.1% of all households. In contrast, only 16 households (2.1%) fall into the $150,000 to $199,999 income bracket, making it the least populous group.
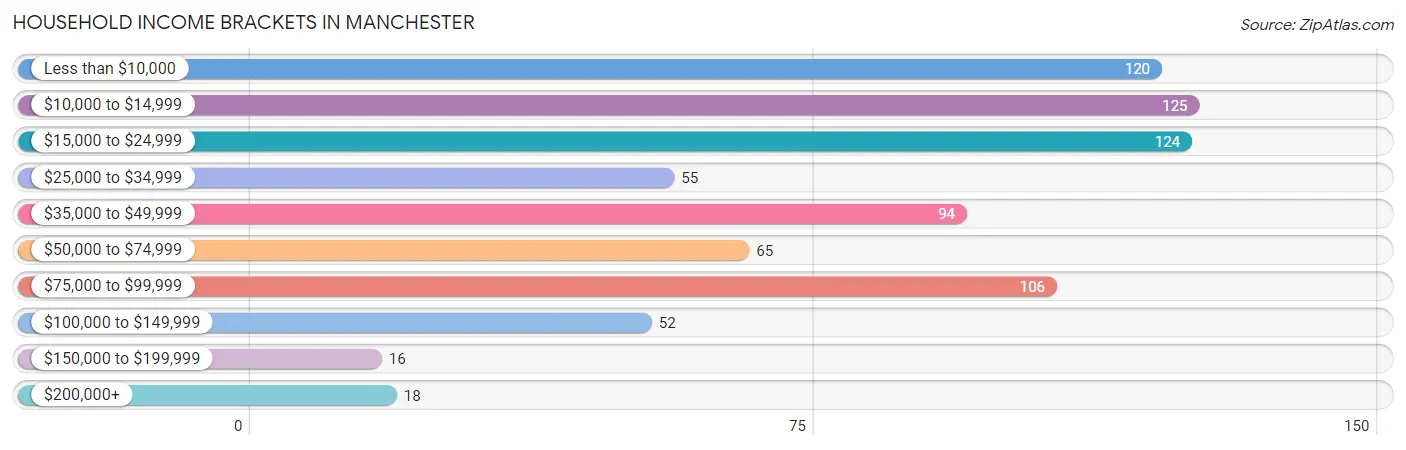
| Income Bracket | # Households | % Households |
| Less than $10,000 | 120 | 15.5% |
| $10,000 to $14,999 | 125 | 16.1% |
| $15,000 to $24,999 | 124 | 16.0% |
| $25,000 to $34,999 | 55 | 7.1% |
| $35,000 to $49,999 | 94 | 12.1% |
| $50,000 to $74,999 | 65 | 8.4% |
| $75,000 to $99,999 | 106 | 13.7% |
| $100,000 to $149,999 | 52 | 6.7% |
| $150,000 to $199,999 | 16 | 2.1% |
| $200,000+ | 18 | 2.3% |
Household Income by Householder Age in Manchester
The median household income in Manchester is $30,474, with the highest median household income of $37,729 found in the 25 to 44 years age bracket for the primary householder. A total of 275 households (35.5%) fall into this category.
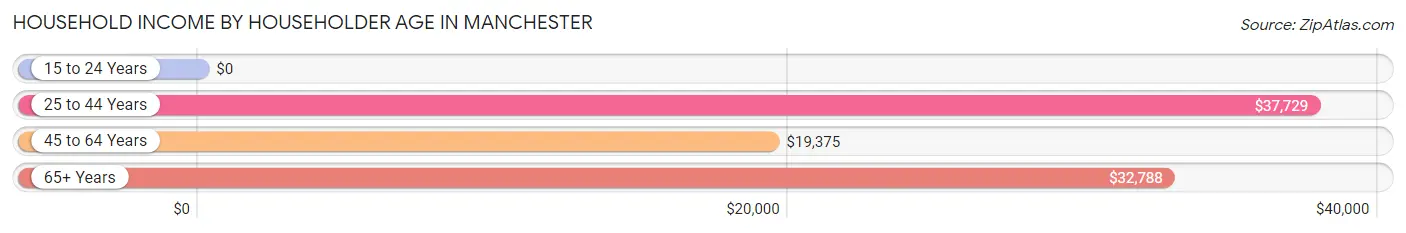
| Income Bracket | # Households | Median Income |
| 15 to 24 Years | 0 (0.0%) | $0 |
| 25 to 44 Years | 275 (35.5%) | $37,729 |
| 45 to 64 Years | 291 (37.6%) | $19,375 |
| 65+ Years | 209 (27.0%) | $32,788 |
| Total | 775 (100.0%) | $30,474 |
Poverty in Manchester
Income Below Poverty by Sex and Age in Manchester
With 41.5% poverty level for males and 38.7% for females among the residents of Manchester, 35 to 44 year old males and 6 to 11 year old females are the most vulnerable to poverty, with 155 males (74.5%) and 16 females (84.2%) in their respective age groups living below the poverty level.
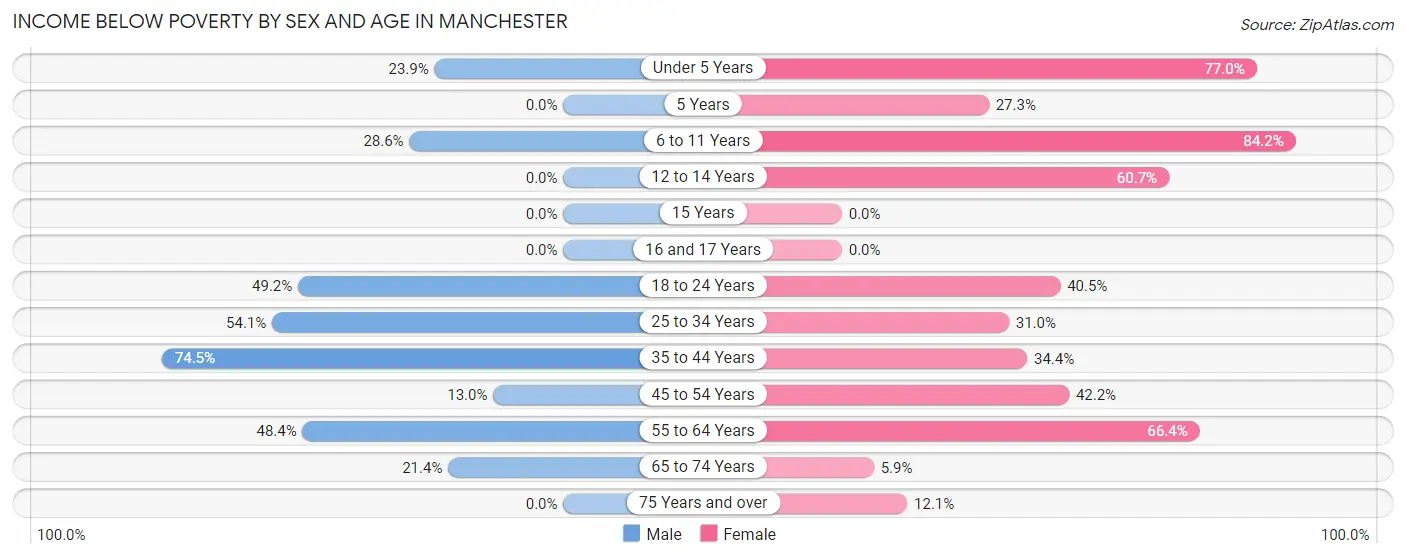
| Age Bracket | Male | Female |
| Under 5 Years | 11 (23.9%) | 87 (77.0%) |
| 5 Years | 0 (0.0%) | 3 (27.3%) |
| 6 to 11 Years | 32 (28.6%) | 16 (84.2%) |
| 12 to 14 Years | 0 (0.0%) | 17 (60.7%) |
| 15 Years | 0 (0.0%) | 0 (0.0%) |
| 16 and 17 Years | 0 (0.0%) | 0 (0.0%) |
| 18 to 24 Years | 32 (49.2%) | 30 (40.5%) |
| 25 to 34 Years | 140 (54.0%) | 66 (31.0%) |
| 35 to 44 Years | 155 (74.5%) | 44 (34.4%) |
| 45 to 54 Years | 16 (13.0%) | 43 (42.2%) |
| 55 to 64 Years | 61 (48.4%) | 83 (66.4%) |
| 65 to 74 Years | 28 (21.4%) | 8 (5.9%) |
| 75 Years and over | 0 (0.0%) | 8 (12.1%) |
| Total | 475 (41.5%) | 405 (38.7%) |
Income Above Poverty by Sex and Age in Manchester
According to the poverty statistics in Manchester, males aged 12 to 14 years and females aged 15 years are the age groups that are most secure financially, with 100.0% of males and 100.0% of females in these age groups living above the poverty line.
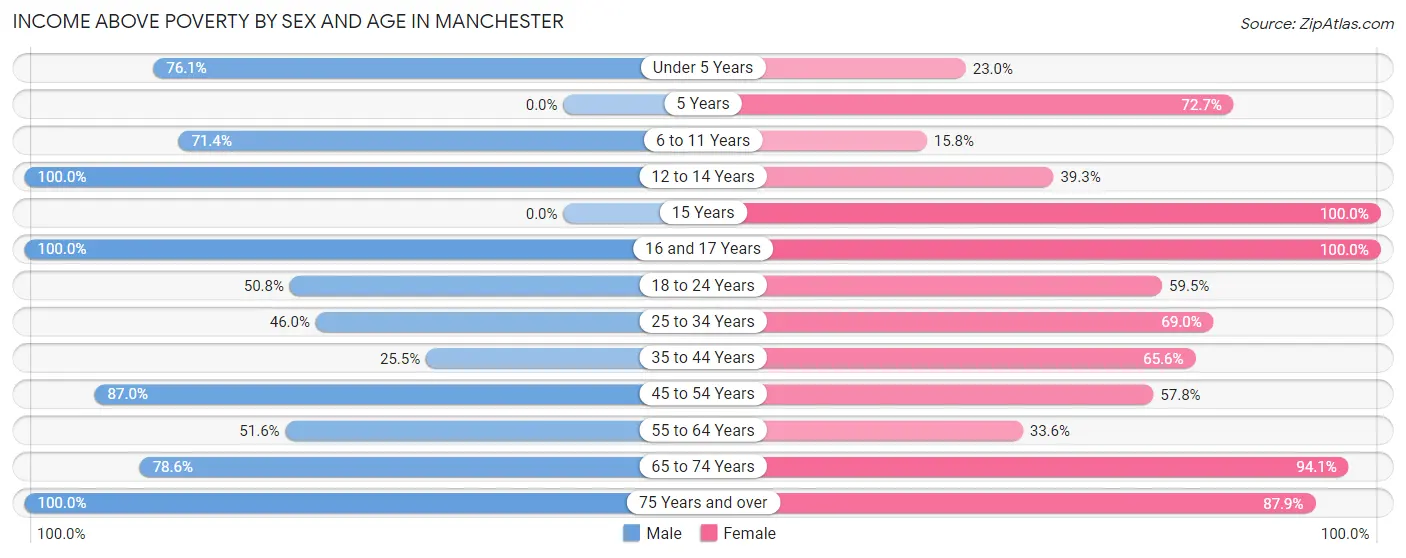
| Age Bracket | Male | Female |
| Under 5 Years | 35 (76.1%) | 26 (23.0%) |
| 5 Years | 0 (0.0%) | 8 (72.7%) |
| 6 to 11 Years | 80 (71.4%) | 3 (15.8%) |
| 12 to 14 Years | 46 (100.0%) | 11 (39.3%) |
| 15 Years | 0 (0.0%) | 11 (100.0%) |
| 16 and 17 Years | 6 (100.0%) | 22 (100.0%) |
| 18 to 24 Years | 33 (50.8%) | 44 (59.5%) |
| 25 to 34 Years | 119 (46.0%) | 147 (69.0%) |
| 35 to 44 Years | 53 (25.5%) | 84 (65.6%) |
| 45 to 54 Years | 107 (87.0%) | 59 (57.8%) |
| 55 to 64 Years | 65 (51.6%) | 42 (33.6%) |
| 65 to 74 Years | 103 (78.6%) | 127 (94.1%) |
| 75 Years and over | 23 (100.0%) | 58 (87.9%) |
| Total | 670 (58.5%) | 642 (61.3%) |
Income Below Poverty Among Married-Couple Families in Manchester
The poverty statistics for married-couple families in Manchester show that 19.1% or 56 of the total 294 families live below the poverty line. Families with no children have the highest poverty rate of 25.9%, comprising of 44 families. On the other hand, families with 3 or 4 children have the lowest poverty rate of 0.0%, which includes 0 families.
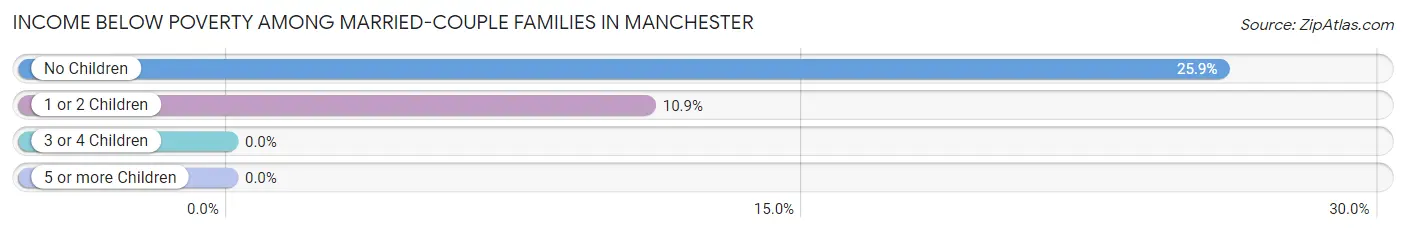
| Children | Above Poverty | Below Poverty |
| No Children | 126 (74.1%) | 44 (25.9%) |
| 1 or 2 Children | 98 (89.1%) | 12 (10.9%) |
| 3 or 4 Children | 14 (100.0%) | 0 (0.0%) |
| 5 or more Children | 0 (0.0%) | 0 (0.0%) |
| Total | 238 (80.9%) | 56 (19.1%) |
Income Below Poverty Among Single-Parent Households in Manchester
According to the poverty data in Manchester, 62.1% or 41 single-father households and 72.1% or 93 single-mother households are living below the poverty line. Among single-father households, those with no children have the highest poverty rate, with 30 households (81.1%) experiencing poverty. Likewise, among single-mother households, those with 3 or 4 children have the highest poverty rate, with 2 households (100.0%) falling below the poverty line.
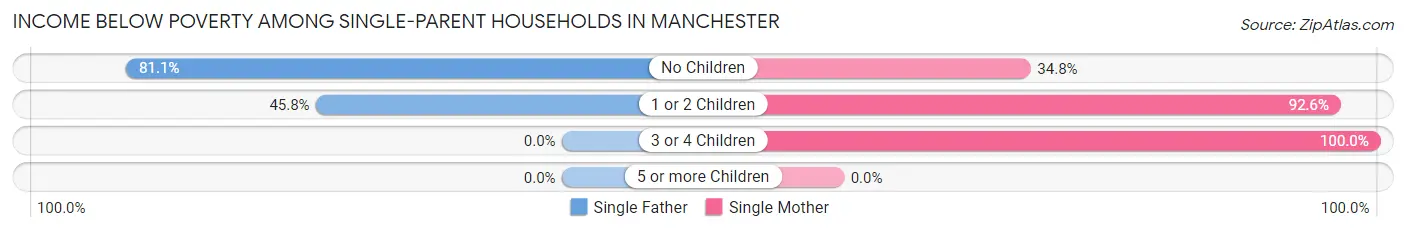
| Children | Single Father | Single Mother |
| No Children | 30 (81.1%) | 16 (34.8%) |
| 1 or 2 Children | 11 (45.8%) | 75 (92.6%) |
| 3 or 4 Children | 0 (0.0%) | 2 (100.0%) |
| 5 or more Children | 0 (0.0%) | 0 (0.0%) |
| Total | 41 (62.1%) | 93 (72.1%) |
Income Below Poverty Among Married-Couple vs Single-Parent Households in Manchester
The poverty data for Manchester shows that 56 of the married-couple family households (19.1%) and 134 of the single-parent households (68.7%) are living below the poverty level. Within the married-couple family households, those with no children have the highest poverty rate, with 44 households (25.9%) falling below the poverty line. Among the single-parent households, those with 1 or 2 children have the highest poverty rate, with 86 household (81.9%) living below poverty.
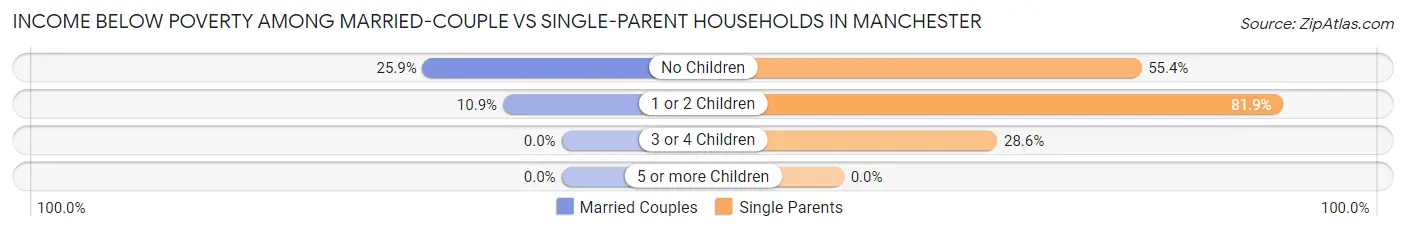
| Children | Married-Couple Families | Single-Parent Households |
| No Children | 44 (25.9%) | 46 (55.4%) |
| 1 or 2 Children | 12 (10.9%) | 86 (81.9%) |
| 3 or 4 Children | 0 (0.0%) | 2 (28.6%) |
| 5 or more Children | 0 (0.0%) | 0 (0.0%) |
| Total | 56 (19.1%) | 134 (68.7%) |
Race in Manchester
The most populous races in Manchester are White / Caucasian (1,698 | 77.4%), Black / African American (349 | 15.9%), and Two or more Races (138 | 6.3%).
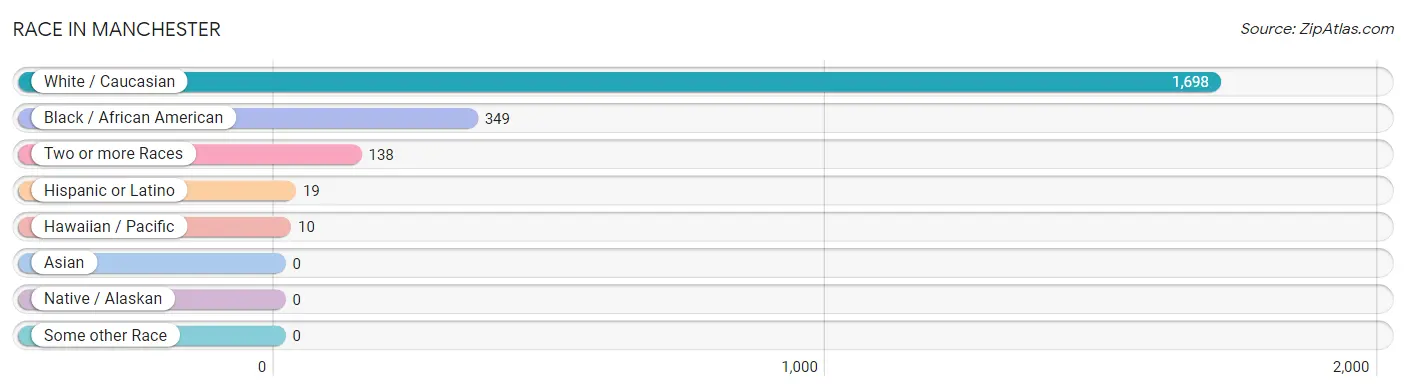
| Race | # Population | % Population |
| Asian | 0 | 0.0% |
| Black / African American | 349 | 15.9% |
| Hawaiian / Pacific | 10 | 0.5% |
| Hispanic or Latino | 19 | 0.9% |
| Native / Alaskan | 0 | 0.0% |
| White / Caucasian | 1,698 | 77.4% |
| Two or more Races | 138 | 6.3% |
| Some other Race | 0 | 0.0% |
| Total | 2,195 | 100.0% |
Ancestry in Manchester
The most populous ancestries reported in Manchester are American (654 | 29.8%), English (343 | 15.6%), German (163 | 7.4%), Italian (93 | 4.2%), and Irish (39 | 1.8%), together accounting for 58.9% of all Manchester residents.
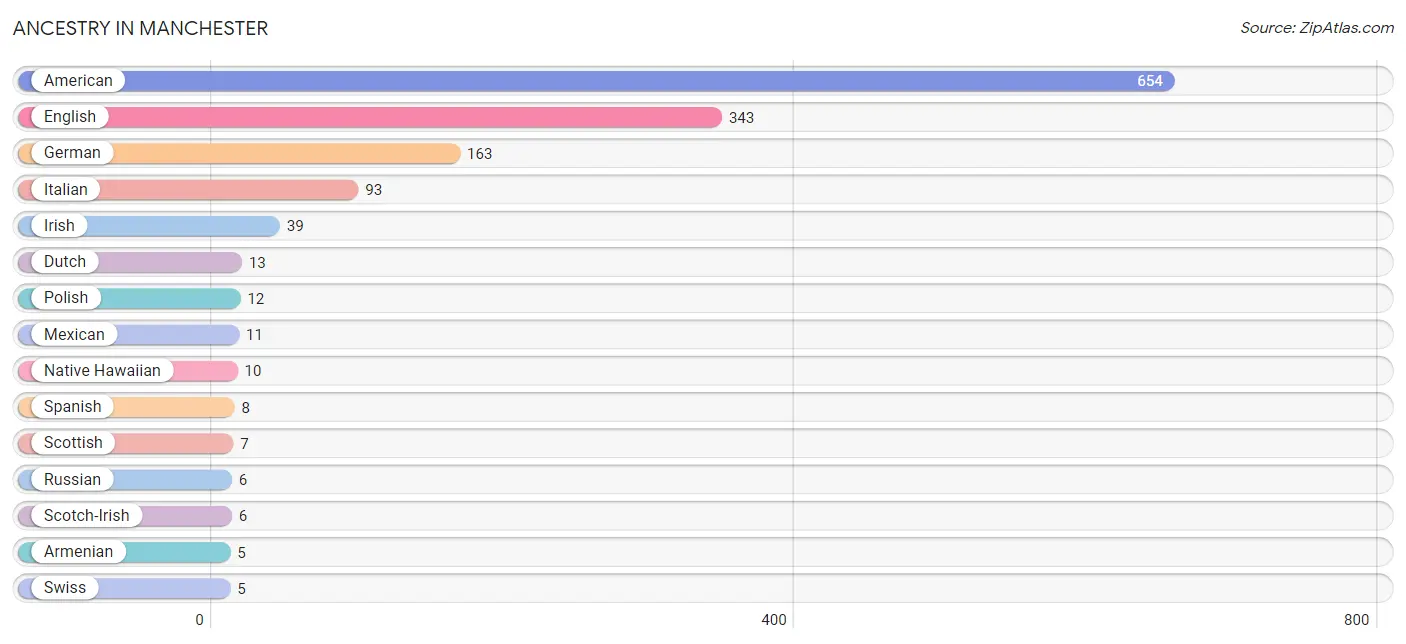
| Ancestry | # Population | % Population |
| American | 654 | 29.8% |
| Armenian | 5 | 0.2% |
| Dutch | 13 | 0.6% |
| English | 343 | 15.6% |
| French | 3 | 0.1% |
| German | 163 | 7.4% |
| Irish | 39 | 1.8% |
| Italian | 93 | 4.2% |
| Mexican | 11 | 0.5% |
| Native Hawaiian | 10 | 0.5% |
| Polish | 12 | 0.5% |
| Russian | 6 | 0.3% |
| Scotch-Irish | 6 | 0.3% |
| Scottish | 7 | 0.3% |
| Spanish | 8 | 0.4% |
| Swiss | 5 | 0.2% |
| Welsh | 4 | 0.2% | View All 17 Rows |
Immigrants in Manchester

| Immigration Origin | # Population | % Population | View All 0 Rows |
Sex and Age in Manchester
Sex and Age in Manchester
The most populous age groups in Manchester are 40 to 44 Years (181 | 15.8%) for men and 25 to 29 Years (138 | 13.1%) for women.
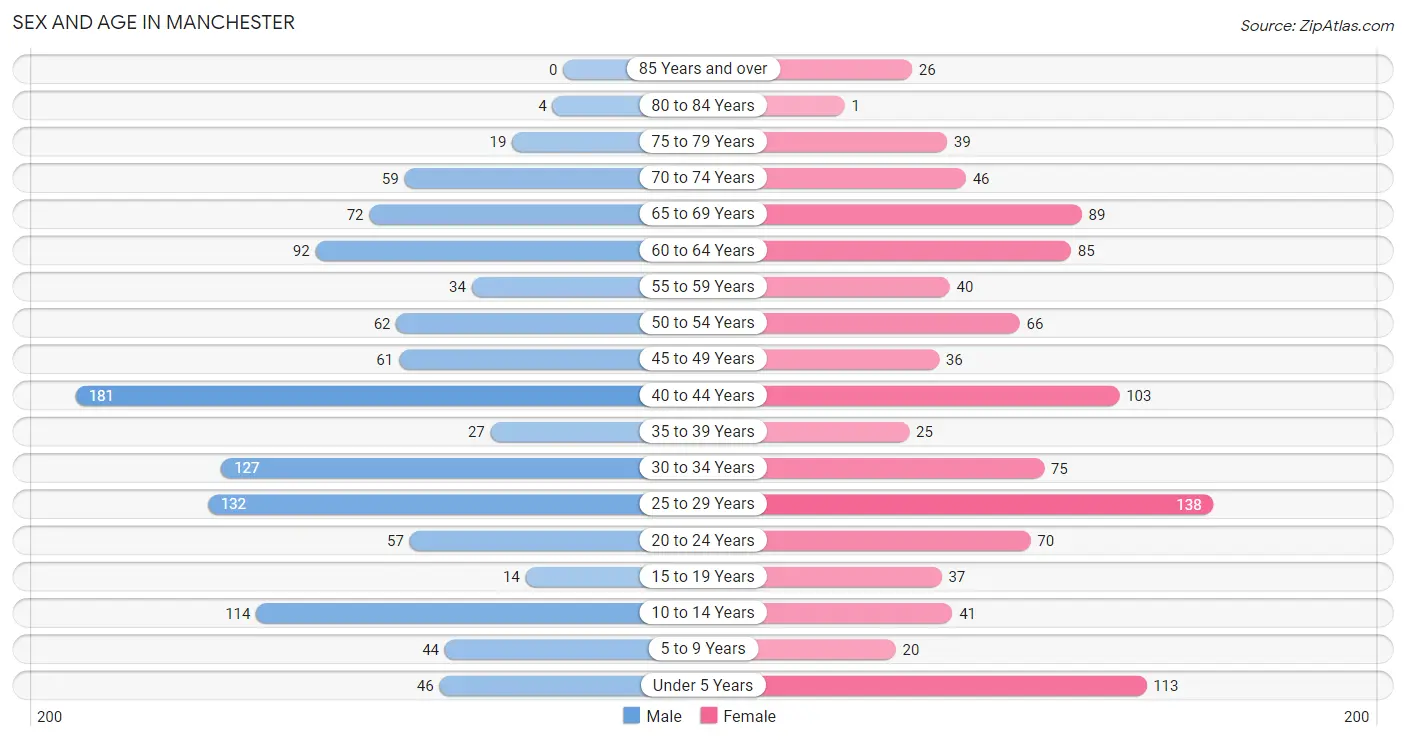
| Age Bracket | Male | Female |
| Under 5 Years | 46 (4.0%) | 113 (10.8%) |
| 5 to 9 Years | 44 (3.8%) | 20 (1.9%) |
| 10 to 14 Years | 114 (10.0%) | 41 (3.9%) |
| 15 to 19 Years | 14 (1.2%) | 37 (3.5%) |
| 20 to 24 Years | 57 (5.0%) | 70 (6.7%) |
| 25 to 29 Years | 132 (11.5%) | 138 (13.1%) |
| 30 to 34 Years | 127 (11.1%) | 75 (7.1%) |
| 35 to 39 Years | 27 (2.4%) | 25 (2.4%) |
| 40 to 44 Years | 181 (15.8%) | 103 (9.8%) |
| 45 to 49 Years | 61 (5.3%) | 36 (3.4%) |
| 50 to 54 Years | 62 (5.4%) | 66 (6.3%) |
| 55 to 59 Years | 34 (3.0%) | 40 (3.8%) |
| 60 to 64 Years | 92 (8.0%) | 85 (8.1%) |
| 65 to 69 Years | 72 (6.3%) | 89 (8.5%) |
| 70 to 74 Years | 59 (5.1%) | 46 (4.4%) |
| 75 to 79 Years | 19 (1.7%) | 39 (3.7%) |
| 80 to 84 Years | 4 (0.4%) | 1 (0.1%) |
| 85 Years and over | 0 (0.0%) | 26 (2.5%) |
| Total | 1,145 (100.0%) | 1,050 (100.0%) |
Families and Households in Manchester
Median Family Size in Manchester
The median family size in Manchester is 3.70 persons per family, with single male/father families (66 | 13.5%) accounting for the largest median family size of 3.95 persons per family. On the other hand, single female/mother families (129 | 26.4%) represent the smallest median family size with 3.50 persons per family.
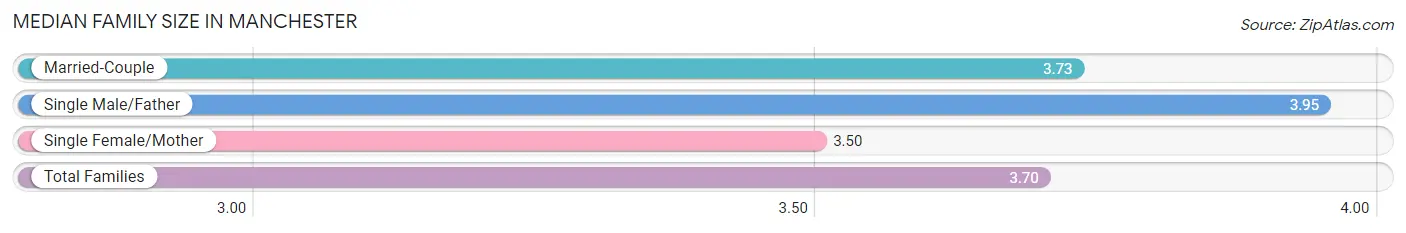
| Family Type | # Families | Family Size |
| Married-Couple | 294 (60.1%) | 3.73 |
| Single Male/Father | 66 (13.5%) | 3.95 |
| Single Female/Mother | 129 (26.4%) | 3.50 |
| Total Families | 489 (100.0%) | 3.70 |
Median Household Size in Manchester
The median household size in Manchester is 2.82 persons per household, with single male/father households (66 | 8.5%) accounting for the largest median household size of 4.14 persons per household. non-family households (286 | 36.9%) represent the smallest median household size with 1.22 persons per household.
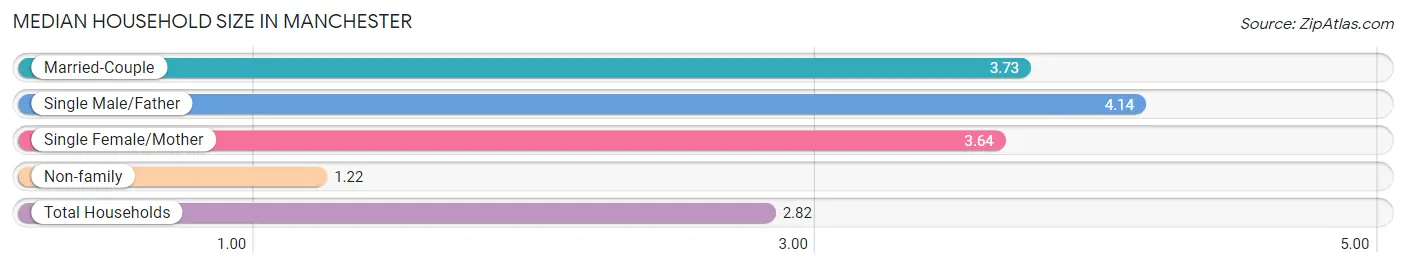
| Household Type | # Households | Household Size |
| Married-Couple | 294 (37.9%) | 3.73 |
| Single Male/Father | 66 (8.5%) | 4.14 |
| Single Female/Mother | 129 (16.7%) | 3.64 |
| Non-family | 286 (36.9%) | 1.22 |
| Total Households | 775 (100.0%) | 2.82 |
Household Size by Marriage Status in Manchester
Out of a total of 775 households in Manchester, 489 (63.1%) are family households, while 286 (36.9%) are nonfamily households. The most numerous type of family households are 2-person households, comprising 181, and the most common type of nonfamily households are 1-person households, comprising 208.
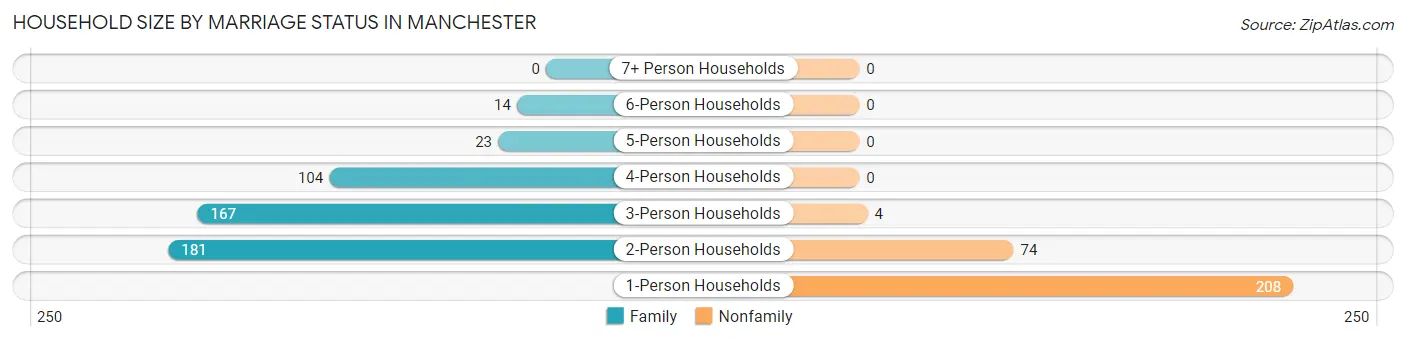
| Household Size | Family Households | Nonfamily Households |
| 1-Person Households | - | 208 (26.8%) |
| 2-Person Households | 181 (23.4%) | 74 (9.6%) |
| 3-Person Households | 167 (21.5%) | 4 (0.5%) |
| 4-Person Households | 104 (13.4%) | 0 (0.0%) |
| 5-Person Households | 23 (3.0%) | 0 (0.0%) |
| 6-Person Households | 14 (1.8%) | 0 (0.0%) |
| 7+ Person Households | 0 (0.0%) | 0 (0.0%) |
| Total | 489 (63.1%) | 286 (36.9%) |
Female Fertility in Manchester
Fertility by Age in Manchester
Average fertility rate in Manchester is 4.0 births per 1,000 women. Women in the age bracket of 20 to 34 years have the highest fertility rate with 7.0 births per 1,000 women. Women in the age bracket of 20 to 34 years acount for 100.0% of all women with births.
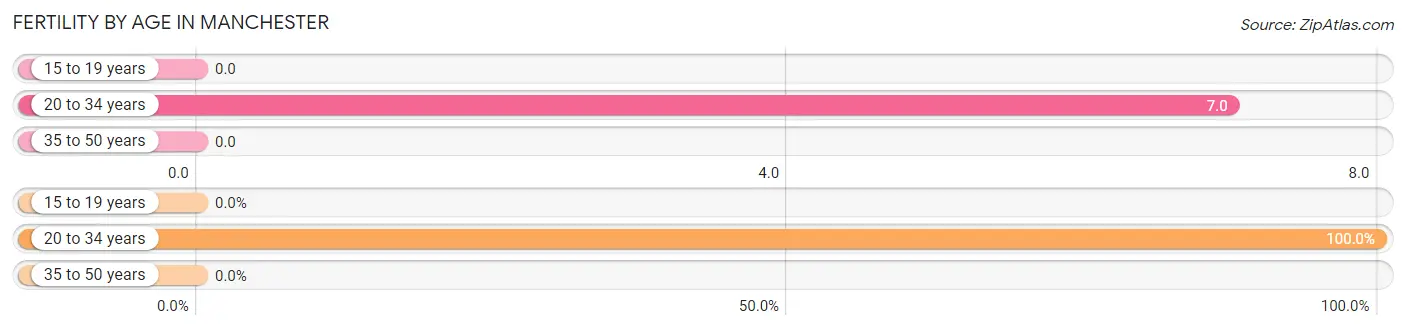
| Age Bracket | Women with Births | Births / 1,000 Women |
| 15 to 19 years | 0 (0.0%) | 0.0 |
| 20 to 34 years | 2 (100.0%) | 7.0 |
| 35 to 50 years | 0 (0.0%) | 0.0 |
| Total | 2 (100.0%) | 4.0 |
Fertility by Age by Marriage Status in Manchester
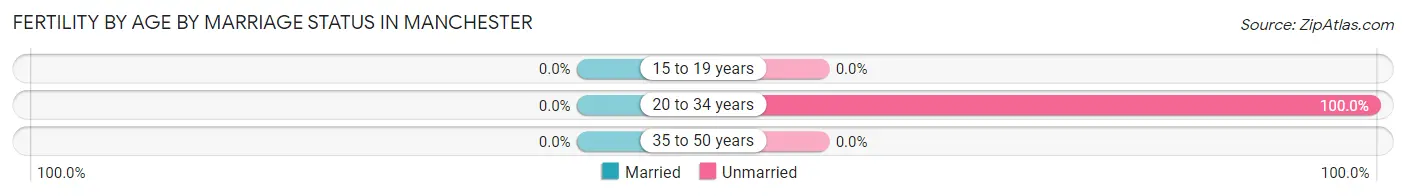
| Age Bracket | Married | Unmarried |
| 15 to 19 years | 0 (0.0%) | 0 (0.0%) |
| 20 to 34 years | 0 (0.0%) | 2 (100.0%) |
| 35 to 50 years | 0 (0.0%) | 0 (0.0%) |
| Total | 0 (0.0%) | 2 (100.0%) |
Fertility by Education in Manchester
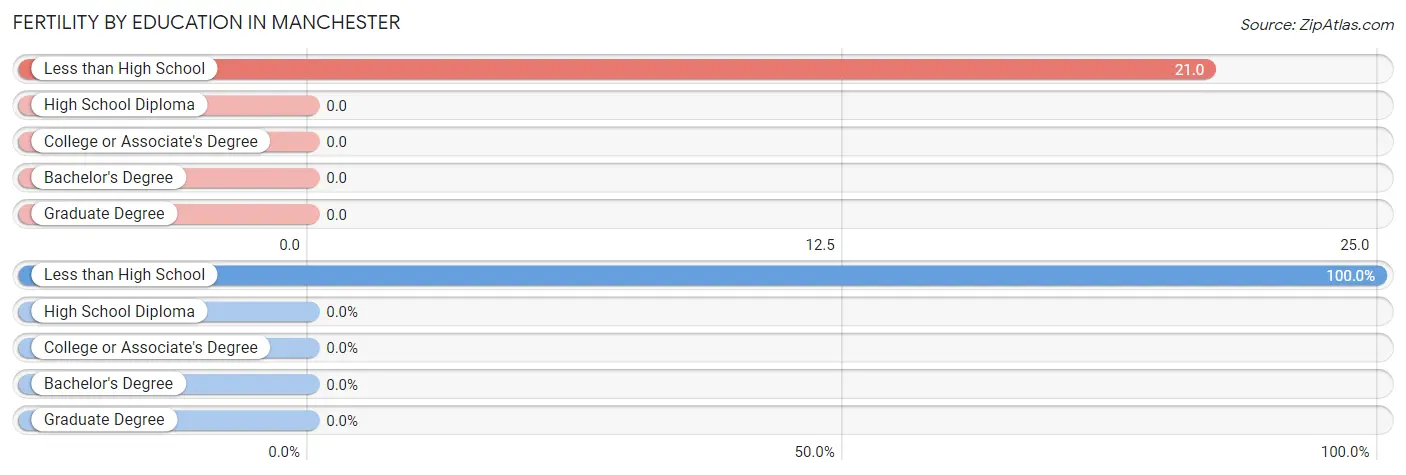
| Educational Attainment | Women with Births | Births / 1,000 Women |
| Less than High School | 2 (100.0%) | 21.0 |
| High School Diploma | 0 (0.0%) | 0.0 |
| College or Associate's Degree | 0 (0.0%) | 0.0 |
| Bachelor's Degree | 0 (0.0%) | 0.0 |
| Graduate Degree | 0 (0.0%) | 0.0 |
| Total | 2 (100.0%) | 4.0 |
Fertility by Education by Marriage Status in Manchester
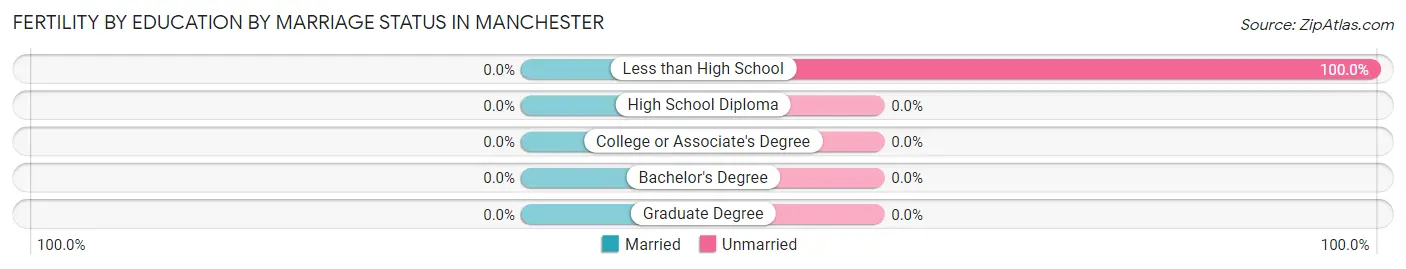
| Educational Attainment | Married | Unmarried |
| Less than High School | 0 (0.0%) | 2 (100.0%) |
| High School Diploma | 0 (0.0%) | 0 (0.0%) |
| College or Associate's Degree | 0 (0.0%) | 0 (0.0%) |
| Bachelor's Degree | 0 (0.0%) | 0 (0.0%) |
| Graduate Degree | 0 (0.0%) | 0 (0.0%) |
| Total | 0 (0.0%) | 2 (100.0%) |
Employment Characteristics in Manchester
Employment by Class of Employer in Manchester
Among the 745 employed individuals in Manchester, private company employees (533 | 71.5%), not-for-profit organizations (85 | 11.4%), and state government employees (59 | 7.9%) make up the most common classes of employment.
| Employer Class | # Employees | % Employees |
| Private Company Employees | 533 | 71.5% |
| Self-Employed (Incorporated) | 2 | 0.3% |
| Self-Employed (Not Incorporated) | 11 | 1.5% |
| Not-for-profit Organizations | 85 | 11.4% |
| Local Government Employees | 43 | 5.8% |
| State Government Employees | 59 | 7.9% |
| Federal Government Employees | 9 | 1.2% |
| Unpaid Family Workers | 3 | 0.4% |
| Total | 745 | 100.0% |
Employment Status by Age in Manchester
According to the labor force statistics for Manchester, out of the total population over 16 years of age (1,806), 43.5% or 786 individuals are in the labor force, with 3.6% or 28 of them unemployed. The age group with the highest labor force participation rate is 25 to 29 years, with 75.6% or 204 individuals in the labor force. Within the labor force, the 16 to 19 years age range has the highest percentage of unemployed individuals, with 34.8% or 8 of them being unemployed.
| Age Bracket | In Labor Force | Unemployed |
| 16 to 19 Years | 23 (57.5%) | 8 (34.8%) |
| 20 to 24 Years | 71 (55.9%) | 3 (4.2%) |
| 25 to 29 Years | 204 (75.6%) | 8 (3.9%) |
| 30 to 34 Years | 49 (24.3%) | 0 (0.0%) |
| 35 to 44 Years | 143 (42.6%) | 9 (6.3%) |
| 45 to 54 Years | 168 (74.7%) | 0 (0.0%) |
| 55 to 59 Years | 12 (16.2%) | 0 (0.0%) |
| 60 to 64 Years | 46 (26.0%) | 0 (0.0%) |
| 65 to 74 Years | 51 (19.2%) | 0 (0.0%) |
| 75 Years and over | 18 (20.2%) | 0 (0.0%) |
| Total | 786 (43.5%) | 28 (3.6%) |
Employment Status by Educational Attainment in Manchester
According to labor force statistics for Manchester, 48.4% of individuals (621) out of the total population between 25 and 64 years of age (1,284) are in the labor force, with 2.7% or 17 of them being unemployed. The group with the highest labor force participation rate are those with the educational attainment of bachelor's degree or higher, with 89.0% or 178 individuals in the labor force. Within the labor force, individuals with college / associate degree education have the highest percentage of unemployment, with 5.1% or 8 of them being unemployed.
| Educational Attainment | In Labor Force | Unemployed |
| Less than High School | 47 (13.5%) | 0 (0.0%) |
| High School Diploma | 240 (52.2%) | 10 (2.1%) |
| College / Associate Degree | 157 (56.9%) | 14 (5.1%) |
| Bachelor's Degree or higher | 178 (89.0%) | 4 (2.2%) |
| Total | 621 (48.4%) | 35 (2.7%) |
Employment Occupations by Sex in Manchester
Management, Business, Science and Arts Occupations
The most common Management, Business, Science and Arts occupations in Manchester are Community & Social Service (97 | 12.8%), Business & Financial (84 | 11.1%), Education, Arts & Media (56 | 7.4%), Management (46 | 6.1%), and Education Instruction & Library (41 | 5.4%).
Management, Business, Science and Arts Occupations by Sex
Within the Management, Business, Science and Arts occupations in Manchester, the most male-oriented occupations are Management (71.7%), Education, Arts & Media (21.4%), and Community & Social Service (18.6%), while the most female-oriented occupations are Computers, Engineering & Science (100.0%), Computers & Mathematics (100.0%), and Health Diagnosing & Treating (100.0%).
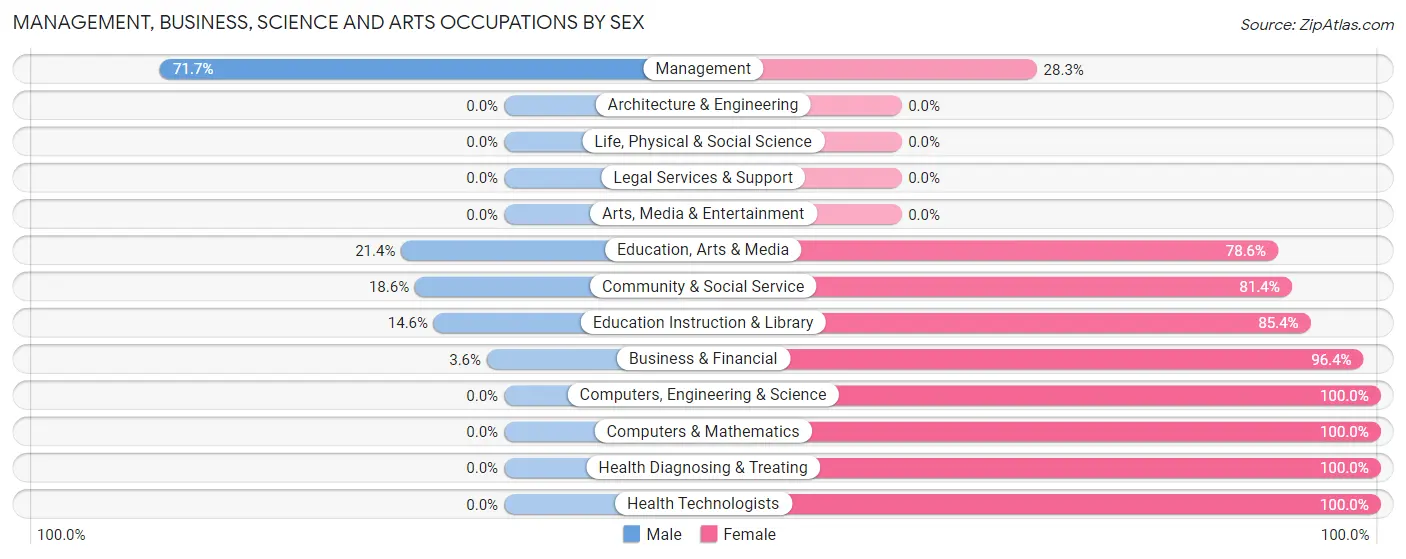
| Occupation | Male | Female |
| Management | 33 (71.7%) | 13 (28.3%) |
| Business & Financial | 3 (3.6%) | 81 (96.4%) |
| Computers, Engineering & Science | 0 (0.0%) | 13 (100.0%) |
| Computers & Mathematics | 0 (0.0%) | 13 (100.0%) |
| Architecture & Engineering | 0 (0.0%) | 0 (0.0%) |
| Life, Physical & Social Science | 0 (0.0%) | 0 (0.0%) |
| Community & Social Service | 18 (18.6%) | 79 (81.4%) |
| Education, Arts & Media | 12 (21.4%) | 44 (78.6%) |
| Legal Services & Support | 0 (0.0%) | 0 (0.0%) |
| Education Instruction & Library | 6 (14.6%) | 35 (85.4%) |
| Arts, Media & Entertainment | 0 (0.0%) | 0 (0.0%) |
| Health Diagnosing & Treating | 0 (0.0%) | 41 (100.0%) |
| Health Technologists | 0 (0.0%) | 29 (100.0%) |
| Total (Category) | 54 (19.2%) | 227 (80.8%) |
| Total (Overall) | 326 (43.1%) | 431 (56.9%) |
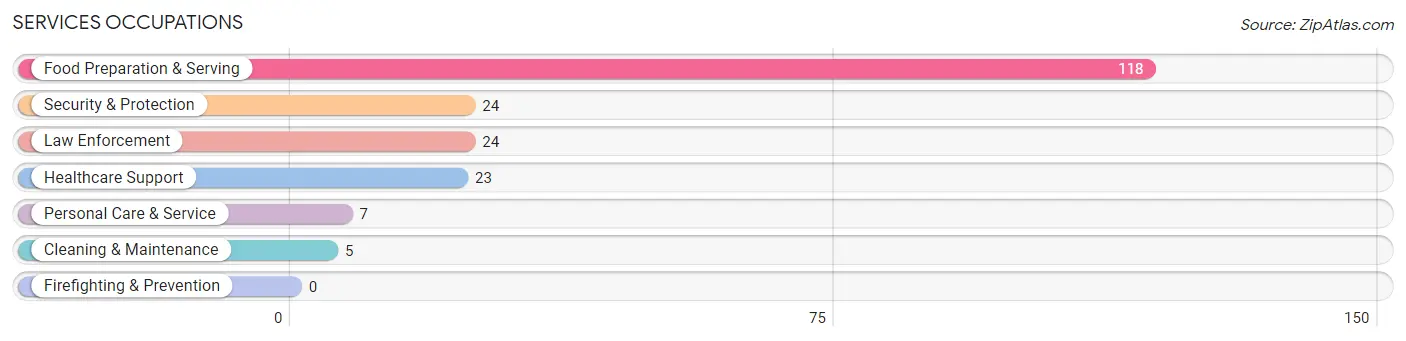
Services Occupations
The most common Services occupations in Manchester are Food Preparation & Serving (118 | 15.6%), Security & Protection (24 | 3.2%), Law Enforcement (24 | 3.2%), Healthcare Support (23 | 3.0%), and Personal Care & Service (7 | 0.9%).
Services Occupations by Sex
Within the Services occupations in Manchester, the most male-oriented occupations are Security & Protection (100.0%), Law Enforcement (100.0%), and Food Preparation & Serving (72.9%), while the most female-oriented occupations are Healthcare Support (100.0%), Cleaning & Maintenance (100.0%), and Personal Care & Service (100.0%).
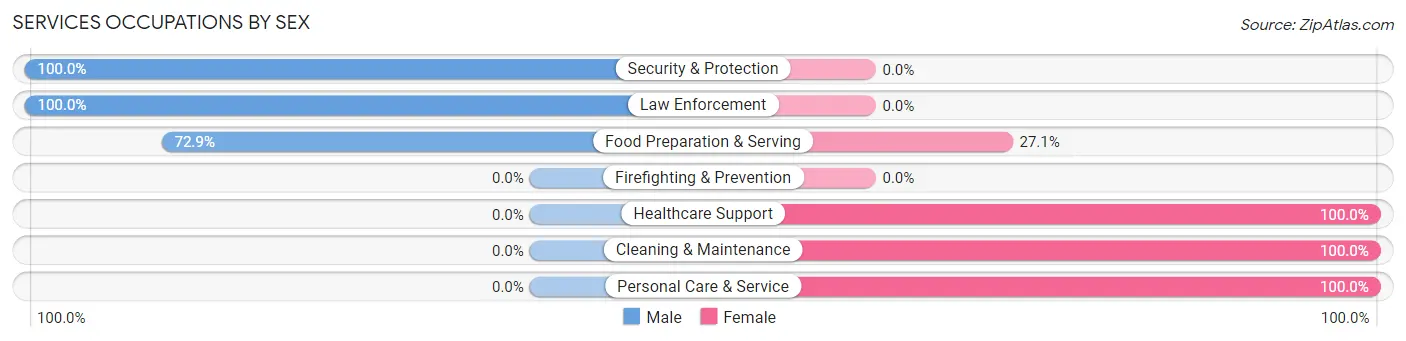
| Occupation | Male | Female |
| Healthcare Support | 0 (0.0%) | 23 (100.0%) |
| Security & Protection | 24 (100.0%) | 0 (0.0%) |
| Firefighting & Prevention | 0 (0.0%) | 0 (0.0%) |
| Law Enforcement | 24 (100.0%) | 0 (0.0%) |
| Food Preparation & Serving | 86 (72.9%) | 32 (27.1%) |
| Cleaning & Maintenance | 0 (0.0%) | 5 (100.0%) |
| Personal Care & Service | 0 (0.0%) | 7 (100.0%) |
| Total (Category) | 110 (62.2%) | 67 (37.9%) |
| Total (Overall) | 326 (43.1%) | 431 (56.9%) |
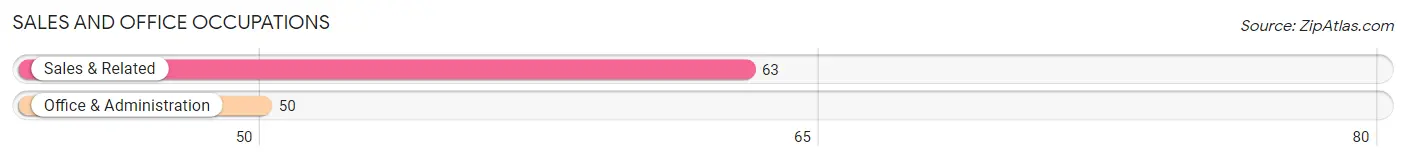
Sales and Office Occupations
The most common Sales and Office occupations in Manchester are Sales & Related (63 | 8.3%), and Office & Administration (50 | 6.6%).
Sales and Office Occupations by Sex
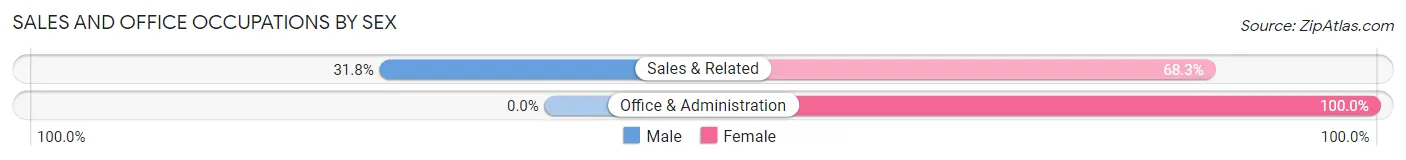
| Occupation | Male | Female |
| Sales & Related | 20 (31.8%) | 43 (68.2%) |
| Office & Administration | 0 (0.0%) | 50 (100.0%) |
| Total (Category) | 20 (17.7%) | 93 (82.3%) |
| Total (Overall) | 326 (43.1%) | 431 (56.9%) |
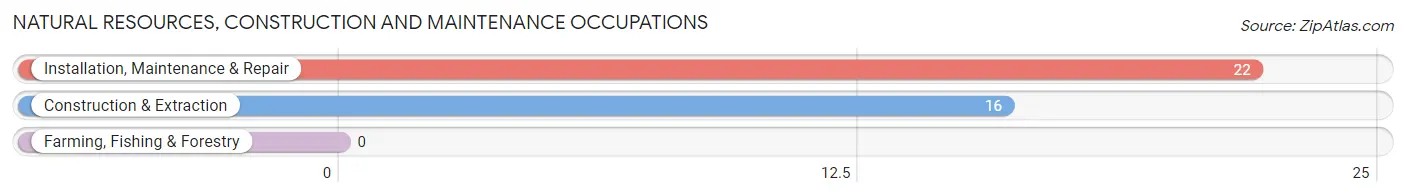
Natural Resources, Construction and Maintenance Occupations
The most common Natural Resources, Construction and Maintenance occupations in Manchester are Installation, Maintenance & Repair (22 | 2.9%), and Construction & Extraction (16 | 2.1%).
Natural Resources, Construction and Maintenance Occupations by Sex
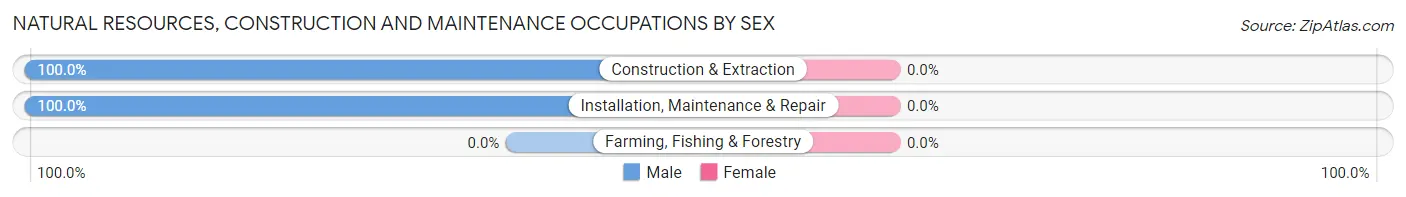
| Occupation | Male | Female |
| Farming, Fishing & Forestry | 0 (0.0%) | 0 (0.0%) |
| Construction & Extraction | 16 (100.0%) | 0 (0.0%) |
| Installation, Maintenance & Repair | 22 (100.0%) | 0 (0.0%) |
| Total (Category) | 38 (100.0%) | 0 (0.0%) |
| Total (Overall) | 326 (43.1%) | 431 (56.9%) |
Production, Transportation and Moving Occupations
The most common Production, Transportation and Moving occupations in Manchester are Production (95 | 12.6%), Transportation (46 | 6.1%), and Material Moving (7 | 0.9%).
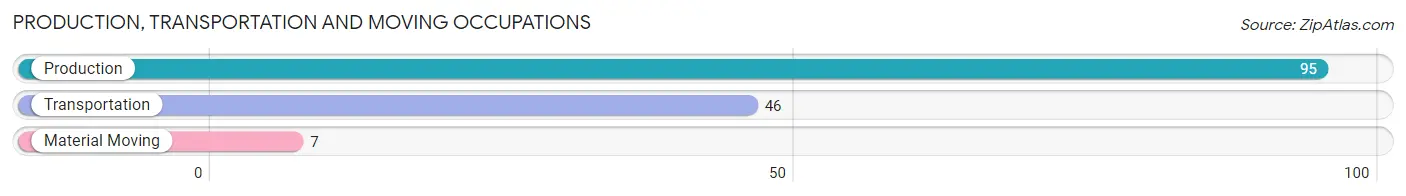
Production, Transportation and Moving Occupations by Sex
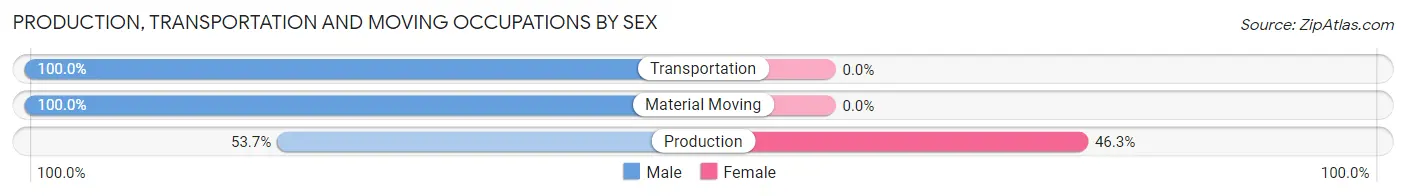
| Occupation | Male | Female |
| Production | 51 (53.7%) | 44 (46.3%) |
| Transportation | 46 (100.0%) | 0 (0.0%) |
| Material Moving | 7 (100.0%) | 0 (0.0%) |
| Total (Category) | 104 (70.3%) | 44 (29.7%) |
| Total (Overall) | 326 (43.1%) | 431 (56.9%) |
Employment Industries by Sex in Manchester
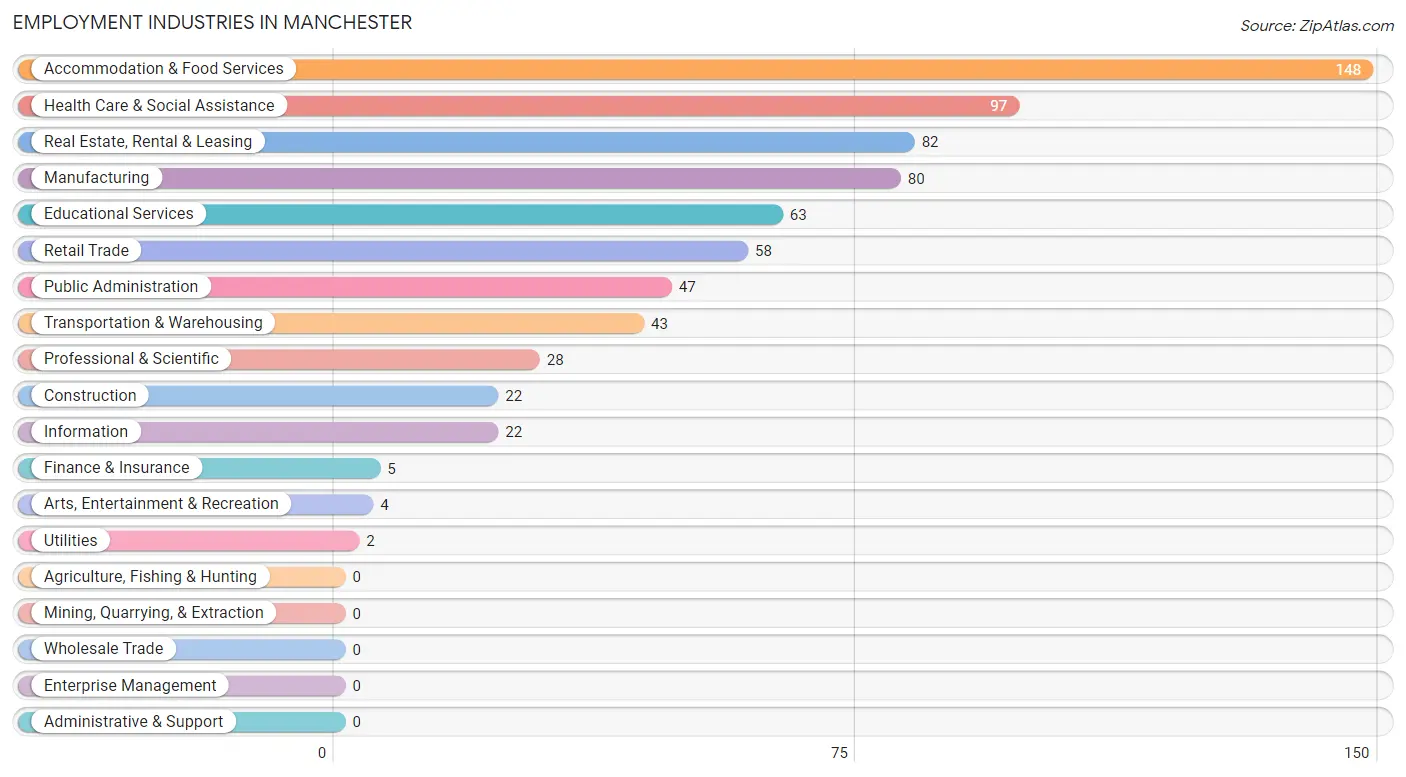
Employment Industries in Manchester
The major employment industries in Manchester include Accommodation & Food Services (148 | 19.6%), Health Care & Social Assistance (97 | 12.8%), Real Estate, Rental & Leasing (82 | 10.8%), Manufacturing (80 | 10.6%), and Educational Services (63 | 8.3%).
Employment Industries by Sex in Manchester
The Manchester industries that see more men than women are Transportation & Warehousing (100.0%), Utilities (100.0%), and Public Administration (70.2%), whereas the industries that tend to have a higher number of women are Professional & Scientific (100.0%), Arts, Entertainment & Recreation (100.0%), and Health Care & Social Assistance (95.9%).
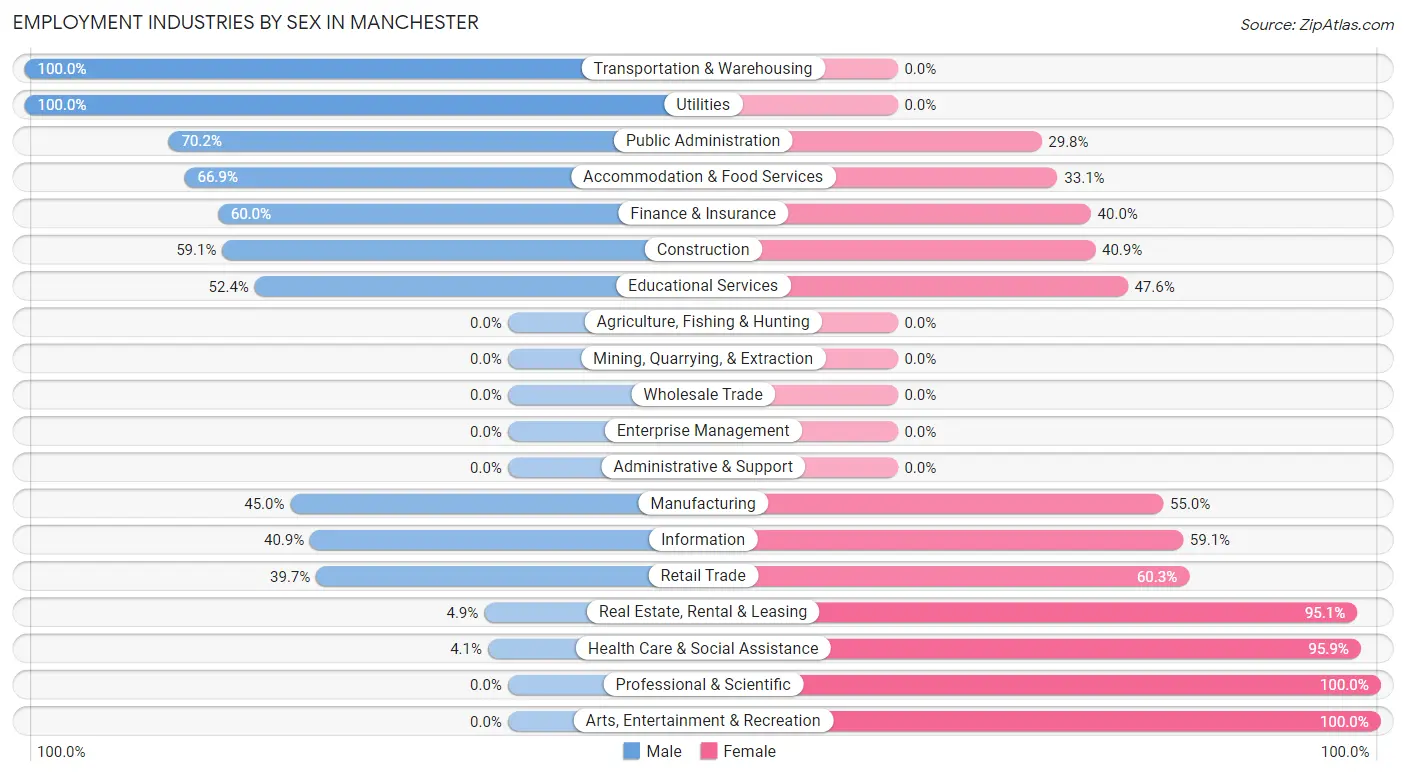
| Industry | Male | Female |
| Agriculture, Fishing & Hunting | 0 (0.0%) | 0 (0.0%) |
| Mining, Quarrying, & Extraction | 0 (0.0%) | 0 (0.0%) |
| Construction | 13 (59.1%) | 9 (40.9%) |
| Manufacturing | 36 (45.0%) | 44 (55.0%) |
| Wholesale Trade | 0 (0.0%) | 0 (0.0%) |
| Retail Trade | 23 (39.7%) | 35 (60.3%) |
| Transportation & Warehousing | 43 (100.0%) | 0 (0.0%) |
| Utilities | 2 (100.0%) | 0 (0.0%) |
| Information | 9 (40.9%) | 13 (59.1%) |
| Finance & Insurance | 3 (60.0%) | 2 (40.0%) |
| Real Estate, Rental & Leasing | 4 (4.9%) | 78 (95.1%) |
| Professional & Scientific | 0 (0.0%) | 28 (100.0%) |
| Enterprise Management | 0 (0.0%) | 0 (0.0%) |
| Administrative & Support | 0 (0.0%) | 0 (0.0%) |
| Educational Services | 33 (52.4%) | 30 (47.6%) |
| Health Care & Social Assistance | 4 (4.1%) | 93 (95.9%) |
| Arts, Entertainment & Recreation | 0 (0.0%) | 4 (100.0%) |
| Accommodation & Food Services | 99 (66.9%) | 49 (33.1%) |
| Public Administration | 33 (70.2%) | 14 (29.8%) |
| Total | 326 (43.1%) | 431 (56.9%) |
Education in Manchester
School Enrollment in Manchester
The most common levels of schooling among the 345 students in Manchester are elementary school (129 | 37.4%), high school (60 | 17.4%), and middle school (59 | 17.1%).
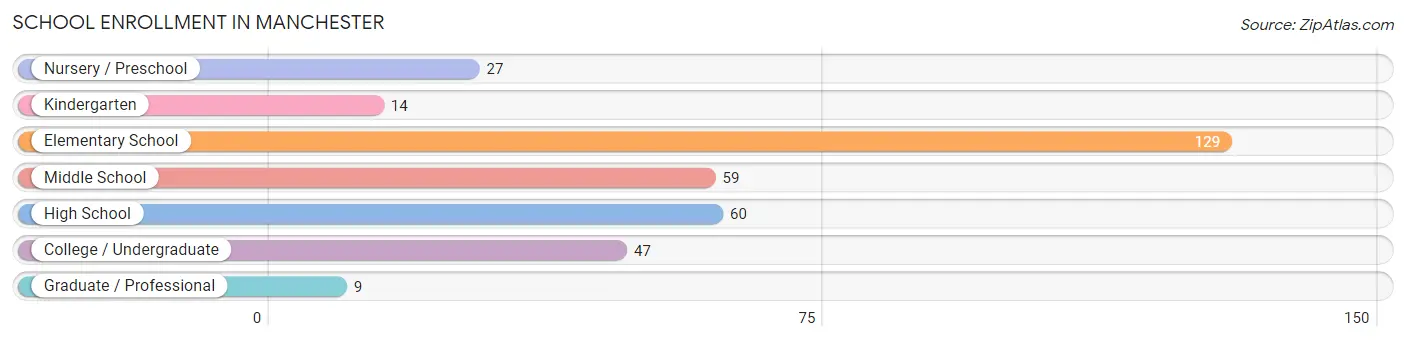
| School Level | # Students | % Students |
| Nursery / Preschool | 27 | 7.8% |
| Kindergarten | 14 | 4.1% |
| Elementary School | 129 | 37.4% |
| Middle School | 59 | 17.1% |
| High School | 60 | 17.4% |
| College / Undergraduate | 47 | 13.6% |
| Graduate / Professional | 9 | 2.6% |
| Total | 345 | 100.0% |
School Enrollment by Age by Funding Source in Manchester
Out of a total of 345 students who are enrolled in schools in Manchester, 18 (5.2%) attend a private institution, while the remaining 327 (94.8%) are enrolled in public schools. The age group of 25 to 34 year olds has the highest likelihood of being enrolled in private schools, with 4 (30.8% in the age bracket) enrolled. Conversely, the age group of 3 to 4 year olds has the lowest likelihood of being enrolled in a private school, with 27 (100.0% in the age bracket) attending a public institution.

| Age Bracket | Public School | Private School |
| 3 to 4 Year Olds | 27 (100.0%) | 0 (0.0%) |
| 5 to 9 Year Old | 64 (100.0%) | 0 (0.0%) |
| 10 to 14 Year Olds | 141 (91.0%) | 14 (9.0%) |
| 15 to 17 Year Olds | 39 (100.0%) | 0 (0.0%) |
| 18 to 19 Year Olds | 4 (100.0%) | 0 (0.0%) |
| 20 to 24 Year Olds | 19 (100.0%) | 0 (0.0%) |
| 25 to 34 Year Olds | 9 (69.2%) | 4 (30.8%) |
| 35 Years and over | 24 (100.0%) | 0 (0.0%) |
| Total | 327 (94.8%) | 18 (5.2%) |
Educational Attainment by Field of Study in Manchester
Education (78 | 29.9%), psychology (46 | 17.6%), bio, nature & agricultural (43 | 16.5%), science & technology (30 | 11.5%), and computers & mathematics (18 | 6.9%) are the most common fields of study among 261 individuals in Manchester who have obtained a bachelor's degree or higher.
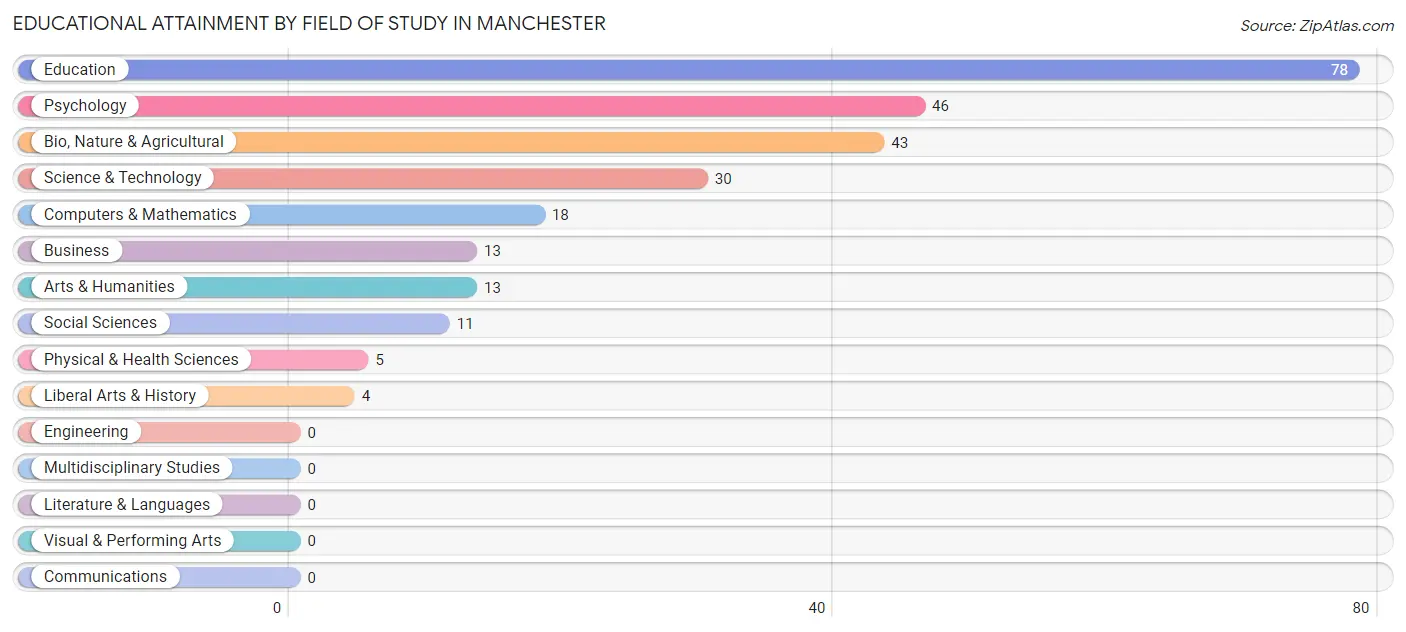
| Field of Study | # Graduates | % Graduates |
| Computers & Mathematics | 18 | 6.9% |
| Bio, Nature & Agricultural | 43 | 16.5% |
| Physical & Health Sciences | 5 | 1.9% |
| Psychology | 46 | 17.6% |
| Social Sciences | 11 | 4.2% |
| Engineering | 0 | 0.0% |
| Multidisciplinary Studies | 0 | 0.0% |
| Science & Technology | 30 | 11.5% |
| Business | 13 | 5.0% |
| Education | 78 | 29.9% |
| Literature & Languages | 0 | 0.0% |
| Liberal Arts & History | 4 | 1.5% |
| Visual & Performing Arts | 0 | 0.0% |
| Communications | 0 | 0.0% |
| Arts & Humanities | 13 | 5.0% |
| Total | 261 | 100.0% |
Transportation & Commute in Manchester
Vehicle Availability by Sex in Manchester
The most prevalent vehicle ownership categories in Manchester are males with 2 vehicles (184, accounting for 56.8%) and females with 2 vehicles (167, making up 43.7%).
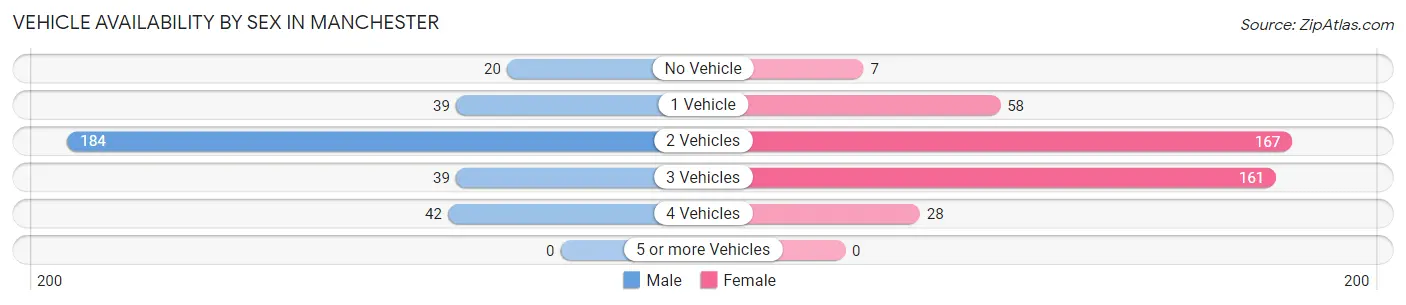
| Vehicles Available | Male | Female |
| No Vehicle | 20 (6.2%) | 7 (1.7%) |
| 1 Vehicle | 39 (12.0%) | 58 (13.8%) |
| 2 Vehicles | 184 (56.8%) | 167 (39.7%) |
| 3 Vehicles | 39 (12.0%) | 161 (38.2%) |
| 4 Vehicles | 42 (13.0%) | 28 (6.7%) |
| 5 or more Vehicles | 0 (0.0%) | 0 (0.0%) |
| Total | 324 (100.0%) | 421 (100.0%) |
Commute Time in Manchester
The most frequently occuring commute durations in Manchester are 10 to 14 minutes (168 commuters, 24.0%), 5 to 9 minutes (136 commuters, 19.4%), and less than 5 minutes (109 commuters, 15.5%).
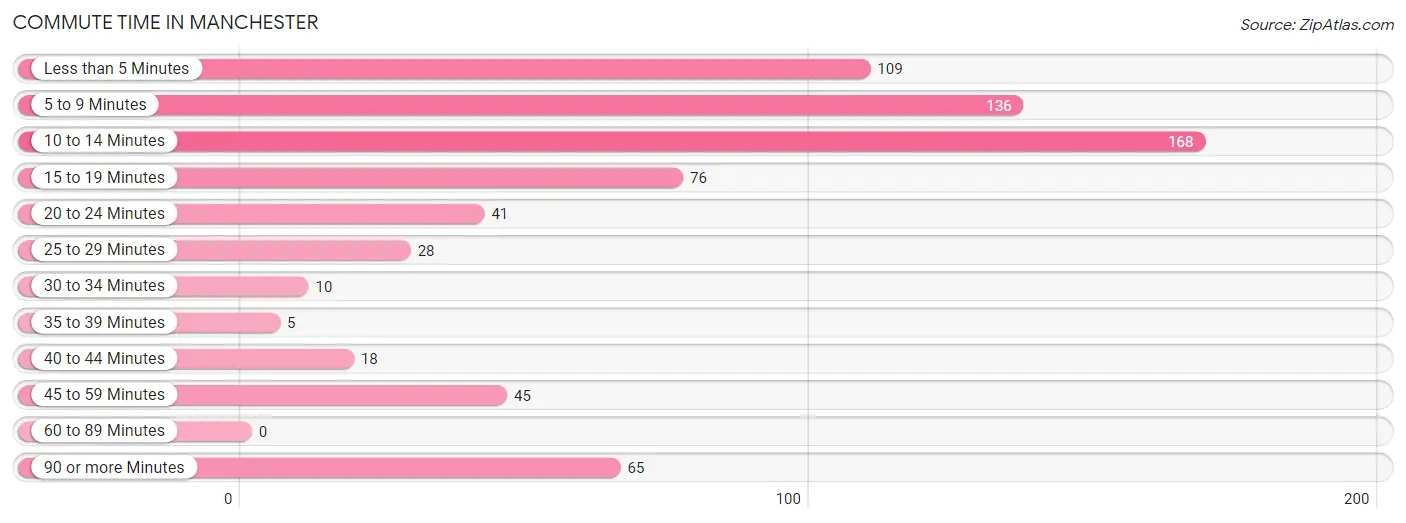
| Commute Time | # Commuters | % Commuters |
| Less than 5 Minutes | 109 | 15.5% |
| 5 to 9 Minutes | 136 | 19.4% |
| 10 to 14 Minutes | 168 | 24.0% |
| 15 to 19 Minutes | 76 | 10.8% |
| 20 to 24 Minutes | 41 | 5.9% |
| 25 to 29 Minutes | 28 | 4.0% |
| 30 to 34 Minutes | 10 | 1.4% |
| 35 to 39 Minutes | 5 | 0.7% |
| 40 to 44 Minutes | 18 | 2.6% |
| 45 to 59 Minutes | 45 | 6.4% |
| 60 to 89 Minutes | 0 | 0.0% |
| 90 or more Minutes | 65 | 9.3% |
Commute Time by Sex in Manchester
The most common commute times in Manchester are 10 to 14 minutes (109 commuters, 33.6%) for males and 5 to 9 minutes (92 commuters, 24.4%) for females.
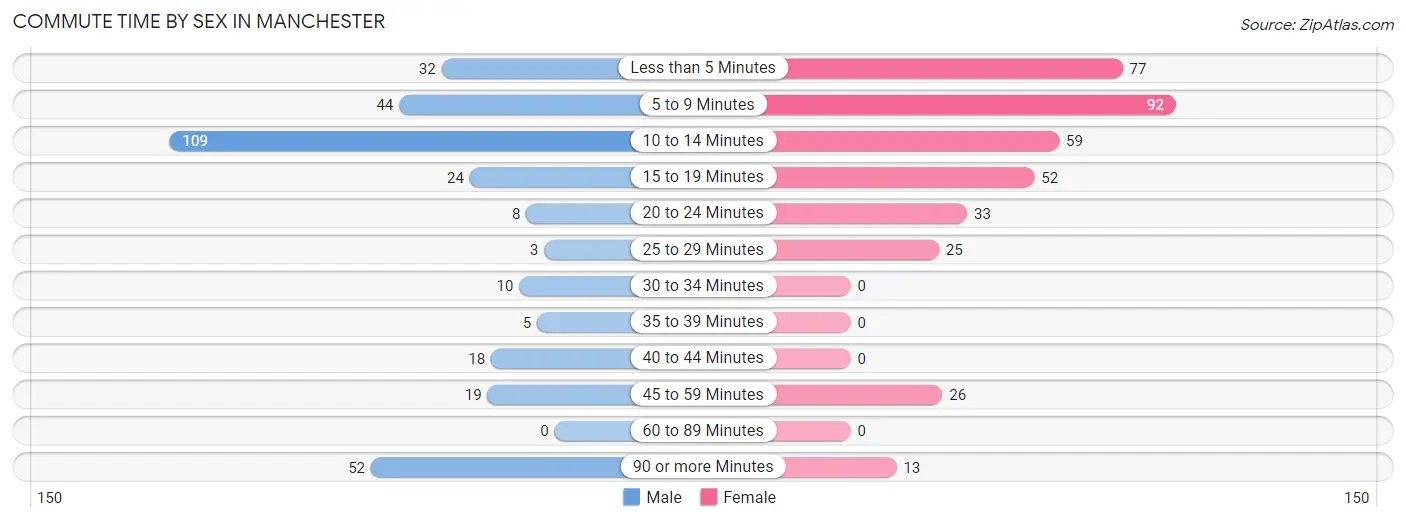
| Commute Time | Male | Female |
| Less than 5 Minutes | 32 (9.9%) | 77 (20.4%) |
| 5 to 9 Minutes | 44 (13.6%) | 92 (24.4%) |
| 10 to 14 Minutes | 109 (33.6%) | 59 (15.7%) |
| 15 to 19 Minutes | 24 (7.4%) | 52 (13.8%) |
| 20 to 24 Minutes | 8 (2.5%) | 33 (8.7%) |
| 25 to 29 Minutes | 3 (0.9%) | 25 (6.6%) |
| 30 to 34 Minutes | 10 (3.1%) | 0 (0.0%) |
| 35 to 39 Minutes | 5 (1.5%) | 0 (0.0%) |
| 40 to 44 Minutes | 18 (5.6%) | 0 (0.0%) |
| 45 to 59 Minutes | 19 (5.9%) | 26 (6.9%) |
| 60 to 89 Minutes | 0 (0.0%) | 0 (0.0%) |
| 90 or more Minutes | 52 (16.1%) | 13 (3.5%) |
Time of Departure to Work by Sex in Manchester
The most frequent times of departure to work in Manchester are 4:00 PM to 11:59 PM (87, 26.9%) for males and 7:00 AM to 7:29 AM (127, 33.7%) for females.
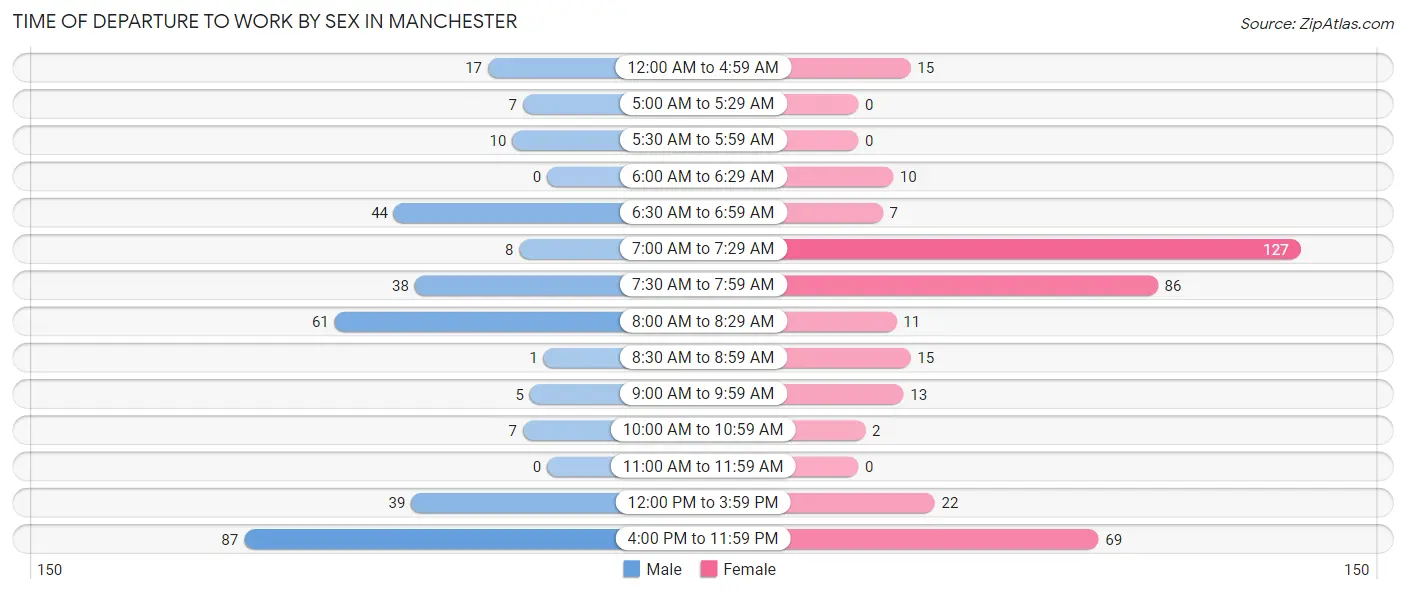
| Time of Departure | Male | Female |
| 12:00 AM to 4:59 AM | 17 (5.2%) | 15 (4.0%) |
| 5:00 AM to 5:29 AM | 7 (2.2%) | 0 (0.0%) |
| 5:30 AM to 5:59 AM | 10 (3.1%) | 0 (0.0%) |
| 6:00 AM to 6:29 AM | 0 (0.0%) | 10 (2.6%) |
| 6:30 AM to 6:59 AM | 44 (13.6%) | 7 (1.9%) |
| 7:00 AM to 7:29 AM | 8 (2.5%) | 127 (33.7%) |
| 7:30 AM to 7:59 AM | 38 (11.7%) | 86 (22.8%) |
| 8:00 AM to 8:29 AM | 61 (18.8%) | 11 (2.9%) |
| 8:30 AM to 8:59 AM | 1 (0.3%) | 15 (4.0%) |
| 9:00 AM to 9:59 AM | 5 (1.5%) | 13 (3.5%) |
| 10:00 AM to 10:59 AM | 7 (2.2%) | 2 (0.5%) |
| 11:00 AM to 11:59 AM | 0 (0.0%) | 0 (0.0%) |
| 12:00 PM to 3:59 PM | 39 (12.0%) | 22 (5.8%) |
| 4:00 PM to 11:59 PM | 87 (26.9%) | 69 (18.3%) |
| Total | 324 (100.0%) | 377 (100.0%) |
Housing Occupancy in Manchester
Occupancy by Ownership in Manchester
Of the total 775 dwellings in Manchester, owner-occupied units account for 350 (45.2%), while renter-occupied units make up 425 (54.8%).
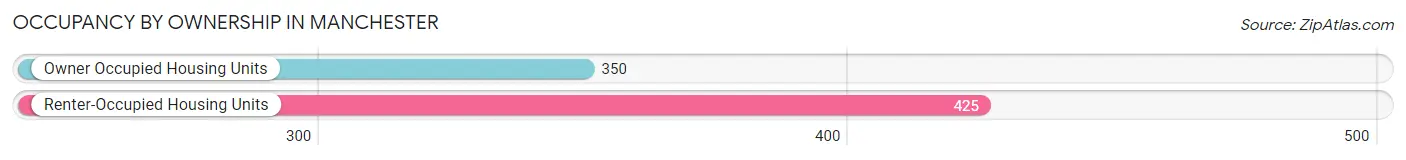
| Occupancy | # Housing Units | % Housing Units |
| Owner Occupied Housing Units | 350 | 45.2% |
| Renter-Occupied Housing Units | 425 | 54.8% |
| Total Occupied Housing Units | 775 | 100.0% |
Occupancy by Household Size in Manchester
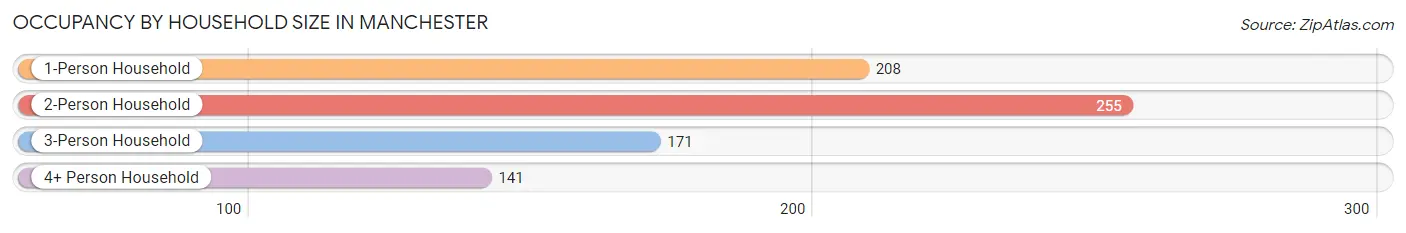
| Household Size | # Housing Units | % Housing Units |
| 1-Person Household | 208 | 26.8% |
| 2-Person Household | 255 | 32.9% |
| 3-Person Household | 171 | 22.1% |
| 4+ Person Household | 141 | 18.2% |
| Total Housing Units | 775 | 100.0% |
Occupancy by Ownership by Household Size in Manchester
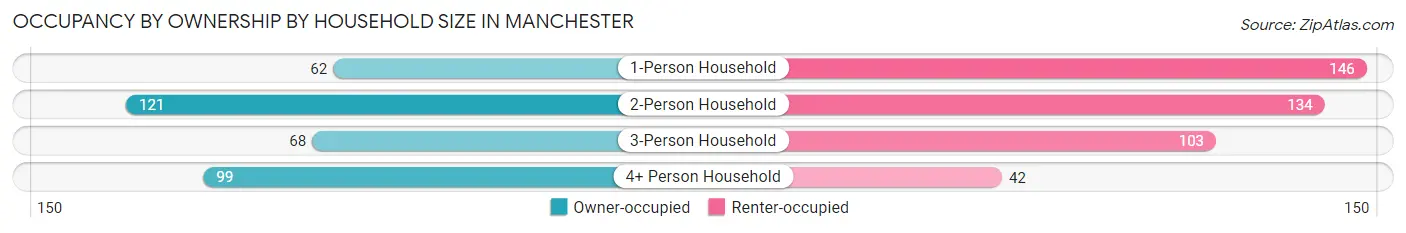
| Household Size | Owner-occupied | Renter-occupied |
| 1-Person Household | 62 (29.8%) | 146 (70.2%) |
| 2-Person Household | 121 (47.4%) | 134 (52.5%) |
| 3-Person Household | 68 (39.8%) | 103 (60.2%) |
| 4+ Person Household | 99 (70.2%) | 42 (29.8%) |
| Total Housing Units | 350 (45.2%) | 425 (54.8%) |
Occupancy by Educational Attainment in Manchester
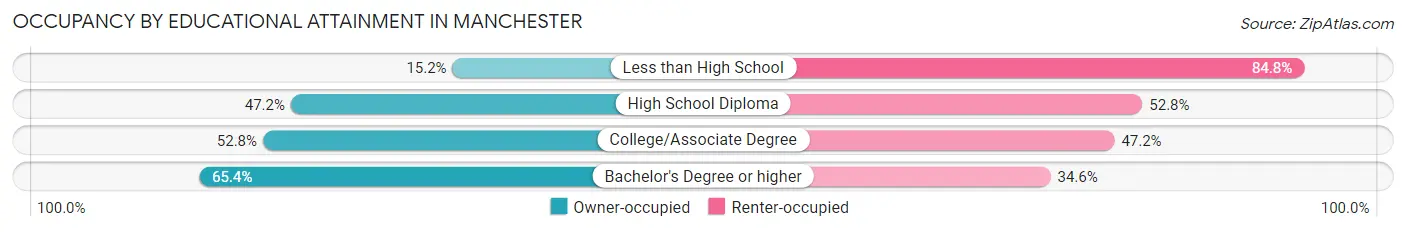
| Household Size | Owner-occupied | Renter-occupied |
| Less than High School | 22 (15.2%) | 123 (84.8%) |
| High School Diploma | 153 (47.2%) | 171 (52.8%) |
| College/Associate Degree | 105 (52.8%) | 94 (47.2%) |
| Bachelor's Degree or higher | 70 (65.4%) | 37 (34.6%) |
Occupancy by Age of Householder in Manchester
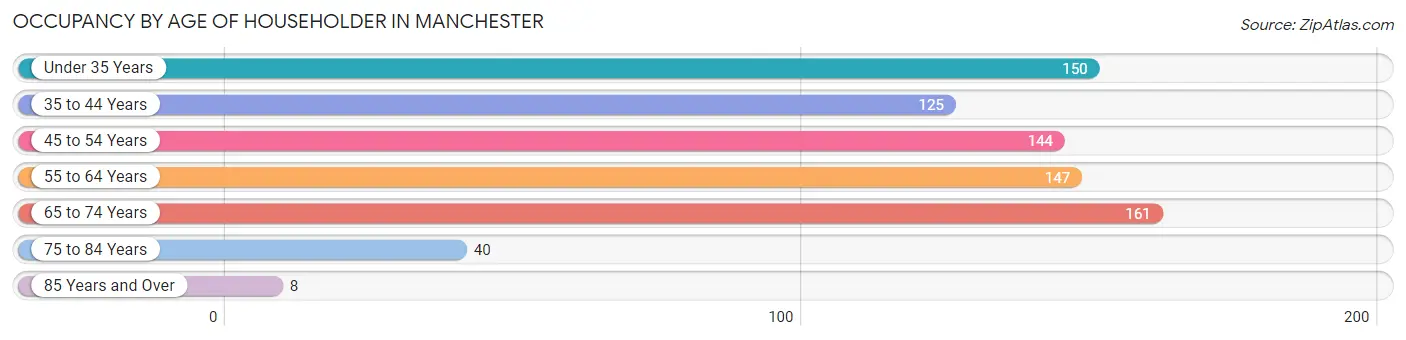
| Age Bracket | # Households | % Households |
| Under 35 Years | 150 | 19.4% |
| 35 to 44 Years | 125 | 16.1% |
| 45 to 54 Years | 144 | 18.6% |
| 55 to 64 Years | 147 | 19.0% |
| 65 to 74 Years | 161 | 20.8% |
| 75 to 84 Years | 40 | 5.2% |
| 85 Years and Over | 8 | 1.0% |
| Total | 775 | 100.0% |
Housing Finances in Manchester
Median Income by Occupancy in Manchester
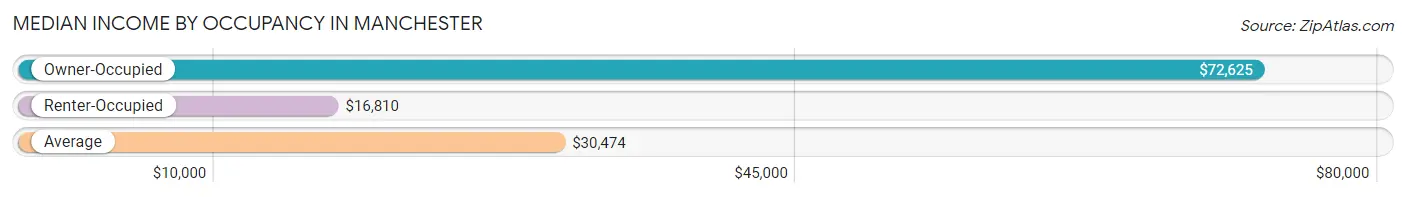
| Occupancy Type | # Households | Median Income |
| Owner-Occupied | 350 (45.2%) | $72,625 |
| Renter-Occupied | 425 (54.8%) | $16,810 |
| Average | 775 (100.0%) | $30,474 |
Occupancy by Householder Income Bracket in Manchester
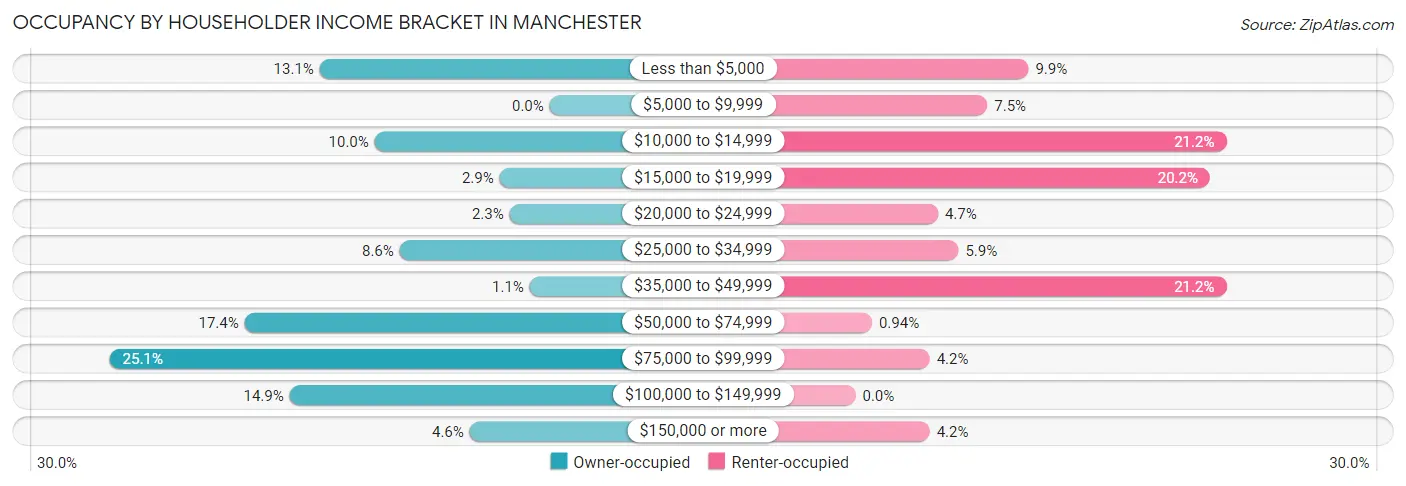
| Income Bracket | Owner-occupied | Renter-occupied |
| Less than $5,000 | 46 (13.1%) | 42 (9.9%) |
| $5,000 to $9,999 | 0 (0.0%) | 32 (7.5%) |
| $10,000 to $14,999 | 35 (10.0%) | 90 (21.2%) |
| $15,000 to $19,999 | 10 (2.9%) | 86 (20.2%) |
| $20,000 to $24,999 | 8 (2.3%) | 20 (4.7%) |
| $25,000 to $34,999 | 30 (8.6%) | 25 (5.9%) |
| $35,000 to $49,999 | 4 (1.1%) | 90 (21.2%) |
| $50,000 to $74,999 | 61 (17.4%) | 4 (0.9%) |
| $75,000 to $99,999 | 88 (25.1%) | 18 (4.2%) |
| $100,000 to $149,999 | 52 (14.9%) | 0 (0.0%) |
| $150,000 or more | 16 (4.6%) | 18 (4.2%) |
| Total | 350 (100.0%) | 425 (100.0%) |
Monthly Housing Cost Tiers in Manchester
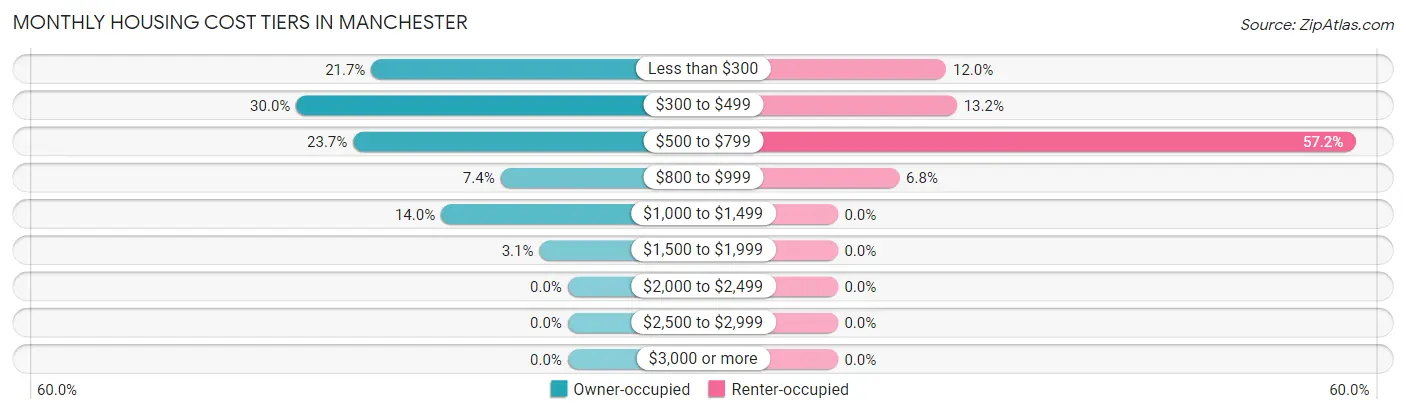
| Monthly Cost | Owner-occupied | Renter-occupied |
| Less than $300 | 76 (21.7%) | 51 (12.0%) |
| $300 to $499 | 105 (30.0%) | 56 (13.2%) |
| $500 to $799 | 83 (23.7%) | 243 (57.2%) |
| $800 to $999 | 26 (7.4%) | 29 (6.8%) |
| $1,000 to $1,499 | 49 (14.0%) | 0 (0.0%) |
| $1,500 to $1,999 | 11 (3.1%) | 0 (0.0%) |
| $2,000 to $2,499 | 0 (0.0%) | 0 (0.0%) |
| $2,500 to $2,999 | 0 (0.0%) | 0 (0.0%) |
| $3,000 or more | 0 (0.0%) | 0 (0.0%) |
| Total | 350 (100.0%) | 425 (100.0%) |
Physical Housing Characteristics in Manchester
Housing Structures in Manchester
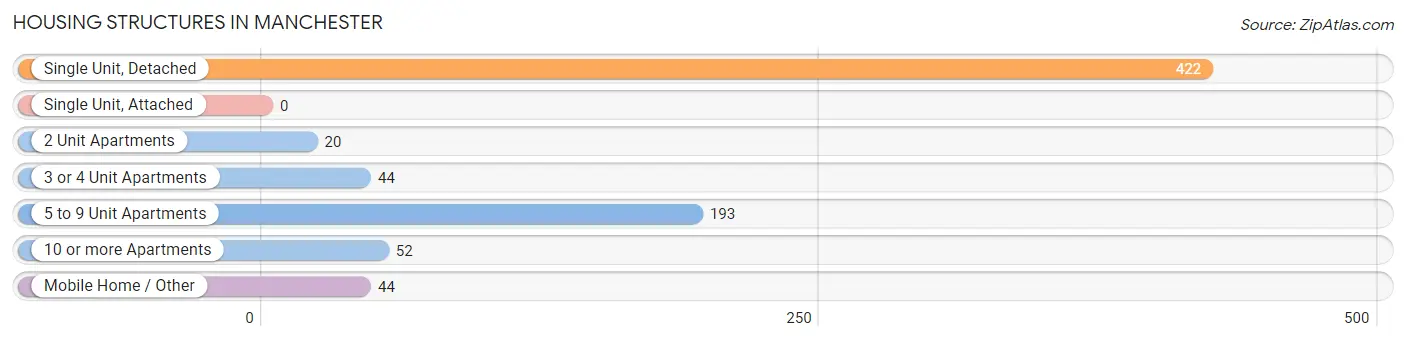
| Structure Type | # Housing Units | % Housing Units |
| Single Unit, Detached | 422 | 54.4% |
| Single Unit, Attached | 0 | 0.0% |
| 2 Unit Apartments | 20 | 2.6% |
| 3 or 4 Unit Apartments | 44 | 5.7% |
| 5 to 9 Unit Apartments | 193 | 24.9% |
| 10 or more Apartments | 52 | 6.7% |
| Mobile Home / Other | 44 | 5.7% |
| Total | 775 | 100.0% |
Housing Structures by Occupancy in Manchester
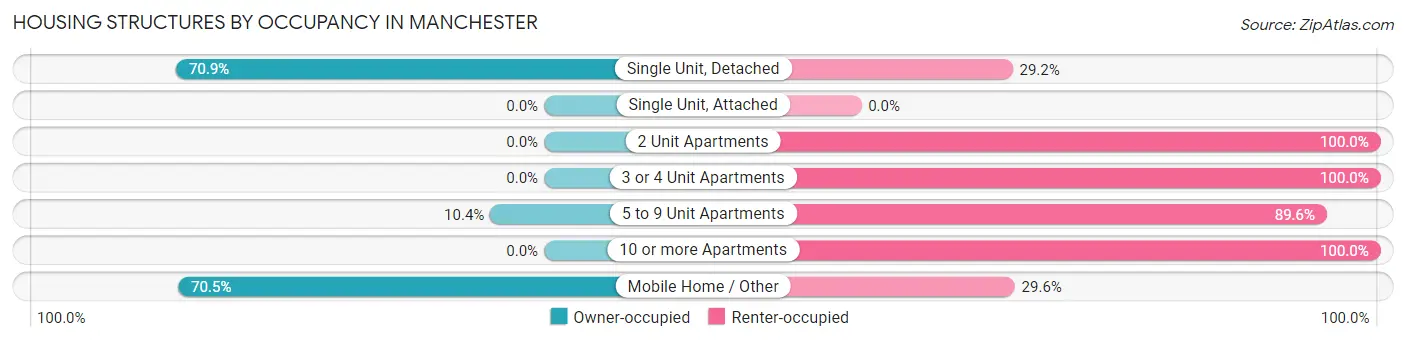
| Structure Type | Owner-occupied | Renter-occupied |
| Single Unit, Detached | 299 (70.9%) | 123 (29.1%) |
| Single Unit, Attached | 0 (0.0%) | 0 (0.0%) |
| 2 Unit Apartments | 0 (0.0%) | 20 (100.0%) |
| 3 or 4 Unit Apartments | 0 (0.0%) | 44 (100.0%) |
| 5 to 9 Unit Apartments | 20 (10.4%) | 173 (89.6%) |
| 10 or more Apartments | 0 (0.0%) | 52 (100.0%) |
| Mobile Home / Other | 31 (70.5%) | 13 (29.5%) |
| Total | 350 (45.2%) | 425 (54.8%) |
Housing Structures by Number of Rooms in Manchester
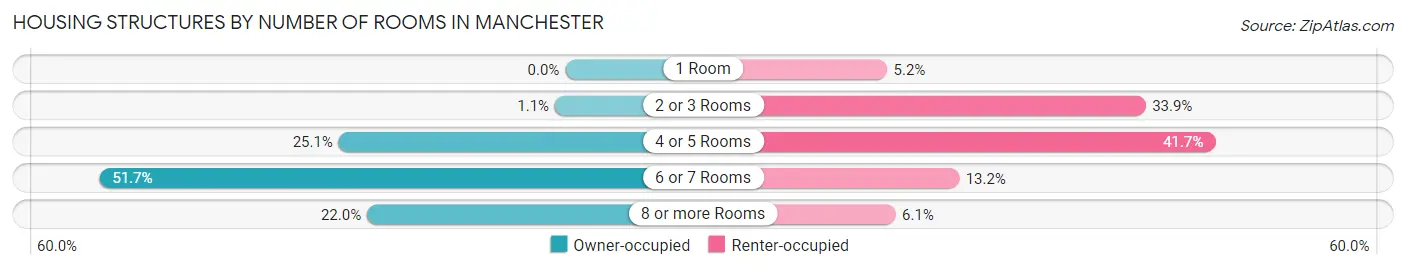
| Number of Rooms | Owner-occupied | Renter-occupied |
| 1 Room | 0 (0.0%) | 22 (5.2%) |
| 2 or 3 Rooms | 4 (1.1%) | 144 (33.9%) |
| 4 or 5 Rooms | 88 (25.1%) | 177 (41.6%) |
| 6 or 7 Rooms | 181 (51.7%) | 56 (13.2%) |
| 8 or more Rooms | 77 (22.0%) | 26 (6.1%) |
| Total | 350 (100.0%) | 425 (100.0%) |
Housing Structure by Heating Type in Manchester
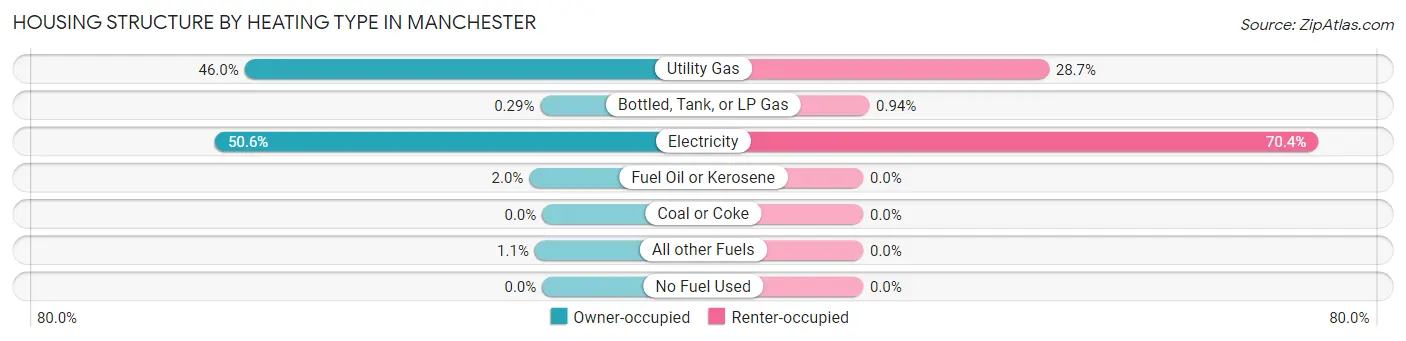
| Heating Type | Owner-occupied | Renter-occupied |
| Utility Gas | 161 (46.0%) | 122 (28.7%) |
| Bottled, Tank, or LP Gas | 1 (0.3%) | 4 (0.9%) |
| Electricity | 177 (50.6%) | 299 (70.4%) |
| Fuel Oil or Kerosene | 7 (2.0%) | 0 (0.0%) |
| Coal or Coke | 0 (0.0%) | 0 (0.0%) |
| All other Fuels | 4 (1.1%) | 0 (0.0%) |
| No Fuel Used | 0 (0.0%) | 0 (0.0%) |
| Total | 350 (100.0%) | 425 (100.0%) |
Household Vehicle Usage in Manchester
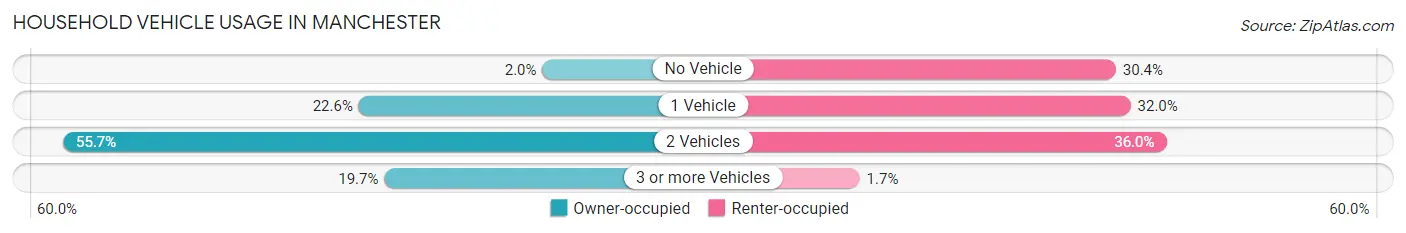
| Vehicles per Household | Owner-occupied | Renter-occupied |
| No Vehicle | 7 (2.0%) | 129 (30.3%) |
| 1 Vehicle | 79 (22.6%) | 136 (32.0%) |
| 2 Vehicles | 195 (55.7%) | 153 (36.0%) |
| 3 or more Vehicles | 69 (19.7%) | 7 (1.7%) |
| Total | 350 (100.0%) | 425 (100.0%) |
Real Estate & Mortgages in Manchester
Real Estate and Mortgage Overview in Manchester
| Characteristic | Without Mortgage | With Mortgage |
| Housing Units | 235 | 115 |
| Median Property Value | $102,100 | $97,200 |
| Median Household Income | $70,625 | $0 |
| Monthly Housing Costs | $339 | $0 |
| Real Estate Taxes | $577 | $0 |
Property Value by Mortgage Status in Manchester
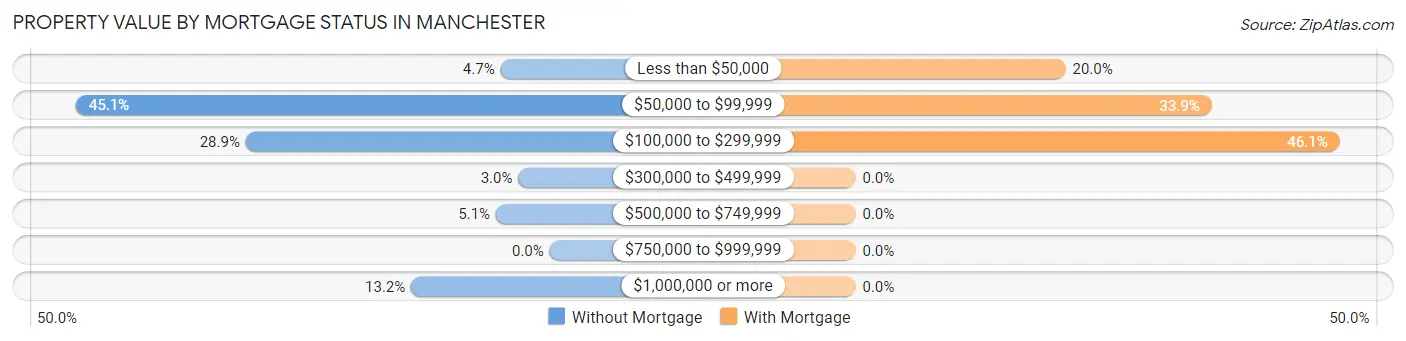
| Property Value | Without Mortgage | With Mortgage |
| Less than $50,000 | 11 (4.7%) | 23 (20.0%) |
| $50,000 to $99,999 | 106 (45.1%) | 39 (33.9%) |
| $100,000 to $299,999 | 68 (28.9%) | 53 (46.1%) |
| $300,000 to $499,999 | 7 (3.0%) | 0 (0.0%) |
| $500,000 to $749,999 | 12 (5.1%) | 0 (0.0%) |
| $750,000 to $999,999 | 0 (0.0%) | 0 (0.0%) |
| $1,000,000 or more | 31 (13.2%) | 0 (0.0%) |
| Total | 235 (100.0%) | 115 (100.0%) |
Household Income by Mortgage Status in Manchester
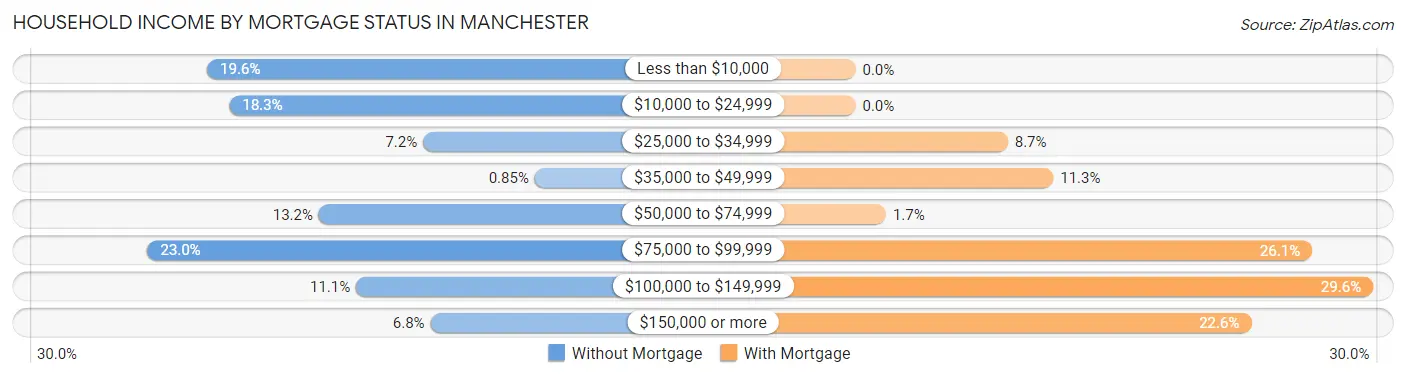
| Household Income | Without Mortgage | With Mortgage |
| Less than $10,000 | 46 (19.6%) | 0 (0.0%) |
| $10,000 to $24,999 | 43 (18.3%) | 0 (0.0%) |
| $25,000 to $34,999 | 17 (7.2%) | 10 (8.7%) |
| $35,000 to $49,999 | 2 (0.9%) | 13 (11.3%) |
| $50,000 to $74,999 | 31 (13.2%) | 2 (1.7%) |
| $75,000 to $99,999 | 54 (23.0%) | 30 (26.1%) |
| $100,000 to $149,999 | 26 (11.1%) | 34 (29.6%) |
| $150,000 or more | 16 (6.8%) | 26 (22.6%) |
| Total | 235 (100.0%) | 115 (100.0%) |
Property Value to Household Income Ratio in Manchester
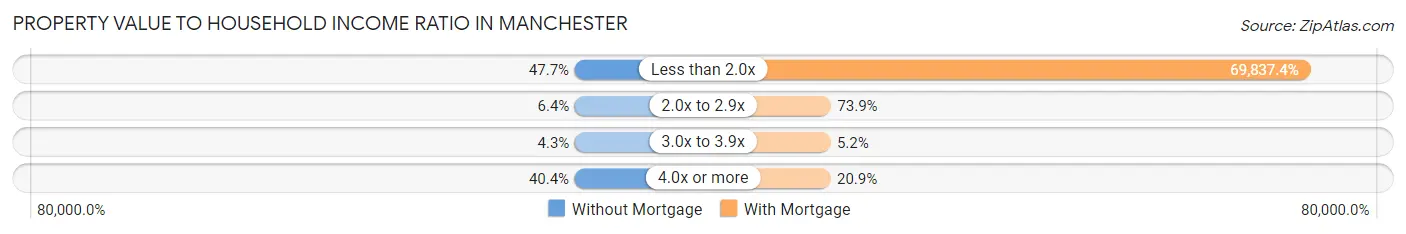
| Value-to-Income Ratio | Without Mortgage | With Mortgage |
| Less than 2.0x | 112 (47.7%) | 80,313 (69,837.4%) |
| 2.0x to 2.9x | 15 (6.4%) | 85 (73.9%) |
| 3.0x to 3.9x | 10 (4.3%) | 6 (5.2%) |
| 4.0x or more | 95 (40.4%) | 24 (20.9%) |
| Total | 235 (100.0%) | 115 (100.0%) |
Real Estate Taxes by Mortgage Status in Manchester
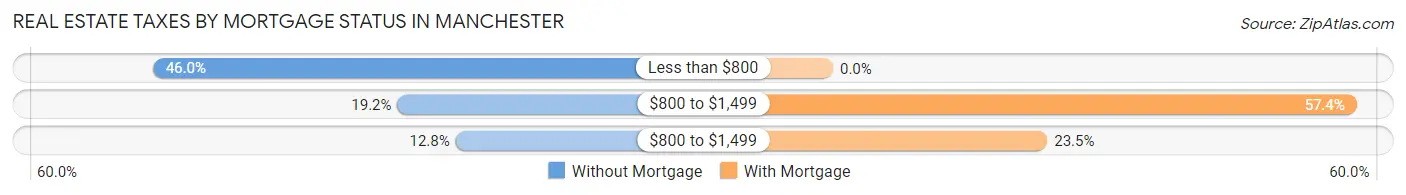
| Property Taxes | Without Mortgage | With Mortgage |
| Less than $800 | 108 (46.0%) | 0 (0.0%) |
| $800 to $1,499 | 45 (19.2%) | 66 (57.4%) |
| $800 to $1,499 | 30 (12.8%) | 27 (23.5%) |
| Total | 235 (100.0%) | 115 (100.0%) |
Health & Disability in Manchester
Health Insurance Coverage by Age in Manchester
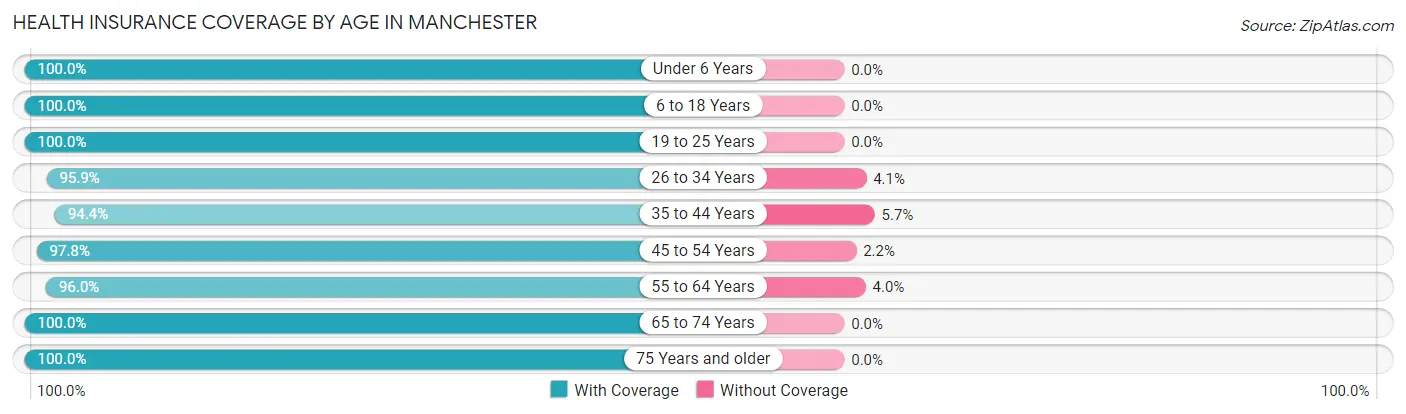
| Age Bracket | With Coverage | Without Coverage |
| Under 6 Years | 170 (100.0%) | 0 (0.0%) |
| 6 to 18 Years | 259 (100.0%) | 0 (0.0%) |
| 19 to 25 Years | 158 (100.0%) | 0 (0.0%) |
| 26 to 34 Years | 423 (95.9%) | 18 (4.1%) |
| 35 to 44 Years | 317 (94.4%) | 19 (5.7%) |
| 45 to 54 Years | 220 (97.8%) | 5 (2.2%) |
| 55 to 64 Years | 241 (96.0%) | 10 (4.0%) |
| 65 to 74 Years | 266 (100.0%) | 0 (0.0%) |
| 75 Years and older | 89 (100.0%) | 0 (0.0%) |
| Total | 2,143 (97.6%) | 52 (2.4%) |
Health Insurance Coverage by Citizenship Status in Manchester
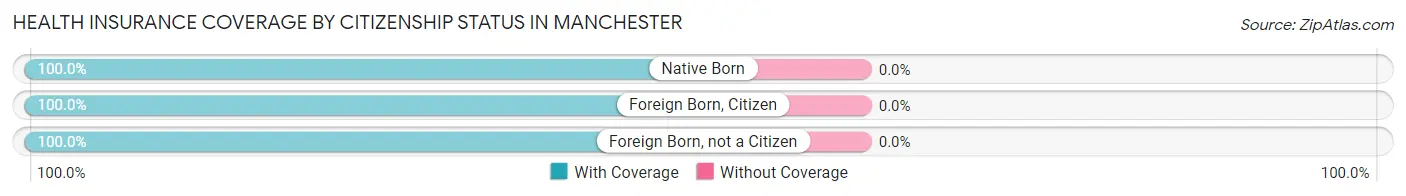
| Citizenship Status | With Coverage | Without Coverage |
| Native Born | 170 (100.0%) | 0 (0.0%) |
| Foreign Born, Citizen | 259 (100.0%) | 0 (0.0%) |
| Foreign Born, not a Citizen | 158 (100.0%) | 0 (0.0%) |
Health Insurance Coverage by Household Income in Manchester
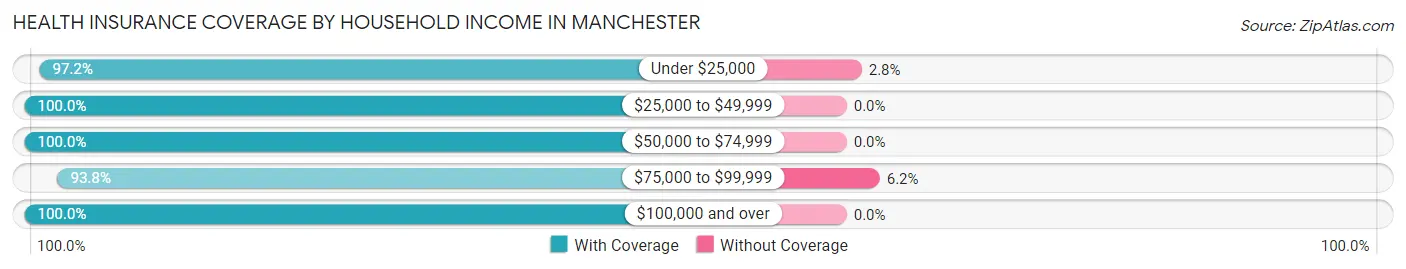
| Household Income | With Coverage | Without Coverage |
| Under $25,000 | 900 (97.2%) | 26 (2.8%) |
| $25,000 to $49,999 | 322 (100.0%) | 0 (0.0%) |
| $50,000 to $74,999 | 189 (100.0%) | 0 (0.0%) |
| $75,000 to $99,999 | 395 (93.8%) | 26 (6.2%) |
| $100,000 and over | 329 (100.0%) | 0 (0.0%) |
Public vs Private Health Insurance Coverage by Age in Manchester
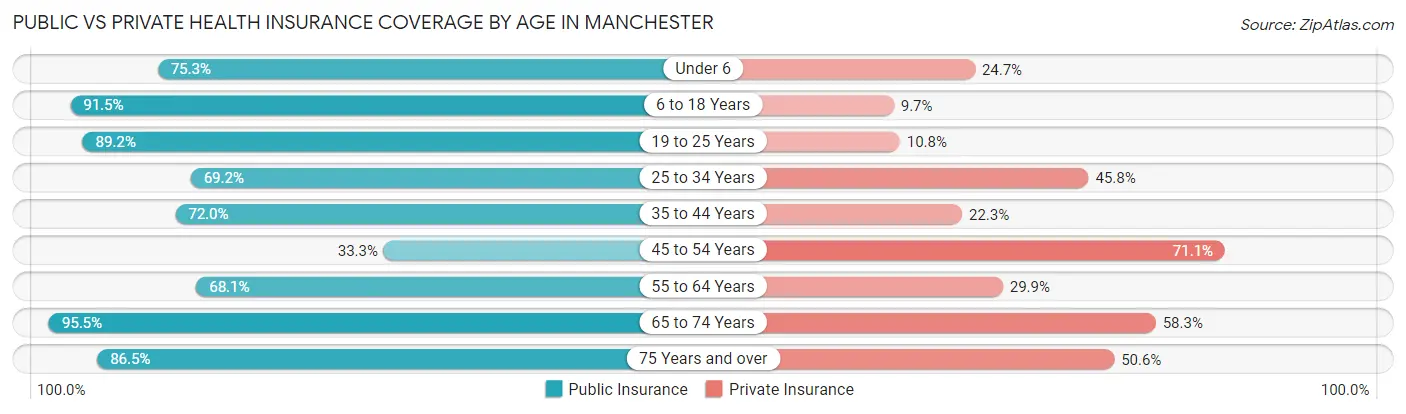
| Age Bracket | Public Insurance | Private Insurance |
| Under 6 | 128 (75.3%) | 42 (24.7%) |
| 6 to 18 Years | 237 (91.5%) | 25 (9.7%) |
| 19 to 25 Years | 141 (89.2%) | 17 (10.8%) |
| 25 to 34 Years | 305 (69.2%) | 202 (45.8%) |
| 35 to 44 Years | 242 (72.0%) | 75 (22.3%) |
| 45 to 54 Years | 75 (33.3%) | 160 (71.1%) |
| 55 to 64 Years | 171 (68.1%) | 75 (29.9%) |
| 65 to 74 Years | 254 (95.5%) | 155 (58.3%) |
| 75 Years and over | 77 (86.5%) | 45 (50.6%) |
| Total | 1,630 (74.3%) | 796 (36.3%) |
Disability Status by Sex by Age in Manchester
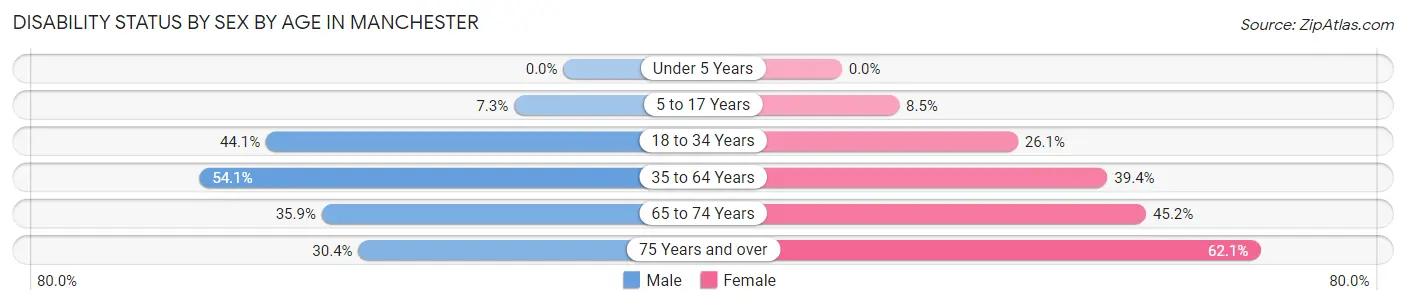
| Age Bracket | Male | Female |
| Under 5 Years | 0 (0.0%) | 0 (0.0%) |
| 5 to 17 Years | 12 (7.3%) | 8 (8.5%) |
| 18 to 34 Years | 143 (44.1%) | 75 (26.1%) |
| 35 to 64 Years | 247 (54.0%) | 140 (39.4%) |
| 65 to 74 Years | 47 (35.9%) | 61 (45.2%) |
| 75 Years and over | 7 (30.4%) | 41 (62.1%) |
Disability Class by Sex by Age in Manchester
Disability Class: Hearing Difficulty
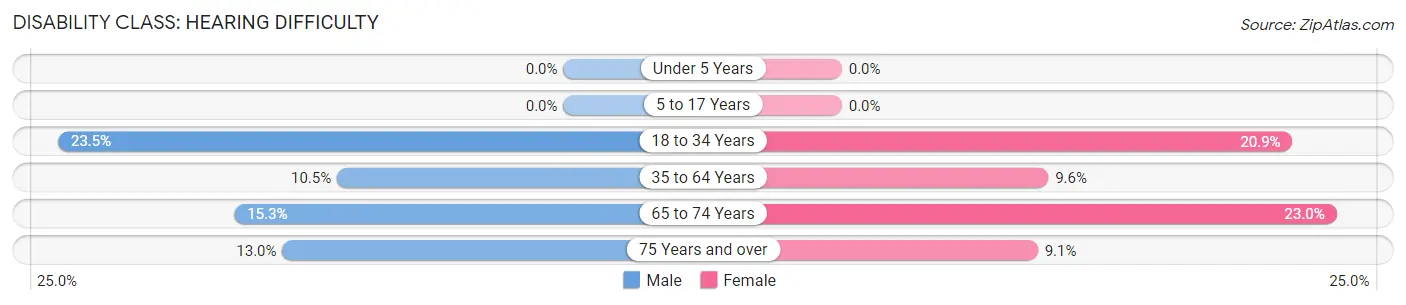
| Age Bracket | Male | Female |
| Under 5 Years | 0 (0.0%) | 0 (0.0%) |
| 5 to 17 Years | 0 (0.0%) | 0 (0.0%) |
| 18 to 34 Years | 76 (23.5%) | 60 (20.9%) |
| 35 to 64 Years | 48 (10.5%) | 34 (9.6%) |
| 65 to 74 Years | 20 (15.3%) | 31 (23.0%) |
| 75 Years and over | 3 (13.0%) | 6 (9.1%) |
Disability Class: Vision Difficulty
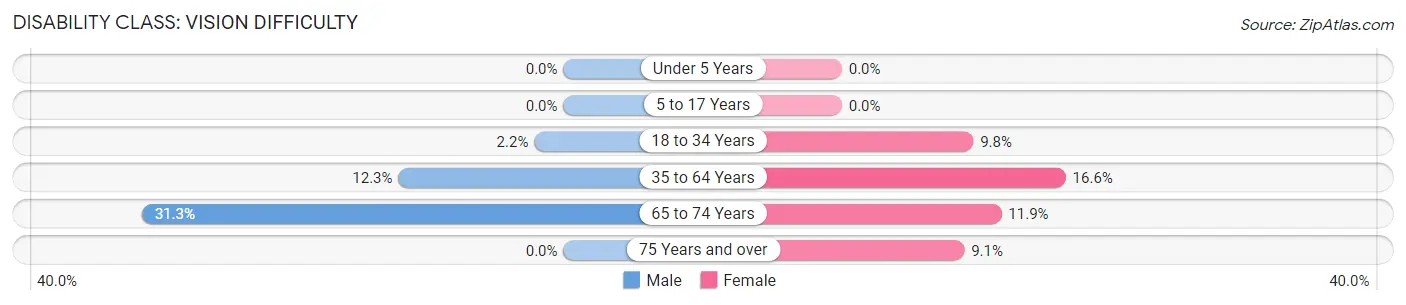
| Age Bracket | Male | Female |
| Under 5 Years | 0 (0.0%) | 0 (0.0%) |
| 5 to 17 Years | 0 (0.0%) | 0 (0.0%) |
| 18 to 34 Years | 7 (2.2%) | 28 (9.8%) |
| 35 to 64 Years | 56 (12.2%) | 59 (16.6%) |
| 65 to 74 Years | 41 (31.3%) | 16 (11.8%) |
| 75 Years and over | 0 (0.0%) | 6 (9.1%) |
Disability Class: Cognitive Difficulty
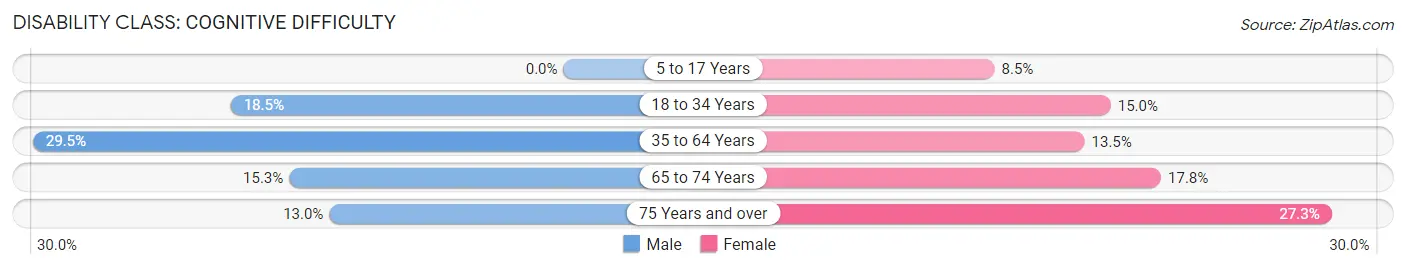
| Age Bracket | Male | Female |
| 5 to 17 Years | 0 (0.0%) | 8 (8.5%) |
| 18 to 34 Years | 60 (18.5%) | 43 (15.0%) |
| 35 to 64 Years | 135 (29.5%) | 48 (13.5%) |
| 65 to 74 Years | 20 (15.3%) | 24 (17.8%) |
| 75 Years and over | 3 (13.0%) | 18 (27.3%) |
Disability Class: Ambulatory Difficulty
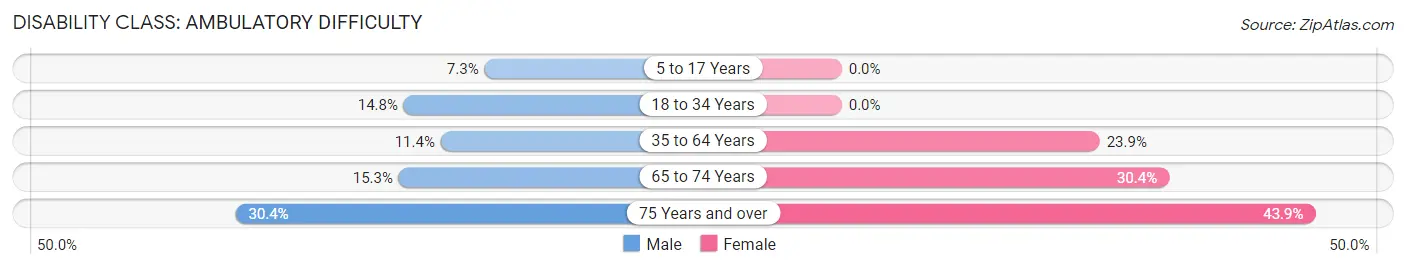
| Age Bracket | Male | Female |
| 5 to 17 Years | 12 (7.3%) | 0 (0.0%) |
| 18 to 34 Years | 48 (14.8%) | 0 (0.0%) |
| 35 to 64 Years | 52 (11.4%) | 85 (23.9%) |
| 65 to 74 Years | 20 (15.3%) | 41 (30.4%) |
| 75 Years and over | 7 (30.4%) | 29 (43.9%) |
Disability Class: Self-Care Difficulty
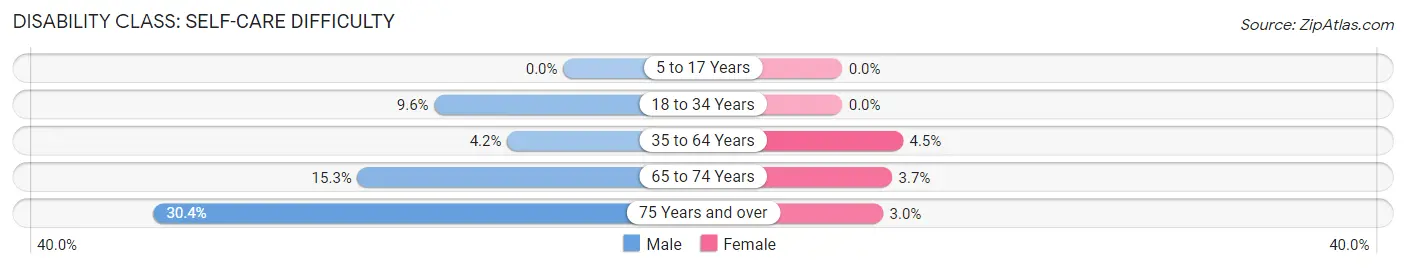
| Age Bracket | Male | Female |
| 5 to 17 Years | 0 (0.0%) | 0 (0.0%) |
| 18 to 34 Years | 31 (9.6%) | 0 (0.0%) |
| 35 to 64 Years | 19 (4.2%) | 16 (4.5%) |
| 65 to 74 Years | 20 (15.3%) | 5 (3.7%) |
| 75 Years and over | 7 (30.4%) | 2 (3.0%) |
Technology Access in Manchester
Computing Device Access in Manchester
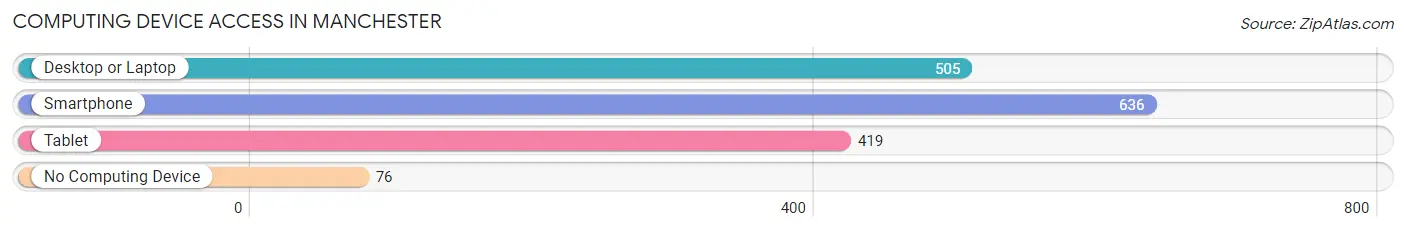
| Device Type | # Households | % Households |
| Desktop or Laptop | 505 | 65.2% |
| Smartphone | 636 | 82.1% |
| Tablet | 419 | 54.1% |
| No Computing Device | 76 | 9.8% |
| Total | 775 | 100.0% |
Internet Access in Manchester
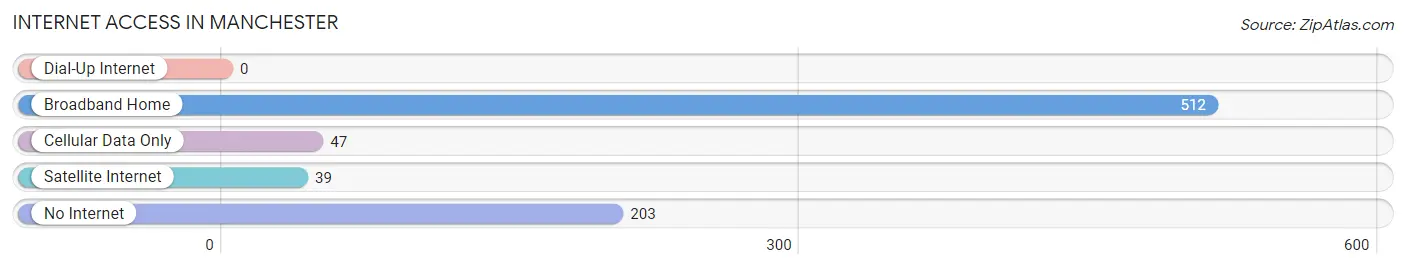
| Internet Type | # Households | % Households |
| Dial-Up Internet | 0 | 0.0% |
| Broadband Home | 512 | 66.1% |
| Cellular Data Only | 47 | 6.1% |
| Satellite Internet | 39 | 5.0% |
| No Internet | 203 | 26.2% |
| Total | 775 | 100.0% |
Manchester Summary
Manchester is a city located in Clay County, Kentucky, United States. It is the county seat of Clay County and the population was 1,841 at the 2010 census. The city is located in the foothills of the Appalachian Mountains and is part of the Appalachian Regional Commission.
History
The area that is now Manchester was first settled in the early 1800s by a group of settlers from Virginia. The town was originally known as Clay Court House, and was later renamed Manchester in 1854. The name was chosen to honor the city of Manchester, England.
The city was incorporated in 1867 and was the county seat of Clay County. The city was a major center for the timber industry in the late 19th and early 20th centuries. The city was also home to a large number of coal mines, which provided employment for many of the city's residents.
Geography
Manchester is located in the foothills of the Appalachian Mountains in southeastern Kentucky. The city is situated at the confluence of the North and South Forks of the Kentucky River. The city is located approximately 50 miles southeast of Lexington, Kentucky and approximately 100 miles north of Knoxville, Tennessee.
The city has a total area of 2.2 square miles, all of which is land. The city is located at an elevation of 890 feet above sea level.
Economy
Manchester's economy is largely based on agriculture and tourism. The city is home to several farms, which produce a variety of crops, including corn, soybeans, and tobacco. The city is also home to several tourist attractions, including the Clay County Historical Museum, the Clay County Courthouse, and the Manchester Historic District.
The city is also home to several manufacturing companies, including a furniture manufacturer, a plastics manufacturer, and a metal fabrication company.
Demographics
As of the 2010 census, there were 1,841 people, 745 households, and 486 families residing in the city. The population density was 830.2 people per square mile. The racial makeup of the city was 95.2% White, 0.7% African American, 0.2% Native American, 0.2% Asian, 0.1% Pacific Islander, 1.2% from other races, and 2.6% from two or more races. Hispanic or Latino of any race were 2.7% of the population.
The median income for a household in the city was $25,000, and the median income for a family was $31,250. The per capita income for the city was $14,845. About 18.2% of families and 22.2% of the population were below the poverty line, including 28.3% of those under age 18 and 16.2% of those age 65 or over.
Manchester is served by the Clay County School District, which includes two elementary schools, one middle school, and one high school. The city is also home to a branch of the University of Kentucky.
Common Questions
What is Per Capita Income in Manchester?
Per Capita income in Manchester is $19,003.
What is the Median Family Income in Manchester?
Median Family Income in Manchester is $40,972.
What is the Median Household income in Manchester?
Median Household Income in Manchester is $30,474.
What is Income or Wage Gap in Manchester?
Income or Wage Gap in Manchester is 12.2%.
Women in Manchester earn 87.8 cents for every dollar earned by a man.
What is Family Income Deficit in Manchester?
Family Income Deficit in Manchester is $12,185.
Families that are below poverty line in Manchester earn $12,185 less on average than the poverty threshold level.
What is Inequality or Gini Index in Manchester?
Inequality or Gini Index in Manchester is 0.54.
What is the Total Population of Manchester?
Total Population of Manchester is 2,195.
What is the Total Male Population of Manchester?
Total Male Population of Manchester is 1,145.
What is the Total Female Population of Manchester?
Total Female Population of Manchester is 1,050.
What is the Ratio of Males per 100 Females in Manchester?
There are 109.05 Males per 100 Females in Manchester.
What is the Ratio of Females per 100 Males in Manchester?
There are 91.70 Females per 100 Males in Manchester.
What is the Median Population Age in Manchester?
Median Population Age in Manchester is 40.8 Years.
What is the Average Family Size in Manchester
Average Family Size in Manchester is 3.7 People.
What is the Average Household Size in Manchester
Average Household Size in Manchester is 2.8 People.
How Large is the Labor Force in Manchester?
There are 786 People in the Labor Forcein in Manchester.
What is the Percentage of People in the Labor Force in Manchester?
43.5% of People are in the Labor Force in Manchester.
What is the Unemployment Rate in Manchester?
Unemployment Rate in Manchester is 3.6%.