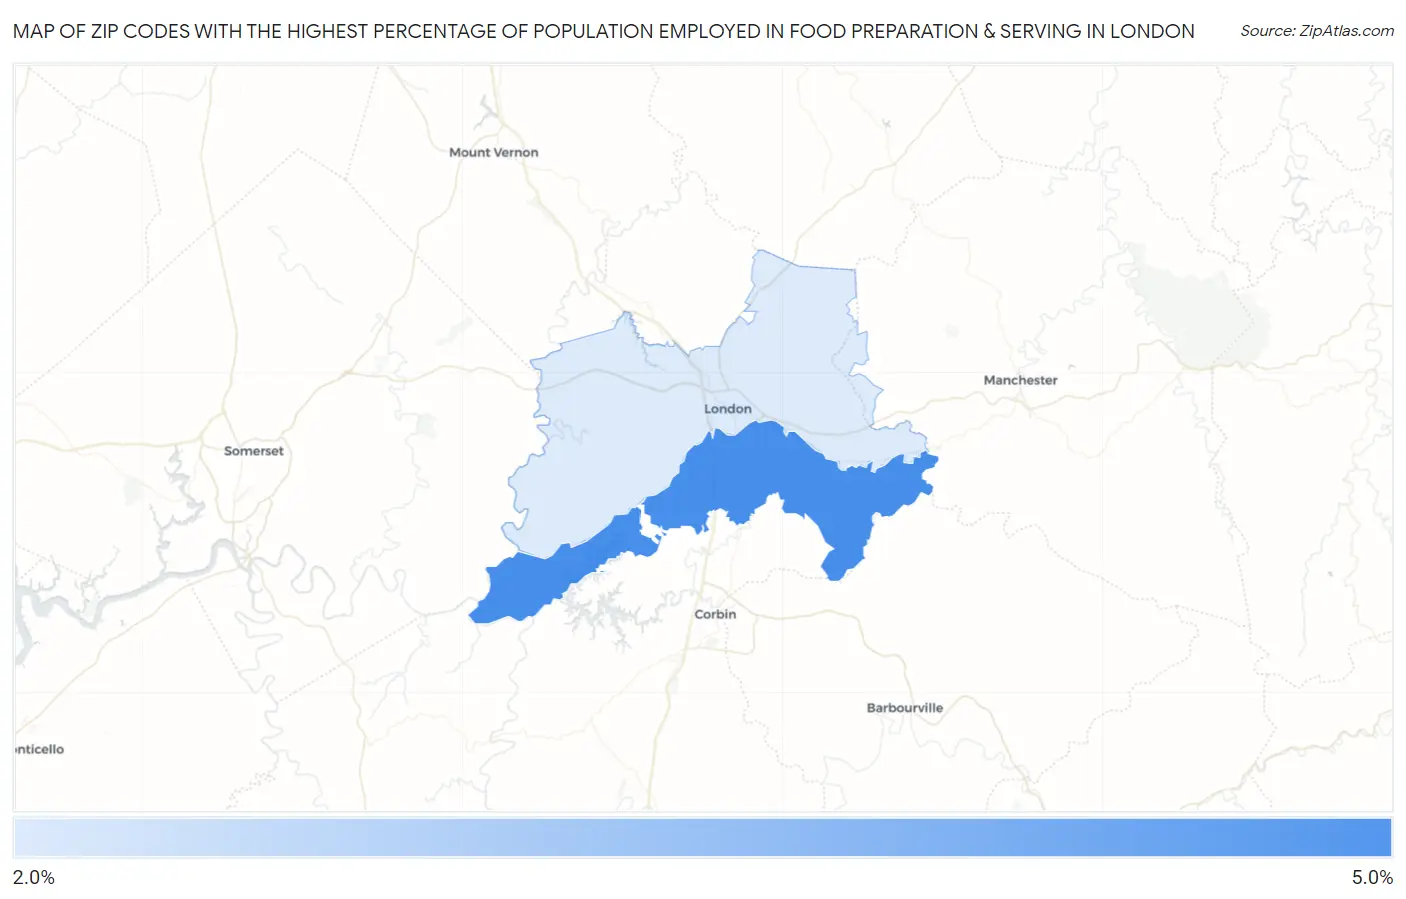
Zip Codes with the Highest Percentage of Population Employed in Food Preparation & Serving in London, KY
RELATED REPORTS & OPTIONS
Food Preparation & Serving
London
Compare Zip Codes
Map of Zip Codes with the Highest Percentage of Population Employed in Food Preparation & Serving in London
2.9%
4.4%
Zip Codes with the Highest Percentage of Population Employed in Food Preparation & Serving in London, KY
| Zip Code | % Employed | vs State | vs National | |
| 1. | 40744 | 4.4% | 5.1%(-0.722)#288 | 5.3%(-0.923)#15,590 |
| 2. | 40741 | 2.9% | 5.1%(-2.18)#390 | 5.3%(-2.39)#21,656 |
1
Common Questions
What are the Top Zip Codes with the Highest Percentage of Population Employed in Food Preparation & Serving in London, KY?
Top Zip Codes with the Highest Percentage of Population Employed in Food Preparation & Serving in London, KY are:
What zip code has the Highest Percentage of Population Employed in Food Preparation & Serving in London, KY?
40744 has the Highest Percentage of Population Employed in Food Preparation & Serving in London, KY with 4.4%.
What is the Percentage of Population Employed in Food Preparation & Serving in London, KY?
Percentage of Population Employed in Food Preparation & Serving in London is 2.1%.
What is the Percentage of Population Employed in Food Preparation & Serving in Kentucky?
Percentage of Population Employed in Food Preparation & Serving in Kentucky is 5.1%.
What is the Percentage of Population Employed in Food Preparation & Serving in the United States?
Percentage of Population Employed in Food Preparation & Serving in the United States is 5.3%.