Zip Codes with the Highest Percentage of Population Employed in Food Preparation & Serving in Lexington, KY
RELATED REPORTS & OPTIONS
Food Preparation & Serving
Lexington
Compare Zip Codes
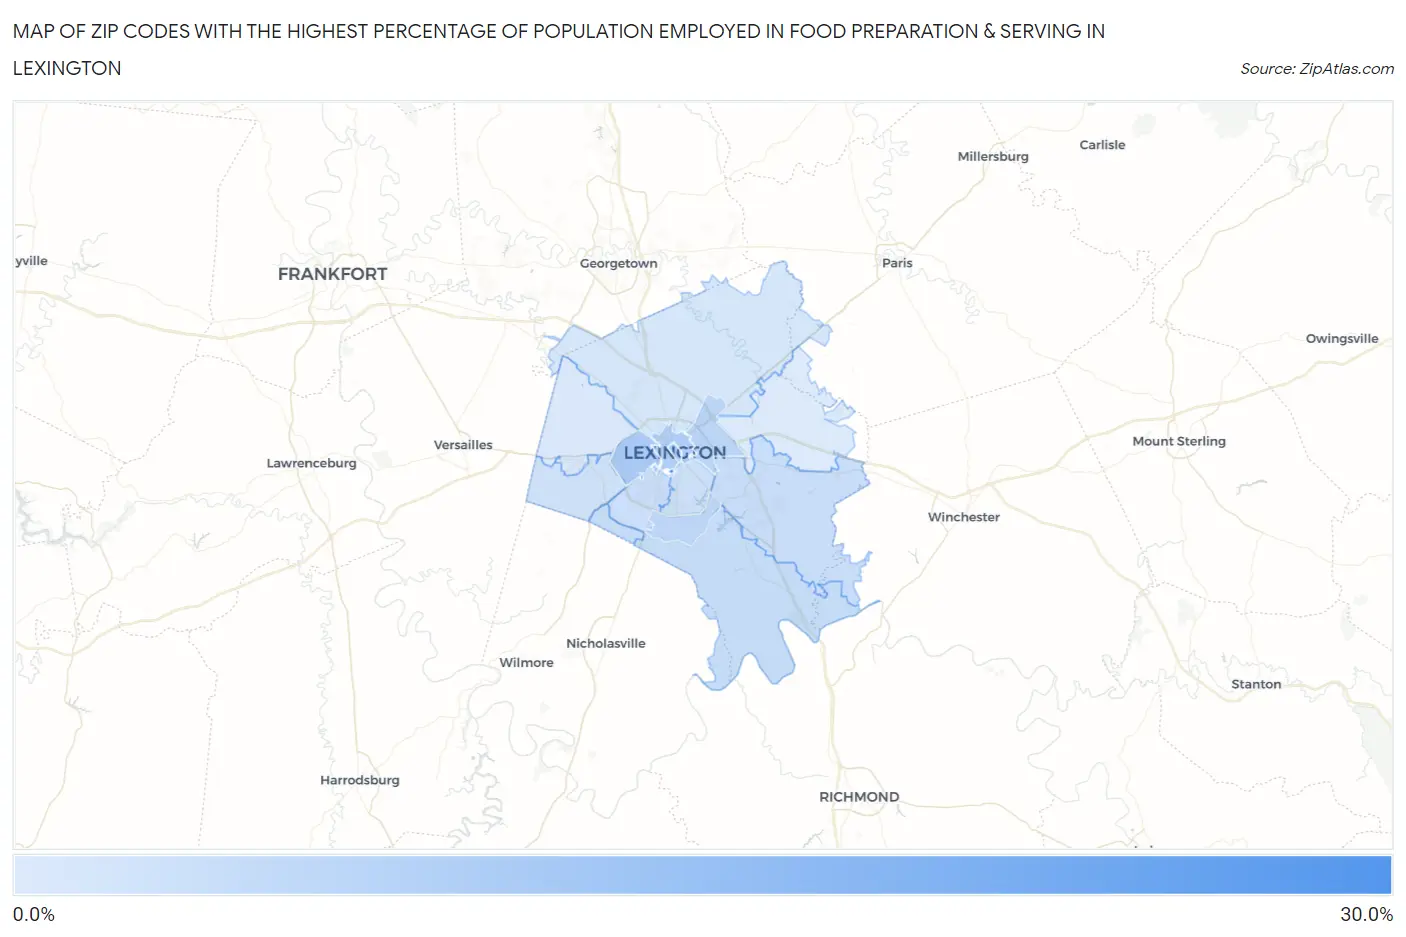
Map of Zip Codes with the Highest Percentage of Population Employed in Food Preparation & Serving in Lexington
1.9%
25.7%
Zip Codes with the Highest Percentage of Population Employed in Food Preparation & Serving in Lexington, KY
| Zip Code | % Employed | vs State | vs National | |
| 1. | 40526 | 25.7% | 5.1%(+20.6)#11 | 5.3%(+20.4)#296 |
| 2. | 40504 | 9.3% | 5.1%(+4.18)#82 | 5.3%(+3.98)#3,263 |
| 3. | 40507 | 9.1% | 5.1%(+4.06)#84 | 5.3%(+3.86)#3,376 |
| 4. | 40508 | 8.2% | 5.1%(+3.09)#117 | 5.3%(+2.89)#4,472 |
| 5. | 40505 | 6.8% | 5.1%(+1.75)#154 | 5.3%(+1.55)#6,974 |
| 6. | 40517 | 6.6% | 5.1%(+1.55)#165 | 5.3%(+1.35)#7,516 |
| 7. | 40514 | 5.2% | 5.1%(+0.162)#232 | 5.3%(-0.039)#11,968 |
| 8. | 40515 | 5.2% | 5.1%(+0.081)#239 | 5.3%(-0.120)#12,294 |
| 9. | 40509 | 4.9% | 5.1%(-0.206)#253 | 5.3%(-0.408)#13,445 |
| 10. | 40503 | 4.6% | 5.1%(-0.457)#272 | 5.3%(-0.658)#14,461 |
| 11. | 40502 | 4.1% | 5.1%(-0.961)#310 | 5.3%(-1.16)#16,602 |
| 12. | 40513 | 3.8% | 5.1%(-1.29)#330 | 5.3%(-1.49)#17,976 |
| 13. | 40511 | 2.7% | 5.1%(-2.36)#402 | 5.3%(-2.56)#22,346 |
| 14. | 40510 | 2.1% | 5.1%(-2.97)#442 | 5.3%(-3.17)#24,343 |
| 15. | 40516 | 1.9% | 5.1%(-3.19)#456 | 5.3%(-3.39)#25,004 |
1
Common Questions
What are the Top 10 Zip Codes with the Highest Percentage of Population Employed in Food Preparation & Serving in Lexington, KY?
Top 10 Zip Codes with the Highest Percentage of Population Employed in Food Preparation & Serving in Lexington, KY are:
What zip code has the Highest Percentage of Population Employed in Food Preparation & Serving in Lexington, KY?
40526 has the Highest Percentage of Population Employed in Food Preparation & Serving in Lexington, KY with 25.7%.
What is the Percentage of Population Employed in Food Preparation & Serving in Lexington, KY?
Percentage of Population Employed in Food Preparation & Serving in Lexington is 5.5%.
What is the Percentage of Population Employed in Food Preparation & Serving in Kentucky?
Percentage of Population Employed in Food Preparation & Serving in Kentucky is 5.1%.
What is the Percentage of Population Employed in Food Preparation & Serving in the United States?
Percentage of Population Employed in Food Preparation & Serving in the United States is 5.3%.