Olive Hill, KY Map & Demographics
Olive Hill Map
Olive Hill Overview
$30,694
PER CAPITA INCOME
$74,448
AVG FAMILY INCOME
$55,000
AVG HOUSEHOLD INCOME
36.1%
WAGE / INCOME GAP [ % ]
63.9¢/ $1
WAGE / INCOME GAP [ $ ]
0.45
INEQUALITY / GINI INDEX
1,545
TOTAL POPULATION
767
MALE POPULATION
778
FEMALE POPULATION
98.59
MALES / 100 FEMALES
101.43
FEMALES / 100 MALES
54.9
MEDIAN AGE
3.0
AVG FAMILY SIZE
2.1
AVG HOUSEHOLD SIZE
696
LABOR FORCE [ PEOPLE ]
49.7%
PERCENT IN LABOR FORCE
0.9%
UNEMPLOYMENT RATE
Olive Hill Zip Codes
Olive Hill Area Codes
Income in Olive Hill
Income Overview in Olive Hill
Per Capita Income in Olive Hill is $30,694, while median incomes of families and households are $74,448 and $55,000 respectively.
| Characteristic | Number | Measure |
| Per Capita Income | 1,545 | $30,694 |
| Median Family Income | 370 | $74,448 |
| Mean Family Income | 370 | $85,141 |
| Median Household Income | 724 | $55,000 |
| Mean Household Income | 724 | $63,657 |
| Income Deficit | 370 | $0 |
| Wage / Income Gap (%) | 1,545 | 36.08% |
| Wage / Income Gap ($) | 1,545 | 63.92¢ per $1 |
| Gini / Inequality Index | 1,545 | 0.45 |
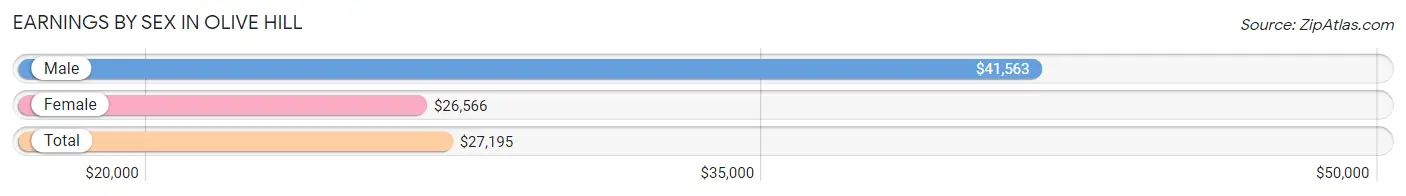
Earnings by Sex in Olive Hill
Average Earnings in Olive Hill are $27,195, $41,563 for men and $26,566 for women, a difference of 36.1%.
| Sex | Number | Average Earnings |
| Male | 451 (61.5%) | $41,563 |
| Female | 282 (38.5%) | $26,566 |
| Total | 733 (100.0%) | $27,195 |
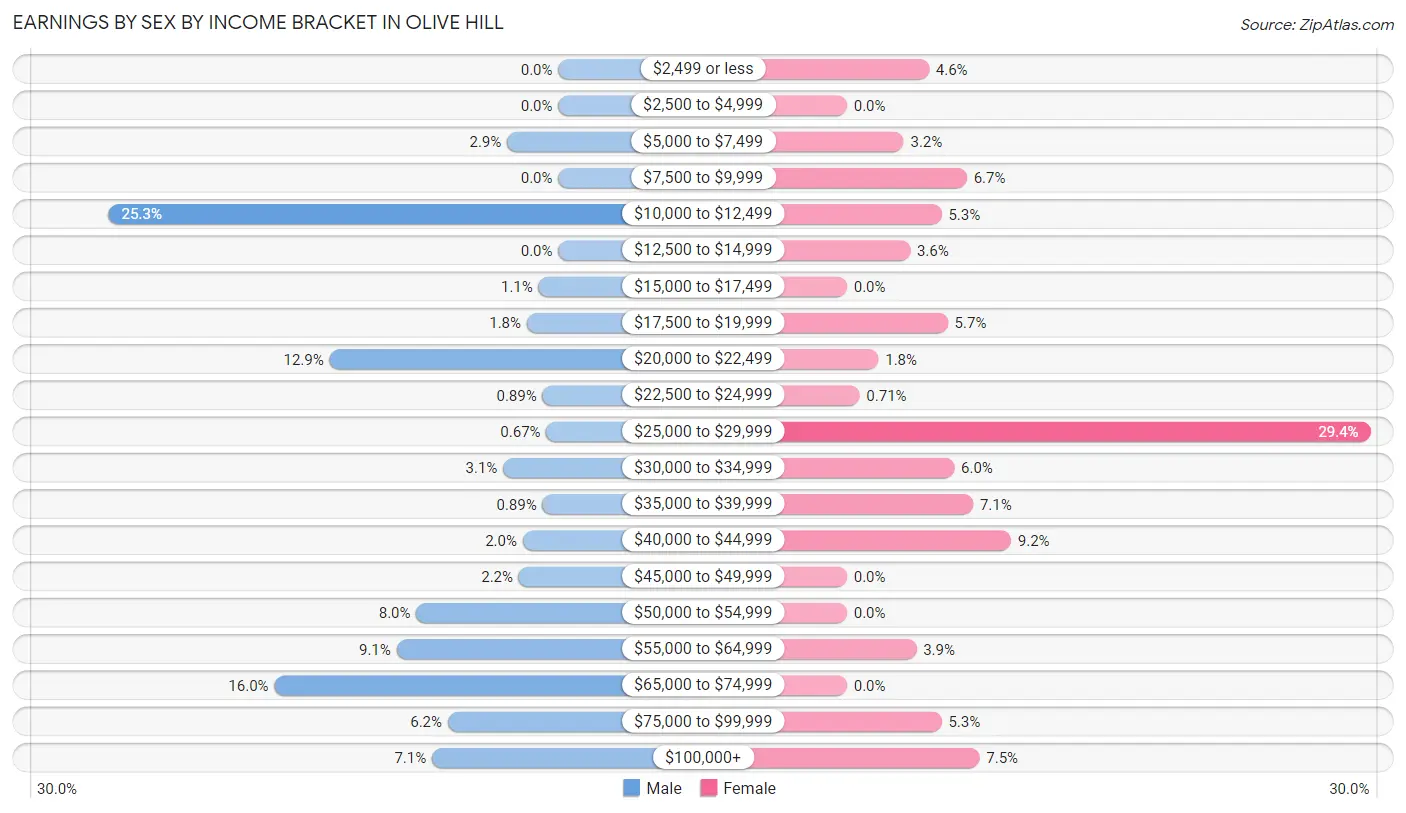
Earnings by Sex by Income Bracket in Olive Hill
The most common earnings brackets in Olive Hill are $10,000 to $12,499 for men (114 | 25.3%) and $25,000 to $29,999 for women (83 | 29.4%).
| Income | Male | Female |
| $2,499 or less | 0 (0.0%) | 13 (4.6%) |
| $2,500 to $4,999 | 0 (0.0%) | 0 (0.0%) |
| $5,000 to $7,499 | 13 (2.9%) | 9 (3.2%) |
| $7,500 to $9,999 | 0 (0.0%) | 19 (6.7%) |
| $10,000 to $12,499 | 114 (25.3%) | 15 (5.3%) |
| $12,500 to $14,999 | 0 (0.0%) | 10 (3.5%) |
| $15,000 to $17,499 | 5 (1.1%) | 0 (0.0%) |
| $17,500 to $19,999 | 8 (1.8%) | 16 (5.7%) |
| $20,000 to $22,499 | 58 (12.9%) | 5 (1.8%) |
| $22,500 to $24,999 | 4 (0.9%) | 2 (0.7%) |
| $25,000 to $29,999 | 3 (0.7%) | 83 (29.4%) |
| $30,000 to $34,999 | 14 (3.1%) | 17 (6.0%) |
| $35,000 to $39,999 | 4 (0.9%) | 20 (7.1%) |
| $40,000 to $44,999 | 9 (2.0%) | 26 (9.2%) |
| $45,000 to $49,999 | 10 (2.2%) | 0 (0.0%) |
| $50,000 to $54,999 | 36 (8.0%) | 0 (0.0%) |
| $55,000 to $64,999 | 41 (9.1%) | 11 (3.9%) |
| $65,000 to $74,999 | 72 (16.0%) | 0 (0.0%) |
| $75,000 to $99,999 | 28 (6.2%) | 15 (5.3%) |
| $100,000+ | 32 (7.1%) | 21 (7.4%) |
| Total | 451 (100.0%) | 282 (100.0%) |
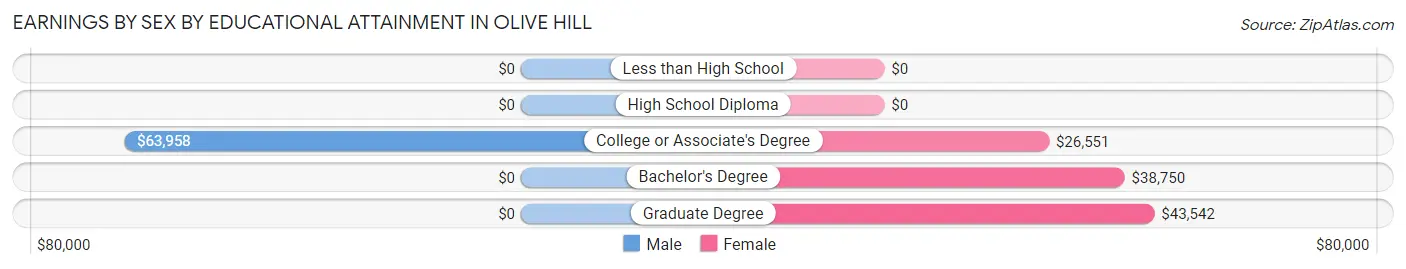
Earnings by Sex by Educational Attainment in Olive Hill
Average earnings in Olive Hill are $46,125 for men and $26,792 for women, a difference of 41.9%. Men with an educational attainment of college or associate's degree enjoy the highest average annual earnings of $63,958, while those with college or associate's degree education earn the least with $63,958. Women with an educational attainment of graduate degree earn the most with the average annual earnings of $43,542, while those with college or associate's degree education have the smallest earnings of $26,551.
| Educational Attainment | Male Income | Female Income |
| Less than High School | - | - |
| High School Diploma | - | - |
| College or Associate's Degree | $63,958 | $26,551 |
| Bachelor's Degree | - | - |
| Graduate Degree | - | - |
| Total | $46,125 | $26,792 |
Family Income in Olive Hill
Family Income Brackets in Olive Hill
According to the Olive Hill family income data, there are 123 families falling into the $50,000 to $74,999 income range, which is the most common income bracket and makes up 33.2% of all families.
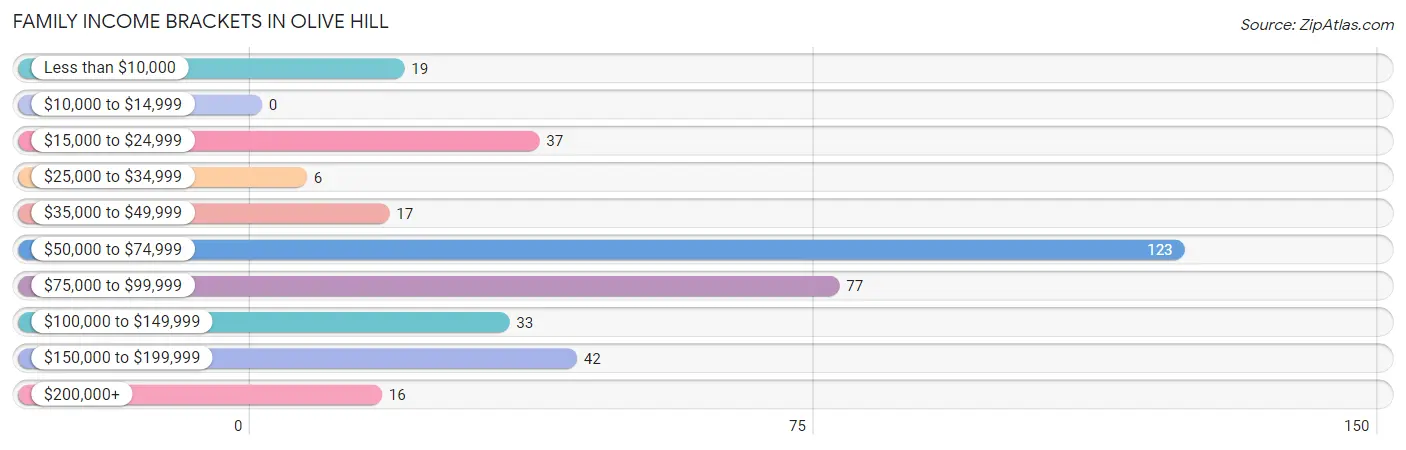
| Income Bracket | # Families | % Families |
| Less than $10,000 | 19 | 5.1% |
| $10,000 to $14,999 | 0 | 0.0% |
| $15,000 to $24,999 | 37 | 10.0% |
| $25,000 to $34,999 | 6 | 1.6% |
| $35,000 to $49,999 | 17 | 4.6% |
| $50,000 to $74,999 | 123 | 33.2% |
| $75,000 to $99,999 | 77 | 20.8% |
| $100,000 to $149,999 | 33 | 8.9% |
| $150,000 to $199,999 | 42 | 11.4% |
| $200,000+ | 16 | 4.3% |
Family Income by Famaliy Size in Olive Hill
2-person families (198 | 53.5%) account for the highest median family income in Olive Hill with $86,071 per family, while 2-person families (198 | 53.5%) have the highest median income of $43,036 per family member.
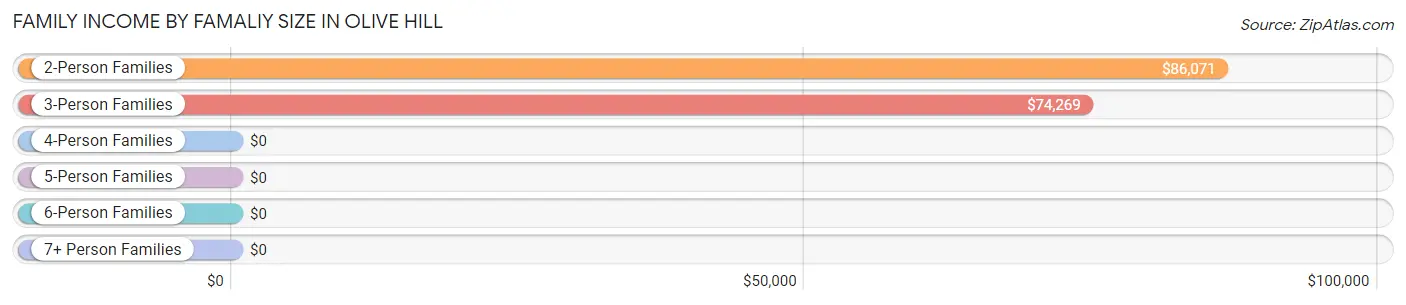
| Income Bracket | # Families | Median Income |
| 2-Person Families | 198 (53.5%) | $86,071 |
| 3-Person Families | 143 (38.7%) | $74,269 |
| 4-Person Families | 16 (4.3%) | $0 |
| 5-Person Families | 4 (1.1%) | $0 |
| 6-Person Families | 0 (0.0%) | $0 |
| 7+ Person Families | 9 (2.4%) | $0 |
| Total | 370 (100.0%) | $74,448 |
Family Income by Number of Earners in Olive Hill
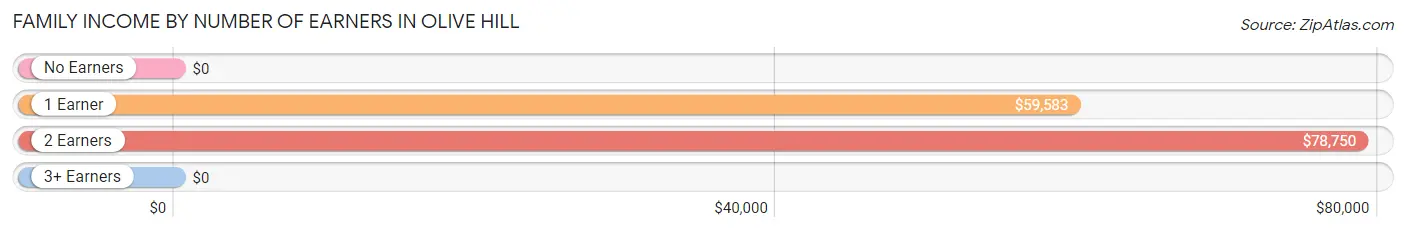
| Number of Earners | # Families | Median Income |
| No Earners | 67 (18.1%) | $0 |
| 1 Earner | 95 (25.7%) | $59,583 |
| 2 Earners | 208 (56.2%) | $78,750 |
| 3+ Earners | 0 (0.0%) | $0 |
| Total | 370 (100.0%) | $74,448 |
Household Income in Olive Hill
Household Income Brackets in Olive Hill
With 176 households falling in the category, the $50,000 to $74,999 income range is the most frequent in Olive Hill, accounting for 24.3% of all households. In contrast, only 16 households (2.2%) fall into the $200,000+ income bracket, making it the least populous group.
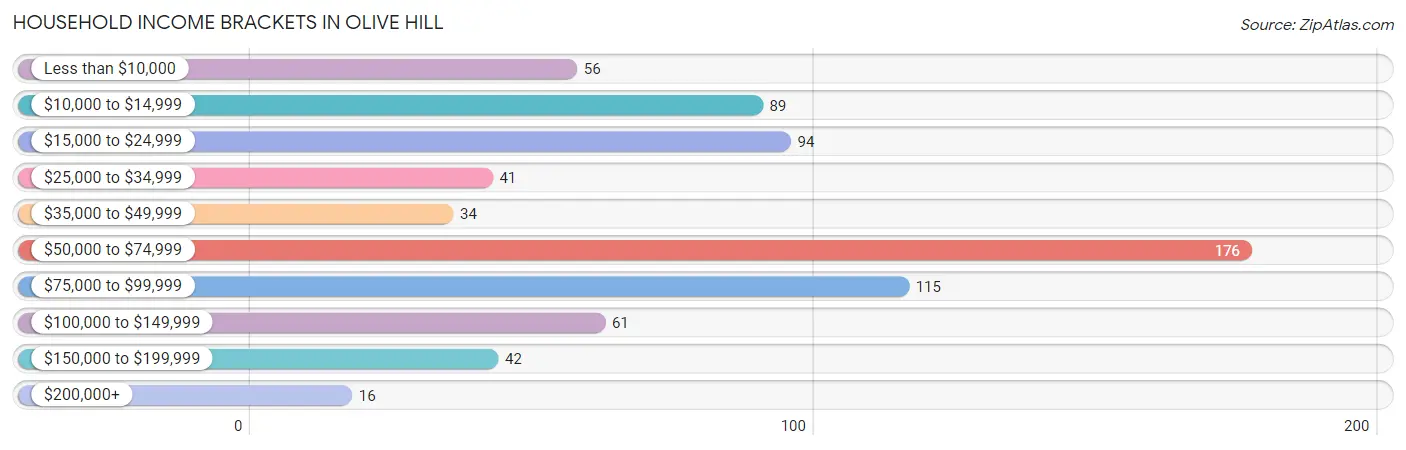
| Income Bracket | # Households | % Households |
| Less than $10,000 | 56 | 7.7% |
| $10,000 to $14,999 | 89 | 12.3% |
| $15,000 to $24,999 | 94 | 13.0% |
| $25,000 to $34,999 | 41 | 5.7% |
| $35,000 to $49,999 | 34 | 4.7% |
| $50,000 to $74,999 | 176 | 24.3% |
| $75,000 to $99,999 | 115 | 15.9% |
| $100,000 to $149,999 | 61 | 8.4% |
| $150,000 to $199,999 | 42 | 5.8% |
| $200,000+ | 16 | 2.2% |
Household Income by Householder Age in Olive Hill
The median household income in Olive Hill is $55,000, with the highest median household income of $66,250 found in the 45 to 64 years age bracket for the primary householder. A total of 212 households (29.3%) fall into this category. Meanwhile, the 15 to 24 years age bracket for the primary householder has the lowest median household income of $0, with 6 households (0.8%) in this group.
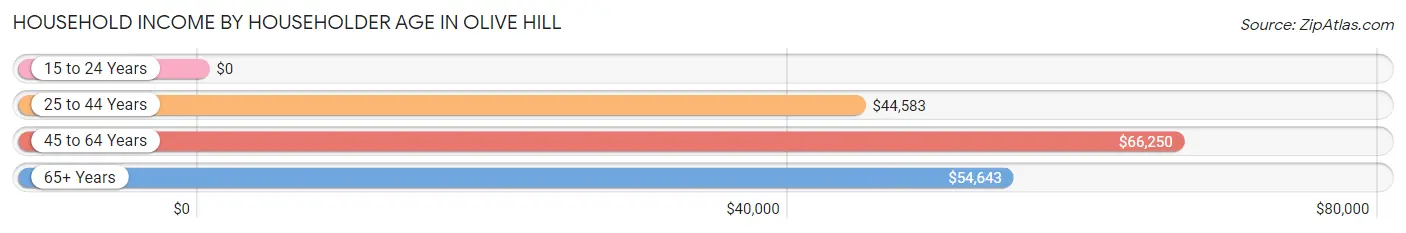
| Income Bracket | # Households | Median Income |
| 15 to 24 Years | 6 (0.8%) | $0 |
| 25 to 44 Years | 108 (14.9%) | $44,583 |
| 45 to 64 Years | 212 (29.3%) | $66,250 |
| 65+ Years | 398 (55.0%) | $54,643 |
| Total | 724 (100.0%) | $55,000 |
Poverty in Olive Hill
Income Below Poverty by Sex and Age in Olive Hill
With 12.5% poverty level for males and 23.9% for females among the residents of Olive Hill, 6 to 11 year old males and 15 year old females are the most vulnerable to poverty, with 14 males (37.8%) and 3 females (100.0%) in their respective age groups living below the poverty level.
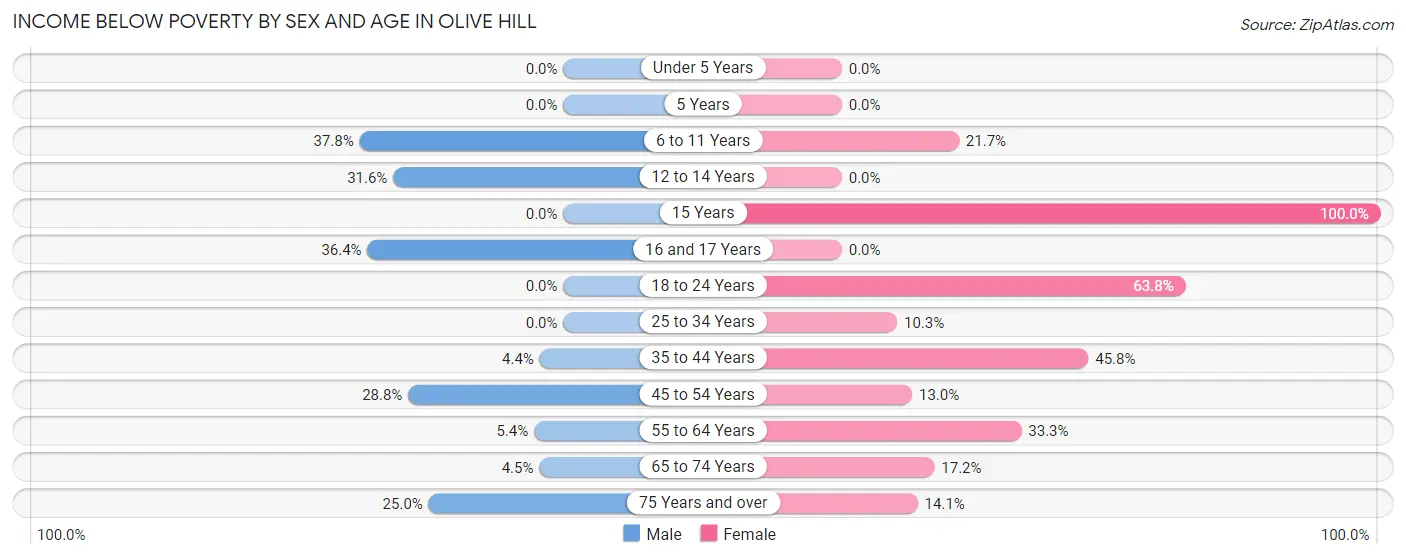
| Age Bracket | Male | Female |
| Under 5 Years | 0 (0.0%) | 0 (0.0%) |
| 5 Years | 0 (0.0%) | 0 (0.0%) |
| 6 to 11 Years | 14 (37.8%) | 10 (21.7%) |
| 12 to 14 Years | 6 (31.6%) | 0 (0.0%) |
| 15 Years | 0 (0.0%) | 3 (100.0%) |
| 16 and 17 Years | 4 (36.4%) | 0 (0.0%) |
| 18 to 24 Years | 0 (0.0%) | 37 (63.8%) |
| 25 to 34 Years | 0 (0.0%) | 4 (10.3%) |
| 35 to 44 Years | 7 (4.4%) | 27 (45.8%) |
| 45 to 54 Years | 36 (28.8%) | 12 (13.0%) |
| 55 to 64 Years | 8 (5.4%) | 38 (33.3%) |
| 65 to 74 Years | 5 (4.5%) | 45 (17.2%) |
| 75 Years and over | 16 (25.0%) | 10 (14.1%) |
| Total | 96 (12.5%) | 186 (23.9%) |
Income Above Poverty by Sex and Age in Olive Hill
According to the poverty statistics in Olive Hill, males aged under 5 years and females aged under 5 years are the age groups that are most secure financially, with 100.0% of males and 100.0% of females in these age groups living above the poverty line.
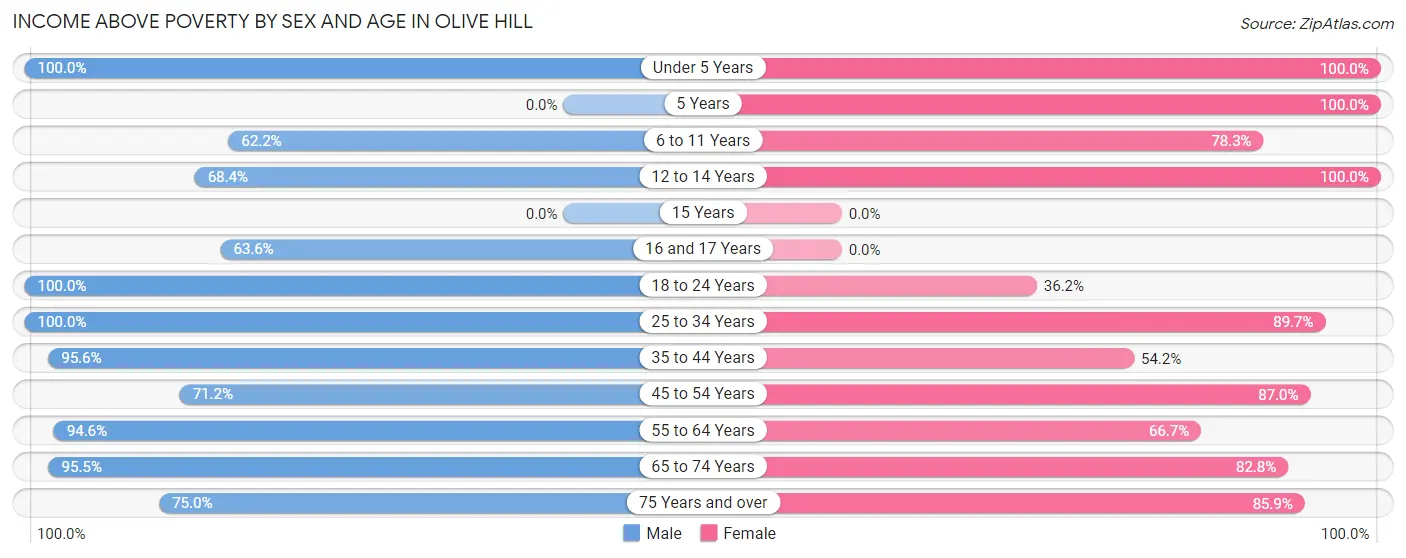
| Age Bracket | Male | Female |
| Under 5 Years | 5 (100.0%) | 7 (100.0%) |
| 5 Years | 0 (0.0%) | 5 (100.0%) |
| 6 to 11 Years | 23 (62.2%) | 36 (78.3%) |
| 12 to 14 Years | 13 (68.4%) | 22 (100.0%) |
| 15 Years | 0 (0.0%) | 0 (0.0%) |
| 16 and 17 Years | 7 (63.6%) | 0 (0.0%) |
| 18 to 24 Years | 18 (100.0%) | 21 (36.2%) |
| 25 to 34 Years | 70 (100.0%) | 35 (89.7%) |
| 35 to 44 Years | 152 (95.6%) | 32 (54.2%) |
| 45 to 54 Years | 89 (71.2%) | 80 (87.0%) |
| 55 to 64 Years | 139 (94.6%) | 76 (66.7%) |
| 65 to 74 Years | 107 (95.5%) | 217 (82.8%) |
| 75 Years and over | 48 (75.0%) | 61 (85.9%) |
| Total | 671 (87.5%) | 592 (76.1%) |
Income Below Poverty Among Married-Couple Families in Olive Hill
The poverty statistics for married-couple families in Olive Hill show that 5.0% or 14 of the total 283 families live below the poverty line. Families with 1 or 2 children have the highest poverty rate of 32.0%, comprising of 8 families. On the other hand, families with 3 or 4 children have the lowest poverty rate of 0.0%, which includes 0 families.
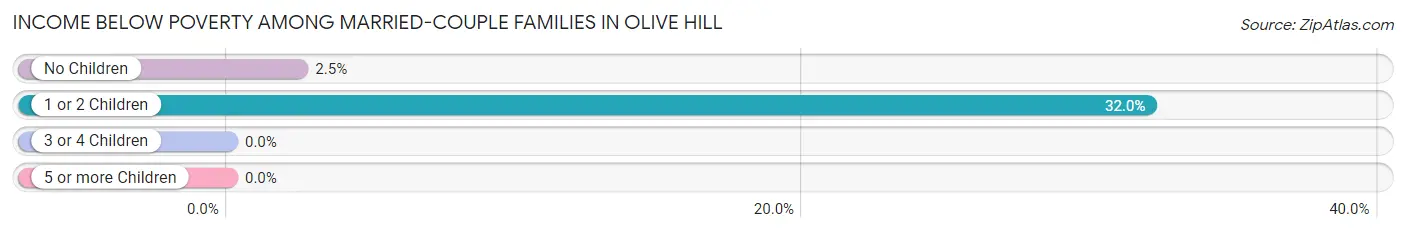
| Children | Above Poverty | Below Poverty |
| No Children | 239 (97.6%) | 6 (2.5%) |
| 1 or 2 Children | 17 (68.0%) | 8 (32.0%) |
| 3 or 4 Children | 13 (100.0%) | 0 (0.0%) |
| 5 or more Children | 0 (0.0%) | 0 (0.0%) |
| Total | 269 (95.1%) | 14 (5.0%) |
Income Below Poverty Among Single-Parent Households in Olive Hill
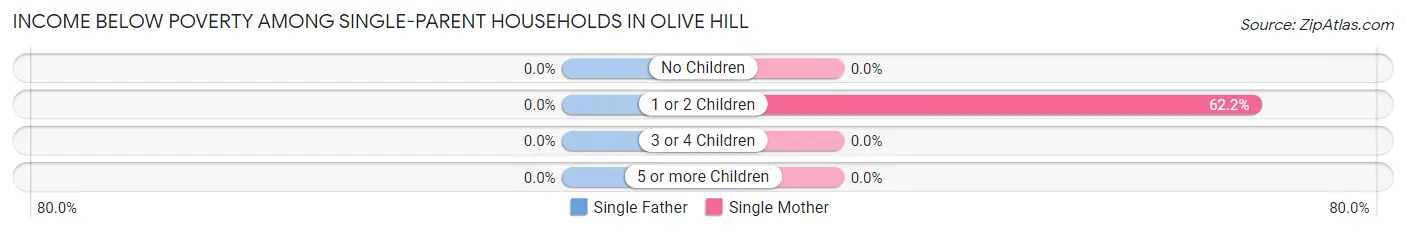
| Children | Single Father | Single Mother |
| No Children | 0 (0.0%) | 0 (0.0%) |
| 1 or 2 Children | 0 (0.0%) | 28 (62.2%) |
| 3 or 4 Children | 0 (0.0%) | 0 (0.0%) |
| 5 or more Children | 0 (0.0%) | 0 (0.0%) |
| Total | 0 (0.0%) | 28 (40.0%) |
Income Below Poverty Among Married-Couple vs Single-Parent Households in Olive Hill
The poverty data for Olive Hill shows that 14 of the married-couple family households (5.0%) and 28 of the single-parent households (32.2%) are living below the poverty level. Within the married-couple family households, those with 1 or 2 children have the highest poverty rate, with 8 households (32.0%) falling below the poverty line. Among the single-parent households, those with 1 or 2 children have the highest poverty rate, with 28 household (62.2%) living below poverty.
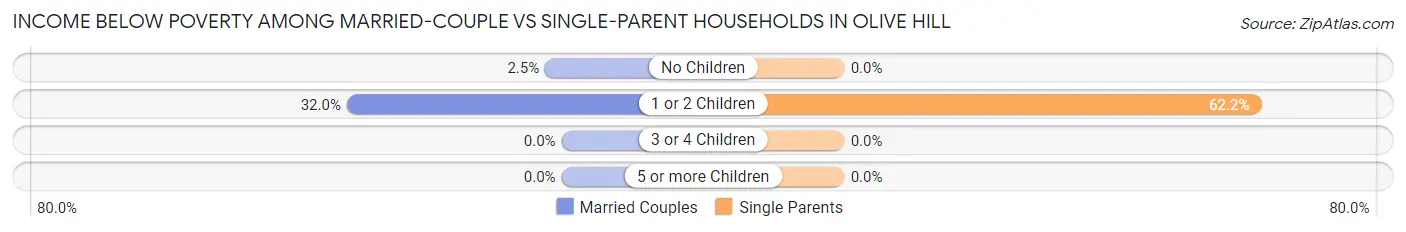
| Children | Married-Couple Families | Single-Parent Households |
| No Children | 6 (2.5%) | 0 (0.0%) |
| 1 or 2 Children | 8 (32.0%) | 28 (62.2%) |
| 3 or 4 Children | 0 (0.0%) | 0 (0.0%) |
| 5 or more Children | 0 (0.0%) | 0 (0.0%) |
| Total | 14 (5.0%) | 28 (32.2%) |
Race in Olive Hill
The most populous races in Olive Hill are White / Caucasian (1,493 | 96.6%), Hispanic or Latino (18 | 1.2%), and Some other Race (18 | 1.2%).
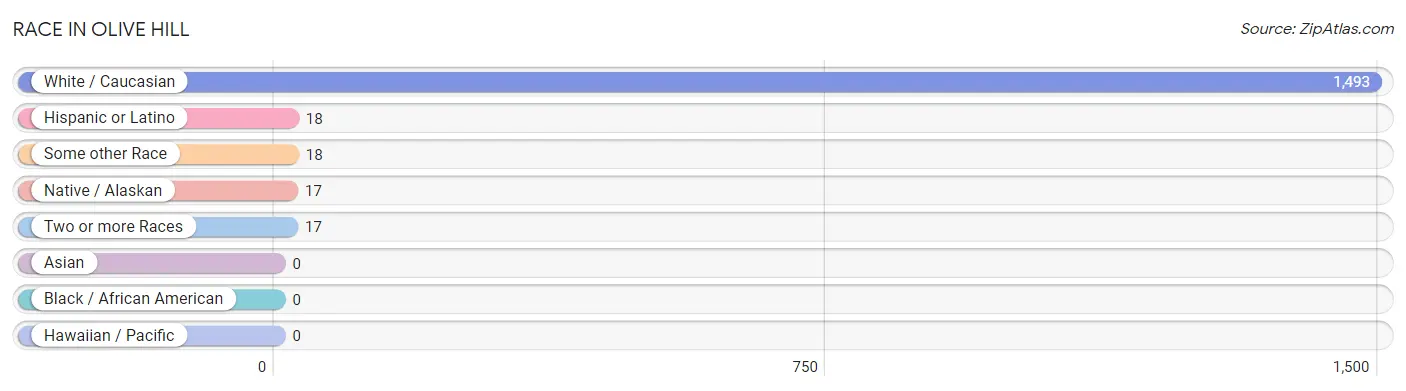
| Race | # Population | % Population |
| Asian | 0 | 0.0% |
| Black / African American | 0 | 0.0% |
| Hawaiian / Pacific | 0 | 0.0% |
| Hispanic or Latino | 18 | 1.2% |
| Native / Alaskan | 17 | 1.1% |
| White / Caucasian | 1,493 | 96.6% |
| Two or more Races | 17 | 1.1% |
| Some other Race | 18 | 1.2% |
| Total | 1,545 | 100.0% |
Ancestry in Olive Hill
The most populous ancestries reported in Olive Hill are American (372 | 24.1%), English (285 | 18.4%), Irish (190 | 12.3%), Swedish (60 | 3.9%), and Scotch-Irish (30 | 1.9%), together accounting for 60.6% of all Olive Hill residents.
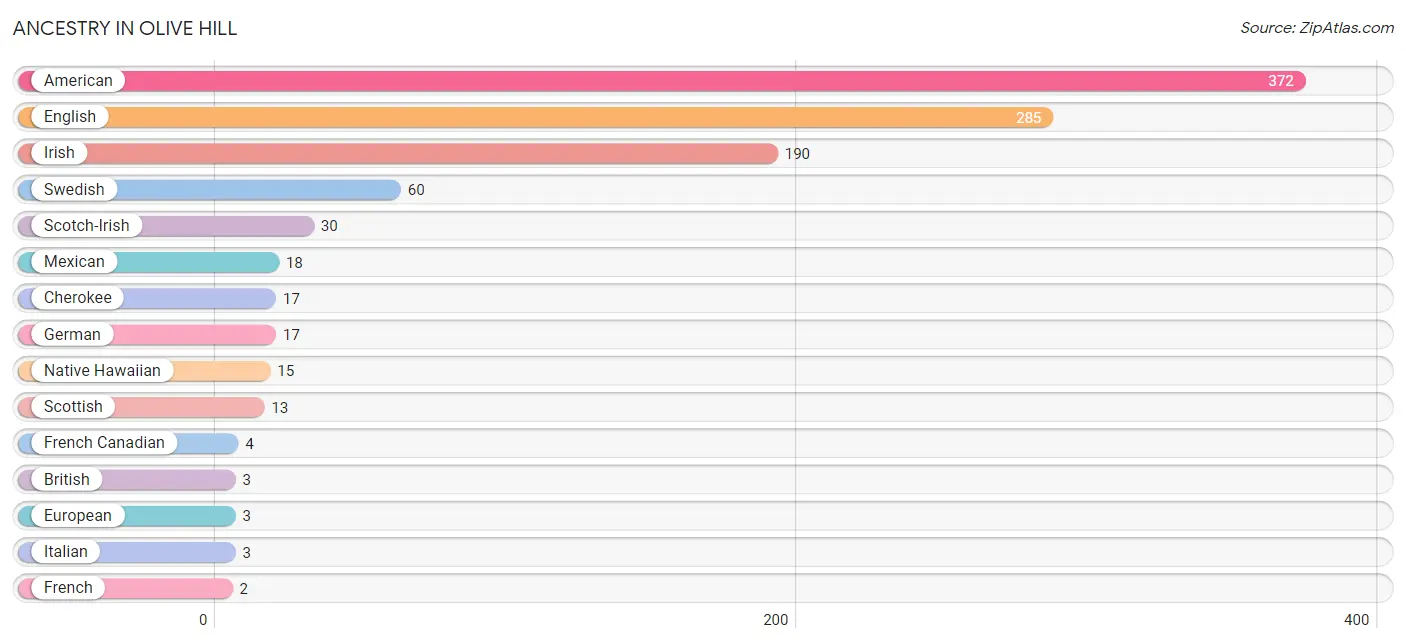
| Ancestry | # Population | % Population |
| American | 372 | 24.1% |
| British | 3 | 0.2% |
| Cherokee | 17 | 1.1% |
| English | 285 | 18.4% |
| European | 3 | 0.2% |
| French | 2 | 0.1% |
| French Canadian | 4 | 0.3% |
| German | 17 | 1.1% |
| Irish | 190 | 12.3% |
| Italian | 3 | 0.2% |
| Mexican | 18 | 1.2% |
| Native Hawaiian | 15 | 1.0% |
| Scotch-Irish | 30 | 1.9% |
| Scottish | 13 | 0.8% |
| Swedish | 60 | 3.9% | View All 15 Rows |
Immigrants in Olive Hill

| Immigration Origin | # Population | % Population | View All 0 Rows |
Sex and Age in Olive Hill
Sex and Age in Olive Hill
The most populous age groups in Olive Hill are 40 to 44 Years (132 | 17.2%) for men and 70 to 74 Years (202 | 26.0%) for women.
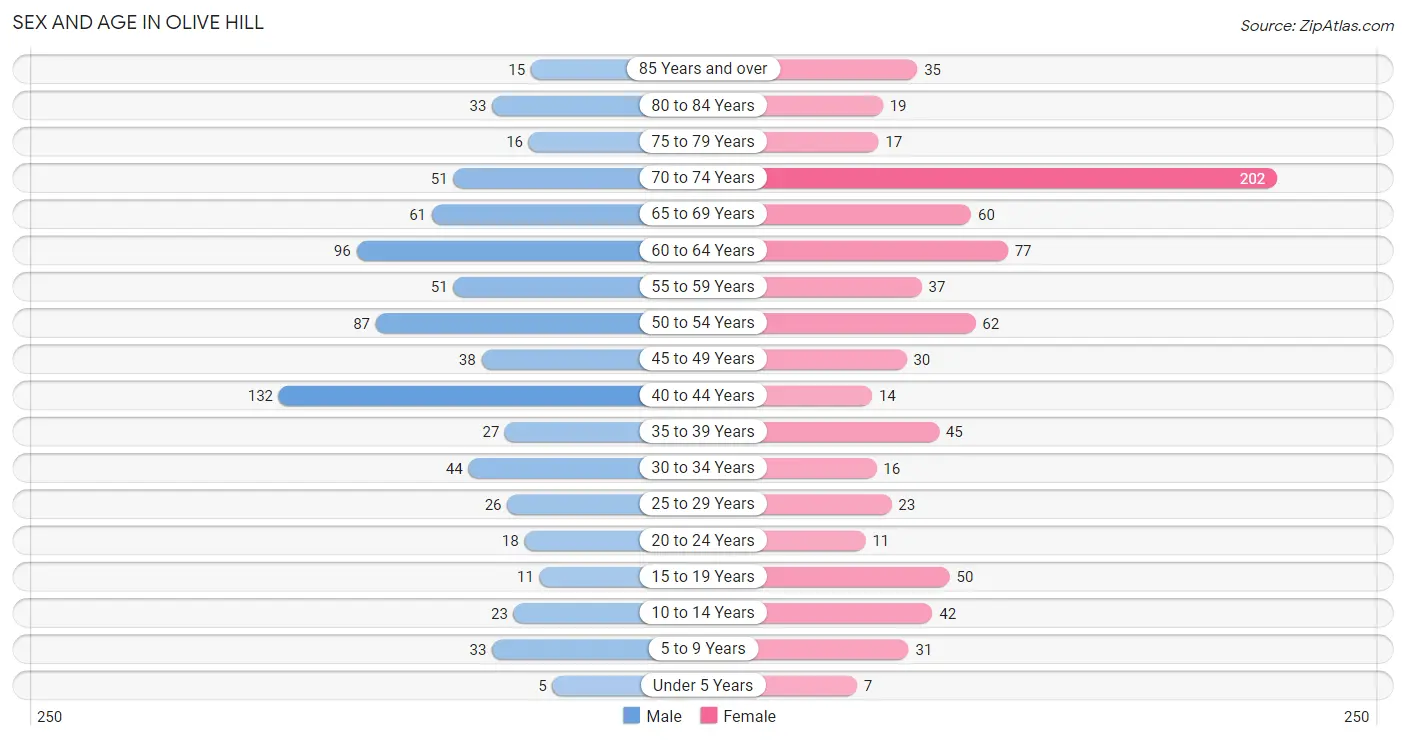
| Age Bracket | Male | Female |
| Under 5 Years | 5 (0.6%) | 7 (0.9%) |
| 5 to 9 Years | 33 (4.3%) | 31 (4.0%) |
| 10 to 14 Years | 23 (3.0%) | 42 (5.4%) |
| 15 to 19 Years | 11 (1.4%) | 50 (6.4%) |
| 20 to 24 Years | 18 (2.4%) | 11 (1.4%) |
| 25 to 29 Years | 26 (3.4%) | 23 (3.0%) |
| 30 to 34 Years | 44 (5.7%) | 16 (2.1%) |
| 35 to 39 Years | 27 (3.5%) | 45 (5.8%) |
| 40 to 44 Years | 132 (17.2%) | 14 (1.8%) |
| 45 to 49 Years | 38 (5.0%) | 30 (3.9%) |
| 50 to 54 Years | 87 (11.3%) | 62 (8.0%) |
| 55 to 59 Years | 51 (6.7%) | 37 (4.8%) |
| 60 to 64 Years | 96 (12.5%) | 77 (9.9%) |
| 65 to 69 Years | 61 (8.0%) | 60 (7.7%) |
| 70 to 74 Years | 51 (6.7%) | 202 (26.0%) |
| 75 to 79 Years | 16 (2.1%) | 17 (2.2%) |
| 80 to 84 Years | 33 (4.3%) | 19 (2.4%) |
| 85 Years and over | 15 (2.0%) | 35 (4.5%) |
| Total | 767 (100.0%) | 778 (100.0%) |
Families and Households in Olive Hill
Median Family Size in Olive Hill
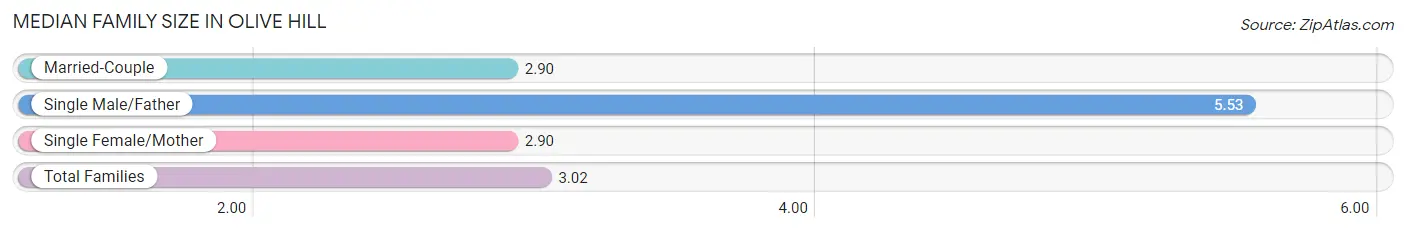
The median family size in Olive Hill is 3.02 persons per family, with single male/father families (17 | 4.6%) accounting for the largest median family size of 5.53 persons per family. On the other hand, married-couple families (283 | 76.5%) represent the smallest median family size with 2.90 persons per family.
| Family Type | # Families | Family Size |
| Married-Couple | 283 (76.5%) | 2.90 |
| Single Male/Father | 17 (4.6%) | 5.53 |
| Single Female/Mother | 70 (18.9%) | 2.90 |
| Total Families | 370 (100.0%) | 3.02 |
Median Household Size in Olive Hill
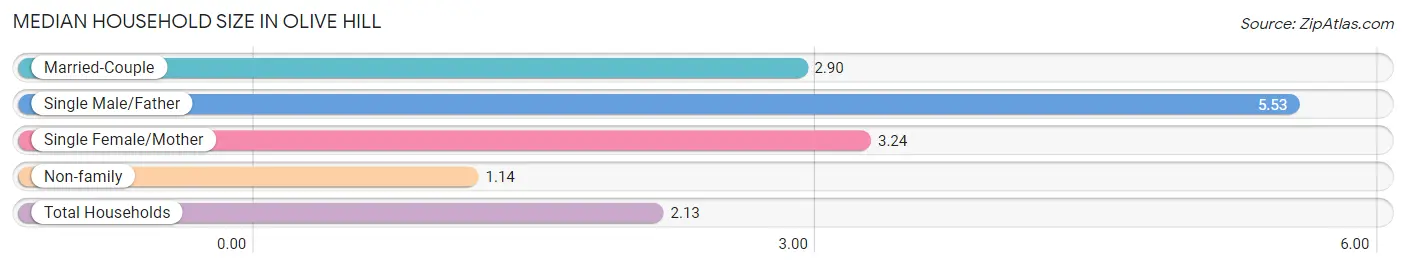
The median household size in Olive Hill is 2.13 persons per household, with single male/father households (17 | 2.4%) accounting for the largest median household size of 5.53 persons per household. non-family households (354 | 48.9%) represent the smallest median household size with 1.14 persons per household.
| Household Type | # Households | Household Size |
| Married-Couple | 283 (39.1%) | 2.90 |
| Single Male/Father | 17 (2.4%) | 5.53 |
| Single Female/Mother | 70 (9.7%) | 3.24 |
| Non-family | 354 (48.9%) | 1.14 |
| Total Households | 724 (100.0%) | 2.13 |
Household Size by Marriage Status in Olive Hill
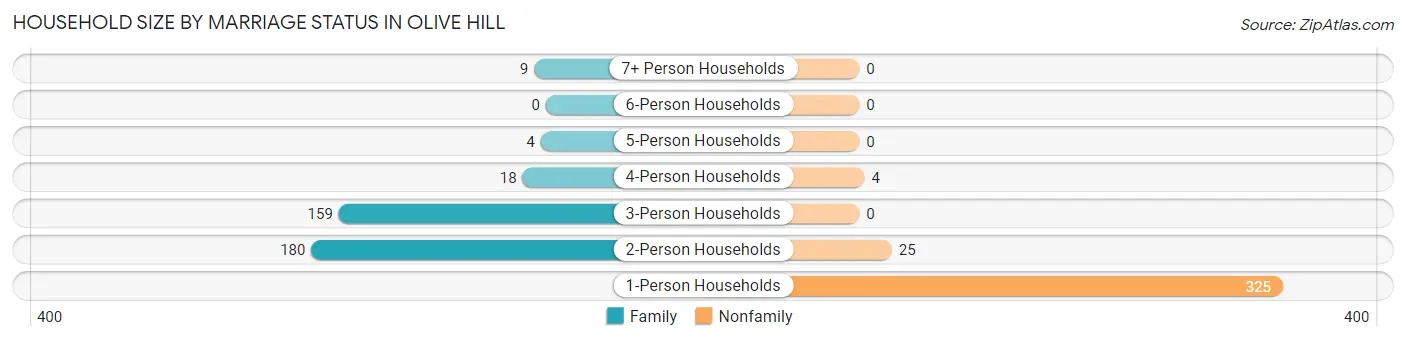
Out of a total of 724 households in Olive Hill, 370 (51.1%) are family households, while 354 (48.9%) are nonfamily households. The most numerous type of family households are 2-person households, comprising 180, and the most common type of nonfamily households are 1-person households, comprising 325.
| Household Size | Family Households | Nonfamily Households |
| 1-Person Households | - | 325 (44.9%) |
| 2-Person Households | 180 (24.9%) | 25 (3.5%) |
| 3-Person Households | 159 (22.0%) | 0 (0.0%) |
| 4-Person Households | 18 (2.5%) | 4 (0.5%) |
| 5-Person Households | 4 (0.5%) | 0 (0.0%) |
| 6-Person Households | 0 (0.0%) | 0 (0.0%) |
| 7+ Person Households | 9 (1.2%) | 0 (0.0%) |
| Total | 370 (51.1%) | 354 (48.9%) |
Female Fertility in Olive Hill
Fertility by Age in Olive Hill
Average fertility rate in Olive Hill is 52.0 births per 1,000 women. Women in the age bracket of 20 to 34 years have the highest fertility rate with 200.0 births per 1,000 women. Women in the age bracket of 20 to 34 years acount for 100.0% of all women with births.
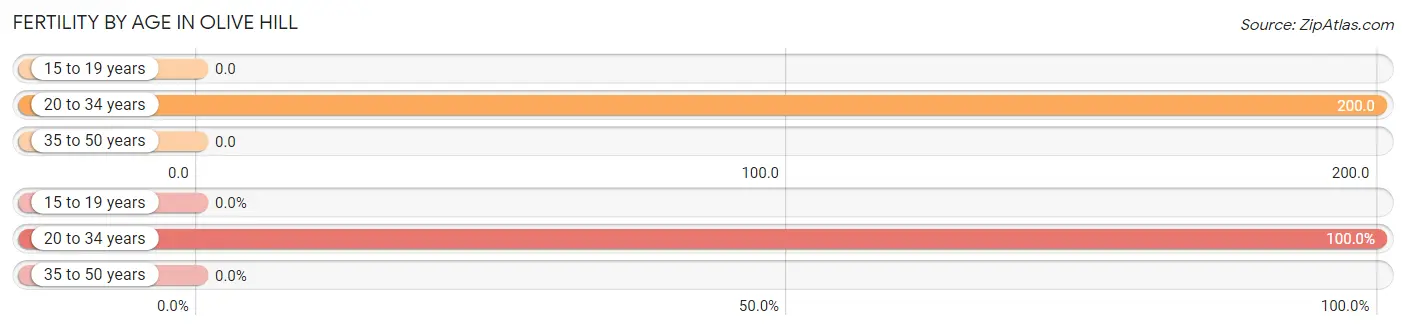
| Age Bracket | Women with Births | Births / 1,000 Women |
| 15 to 19 years | 0 (0.0%) | 0.0 |
| 20 to 34 years | 10 (100.0%) | 200.0 |
| 35 to 50 years | 0 (0.0%) | 0.0 |
| Total | 10 (100.0%) | 52.0 |
Fertility by Age by Marriage Status in Olive Hill
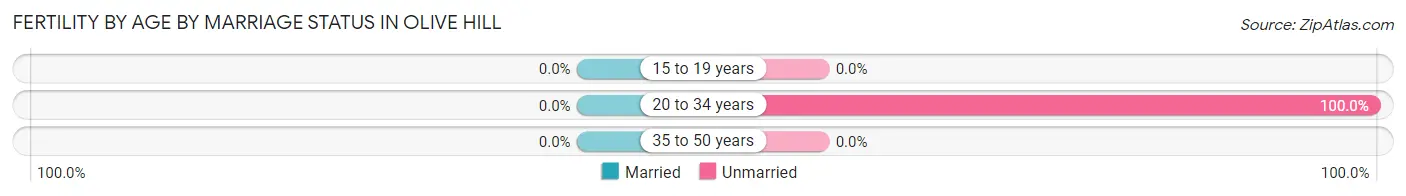
| Age Bracket | Married | Unmarried |
| 15 to 19 years | 0 (0.0%) | 0 (0.0%) |
| 20 to 34 years | 0 (0.0%) | 10 (100.0%) |
| 35 to 50 years | 0 (0.0%) | 0 (0.0%) |
| Total | 0 (0.0%) | 10 (100.0%) |
Fertility by Education in Olive Hill
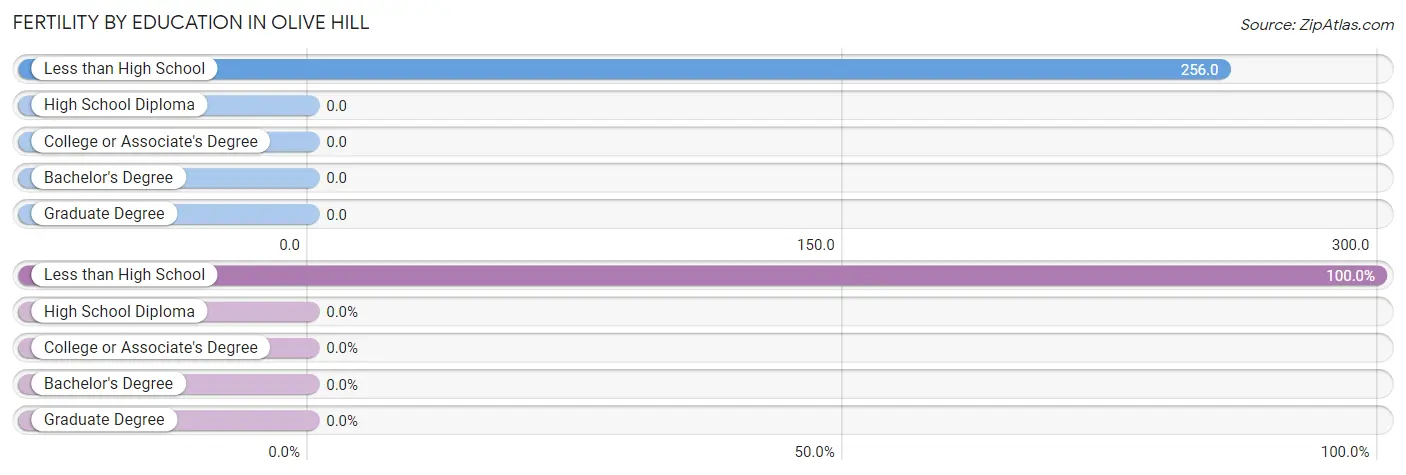
| Educational Attainment | Women with Births | Births / 1,000 Women |
| Less than High School | 10 (100.0%) | 256.0 |
| High School Diploma | 0 (0.0%) | 0.0 |
| College or Associate's Degree | 0 (0.0%) | 0.0 |
| Bachelor's Degree | 0 (0.0%) | 0.0 |
| Graduate Degree | 0 (0.0%) | 0.0 |
| Total | 10 (100.0%) | 52.0 |
Fertility by Education by Marriage Status in Olive Hill
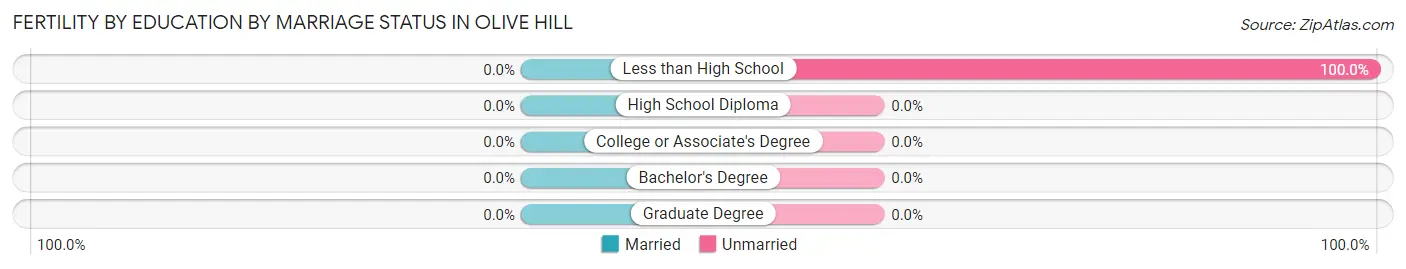
| Educational Attainment | Married | Unmarried |
| Less than High School | 0 (0.0%) | 10 (100.0%) |
| High School Diploma | 0 (0.0%) | 0 (0.0%) |
| College or Associate's Degree | 0 (0.0%) | 0 (0.0%) |
| Bachelor's Degree | 0 (0.0%) | 0 (0.0%) |
| Graduate Degree | 0 (0.0%) | 0 (0.0%) |
| Total | 0 (0.0%) | 10 (100.0%) |
Employment Characteristics in Olive Hill
Employment by Class of Employer in Olive Hill
Among the 652 employed individuals in Olive Hill, private company employees (422 | 64.7%), state government employees (129 | 19.8%), and self-employed (not incorporated) (35 | 5.4%) make up the most common classes of employment.
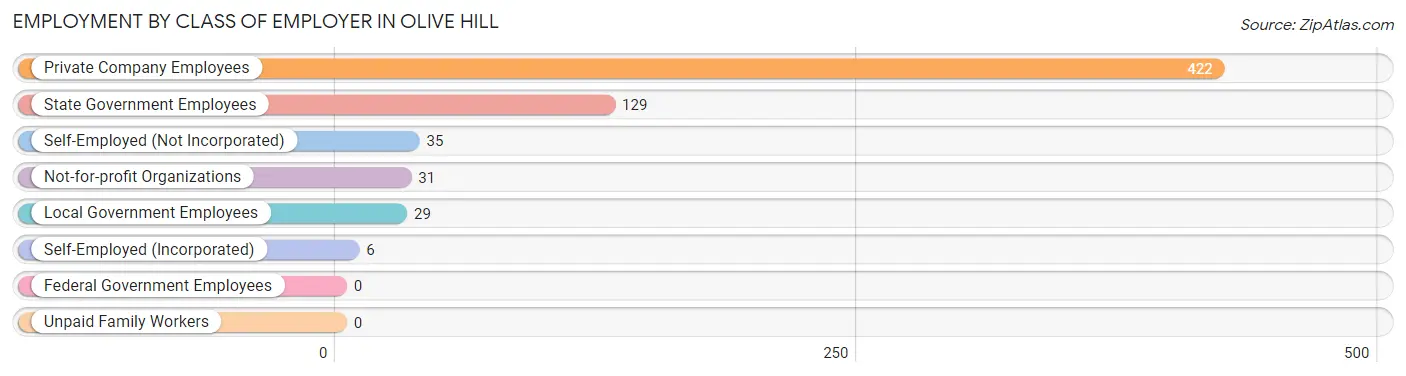
| Employer Class | # Employees | % Employees |
| Private Company Employees | 422 | 64.7% |
| Self-Employed (Incorporated) | 6 | 0.9% |
| Self-Employed (Not Incorporated) | 35 | 5.4% |
| Not-for-profit Organizations | 31 | 4.8% |
| Local Government Employees | 29 | 4.4% |
| State Government Employees | 129 | 19.8% |
| Federal Government Employees | 0 | 0.0% |
| Unpaid Family Workers | 0 | 0.0% |
| Total | 652 | 100.0% |
Employment Status by Age in Olive Hill
According to the labor force statistics for Olive Hill, out of the total population over 16 years of age (1,401), 49.7% or 696 individuals are in the labor force, with 0.9% or 6 of them unemployed. The age group with the highest labor force participation rate is 25 to 29 years, with 91.8% or 45 individuals in the labor force. Within the labor force, the 45 to 54 years age range has the highest percentage of unemployed individuals, with 4.3% or 6 of them being unemployed.
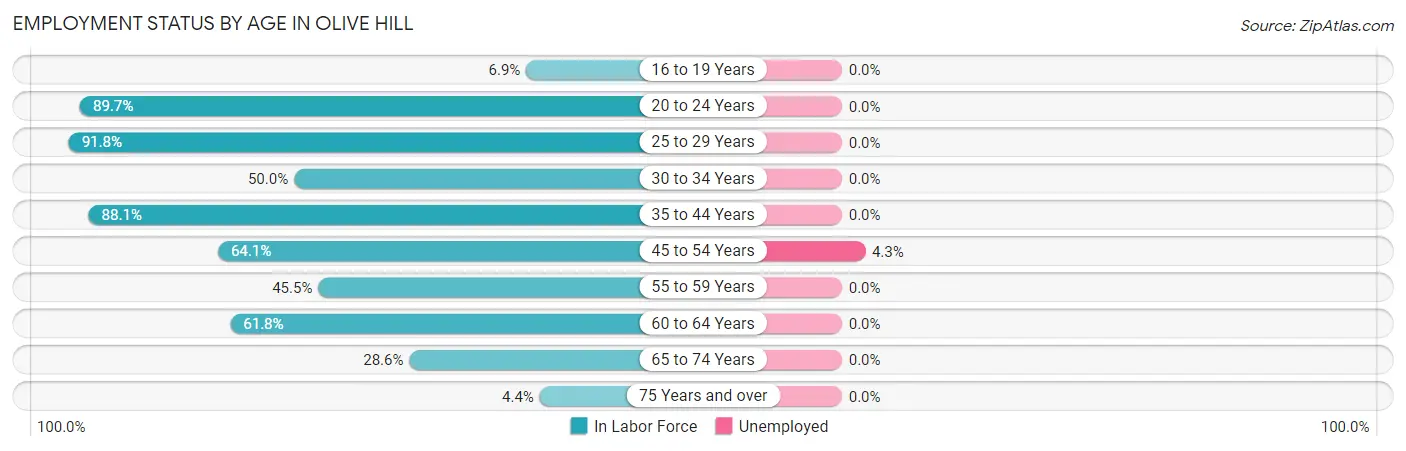
| Age Bracket | In Labor Force | Unemployed |
| 16 to 19 Years | 4 (6.9%) | 0 (0.0%) |
| 20 to 24 Years | 26 (89.7%) | 0 (0.0%) |
| 25 to 29 Years | 45 (91.8%) | 0 (0.0%) |
| 30 to 34 Years | 30 (50.0%) | 0 (0.0%) |
| 35 to 44 Years | 192 (88.1%) | 0 (0.0%) |
| 45 to 54 Years | 139 (64.1%) | 6 (4.3%) |
| 55 to 59 Years | 40 (45.5%) | 0 (0.0%) |
| 60 to 64 Years | 107 (61.8%) | 0 (0.0%) |
| 65 to 74 Years | 107 (28.6%) | 0 (0.0%) |
| 75 Years and over | 6 (4.4%) | 0 (0.0%) |
| Total | 696 (49.7%) | 6 (0.9%) |
Employment Status by Educational Attainment in Olive Hill
According to labor force statistics for Olive Hill, 68.7% of individuals (553) out of the total population between 25 and 64 years of age (805) are in the labor force, with 1.1% or 6 of them being unemployed. The group with the highest labor force participation rate are those with the educational attainment of bachelor's degree or higher, with 74.8% or 83 individuals in the labor force. Within the labor force, individuals with high school diploma education have the highest percentage of unemployment, with 1.8% or 6 of them being unemployed.
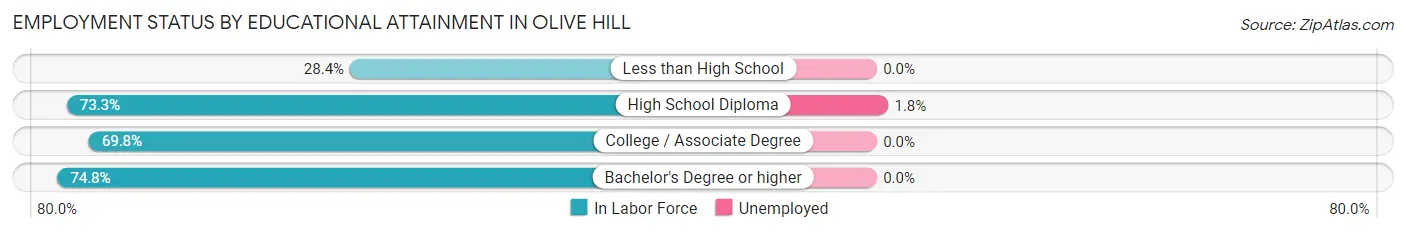
| Educational Attainment | In Labor Force | Unemployed |
| Less than High School | 21 (28.4%) | 0 (0.0%) |
| High School Diploma | 338 (73.3%) | 8 (1.8%) |
| College / Associate Degree | 111 (69.8%) | 0 (0.0%) |
| Bachelor's Degree or higher | 83 (74.8%) | 0 (0.0%) |
| Total | 553 (68.7%) | 9 (1.1%) |
Employment Occupations by Sex in Olive Hill
Management, Business, Science and Arts Occupations
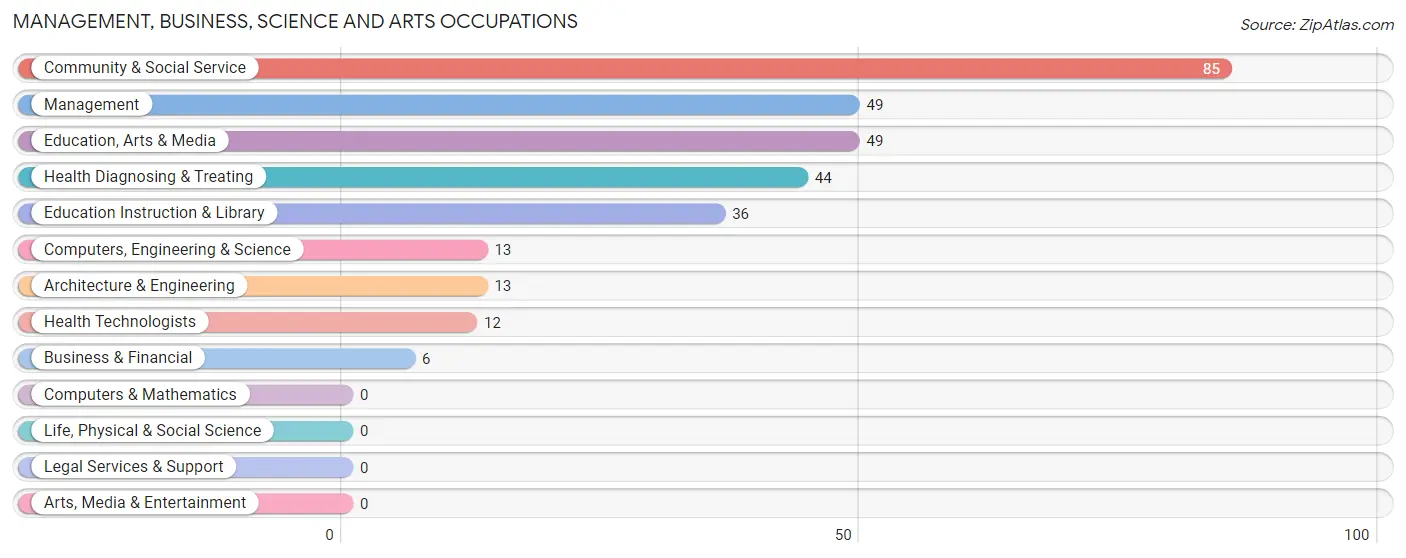
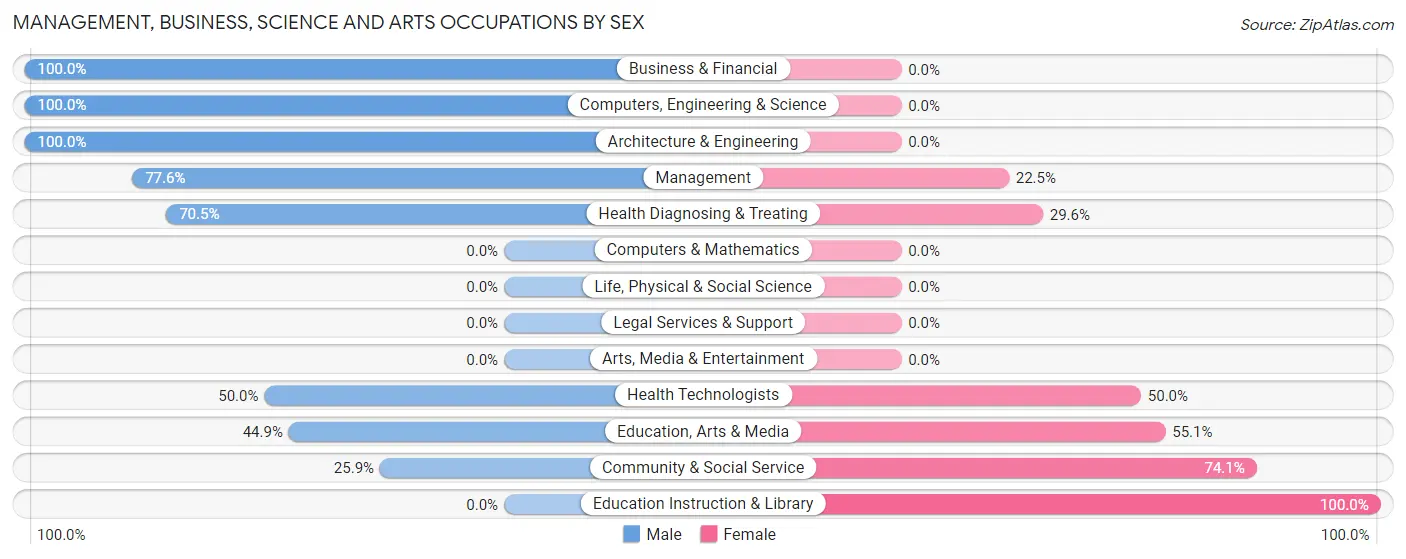
The most common Management, Business, Science and Arts occupations in Olive Hill are Community & Social Service (85 | 12.3%), Management (49 | 7.1%), Education, Arts & Media (49 | 7.1%), Health Diagnosing & Treating (44 | 6.4%), and Education Instruction & Library (36 | 5.2%).
Management, Business, Science and Arts Occupations by Sex
Within the Management, Business, Science and Arts occupations in Olive Hill, the most male-oriented occupations are Business & Financial (100.0%), Computers, Engineering & Science (100.0%), and Architecture & Engineering (100.0%), while the most female-oriented occupations are Education Instruction & Library (100.0%), Community & Social Service (74.1%), and Education, Arts & Media (55.1%).
| Occupation | Male | Female |
| Management | 38 (77.5%) | 11 (22.5%) |
| Business & Financial | 6 (100.0%) | 0 (0.0%) |
| Computers, Engineering & Science | 13 (100.0%) | 0 (0.0%) |
| Computers & Mathematics | 0 (0.0%) | 0 (0.0%) |
| Architecture & Engineering | 13 (100.0%) | 0 (0.0%) |
| Life, Physical & Social Science | 0 (0.0%) | 0 (0.0%) |
| Community & Social Service | 22 (25.9%) | 63 (74.1%) |
| Education, Arts & Media | 22 (44.9%) | 27 (55.1%) |
| Legal Services & Support | 0 (0.0%) | 0 (0.0%) |
| Education Instruction & Library | 0 (0.0%) | 36 (100.0%) |
| Arts, Media & Entertainment | 0 (0.0%) | 0 (0.0%) |
| Health Diagnosing & Treating | 31 (70.5%) | 13 (29.5%) |
| Health Technologists | 6 (50.0%) | 6 (50.0%) |
| Total (Category) | 110 (55.8%) | 87 (44.2%) |
| Total (Overall) | 423 (61.3%) | 267 (38.7%) |
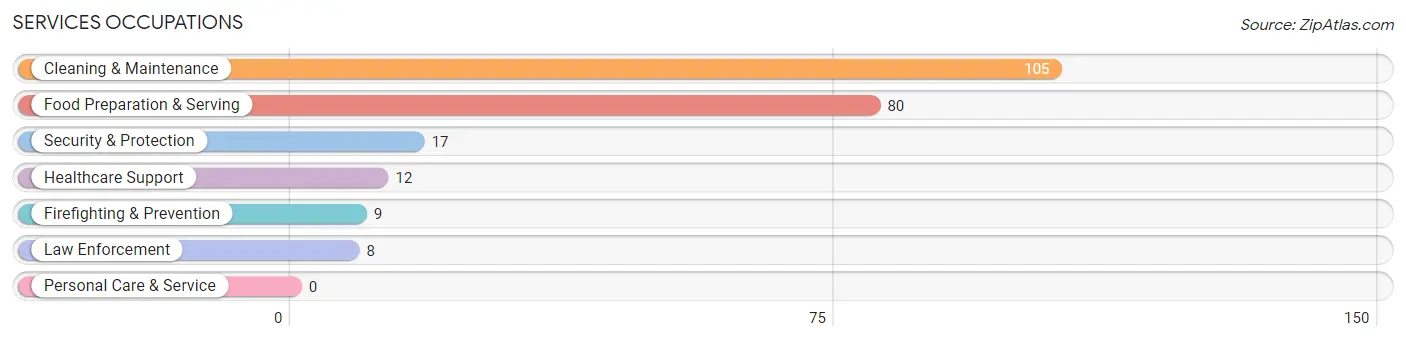
Services Occupations
The most common Services occupations in Olive Hill are Cleaning & Maintenance (105 | 15.2%), Food Preparation & Serving (80 | 11.6%), Security & Protection (17 | 2.5%), Healthcare Support (12 | 1.7%), and Firefighting & Prevention (9 | 1.3%).
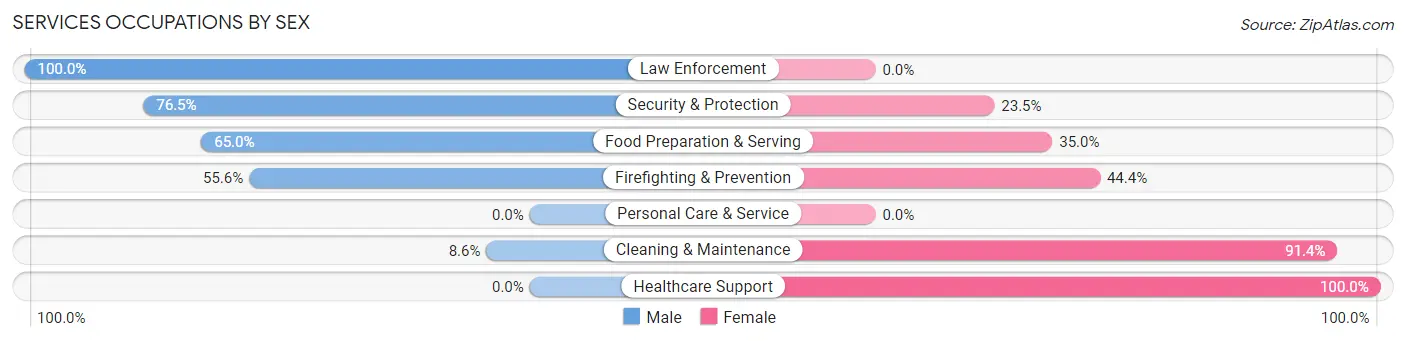
Services Occupations by Sex
Within the Services occupations in Olive Hill, the most male-oriented occupations are Law Enforcement (100.0%), Security & Protection (76.5%), and Food Preparation & Serving (65.0%), while the most female-oriented occupations are Healthcare Support (100.0%), Cleaning & Maintenance (91.4%), and Firefighting & Prevention (44.4%).
| Occupation | Male | Female |
| Healthcare Support | 0 (0.0%) | 12 (100.0%) |
| Security & Protection | 13 (76.5%) | 4 (23.5%) |
| Firefighting & Prevention | 5 (55.6%) | 4 (44.4%) |
| Law Enforcement | 8 (100.0%) | 0 (0.0%) |
| Food Preparation & Serving | 52 (65.0%) | 28 (35.0%) |
| Cleaning & Maintenance | 9 (8.6%) | 96 (91.4%) |
| Personal Care & Service | 0 (0.0%) | 0 (0.0%) |
| Total (Category) | 74 (34.6%) | 140 (65.4%) |
| Total (Overall) | 423 (61.3%) | 267 (38.7%) |
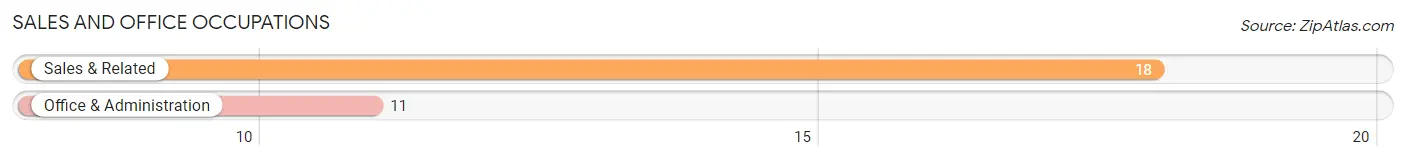
Sales and Office Occupations
The most common Sales and Office occupations in Olive Hill are Sales & Related (18 | 2.6%), and Office & Administration (11 | 1.6%).
Sales and Office Occupations by Sex
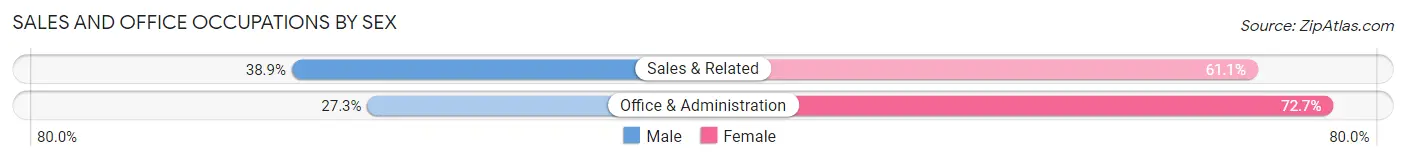
| Occupation | Male | Female |
| Sales & Related | 7 (38.9%) | 11 (61.1%) |
| Office & Administration | 3 (27.3%) | 8 (72.7%) |
| Total (Category) | 10 (34.5%) | 19 (65.5%) |
| Total (Overall) | 423 (61.3%) | 267 (38.7%) |
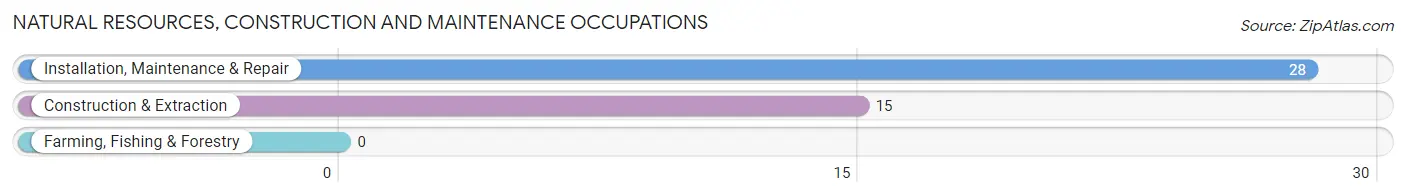
Natural Resources, Construction and Maintenance Occupations
The most common Natural Resources, Construction and Maintenance occupations in Olive Hill are Installation, Maintenance & Repair (28 | 4.1%), and Construction & Extraction (15 | 2.2%).
Natural Resources, Construction and Maintenance Occupations by Sex
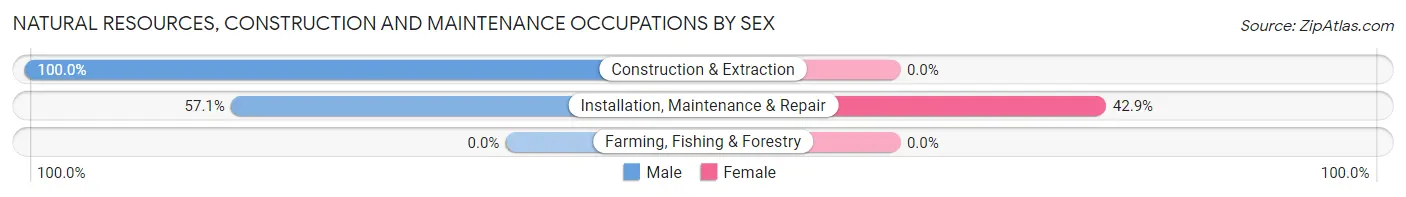
| Occupation | Male | Female |
| Farming, Fishing & Forestry | 0 (0.0%) | 0 (0.0%) |
| Construction & Extraction | 15 (100.0%) | 0 (0.0%) |
| Installation, Maintenance & Repair | 16 (57.1%) | 12 (42.9%) |
| Total (Category) | 31 (72.1%) | 12 (27.9%) |
| Total (Overall) | 423 (61.3%) | 267 (38.7%) |
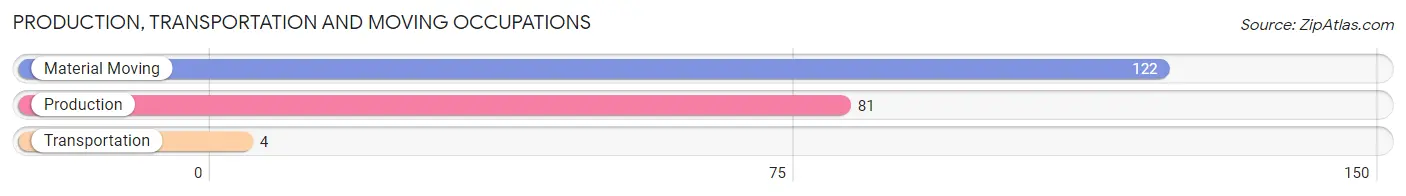
Production, Transportation and Moving Occupations
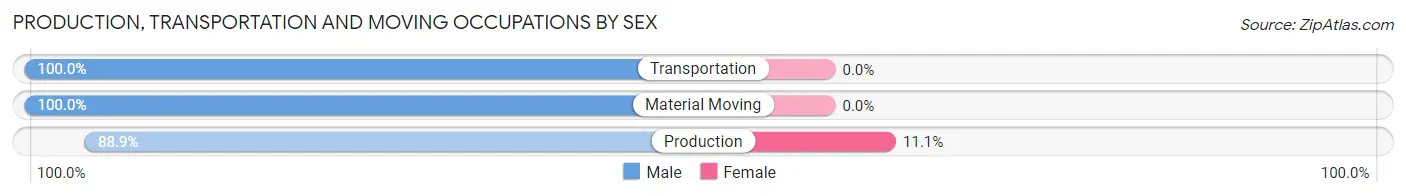
The most common Production, Transportation and Moving occupations in Olive Hill are Material Moving (122 | 17.7%), Production (81 | 11.7%), and Transportation (4 | 0.6%).
Production, Transportation and Moving Occupations by Sex
| Occupation | Male | Female |
| Production | 72 (88.9%) | 9 (11.1%) |
| Transportation | 4 (100.0%) | 0 (0.0%) |
| Material Moving | 122 (100.0%) | 0 (0.0%) |
| Total (Category) | 198 (95.7%) | 9 (4.3%) |
| Total (Overall) | 423 (61.3%) | 267 (38.7%) |
Employment Industries by Sex in Olive Hill
Employment Industries in Olive Hill
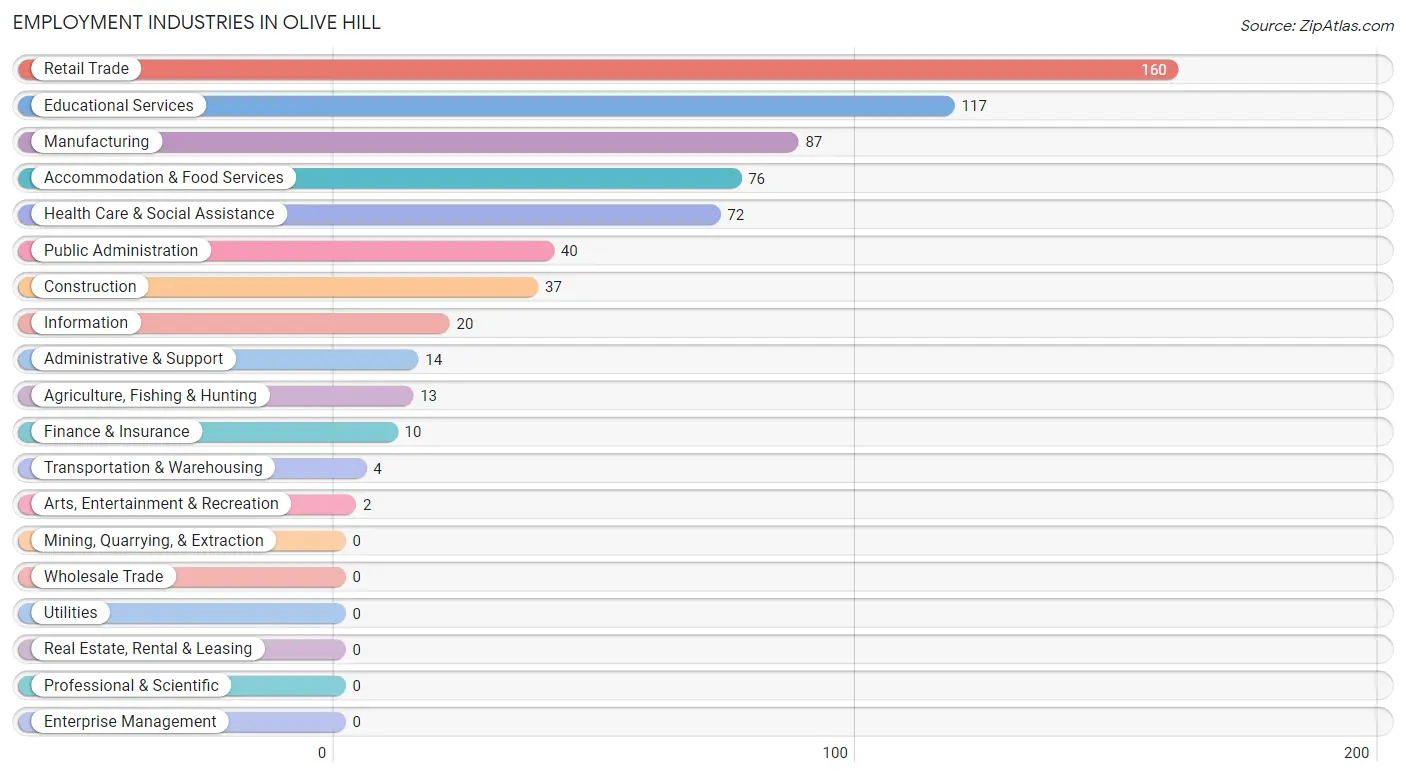
The major employment industries in Olive Hill include Retail Trade (160 | 23.2%), Educational Services (117 | 17.0%), Manufacturing (87 | 12.6%), Accommodation & Food Services (76 | 11.0%), and Health Care & Social Assistance (72 | 10.4%).
Employment Industries by Sex in Olive Hill
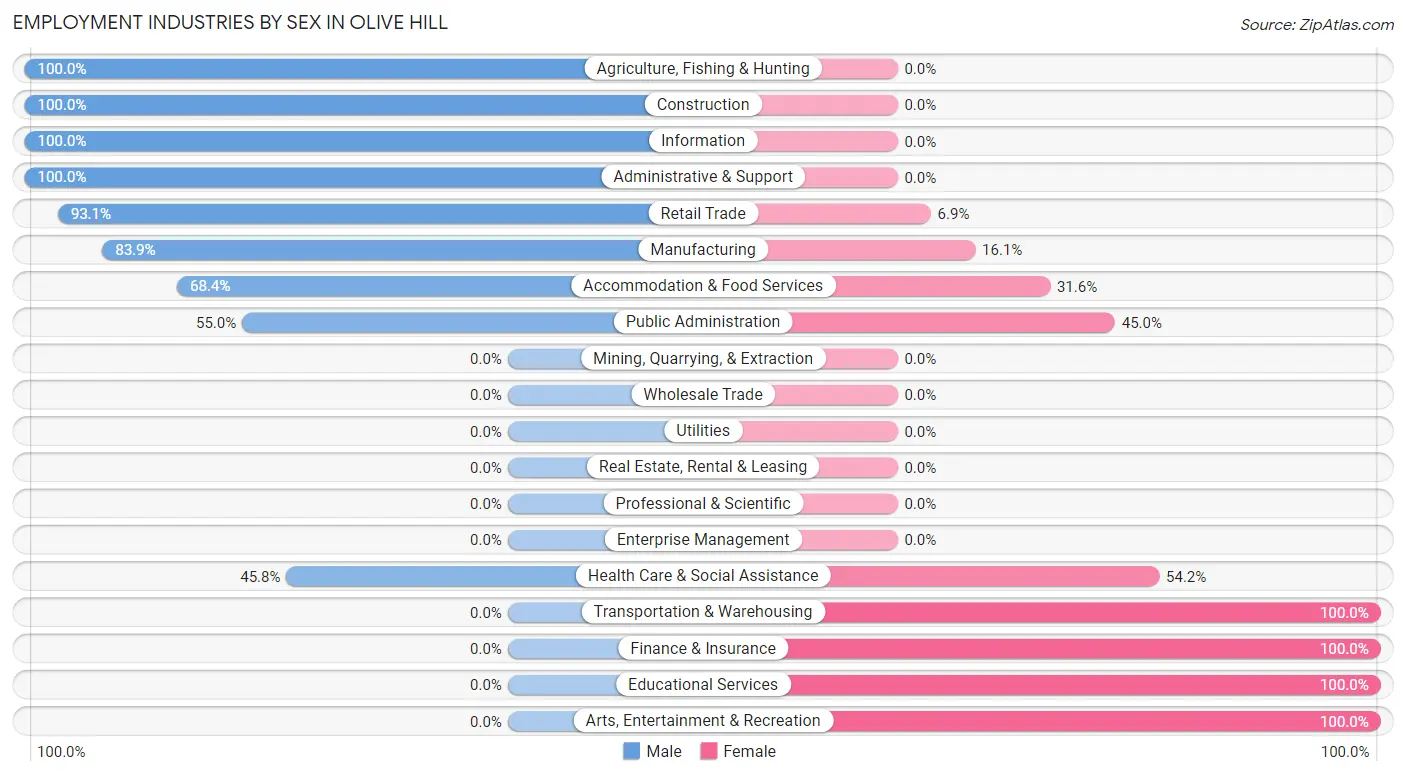
The Olive Hill industries that see more men than women are Agriculture, Fishing & Hunting (100.0%), Construction (100.0%), and Information (100.0%), whereas the industries that tend to have a higher number of women are Transportation & Warehousing (100.0%), Finance & Insurance (100.0%), and Educational Services (100.0%).
| Industry | Male | Female |
| Agriculture, Fishing & Hunting | 13 (100.0%) | 0 (0.0%) |
| Mining, Quarrying, & Extraction | 0 (0.0%) | 0 (0.0%) |
| Construction | 37 (100.0%) | 0 (0.0%) |
| Manufacturing | 73 (83.9%) | 14 (16.1%) |
| Wholesale Trade | 0 (0.0%) | 0 (0.0%) |
| Retail Trade | 149 (93.1%) | 11 (6.9%) |
| Transportation & Warehousing | 0 (0.0%) | 4 (100.0%) |
| Utilities | 0 (0.0%) | 0 (0.0%) |
| Information | 20 (100.0%) | 0 (0.0%) |
| Finance & Insurance | 0 (0.0%) | 10 (100.0%) |
| Real Estate, Rental & Leasing | 0 (0.0%) | 0 (0.0%) |
| Professional & Scientific | 0 (0.0%) | 0 (0.0%) |
| Enterprise Management | 0 (0.0%) | 0 (0.0%) |
| Administrative & Support | 14 (100.0%) | 0 (0.0%) |
| Educational Services | 0 (0.0%) | 117 (100.0%) |
| Health Care & Social Assistance | 33 (45.8%) | 39 (54.2%) |
| Arts, Entertainment & Recreation | 0 (0.0%) | 2 (100.0%) |
| Accommodation & Food Services | 52 (68.4%) | 24 (31.6%) |
| Public Administration | 22 (55.0%) | 18 (45.0%) |
| Total | 423 (61.3%) | 267 (38.7%) |
Education in Olive Hill
School Enrollment in Olive Hill
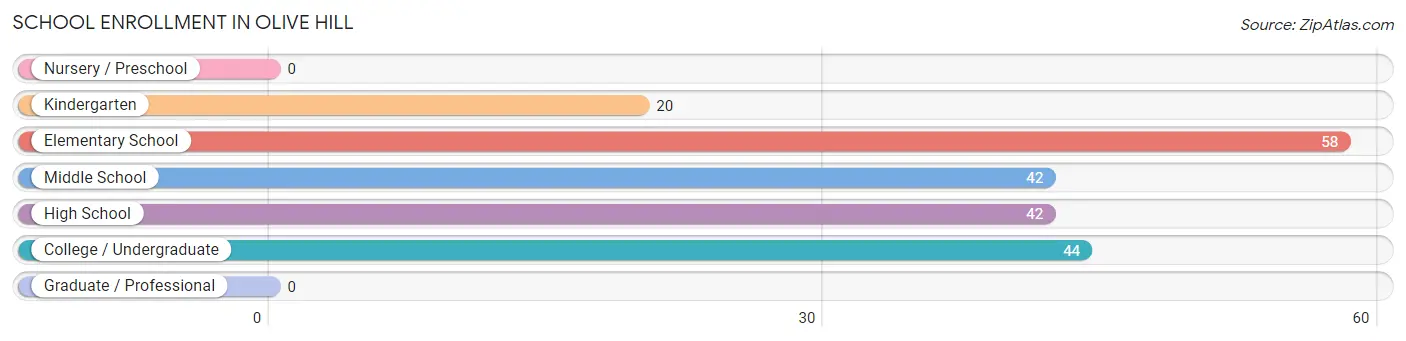
The most common levels of schooling among the 206 students in Olive Hill are elementary school (58 | 28.2%), college / undergraduate (44 | 21.4%), and middle school (42 | 20.4%).
| School Level | # Students | % Students |
| Nursery / Preschool | 0 | 0.0% |
| Kindergarten | 20 | 9.7% |
| Elementary School | 58 | 28.2% |
| Middle School | 42 | 20.4% |
| High School | 42 | 20.4% |
| College / Undergraduate | 44 | 21.4% |
| Graduate / Professional | 0 | 0.0% |
| Total | 206 | 100.0% |
School Enrollment by Age by Funding Source in Olive Hill
Out of a total of 206 students who are enrolled in schools in Olive Hill, 15 (7.3%) attend a private institution, while the remaining 191 (92.7%) are enrolled in public schools. The age group of 5 to 9 year old has the highest likelihood of being enrolled in private schools, with 15 (23.4% in the age bracket) enrolled. Conversely, the age group of 10 to 14 year olds has the lowest likelihood of being enrolled in a private school, with 65 (100.0% in the age bracket) attending a public institution.
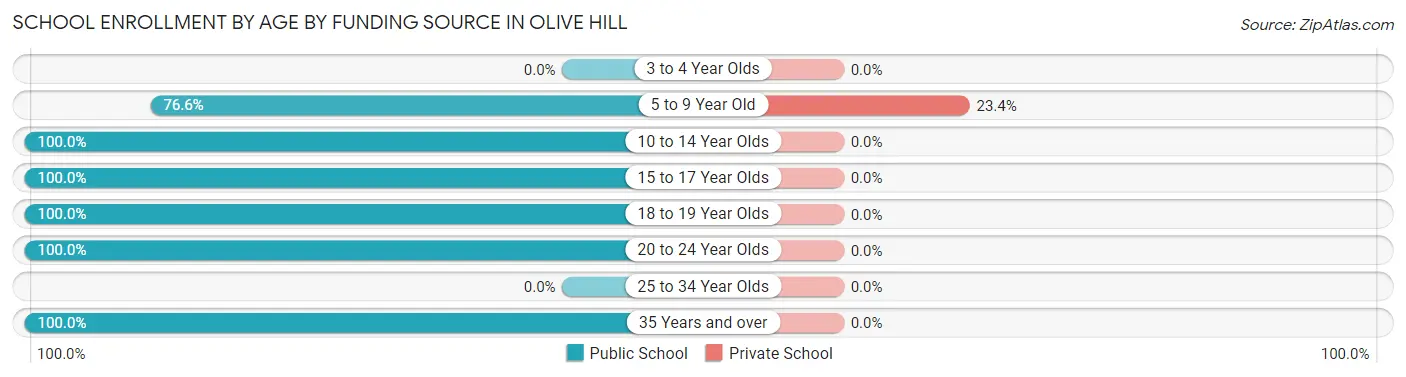
| Age Bracket | Public School | Private School |
| 3 to 4 Year Olds | 0 (0.0%) | 0 (0.0%) |
| 5 to 9 Year Old | 49 (76.6%) | 15 (23.4%) |
| 10 to 14 Year Olds | 65 (100.0%) | 0 (0.0%) |
| 15 to 17 Year Olds | 7 (100.0%) | 0 (0.0%) |
| 18 to 19 Year Olds | 43 (100.0%) | 0 (0.0%) |
| 20 to 24 Year Olds | 8 (100.0%) | 0 (0.0%) |
| 25 to 34 Year Olds | 0 (0.0%) | 0 (0.0%) |
| 35 Years and over | 19 (100.0%) | 0 (0.0%) |
| Total | 191 (92.7%) | 15 (7.3%) |
Educational Attainment by Field of Study in Olive Hill
Business (67 | 32.2%), education (66 | 31.7%), arts & humanities (37 | 17.8%), liberal arts & history (21 | 10.1%), and science & technology (8 | 3.8%) are the most common fields of study among 208 individuals in Olive Hill who have obtained a bachelor's degree or higher.
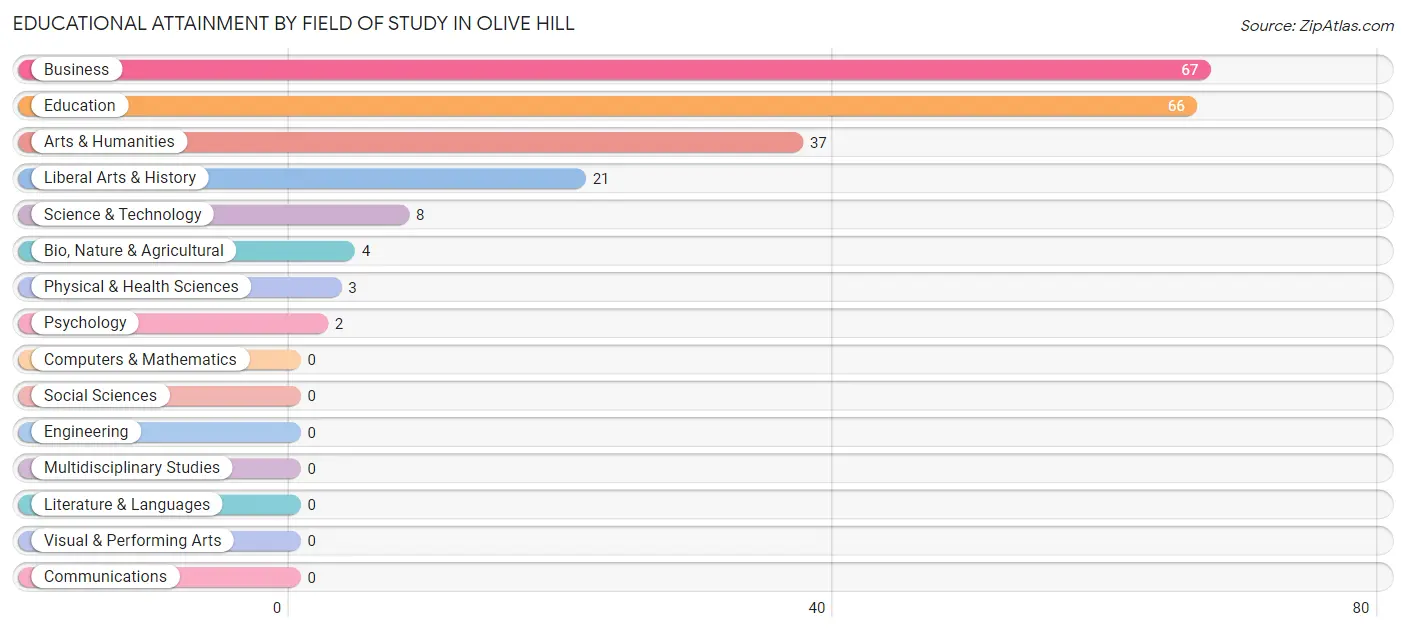
| Field of Study | # Graduates | % Graduates |
| Computers & Mathematics | 0 | 0.0% |
| Bio, Nature & Agricultural | 4 | 1.9% |
| Physical & Health Sciences | 3 | 1.4% |
| Psychology | 2 | 1.0% |
| Social Sciences | 0 | 0.0% |
| Engineering | 0 | 0.0% |
| Multidisciplinary Studies | 0 | 0.0% |
| Science & Technology | 8 | 3.8% |
| Business | 67 | 32.2% |
| Education | 66 | 31.7% |
| Literature & Languages | 0 | 0.0% |
| Liberal Arts & History | 21 | 10.1% |
| Visual & Performing Arts | 0 | 0.0% |
| Communications | 0 | 0.0% |
| Arts & Humanities | 37 | 17.8% |
| Total | 208 | 100.0% |
Transportation & Commute in Olive Hill
Vehicle Availability by Sex in Olive Hill
The most prevalent vehicle ownership categories in Olive Hill are males with 3 vehicles (199, accounting for 47.9%) and females with 3 vehicles (139, making up 84.0%).
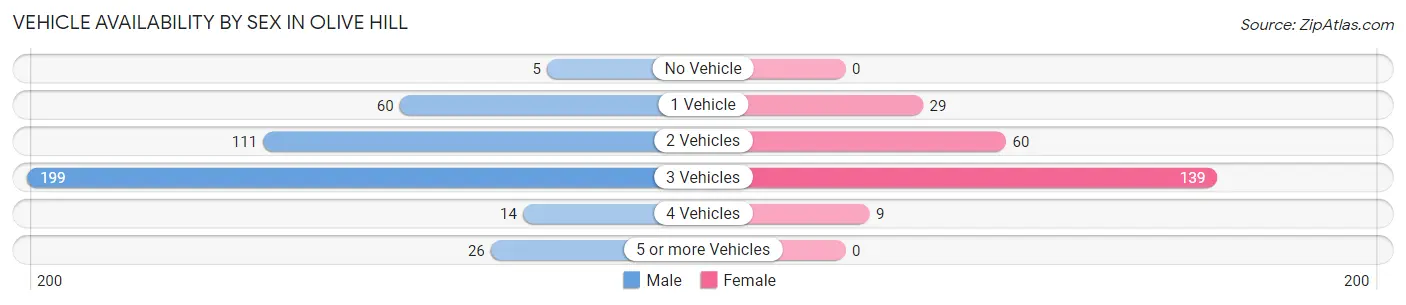
| Vehicles Available | Male | Female |
| No Vehicle | 5 (1.2%) | 0 (0.0%) |
| 1 Vehicle | 60 (14.5%) | 29 (12.2%) |
| 2 Vehicles | 111 (26.8%) | 60 (25.3%) |
| 3 Vehicles | 199 (47.9%) | 139 (58.7%) |
| 4 Vehicles | 14 (3.4%) | 9 (3.8%) |
| 5 or more Vehicles | 26 (6.3%) | 0 (0.0%) |
| Total | 415 (100.0%) | 237 (100.0%) |
Commute Time in Olive Hill
The most frequently occuring commute durations in Olive Hill are 10 to 14 minutes (138 commuters, 21.6%), less than 5 minutes (122 commuters, 19.1%), and 5 to 9 minutes (93 commuters, 14.5%).
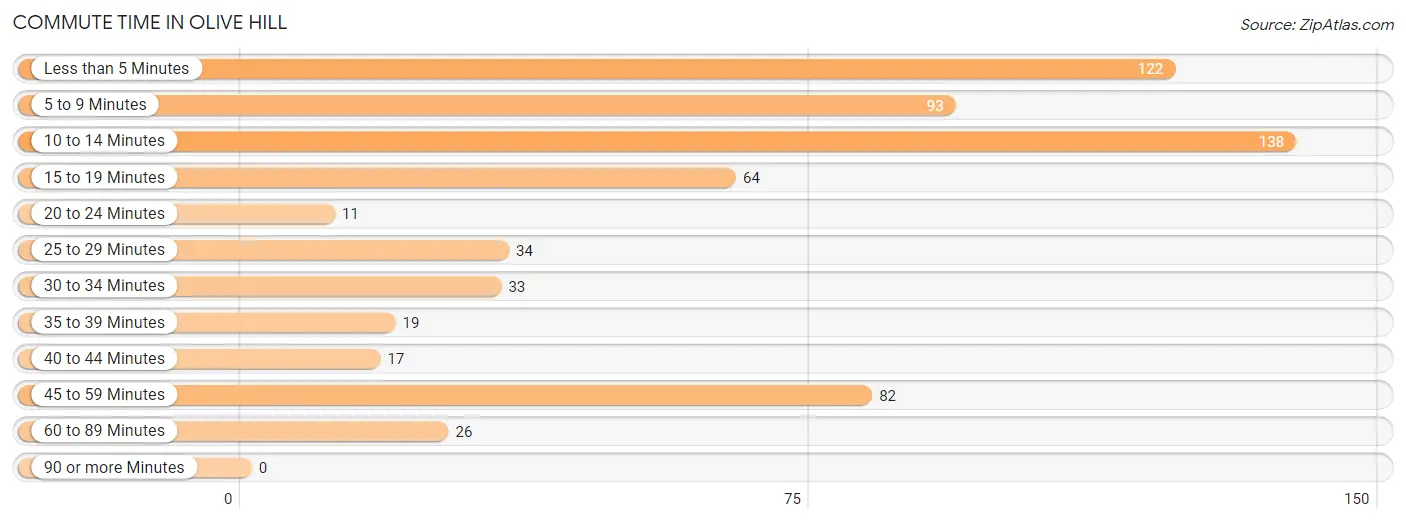
| Commute Time | # Commuters | % Commuters |
| Less than 5 Minutes | 122 | 19.1% |
| 5 to 9 Minutes | 93 | 14.5% |
| 10 to 14 Minutes | 138 | 21.6% |
| 15 to 19 Minutes | 64 | 10.0% |
| 20 to 24 Minutes | 11 | 1.7% |
| 25 to 29 Minutes | 34 | 5.3% |
| 30 to 34 Minutes | 33 | 5.2% |
| 35 to 39 Minutes | 19 | 3.0% |
| 40 to 44 Minutes | 17 | 2.7% |
| 45 to 59 Minutes | 82 | 12.8% |
| 60 to 89 Minutes | 26 | 4.1% |
| 90 or more Minutes | 0 | 0.0% |
Commute Time by Sex in Olive Hill
The most common commute times in Olive Hill are 10 to 14 minutes (134 commuters, 33.3%) for males and less than 5 minutes (96 commuters, 40.5%) for females.
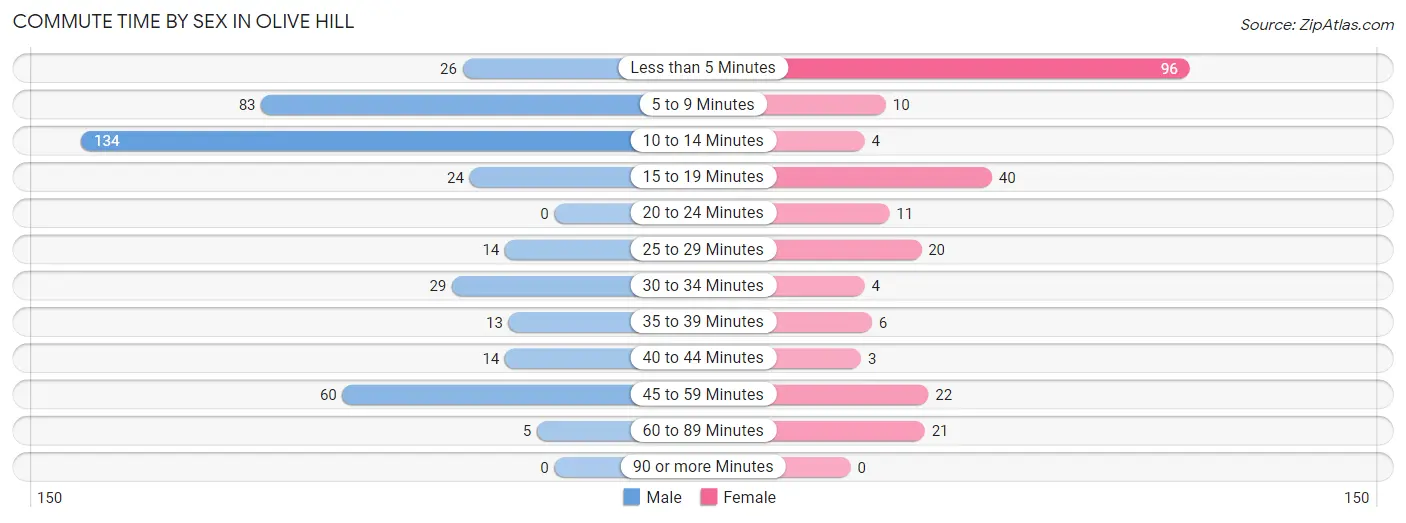
| Commute Time | Male | Female |
| Less than 5 Minutes | 26 (6.5%) | 96 (40.5%) |
| 5 to 9 Minutes | 83 (20.6%) | 10 (4.2%) |
| 10 to 14 Minutes | 134 (33.3%) | 4 (1.7%) |
| 15 to 19 Minutes | 24 (6.0%) | 40 (16.9%) |
| 20 to 24 Minutes | 0 (0.0%) | 11 (4.6%) |
| 25 to 29 Minutes | 14 (3.5%) | 20 (8.4%) |
| 30 to 34 Minutes | 29 (7.2%) | 4 (1.7%) |
| 35 to 39 Minutes | 13 (3.2%) | 6 (2.5%) |
| 40 to 44 Minutes | 14 (3.5%) | 3 (1.3%) |
| 45 to 59 Minutes | 60 (14.9%) | 22 (9.3%) |
| 60 to 89 Minutes | 5 (1.2%) | 21 (8.9%) |
| 90 or more Minutes | 0 (0.0%) | 0 (0.0%) |
Time of Departure to Work by Sex in Olive Hill
The most frequent times of departure to work in Olive Hill are 4:00 PM to 11:59 PM (121, 30.1%) for males and 6:30 AM to 6:59 AM (114, 48.1%) for females.
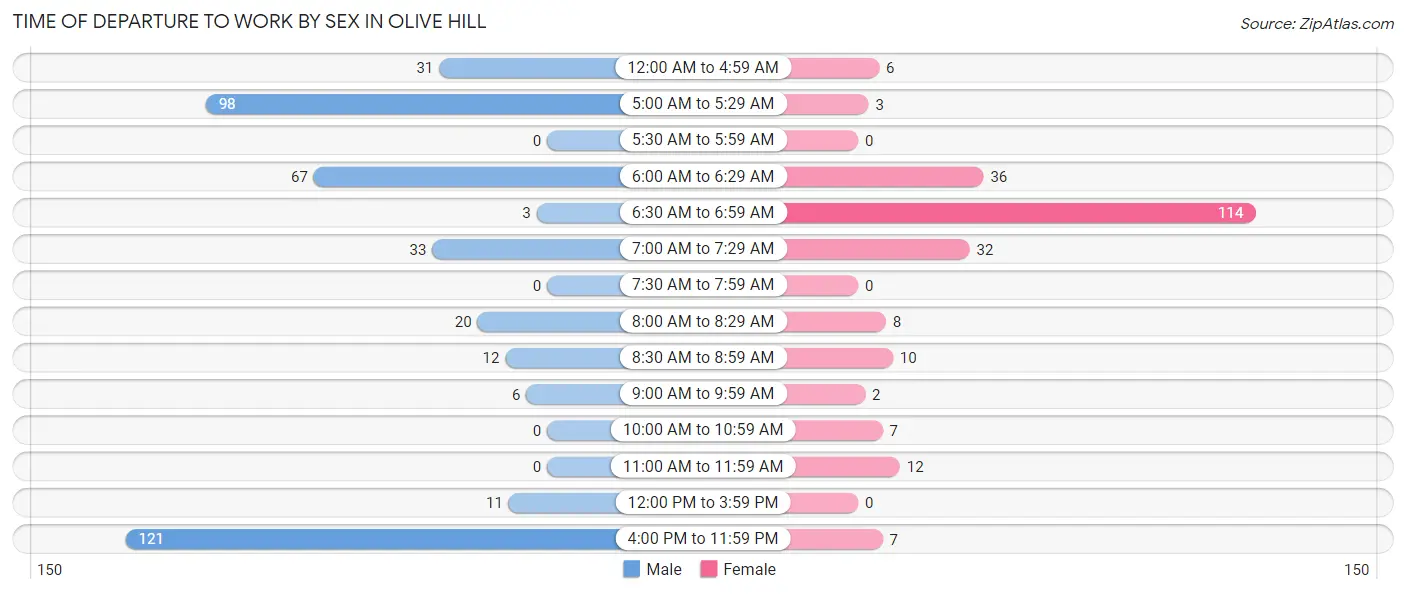
| Time of Departure | Male | Female |
| 12:00 AM to 4:59 AM | 31 (7.7%) | 6 (2.5%) |
| 5:00 AM to 5:29 AM | 98 (24.4%) | 3 (1.3%) |
| 5:30 AM to 5:59 AM | 0 (0.0%) | 0 (0.0%) |
| 6:00 AM to 6:29 AM | 67 (16.7%) | 36 (15.2%) |
| 6:30 AM to 6:59 AM | 3 (0.7%) | 114 (48.1%) |
| 7:00 AM to 7:29 AM | 33 (8.2%) | 32 (13.5%) |
| 7:30 AM to 7:59 AM | 0 (0.0%) | 0 (0.0%) |
| 8:00 AM to 8:29 AM | 20 (5.0%) | 8 (3.4%) |
| 8:30 AM to 8:59 AM | 12 (3.0%) | 10 (4.2%) |
| 9:00 AM to 9:59 AM | 6 (1.5%) | 2 (0.8%) |
| 10:00 AM to 10:59 AM | 0 (0.0%) | 7 (2.9%) |
| 11:00 AM to 11:59 AM | 0 (0.0%) | 12 (5.1%) |
| 12:00 PM to 3:59 PM | 11 (2.7%) | 0 (0.0%) |
| 4:00 PM to 11:59 PM | 121 (30.1%) | 7 (2.9%) |
| Total | 402 (100.0%) | 237 (100.0%) |
Housing Occupancy in Olive Hill
Occupancy by Ownership in Olive Hill
Of the total 724 dwellings in Olive Hill, owner-occupied units account for 490 (67.7%), while renter-occupied units make up 234 (32.3%).
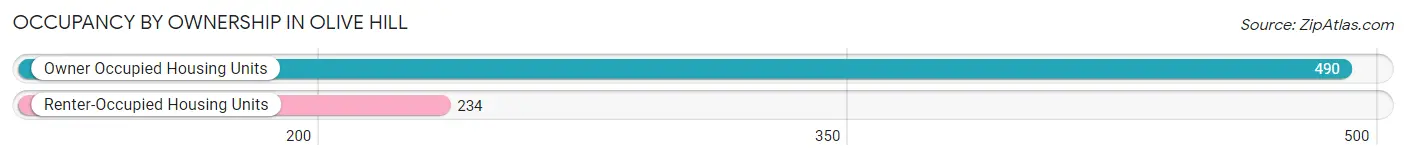
| Occupancy | # Housing Units | % Housing Units |
| Owner Occupied Housing Units | 490 | 67.7% |
| Renter-Occupied Housing Units | 234 | 32.3% |
| Total Occupied Housing Units | 724 | 100.0% |
Occupancy by Household Size in Olive Hill
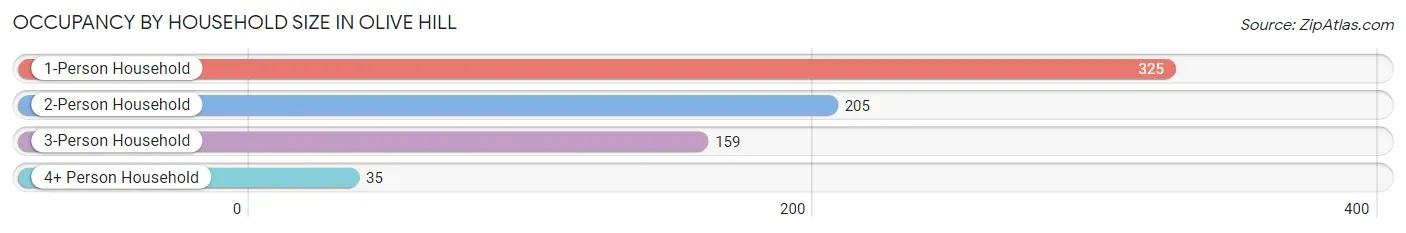
| Household Size | # Housing Units | % Housing Units |
| 1-Person Household | 325 | 44.9% |
| 2-Person Household | 205 | 28.3% |
| 3-Person Household | 159 | 22.0% |
| 4+ Person Household | 35 | 4.8% |
| Total Housing Units | 724 | 100.0% |
Occupancy by Ownership by Household Size in Olive Hill
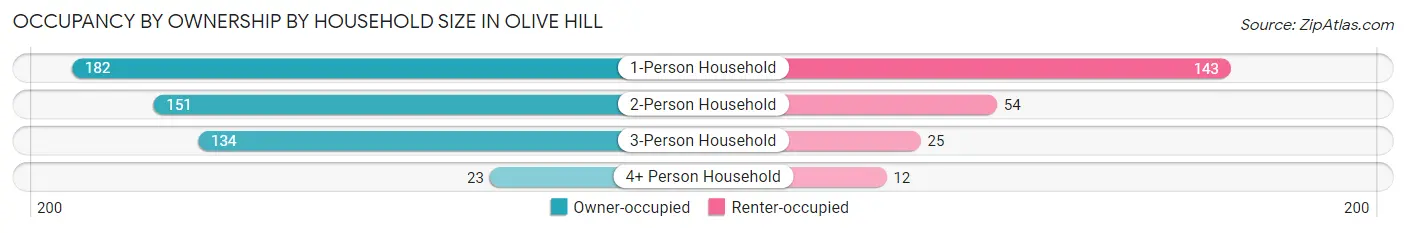
| Household Size | Owner-occupied | Renter-occupied |
| 1-Person Household | 182 (56.0%) | 143 (44.0%) |
| 2-Person Household | 151 (73.7%) | 54 (26.3%) |
| 3-Person Household | 134 (84.3%) | 25 (15.7%) |
| 4+ Person Household | 23 (65.7%) | 12 (34.3%) |
| Total Housing Units | 490 (67.7%) | 234 (32.3%) |
Occupancy by Educational Attainment in Olive Hill
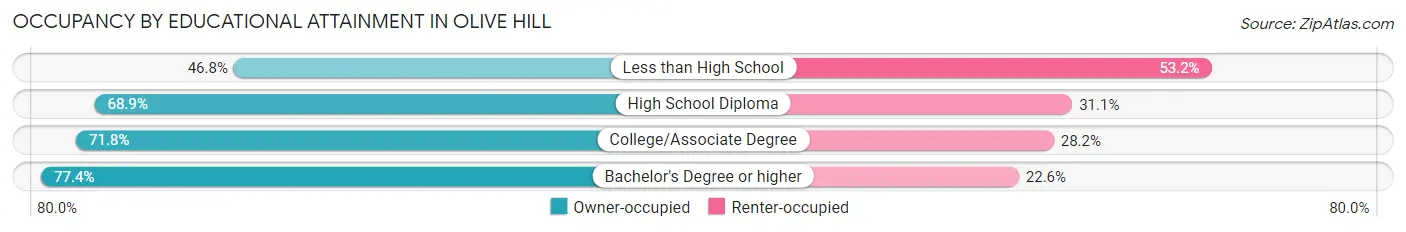
| Household Size | Owner-occupied | Renter-occupied |
| Less than High School | 59 (46.8%) | 67 (53.2%) |
| High School Diploma | 144 (68.9%) | 65 (31.1%) |
| College/Associate Degree | 181 (71.8%) | 71 (28.2%) |
| Bachelor's Degree or higher | 106 (77.4%) | 31 (22.6%) |
Occupancy by Age of Householder in Olive Hill
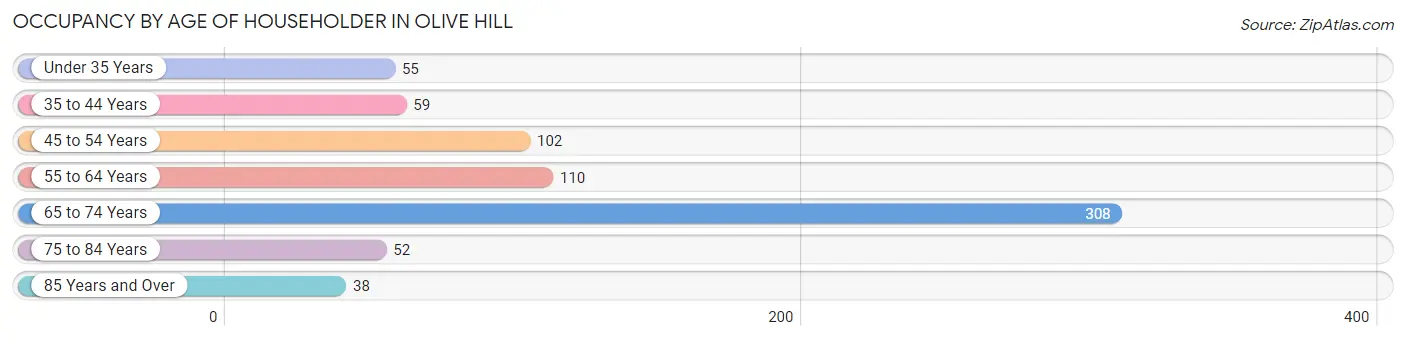
| Age Bracket | # Households | % Households |
| Under 35 Years | 55 | 7.6% |
| 35 to 44 Years | 59 | 8.2% |
| 45 to 54 Years | 102 | 14.1% |
| 55 to 64 Years | 110 | 15.2% |
| 65 to 74 Years | 308 | 42.5% |
| 75 to 84 Years | 52 | 7.2% |
| 85 Years and Over | 38 | 5.2% |
| Total | 724 | 100.0% |
Housing Finances in Olive Hill
Median Income by Occupancy in Olive Hill
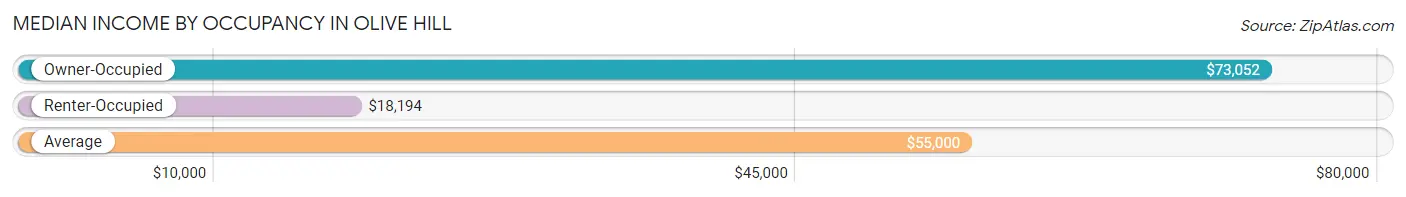
| Occupancy Type | # Households | Median Income |
| Owner-Occupied | 490 (67.7%) | $73,052 |
| Renter-Occupied | 234 (32.3%) | $18,194 |
| Average | 724 (100.0%) | $55,000 |
Occupancy by Householder Income Bracket in Olive Hill
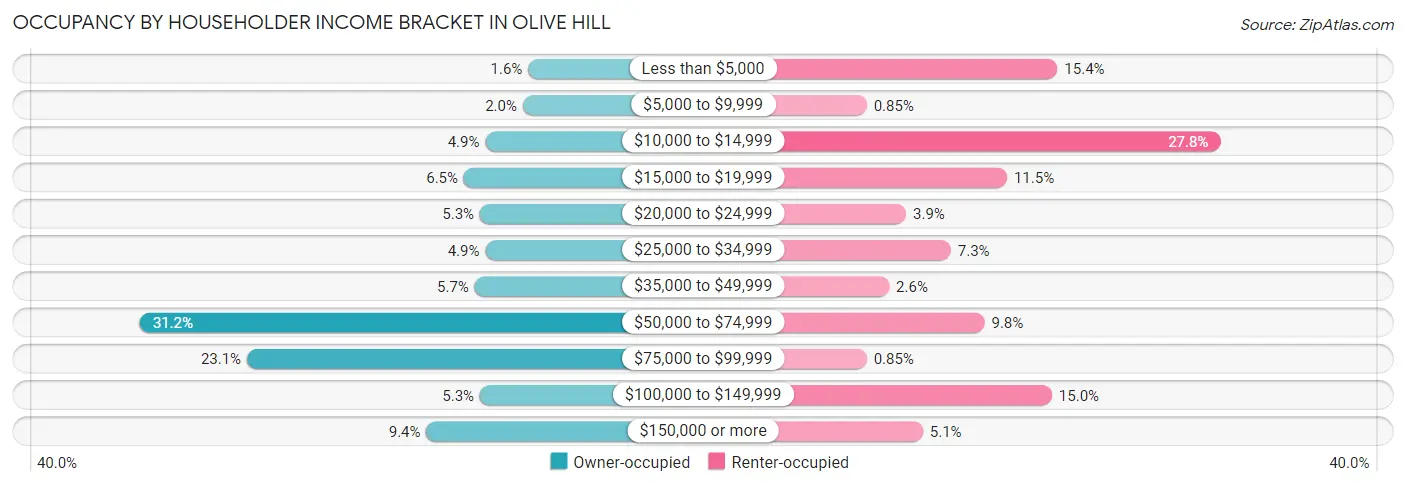
| Income Bracket | Owner-occupied | Renter-occupied |
| Less than $5,000 | 8 (1.6%) | 36 (15.4%) |
| $5,000 to $9,999 | 10 (2.0%) | 2 (0.9%) |
| $10,000 to $14,999 | 24 (4.9%) | 65 (27.8%) |
| $15,000 to $19,999 | 32 (6.5%) | 27 (11.5%) |
| $20,000 to $24,999 | 26 (5.3%) | 9 (3.8%) |
| $25,000 to $34,999 | 24 (4.9%) | 17 (7.3%) |
| $35,000 to $49,999 | 28 (5.7%) | 6 (2.6%) |
| $50,000 to $74,999 | 153 (31.2%) | 23 (9.8%) |
| $75,000 to $99,999 | 113 (23.1%) | 2 (0.9%) |
| $100,000 to $149,999 | 26 (5.3%) | 35 (15.0%) |
| $150,000 or more | 46 (9.4%) | 12 (5.1%) |
| Total | 490 (100.0%) | 234 (100.0%) |
Monthly Housing Cost Tiers in Olive Hill
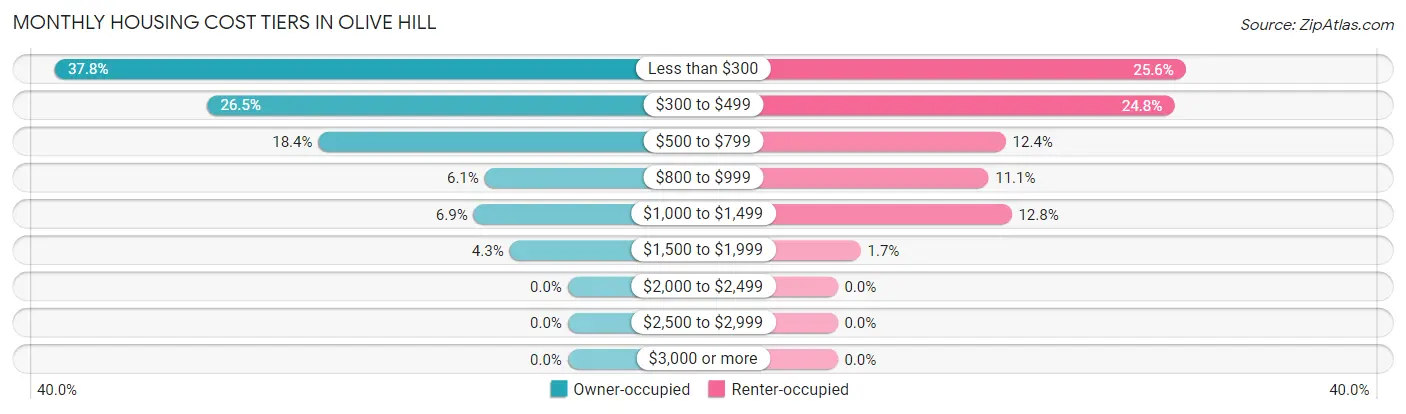
| Monthly Cost | Owner-occupied | Renter-occupied |
| Less than $300 | 185 (37.8%) | 60 (25.6%) |
| $300 to $499 | 130 (26.5%) | 58 (24.8%) |
| $500 to $799 | 90 (18.4%) | 29 (12.4%) |
| $800 to $999 | 30 (6.1%) | 26 (11.1%) |
| $1,000 to $1,499 | 34 (6.9%) | 30 (12.8%) |
| $1,500 to $1,999 | 21 (4.3%) | 4 (1.7%) |
| $2,000 to $2,499 | 0 (0.0%) | 0 (0.0%) |
| $2,500 to $2,999 | 0 (0.0%) | 0 (0.0%) |
| $3,000 or more | 0 (0.0%) | 0 (0.0%) |
| Total | 490 (100.0%) | 234 (100.0%) |
Physical Housing Characteristics in Olive Hill
Housing Structures in Olive Hill
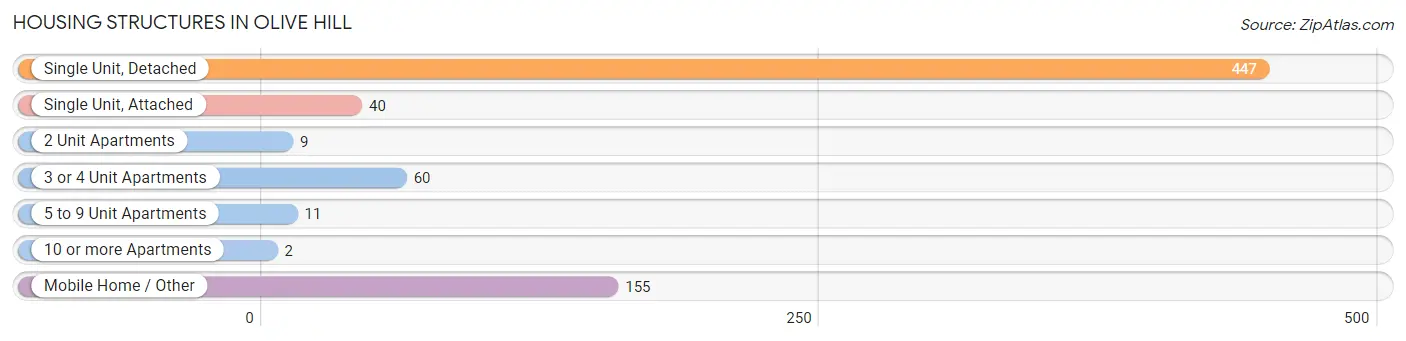
| Structure Type | # Housing Units | % Housing Units |
| Single Unit, Detached | 447 | 61.7% |
| Single Unit, Attached | 40 | 5.5% |
| 2 Unit Apartments | 9 | 1.2% |
| 3 or 4 Unit Apartments | 60 | 8.3% |
| 5 to 9 Unit Apartments | 11 | 1.5% |
| 10 or more Apartments | 2 | 0.3% |
| Mobile Home / Other | 155 | 21.4% |
| Total | 724 | 100.0% |
Housing Structures by Occupancy in Olive Hill
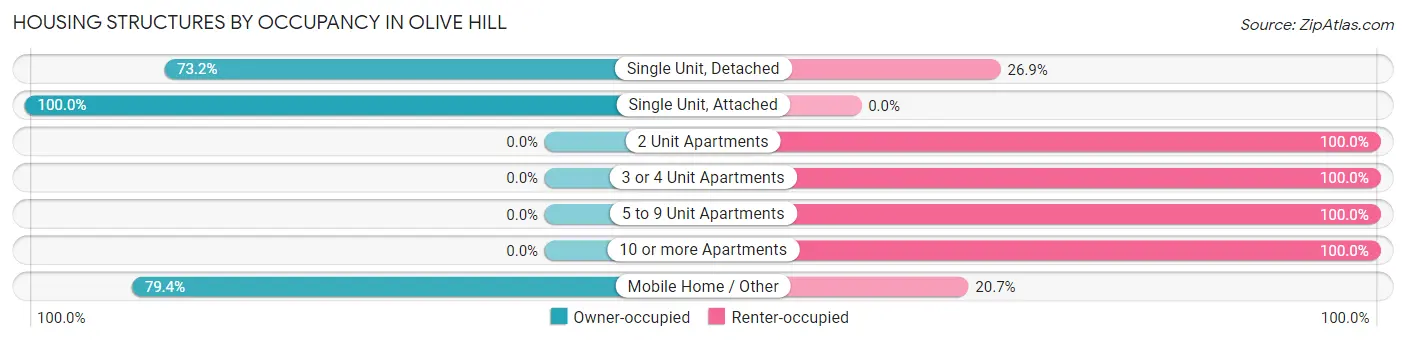
| Structure Type | Owner-occupied | Renter-occupied |
| Single Unit, Detached | 327 (73.2%) | 120 (26.9%) |
| Single Unit, Attached | 40 (100.0%) | 0 (0.0%) |
| 2 Unit Apartments | 0 (0.0%) | 9 (100.0%) |
| 3 or 4 Unit Apartments | 0 (0.0%) | 60 (100.0%) |
| 5 to 9 Unit Apartments | 0 (0.0%) | 11 (100.0%) |
| 10 or more Apartments | 0 (0.0%) | 2 (100.0%) |
| Mobile Home / Other | 123 (79.3%) | 32 (20.6%) |
| Total | 490 (67.7%) | 234 (32.3%) |
Housing Structures by Number of Rooms in Olive Hill
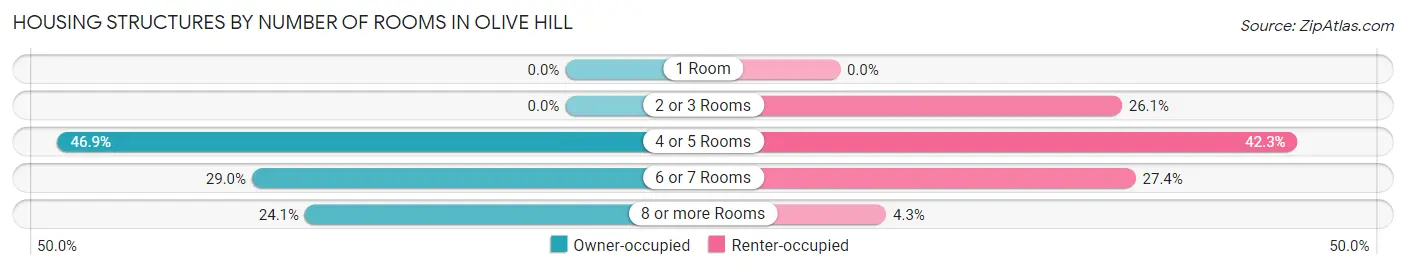
| Number of Rooms | Owner-occupied | Renter-occupied |
| 1 Room | 0 (0.0%) | 0 (0.0%) |
| 2 or 3 Rooms | 0 (0.0%) | 61 (26.1%) |
| 4 or 5 Rooms | 230 (46.9%) | 99 (42.3%) |
| 6 or 7 Rooms | 142 (29.0%) | 64 (27.4%) |
| 8 or more Rooms | 118 (24.1%) | 10 (4.3%) |
| Total | 490 (100.0%) | 234 (100.0%) |
Housing Structure by Heating Type in Olive Hill
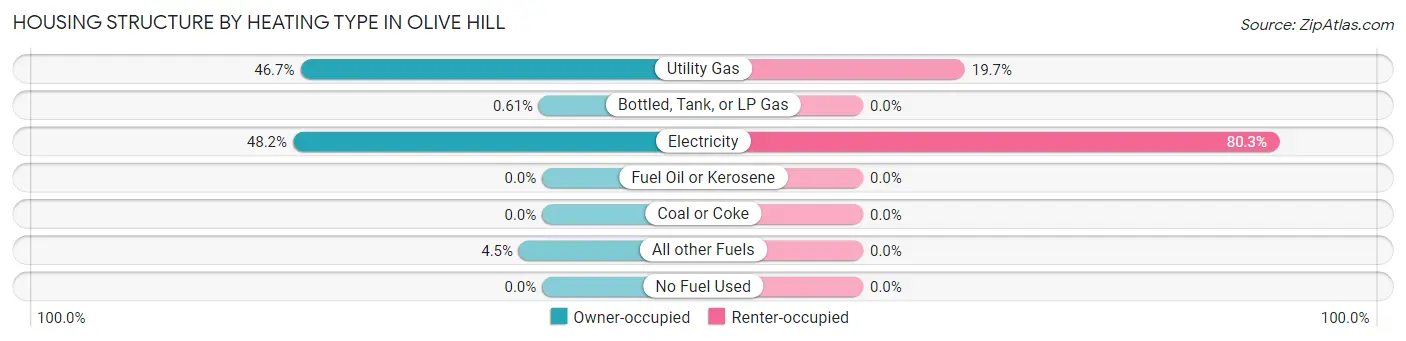
| Heating Type | Owner-occupied | Renter-occupied |
| Utility Gas | 229 (46.7%) | 46 (19.7%) |
| Bottled, Tank, or LP Gas | 3 (0.6%) | 0 (0.0%) |
| Electricity | 236 (48.2%) | 188 (80.3%) |
| Fuel Oil or Kerosene | 0 (0.0%) | 0 (0.0%) |
| Coal or Coke | 0 (0.0%) | 0 (0.0%) |
| All other Fuels | 22 (4.5%) | 0 (0.0%) |
| No Fuel Used | 0 (0.0%) | 0 (0.0%) |
| Total | 490 (100.0%) | 234 (100.0%) |
Household Vehicle Usage in Olive Hill
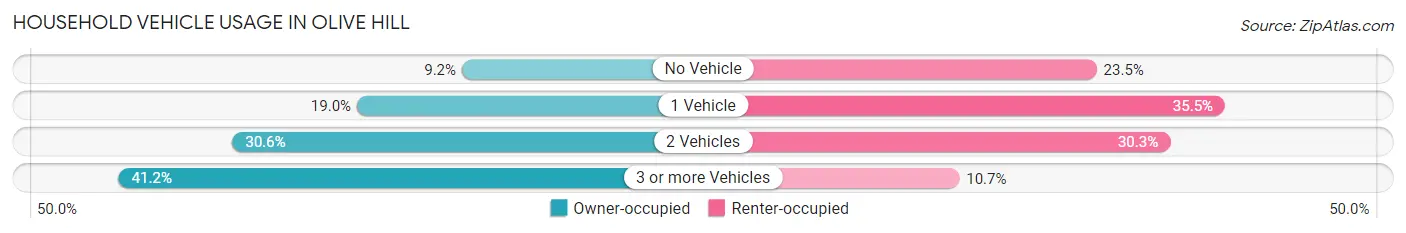
| Vehicles per Household | Owner-occupied | Renter-occupied |
| No Vehicle | 45 (9.2%) | 55 (23.5%) |
| 1 Vehicle | 93 (19.0%) | 83 (35.5%) |
| 2 Vehicles | 150 (30.6%) | 71 (30.3%) |
| 3 or more Vehicles | 202 (41.2%) | 25 (10.7%) |
| Total | 490 (100.0%) | 234 (100.0%) |
Real Estate & Mortgages in Olive Hill
Real Estate and Mortgage Overview in Olive Hill
| Characteristic | Without Mortgage | With Mortgage |
| Housing Units | 359 | 131 |
| Median Property Value | $97,500 | $89,600 |
| Median Household Income | $73,166 | $29 |
| Monthly Housing Costs | $367 | $0 |
| Real Estate Taxes | $425 | $9 |
Property Value by Mortgage Status in Olive Hill
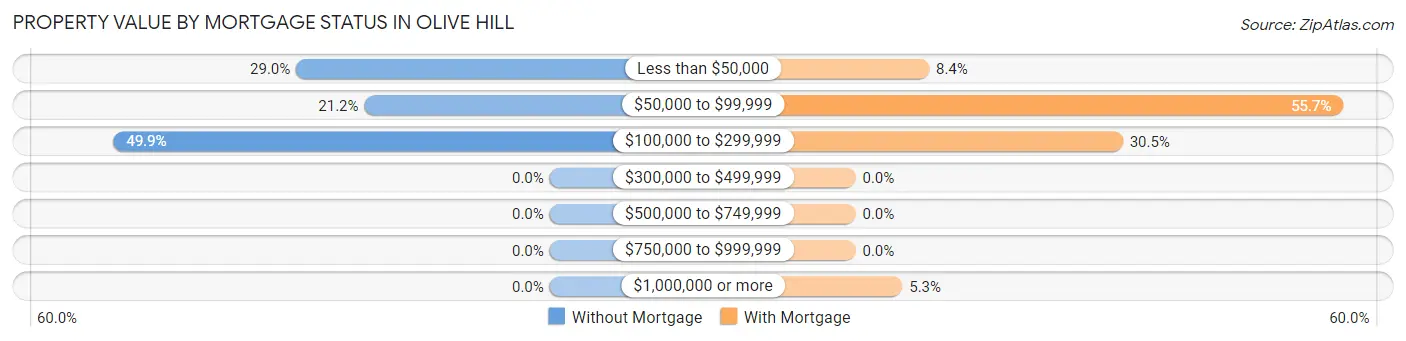
| Property Value | Without Mortgage | With Mortgage |
| Less than $50,000 | 104 (29.0%) | 11 (8.4%) |
| $50,000 to $99,999 | 76 (21.2%) | 73 (55.7%) |
| $100,000 to $299,999 | 179 (49.9%) | 40 (30.5%) |
| $300,000 to $499,999 | 0 (0.0%) | 0 (0.0%) |
| $500,000 to $749,999 | 0 (0.0%) | 0 (0.0%) |
| $750,000 to $999,999 | 0 (0.0%) | 0 (0.0%) |
| $1,000,000 or more | 0 (0.0%) | 7 (5.3%) |
| Total | 359 (100.0%) | 131 (100.0%) |
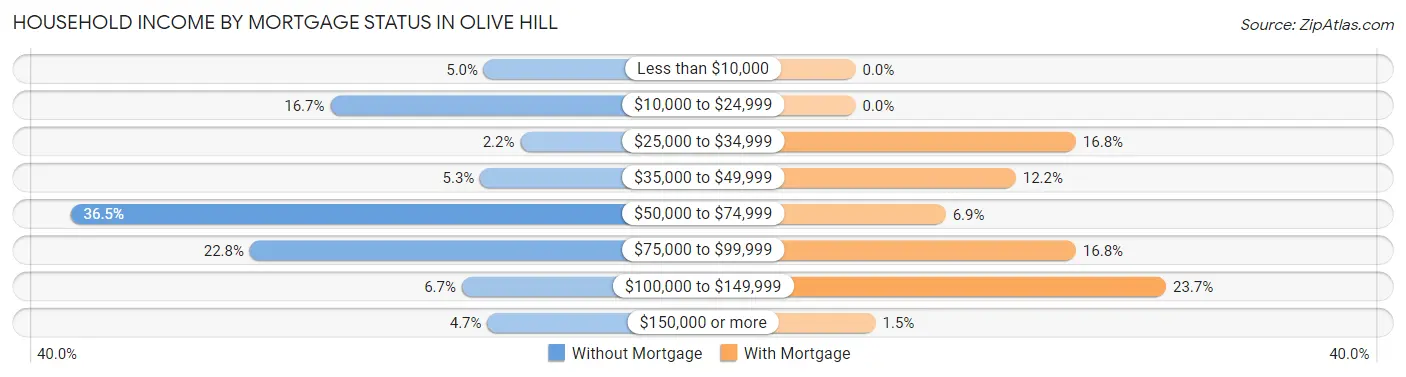
Household Income by Mortgage Status in Olive Hill
| Household Income | Without Mortgage | With Mortgage |
| Less than $10,000 | 18 (5.0%) | 0 (0.0%) |
| $10,000 to $24,999 | 60 (16.7%) | 0 (0.0%) |
| $25,000 to $34,999 | 8 (2.2%) | 22 (16.8%) |
| $35,000 to $49,999 | 19 (5.3%) | 16 (12.2%) |
| $50,000 to $74,999 | 131 (36.5%) | 9 (6.9%) |
| $75,000 to $99,999 | 82 (22.8%) | 22 (16.8%) |
| $100,000 to $149,999 | 24 (6.7%) | 31 (23.7%) |
| $150,000 or more | 17 (4.7%) | 2 (1.5%) |
| Total | 359 (100.0%) | 131 (100.0%) |
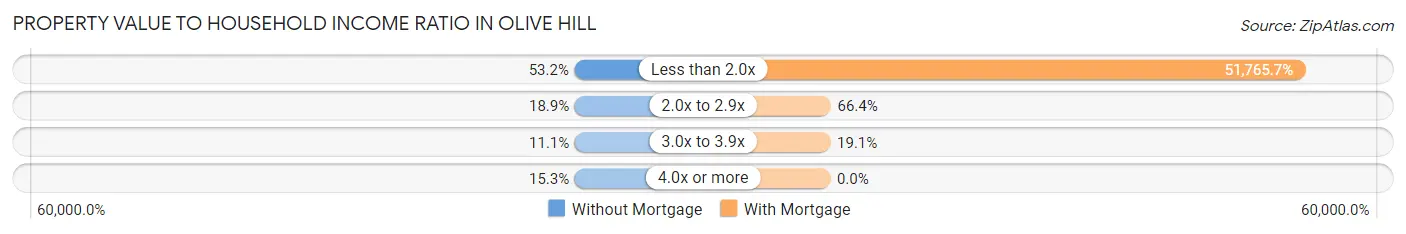
Property Value to Household Income Ratio in Olive Hill
| Value-to-Income Ratio | Without Mortgage | With Mortgage |
| Less than 2.0x | 191 (53.2%) | 67,813 (51,765.7%) |
| 2.0x to 2.9x | 68 (18.9%) | 87 (66.4%) |
| 3.0x to 3.9x | 40 (11.1%) | 25 (19.1%) |
| 4.0x or more | 55 (15.3%) | 0 (0.0%) |
| Total | 359 (100.0%) | 131 (100.0%) |
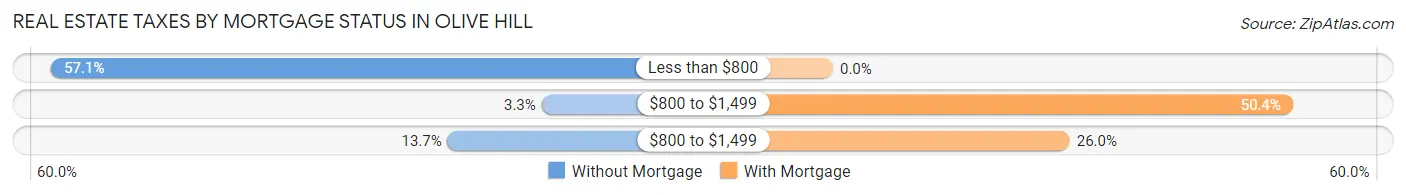
Real Estate Taxes by Mortgage Status in Olive Hill
| Property Taxes | Without Mortgage | With Mortgage |
| Less than $800 | 205 (57.1%) | 0 (0.0%) |
| $800 to $1,499 | 12 (3.3%) | 66 (50.4%) |
| $800 to $1,499 | 49 (13.7%) | 34 (26.0%) |
| Total | 359 (100.0%) | 131 (100.0%) |
Health & Disability in Olive Hill
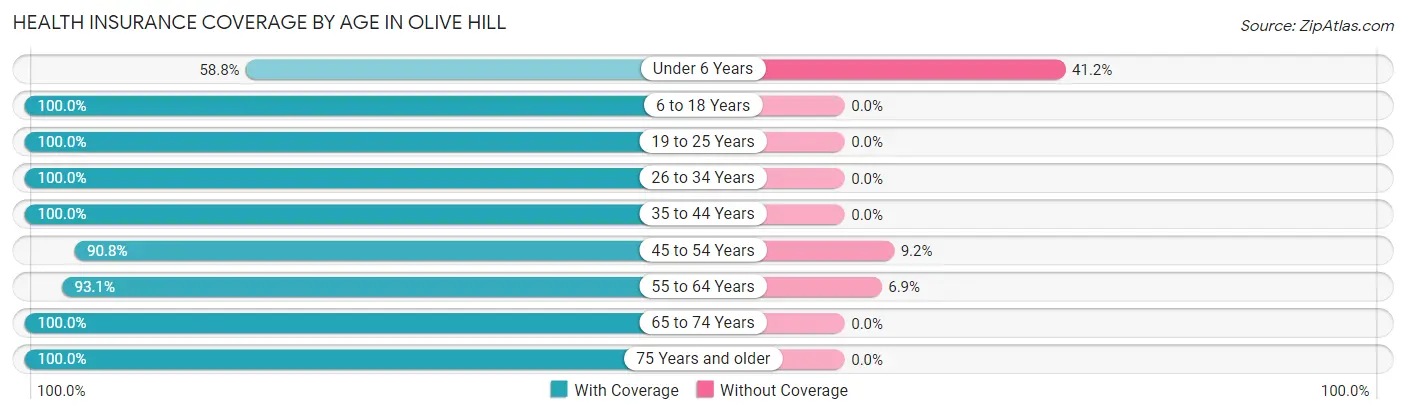
Health Insurance Coverage by Age in Olive Hill
| Age Bracket | With Coverage | Without Coverage |
| Under 6 Years | 10 (58.8%) | 7 (41.2%) |
| 6 to 18 Years | 181 (100.0%) | 0 (0.0%) |
| 19 to 25 Years | 35 (100.0%) | 0 (0.0%) |
| 26 to 34 Years | 107 (100.0%) | 0 (0.0%) |
| 35 to 44 Years | 218 (100.0%) | 0 (0.0%) |
| 45 to 54 Years | 197 (90.8%) | 20 (9.2%) |
| 55 to 64 Years | 243 (93.1%) | 18 (6.9%) |
| 65 to 74 Years | 374 (100.0%) | 0 (0.0%) |
| 75 Years and older | 135 (100.0%) | 0 (0.0%) |
| Total | 1,500 (97.1%) | 45 (2.9%) |
Health Insurance Coverage by Citizenship Status in Olive Hill
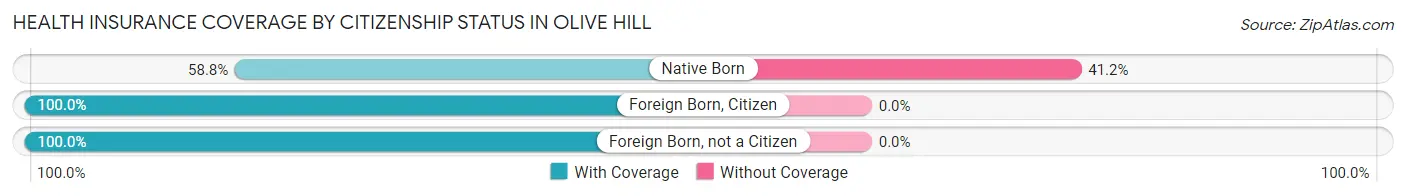
| Citizenship Status | With Coverage | Without Coverage |
| Native Born | 10 (58.8%) | 7 (41.2%) |
| Foreign Born, Citizen | 181 (100.0%) | 0 (0.0%) |
| Foreign Born, not a Citizen | 35 (100.0%) | 0 (0.0%) |
Health Insurance Coverage by Household Income in Olive Hill
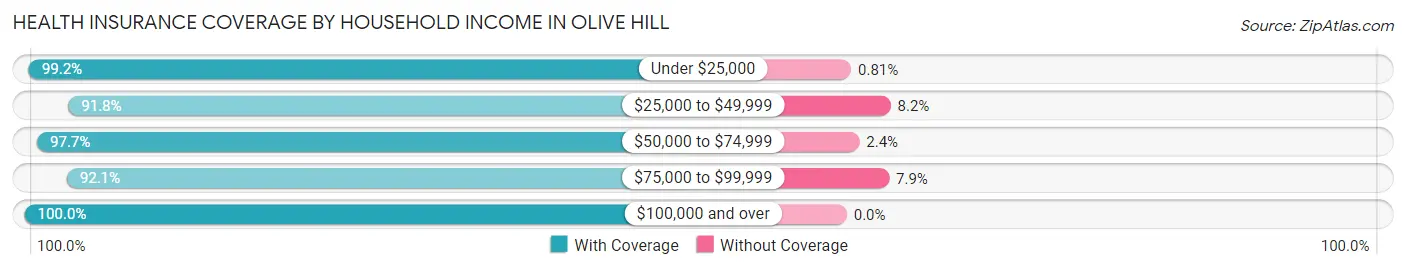
| Household Income | With Coverage | Without Coverage |
| Under $25,000 | 369 (99.2%) | 3 (0.8%) |
| $25,000 to $49,999 | 123 (91.8%) | 11 (8.2%) |
| $50,000 to $74,999 | 498 (97.7%) | 12 (2.4%) |
| $75,000 to $99,999 | 221 (92.1%) | 19 (7.9%) |
| $100,000 and over | 289 (100.0%) | 0 (0.0%) |
Public vs Private Health Insurance Coverage by Age in Olive Hill
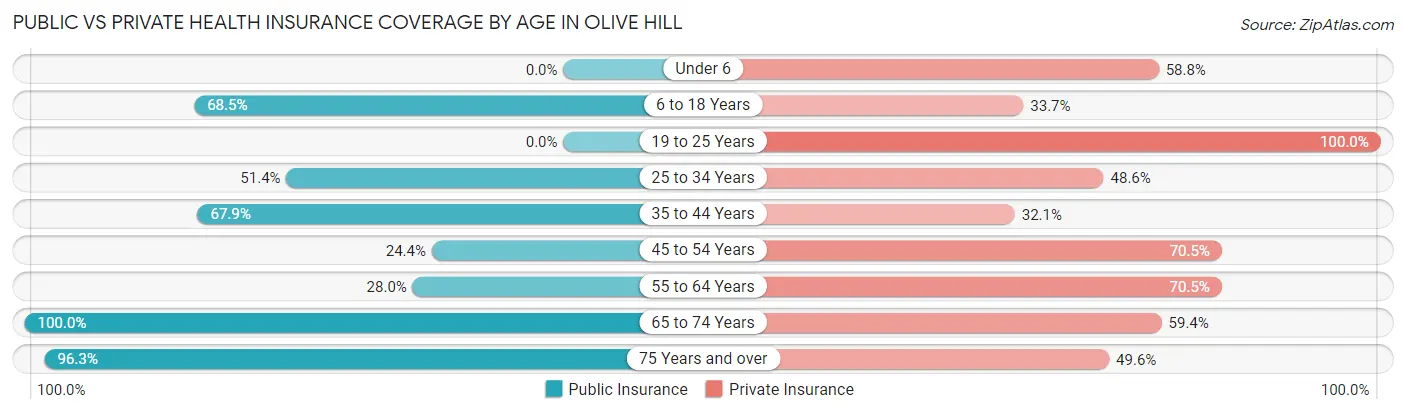
| Age Bracket | Public Insurance | Private Insurance |
| Under 6 | 0 (0.0%) | 10 (58.8%) |
| 6 to 18 Years | 124 (68.5%) | 61 (33.7%) |
| 19 to 25 Years | 0 (0.0%) | 35 (100.0%) |
| 25 to 34 Years | 55 (51.4%) | 52 (48.6%) |
| 35 to 44 Years | 148 (67.9%) | 70 (32.1%) |
| 45 to 54 Years | 53 (24.4%) | 153 (70.5%) |
| 55 to 64 Years | 73 (28.0%) | 184 (70.5%) |
| 65 to 74 Years | 374 (100.0%) | 222 (59.4%) |
| 75 Years and over | 130 (96.3%) | 67 (49.6%) |
| Total | 957 (61.9%) | 854 (55.3%) |
Disability Status by Sex by Age in Olive Hill
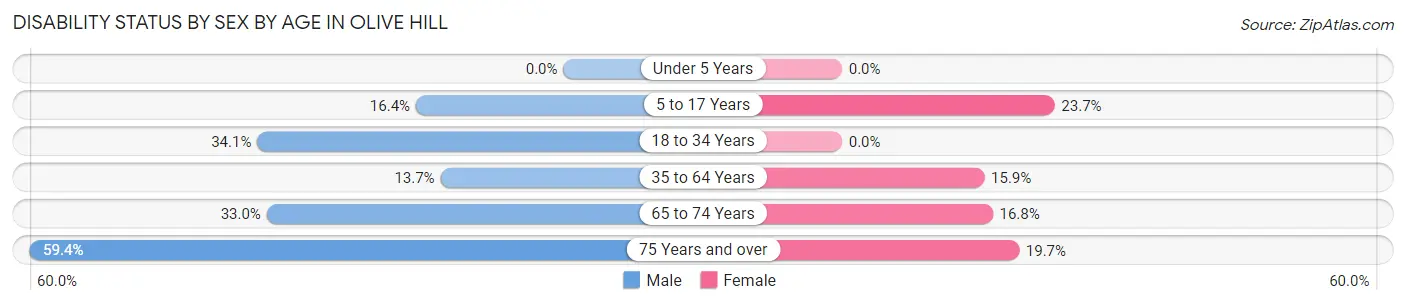
| Age Bracket | Male | Female |
| Under 5 Years | 0 (0.0%) | 0 (0.0%) |
| 5 to 17 Years | 11 (16.4%) | 18 (23.7%) |
| 18 to 34 Years | 30 (34.1%) | 0 (0.0%) |
| 35 to 64 Years | 59 (13.7%) | 42 (15.9%) |
| 65 to 74 Years | 37 (33.0%) | 44 (16.8%) |
| 75 Years and over | 38 (59.4%) | 14 (19.7%) |
Disability Class by Sex by Age in Olive Hill
Disability Class: Hearing Difficulty
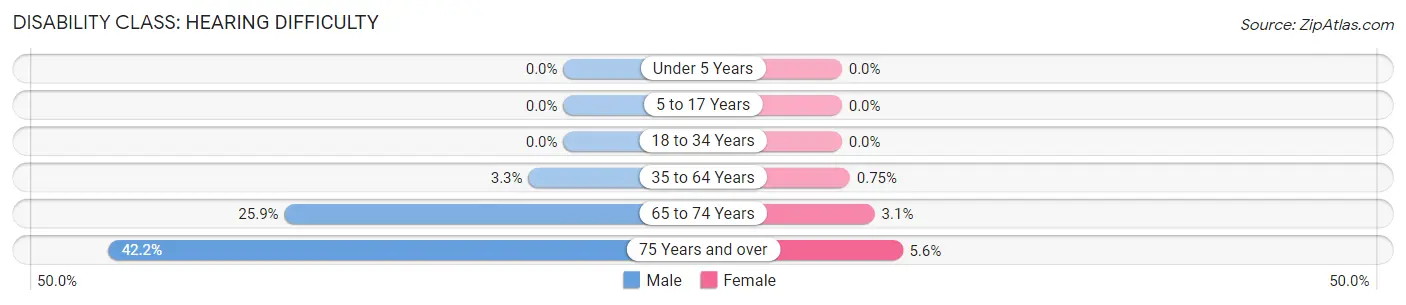
| Age Bracket | Male | Female |
| Under 5 Years | 0 (0.0%) | 0 (0.0%) |
| 5 to 17 Years | 0 (0.0%) | 0 (0.0%) |
| 18 to 34 Years | 0 (0.0%) | 0 (0.0%) |
| 35 to 64 Years | 14 (3.3%) | 2 (0.7%) |
| 65 to 74 Years | 29 (25.9%) | 8 (3.0%) |
| 75 Years and over | 27 (42.2%) | 4 (5.6%) |
Disability Class: Vision Difficulty
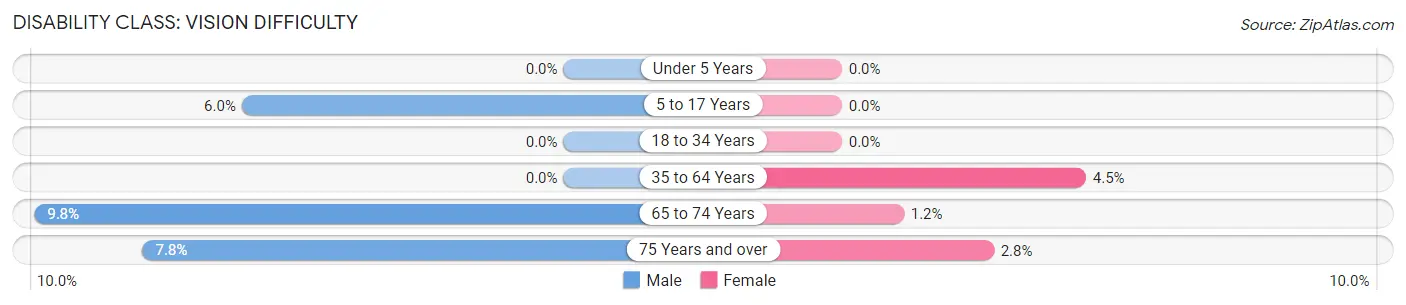
| Age Bracket | Male | Female |
| Under 5 Years | 0 (0.0%) | 0 (0.0%) |
| 5 to 17 Years | 4 (6.0%) | 0 (0.0%) |
| 18 to 34 Years | 0 (0.0%) | 0 (0.0%) |
| 35 to 64 Years | 0 (0.0%) | 12 (4.5%) |
| 65 to 74 Years | 11 (9.8%) | 3 (1.1%) |
| 75 Years and over | 5 (7.8%) | 2 (2.8%) |
Disability Class: Cognitive Difficulty
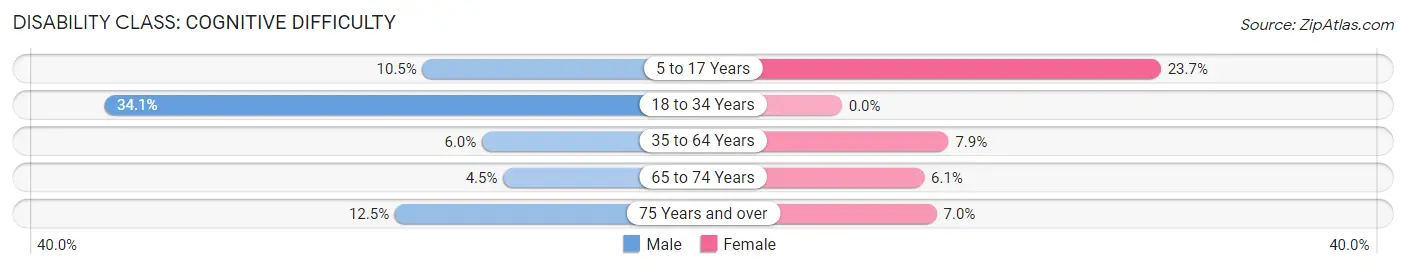
| Age Bracket | Male | Female |
| 5 to 17 Years | 7 (10.4%) | 18 (23.7%) |
| 18 to 34 Years | 30 (34.1%) | 0 (0.0%) |
| 35 to 64 Years | 26 (6.0%) | 21 (7.9%) |
| 65 to 74 Years | 5 (4.5%) | 16 (6.1%) |
| 75 Years and over | 8 (12.5%) | 5 (7.0%) |
Disability Class: Ambulatory Difficulty
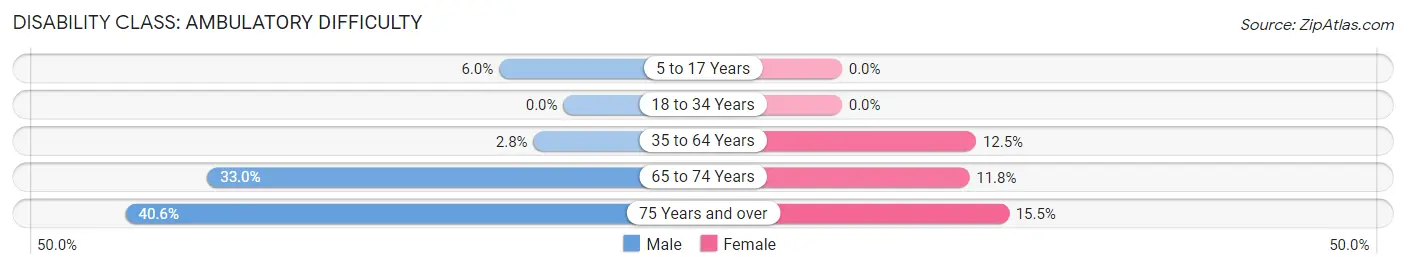
| Age Bracket | Male | Female |
| 5 to 17 Years | 4 (6.0%) | 0 (0.0%) |
| 18 to 34 Years | 0 (0.0%) | 0 (0.0%) |
| 35 to 64 Years | 12 (2.8%) | 33 (12.4%) |
| 65 to 74 Years | 37 (33.0%) | 31 (11.8%) |
| 75 Years and over | 26 (40.6%) | 11 (15.5%) |
Disability Class: Self-Care Difficulty
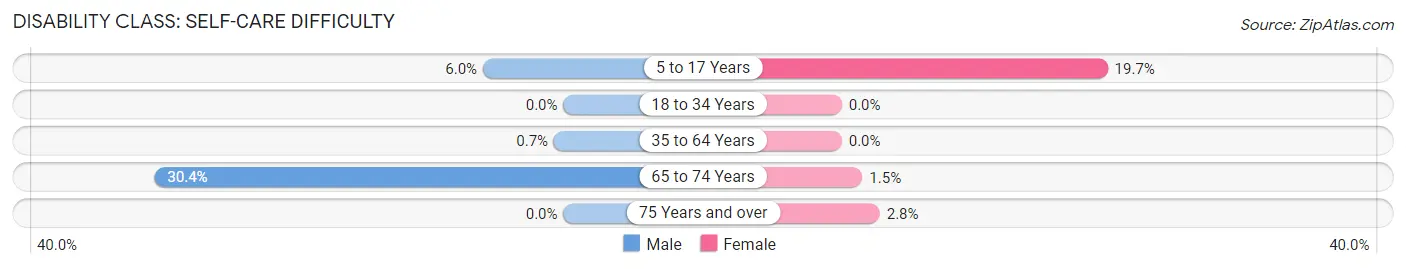
| Age Bracket | Male | Female |
| 5 to 17 Years | 4 (6.0%) | 15 (19.7%) |
| 18 to 34 Years | 0 (0.0%) | 0 (0.0%) |
| 35 to 64 Years | 3 (0.7%) | 0 (0.0%) |
| 65 to 74 Years | 34 (30.4%) | 4 (1.5%) |
| 75 Years and over | 0 (0.0%) | 2 (2.8%) |
Technology Access in Olive Hill
Computing Device Access in Olive Hill
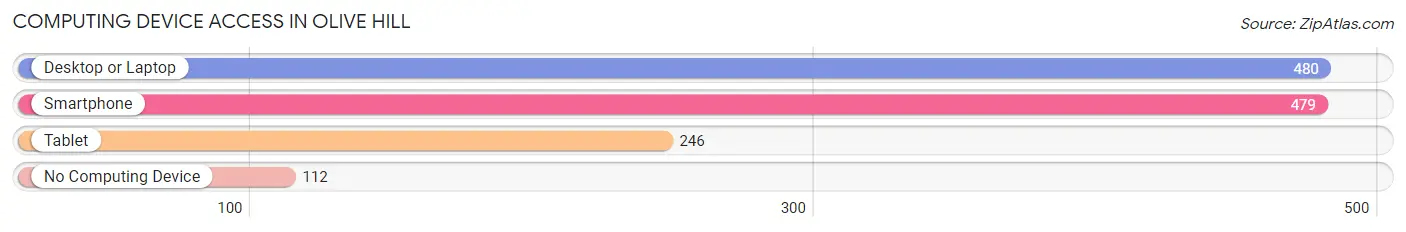
| Device Type | # Households | % Households |
| Desktop or Laptop | 480 | 66.3% |
| Smartphone | 479 | 66.2% |
| Tablet | 246 | 34.0% |
| No Computing Device | 112 | 15.5% |
| Total | 724 | 100.0% |
Internet Access in Olive Hill
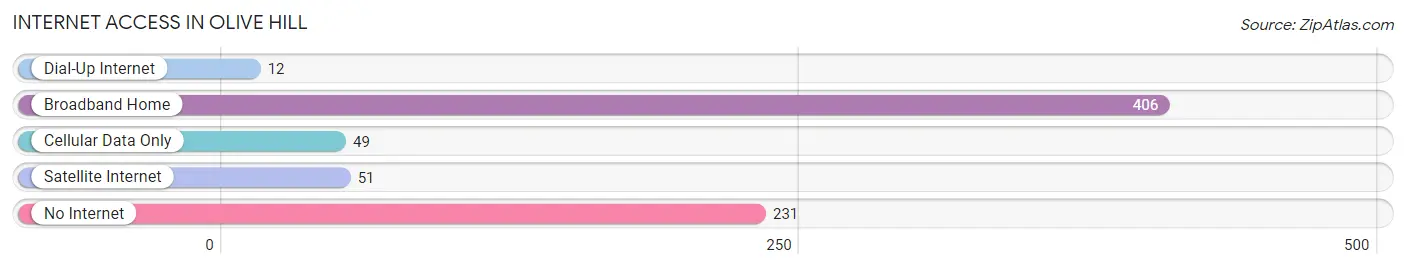
| Internet Type | # Households | % Households |
| Dial-Up Internet | 12 | 1.7% |
| Broadband Home | 406 | 56.1% |
| Cellular Data Only | 49 | 6.8% |
| Satellite Internet | 51 | 7.0% |
| No Internet | 231 | 31.9% |
| Total | 724 | 100.0% |
Olive Hill Summary
Olive Hill is a small city located in Carter County, Kentucky, United States. It is situated in the foothills of the Appalachian Mountains, approximately 50 miles east of Lexington. The city has a population of approximately 2,500 people and is the county seat of Carter County.
History
Olive Hill was founded in 1817 by William and Mary Olive, who were among the first settlers in the area. The city was named after the Olive family, who were among the first settlers in the area. The city was incorporated in 1820 and has remained a small, rural community ever since.
The city was an important stop on the Underground Railroad, with many slaves escaping to freedom in the north. The city was also a major stop on the Kentucky Central Railroad, which connected the city to Lexington and Cincinnati.
Geography
Olive Hill is located in the foothills of the Appalachian Mountains, approximately 50 miles east of Lexington. The city is situated in a valley surrounded by rolling hills and is bordered by the Little Sandy River. The city has a total area of 2.2 square miles, all of which is land.
The climate in Olive Hill is humid subtropical, with hot, humid summers and mild winters. The average annual temperature is around 60 degrees Fahrenheit, with an average high of around 80 degrees in the summer and an average low of around 40 degrees in the winter.
Economy
Olive Hill’s economy is largely based on agriculture and tourism. The city is home to several farms, which produce a variety of crops, including corn, soybeans, wheat, and hay. The city is also home to several tourist attractions, including the Carter County Museum, the Olive Hill Historical Society, and the Olive Hill Arts Council.
Demographics
As of the 2010 census, Olive Hill had a population of 2,500 people. The racial makeup of the city was 97.2% White, 0.8% African American, 0.4% Native American, 0.2% Asian, and 1.4% from other races. The median household income was $30,000, and the median family income was $35,000.
Conclusion
Olive Hill is a small city located in Carter County, Kentucky, United States. It is situated in the foothills of the Appalachian Mountains, approximately 50 miles east of Lexington. The city has a population of approximately 2,500 people and is the county seat of Carter County. The city was founded in 1817 and has remained a small, rural community ever since. The economy of Olive Hill is largely based on agriculture and tourism, and the city is home to several tourist attractions. As of the 2010 census, Olive Hill had a population of 2,500 people, with a median household income of $30,000.
Common Questions
What is Per Capita Income in Olive Hill?
Per Capita income in Olive Hill is $30,694.
What is the Median Family Income in Olive Hill?
Median Family Income in Olive Hill is $74,448.
What is the Median Household income in Olive Hill?
Median Household Income in Olive Hill is $55,000.
What is Income or Wage Gap in Olive Hill?
Income or Wage Gap in Olive Hill is 36.1%.
Women in Olive Hill earn 63.9 cents for every dollar earned by a man.
What is Inequality or Gini Index in Olive Hill?
Inequality or Gini Index in Olive Hill is 0.45.
What is the Total Population of Olive Hill?
Total Population of Olive Hill is 1,545.
What is the Total Male Population of Olive Hill?
Total Male Population of Olive Hill is 767.
What is the Total Female Population of Olive Hill?
Total Female Population of Olive Hill is 778.
What is the Ratio of Males per 100 Females in Olive Hill?
There are 98.59 Males per 100 Females in Olive Hill.
What is the Ratio of Females per 100 Males in Olive Hill?
There are 101.43 Females per 100 Males in Olive Hill.
What is the Median Population Age in Olive Hill?
Median Population Age in Olive Hill is 54.9 Years.
What is the Average Family Size in Olive Hill
Average Family Size in Olive Hill is 3.0 People.
What is the Average Household Size in Olive Hill
Average Household Size in Olive Hill is 2.1 People.
How Large is the Labor Force in Olive Hill?
There are 696 People in the Labor Forcein in Olive Hill.
What is the Percentage of People in the Labor Force in Olive Hill?
49.7% of People are in the Labor Force in Olive Hill.
What is the Unemployment Rate in Olive Hill?
Unemployment Rate in Olive Hill is 0.9%.