Fairview, KY Map & Demographics
Fairview Map
Fairview Overview
$36,547
PER CAPITA INCOME
$72,083
AVG FAMILY INCOME
$70,000
AVG HOUSEHOLD INCOME
54.4%
WAGE / INCOME GAP [ % ]
45.6¢/ $1
WAGE / INCOME GAP [ $ ]
0.42
INEQUALITY / GINI INDEX
148
TOTAL POPULATION
87
MALE POPULATION
61
FEMALE POPULATION
142.62
MALES / 100 FEMALES
70.11
FEMALES / 100 MALES
51.4
MEDIAN AGE
2.7
AVG FAMILY SIZE
2.3
AVG HOUSEHOLD SIZE
81
LABOR FORCE [ PEOPLE ]
62.3%
PERCENT IN LABOR FORCE
Fairview Area Codes
Income in Fairview
Income Overview in Fairview
Per Capita Income in Fairview is $36,547, while median incomes of families and households are $72,083 and $70,000 respectively.
| Characteristic | Number | Measure |
| Per Capita Income | 148 | $36,547 |
| Median Family Income | 48 | $72,083 |
| Mean Family Income | 48 | $100,721 |
| Median Household Income | 64 | $70,000 |
| Mean Household Income | 64 | $84,894 |
| Income Deficit | 48 | $0 |
| Wage / Income Gap (%) | 148 | 54.38% |
| Wage / Income Gap ($) | 148 | 45.62¢ per $1 |
| Gini / Inequality Index | 148 | 0.42 |
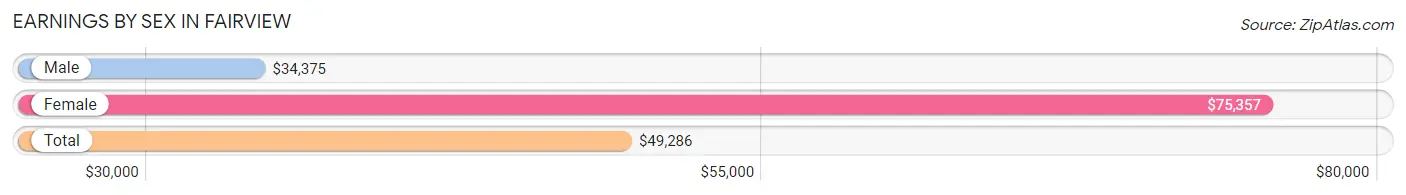
Earnings by Sex in Fairview
Average Earnings in Fairview are $49,286, $34,375 for men and $75,357 for women, a difference of 54.4%.
| Sex | Number | Average Earnings |
| Male | 54 (64.3%) | $34,375 |
| Female | 30 (35.7%) | $75,357 |
| Total | 84 (100.0%) | $49,286 |
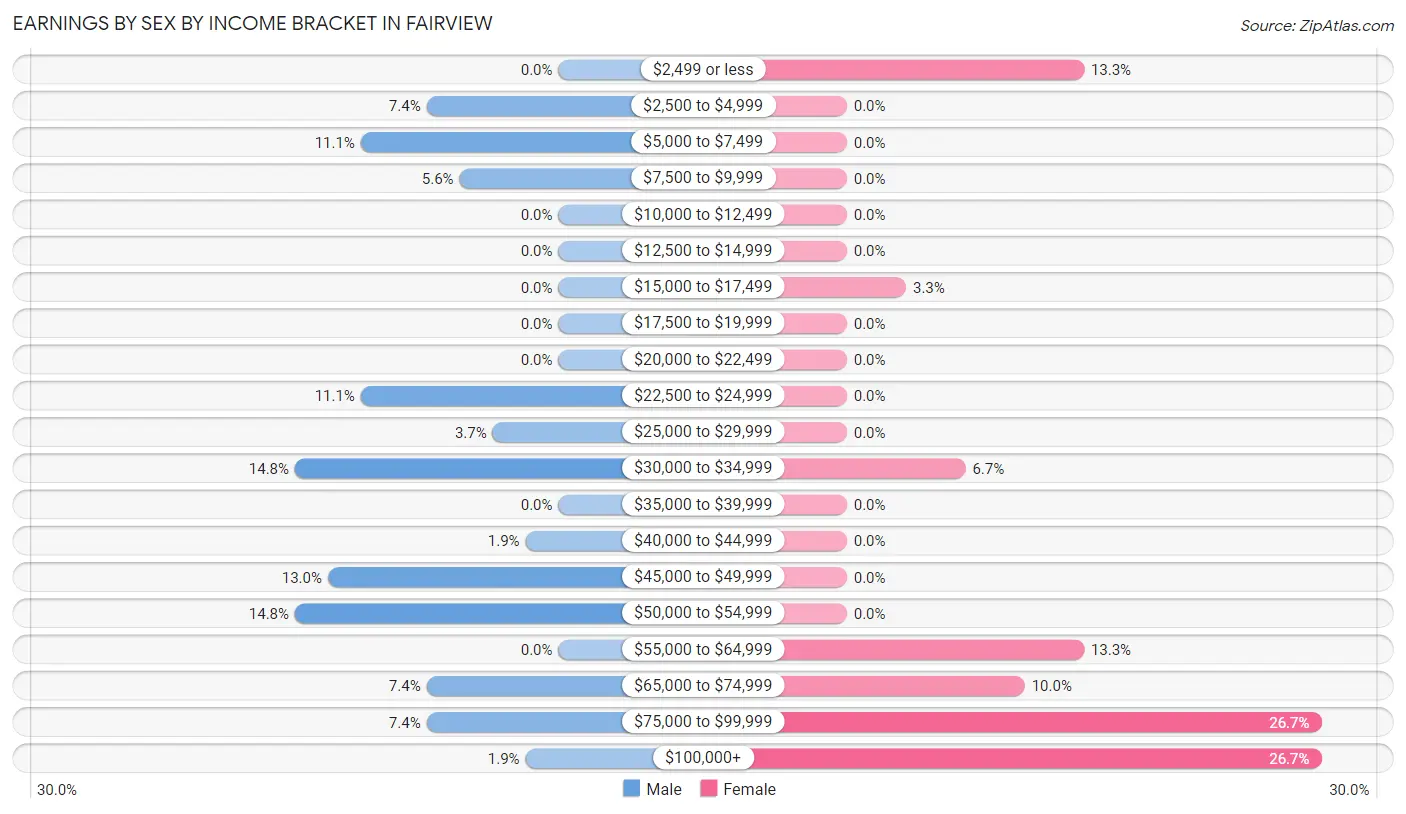
Earnings by Sex by Income Bracket in Fairview
The most common earnings brackets in Fairview are $30,000 to $34,999 for men (8 | 14.8%) and $75,000 to $99,999 for women (8 | 26.7%).
| Income | Male | Female |
| $2,499 or less | 0 (0.0%) | 4 (13.3%) |
| $2,500 to $4,999 | 4 (7.4%) | 0 (0.0%) |
| $5,000 to $7,499 | 6 (11.1%) | 0 (0.0%) |
| $7,500 to $9,999 | 3 (5.6%) | 0 (0.0%) |
| $10,000 to $12,499 | 0 (0.0%) | 0 (0.0%) |
| $12,500 to $14,999 | 0 (0.0%) | 0 (0.0%) |
| $15,000 to $17,499 | 0 (0.0%) | 1 (3.3%) |
| $17,500 to $19,999 | 0 (0.0%) | 0 (0.0%) |
| $20,000 to $22,499 | 0 (0.0%) | 0 (0.0%) |
| $22,500 to $24,999 | 6 (11.1%) | 0 (0.0%) |
| $25,000 to $29,999 | 2 (3.7%) | 0 (0.0%) |
| $30,000 to $34,999 | 8 (14.8%) | 2 (6.7%) |
| $35,000 to $39,999 | 0 (0.0%) | 0 (0.0%) |
| $40,000 to $44,999 | 1 (1.8%) | 0 (0.0%) |
| $45,000 to $49,999 | 7 (13.0%) | 0 (0.0%) |
| $50,000 to $54,999 | 8 (14.8%) | 0 (0.0%) |
| $55,000 to $64,999 | 0 (0.0%) | 4 (13.3%) |
| $65,000 to $74,999 | 4 (7.4%) | 3 (10.0%) |
| $75,000 to $99,999 | 4 (7.4%) | 8 (26.7%) |
| $100,000+ | 1 (1.8%) | 8 (26.7%) |
| Total | 54 (100.0%) | 30 (100.0%) |
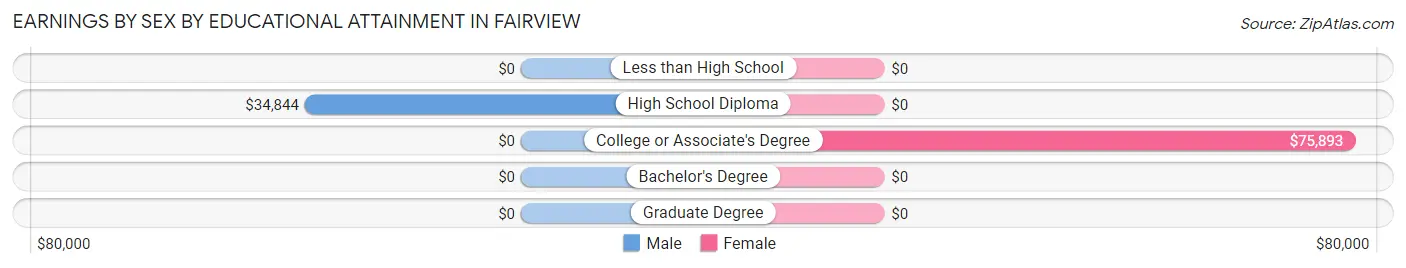
Earnings by Sex by Educational Attainment in Fairview
Average earnings in Fairview are $47,857 for men and $75,357 for women, a difference of 36.5%. Men with an educational attainment of high school diploma enjoy the highest average annual earnings of $34,844, while those with high school diploma education earn the least with $34,844. Women with an educational attainment of college or associate's degree earn the most with the average annual earnings of $75,893, while those with college or associate's degree education have the smallest earnings of $75,893.
| Educational Attainment | Male Income | Female Income |
| Less than High School | - | - |
| High School Diploma | $34,844 | $0 |
| College or Associate's Degree | - | - |
| Bachelor's Degree | - | - |
| Graduate Degree | - | - |
| Total | $47,857 | $75,357 |
Family Income in Fairview
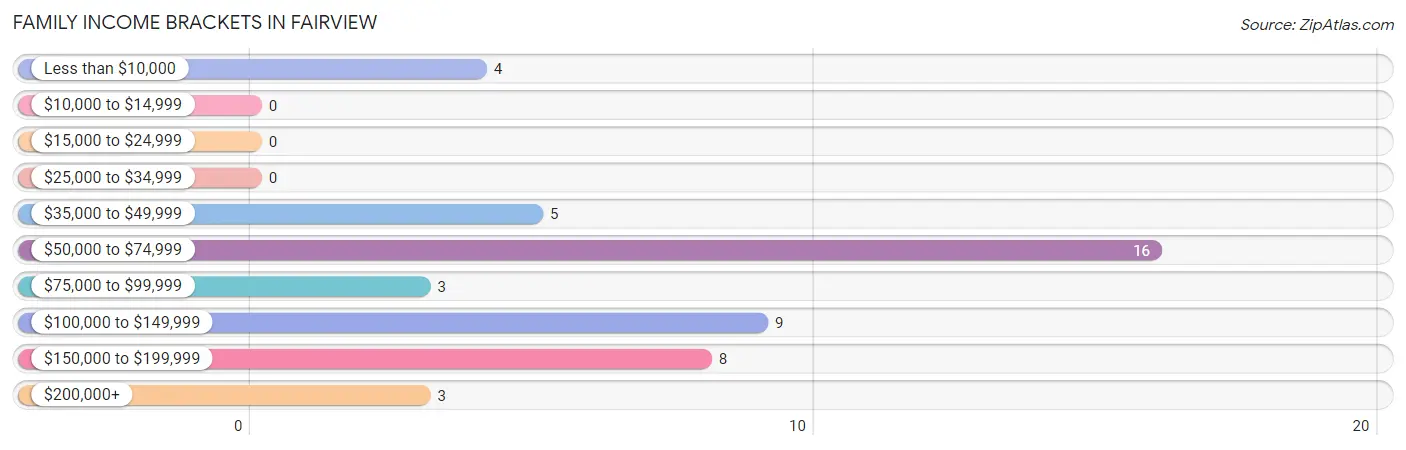
Family Income Brackets in Fairview
According to the Fairview family income data, there are 16 families falling into the $50,000 to $74,999 income range, which is the most common income bracket and makes up 33.3% of all families.
| Income Bracket | # Families | % Families |
| Less than $10,000 | 4 | 8.3% |
| $10,000 to $14,999 | 0 | 0.0% |
| $15,000 to $24,999 | 0 | 0.0% |
| $25,000 to $34,999 | 0 | 0.0% |
| $35,000 to $49,999 | 5 | 10.4% |
| $50,000 to $74,999 | 16 | 33.3% |
| $75,000 to $99,999 | 3 | 6.3% |
| $100,000 to $149,999 | 9 | 18.8% |
| $150,000 to $199,999 | 8 | 16.7% |
| $200,000+ | 3 | 6.3% |
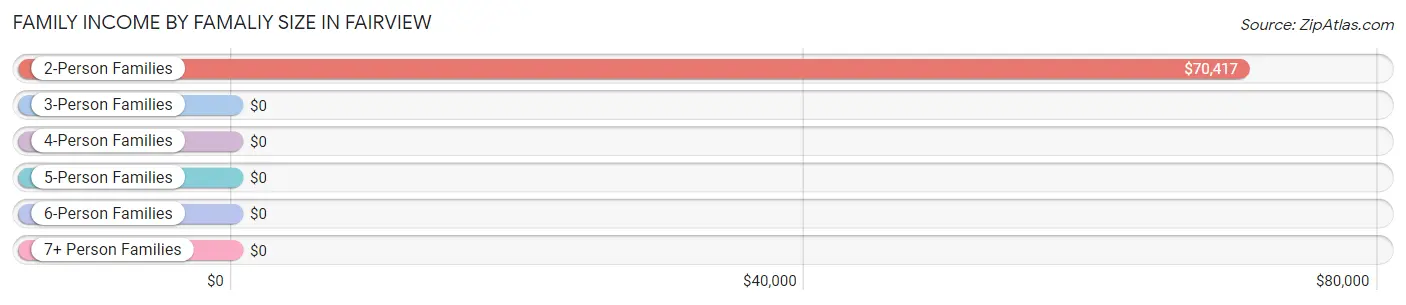
Family Income by Famaliy Size in Fairview
2-person families (36 | 75.0%) account for the highest median family income in Fairview with $70,417 per family, while 2-person families (36 | 75.0%) have the highest median income of $35,208 per family member.
| Income Bracket | # Families | Median Income |
| 2-Person Families | 36 (75.0%) | $70,417 |
| 3-Person Families | 1 (2.1%) | $0 |
| 4-Person Families | 3 (6.2%) | $0 |
| 5-Person Families | 8 (16.7%) | $0 |
| 6-Person Families | 0 (0.0%) | $0 |
| 7+ Person Families | 0 (0.0%) | $0 |
| Total | 48 (100.0%) | $72,083 |
Family Income by Number of Earners in Fairview
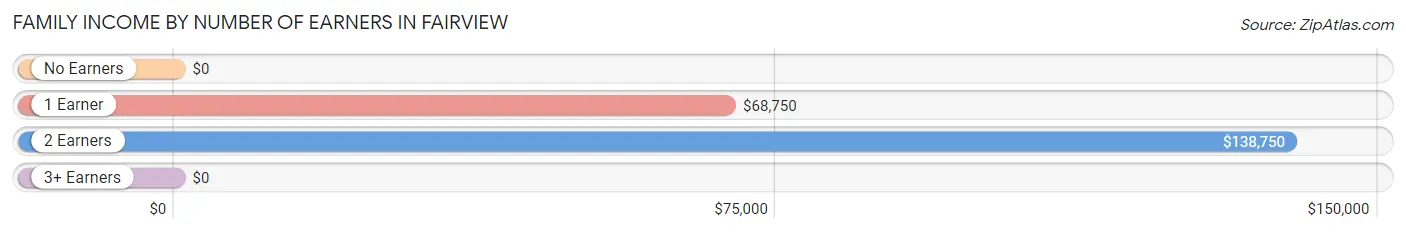
| Number of Earners | # Families | Median Income |
| No Earners | 3 (6.2%) | $0 |
| 1 Earner | 25 (52.1%) | $68,750 |
| 2 Earners | 12 (25.0%) | $138,750 |
| 3+ Earners | 8 (16.7%) | $0 |
| Total | 48 (100.0%) | $72,083 |
Household Income in Fairview
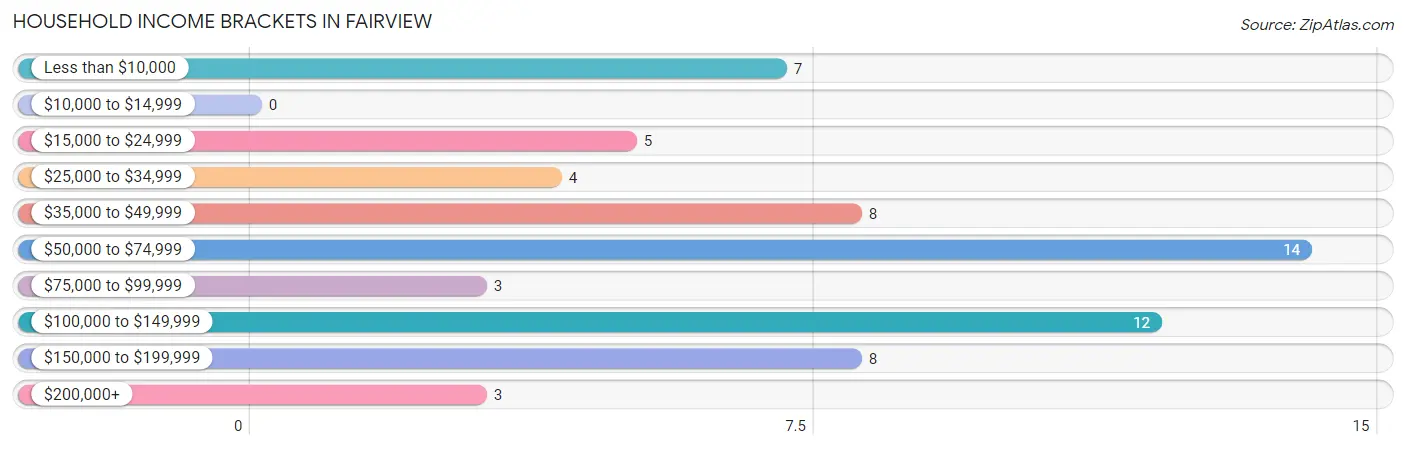
Household Income Brackets in Fairview
With 14 households falling in the category, the $50,000 to $74,999 income range is the most frequent in Fairview, accounting for 21.9% of all households.
| Income Bracket | # Households | % Households |
| Less than $10,000 | 7 | 10.9% |
| $10,000 to $14,999 | 0 | 0.0% |
| $15,000 to $24,999 | 5 | 7.8% |
| $25,000 to $34,999 | 4 | 6.3% |
| $35,000 to $49,999 | 8 | 12.5% |
| $50,000 to $74,999 | 14 | 21.9% |
| $75,000 to $99,999 | 3 | 4.7% |
| $100,000 to $149,999 | 12 | 18.8% |
| $150,000 to $199,999 | 8 | 12.5% |
| $200,000+ | 3 | 4.7% |
Household Income by Householder Age in Fairview
The median household income in Fairview is $70,000, with the highest median household income of $138,281 found in the 45 to 64 years age bracket for the primary householder. A total of 31 households (48.4%) fall into this category.
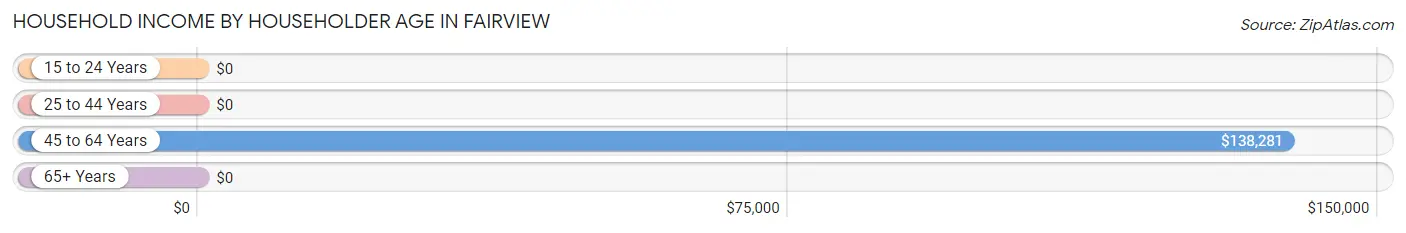
| Income Bracket | # Households | Median Income |
| 15 to 24 Years | 0 (0.0%) | $0 |
| 25 to 44 Years | 11 (17.2%) | $0 |
| 45 to 64 Years | 31 (48.4%) | $138,281 |
| 65+ Years | 22 (34.4%) | $0 |
| Total | 64 (100.0%) | $70,000 |
Poverty in Fairview
Income Below Poverty by Sex and Age in Fairview
With 3.5% poverty level for males and 11.5% for females among the residents of Fairview, 35 to 44 year old males and 25 to 34 year old females are the most vulnerable to poverty, with 3 males (75.0%) and 4 females (50.0%) in their respective age groups living below the poverty level.
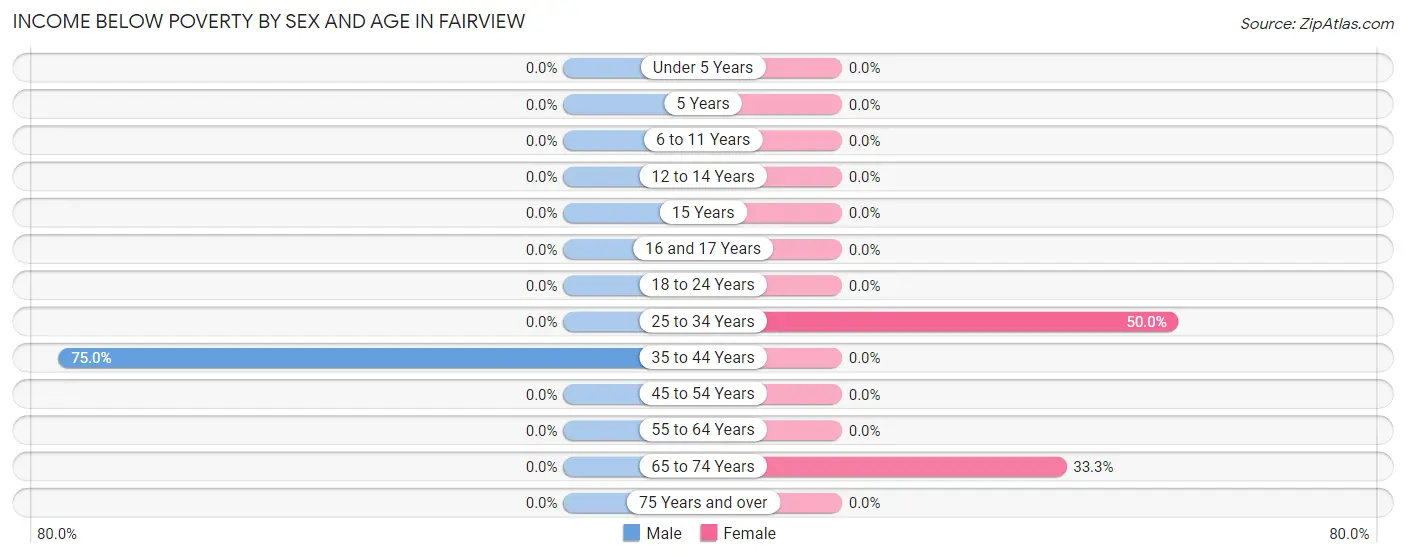
| Age Bracket | Male | Female |
| Under 5 Years | 0 (0.0%) | 0 (0.0%) |
| 5 Years | 0 (0.0%) | 0 (0.0%) |
| 6 to 11 Years | 0 (0.0%) | 0 (0.0%) |
| 12 to 14 Years | 0 (0.0%) | 0 (0.0%) |
| 15 Years | 0 (0.0%) | 0 (0.0%) |
| 16 and 17 Years | 0 (0.0%) | 0 (0.0%) |
| 18 to 24 Years | 0 (0.0%) | 0 (0.0%) |
| 25 to 34 Years | 0 (0.0%) | 4 (50.0%) |
| 35 to 44 Years | 3 (75.0%) | 0 (0.0%) |
| 45 to 54 Years | 0 (0.0%) | 0 (0.0%) |
| 55 to 64 Years | 0 (0.0%) | 0 (0.0%) |
| 65 to 74 Years | 0 (0.0%) | 3 (33.3%) |
| 75 Years and over | 0 (0.0%) | 0 (0.0%) |
| Total | 3 (3.5%) | 7 (11.5%) |
Income Above Poverty by Sex and Age in Fairview
According to the poverty statistics in Fairview, males aged under 5 years and females aged under 5 years are the age groups that are most secure financially, with 100.0% of males and 100.0% of females in these age groups living above the poverty line.
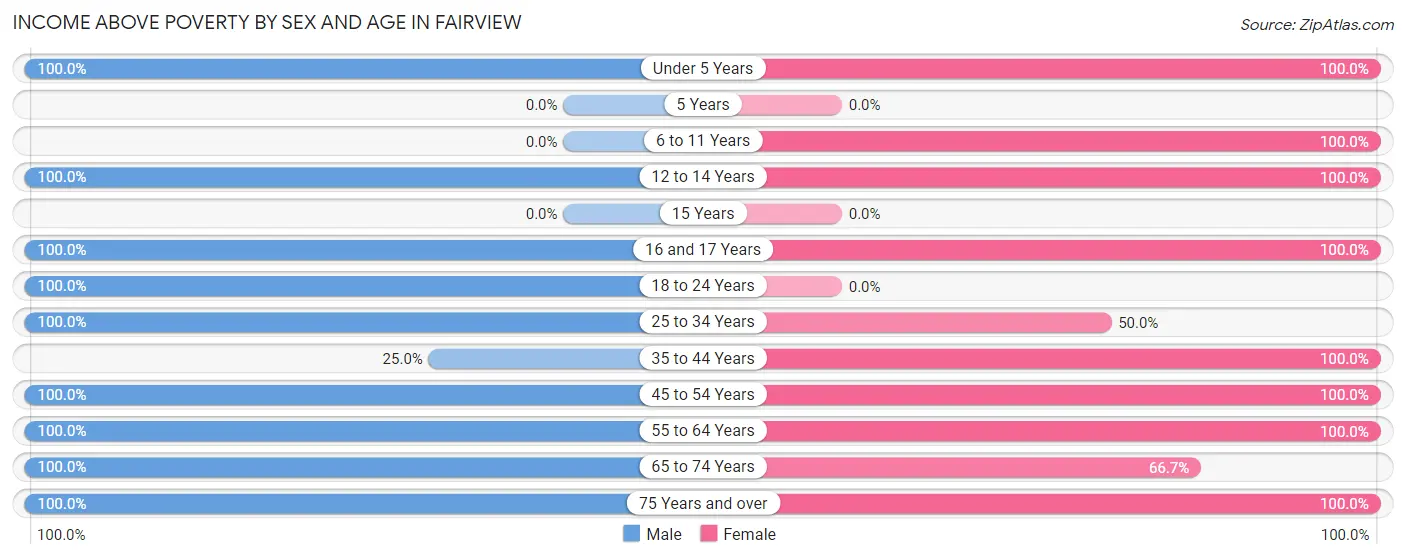
| Age Bracket | Male | Female |
| Under 5 Years | 6 (100.0%) | 1 (100.0%) |
| 5 Years | 0 (0.0%) | 0 (0.0%) |
| 6 to 11 Years | 0 (0.0%) | 2 (100.0%) |
| 12 to 14 Years | 7 (100.0%) | 2 (100.0%) |
| 15 Years | 0 (0.0%) | 0 (0.0%) |
| 16 and 17 Years | 6 (100.0%) | 2 (100.0%) |
| 18 to 24 Years | 2 (100.0%) | 0 (0.0%) |
| 25 to 34 Years | 14 (100.0%) | 4 (50.0%) |
| 35 to 44 Years | 1 (25.0%) | 2 (100.0%) |
| 45 to 54 Years | 18 (100.0%) | 9 (100.0%) |
| 55 to 64 Years | 15 (100.0%) | 18 (100.0%) |
| 65 to 74 Years | 5 (100.0%) | 6 (66.7%) |
| 75 Years and over | 10 (100.0%) | 8 (100.0%) |
| Total | 84 (96.6%) | 54 (88.5%) |
Income Below Poverty Among Married-Couple Families in Fairview
The poverty statistics for married-couple families in Fairview show that 11.4% or 4 of the total 35 families live below the poverty line. Families with no children have the highest poverty rate of 16.7%, comprising of 4 families. On the other hand, families with 1 or 2 children have the lowest poverty rate of 0.0%, which includes 0 families.
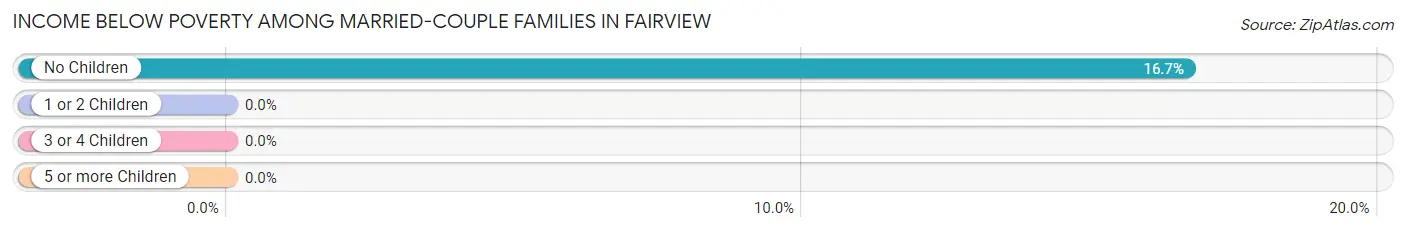
| Children | Above Poverty | Below Poverty |
| No Children | 20 (83.3%) | 4 (16.7%) |
| 1 or 2 Children | 11 (100.0%) | 0 (0.0%) |
| 3 or 4 Children | 0 (0.0%) | 0 (0.0%) |
| 5 or more Children | 0 (0.0%) | 0 (0.0%) |
| Total | 31 (88.6%) | 4 (11.4%) |
Income Below Poverty Among Single-Parent Households in Fairview
| Children | Single Father | Single Mother |
| No Children | 0 (0.0%) | 0 (0.0%) |
| 1 or 2 Children | 0 (0.0%) | 0 (0.0%) |
| 3 or 4 Children | 0 (0.0%) | 0 (0.0%) |
| 5 or more Children | 0 (0.0%) | 0 (0.0%) |
| Total | 0 (0.0%) | 0 (0.0%) |
Income Below Poverty Among Married-Couple vs Single-Parent Households in Fairview
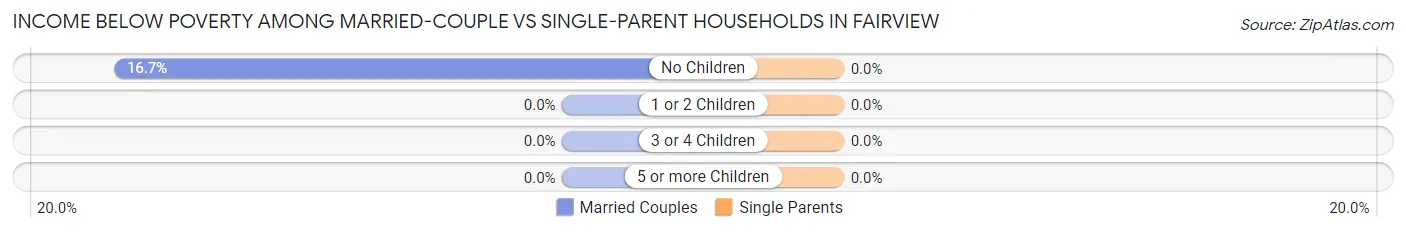
| Children | Married-Couple Families | Single-Parent Households |
| No Children | 4 (16.7%) | 0 (0.0%) |
| 1 or 2 Children | 0 (0.0%) | 0 (0.0%) |
| 3 or 4 Children | 0 (0.0%) | 0 (0.0%) |
| 5 or more Children | 0 (0.0%) | 0 (0.0%) |
| Total | 4 (11.4%) | 0 (0.0%) |
Race in Fairview
The most populous races in Fairview are , and White / Caucasian (148 | 100.0%).
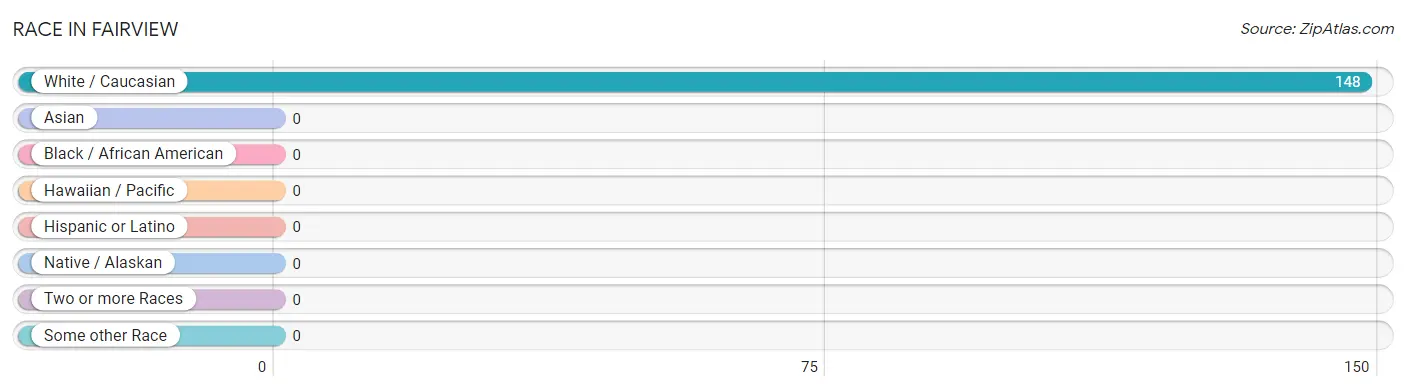
| Race | # Population | % Population |
| Asian | 0 | 0.0% |
| Black / African American | 0 | 0.0% |
| Hawaiian / Pacific | 0 | 0.0% |
| Hispanic or Latino | 0 | 0.0% |
| Native / Alaskan | 0 | 0.0% |
| White / Caucasian | 148 | 100.0% |
| Two or more Races | 0 | 0.0% |
| Some other Race | 0 | 0.0% |
| Total | 148 | 100.0% |
Ancestry in Fairview
The most populous ancestries reported in Fairview are German (78 | 52.7%), English (30 | 20.3%), Irish (19 | 12.8%), American (9 | 6.1%), and French (8 | 5.4%), together accounting for 97.3% of all Fairview residents.
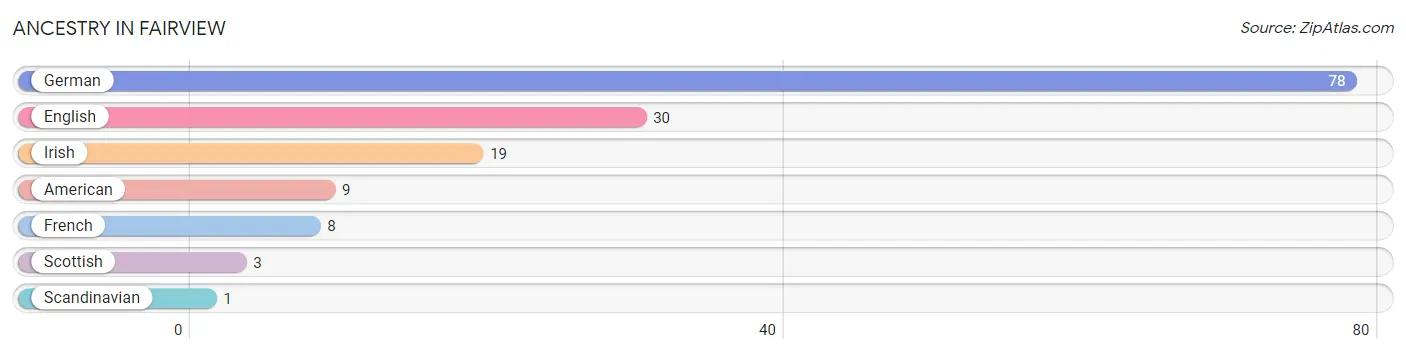
| Ancestry | # Population | % Population |
| American | 9 | 6.1% |
| English | 30 | 20.3% |
| French | 8 | 5.4% |
| German | 78 | 52.7% |
| Irish | 19 | 12.8% |
| Scandinavian | 1 | 0.7% |
| Scottish | 3 | 2.0% | View All 7 Rows |
Immigrants in Fairview
The most numerous immigrant groups reported in Fairview came from Asia (4 | 2.7%), Cambodia (4 | 2.7%), and South Eastern Asia (4 | 2.7%), together accounting for 8.1% of all Fairview residents.
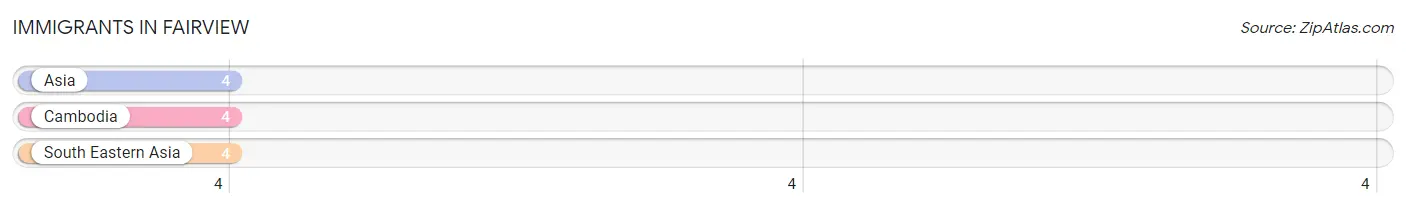
| Immigration Origin | # Population | % Population |
| Asia | 4 | 2.7% |
| Cambodia | 4 | 2.7% |
| South Eastern Asia | 4 | 2.7% | View All 3 Rows |
Sex and Age in Fairview
Sex and Age in Fairview
The most populous age groups in Fairview are 50 to 54 Years (18 | 20.7%) for men and 55 to 59 Years (10 | 16.4%) for women.
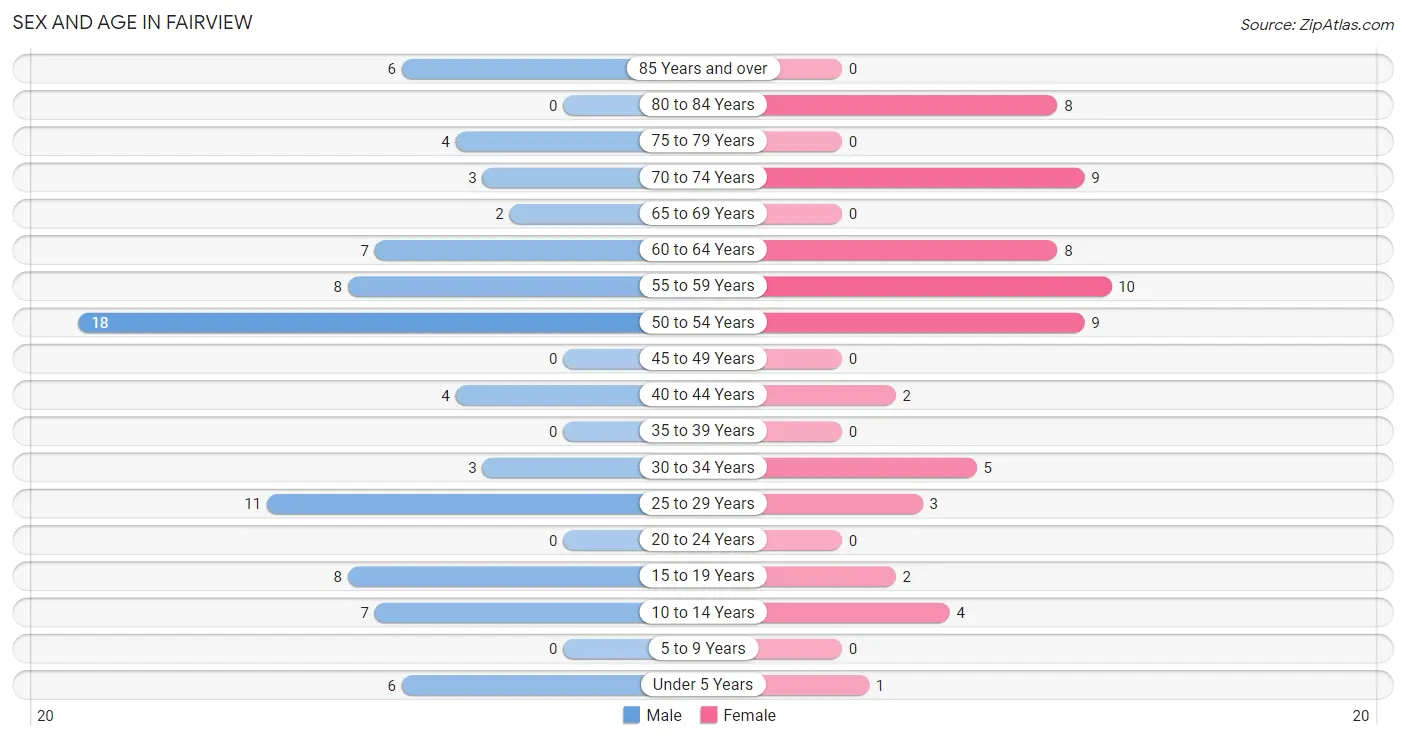
| Age Bracket | Male | Female |
| Under 5 Years | 6 (6.9%) | 1 (1.6%) |
| 5 to 9 Years | 0 (0.0%) | 0 (0.0%) |
| 10 to 14 Years | 7 (8.1%) | 4 (6.6%) |
| 15 to 19 Years | 8 (9.2%) | 2 (3.3%) |
| 20 to 24 Years | 0 (0.0%) | 0 (0.0%) |
| 25 to 29 Years | 11 (12.6%) | 3 (4.9%) |
| 30 to 34 Years | 3 (3.5%) | 5 (8.2%) |
| 35 to 39 Years | 0 (0.0%) | 0 (0.0%) |
| 40 to 44 Years | 4 (4.6%) | 2 (3.3%) |
| 45 to 49 Years | 0 (0.0%) | 0 (0.0%) |
| 50 to 54 Years | 18 (20.7%) | 9 (14.7%) |
| 55 to 59 Years | 8 (9.2%) | 10 (16.4%) |
| 60 to 64 Years | 7 (8.1%) | 8 (13.1%) |
| 65 to 69 Years | 2 (2.3%) | 0 (0.0%) |
| 70 to 74 Years | 3 (3.5%) | 9 (14.7%) |
| 75 to 79 Years | 4 (4.6%) | 0 (0.0%) |
| 80 to 84 Years | 0 (0.0%) | 8 (13.1%) |
| 85 Years and over | 6 (6.9%) | 0 (0.0%) |
| Total | 87 (100.0%) | 61 (100.0%) |
Families and Households in Fairview
Median Family Size in Fairview
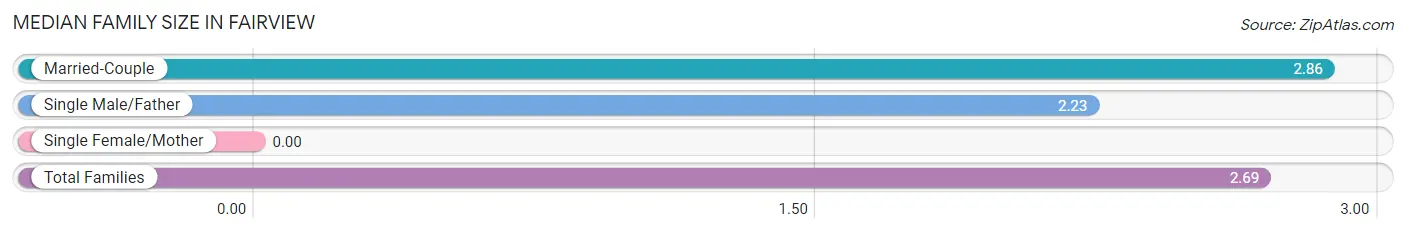
| Family Type | # Families | Family Size |
| Married-Couple | 35 (72.9%) | 2.86 |
| Single Male/Father | 13 (27.1%) | 2.23 |
| Single Female/Mother | 0 (0.0%) | - |
| Total Families | 48 (100.0%) | 2.69 |
Median Household Size in Fairview
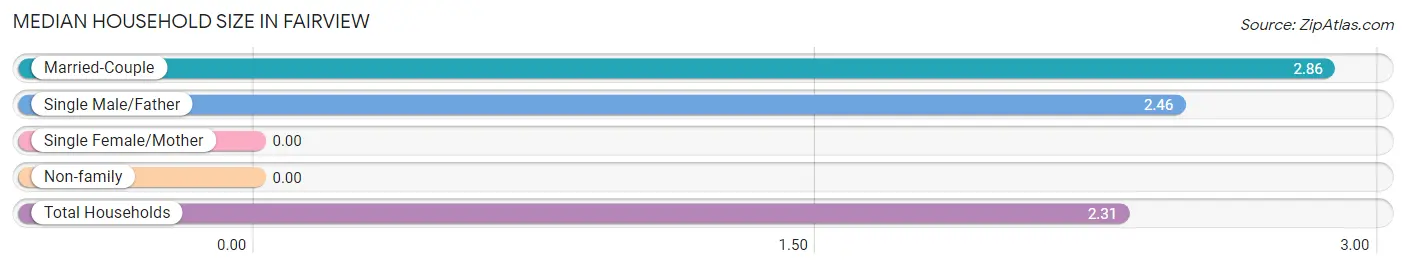
| Household Type | # Households | Household Size |
| Married-Couple | 35 (54.7%) | 2.86 |
| Single Male/Father | 13 (20.3%) | 2.46 |
| Single Female/Mother | 0 (0.0%) | - |
| Non-family | 16 (25.0%) | - |
| Total Households | 64 (100.0%) | 2.31 |
Household Size by Marriage Status in Fairview
Out of a total of 64 households in Fairview, 48 (75.0%) are family households, while 16 (25.0%) are nonfamily households. The most numerous type of family households are 2-person households, comprising 33, and the most common type of nonfamily households are 1-person households, comprising 16.
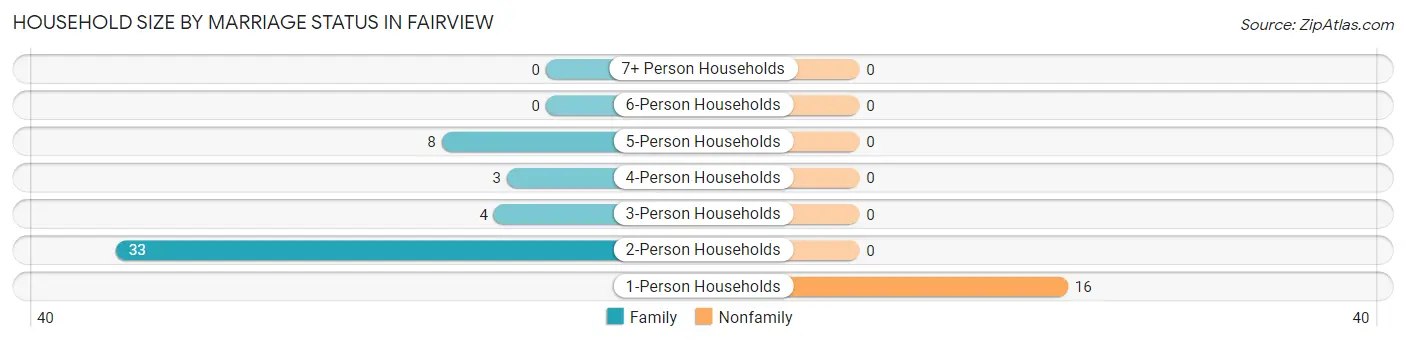
| Household Size | Family Households | Nonfamily Households |
| 1-Person Households | - | 16 (25.0%) |
| 2-Person Households | 33 (51.6%) | 0 (0.0%) |
| 3-Person Households | 4 (6.2%) | 0 (0.0%) |
| 4-Person Households | 3 (4.7%) | 0 (0.0%) |
| 5-Person Households | 8 (12.5%) | 0 (0.0%) |
| 6-Person Households | 0 (0.0%) | 0 (0.0%) |
| 7+ Person Households | 0 (0.0%) | 0 (0.0%) |
| Total | 48 (75.0%) | 16 (25.0%) |
Female Fertility in Fairview
Fertility by Age in Fairview
Average fertility rate in Fairview is 53.0 births per 1,000 women. Women in the age bracket of 35 to 50 years have the highest fertility rate with 111.0 births per 1,000 women. Women in the age bracket of 35 to 50 years acount for 100.0% of all women with births.
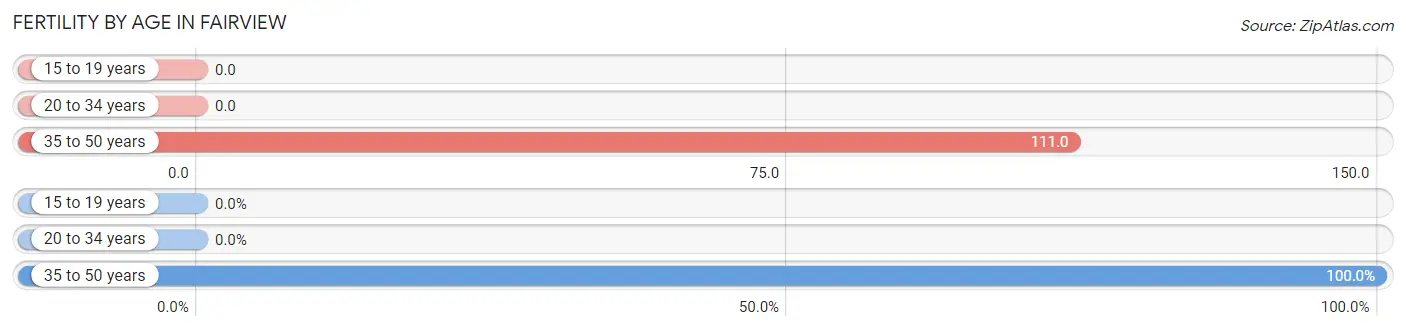
| Age Bracket | Women with Births | Births / 1,000 Women |
| 15 to 19 years | 0 (0.0%) | 0.0 |
| 20 to 34 years | 0 (0.0%) | 0.0 |
| 35 to 50 years | 1 (100.0%) | 111.0 |
| Total | 1 (100.0%) | 53.0 |
Fertility by Age by Marriage Status in Fairview
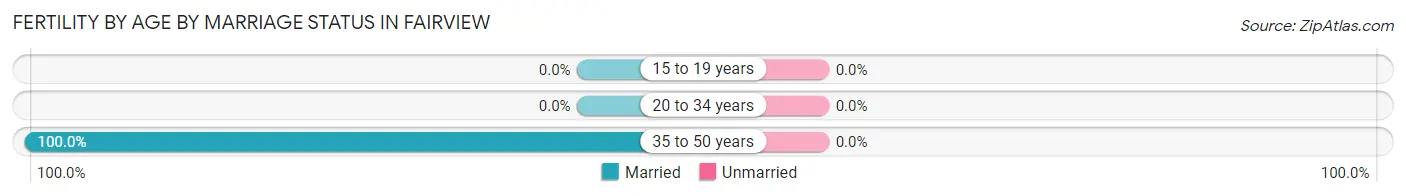
| Age Bracket | Married | Unmarried |
| 15 to 19 years | 0 (0.0%) | 0 (0.0%) |
| 20 to 34 years | 0 (0.0%) | 0 (0.0%) |
| 35 to 50 years | 1 (100.0%) | 0 (0.0%) |
| Total | 1 (100.0%) | 0 (0.0%) |
Fertility by Education in Fairview
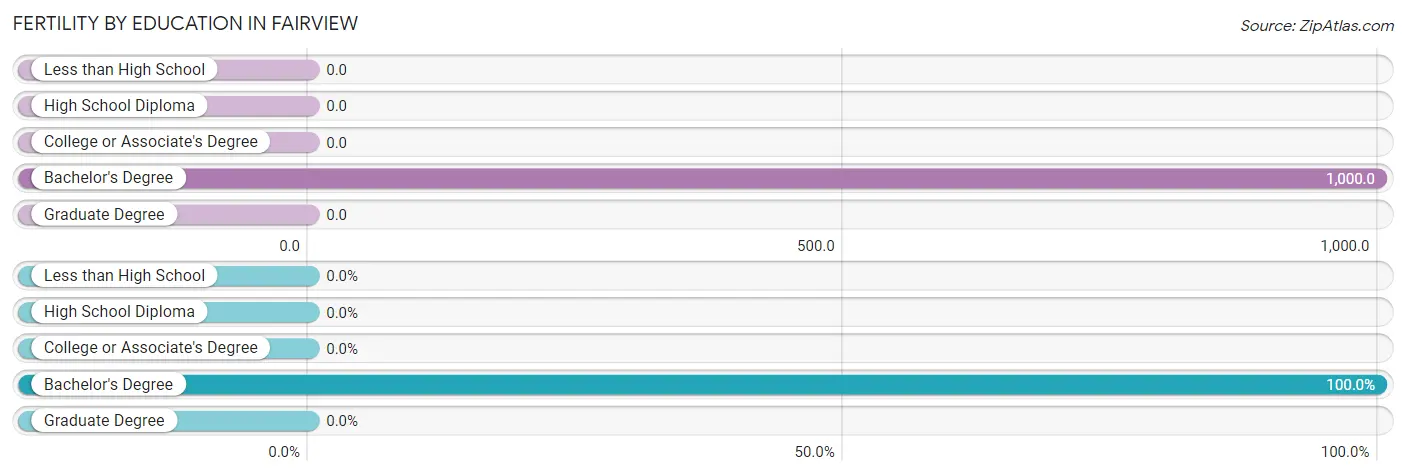
| Educational Attainment | Women with Births | Births / 1,000 Women |
| Less than High School | 0 (0.0%) | 0.0 |
| High School Diploma | 0 (0.0%) | 0.0 |
| College or Associate's Degree | 0 (0.0%) | 0.0 |
| Bachelor's Degree | 1 (100.0%) | 1,000.0 |
| Graduate Degree | 0 (0.0%) | 0.0 |
| Total | 1 (100.0%) | 53.0 |
Fertility by Education by Marriage Status in Fairview
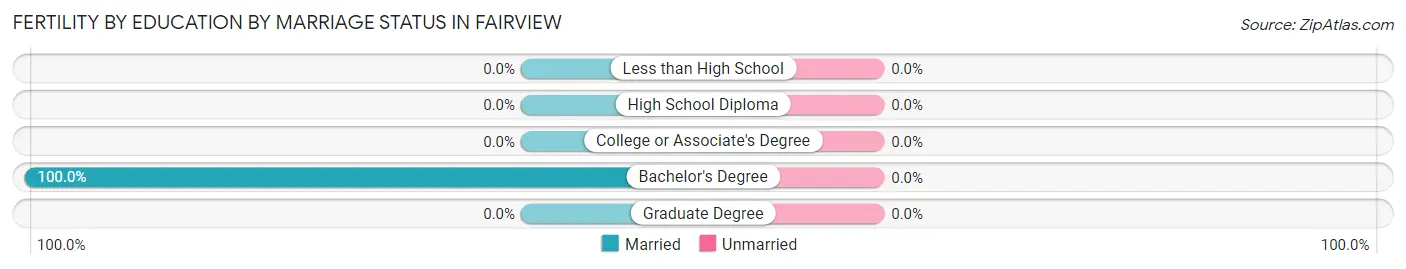
| Educational Attainment | Married | Unmarried |
| Less than High School | 0 (0.0%) | 0 (0.0%) |
| High School Diploma | 0 (0.0%) | 0 (0.0%) |
| College or Associate's Degree | 0 (0.0%) | 0 (0.0%) |
| Bachelor's Degree | 1 (100.0%) | 0 (0.0%) |
| Graduate Degree | 0 (0.0%) | 0 (0.0%) |
| Total | 1 (100.0%) | 0 (0.0%) |
Employment Characteristics in Fairview
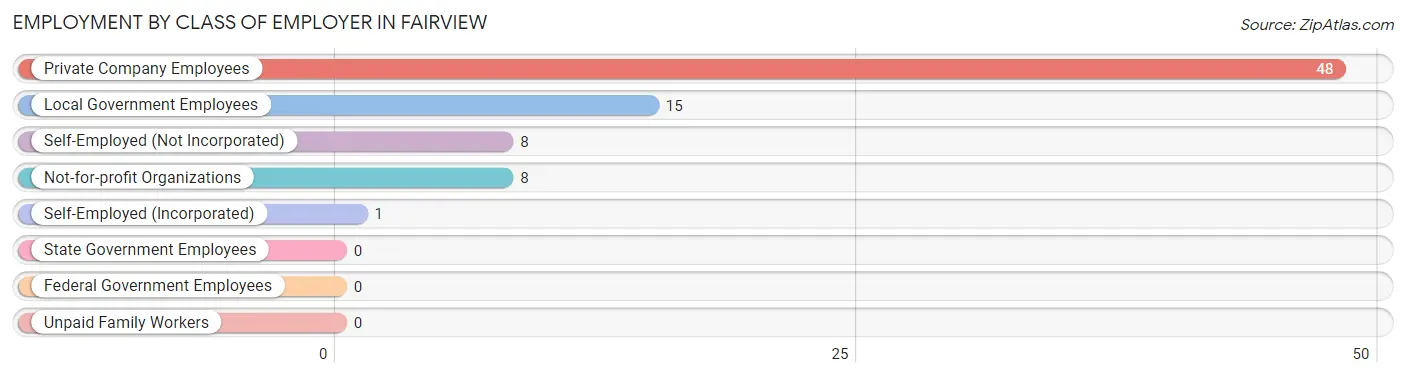
Employment by Class of Employer in Fairview
Among the 80 employed individuals in Fairview, private company employees (48 | 60.0%), local government employees (15 | 18.8%), and self-employed (not incorporated) (8 | 10.0%) make up the most common classes of employment.
| Employer Class | # Employees | % Employees |
| Private Company Employees | 48 | 60.0% |
| Self-Employed (Incorporated) | 1 | 1.3% |
| Self-Employed (Not Incorporated) | 8 | 10.0% |
| Not-for-profit Organizations | 8 | 10.0% |
| Local Government Employees | 15 | 18.8% |
| State Government Employees | 0 | 0.0% |
| Federal Government Employees | 0 | 0.0% |
| Unpaid Family Workers | 0 | 0.0% |
| Total | 80 | 100.0% |
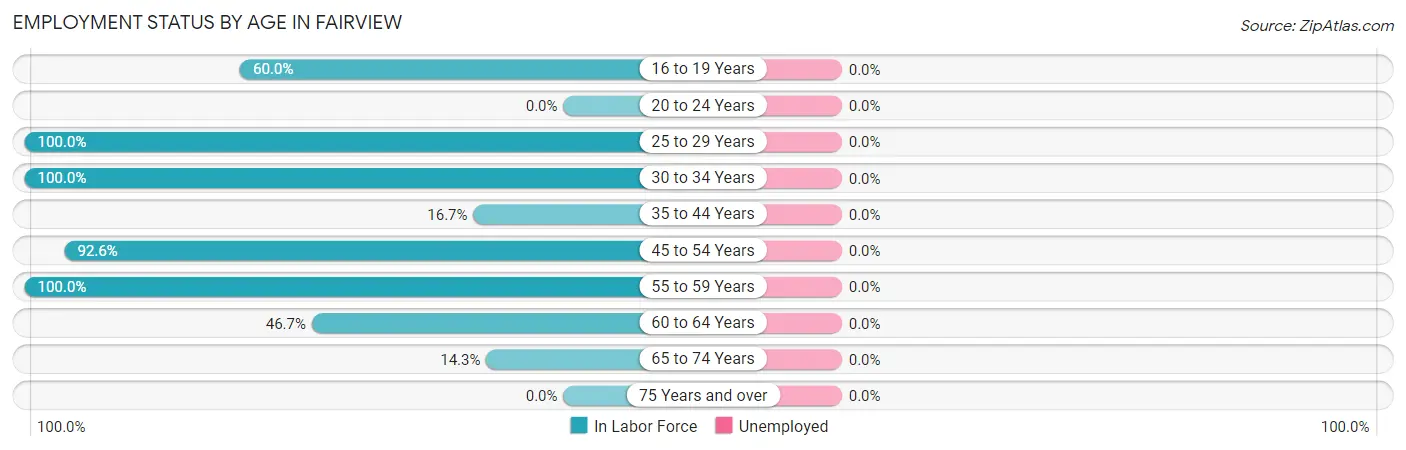
Employment Status by Age in Fairview
| Age Bracket | In Labor Force | Unemployed |
| 16 to 19 Years | 6 (60.0%) | 0 (0.0%) |
| 20 to 24 Years | 0 (0.0%) | 0 (0.0%) |
| 25 to 29 Years | 14 (100.0%) | 0 (0.0%) |
| 30 to 34 Years | 8 (100.0%) | 0 (0.0%) |
| 35 to 44 Years | 1 (16.7%) | 0 (0.0%) |
| 45 to 54 Years | 25 (92.6%) | 0 (0.0%) |
| 55 to 59 Years | 18 (100.0%) | 0 (0.0%) |
| 60 to 64 Years | 7 (46.7%) | 0 (0.0%) |
| 65 to 74 Years | 2 (14.3%) | 0 (0.0%) |
| 75 Years and over | 0 (0.0%) | 0 (0.0%) |
| Total | 81 (62.3%) | 0 (0.0%) |
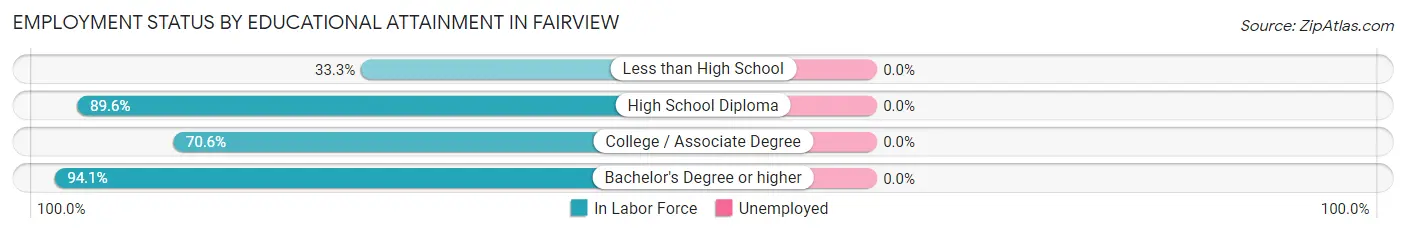
Employment Status by Educational Attainment in Fairview
| Educational Attainment | In Labor Force | Unemployed |
| Less than High School | 2 (33.3%) | 0 (0.0%) |
| High School Diploma | 43 (89.6%) | 0 (0.0%) |
| College / Associate Degree | 12 (70.6%) | 0 (0.0%) |
| Bachelor's Degree or higher | 16 (94.1%) | 0 (0.0%) |
| Total | 73 (83.0%) | 0 (0.0%) |
Employment Occupations by Sex in Fairview
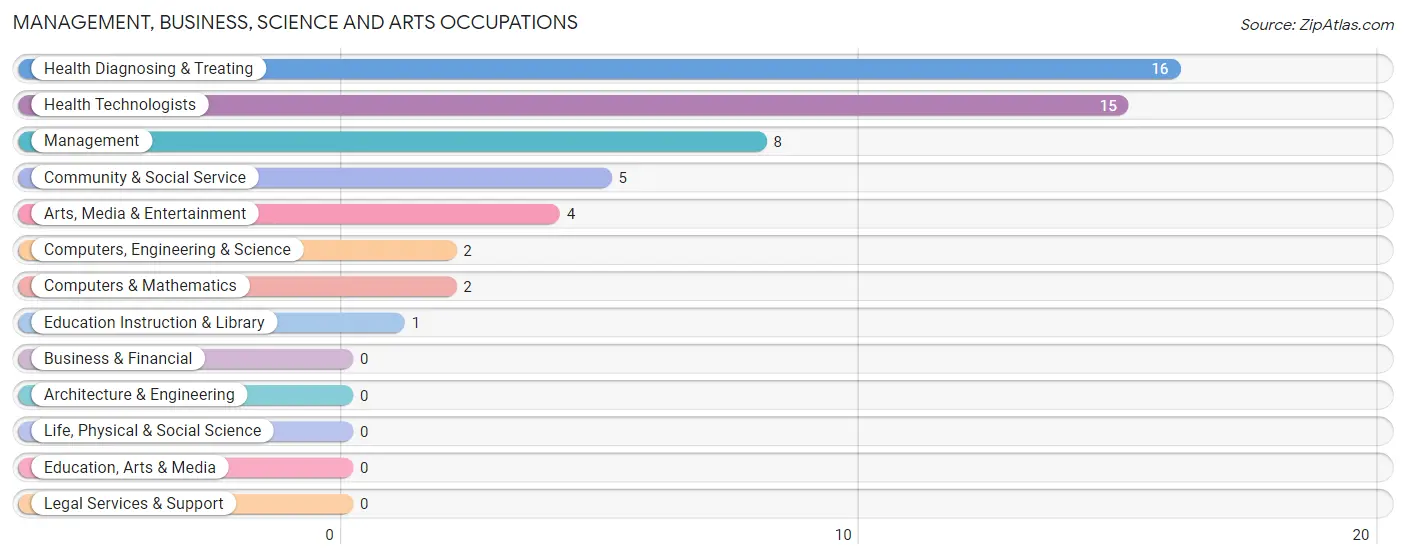
Management, Business, Science and Arts Occupations
The most common Management, Business, Science and Arts occupations in Fairview are Health Diagnosing & Treating (16 | 19.8%), Health Technologists (15 | 18.5%), Management (8 | 9.9%), Community & Social Service (5 | 6.2%), and Arts, Media & Entertainment (4 | 4.9%).
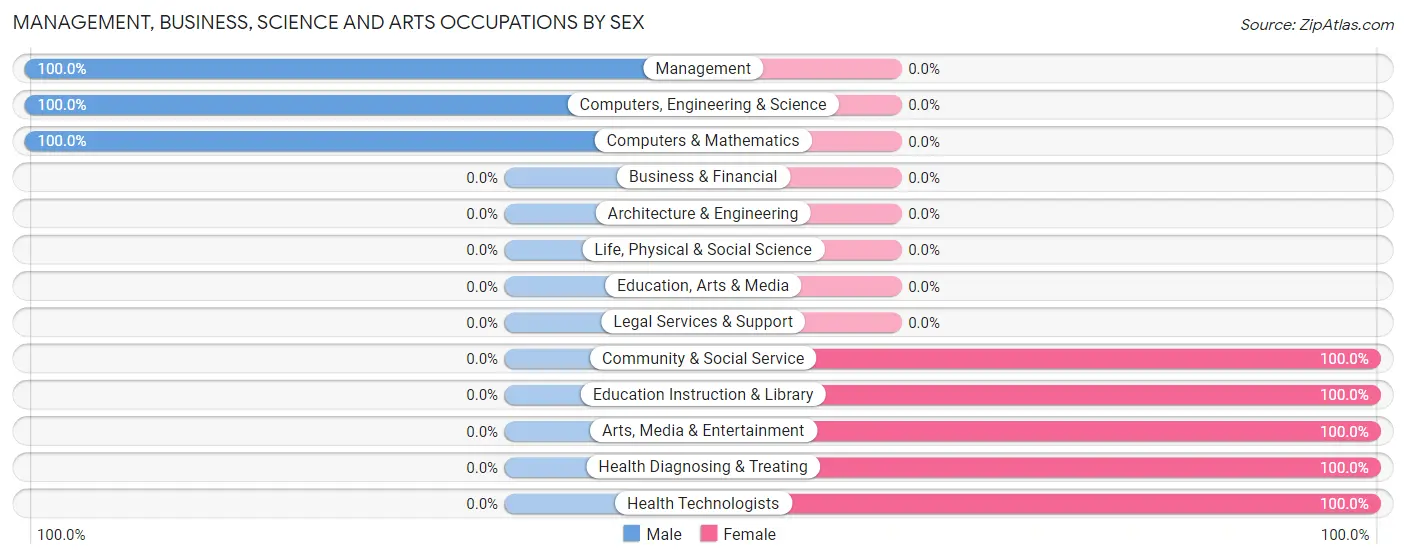
Management, Business, Science and Arts Occupations by Sex
Within the Management, Business, Science and Arts occupations in Fairview, the most male-oriented occupations are Management (100.0%), Computers, Engineering & Science (100.0%), and Computers & Mathematics (100.0%), while the most female-oriented occupations are Community & Social Service (100.0%), Education Instruction & Library (100.0%), and Arts, Media & Entertainment (100.0%).
| Occupation | Male | Female |
| Management | 8 (100.0%) | 0 (0.0%) |
| Business & Financial | 0 (0.0%) | 0 (0.0%) |
| Computers, Engineering & Science | 2 (100.0%) | 0 (0.0%) |
| Computers & Mathematics | 2 (100.0%) | 0 (0.0%) |
| Architecture & Engineering | 0 (0.0%) | 0 (0.0%) |
| Life, Physical & Social Science | 0 (0.0%) | 0 (0.0%) |
| Community & Social Service | 0 (0.0%) | 5 (100.0%) |
| Education, Arts & Media | 0 (0.0%) | 0 (0.0%) |
| Legal Services & Support | 0 (0.0%) | 0 (0.0%) |
| Education Instruction & Library | 0 (0.0%) | 1 (100.0%) |
| Arts, Media & Entertainment | 0 (0.0%) | 4 (100.0%) |
| Health Diagnosing & Treating | 0 (0.0%) | 16 (100.0%) |
| Health Technologists | 0 (0.0%) | 15 (100.0%) |
| Total (Category) | 10 (32.3%) | 21 (67.7%) |
| Total (Overall) | 51 (63.0%) | 30 (37.0%) |
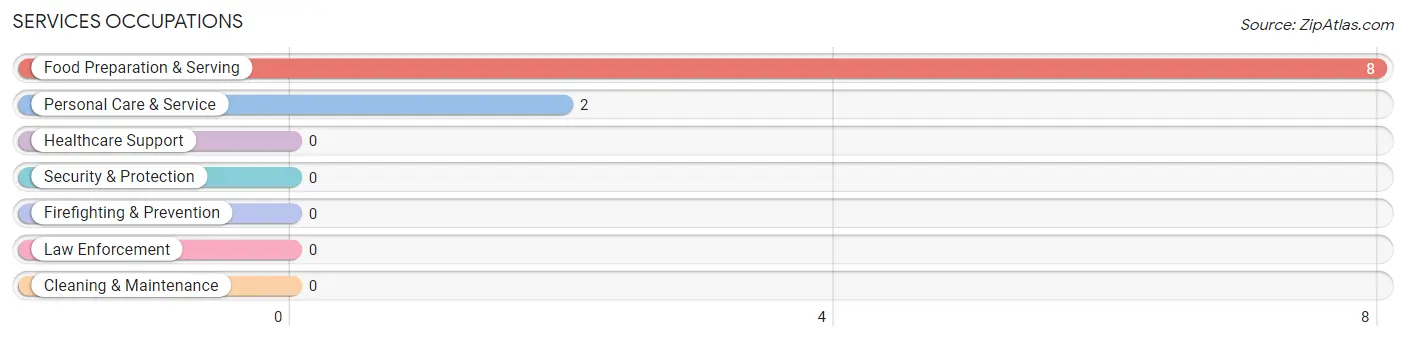
Services Occupations
The most common Services occupations in Fairview are Food Preparation & Serving (8 | 9.9%), and Personal Care & Service (2 | 2.5%).
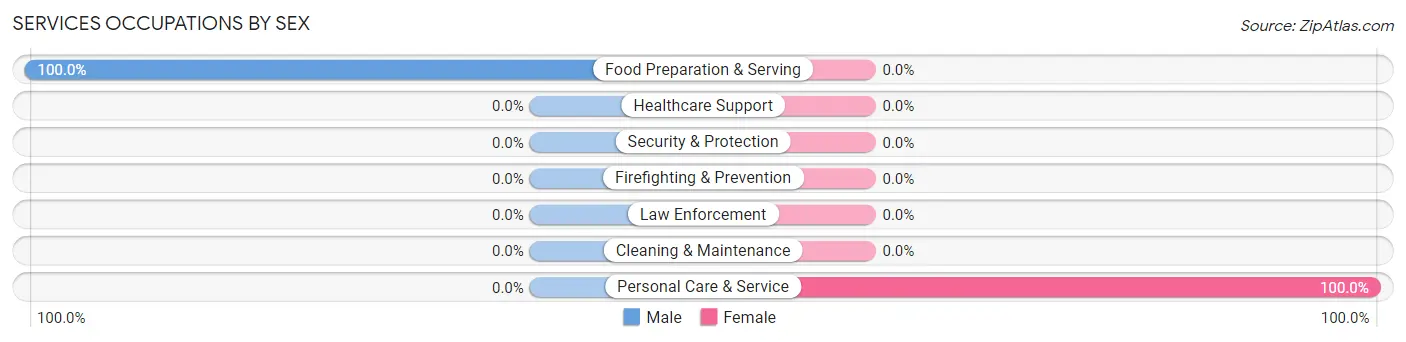
Services Occupations by Sex
| Occupation | Male | Female |
| Healthcare Support | 0 (0.0%) | 0 (0.0%) |
| Security & Protection | 0 (0.0%) | 0 (0.0%) |
| Firefighting & Prevention | 0 (0.0%) | 0 (0.0%) |
| Law Enforcement | 0 (0.0%) | 0 (0.0%) |
| Food Preparation & Serving | 8 (100.0%) | 0 (0.0%) |
| Cleaning & Maintenance | 0 (0.0%) | 0 (0.0%) |
| Personal Care & Service | 0 (0.0%) | 2 (100.0%) |
| Total (Category) | 8 (80.0%) | 2 (20.0%) |
| Total (Overall) | 51 (63.0%) | 30 (37.0%) |
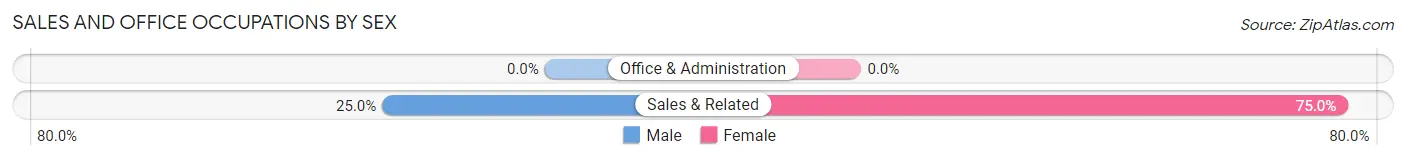
Sales and Office Occupations
The most common Sales and Office occupations in Fairview are , and Sales & Related (4 | 4.9%).

Sales and Office Occupations by Sex
| Occupation | Male | Female |
| Sales & Related | 1 (25.0%) | 3 (75.0%) |
| Office & Administration | 0 (0.0%) | 0 (0.0%) |
| Total (Category) | 1 (25.0%) | 3 (75.0%) |
| Total (Overall) | 51 (63.0%) | 30 (37.0%) |
Natural Resources, Construction and Maintenance Occupations
The most common Natural Resources, Construction and Maintenance occupations in Fairview are , and Construction & Extraction (20 | 24.7%).
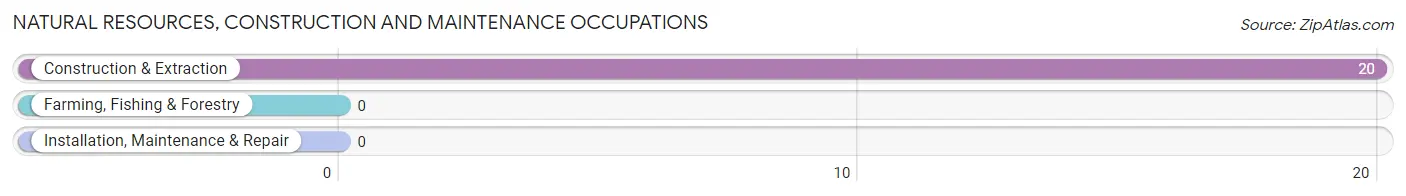
Natural Resources, Construction and Maintenance Occupations by Sex
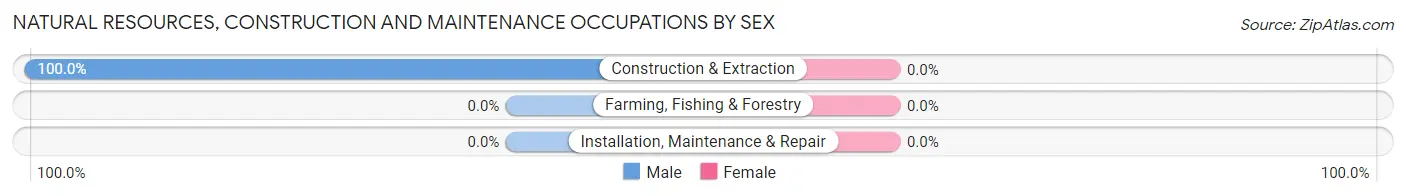
| Occupation | Male | Female |
| Farming, Fishing & Forestry | 0 (0.0%) | 0 (0.0%) |
| Construction & Extraction | 20 (100.0%) | 0 (0.0%) |
| Installation, Maintenance & Repair | 0 (0.0%) | 0 (0.0%) |
| Total (Category) | 20 (100.0%) | 0 (0.0%) |
| Total (Overall) | 51 (63.0%) | 30 (37.0%) |
Production, Transportation and Moving Occupations
The most common Production, Transportation and Moving occupations in Fairview are Production (15 | 18.5%), and Material Moving (1 | 1.2%).
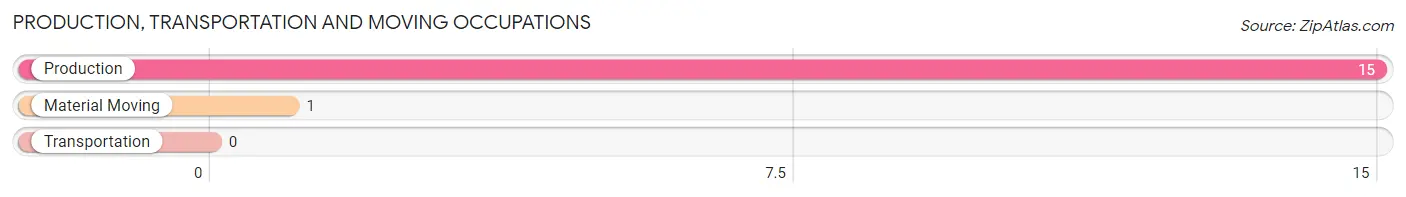
Production, Transportation and Moving Occupations by Sex
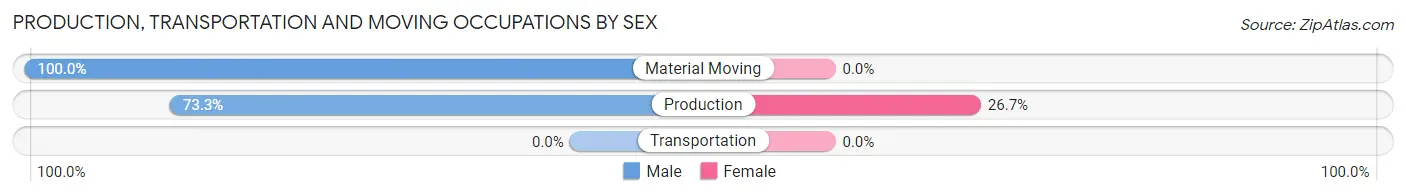
| Occupation | Male | Female |
| Production | 11 (73.3%) | 4 (26.7%) |
| Transportation | 0 (0.0%) | 0 (0.0%) |
| Material Moving | 1 (100.0%) | 0 (0.0%) |
| Total (Category) | 12 (75.0%) | 4 (25.0%) |
| Total (Overall) | 51 (63.0%) | 30 (37.0%) |
Employment Industries by Sex in Fairview
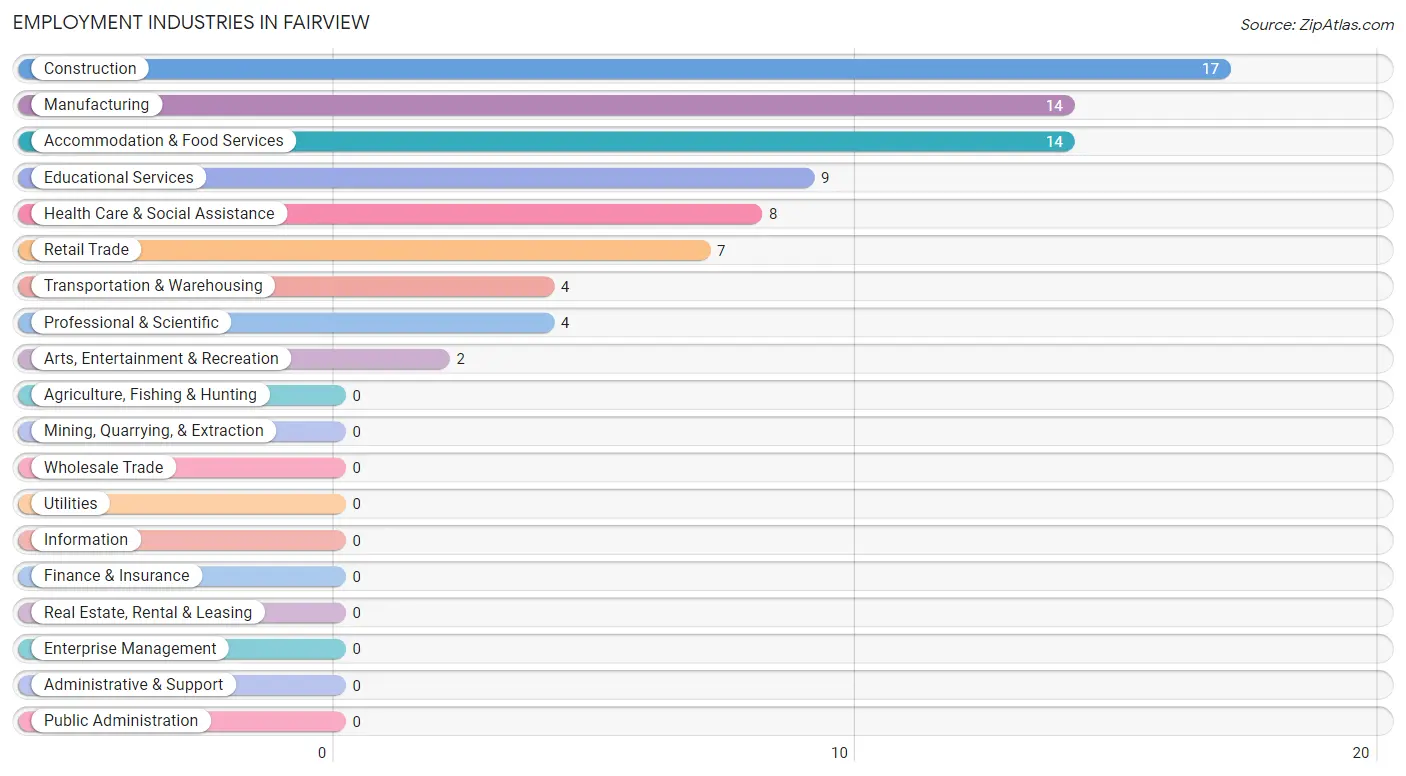
Employment Industries in Fairview
The major employment industries in Fairview include Construction (17 | 21.0%), Manufacturing (14 | 17.3%), Accommodation & Food Services (14 | 17.3%), Educational Services (9 | 11.1%), and Health Care & Social Assistance (8 | 9.9%).
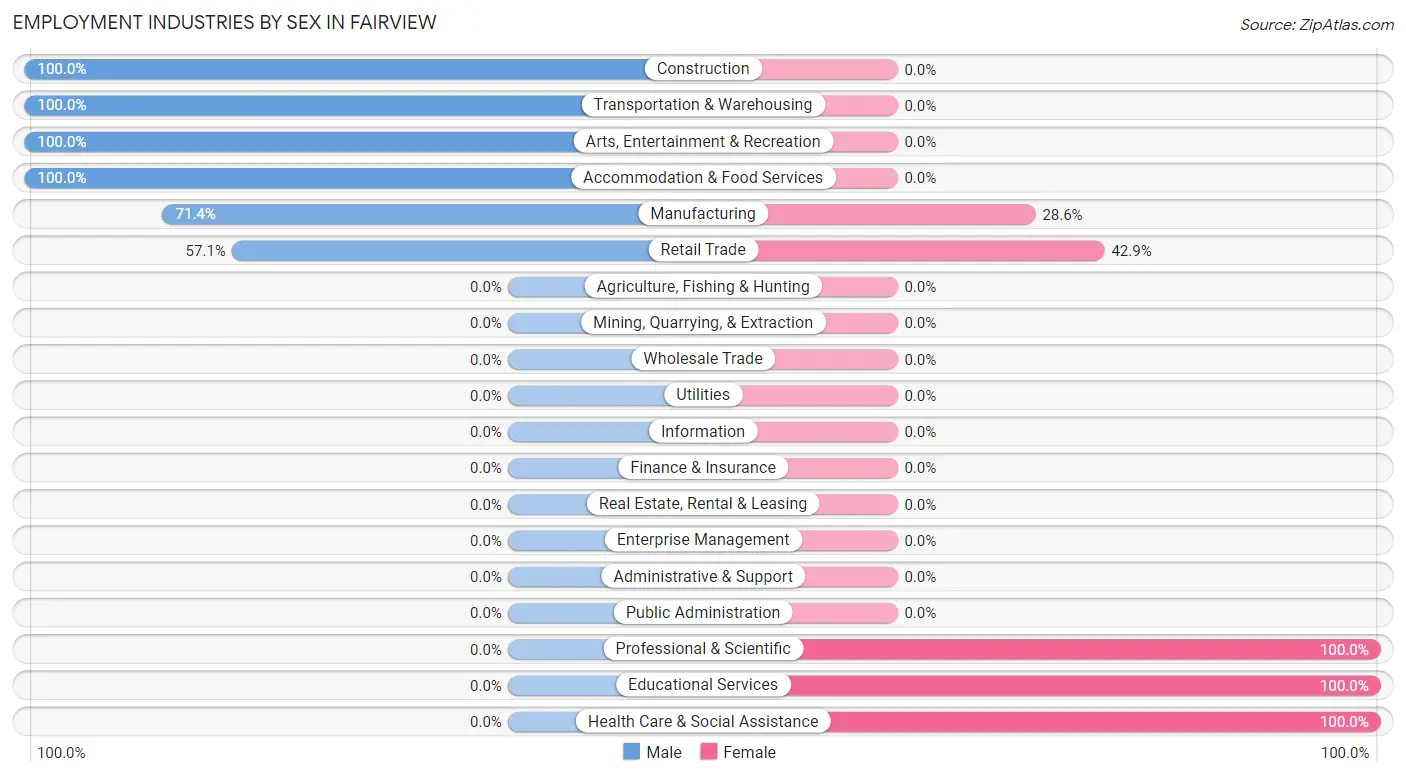
Employment Industries by Sex in Fairview
The Fairview industries that see more men than women are Construction (100.0%), Transportation & Warehousing (100.0%), and Arts, Entertainment & Recreation (100.0%), whereas the industries that tend to have a higher number of women are Professional & Scientific (100.0%), Educational Services (100.0%), and Health Care & Social Assistance (100.0%).
| Industry | Male | Female |
| Agriculture, Fishing & Hunting | 0 (0.0%) | 0 (0.0%) |
| Mining, Quarrying, & Extraction | 0 (0.0%) | 0 (0.0%) |
| Construction | 17 (100.0%) | 0 (0.0%) |
| Manufacturing | 10 (71.4%) | 4 (28.6%) |
| Wholesale Trade | 0 (0.0%) | 0 (0.0%) |
| Retail Trade | 4 (57.1%) | 3 (42.9%) |
| Transportation & Warehousing | 4 (100.0%) | 0 (0.0%) |
| Utilities | 0 (0.0%) | 0 (0.0%) |
| Information | 0 (0.0%) | 0 (0.0%) |
| Finance & Insurance | 0 (0.0%) | 0 (0.0%) |
| Real Estate, Rental & Leasing | 0 (0.0%) | 0 (0.0%) |
| Professional & Scientific | 0 (0.0%) | 4 (100.0%) |
| Enterprise Management | 0 (0.0%) | 0 (0.0%) |
| Administrative & Support | 0 (0.0%) | 0 (0.0%) |
| Educational Services | 0 (0.0%) | 9 (100.0%) |
| Health Care & Social Assistance | 0 (0.0%) | 8 (100.0%) |
| Arts, Entertainment & Recreation | 2 (100.0%) | 0 (0.0%) |
| Accommodation & Food Services | 14 (100.0%) | 0 (0.0%) |
| Public Administration | 0 (0.0%) | 0 (0.0%) |
| Total | 51 (63.0%) | 30 (37.0%) |
Education in Fairview
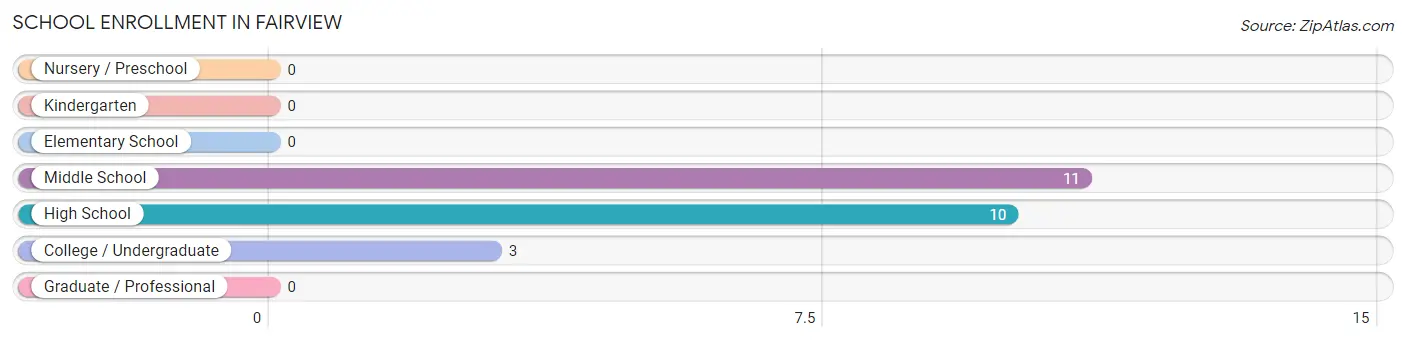
School Enrollment in Fairview
The most common levels of schooling among the 24 students in Fairview are middle school (11 | 45.8%), high school (10 | 41.7%), and college / undergraduate (3 | 12.5%).
| School Level | # Students | % Students |
| Nursery / Preschool | 0 | 0.0% |
| Kindergarten | 0 | 0.0% |
| Elementary School | 0 | 0.0% |
| Middle School | 11 | 45.8% |
| High School | 10 | 41.7% |
| College / Undergraduate | 3 | 12.5% |
| Graduate / Professional | 0 | 0.0% |
| Total | 24 | 100.0% |
School Enrollment by Age by Funding Source in Fairview
Out of a total of 24 students who are enrolled in schools in Fairview, 5 (20.8%) attend a private institution, while the remaining 19 (79.2%) are enrolled in public schools. The age group of 10 to 14 year olds has the highest likelihood of being enrolled in private schools, with 3 (27.3% in the age bracket) enrolled. Conversely, the age group of 18 to 19 year olds has the lowest likelihood of being enrolled in a private school, with 2 (100.0% in the age bracket) attending a public institution.
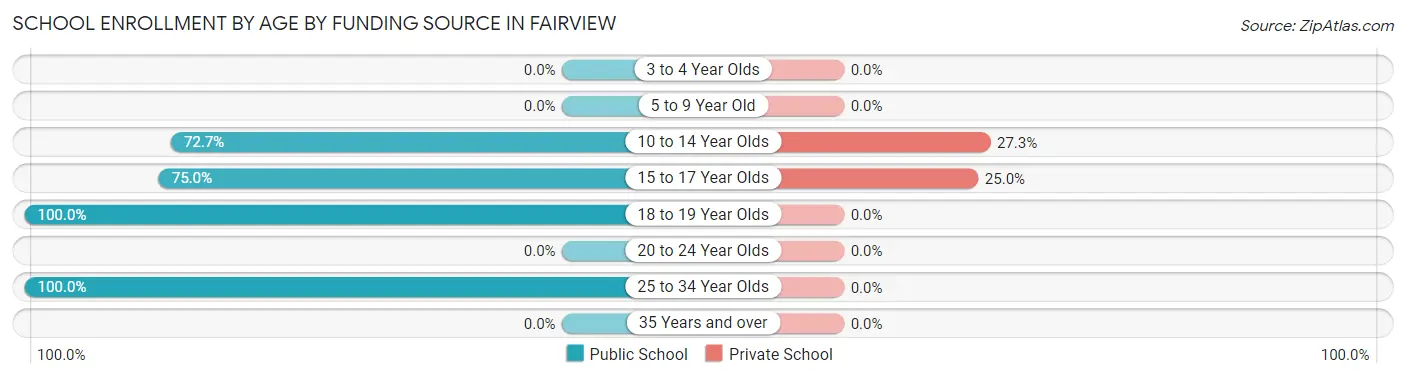
| Age Bracket | Public School | Private School |
| 3 to 4 Year Olds | 0 (0.0%) | 0 (0.0%) |
| 5 to 9 Year Old | 0 (0.0%) | 0 (0.0%) |
| 10 to 14 Year Olds | 8 (72.7%) | 3 (27.3%) |
| 15 to 17 Year Olds | 6 (75.0%) | 2 (25.0%) |
| 18 to 19 Year Olds | 2 (100.0%) | 0 (0.0%) |
| 20 to 24 Year Olds | 0 (0.0%) | 0 (0.0%) |
| 25 to 34 Year Olds | 3 (100.0%) | 0 (0.0%) |
| 35 Years and over | 0 (0.0%) | 0 (0.0%) |
| Total | 19 (79.2%) | 5 (20.8%) |
Educational Attainment by Field of Study in Fairview
Science & technology (9 | 47.4%), business (5 | 26.3%), arts & humanities (3 | 15.8%), and physical & health sciences (2 | 10.5%) are the most common fields of study among 19 individuals in Fairview who have obtained a bachelor's degree or higher.
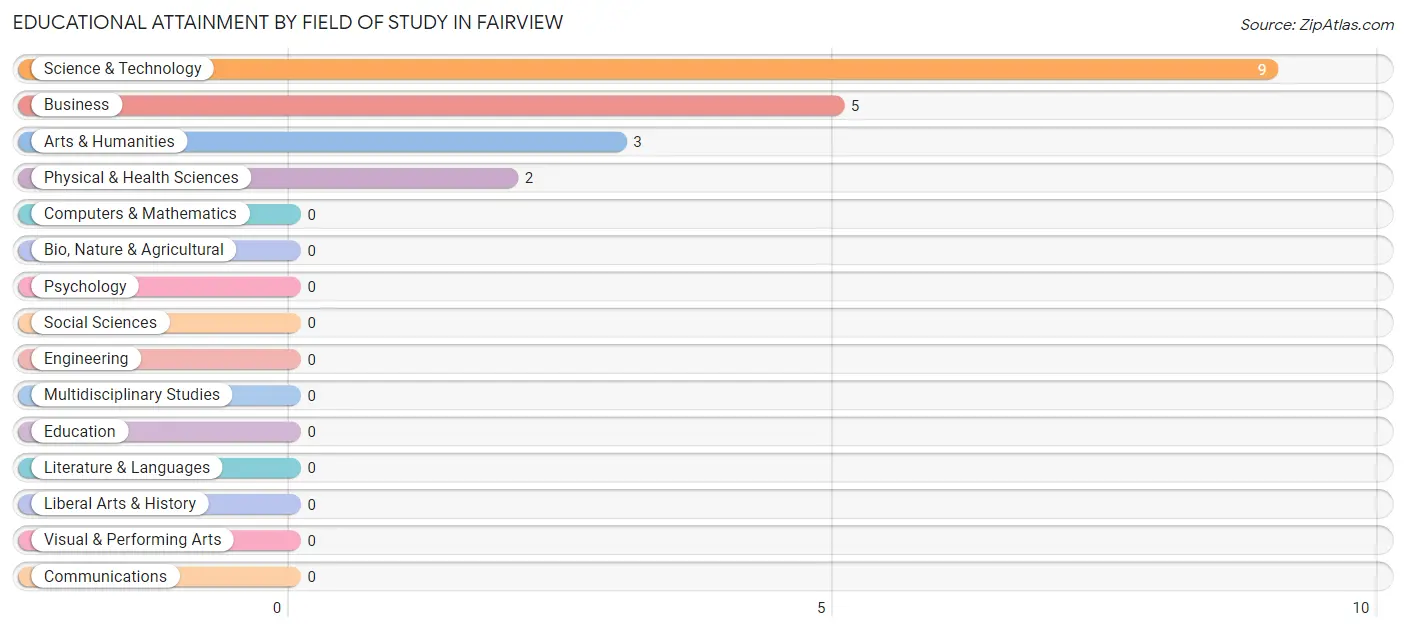
| Field of Study | # Graduates | % Graduates |
| Computers & Mathematics | 0 | 0.0% |
| Bio, Nature & Agricultural | 0 | 0.0% |
| Physical & Health Sciences | 2 | 10.5% |
| Psychology | 0 | 0.0% |
| Social Sciences | 0 | 0.0% |
| Engineering | 0 | 0.0% |
| Multidisciplinary Studies | 0 | 0.0% |
| Science & Technology | 9 | 47.4% |
| Business | 5 | 26.3% |
| Education | 0 | 0.0% |
| Literature & Languages | 0 | 0.0% |
| Liberal Arts & History | 0 | 0.0% |
| Visual & Performing Arts | 0 | 0.0% |
| Communications | 0 | 0.0% |
| Arts & Humanities | 3 | 15.8% |
| Total | 19 | 100.0% |
Transportation & Commute in Fairview
Vehicle Availability by Sex in Fairview
The most prevalent vehicle ownership categories in Fairview are males with 2 vehicles (23, accounting for 45.1%) and females with 2 vehicles (13, making up 79.3%).
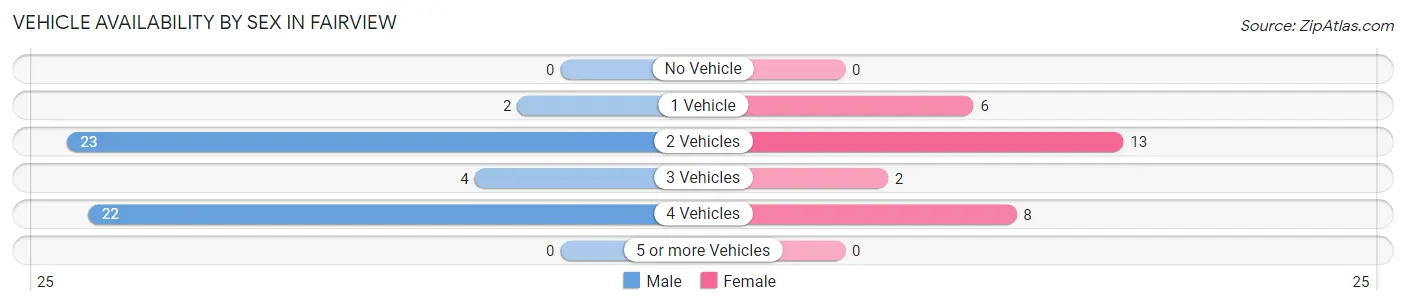
| Vehicles Available | Male | Female |
| No Vehicle | 0 (0.0%) | 0 (0.0%) |
| 1 Vehicle | 2 (3.9%) | 6 (20.7%) |
| 2 Vehicles | 23 (45.1%) | 13 (44.8%) |
| 3 Vehicles | 4 (7.8%) | 2 (6.9%) |
| 4 Vehicles | 22 (43.1%) | 8 (27.6%) |
| 5 or more Vehicles | 0 (0.0%) | 0 (0.0%) |
| Total | 51 (100.0%) | 29 (100.0%) |
Commute Time in Fairview
The most frequently occuring commute durations in Fairview are 15 to 19 minutes (38 commuters, 53.5%), 20 to 24 minutes (11 commuters, 15.5%), and 45 to 59 minutes (8 commuters, 11.3%).
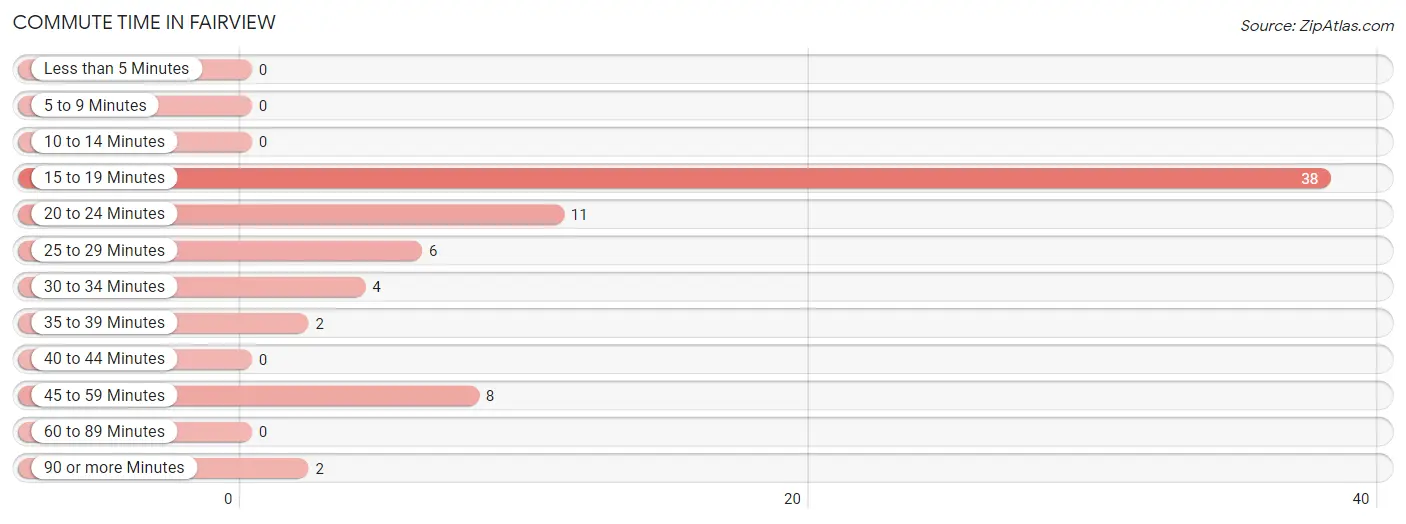
| Commute Time | # Commuters | % Commuters |
| Less than 5 Minutes | 0 | 0.0% |
| 5 to 9 Minutes | 0 | 0.0% |
| 10 to 14 Minutes | 0 | 0.0% |
| 15 to 19 Minutes | 38 | 53.5% |
| 20 to 24 Minutes | 11 | 15.5% |
| 25 to 29 Minutes | 6 | 8.5% |
| 30 to 34 Minutes | 4 | 5.6% |
| 35 to 39 Minutes | 2 | 2.8% |
| 40 to 44 Minutes | 0 | 0.0% |
| 45 to 59 Minutes | 8 | 11.3% |
| 60 to 89 Minutes | 0 | 0.0% |
| 90 or more Minutes | 2 | 2.8% |
Commute Time by Sex in Fairview
The most common commute times in Fairview are 15 to 19 minutes (18 commuters, 42.9%) for males and 15 to 19 minutes (20 commuters, 69.0%) for females.
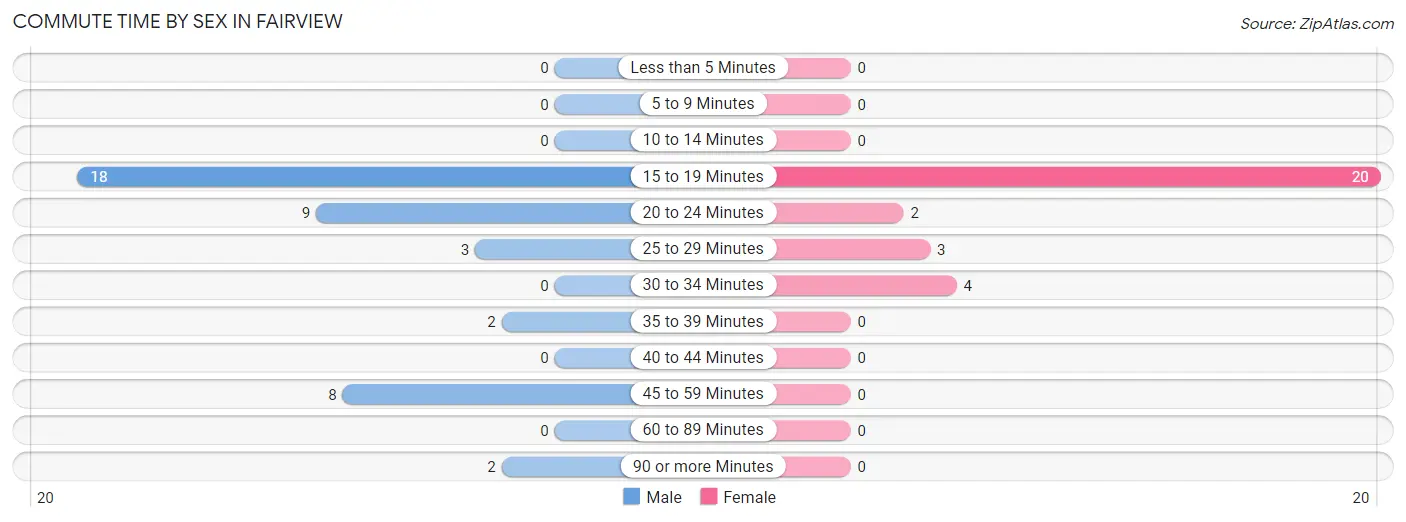
| Commute Time | Male | Female |
| Less than 5 Minutes | 0 (0.0%) | 0 (0.0%) |
| 5 to 9 Minutes | 0 (0.0%) | 0 (0.0%) |
| 10 to 14 Minutes | 0 (0.0%) | 0 (0.0%) |
| 15 to 19 Minutes | 18 (42.9%) | 20 (69.0%) |
| 20 to 24 Minutes | 9 (21.4%) | 2 (6.9%) |
| 25 to 29 Minutes | 3 (7.1%) | 3 (10.3%) |
| 30 to 34 Minutes | 0 (0.0%) | 4 (13.8%) |
| 35 to 39 Minutes | 2 (4.8%) | 0 (0.0%) |
| 40 to 44 Minutes | 0 (0.0%) | 0 (0.0%) |
| 45 to 59 Minutes | 8 (19.1%) | 0 (0.0%) |
| 60 to 89 Minutes | 0 (0.0%) | 0 (0.0%) |
| 90 or more Minutes | 2 (4.8%) | 0 (0.0%) |
Time of Departure to Work by Sex in Fairview
The most frequent times of departure to work in Fairview are 12:00 PM to 3:59 PM (9, 21.4%) for males and 7:00 AM to 7:29 AM (8, 27.6%) for females.
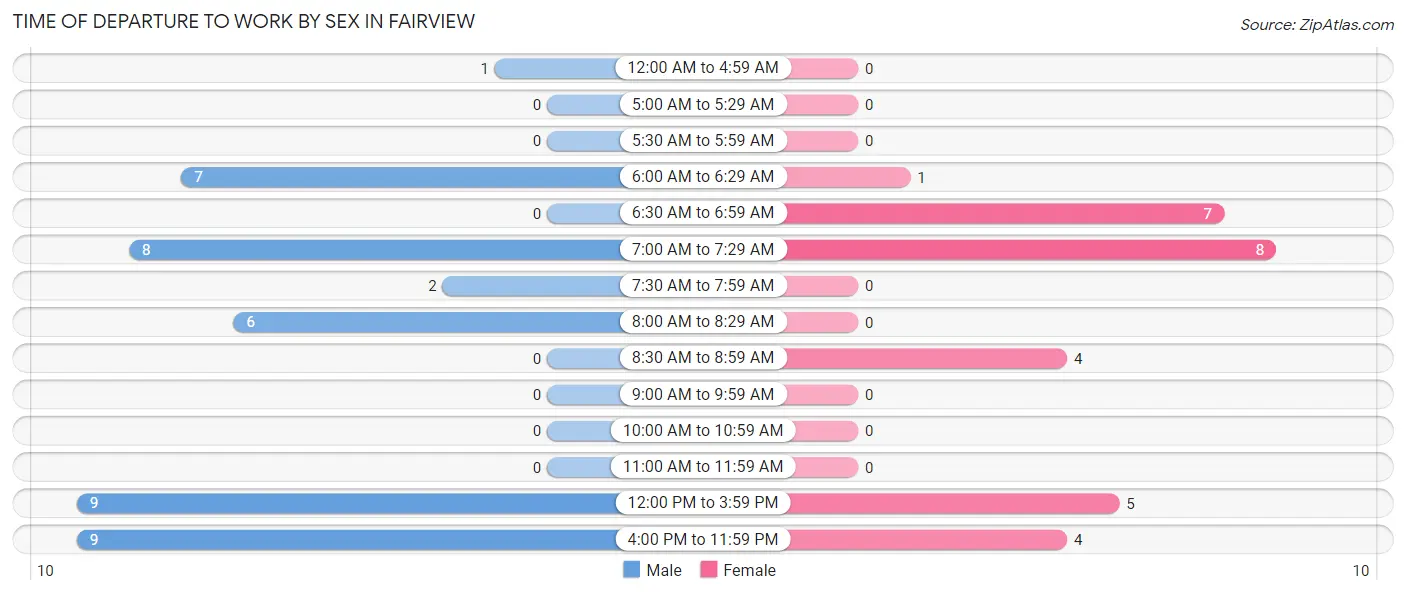
| Time of Departure | Male | Female |
| 12:00 AM to 4:59 AM | 1 (2.4%) | 0 (0.0%) |
| 5:00 AM to 5:29 AM | 0 (0.0%) | 0 (0.0%) |
| 5:30 AM to 5:59 AM | 0 (0.0%) | 0 (0.0%) |
| 6:00 AM to 6:29 AM | 7 (16.7%) | 1 (3.5%) |
| 6:30 AM to 6:59 AM | 0 (0.0%) | 7 (24.1%) |
| 7:00 AM to 7:29 AM | 8 (19.1%) | 8 (27.6%) |
| 7:30 AM to 7:59 AM | 2 (4.8%) | 0 (0.0%) |
| 8:00 AM to 8:29 AM | 6 (14.3%) | 0 (0.0%) |
| 8:30 AM to 8:59 AM | 0 (0.0%) | 4 (13.8%) |
| 9:00 AM to 9:59 AM | 0 (0.0%) | 0 (0.0%) |
| 10:00 AM to 10:59 AM | 0 (0.0%) | 0 (0.0%) |
| 11:00 AM to 11:59 AM | 0 (0.0%) | 0 (0.0%) |
| 12:00 PM to 3:59 PM | 9 (21.4%) | 5 (17.2%) |
| 4:00 PM to 11:59 PM | 9 (21.4%) | 4 (13.8%) |
| Total | 42 (100.0%) | 29 (100.0%) |
Housing Occupancy in Fairview
Occupancy by Ownership in Fairview
Of the total 64 dwellings in Fairview, owner-occupied units account for 62 (96.9%), while renter-occupied units make up 2 (3.1%).
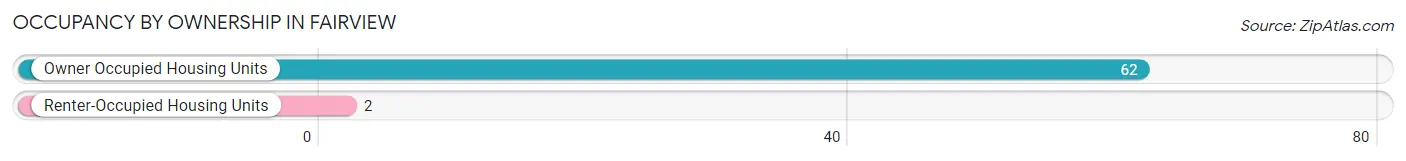
| Occupancy | # Housing Units | % Housing Units |
| Owner Occupied Housing Units | 62 | 96.9% |
| Renter-Occupied Housing Units | 2 | 3.1% |
| Total Occupied Housing Units | 64 | 100.0% |
Occupancy by Household Size in Fairview
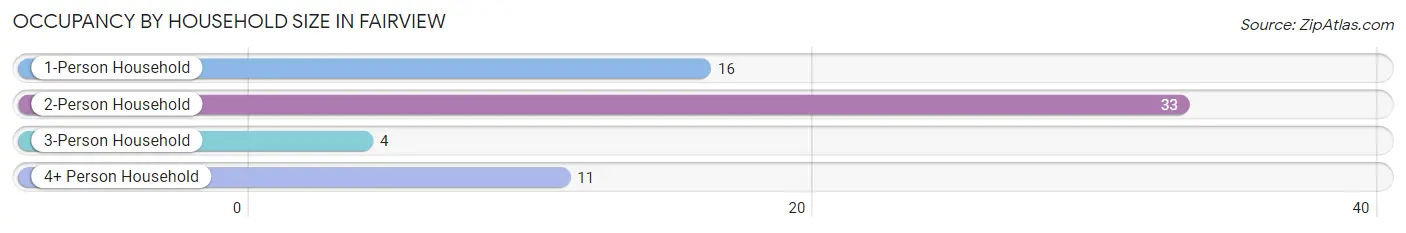
| Household Size | # Housing Units | % Housing Units |
| 1-Person Household | 16 | 25.0% |
| 2-Person Household | 33 | 51.6% |
| 3-Person Household | 4 | 6.2% |
| 4+ Person Household | 11 | 17.2% |
| Total Housing Units | 64 | 100.0% |
Occupancy by Ownership by Household Size in Fairview
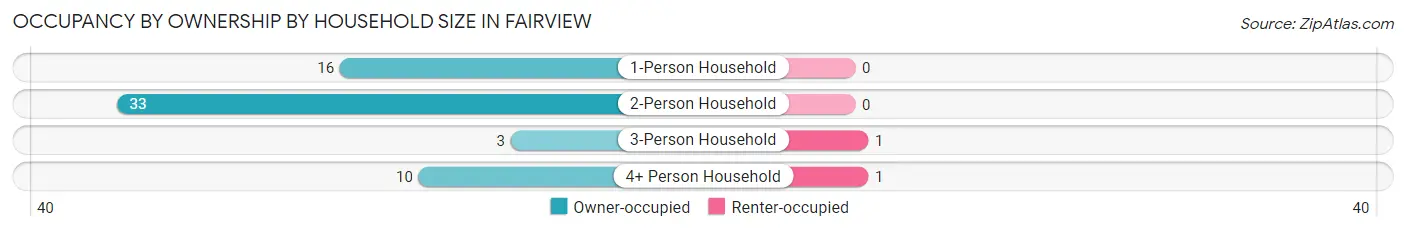
| Household Size | Owner-occupied | Renter-occupied |
| 1-Person Household | 16 (100.0%) | 0 (0.0%) |
| 2-Person Household | 33 (100.0%) | 0 (0.0%) |
| 3-Person Household | 3 (75.0%) | 1 (25.0%) |
| 4+ Person Household | 10 (90.9%) | 1 (9.1%) |
| Total Housing Units | 62 (96.9%) | 2 (3.1%) |
Occupancy by Educational Attainment in Fairview
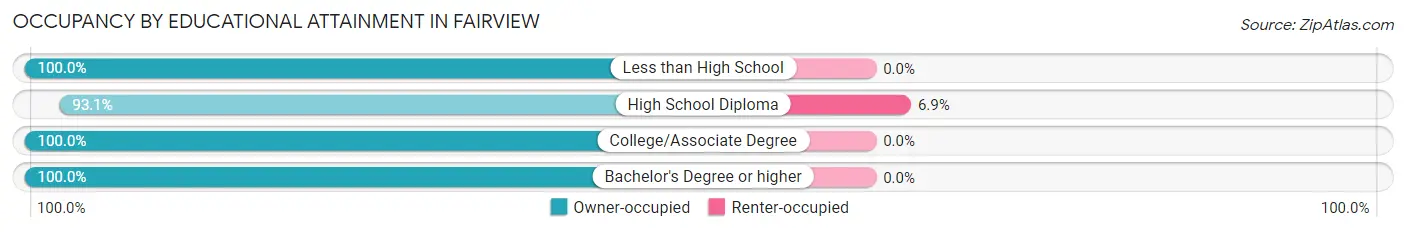
| Household Size | Owner-occupied | Renter-occupied |
| Less than High School | 13 (100.0%) | 0 (0.0%) |
| High School Diploma | 27 (93.1%) | 2 (6.9%) |
| College/Associate Degree | 4 (100.0%) | 0 (0.0%) |
| Bachelor's Degree or higher | 18 (100.0%) | 0 (0.0%) |
Occupancy by Age of Householder in Fairview
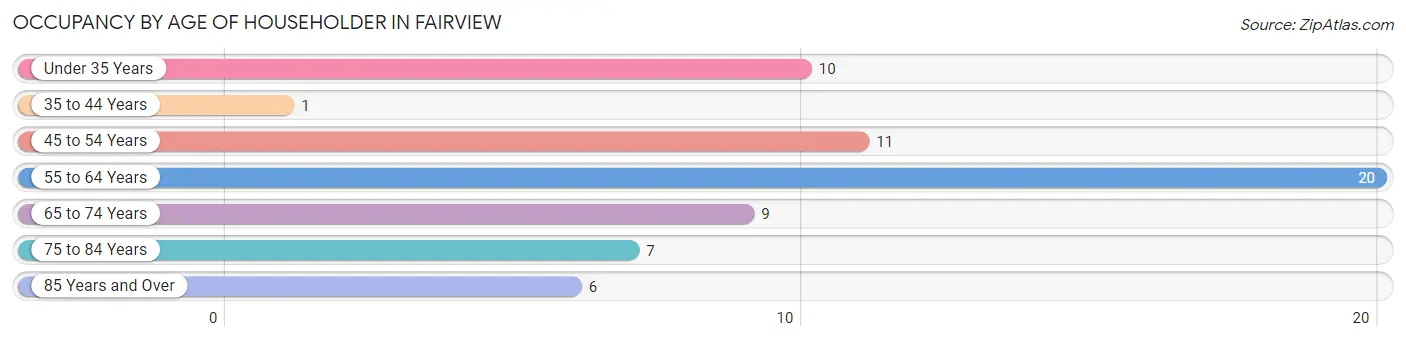
| Age Bracket | # Households | % Households |
| Under 35 Years | 10 | 15.6% |
| 35 to 44 Years | 1 | 1.6% |
| 45 to 54 Years | 11 | 17.2% |
| 55 to 64 Years | 20 | 31.2% |
| 65 to 74 Years | 9 | 14.1% |
| 75 to 84 Years | 7 | 10.9% |
| 85 Years and Over | 6 | 9.4% |
| Total | 64 | 100.0% |
Housing Finances in Fairview
Median Income by Occupancy in Fairview
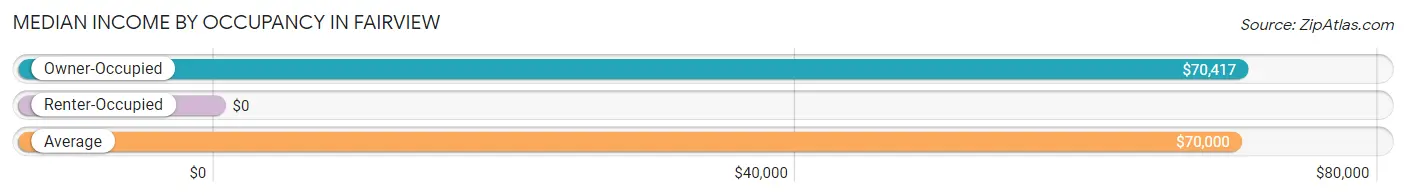
| Occupancy Type | # Households | Median Income |
| Owner-Occupied | 62 (96.9%) | $70,417 |
| Renter-Occupied | 2 (3.1%) | $0 |
| Average | 64 (100.0%) | $70,000 |
Occupancy by Householder Income Bracket in Fairview
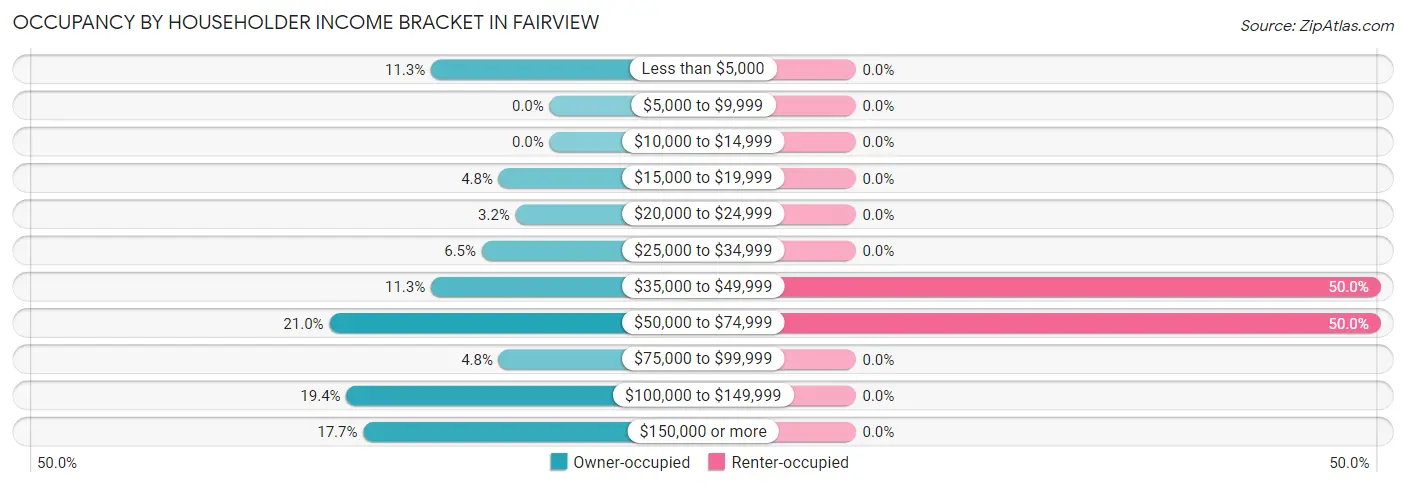
| Income Bracket | Owner-occupied | Renter-occupied |
| Less than $5,000 | 7 (11.3%) | 0 (0.0%) |
| $5,000 to $9,999 | 0 (0.0%) | 0 (0.0%) |
| $10,000 to $14,999 | 0 (0.0%) | 0 (0.0%) |
| $15,000 to $19,999 | 3 (4.8%) | 0 (0.0%) |
| $20,000 to $24,999 | 2 (3.2%) | 0 (0.0%) |
| $25,000 to $34,999 | 4 (6.5%) | 0 (0.0%) |
| $35,000 to $49,999 | 7 (11.3%) | 1 (50.0%) |
| $50,000 to $74,999 | 13 (21.0%) | 1 (50.0%) |
| $75,000 to $99,999 | 3 (4.8%) | 0 (0.0%) |
| $100,000 to $149,999 | 12 (19.4%) | 0 (0.0%) |
| $150,000 or more | 11 (17.7%) | 0 (0.0%) |
| Total | 62 (100.0%) | 2 (100.0%) |
Monthly Housing Cost Tiers in Fairview
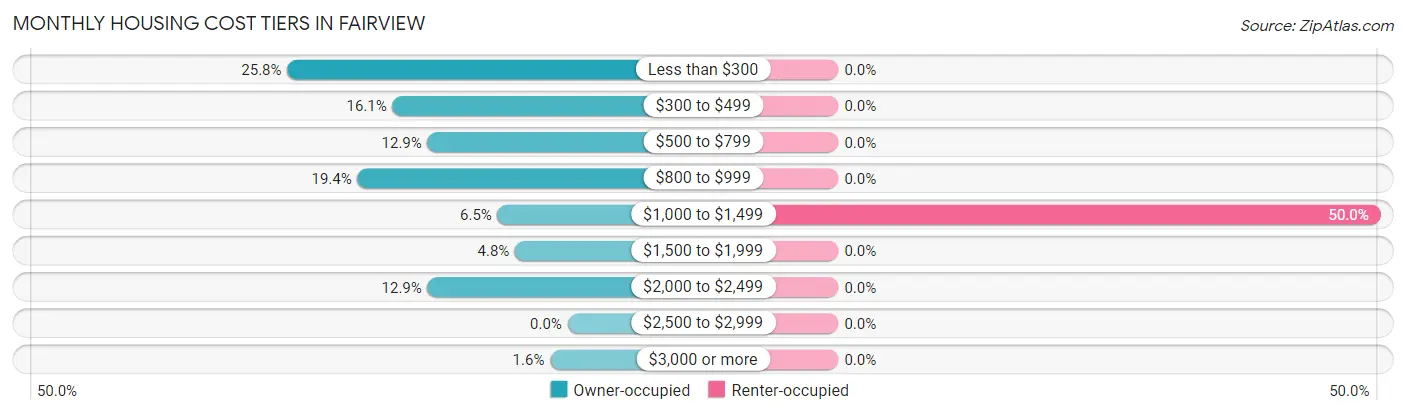
| Monthly Cost | Owner-occupied | Renter-occupied |
| Less than $300 | 16 (25.8%) | 0 (0.0%) |
| $300 to $499 | 10 (16.1%) | 0 (0.0%) |
| $500 to $799 | 8 (12.9%) | 0 (0.0%) |
| $800 to $999 | 12 (19.4%) | 0 (0.0%) |
| $1,000 to $1,499 | 4 (6.5%) | 1 (50.0%) |
| $1,500 to $1,999 | 3 (4.8%) | 0 (0.0%) |
| $2,000 to $2,499 | 8 (12.9%) | 0 (0.0%) |
| $2,500 to $2,999 | 0 (0.0%) | 0 (0.0%) |
| $3,000 or more | 1 (1.6%) | 0 (0.0%) |
| Total | 62 (100.0%) | 2 (100.0%) |
Physical Housing Characteristics in Fairview
Housing Structures in Fairview
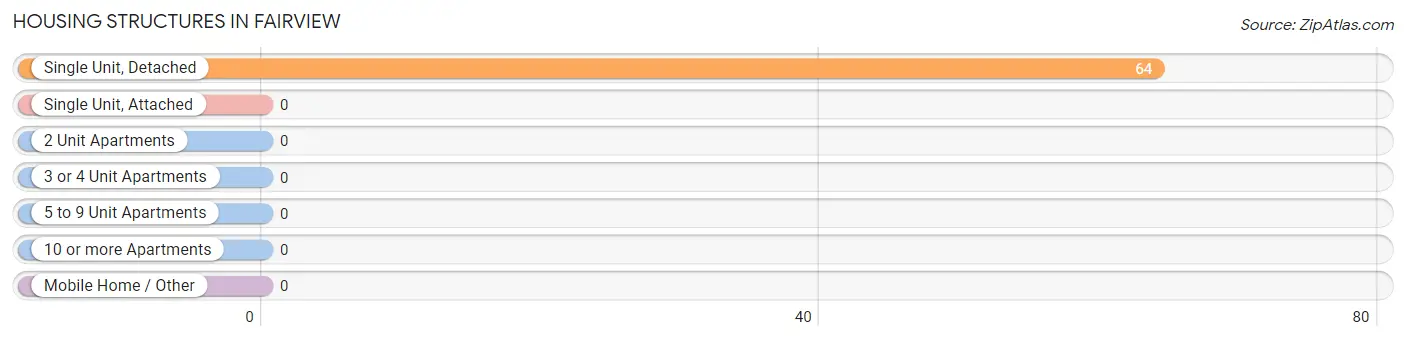
| Structure Type | # Housing Units | % Housing Units |
| Single Unit, Detached | 64 | 100.0% |
| Single Unit, Attached | 0 | 0.0% |
| 2 Unit Apartments | 0 | 0.0% |
| 3 or 4 Unit Apartments | 0 | 0.0% |
| 5 to 9 Unit Apartments | 0 | 0.0% |
| 10 or more Apartments | 0 | 0.0% |
| Mobile Home / Other | 0 | 0.0% |
| Total | 64 | 100.0% |
Housing Structures by Occupancy in Fairview
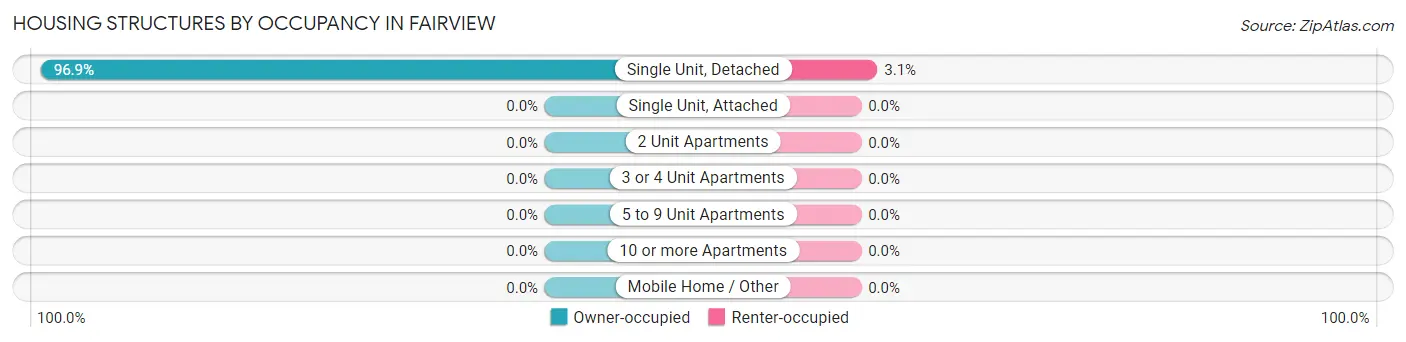
| Structure Type | Owner-occupied | Renter-occupied |
| Single Unit, Detached | 62 (96.9%) | 2 (3.1%) |
| Single Unit, Attached | 0 (0.0%) | 0 (0.0%) |
| 2 Unit Apartments | 0 (0.0%) | 0 (0.0%) |
| 3 or 4 Unit Apartments | 0 (0.0%) | 0 (0.0%) |
| 5 to 9 Unit Apartments | 0 (0.0%) | 0 (0.0%) |
| 10 or more Apartments | 0 (0.0%) | 0 (0.0%) |
| Mobile Home / Other | 0 (0.0%) | 0 (0.0%) |
| Total | 62 (96.9%) | 2 (3.1%) |
Housing Structures by Number of Rooms in Fairview
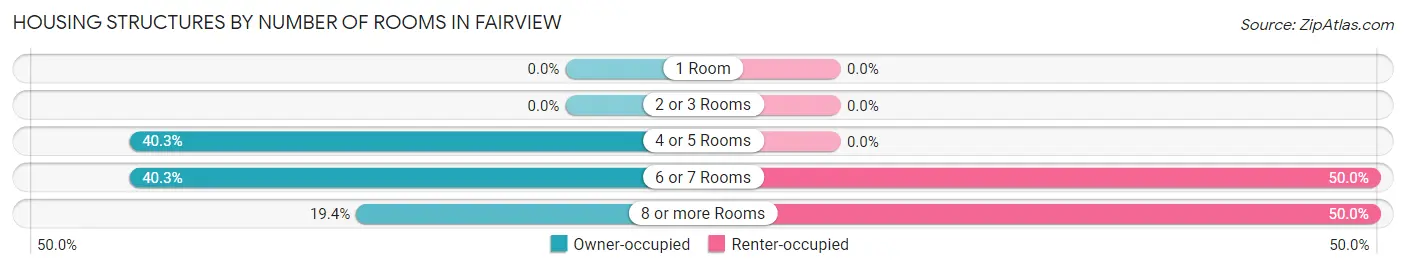
| Number of Rooms | Owner-occupied | Renter-occupied |
| 1 Room | 0 (0.0%) | 0 (0.0%) |
| 2 or 3 Rooms | 0 (0.0%) | 0 (0.0%) |
| 4 or 5 Rooms | 25 (40.3%) | 0 (0.0%) |
| 6 or 7 Rooms | 25 (40.3%) | 1 (50.0%) |
| 8 or more Rooms | 12 (19.4%) | 1 (50.0%) |
| Total | 62 (100.0%) | 2 (100.0%) |
Housing Structure by Heating Type in Fairview
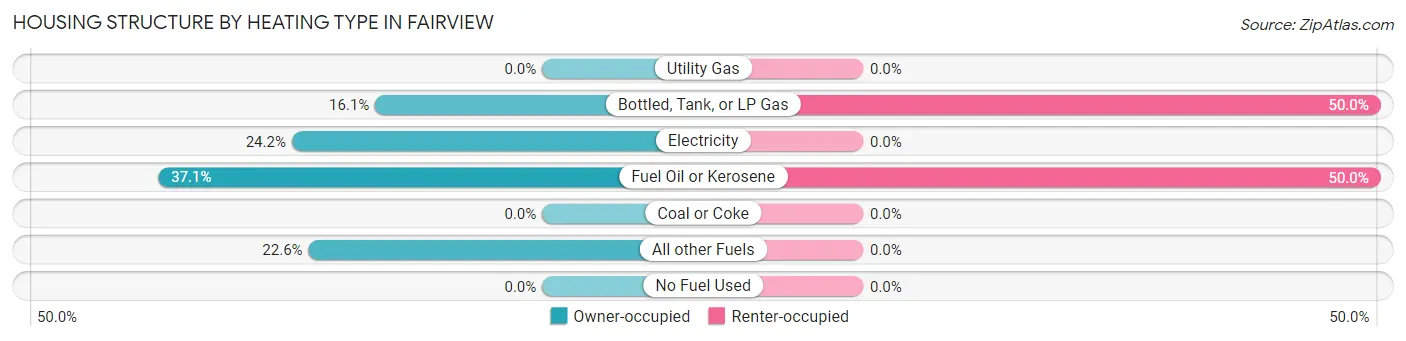
| Heating Type | Owner-occupied | Renter-occupied |
| Utility Gas | 0 (0.0%) | 0 (0.0%) |
| Bottled, Tank, or LP Gas | 10 (16.1%) | 1 (50.0%) |
| Electricity | 15 (24.2%) | 0 (0.0%) |
| Fuel Oil or Kerosene | 23 (37.1%) | 1 (50.0%) |
| Coal or Coke | 0 (0.0%) | 0 (0.0%) |
| All other Fuels | 14 (22.6%) | 0 (0.0%) |
| No Fuel Used | 0 (0.0%) | 0 (0.0%) |
| Total | 62 (100.0%) | 2 (100.0%) |
Household Vehicle Usage in Fairview
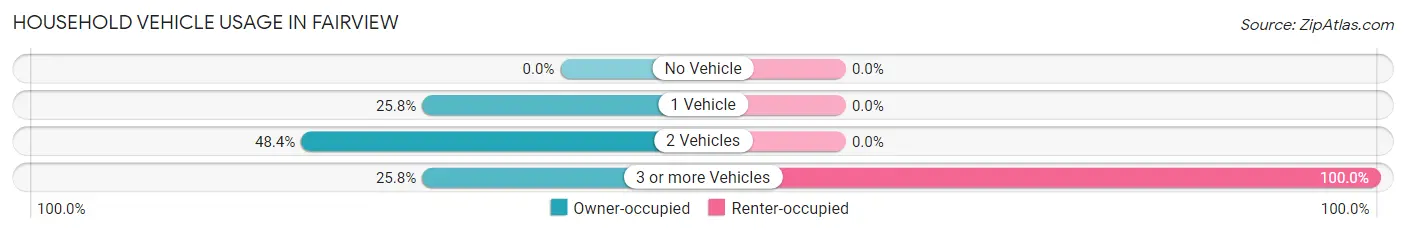
| Vehicles per Household | Owner-occupied | Renter-occupied |
| No Vehicle | 0 (0.0%) | 0 (0.0%) |
| 1 Vehicle | 16 (25.8%) | 0 (0.0%) |
| 2 Vehicles | 30 (48.4%) | 0 (0.0%) |
| 3 or more Vehicles | 16 (25.8%) | 2 (100.0%) |
| Total | 62 (100.0%) | 2 (100.0%) |
Real Estate & Mortgages in Fairview
Real Estate and Mortgage Overview in Fairview
| Characteristic | Without Mortgage | With Mortgage |
| Housing Units | 28 | 32 |
| Median Property Value | $186,800 | $146,900 |
| Median Household Income | $26,176 | $9 |
| Monthly Housing Costs | $918 | $1 |
| Real Estate Taxes | $494 | $0 |
Property Value by Mortgage Status in Fairview
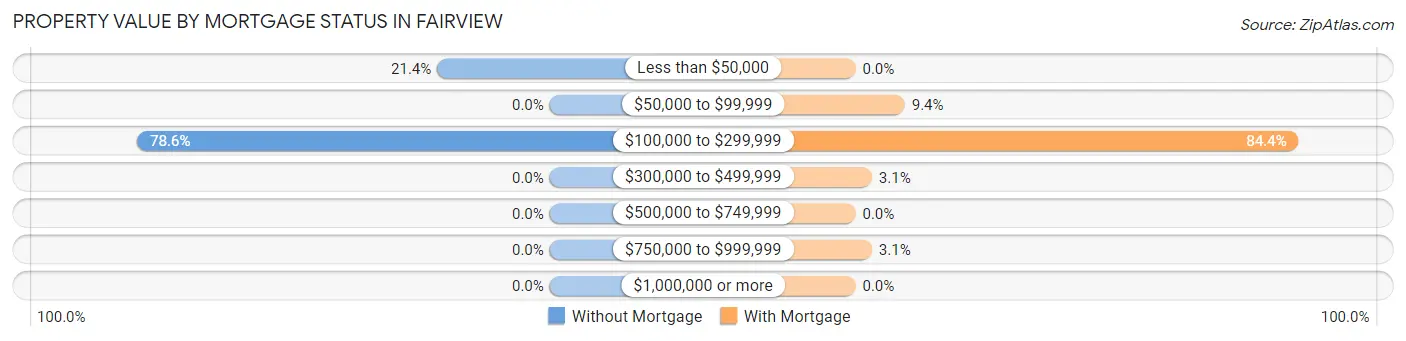
| Property Value | Without Mortgage | With Mortgage |
| Less than $50,000 | 6 (21.4%) | 0 (0.0%) |
| $50,000 to $99,999 | 0 (0.0%) | 3 (9.4%) |
| $100,000 to $299,999 | 22 (78.6%) | 27 (84.4%) |
| $300,000 to $499,999 | 0 (0.0%) | 1 (3.1%) |
| $500,000 to $749,999 | 0 (0.0%) | 0 (0.0%) |
| $750,000 to $999,999 | 0 (0.0%) | 1 (3.1%) |
| $1,000,000 or more | 0 (0.0%) | 0 (0.0%) |
| Total | 28 (100.0%) | 32 (100.0%) |
Household Income by Mortgage Status in Fairview
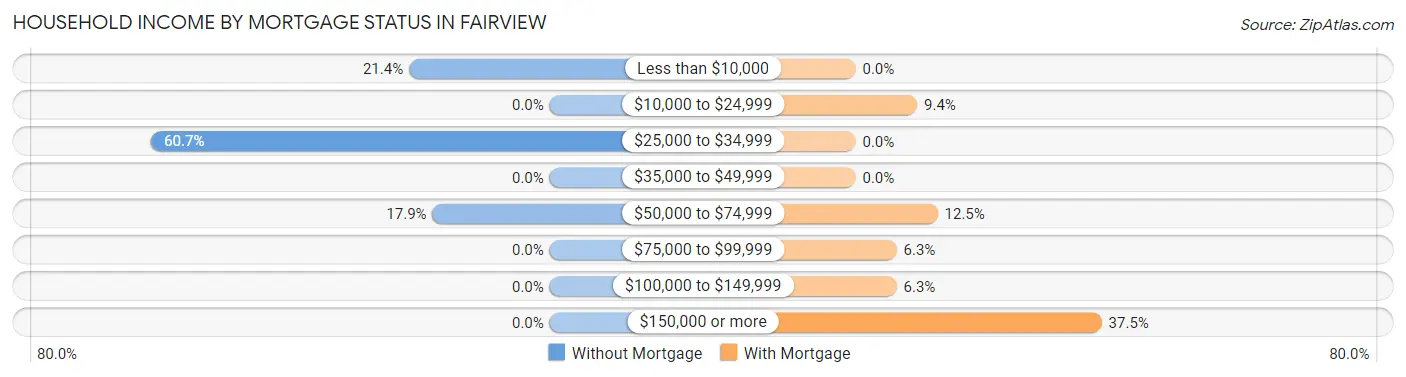
| Household Income | Without Mortgage | With Mortgage |
| Less than $10,000 | 6 (21.4%) | 0 (0.0%) |
| $10,000 to $24,999 | 0 (0.0%) | 3 (9.4%) |
| $25,000 to $34,999 | 17 (60.7%) | 0 (0.0%) |
| $35,000 to $49,999 | 0 (0.0%) | 0 (0.0%) |
| $50,000 to $74,999 | 5 (17.9%) | 4 (12.5%) |
| $75,000 to $99,999 | 0 (0.0%) | 2 (6.2%) |
| $100,000 to $149,999 | 0 (0.0%) | 2 (6.2%) |
| $150,000 or more | 0 (0.0%) | 12 (37.5%) |
| Total | 28 (100.0%) | 32 (100.0%) |
Property Value to Household Income Ratio in Fairview
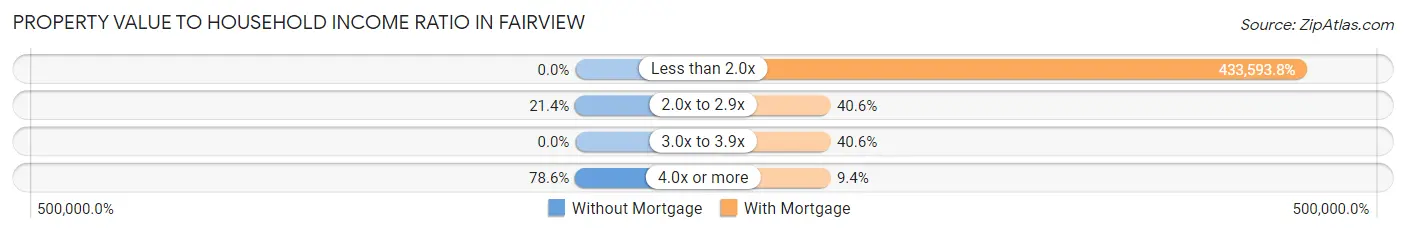
| Value-to-Income Ratio | Without Mortgage | With Mortgage |
| Less than 2.0x | 0 (0.0%) | 138,750 (433,593.8%) |
| 2.0x to 2.9x | 6 (21.4%) | 13 (40.6%) |
| 3.0x to 3.9x | 0 (0.0%) | 13 (40.6%) |
| 4.0x or more | 22 (78.6%) | 3 (9.4%) |
| Total | 28 (100.0%) | 32 (100.0%) |
Real Estate Taxes by Mortgage Status in Fairview
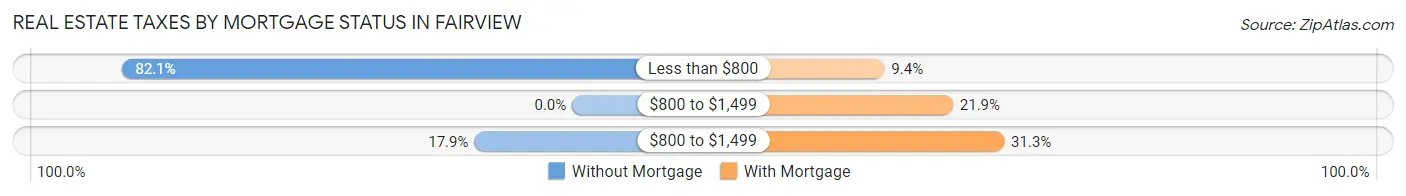
| Property Taxes | Without Mortgage | With Mortgage |
| Less than $800 | 23 (82.1%) | 3 (9.4%) |
| $800 to $1,499 | 0 (0.0%) | 7 (21.9%) |
| $800 to $1,499 | 5 (17.9%) | 10 (31.2%) |
| Total | 28 (100.0%) | 32 (100.0%) |
Health & Disability in Fairview
Health Insurance Coverage by Age in Fairview
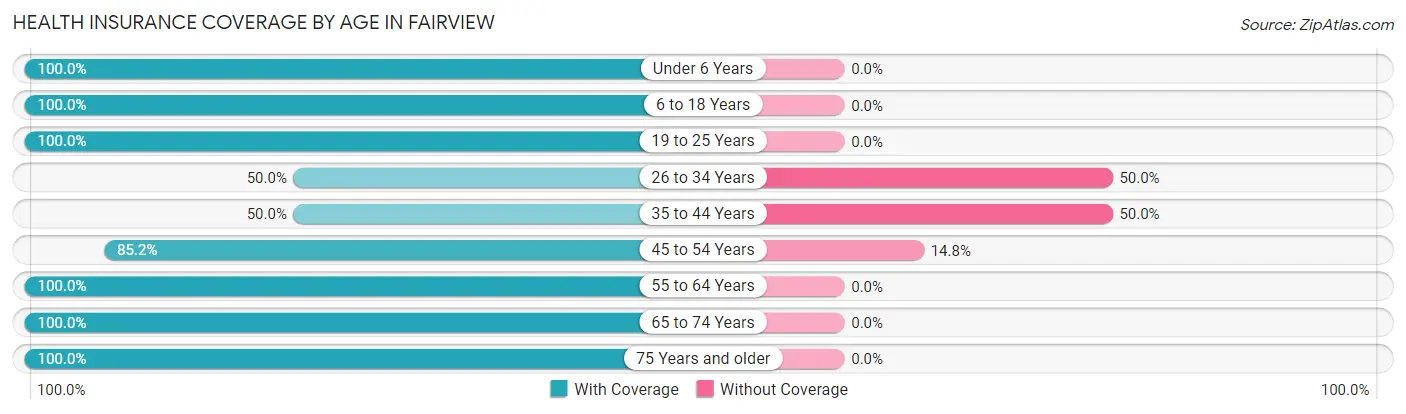
| Age Bracket | With Coverage | Without Coverage |
| Under 6 Years | 7 (100.0%) | 0 (0.0%) |
| 6 to 18 Years | 21 (100.0%) | 0 (0.0%) |
| 19 to 25 Years | 14 (100.0%) | 0 (0.0%) |
| 26 to 34 Years | 4 (50.0%) | 4 (50.0%) |
| 35 to 44 Years | 3 (50.0%) | 3 (50.0%) |
| 45 to 54 Years | 23 (85.2%) | 4 (14.8%) |
| 55 to 64 Years | 33 (100.0%) | 0 (0.0%) |
| 65 to 74 Years | 14 (100.0%) | 0 (0.0%) |
| 75 Years and older | 18 (100.0%) | 0 (0.0%) |
| Total | 137 (92.6%) | 11 (7.4%) |
Health Insurance Coverage by Citizenship Status in Fairview
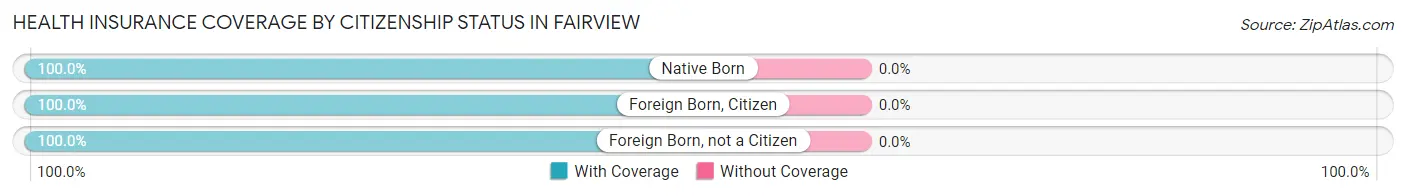
| Citizenship Status | With Coverage | Without Coverage |
| Native Born | 7 (100.0%) | 0 (0.0%) |
| Foreign Born, Citizen | 21 (100.0%) | 0 (0.0%) |
| Foreign Born, not a Citizen | 14 (100.0%) | 0 (0.0%) |
Health Insurance Coverage by Household Income in Fairview
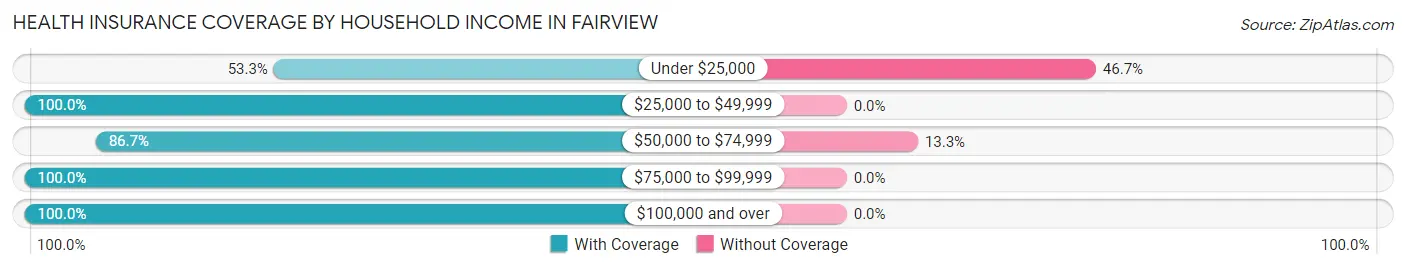
| Household Income | With Coverage | Without Coverage |
| Under $25,000 | 8 (53.3%) | 7 (46.7%) |
| $25,000 to $49,999 | 22 (100.0%) | 0 (0.0%) |
| $50,000 to $74,999 | 26 (86.7%) | 4 (13.3%) |
| $75,000 to $99,999 | 10 (100.0%) | 0 (0.0%) |
| $100,000 and over | 71 (100.0%) | 0 (0.0%) |
Public vs Private Health Insurance Coverage by Age in Fairview
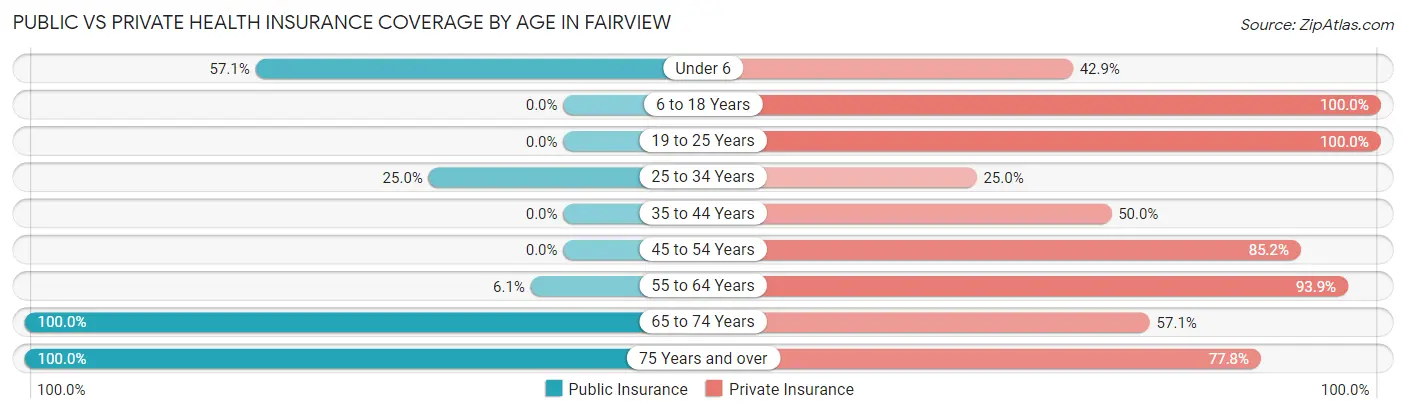
| Age Bracket | Public Insurance | Private Insurance |
| Under 6 | 4 (57.1%) | 3 (42.9%) |
| 6 to 18 Years | 0 (0.0%) | 21 (100.0%) |
| 19 to 25 Years | 0 (0.0%) | 14 (100.0%) |
| 25 to 34 Years | 2 (25.0%) | 2 (25.0%) |
| 35 to 44 Years | 0 (0.0%) | 3 (50.0%) |
| 45 to 54 Years | 0 (0.0%) | 23 (85.2%) |
| 55 to 64 Years | 2 (6.1%) | 31 (93.9%) |
| 65 to 74 Years | 14 (100.0%) | 8 (57.1%) |
| 75 Years and over | 18 (100.0%) | 14 (77.8%) |
| Total | 40 (27.0%) | 119 (80.4%) |
Disability Status by Sex by Age in Fairview
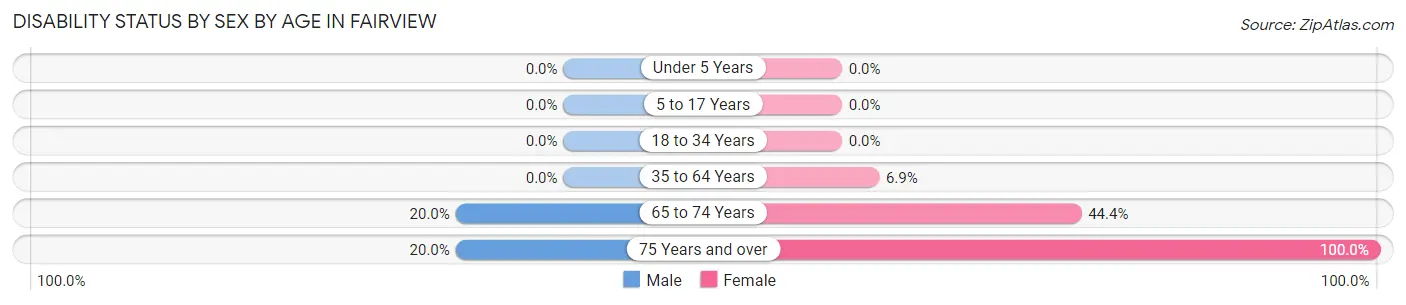
| Age Bracket | Male | Female |
| Under 5 Years | 0 (0.0%) | 0 (0.0%) |
| 5 to 17 Years | 0 (0.0%) | 0 (0.0%) |
| 18 to 34 Years | 0 (0.0%) | 0 (0.0%) |
| 35 to 64 Years | 0 (0.0%) | 2 (6.9%) |
| 65 to 74 Years | 1 (20.0%) | 4 (44.4%) |
| 75 Years and over | 2 (20.0%) | 8 (100.0%) |
Disability Class by Sex by Age in Fairview
Disability Class: Hearing Difficulty
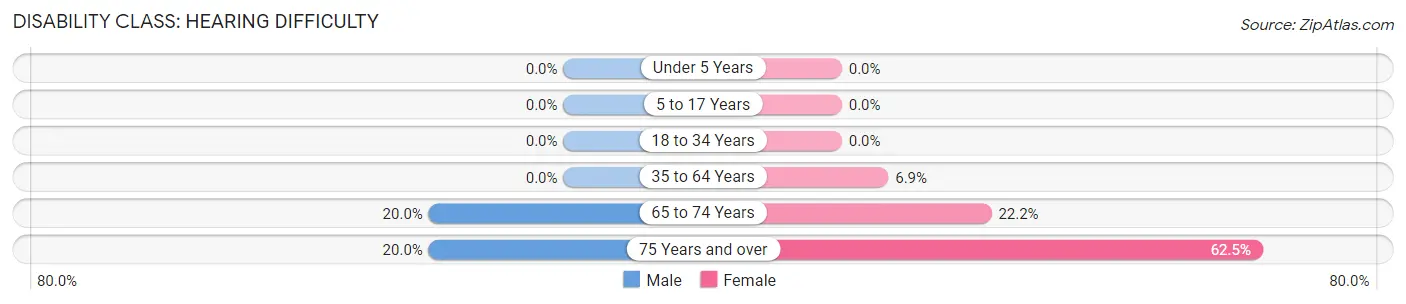
| Age Bracket | Male | Female |
| Under 5 Years | 0 (0.0%) | 0 (0.0%) |
| 5 to 17 Years | 0 (0.0%) | 0 (0.0%) |
| 18 to 34 Years | 0 (0.0%) | 0 (0.0%) |
| 35 to 64 Years | 0 (0.0%) | 2 (6.9%) |
| 65 to 74 Years | 1 (20.0%) | 2 (22.2%) |
| 75 Years and over | 2 (20.0%) | 5 (62.5%) |
Disability Class: Vision Difficulty
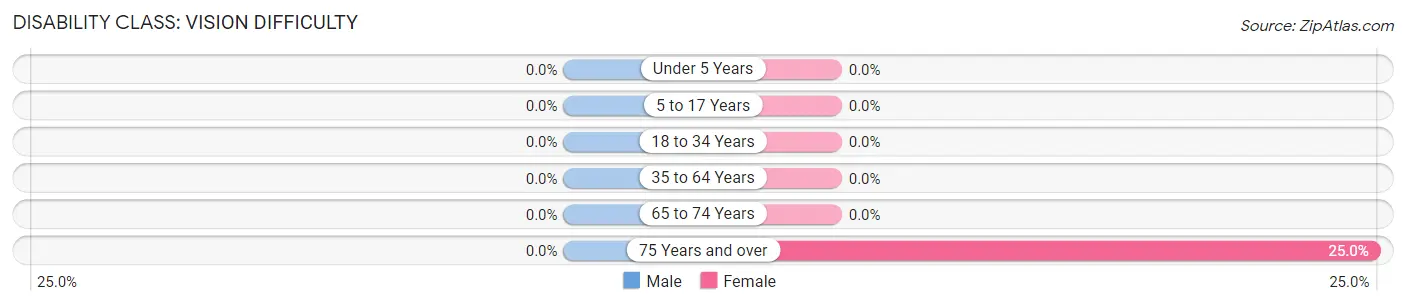
| Age Bracket | Male | Female |
| Under 5 Years | 0 (0.0%) | 0 (0.0%) |
| 5 to 17 Years | 0 (0.0%) | 0 (0.0%) |
| 18 to 34 Years | 0 (0.0%) | 0 (0.0%) |
| 35 to 64 Years | 0 (0.0%) | 0 (0.0%) |
| 65 to 74 Years | 0 (0.0%) | 0 (0.0%) |
| 75 Years and over | 0 (0.0%) | 2 (25.0%) |
Disability Class: Cognitive Difficulty
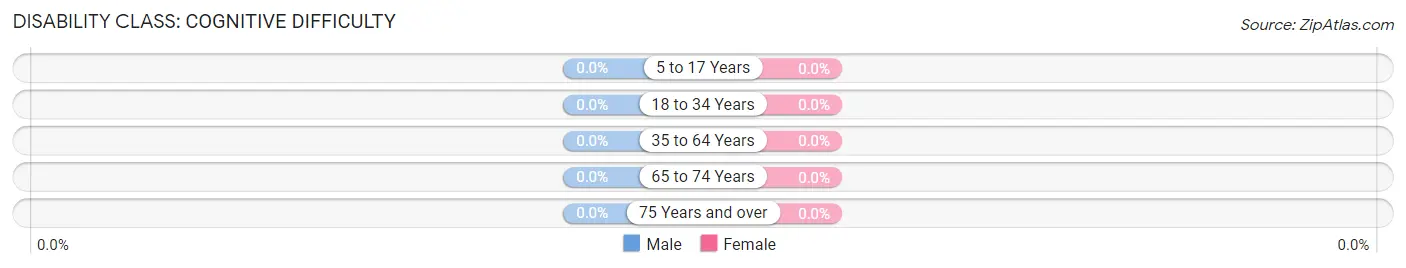
| Age Bracket | Male | Female |
| 5 to 17 Years | 0 (0.0%) | 0 (0.0%) |
| 18 to 34 Years | 0 (0.0%) | 0 (0.0%) |
| 35 to 64 Years | 0 (0.0%) | 0 (0.0%) |
| 65 to 74 Years | 0 (0.0%) | 0 (0.0%) |
| 75 Years and over | 0 (0.0%) | 0 (0.0%) |
Disability Class: Ambulatory Difficulty
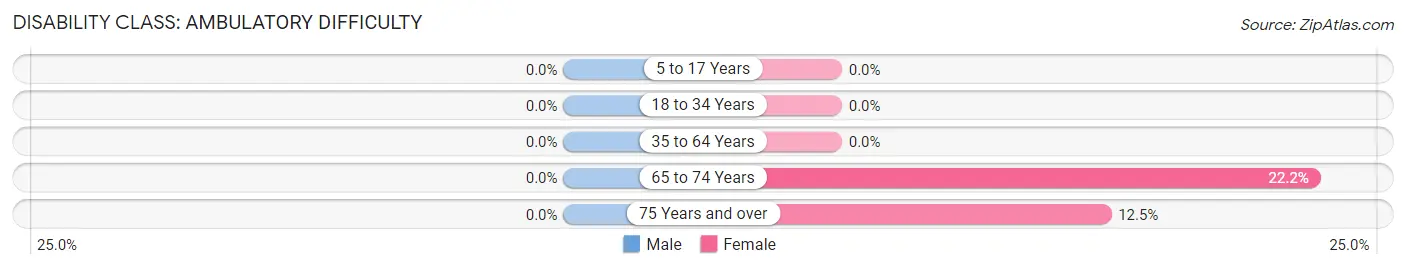
| Age Bracket | Male | Female |
| 5 to 17 Years | 0 (0.0%) | 0 (0.0%) |
| 18 to 34 Years | 0 (0.0%) | 0 (0.0%) |
| 35 to 64 Years | 0 (0.0%) | 0 (0.0%) |
| 65 to 74 Years | 0 (0.0%) | 2 (22.2%) |
| 75 Years and over | 0 (0.0%) | 1 (12.5%) |
Disability Class: Self-Care Difficulty
| Age Bracket | Male | Female |
| 5 to 17 Years | 0 (0.0%) | 0 (0.0%) |
| 18 to 34 Years | 0 (0.0%) | 0 (0.0%) |
| 35 to 64 Years | 0 (0.0%) | 0 (0.0%) |
| 65 to 74 Years | 0 (0.0%) | 0 (0.0%) |
| 75 Years and over | 0 (0.0%) | 0 (0.0%) |
Technology Access in Fairview
Computing Device Access in Fairview
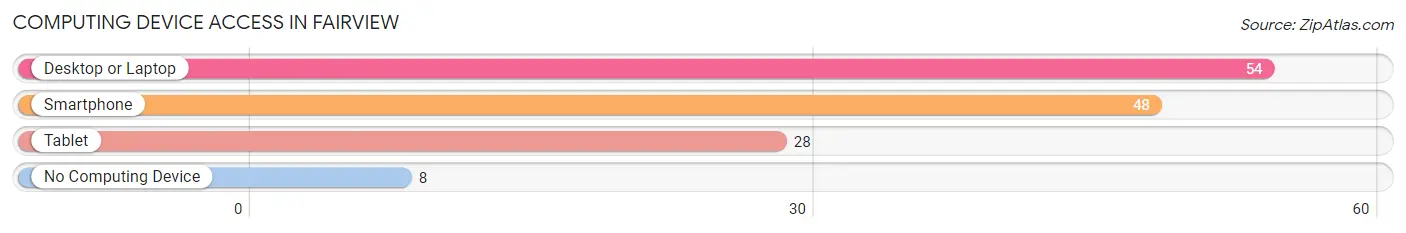
| Device Type | # Households | % Households |
| Desktop or Laptop | 54 | 84.4% |
| Smartphone | 48 | 75.0% |
| Tablet | 28 | 43.8% |
| No Computing Device | 8 | 12.5% |
| Total | 64 | 100.0% |
Internet Access in Fairview
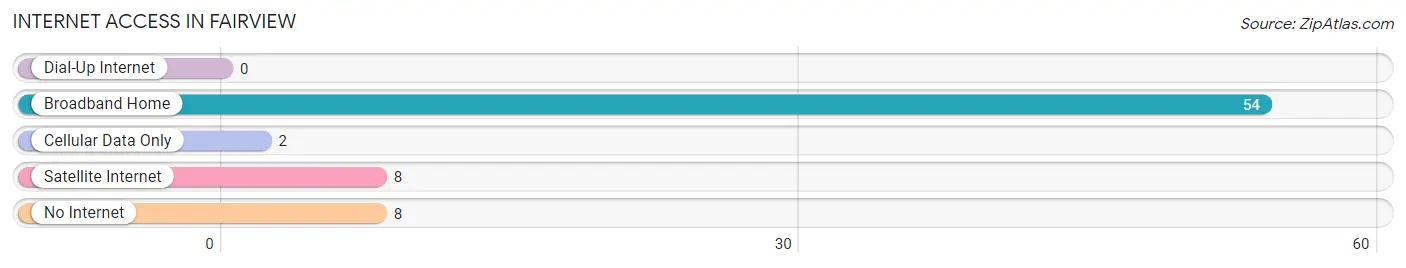
| Internet Type | # Households | % Households |
| Dial-Up Internet | 0 | 0.0% |
| Broadband Home | 54 | 84.4% |
| Cellular Data Only | 2 | 3.1% |
| Satellite Internet | 8 | 12.5% |
| No Internet | 8 | 12.5% |
| Total | 64 | 100.0% |
Fairview Summary
History
The small town of Fairview, Kentucky is located in the western part of the state, in the county of Warren. It is situated on the banks of the Green River, and is part of the Bowling Green metropolitan area. The town was first settled in the early 1800s, and was originally known as “Fairview Station”. The name was changed to Fairview in 1845, and the town was officially incorporated in 1876.
The town was originally a farming community, and the main crops grown were tobacco, corn, and wheat. The town also had a few small businesses, such as a general store, a blacksmith shop, and a grist mill. The town was also home to a few churches, including the Fairview Methodist Church, which was founded in 1845.
In the late 1800s, the town began to grow and develop. The railroad came to town in 1887, and the town was connected to the rest of the state by the Louisville and Nashville Railroad. This allowed the town to become a shipping center for the surrounding area. The town also had a few factories, including a cotton mill and a furniture factory.
In the early 1900s, the town continued to grow and develop. The population increased, and the town had a few more businesses, including a bank, a hotel, and a movie theater. The town also had a few schools, including a high school and a college.
Geography
Fairview is located in the western part of Kentucky, in Warren County. It is situated on the banks of the Green River, and is part of the Bowling Green metropolitan area. The town is located about 25 miles south of Bowling Green, and about 50 miles north of Nashville, Tennessee.
The town is located in a hilly area, and the terrain is mostly flat. The town is surrounded by farmland, and there are several small lakes and streams in the area. The climate in Fairview is humid subtropical, with hot summers and mild winters.
Economy
The economy of Fairview is largely based on agriculture. The town is surrounded by farmland, and the main crops grown are tobacco, corn, and wheat. The town also has a few small businesses, including a general store, a blacksmith shop, and a grist mill.
The town is also home to a few factories, including a cotton mill and a furniture factory. The town also has a few schools, including a high school and a college.
Demographics
As of the 2010 census, the population of Fairview was 1,845. The town has a total area of 1.3 square miles, and the population density is 1,400 people per square mile. The median household income is $37,500, and the median age is 38.
The town is predominantly white, with about 95% of the population being white. The other 5% of the population is made up of African Americans, Hispanics, and Asians. The town also has a small Native American population.
The town is served by the Warren County School District, and the town has a few schools, including a high school and a college. The town also has a few churches, including the Fairview Methodist Church, which was founded in 1845.
Common Questions
What is Per Capita Income in Fairview?
Per Capita income in Fairview is $36,547.
What is the Median Family Income in Fairview?
Median Family Income in Fairview is $72,083.
What is the Median Household income in Fairview?
Median Household Income in Fairview is $70,000.
What is Income or Wage Gap in Fairview?
Income or Wage Gap in Fairview is 54.4%.
Women in Fairview earn 45.6 cents for every dollar earned by a man.
What is Inequality or Gini Index in Fairview?
Inequality or Gini Index in Fairview is 0.42.
What is the Total Population of Fairview?
Total Population of Fairview is 148.
What is the Total Male Population of Fairview?
Total Male Population of Fairview is 87.
What is the Total Female Population of Fairview?
Total Female Population of Fairview is 61.
What is the Ratio of Males per 100 Females in Fairview?
There are 142.62 Males per 100 Females in Fairview.
What is the Ratio of Females per 100 Males in Fairview?
There are 70.11 Females per 100 Males in Fairview.
What is the Median Population Age in Fairview?
Median Population Age in Fairview is 51.4 Years.
What is the Average Family Size in Fairview
Average Family Size in Fairview is 2.7 People.
What is the Average Household Size in Fairview
Average Household Size in Fairview is 2.3 People.
How Large is the Labor Force in Fairview?
There are 81 People in the Labor Forcein in Fairview.
What is the Percentage of People in the Labor Force in Fairview?
62.3% of People are in the Labor Force in Fairview.