Zip Codes with the Highest Percentage of Population Employed in Food Preparation & Serving in Newport, KY
RELATED REPORTS & OPTIONS
Food Preparation & Serving
Newport
Compare Zip Codes
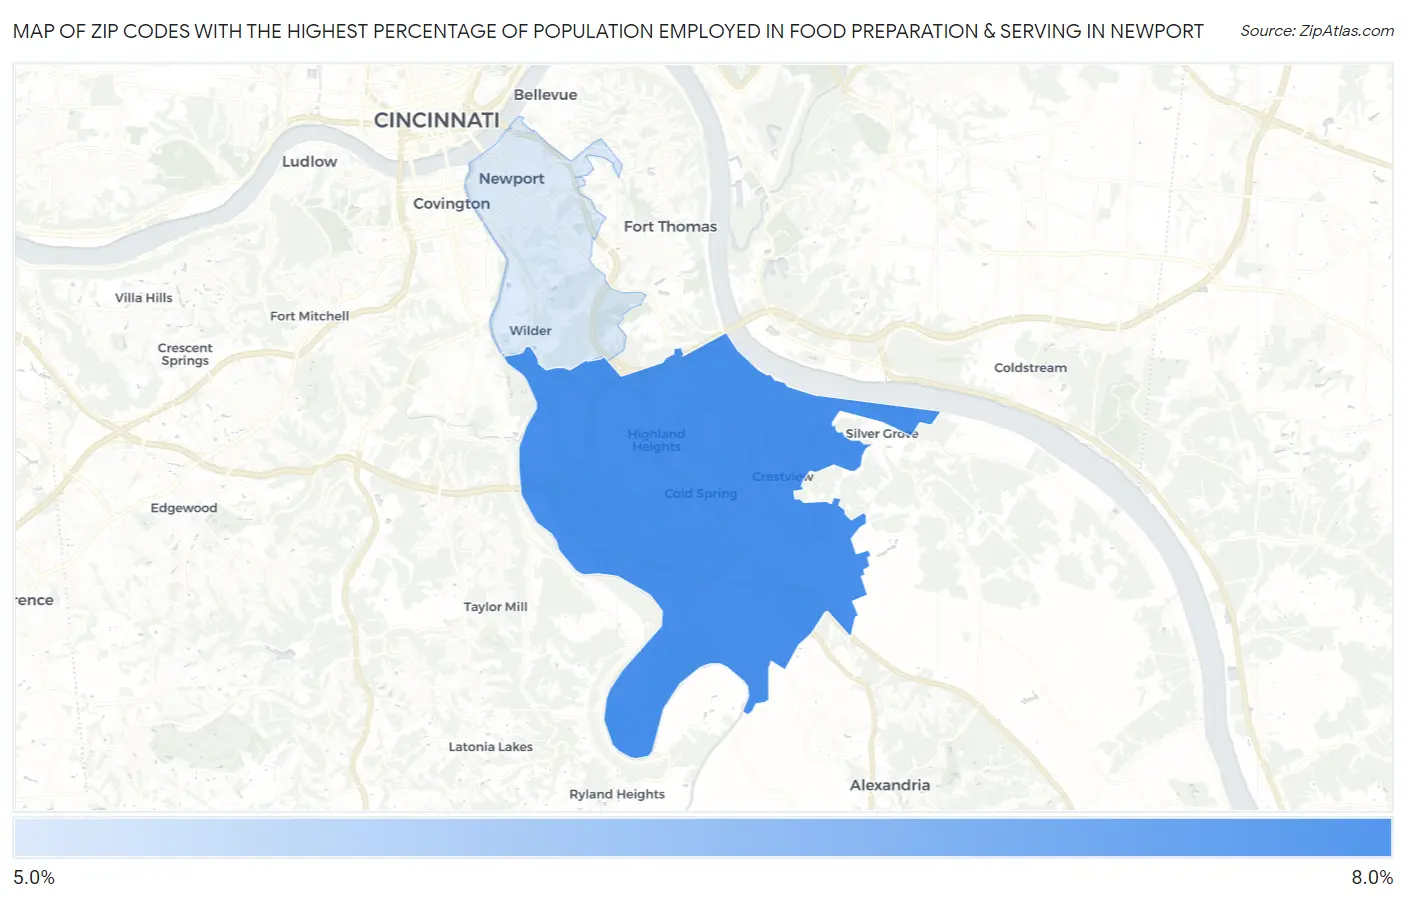
Map of Zip Codes with the Highest Percentage of Population Employed in Food Preparation & Serving in Newport
5.1%
6.2%
Zip Codes with the Highest Percentage of Population Employed in Food Preparation & Serving in Newport, KY
| Zip Code | % Employed | vs State | vs National | |
| 1. | 41076 | 6.2% | 5.1%(+1.09)#185 | 5.3%(+0.890)#8,805 |
| 2. | 41071 | 5.1% | 5.1%(+0.033)#242 | 5.3%(-0.168)#12,473 |
1
Common Questions
What are the Top Zip Codes with the Highest Percentage of Population Employed in Food Preparation & Serving in Newport, KY?
Top Zip Codes with the Highest Percentage of Population Employed in Food Preparation & Serving in Newport, KY are:
What zip code has the Highest Percentage of Population Employed in Food Preparation & Serving in Newport, KY?
41076 has the Highest Percentage of Population Employed in Food Preparation & Serving in Newport, KY with 6.2%.
What is the Percentage of Population Employed in Food Preparation & Serving in Newport, KY?
Percentage of Population Employed in Food Preparation & Serving in Newport is 4.6%.
What is the Percentage of Population Employed in Food Preparation & Serving in Kentucky?
Percentage of Population Employed in Food Preparation & Serving in Kentucky is 5.1%.
What is the Percentage of Population Employed in Food Preparation & Serving in the United States?
Percentage of Population Employed in Food Preparation & Serving in the United States is 5.3%.