Munfordville, KY Map & Demographics
Munfordville Map
Munfordville Overview
$22,628
PER CAPITA INCOME
$50,357
AVG FAMILY INCOME
$26,953
AVG HOUSEHOLD INCOME
48.3%
WAGE / INCOME GAP [ % ]
51.7¢/ $1
WAGE / INCOME GAP [ $ ]
0.57
INEQUALITY / GINI INDEX
1,746
TOTAL POPULATION
961
MALE POPULATION
785
FEMALE POPULATION
122.42
MALES / 100 FEMALES
81.69
FEMALES / 100 MALES
41.1
MEDIAN AGE
2.8
AVG FAMILY SIZE
2.2
AVG HOUSEHOLD SIZE
708
LABOR FORCE [ PEOPLE ]
48.9%
PERCENT IN LABOR FORCE
4.5%
UNEMPLOYMENT RATE
Munfordville Zip Codes
Munfordville Area Codes
Income in Munfordville
Income Overview in Munfordville
Per Capita Income in Munfordville is $22,628, while median incomes of families and households are $50,357 and $26,953 respectively.
| Characteristic | Number | Measure |
| Per Capita Income | 1,746 | $22,628 |
| Median Family Income | 378 | $50,357 |
| Mean Family Income | 378 | $77,423 |
| Median Household Income | 728 | $26,953 |
| Mean Household Income | 728 | $52,886 |
| Income Deficit | 378 | $0 |
| Wage / Income Gap (%) | 1,746 | 48.32% |
| Wage / Income Gap ($) | 1,746 | 51.68¢ per $1 |
| Gini / Inequality Index | 1,746 | 0.57 |
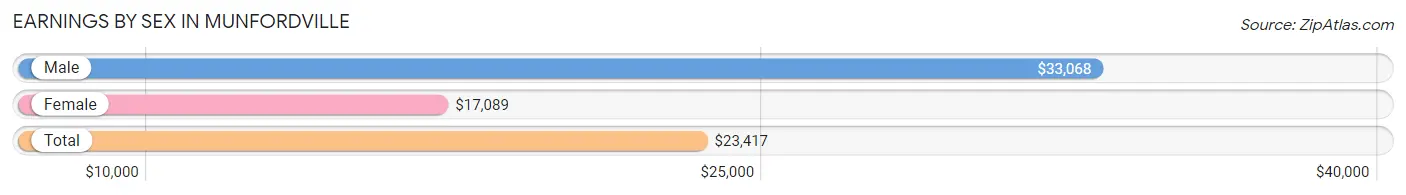
Earnings by Sex in Munfordville
Average Earnings in Munfordville are $23,417, $33,068 for men and $17,089 for women, a difference of 48.3%.
| Sex | Number | Average Earnings |
| Male | 400 (52.7%) | $33,068 |
| Female | 359 (47.3%) | $17,089 |
| Total | 759 (100.0%) | $23,417 |
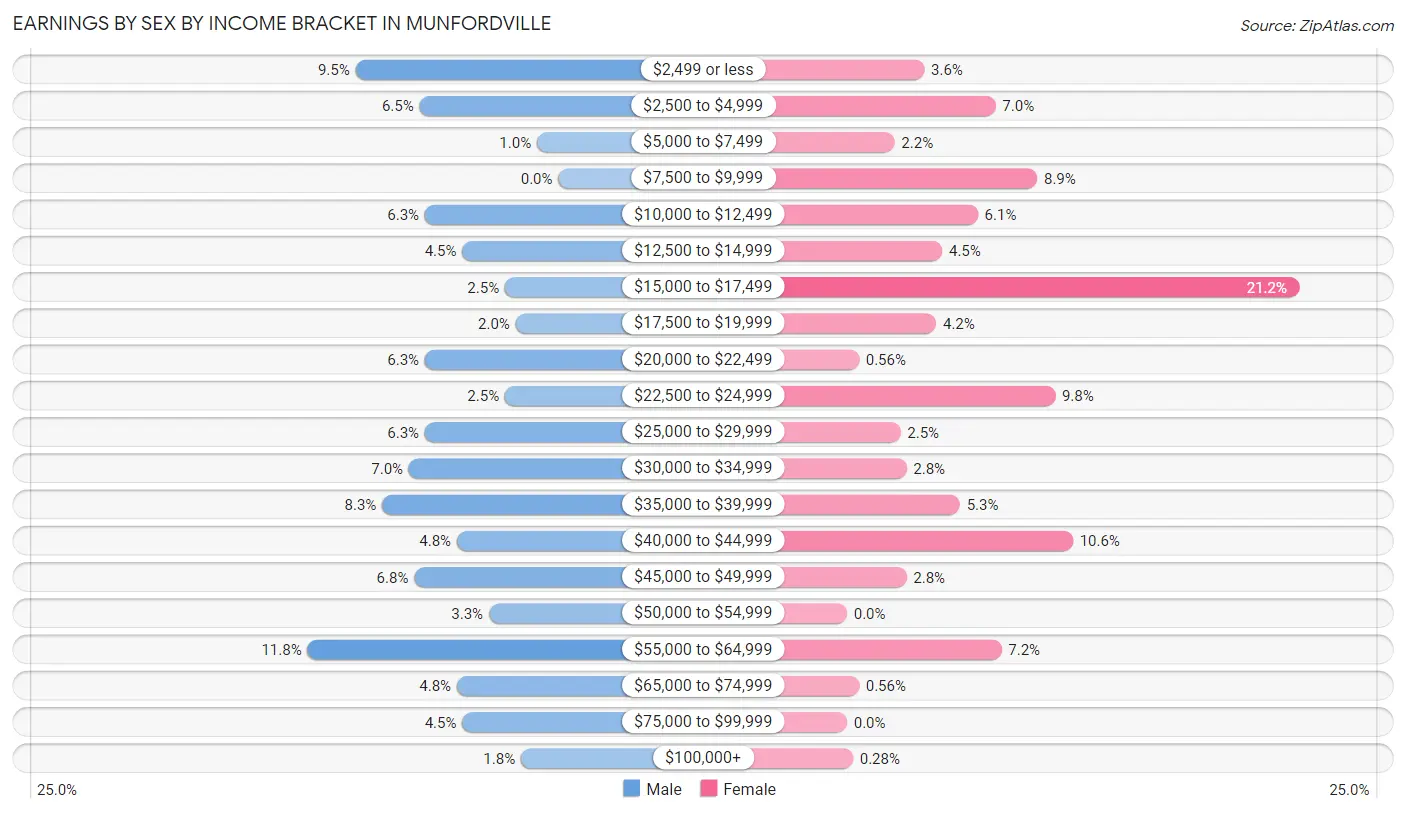
Earnings by Sex by Income Bracket in Munfordville
The most common earnings brackets in Munfordville are $55,000 to $64,999 for men (47 | 11.7%) and $15,000 to $17,499 for women (76 | 21.2%).
| Income | Male | Female |
| $2,499 or less | 38 (9.5%) | 13 (3.6%) |
| $2,500 to $4,999 | 26 (6.5%) | 25 (7.0%) |
| $5,000 to $7,499 | 4 (1.0%) | 8 (2.2%) |
| $7,500 to $9,999 | 0 (0.0%) | 32 (8.9%) |
| $10,000 to $12,499 | 25 (6.2%) | 22 (6.1%) |
| $12,500 to $14,999 | 18 (4.5%) | 16 (4.5%) |
| $15,000 to $17,499 | 10 (2.5%) | 76 (21.2%) |
| $17,500 to $19,999 | 8 (2.0%) | 15 (4.2%) |
| $20,000 to $22,499 | 25 (6.2%) | 2 (0.6%) |
| $22,500 to $24,999 | 10 (2.5%) | 35 (9.8%) |
| $25,000 to $29,999 | 25 (6.2%) | 9 (2.5%) |
| $30,000 to $34,999 | 28 (7.0%) | 10 (2.8%) |
| $35,000 to $39,999 | 33 (8.3%) | 19 (5.3%) |
| $40,000 to $44,999 | 19 (4.8%) | 38 (10.6%) |
| $45,000 to $49,999 | 27 (6.8%) | 10 (2.8%) |
| $50,000 to $54,999 | 13 (3.3%) | 0 (0.0%) |
| $55,000 to $64,999 | 47 (11.7%) | 26 (7.2%) |
| $65,000 to $74,999 | 19 (4.8%) | 2 (0.6%) |
| $75,000 to $99,999 | 18 (4.5%) | 0 (0.0%) |
| $100,000+ | 7 (1.8%) | 1 (0.3%) |
| Total | 400 (100.0%) | 359 (100.0%) |
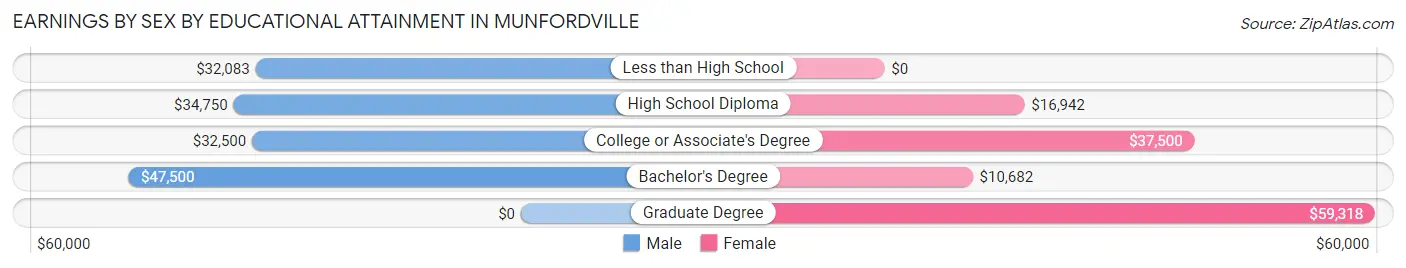
Earnings by Sex by Educational Attainment in Munfordville
Average earnings in Munfordville are $36,750 for men and $18,083 for women, a difference of 50.8%. Men with an educational attainment of bachelor's degree enjoy the highest average annual earnings of $47,500, while those with less than high school education earn the least with $32,083. Women with an educational attainment of graduate degree earn the most with the average annual earnings of $59,318, while those with bachelor's degree education have the smallest earnings of $10,682.
| Educational Attainment | Male Income | Female Income |
| Less than High School | $32,083 | $0 |
| High School Diploma | $34,750 | $16,942 |
| College or Associate's Degree | $32,500 | $37,500 |
| Bachelor's Degree | $47,500 | $10,682 |
| Graduate Degree | - | - |
| Total | $36,750 | $18,083 |
Family Income in Munfordville
Family Income Brackets in Munfordville
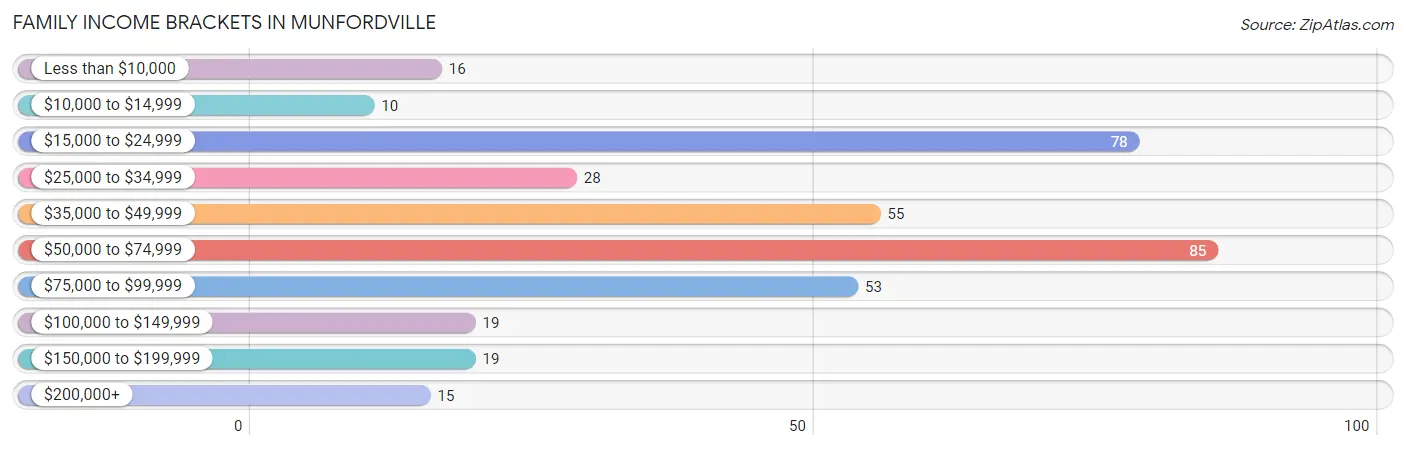
According to the Munfordville family income data, there are 85 families falling into the $50,000 to $74,999 income range, which is the most common income bracket and makes up 22.5% of all families. Conversely, the $10,000 to $14,999 income bracket is the least frequent group with only 10 families (2.6%) belonging to this category.
| Income Bracket | # Families | % Families |
| Less than $10,000 | 16 | 4.2% |
| $10,000 to $14,999 | 10 | 2.6% |
| $15,000 to $24,999 | 78 | 20.6% |
| $25,000 to $34,999 | 28 | 7.4% |
| $35,000 to $49,999 | 55 | 14.6% |
| $50,000 to $74,999 | 85 | 22.5% |
| $75,000 to $99,999 | 53 | 14.0% |
| $100,000 to $149,999 | 19 | 5.0% |
| $150,000 to $199,999 | 19 | 5.0% |
| $200,000+ | 15 | 4.0% |
Family Income by Famaliy Size in Munfordville
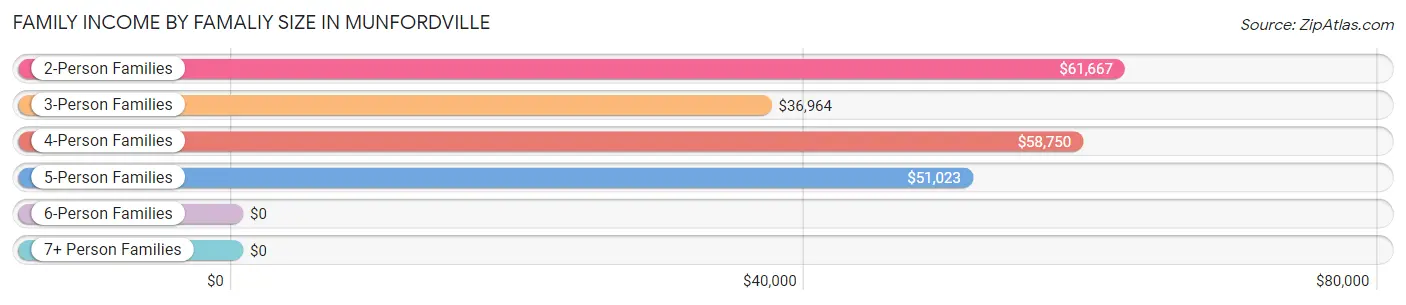
2-person families (156 | 41.3%) account for the highest median family income in Munfordville with $61,667 per family, while 2-person families (156 | 41.3%) have the highest median income of $30,834 per family member.
| Income Bracket | # Families | Median Income |
| 2-Person Families | 156 (41.3%) | $61,667 |
| 3-Person Families | 158 (41.8%) | $36,964 |
| 4-Person Families | 35 (9.3%) | $58,750 |
| 5-Person Families | 29 (7.7%) | $51,023 |
| 6-Person Families | 0 (0.0%) | $0 |
| 7+ Person Families | 0 (0.0%) | $0 |
| Total | 378 (100.0%) | $50,357 |
Family Income by Number of Earners in Munfordville
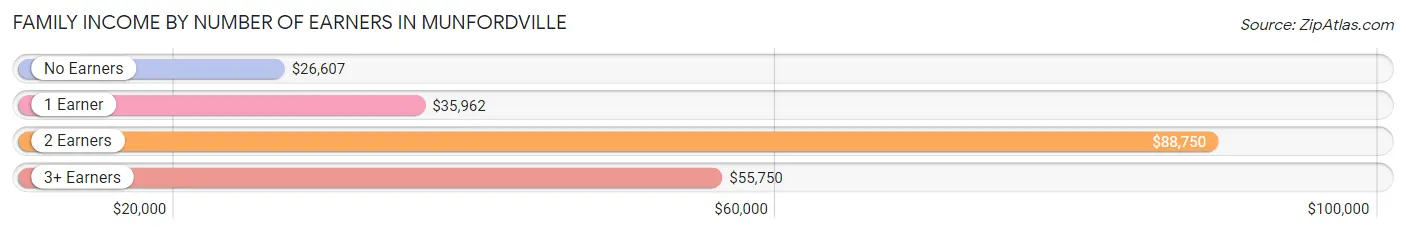
The median family income in Munfordville is $50,357, with families comprising 2 earners (129) having the highest median family income of $88,750, while families with no earners (33) have the lowest median family income of $26,607, accounting for 34.1% and 8.7% of families, respectively.
| Number of Earners | # Families | Median Income |
| No Earners | 33 (8.7%) | $26,607 |
| 1 Earner | 188 (49.7%) | $35,962 |
| 2 Earners | 129 (34.1%) | $88,750 |
| 3+ Earners | 28 (7.4%) | $55,750 |
| Total | 378 (100.0%) | $50,357 |
Household Income in Munfordville
Household Income Brackets in Munfordville
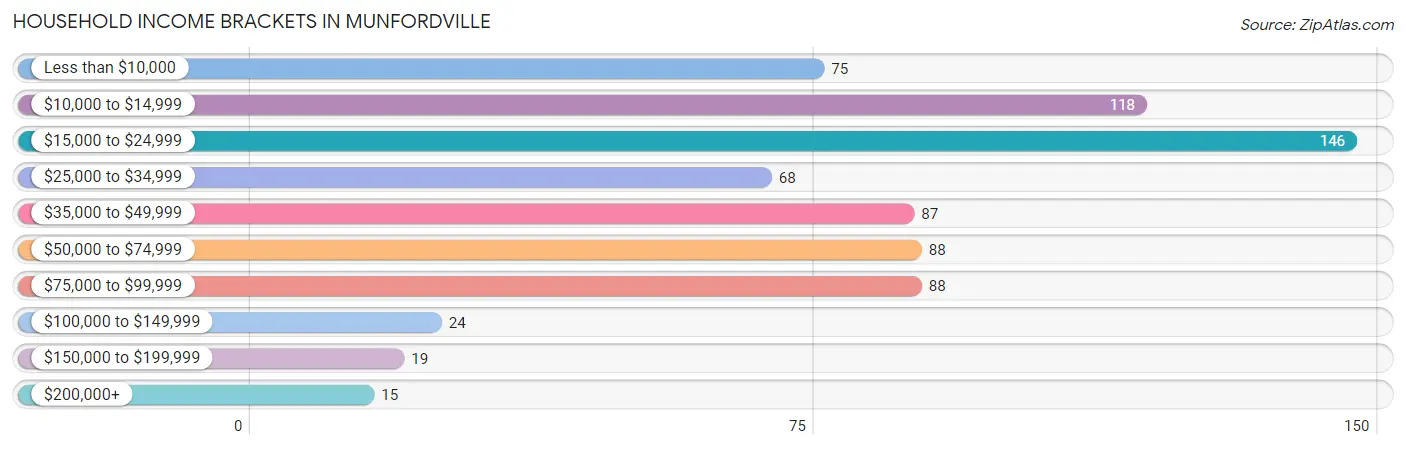
With 146 households falling in the category, the $15,000 to $24,999 income range is the most frequent in Munfordville, accounting for 20.1% of all households. In contrast, only 15 households (2.1%) fall into the $200,000+ income bracket, making it the least populous group.
| Income Bracket | # Households | % Households |
| Less than $10,000 | 75 | 10.3% |
| $10,000 to $14,999 | 118 | 16.2% |
| $15,000 to $24,999 | 146 | 20.1% |
| $25,000 to $34,999 | 68 | 9.3% |
| $35,000 to $49,999 | 87 | 12.0% |
| $50,000 to $74,999 | 88 | 12.1% |
| $75,000 to $99,999 | 88 | 12.1% |
| $100,000 to $149,999 | 24 | 3.3% |
| $150,000 to $199,999 | 19 | 2.6% |
| $200,000+ | 15 | 2.1% |
Household Income by Householder Age in Munfordville
The median household income in Munfordville is $26,953, with the highest median household income of $45,063 found in the 45 to 64 years age bracket for the primary householder. A total of 315 households (43.3%) fall into this category. Meanwhile, the 25 to 44 years age bracket for the primary householder has the lowest median household income of $0, with 147 households (20.2%) in this group.
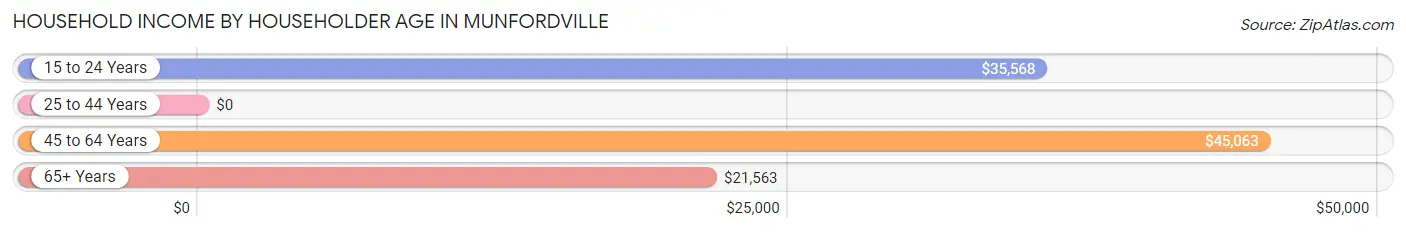
| Income Bracket | # Households | Median Income |
| 15 to 24 Years | 31 (4.3%) | $35,568 |
| 25 to 44 Years | 147 (20.2%) | $0 |
| 45 to 64 Years | 315 (43.3%) | $45,063 |
| 65+ Years | 235 (32.3%) | $21,563 |
| Total | 728 (100.0%) | $26,953 |
Poverty in Munfordville
Income Below Poverty by Sex and Age in Munfordville
With 40.7% poverty level for males and 31.5% for females among the residents of Munfordville, 6 to 11 year old males and 25 to 34 year old females are the most vulnerable to poverty, with 87 males (87.0%) and 59 females (51.7%) in their respective age groups living below the poverty level.
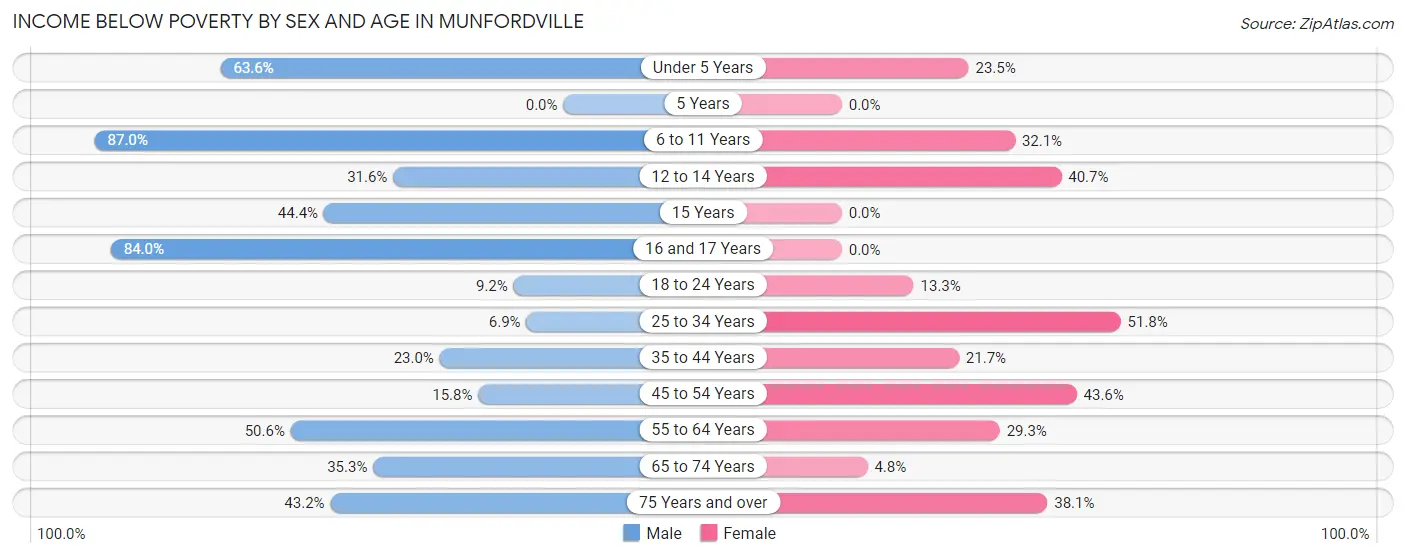
| Age Bracket | Male | Female |
| Under 5 Years | 28 (63.6%) | 12 (23.5%) |
| 5 Years | 0 (0.0%) | 0 (0.0%) |
| 6 to 11 Years | 87 (87.0%) | 9 (32.1%) |
| 12 to 14 Years | 12 (31.6%) | 11 (40.7%) |
| 15 Years | 4 (44.4%) | 0 (0.0%) |
| 16 and 17 Years | 21 (84.0%) | 0 (0.0%) |
| 18 to 24 Years | 6 (9.2%) | 10 (13.3%) |
| 25 to 34 Years | 5 (6.9%) | 59 (51.7%) |
| 35 to 44 Years | 14 (23.0%) | 15 (21.7%) |
| 45 to 54 Years | 12 (15.8%) | 51 (43.6%) |
| 55 to 64 Years | 85 (50.6%) | 34 (29.3%) |
| 65 to 74 Years | 42 (35.3%) | 3 (4.8%) |
| 75 Years and over | 16 (43.2%) | 37 (38.1%) |
| Total | 332 (40.7%) | 241 (31.5%) |
Income Above Poverty by Sex and Age in Munfordville
According to the poverty statistics in Munfordville, males aged 25 to 34 years and females aged 15 years are the age groups that are most secure financially, with 93.1% of males and 100.0% of females in these age groups living above the poverty line.
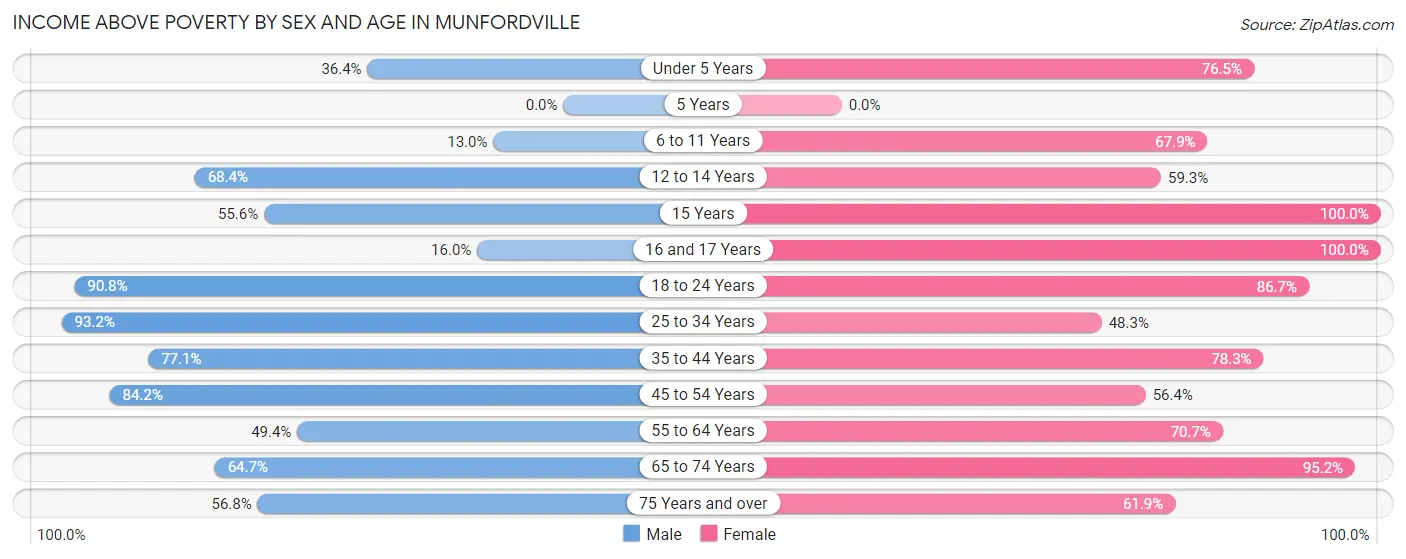
| Age Bracket | Male | Female |
| Under 5 Years | 16 (36.4%) | 39 (76.5%) |
| 5 Years | 0 (0.0%) | 0 (0.0%) |
| 6 to 11 Years | 13 (13.0%) | 19 (67.9%) |
| 12 to 14 Years | 26 (68.4%) | 16 (59.3%) |
| 15 Years | 5 (55.6%) | 2 (100.0%) |
| 16 and 17 Years | 4 (16.0%) | 6 (100.0%) |
| 18 to 24 Years | 59 (90.8%) | 65 (86.7%) |
| 25 to 34 Years | 68 (93.1%) | 55 (48.2%) |
| 35 to 44 Years | 47 (77.0%) | 54 (78.3%) |
| 45 to 54 Years | 64 (84.2%) | 66 (56.4%) |
| 55 to 64 Years | 83 (49.4%) | 82 (70.7%) |
| 65 to 74 Years | 77 (64.7%) | 60 (95.2%) |
| 75 Years and over | 21 (56.8%) | 60 (61.9%) |
| Total | 483 (59.3%) | 524 (68.5%) |
Income Below Poverty Among Married-Couple Families in Munfordville
The poverty statistics for married-couple families in Munfordville show that 3.5% or 6 of the total 174 families live below the poverty line. Families with 1 or 2 children have the highest poverty rate of 6.8%, comprising of 5 families. On the other hand, families with no children have the lowest poverty rate of 1.0%, which includes 1 families.
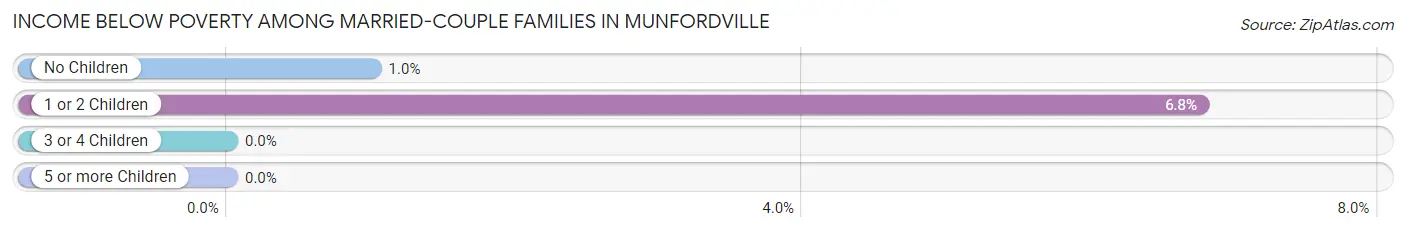
| Children | Above Poverty | Below Poverty |
| No Children | 99 (99.0%) | 1 (1.0%) |
| 1 or 2 Children | 69 (93.2%) | 5 (6.8%) |
| 3 or 4 Children | 0 (0.0%) | 0 (0.0%) |
| 5 or more Children | 0 (0.0%) | 0 (0.0%) |
| Total | 168 (96.6%) | 6 (3.5%) |
Income Below Poverty Among Single-Parent Households in Munfordville
According to the poverty data in Munfordville, 9.6% or 5 single-father households and 59.2% or 90 single-mother households are living below the poverty line. Among single-father households, those with 1 or 2 children have the highest poverty rate, with 5 households (27.8%) experiencing poverty. Likewise, among single-mother households, those with 1 or 2 children have the highest poverty rate, with 76 households (80.8%) falling below the poverty line.
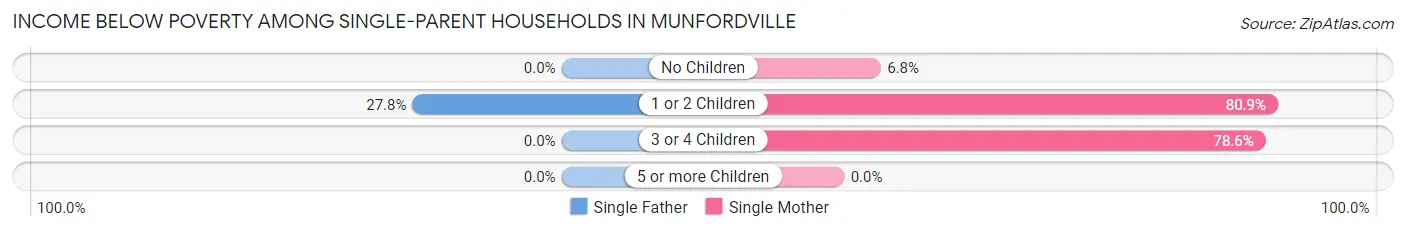
| Children | Single Father | Single Mother |
| No Children | 0 (0.0%) | 3 (6.8%) |
| 1 or 2 Children | 5 (27.8%) | 76 (80.8%) |
| 3 or 4 Children | 0 (0.0%) | 11 (78.6%) |
| 5 or more Children | 0 (0.0%) | 0 (0.0%) |
| Total | 5 (9.6%) | 90 (59.2%) |
Income Below Poverty Among Married-Couple vs Single-Parent Households in Munfordville
The poverty data for Munfordville shows that 6 of the married-couple family households (3.5%) and 95 of the single-parent households (46.6%) are living below the poverty level. Within the married-couple family households, those with 1 or 2 children have the highest poverty rate, with 5 households (6.8%) falling below the poverty line. Among the single-parent households, those with 3 or 4 children have the highest poverty rate, with 11 household (78.6%) living below poverty.
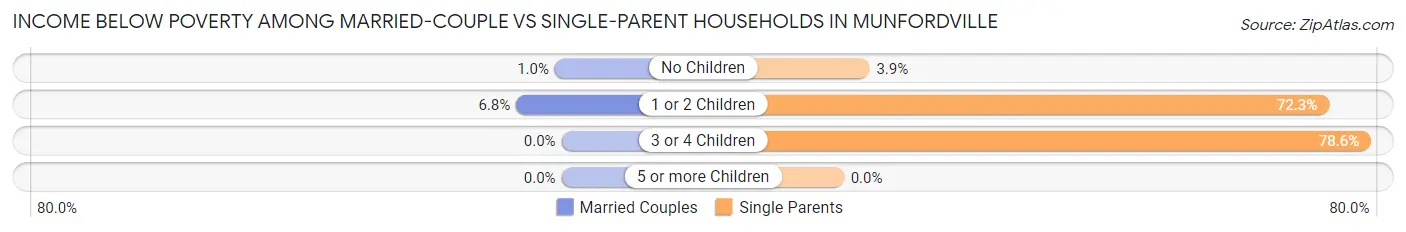
| Children | Married-Couple Families | Single-Parent Households |
| No Children | 1 (1.0%) | 3 (3.8%) |
| 1 or 2 Children | 5 (6.8%) | 81 (72.3%) |
| 3 or 4 Children | 0 (0.0%) | 11 (78.6%) |
| 5 or more Children | 0 (0.0%) | 0 (0.0%) |
| Total | 6 (3.5%) | 95 (46.6%) |
Race in Munfordville
The most populous races in Munfordville are White / Caucasian (1,477 | 84.6%), Black / African American (149 | 8.5%), and Two or more Races (67 | 3.8%).
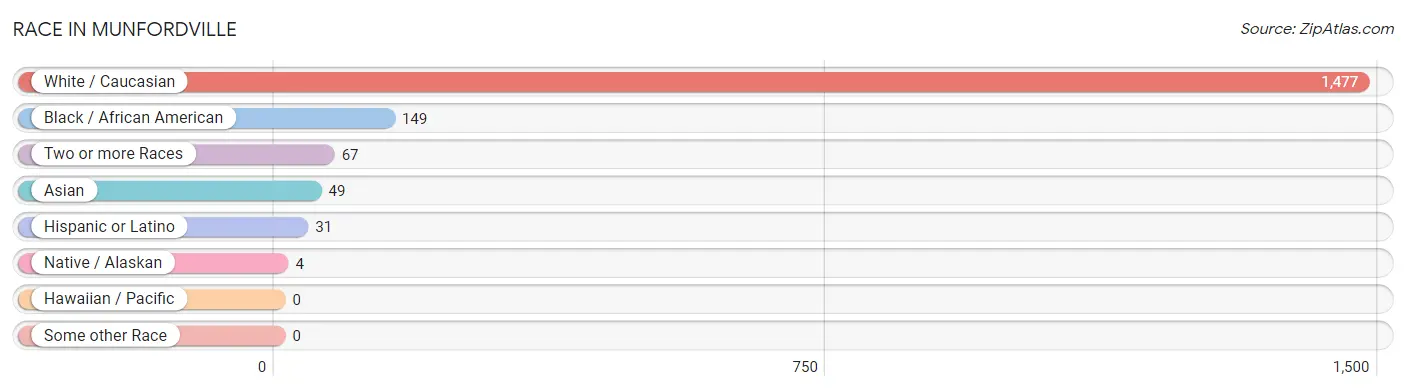
| Race | # Population | % Population |
| Asian | 49 | 2.8% |
| Black / African American | 149 | 8.5% |
| Hawaiian / Pacific | 0 | 0.0% |
| Hispanic or Latino | 31 | 1.8% |
| Native / Alaskan | 4 | 0.2% |
| White / Caucasian | 1,477 | 84.6% |
| Two or more Races | 67 | 3.8% |
| Some other Race | 0 | 0.0% |
| Total | 1,746 | 100.0% |
Ancestry in Munfordville
The most populous ancestries reported in Munfordville are German (281 | 16.1%), Irish (272 | 15.6%), American (207 | 11.9%), English (102 | 5.8%), and Scottish (60 | 3.4%), together accounting for 52.8% of all Munfordville residents.
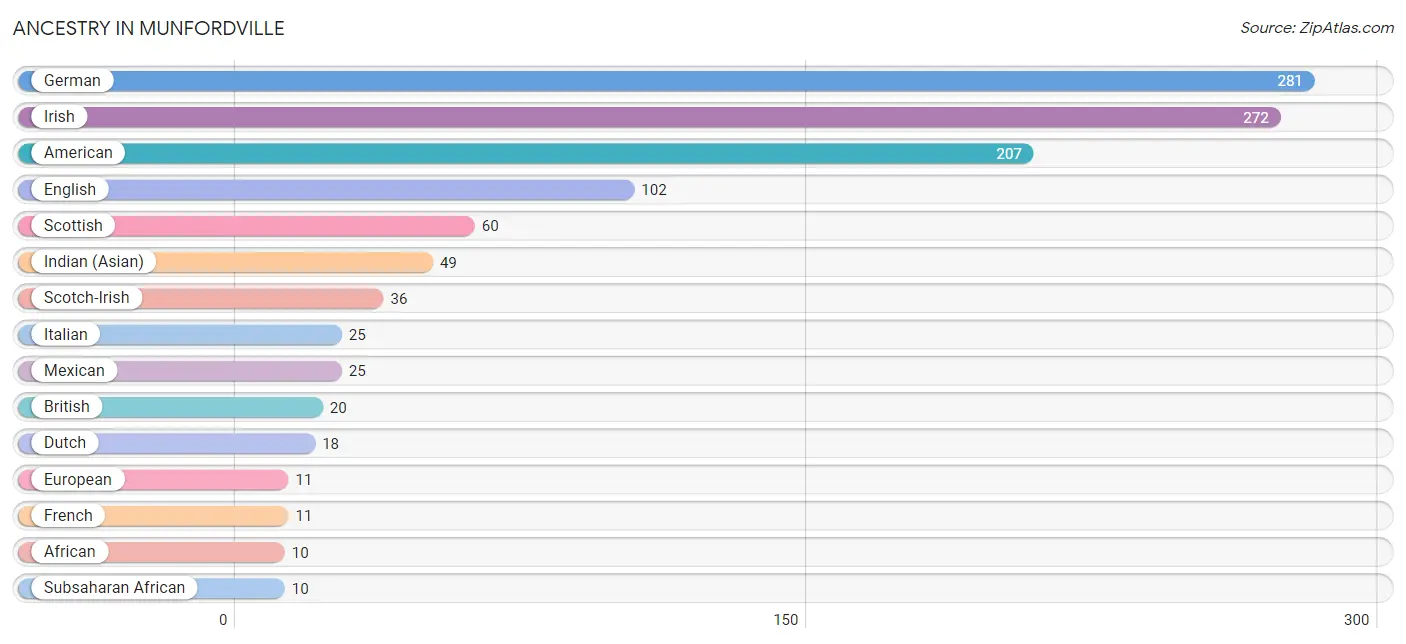
| Ancestry | # Population | % Population |
| African | 10 | 0.6% |
| American | 207 | 11.9% |
| Blackfeet | 1 | 0.1% |
| British | 20 | 1.1% |
| Cherokee | 7 | 0.4% |
| Dutch | 18 | 1.0% |
| English | 102 | 5.8% |
| European | 11 | 0.6% |
| Finnish | 9 | 0.5% |
| French | 11 | 0.6% |
| German | 281 | 16.1% |
| Hungarian | 3 | 0.2% |
| Indian (Asian) | 49 | 2.8% |
| Irish | 272 | 15.6% |
| Italian | 25 | 1.4% |
| Mexican | 25 | 1.4% |
| Polish | 9 | 0.5% |
| Puerto Rican | 6 | 0.3% |
| Scotch-Irish | 36 | 2.1% |
| Scottish | 60 | 3.4% |
| Subsaharan African | 10 | 0.6% | View All 21 Rows |
Immigrants in Munfordville
The most numerous immigrant groups reported in Munfordville came from Asia (41 | 2.4%), China (41 | 2.4%), and Eastern Asia (41 | 2.4%), together accounting for 7.1% of all Munfordville residents.
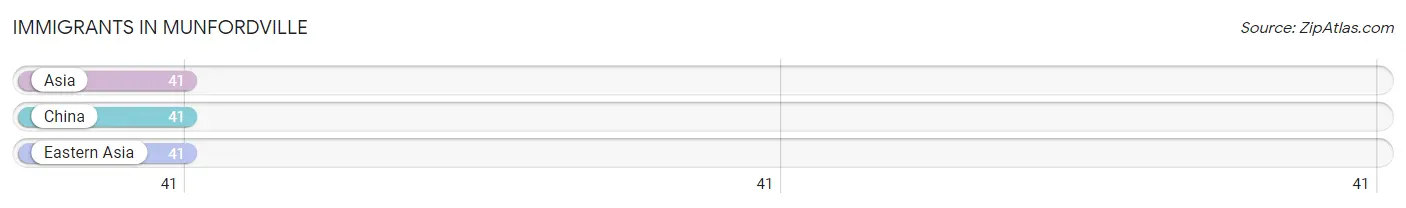
| Immigration Origin | # Population | % Population |
| Asia | 41 | 2.4% |
| China | 41 | 2.4% |
| Eastern Asia | 41 | 2.4% | View All 3 Rows |
Sex and Age in Munfordville
Sex and Age in Munfordville
The most populous age groups in Munfordville are 10 to 14 Years (125 | 13.0%) for men and 30 to 34 Years (82 | 10.4%) for women.
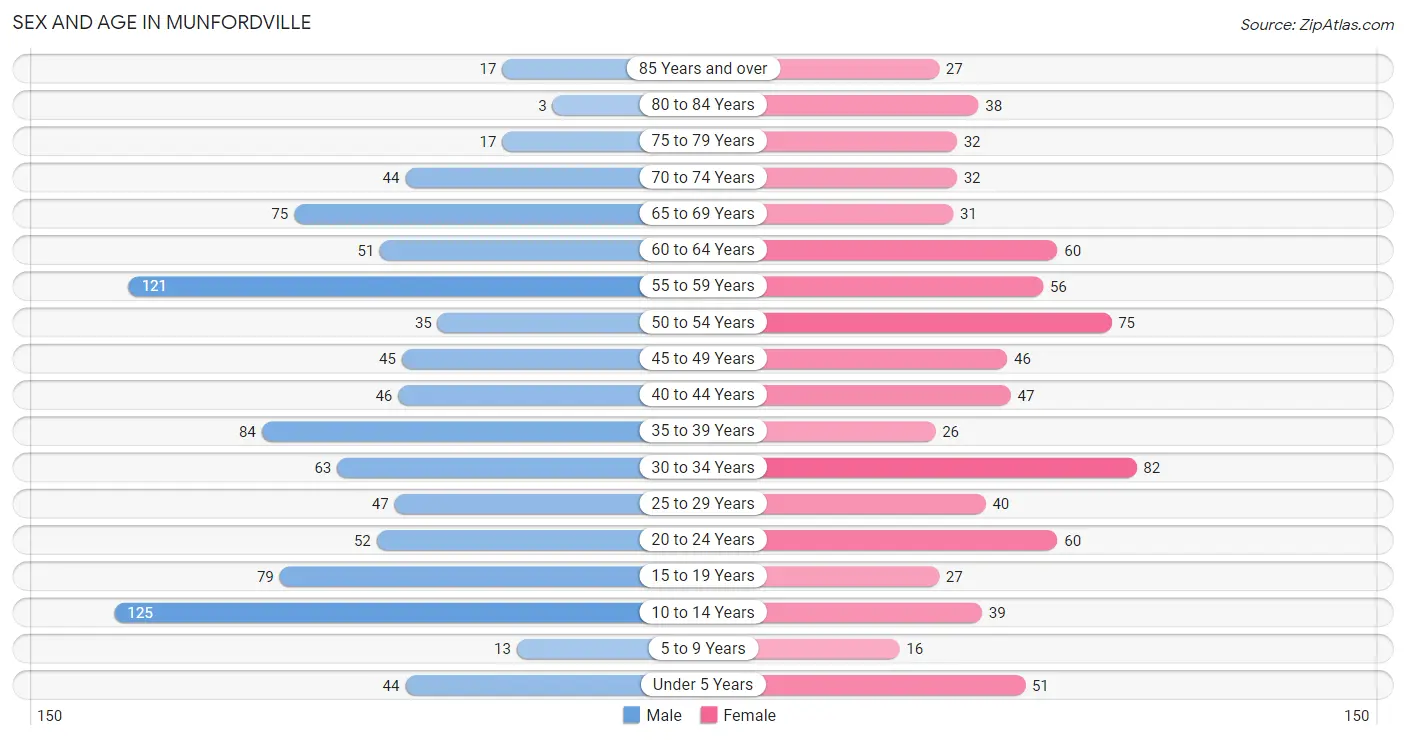
| Age Bracket | Male | Female |
| Under 5 Years | 44 (4.6%) | 51 (6.5%) |
| 5 to 9 Years | 13 (1.3%) | 16 (2.0%) |
| 10 to 14 Years | 125 (13.0%) | 39 (5.0%) |
| 15 to 19 Years | 79 (8.2%) | 27 (3.4%) |
| 20 to 24 Years | 52 (5.4%) | 60 (7.6%) |
| 25 to 29 Years | 47 (4.9%) | 40 (5.1%) |
| 30 to 34 Years | 63 (6.6%) | 82 (10.4%) |
| 35 to 39 Years | 84 (8.7%) | 26 (3.3%) |
| 40 to 44 Years | 46 (4.8%) | 47 (6.0%) |
| 45 to 49 Years | 45 (4.7%) | 46 (5.9%) |
| 50 to 54 Years | 35 (3.6%) | 75 (9.6%) |
| 55 to 59 Years | 121 (12.6%) | 56 (7.1%) |
| 60 to 64 Years | 51 (5.3%) | 60 (7.6%) |
| 65 to 69 Years | 75 (7.8%) | 31 (4.0%) |
| 70 to 74 Years | 44 (4.6%) | 32 (4.1%) |
| 75 to 79 Years | 17 (1.8%) | 32 (4.1%) |
| 80 to 84 Years | 3 (0.3%) | 38 (4.8%) |
| 85 Years and over | 17 (1.8%) | 27 (3.4%) |
| Total | 961 (100.0%) | 785 (100.0%) |
Families and Households in Munfordville
Median Family Size in Munfordville
The median family size in Munfordville is 2.84 persons per family, with single male/father families (52 | 13.8%) accounting for the largest median family size of 3.29 persons per family. On the other hand, married-couple families (174 | 46.0%) represent the smallest median family size with 2.74 persons per family.
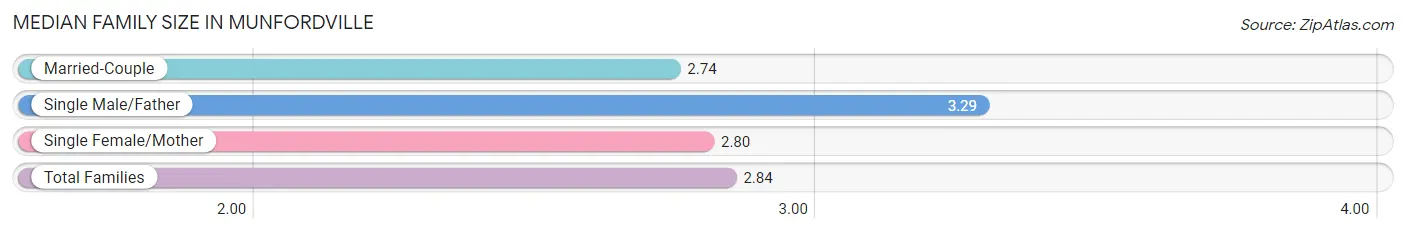
| Family Type | # Families | Family Size |
| Married-Couple | 174 (46.0%) | 2.74 |
| Single Male/Father | 52 (13.8%) | 3.29 |
| Single Female/Mother | 152 (40.2%) | 2.80 |
| Total Families | 378 (100.0%) | 2.84 |
Median Household Size in Munfordville
The median household size in Munfordville is 2.17 persons per household, with single male/father households (52 | 7.1%) accounting for the largest median household size of 3.6 persons per household. non-family households (350 | 48.1%) represent the smallest median household size with 1.26 persons per household.
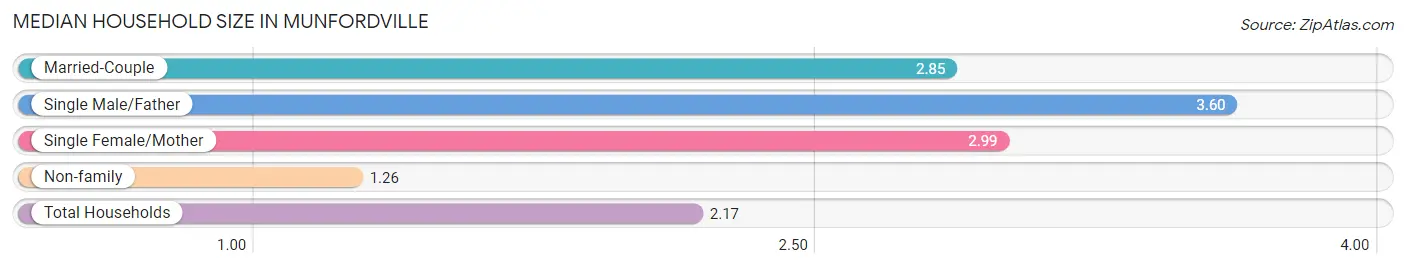
| Household Type | # Households | Household Size |
| Married-Couple | 174 (23.9%) | 2.85 |
| Single Male/Father | 52 (7.1%) | 3.60 |
| Single Female/Mother | 152 (20.9%) | 2.99 |
| Non-family | 350 (48.1%) | 1.26 |
| Total Households | 728 (100.0%) | 2.17 |
Household Size by Marriage Status in Munfordville
Out of a total of 728 households in Munfordville, 378 (51.9%) are family households, while 350 (48.1%) are nonfamily households. The most numerous type of family households are 2-person households, comprising 138, and the most common type of nonfamily households are 1-person households, comprising 297.
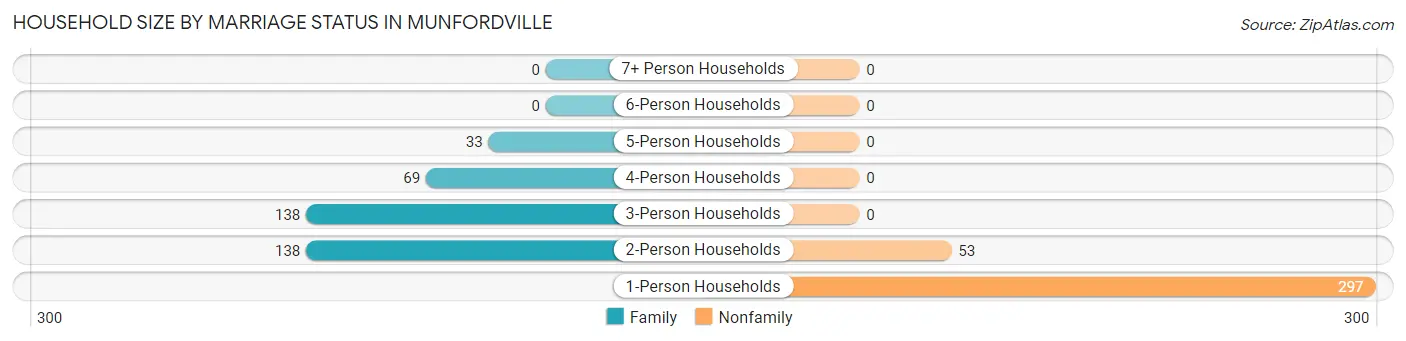
| Household Size | Family Households | Nonfamily Households |
| 1-Person Households | - | 297 (40.8%) |
| 2-Person Households | 138 (19.0%) | 53 (7.3%) |
| 3-Person Households | 138 (19.0%) | 0 (0.0%) |
| 4-Person Households | 69 (9.5%) | 0 (0.0%) |
| 5-Person Households | 33 (4.5%) | 0 (0.0%) |
| 6-Person Households | 0 (0.0%) | 0 (0.0%) |
| 7+ Person Households | 0 (0.0%) | 0 (0.0%) |
| Total | 378 (51.9%) | 350 (48.1%) |
Female Fertility in Munfordville
Fertility by Age in Munfordville
Average fertility rate in Munfordville is 51.0 births per 1,000 women. Women in the age bracket of 20 to 34 years have the highest fertility rate with 93.0 births per 1,000 women. Women in the age bracket of 20 to 34 years acount for 100.0% of all women with births.
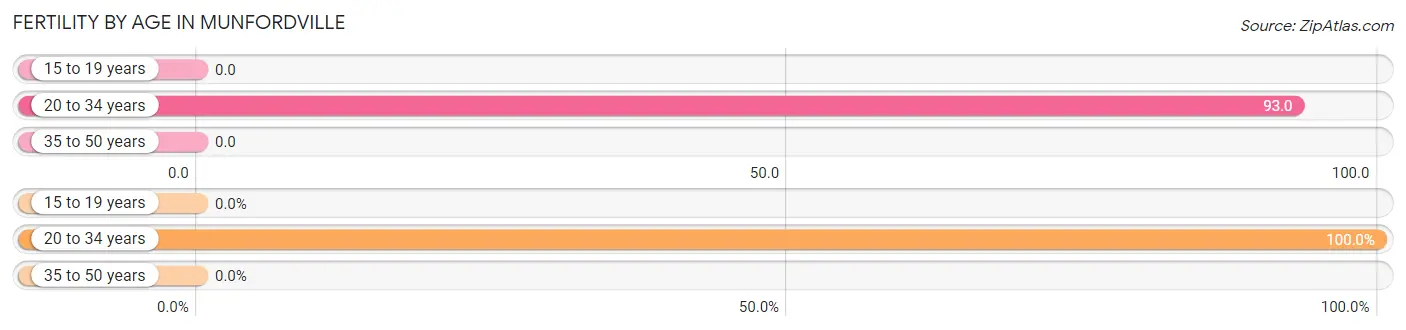
| Age Bracket | Women with Births | Births / 1,000 Women |
| 15 to 19 years | 0 (0.0%) | 0.0 |
| 20 to 34 years | 17 (100.0%) | 93.0 |
| 35 to 50 years | 0 (0.0%) | 0.0 |
| Total | 17 (100.0%) | 51.0 |
Fertility by Age by Marriage Status in Munfordville
17.6% of women with births (17) in Munfordville are married. The highest percentage of unmarried women with births falls into 20 to 34 years age bracket with 82.4% of them unmarried at the time of birth, while the lowest percentage of unmarried women with births belong to 20 to 34 years age bracket with 82.4% of them unmarried.
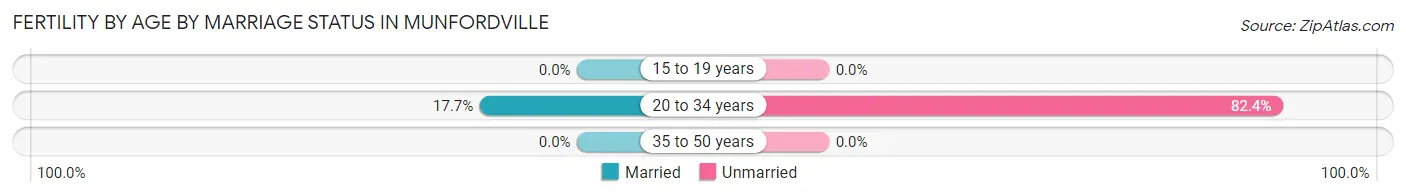
| Age Bracket | Married | Unmarried |
| 15 to 19 years | 0 (0.0%) | 0 (0.0%) |
| 20 to 34 years | 3 (17.6%) | 14 (82.4%) |
| 35 to 50 years | 0 (0.0%) | 0 (0.0%) |
| Total | 3 (17.6%) | 14 (82.4%) |
Fertility by Education in Munfordville
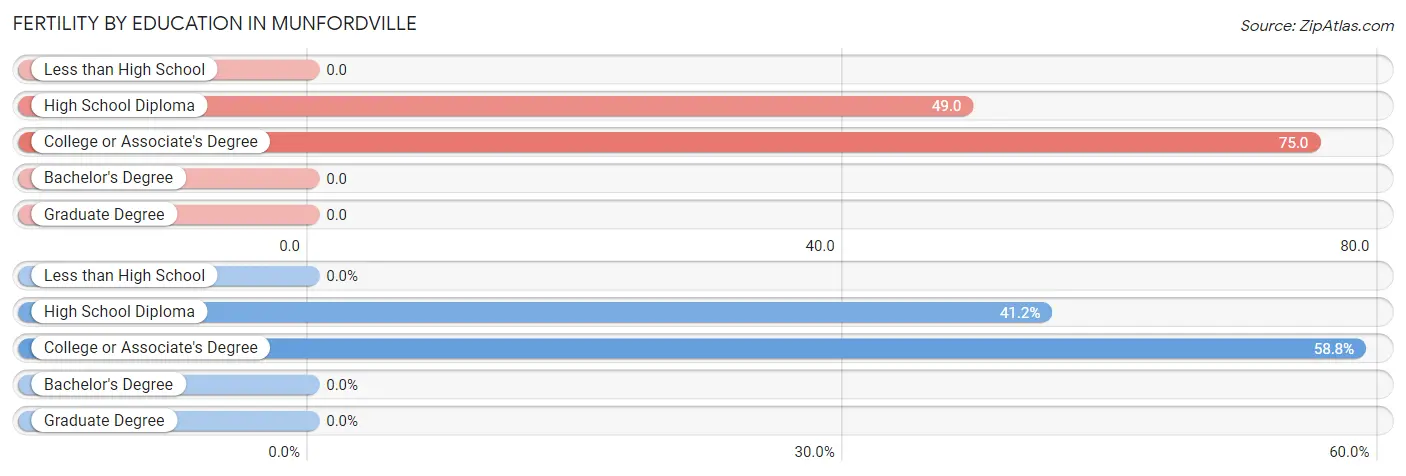
| Educational Attainment | Women with Births | Births / 1,000 Women |
| Less than High School | 0 (0.0%) | 0.0 |
| High School Diploma | 7 (41.2%) | 49.0 |
| College or Associate's Degree | 10 (58.8%) | 75.0 |
| Bachelor's Degree | 0 (0.0%) | 0.0 |
| Graduate Degree | 0 (0.0%) | 0.0 |
| Total | 17 (100.0%) | 51.0 |
Fertility by Education by Marriage Status in Munfordville
82.4% of women with births in Munfordville are unmarried. Women with the educational attainment of high school diploma are most likely to be married with 42.9% of them married at childbirth, while women with the educational attainment of college or associate's degree are least likely to be married with 100.0% of them unmarried at childbirth.
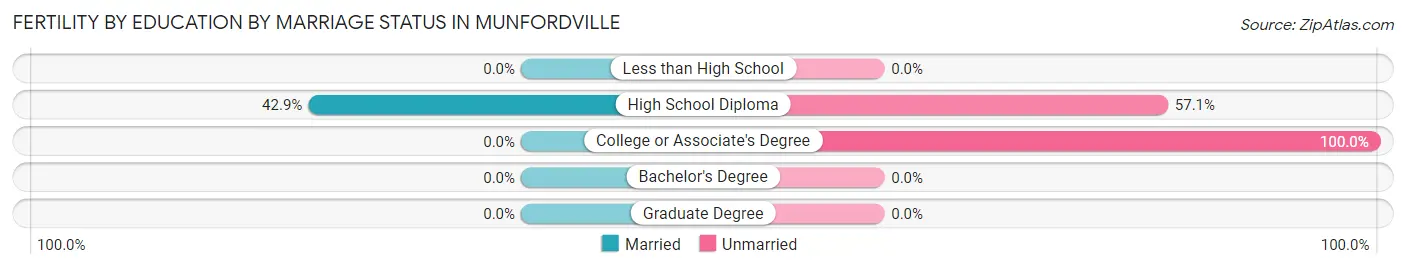
| Educational Attainment | Married | Unmarried |
| Less than High School | 0 (0.0%) | 0 (0.0%) |
| High School Diploma | 3 (42.9%) | 4 (57.1%) |
| College or Associate's Degree | 0 (0.0%) | 10 (100.0%) |
| Bachelor's Degree | 0 (0.0%) | 0 (0.0%) |
| Graduate Degree | 0 (0.0%) | 0 (0.0%) |
| Total | 3 (17.6%) | 14 (82.4%) |
Employment Characteristics in Munfordville
Employment by Class of Employer in Munfordville
Among the 589 employed individuals in Munfordville, private company employees (420 | 71.3%), self-employed (not incorporated) (53 | 9.0%), and self-employed (incorporated) (42 | 7.1%) make up the most common classes of employment.
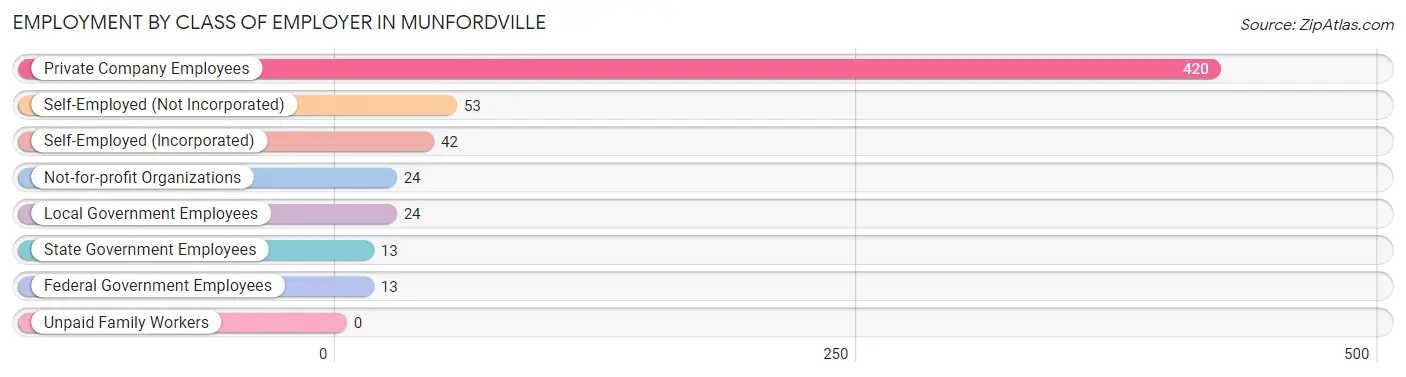
| Employer Class | # Employees | % Employees |
| Private Company Employees | 420 | 71.3% |
| Self-Employed (Incorporated) | 42 | 7.1% |
| Self-Employed (Not Incorporated) | 53 | 9.0% |
| Not-for-profit Organizations | 24 | 4.1% |
| Local Government Employees | 24 | 4.1% |
| State Government Employees | 13 | 2.2% |
| Federal Government Employees | 13 | 2.2% |
| Unpaid Family Workers | 0 | 0.0% |
| Total | 589 | 100.0% |
Employment Status by Age in Munfordville
According to the labor force statistics for Munfordville, out of the total population over 16 years of age (1,447), 48.9% or 708 individuals are in the labor force, with 4.5% or 32 of them unemployed. The age group with the highest labor force participation rate is 16 to 19 years, with 78.9% or 75 individuals in the labor force. Within the labor force, the 35 to 44 years age range has the highest percentage of unemployed individuals, with 12.0% or 13 of them being unemployed.
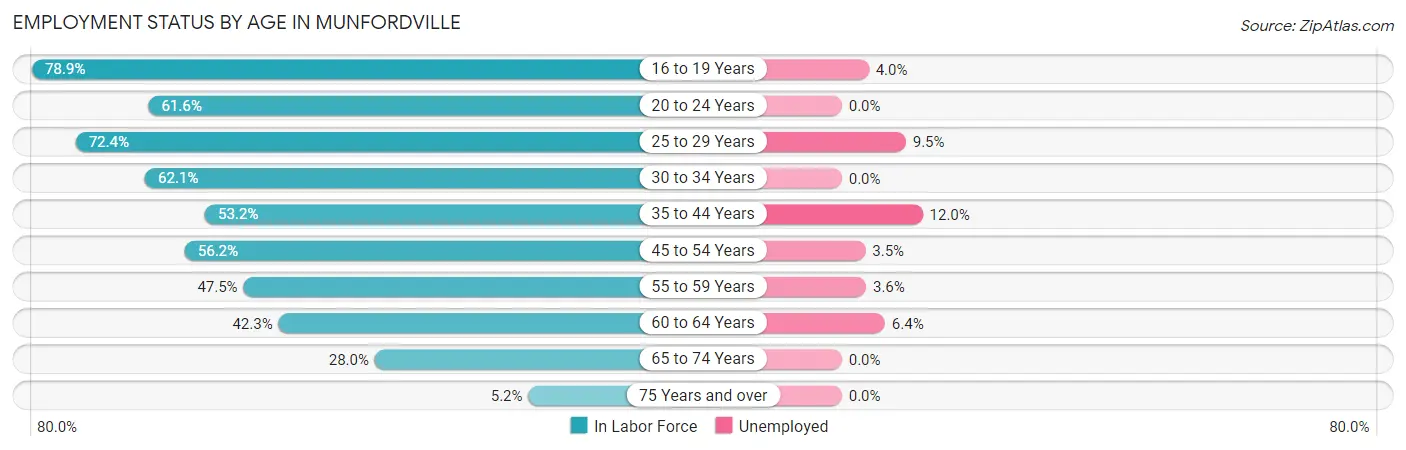
| Age Bracket | In Labor Force | Unemployed |
| 16 to 19 Years | 75 (78.9%) | 3 (4.0%) |
| 20 to 24 Years | 69 (61.6%) | 0 (0.0%) |
| 25 to 29 Years | 63 (72.4%) | 6 (9.5%) |
| 30 to 34 Years | 90 (62.1%) | 0 (0.0%) |
| 35 to 44 Years | 108 (53.2%) | 13 (12.0%) |
| 45 to 54 Years | 113 (56.2%) | 4 (3.5%) |
| 55 to 59 Years | 84 (47.5%) | 3 (3.6%) |
| 60 to 64 Years | 47 (42.3%) | 3 (6.4%) |
| 65 to 74 Years | 51 (28.0%) | 0 (0.0%) |
| 75 Years and over | 7 (5.2%) | 0 (0.0%) |
| Total | 708 (48.9%) | 32 (4.5%) |
Employment Status by Educational Attainment in Munfordville
According to labor force statistics for Munfordville, 54.7% of individuals (505) out of the total population between 25 and 64 years of age (924) are in the labor force, with 5.7% or 29 of them being unemployed. The group with the highest labor force participation rate are those with the educational attainment of bachelor's degree or higher, with 82.0% or 73 individuals in the labor force. Within the labor force, individuals with less than high school education have the highest percentage of unemployment, with 21.2% or 7 of them being unemployed.
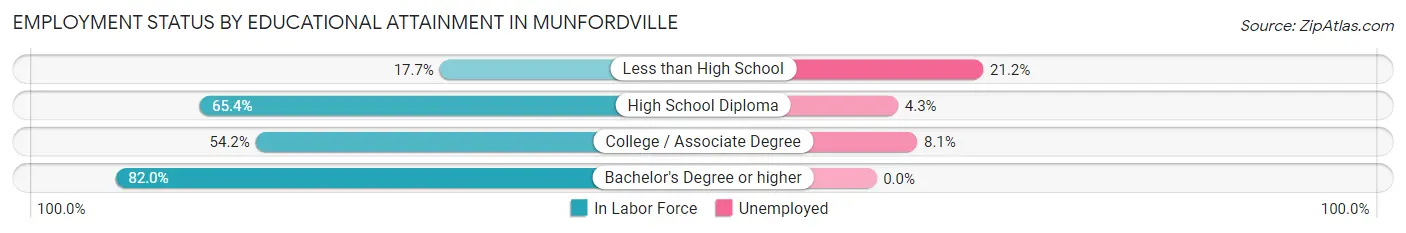
| Educational Attainment | In Labor Force | Unemployed |
| Less than High School | 33 (17.7%) | 39 (21.2%) |
| High School Diploma | 276 (65.4%) | 18 (4.3%) |
| College / Associate Degree | 123 (54.2%) | 18 (8.1%) |
| Bachelor's Degree or higher | 73 (82.0%) | 0 (0.0%) |
| Total | 505 (54.7%) | 53 (5.7%) |
Employment Occupations by Sex in Munfordville
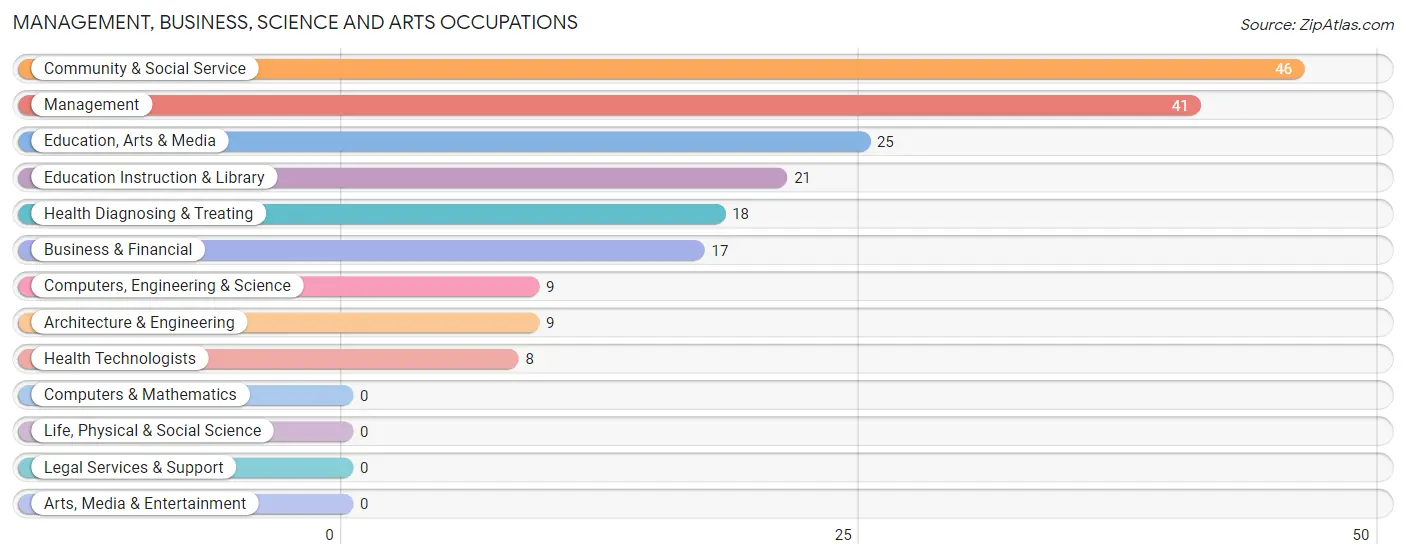
Management, Business, Science and Arts Occupations
The most common Management, Business, Science and Arts occupations in Munfordville are Community & Social Service (46 | 6.8%), Management (41 | 6.1%), Education, Arts & Media (25 | 3.7%), Education Instruction & Library (21 | 3.1%), and Health Diagnosing & Treating (18 | 2.7%).
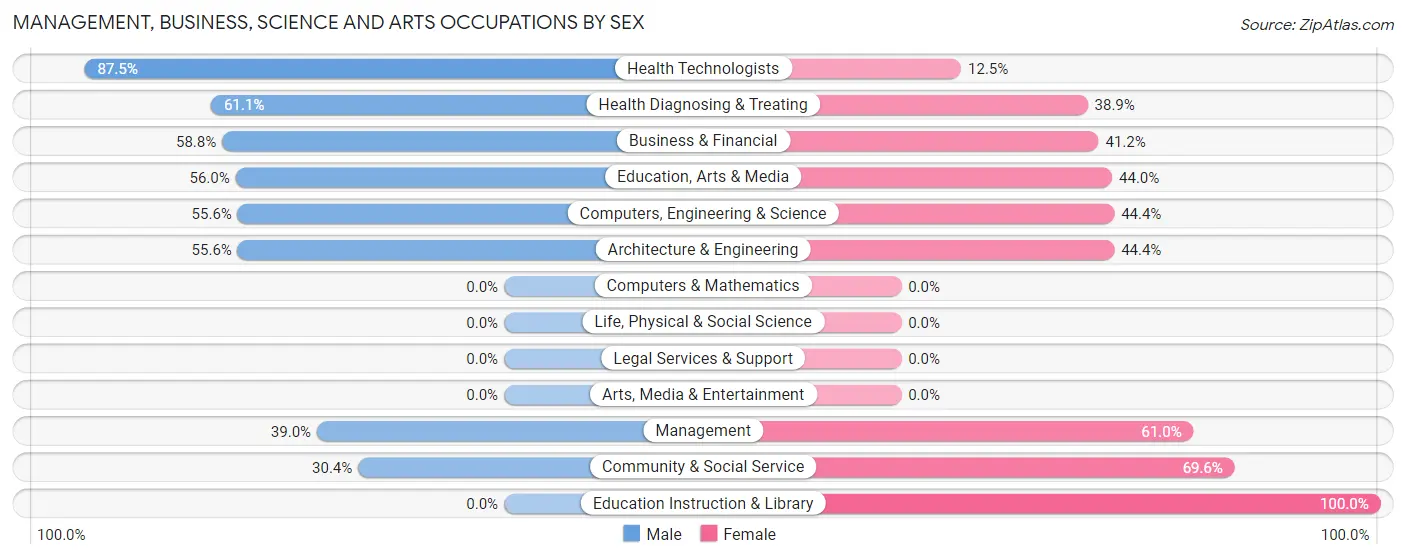
Management, Business, Science and Arts Occupations by Sex
Within the Management, Business, Science and Arts occupations in Munfordville, the most male-oriented occupations are Health Technologists (87.5%), Health Diagnosing & Treating (61.1%), and Business & Financial (58.8%), while the most female-oriented occupations are Education Instruction & Library (100.0%), Community & Social Service (69.6%), and Management (61.0%).
| Occupation | Male | Female |
| Management | 16 (39.0%) | 25 (61.0%) |
| Business & Financial | 10 (58.8%) | 7 (41.2%) |
| Computers, Engineering & Science | 5 (55.6%) | 4 (44.4%) |
| Computers & Mathematics | 0 (0.0%) | 0 (0.0%) |
| Architecture & Engineering | 5 (55.6%) | 4 (44.4%) |
| Life, Physical & Social Science | 0 (0.0%) | 0 (0.0%) |
| Community & Social Service | 14 (30.4%) | 32 (69.6%) |
| Education, Arts & Media | 14 (56.0%) | 11 (44.0%) |
| Legal Services & Support | 0 (0.0%) | 0 (0.0%) |
| Education Instruction & Library | 0 (0.0%) | 21 (100.0%) |
| Arts, Media & Entertainment | 0 (0.0%) | 0 (0.0%) |
| Health Diagnosing & Treating | 11 (61.1%) | 7 (38.9%) |
| Health Technologists | 7 (87.5%) | 1 (12.5%) |
| Total (Category) | 56 (42.7%) | 75 (57.3%) |
| Total (Overall) | 347 (51.4%) | 328 (48.6%) |
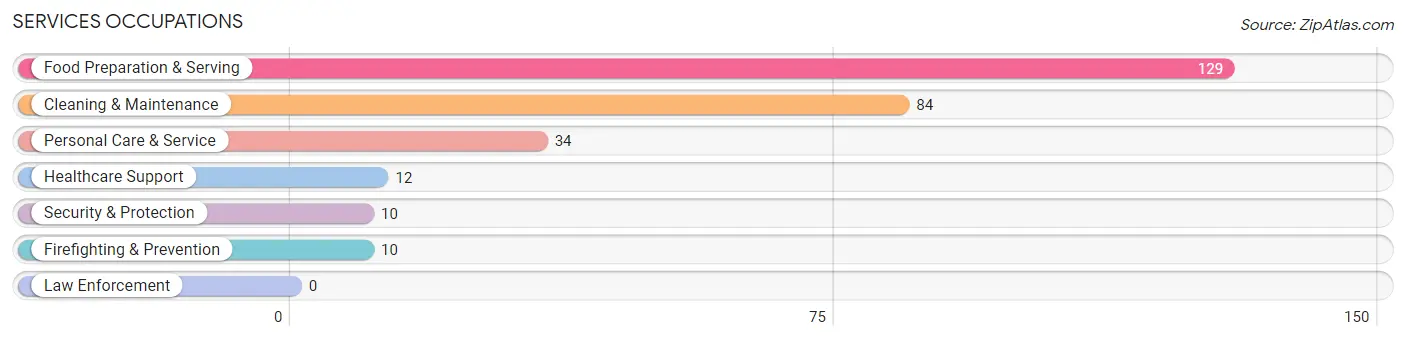
Services Occupations
The most common Services occupations in Munfordville are Food Preparation & Serving (129 | 19.1%), Cleaning & Maintenance (84 | 12.4%), Personal Care & Service (34 | 5.0%), Healthcare Support (12 | 1.8%), and Security & Protection (10 | 1.5%).
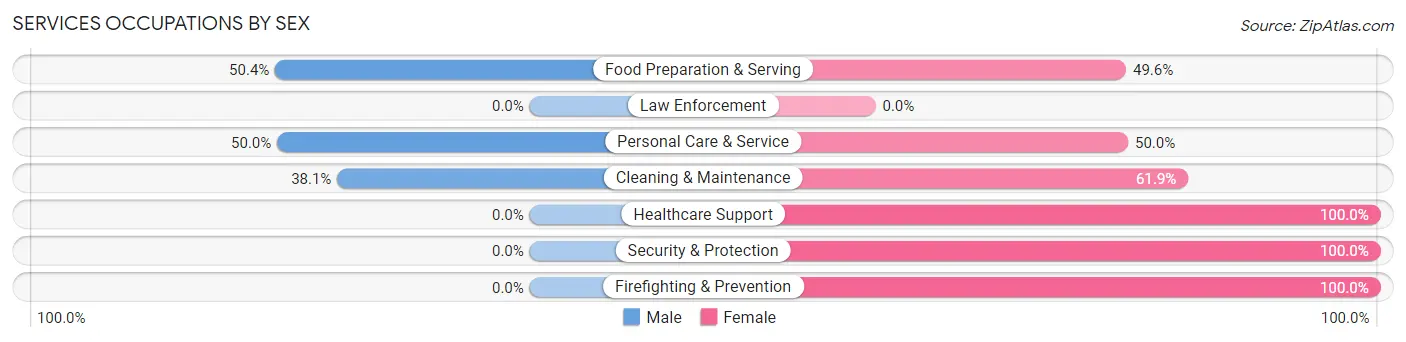
Services Occupations by Sex
Within the Services occupations in Munfordville, the most male-oriented occupations are Food Preparation & Serving (50.4%), Personal Care & Service (50.0%), and Cleaning & Maintenance (38.1%), while the most female-oriented occupations are Healthcare Support (100.0%), Security & Protection (100.0%), and Firefighting & Prevention (100.0%).
| Occupation | Male | Female |
| Healthcare Support | 0 (0.0%) | 12 (100.0%) |
| Security & Protection | 0 (0.0%) | 10 (100.0%) |
| Firefighting & Prevention | 0 (0.0%) | 10 (100.0%) |
| Law Enforcement | 0 (0.0%) | 0 (0.0%) |
| Food Preparation & Serving | 65 (50.4%) | 64 (49.6%) |
| Cleaning & Maintenance | 32 (38.1%) | 52 (61.9%) |
| Personal Care & Service | 17 (50.0%) | 17 (50.0%) |
| Total (Category) | 114 (42.4%) | 155 (57.6%) |
| Total (Overall) | 347 (51.4%) | 328 (48.6%) |
Sales and Office Occupations
The most common Sales and Office occupations in Munfordville are Sales & Related (58 | 8.6%), and Office & Administration (39 | 5.8%).
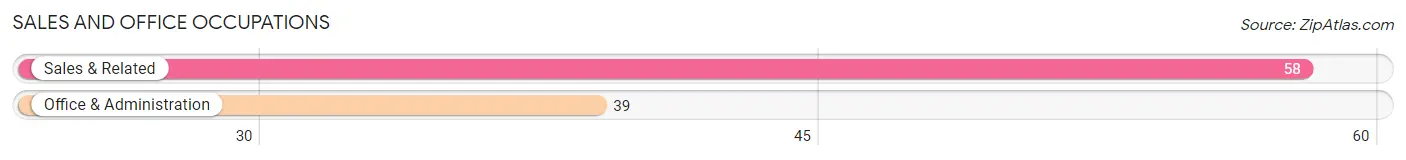
Sales and Office Occupations by Sex

| Occupation | Male | Female |
| Sales & Related | 14 (24.1%) | 44 (75.9%) |
| Office & Administration | 6 (15.4%) | 33 (84.6%) |
| Total (Category) | 20 (20.6%) | 77 (79.4%) |
| Total (Overall) | 347 (51.4%) | 328 (48.6%) |
Natural Resources, Construction and Maintenance Occupations
The most common Natural Resources, Construction and Maintenance occupations in Munfordville are Installation, Maintenance & Repair (32 | 4.7%), Construction & Extraction (25 | 3.7%), and Farming, Fishing & Forestry (3 | 0.4%).

Natural Resources, Construction and Maintenance Occupations by Sex
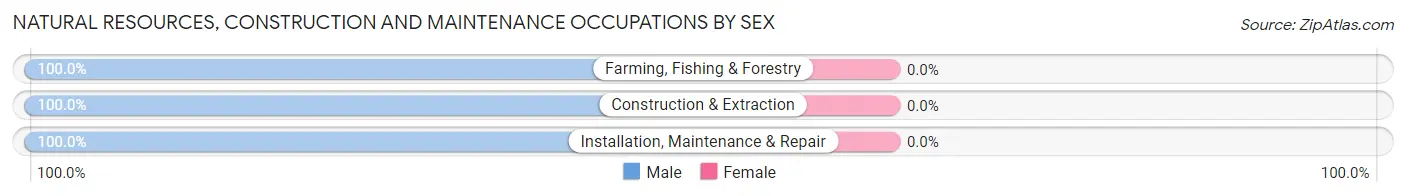
| Occupation | Male | Female |
| Farming, Fishing & Forestry | 3 (100.0%) | 0 (0.0%) |
| Construction & Extraction | 25 (100.0%) | 0 (0.0%) |
| Installation, Maintenance & Repair | 32 (100.0%) | 0 (0.0%) |
| Total (Category) | 60 (100.0%) | 0 (0.0%) |
| Total (Overall) | 347 (51.4%) | 328 (48.6%) |
Production, Transportation and Moving Occupations
The most common Production, Transportation and Moving occupations in Munfordville are Production (60 | 8.9%), Material Moving (32 | 4.7%), and Transportation (26 | 3.8%).
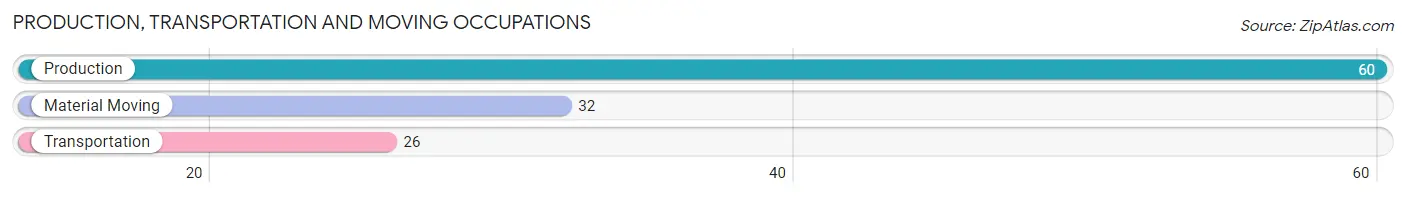
Production, Transportation and Moving Occupations by Sex
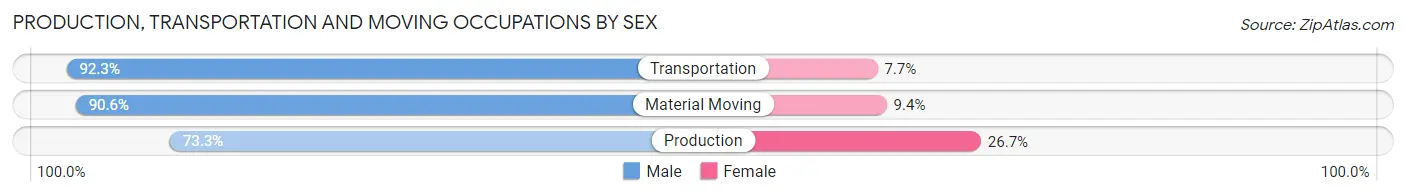
| Occupation | Male | Female |
| Production | 44 (73.3%) | 16 (26.7%) |
| Transportation | 24 (92.3%) | 2 (7.7%) |
| Material Moving | 29 (90.6%) | 3 (9.4%) |
| Total (Category) | 97 (82.2%) | 21 (17.8%) |
| Total (Overall) | 347 (51.4%) | 328 (48.6%) |
Employment Industries by Sex in Munfordville
Employment Industries in Munfordville
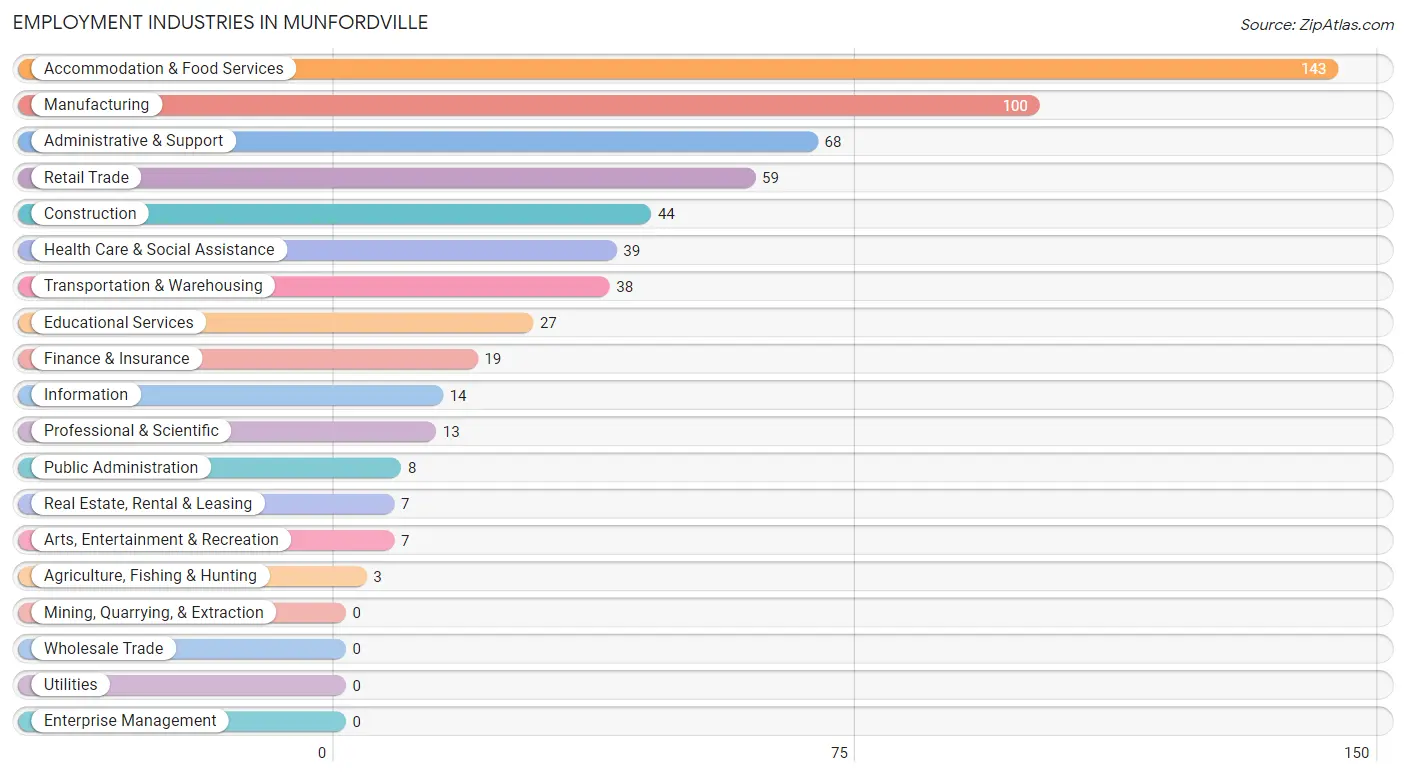
The major employment industries in Munfordville include Accommodation & Food Services (143 | 21.2%), Manufacturing (100 | 14.8%), Administrative & Support (68 | 10.1%), Retail Trade (59 | 8.7%), and Construction (44 | 6.5%).
Employment Industries by Sex in Munfordville
The Munfordville industries that see more men than women are Information (100.0%), Real Estate, Rental & Leasing (100.0%), and Arts, Entertainment & Recreation (100.0%), whereas the industries that tend to have a higher number of women are Agriculture, Fishing & Hunting (100.0%), Educational Services (100.0%), and Finance & Insurance (78.9%).
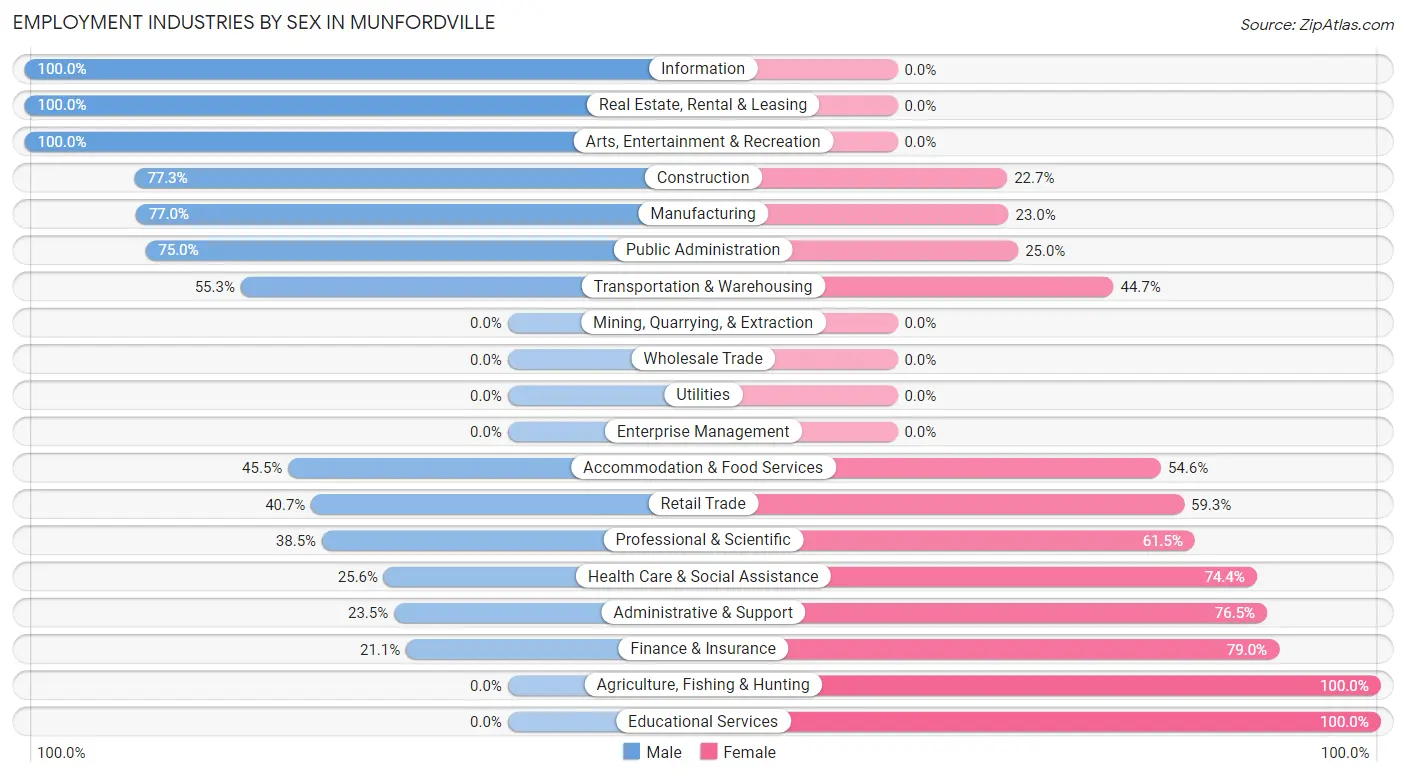
| Industry | Male | Female |
| Agriculture, Fishing & Hunting | 0 (0.0%) | 3 (100.0%) |
| Mining, Quarrying, & Extraction | 0 (0.0%) | 0 (0.0%) |
| Construction | 34 (77.3%) | 10 (22.7%) |
| Manufacturing | 77 (77.0%) | 23 (23.0%) |
| Wholesale Trade | 0 (0.0%) | 0 (0.0%) |
| Retail Trade | 24 (40.7%) | 35 (59.3%) |
| Transportation & Warehousing | 21 (55.3%) | 17 (44.7%) |
| Utilities | 0 (0.0%) | 0 (0.0%) |
| Information | 14 (100.0%) | 0 (0.0%) |
| Finance & Insurance | 4 (21.0%) | 15 (78.9%) |
| Real Estate, Rental & Leasing | 7 (100.0%) | 0 (0.0%) |
| Professional & Scientific | 5 (38.5%) | 8 (61.5%) |
| Enterprise Management | 0 (0.0%) | 0 (0.0%) |
| Administrative & Support | 16 (23.5%) | 52 (76.5%) |
| Educational Services | 0 (0.0%) | 27 (100.0%) |
| Health Care & Social Assistance | 10 (25.6%) | 29 (74.4%) |
| Arts, Entertainment & Recreation | 7 (100.0%) | 0 (0.0%) |
| Accommodation & Food Services | 65 (45.5%) | 78 (54.5%) |
| Public Administration | 6 (75.0%) | 2 (25.0%) |
| Total | 347 (51.4%) | 328 (48.6%) |
Education in Munfordville
School Enrollment in Munfordville
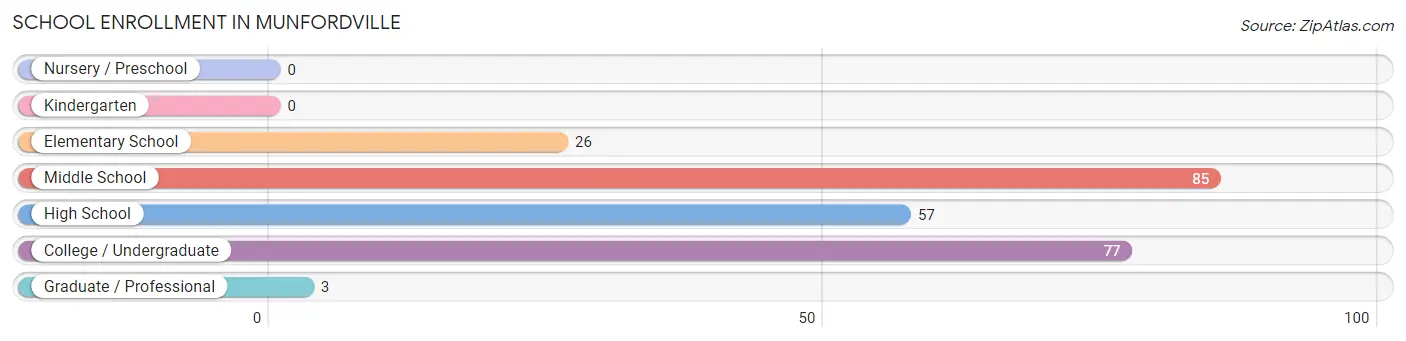
The most common levels of schooling among the 248 students in Munfordville are middle school (85 | 34.3%), college / undergraduate (77 | 31.0%), and high school (57 | 23.0%).
| School Level | # Students | % Students |
| Nursery / Preschool | 0 | 0.0% |
| Kindergarten | 0 | 0.0% |
| Elementary School | 26 | 10.5% |
| Middle School | 85 | 34.3% |
| High School | 57 | 23.0% |
| College / Undergraduate | 77 | 31.0% |
| Graduate / Professional | 3 | 1.2% |
| Total | 248 | 100.0% |
School Enrollment by Age by Funding Source in Munfordville
Out of a total of 248 students who are enrolled in schools in Munfordville, 36 (14.5%) attend a private institution, while the remaining 212 (85.5%) are enrolled in public schools. The age group of 18 to 19 year olds has the highest likelihood of being enrolled in private schools, with 23 (62.2% in the age bracket) enrolled. Conversely, the age group of 15 to 17 year olds has the lowest likelihood of being enrolled in a private school, with 42 (100.0% in the age bracket) attending a public institution.
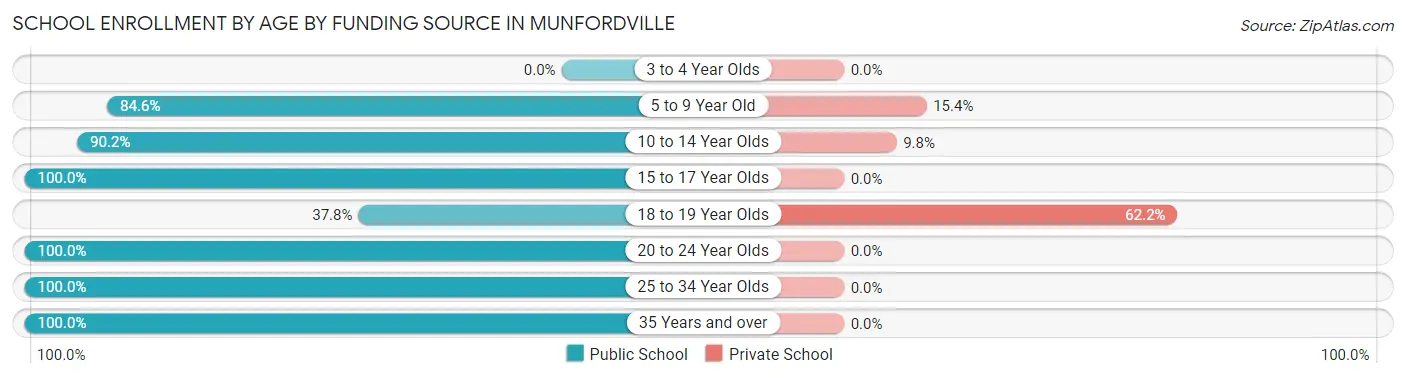
| Age Bracket | Public School | Private School |
| 3 to 4 Year Olds | 0 (0.0%) | 0 (0.0%) |
| 5 to 9 Year Old | 22 (84.6%) | 4 (15.4%) |
| 10 to 14 Year Olds | 83 (90.2%) | 9 (9.8%) |
| 15 to 17 Year Olds | 42 (100.0%) | 0 (0.0%) |
| 18 to 19 Year Olds | 14 (37.8%) | 23 (62.2%) |
| 20 to 24 Year Olds | 28 (100.0%) | 0 (0.0%) |
| 25 to 34 Year Olds | 20 (100.0%) | 0 (0.0%) |
| 35 Years and over | 3 (100.0%) | 0 (0.0%) |
| Total | 212 (85.5%) | 36 (14.5%) |
Educational Attainment by Field of Study in Munfordville
Education (28 | 19.4%), bio, nature & agricultural (24 | 16.7%), business (23 | 16.0%), literature & languages (18 | 12.5%), and social sciences (14 | 9.7%) are the most common fields of study among 144 individuals in Munfordville who have obtained a bachelor's degree or higher.
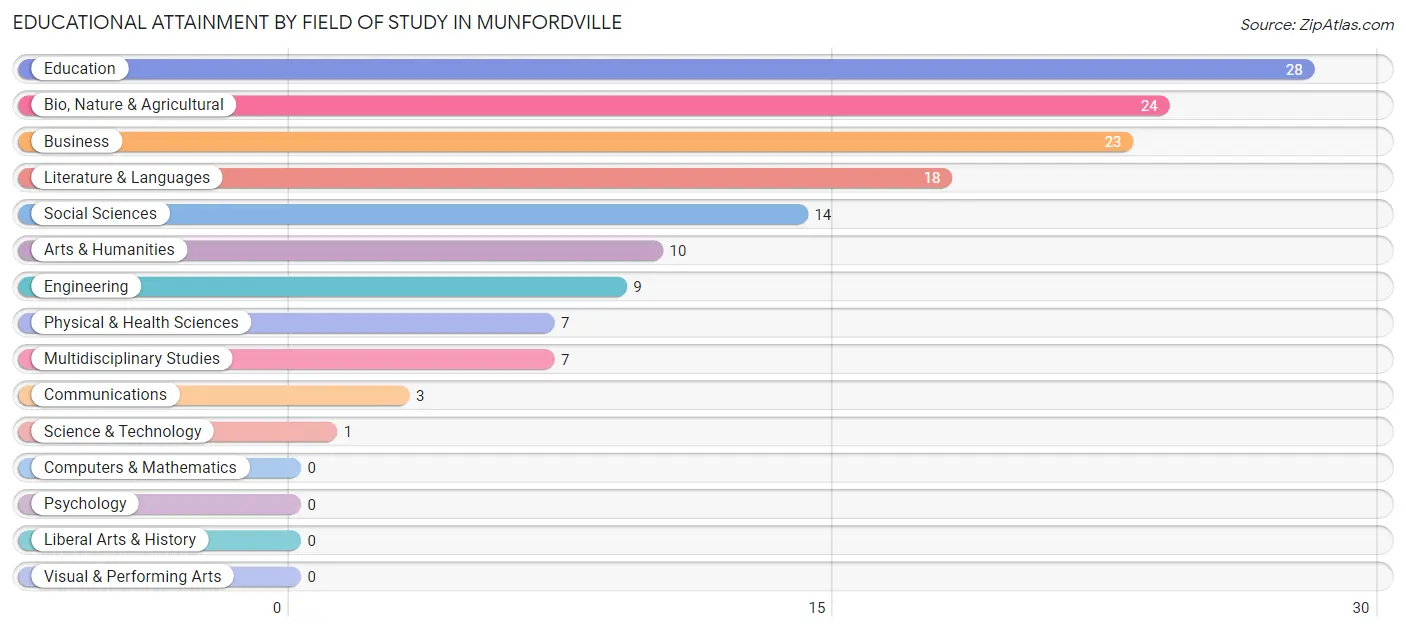
| Field of Study | # Graduates | % Graduates |
| Computers & Mathematics | 0 | 0.0% |
| Bio, Nature & Agricultural | 24 | 16.7% |
| Physical & Health Sciences | 7 | 4.9% |
| Psychology | 0 | 0.0% |
| Social Sciences | 14 | 9.7% |
| Engineering | 9 | 6.2% |
| Multidisciplinary Studies | 7 | 4.9% |
| Science & Technology | 1 | 0.7% |
| Business | 23 | 16.0% |
| Education | 28 | 19.4% |
| Literature & Languages | 18 | 12.5% |
| Liberal Arts & History | 0 | 0.0% |
| Visual & Performing Arts | 0 | 0.0% |
| Communications | 3 | 2.1% |
| Arts & Humanities | 10 | 6.9% |
| Total | 144 | 100.0% |
Transportation & Commute in Munfordville
Vehicle Availability by Sex in Munfordville
The most prevalent vehicle ownership categories in Munfordville are males with 2 vehicles (109, accounting for 32.7%) and females with 2 vehicles (54, making up 42.6%).
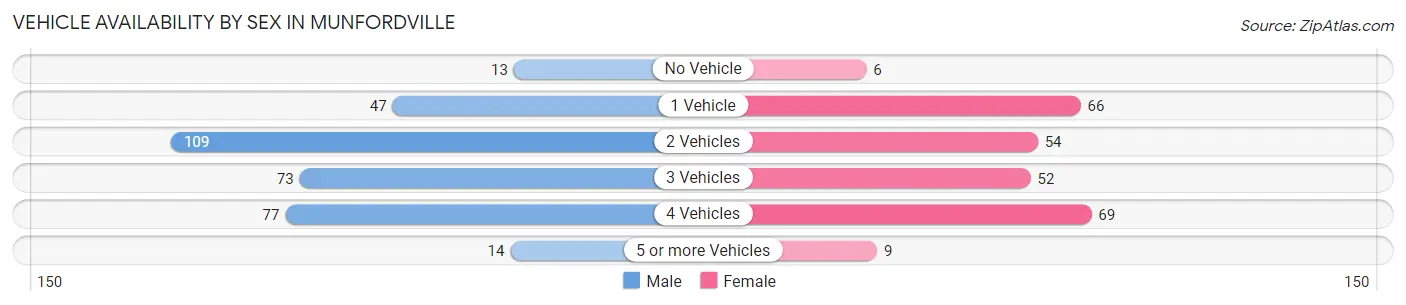
| Vehicles Available | Male | Female |
| No Vehicle | 13 (3.9%) | 6 (2.3%) |
| 1 Vehicle | 47 (14.1%) | 66 (25.8%) |
| 2 Vehicles | 109 (32.7%) | 54 (21.1%) |
| 3 Vehicles | 73 (21.9%) | 52 (20.3%) |
| 4 Vehicles | 77 (23.1%) | 69 (27.0%) |
| 5 or more Vehicles | 14 (4.2%) | 9 (3.5%) |
| Total | 333 (100.0%) | 256 (100.0%) |
Commute Time in Munfordville
The most frequently occuring commute durations in Munfordville are less than 5 minutes (126 commuters, 22.5%), 10 to 14 minutes (80 commuters, 14.3%), and 5 to 9 minutes (73 commuters, 13.1%).
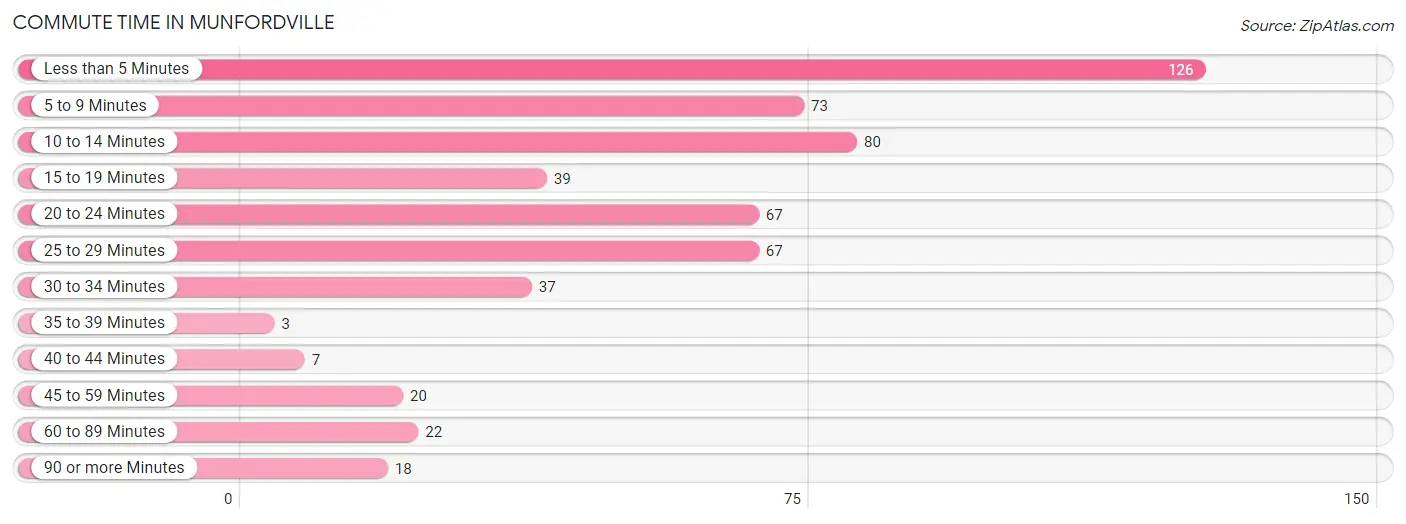
| Commute Time | # Commuters | % Commuters |
| Less than 5 Minutes | 126 | 22.5% |
| 5 to 9 Minutes | 73 | 13.1% |
| 10 to 14 Minutes | 80 | 14.3% |
| 15 to 19 Minutes | 39 | 7.0% |
| 20 to 24 Minutes | 67 | 12.0% |
| 25 to 29 Minutes | 67 | 12.0% |
| 30 to 34 Minutes | 37 | 6.6% |
| 35 to 39 Minutes | 3 | 0.5% |
| 40 to 44 Minutes | 7 | 1.3% |
| 45 to 59 Minutes | 20 | 3.6% |
| 60 to 89 Minutes | 22 | 3.9% |
| 90 or more Minutes | 18 | 3.2% |
Commute Time by Sex in Munfordville
The most common commute times in Munfordville are less than 5 minutes (61 commuters, 19.1%) for males and less than 5 minutes (65 commuters, 27.1%) for females.
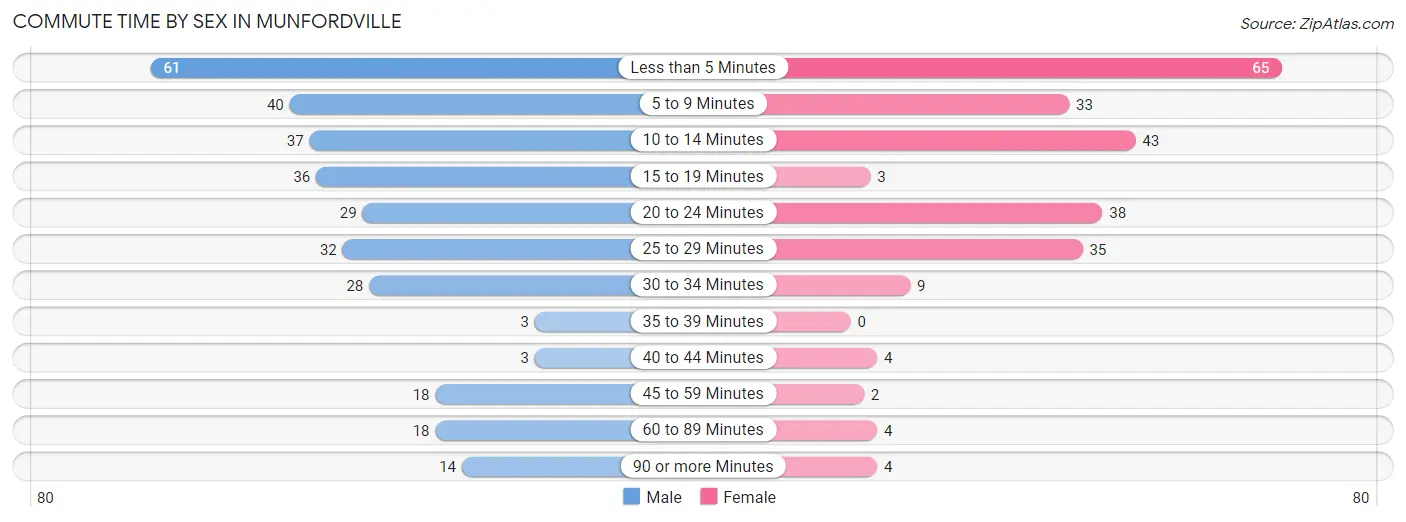
| Commute Time | Male | Female |
| Less than 5 Minutes | 61 (19.1%) | 65 (27.1%) |
| 5 to 9 Minutes | 40 (12.5%) | 33 (13.8%) |
| 10 to 14 Minutes | 37 (11.6%) | 43 (17.9%) |
| 15 to 19 Minutes | 36 (11.3%) | 3 (1.3%) |
| 20 to 24 Minutes | 29 (9.1%) | 38 (15.8%) |
| 25 to 29 Minutes | 32 (10.0%) | 35 (14.6%) |
| 30 to 34 Minutes | 28 (8.8%) | 9 (3.7%) |
| 35 to 39 Minutes | 3 (0.9%) | 0 (0.0%) |
| 40 to 44 Minutes | 3 (0.9%) | 4 (1.7%) |
| 45 to 59 Minutes | 18 (5.6%) | 2 (0.8%) |
| 60 to 89 Minutes | 18 (5.6%) | 4 (1.7%) |
| 90 or more Minutes | 14 (4.4%) | 4 (1.7%) |
Time of Departure to Work by Sex in Munfordville
The most frequent times of departure to work in Munfordville are 12:00 PM to 3:59 PM (40, 12.5%) for males and 7:30 AM to 7:59 AM (49, 20.4%) for females.
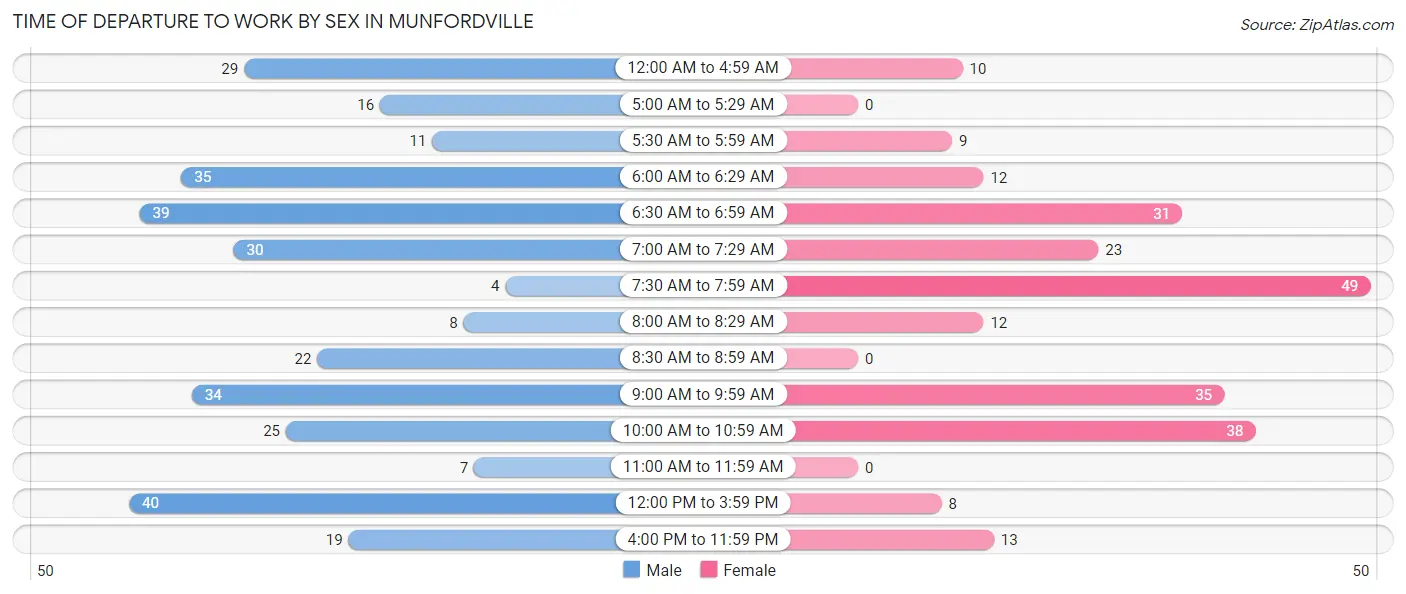
| Time of Departure | Male | Female |
| 12:00 AM to 4:59 AM | 29 (9.1%) | 10 (4.2%) |
| 5:00 AM to 5:29 AM | 16 (5.0%) | 0 (0.0%) |
| 5:30 AM to 5:59 AM | 11 (3.5%) | 9 (3.7%) |
| 6:00 AM to 6:29 AM | 35 (11.0%) | 12 (5.0%) |
| 6:30 AM to 6:59 AM | 39 (12.2%) | 31 (12.9%) |
| 7:00 AM to 7:29 AM | 30 (9.4%) | 23 (9.6%) |
| 7:30 AM to 7:59 AM | 4 (1.3%) | 49 (20.4%) |
| 8:00 AM to 8:29 AM | 8 (2.5%) | 12 (5.0%) |
| 8:30 AM to 8:59 AM | 22 (6.9%) | 0 (0.0%) |
| 9:00 AM to 9:59 AM | 34 (10.7%) | 35 (14.6%) |
| 10:00 AM to 10:59 AM | 25 (7.8%) | 38 (15.8%) |
| 11:00 AM to 11:59 AM | 7 (2.2%) | 0 (0.0%) |
| 12:00 PM to 3:59 PM | 40 (12.5%) | 8 (3.3%) |
| 4:00 PM to 11:59 PM | 19 (6.0%) | 13 (5.4%) |
| Total | 319 (100.0%) | 240 (100.0%) |
Housing Occupancy in Munfordville
Occupancy by Ownership in Munfordville
Of the total 728 dwellings in Munfordville, owner-occupied units account for 312 (42.9%), while renter-occupied units make up 416 (57.1%).
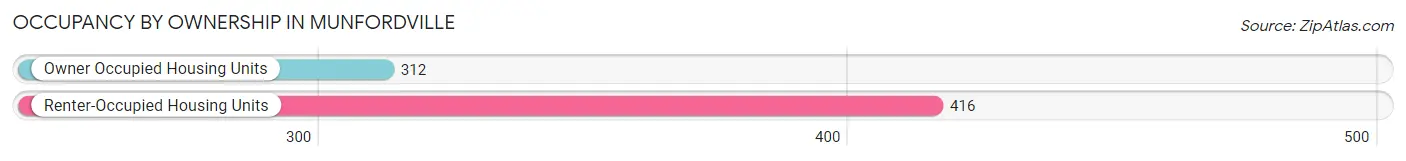
| Occupancy | # Housing Units | % Housing Units |
| Owner Occupied Housing Units | 312 | 42.9% |
| Renter-Occupied Housing Units | 416 | 57.1% |
| Total Occupied Housing Units | 728 | 100.0% |
Occupancy by Household Size in Munfordville
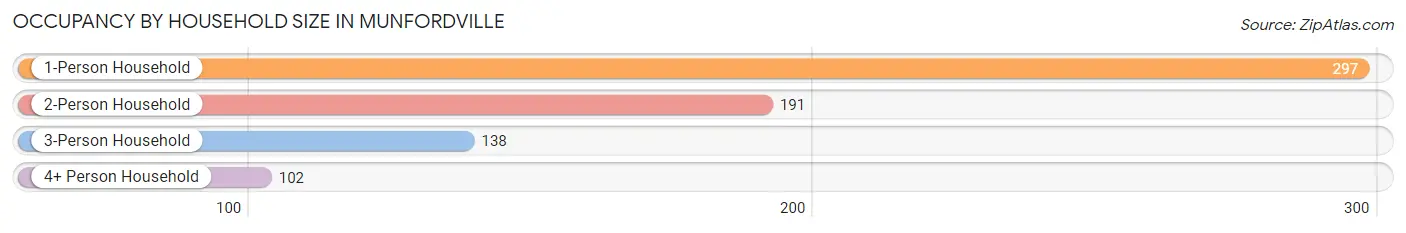
| Household Size | # Housing Units | % Housing Units |
| 1-Person Household | 297 | 40.8% |
| 2-Person Household | 191 | 26.2% |
| 3-Person Household | 138 | 19.0% |
| 4+ Person Household | 102 | 14.0% |
| Total Housing Units | 728 | 100.0% |
Occupancy by Ownership by Household Size in Munfordville
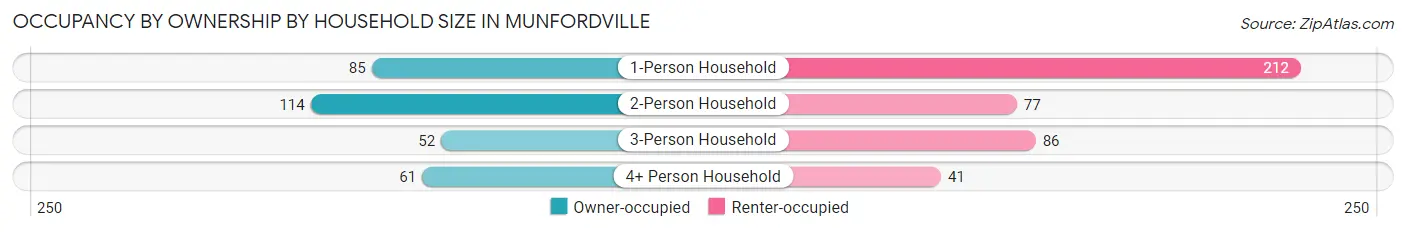
| Household Size | Owner-occupied | Renter-occupied |
| 1-Person Household | 85 (28.6%) | 212 (71.4%) |
| 2-Person Household | 114 (59.7%) | 77 (40.3%) |
| 3-Person Household | 52 (37.7%) | 86 (62.3%) |
| 4+ Person Household | 61 (59.8%) | 41 (40.2%) |
| Total Housing Units | 312 (42.9%) | 416 (57.1%) |
Occupancy by Educational Attainment in Munfordville
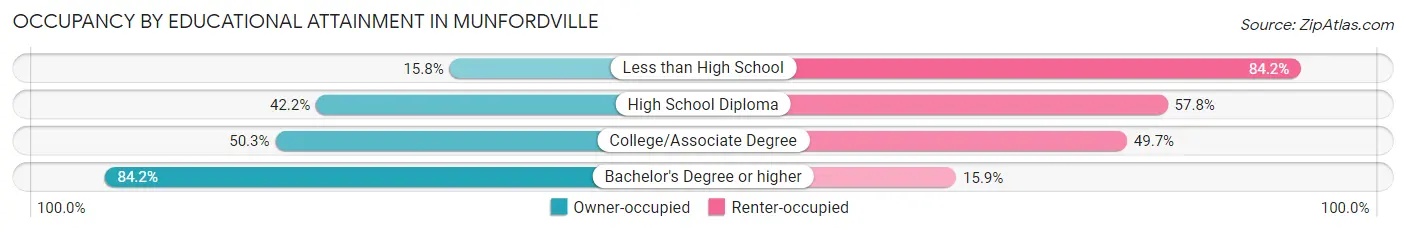
| Household Size | Owner-occupied | Renter-occupied |
| Less than High School | 26 (15.8%) | 139 (84.2%) |
| High School Diploma | 130 (42.2%) | 178 (57.8%) |
| College/Associate Degree | 87 (50.3%) | 86 (49.7%) |
| Bachelor's Degree or higher | 69 (84.2%) | 13 (15.9%) |
Occupancy by Age of Householder in Munfordville
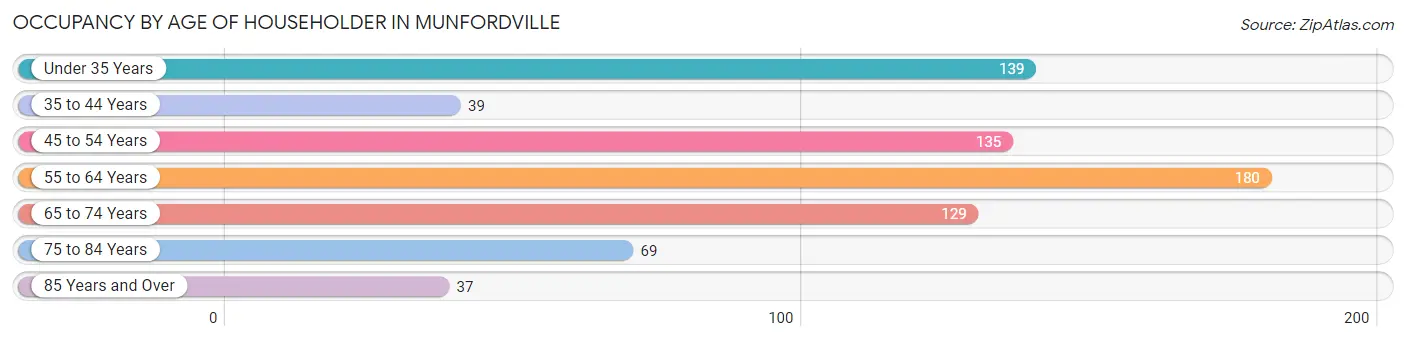
| Age Bracket | # Households | % Households |
| Under 35 Years | 139 | 19.1% |
| 35 to 44 Years | 39 | 5.4% |
| 45 to 54 Years | 135 | 18.5% |
| 55 to 64 Years | 180 | 24.7% |
| 65 to 74 Years | 129 | 17.7% |
| 75 to 84 Years | 69 | 9.5% |
| 85 Years and Over | 37 | 5.1% |
| Total | 728 | 100.0% |
Housing Finances in Munfordville
Median Income by Occupancy in Munfordville
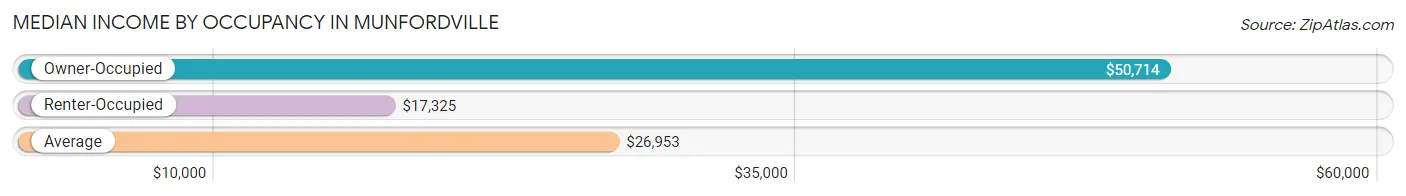
| Occupancy Type | # Households | Median Income |
| Owner-Occupied | 312 (42.9%) | $50,714 |
| Renter-Occupied | 416 (57.1%) | $17,325 |
| Average | 728 (100.0%) | $26,953 |
Occupancy by Householder Income Bracket in Munfordville
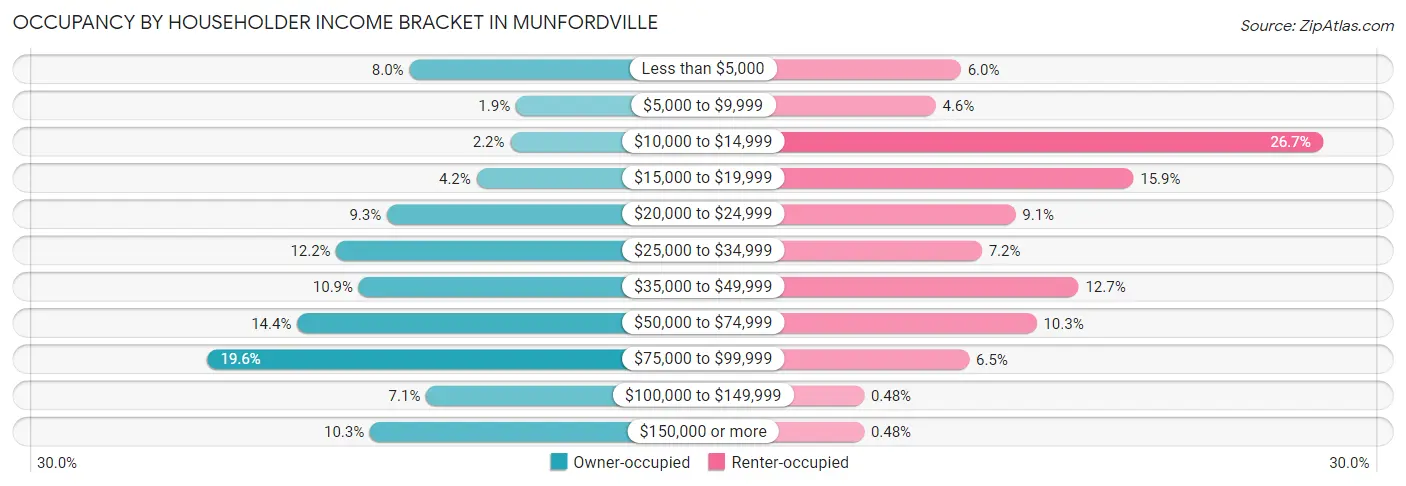
| Income Bracket | Owner-occupied | Renter-occupied |
| Less than $5,000 | 25 (8.0%) | 25 (6.0%) |
| $5,000 to $9,999 | 6 (1.9%) | 19 (4.6%) |
| $10,000 to $14,999 | 7 (2.2%) | 111 (26.7%) |
| $15,000 to $19,999 | 13 (4.2%) | 66 (15.9%) |
| $20,000 to $24,999 | 29 (9.3%) | 38 (9.1%) |
| $25,000 to $34,999 | 38 (12.2%) | 30 (7.2%) |
| $35,000 to $49,999 | 34 (10.9%) | 53 (12.7%) |
| $50,000 to $74,999 | 45 (14.4%) | 43 (10.3%) |
| $75,000 to $99,999 | 61 (19.6%) | 27 (6.5%) |
| $100,000 to $149,999 | 22 (7.0%) | 2 (0.5%) |
| $150,000 or more | 32 (10.3%) | 2 (0.5%) |
| Total | 312 (100.0%) | 416 (100.0%) |
Monthly Housing Cost Tiers in Munfordville
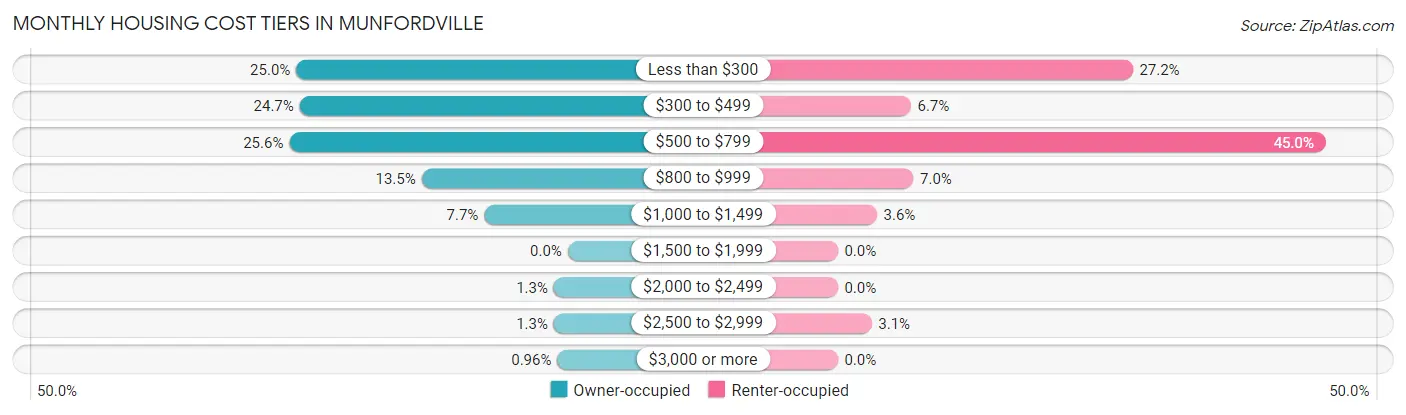
| Monthly Cost | Owner-occupied | Renter-occupied |
| Less than $300 | 78 (25.0%) | 113 (27.2%) |
| $300 to $499 | 77 (24.7%) | 28 (6.7%) |
| $500 to $799 | 80 (25.6%) | 187 (45.0%) |
| $800 to $999 | 42 (13.5%) | 29 (7.0%) |
| $1,000 to $1,499 | 24 (7.7%) | 15 (3.6%) |
| $1,500 to $1,999 | 0 (0.0%) | 0 (0.0%) |
| $2,000 to $2,499 | 4 (1.3%) | 0 (0.0%) |
| $2,500 to $2,999 | 4 (1.3%) | 13 (3.1%) |
| $3,000 or more | 3 (1.0%) | 0 (0.0%) |
| Total | 312 (100.0%) | 416 (100.0%) |
Physical Housing Characteristics in Munfordville
Housing Structures in Munfordville
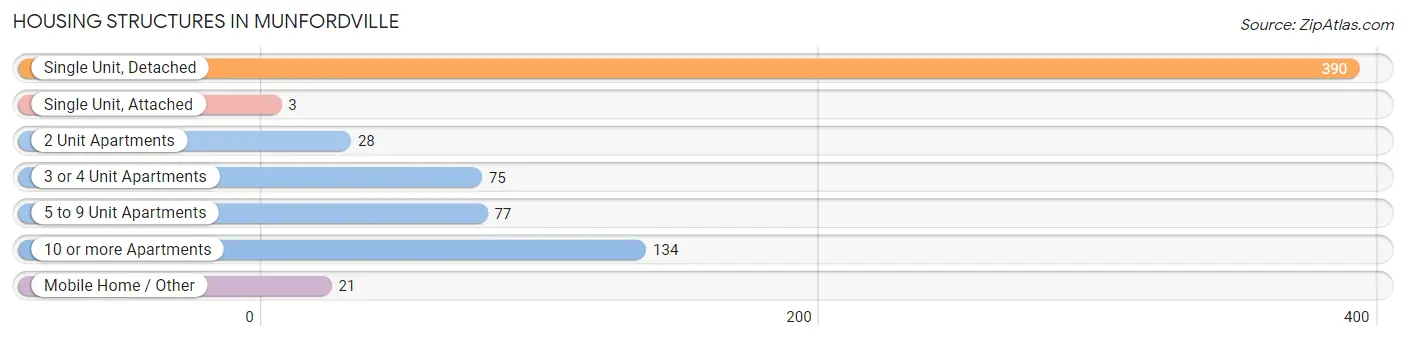
| Structure Type | # Housing Units | % Housing Units |
| Single Unit, Detached | 390 | 53.6% |
| Single Unit, Attached | 3 | 0.4% |
| 2 Unit Apartments | 28 | 3.8% |
| 3 or 4 Unit Apartments | 75 | 10.3% |
| 5 to 9 Unit Apartments | 77 | 10.6% |
| 10 or more Apartments | 134 | 18.4% |
| Mobile Home / Other | 21 | 2.9% |
| Total | 728 | 100.0% |
Housing Structures by Occupancy in Munfordville
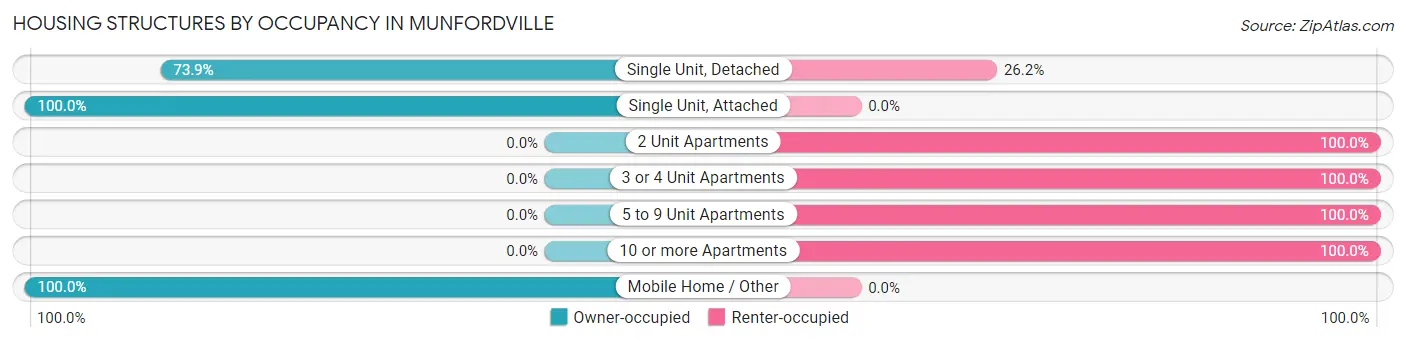
| Structure Type | Owner-occupied | Renter-occupied |
| Single Unit, Detached | 288 (73.9%) | 102 (26.2%) |
| Single Unit, Attached | 3 (100.0%) | 0 (0.0%) |
| 2 Unit Apartments | 0 (0.0%) | 28 (100.0%) |
| 3 or 4 Unit Apartments | 0 (0.0%) | 75 (100.0%) |
| 5 to 9 Unit Apartments | 0 (0.0%) | 77 (100.0%) |
| 10 or more Apartments | 0 (0.0%) | 134 (100.0%) |
| Mobile Home / Other | 21 (100.0%) | 0 (0.0%) |
| Total | 312 (42.9%) | 416 (57.1%) |
Housing Structures by Number of Rooms in Munfordville
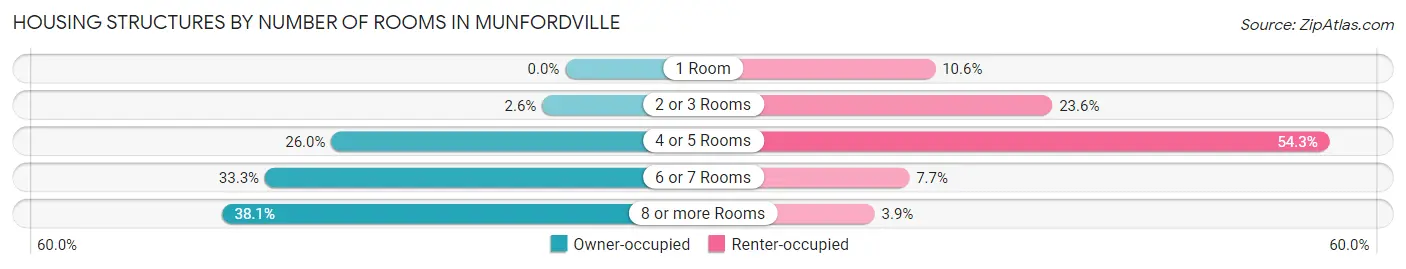
| Number of Rooms | Owner-occupied | Renter-occupied |
| 1 Room | 0 (0.0%) | 44 (10.6%) |
| 2 or 3 Rooms | 8 (2.6%) | 98 (23.6%) |
| 4 or 5 Rooms | 81 (26.0%) | 226 (54.3%) |
| 6 or 7 Rooms | 104 (33.3%) | 32 (7.7%) |
| 8 or more Rooms | 119 (38.1%) | 16 (3.8%) |
| Total | 312 (100.0%) | 416 (100.0%) |
Housing Structure by Heating Type in Munfordville
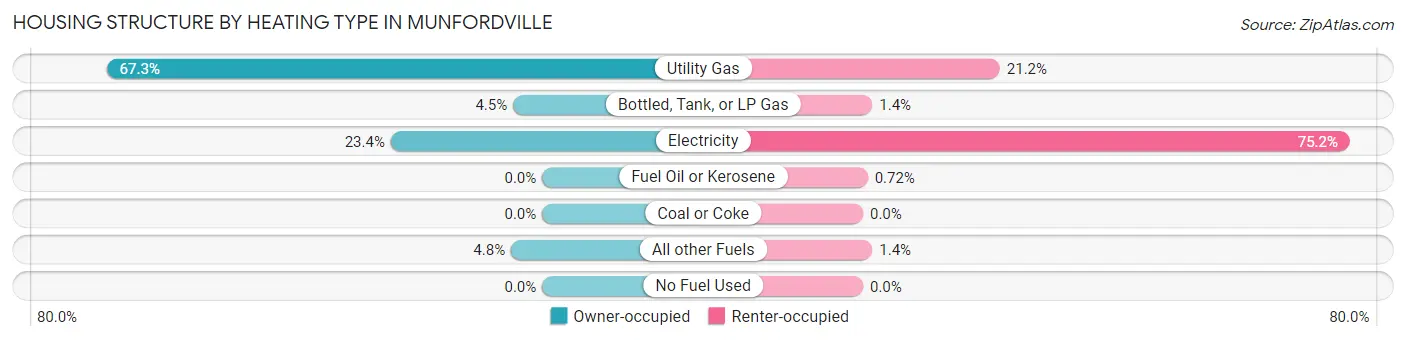
| Heating Type | Owner-occupied | Renter-occupied |
| Utility Gas | 210 (67.3%) | 88 (21.1%) |
| Bottled, Tank, or LP Gas | 14 (4.5%) | 6 (1.4%) |
| Electricity | 73 (23.4%) | 313 (75.2%) |
| Fuel Oil or Kerosene | 0 (0.0%) | 3 (0.7%) |
| Coal or Coke | 0 (0.0%) | 0 (0.0%) |
| All other Fuels | 15 (4.8%) | 6 (1.4%) |
| No Fuel Used | 0 (0.0%) | 0 (0.0%) |
| Total | 312 (100.0%) | 416 (100.0%) |
Household Vehicle Usage in Munfordville
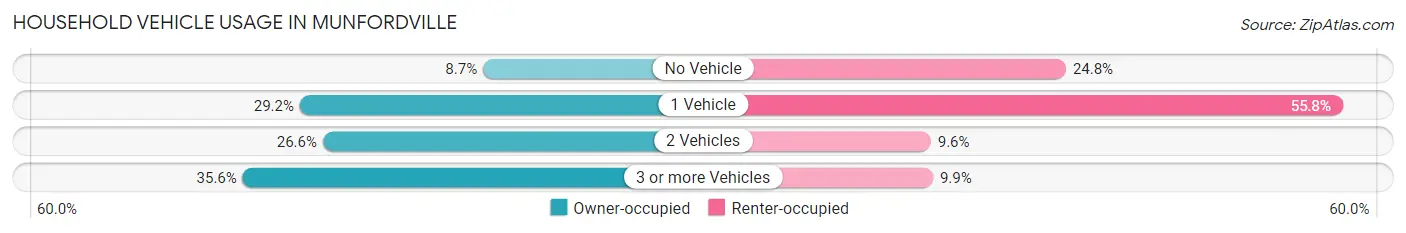
| Vehicles per Household | Owner-occupied | Renter-occupied |
| No Vehicle | 27 (8.6%) | 103 (24.8%) |
| 1 Vehicle | 91 (29.2%) | 232 (55.8%) |
| 2 Vehicles | 83 (26.6%) | 40 (9.6%) |
| 3 or more Vehicles | 111 (35.6%) | 41 (9.9%) |
| Total | 312 (100.0%) | 416 (100.0%) |
Real Estate & Mortgages in Munfordville
Real Estate and Mortgage Overview in Munfordville
| Characteristic | Without Mortgage | With Mortgage |
| Housing Units | 185 | 127 |
| Median Property Value | $87,500 | $97,400 |
| Median Household Income | $32,969 | $9 |
| Monthly Housing Costs | $318 | $3 |
| Real Estate Taxes | $567 | $0 |
Property Value by Mortgage Status in Munfordville
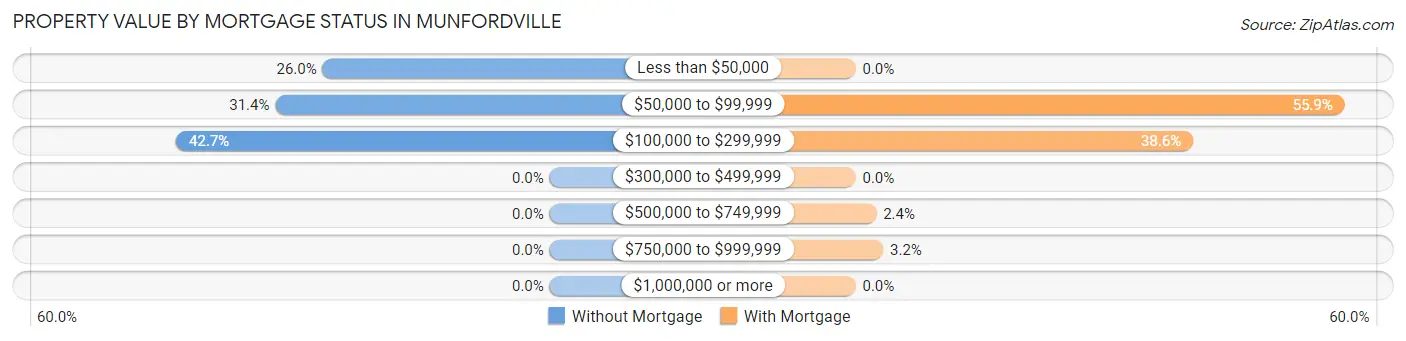
| Property Value | Without Mortgage | With Mortgage |
| Less than $50,000 | 48 (26.0%) | 0 (0.0%) |
| $50,000 to $99,999 | 58 (31.4%) | 71 (55.9%) |
| $100,000 to $299,999 | 79 (42.7%) | 49 (38.6%) |
| $300,000 to $499,999 | 0 (0.0%) | 0 (0.0%) |
| $500,000 to $749,999 | 0 (0.0%) | 3 (2.4%) |
| $750,000 to $999,999 | 0 (0.0%) | 4 (3.2%) |
| $1,000,000 or more | 0 (0.0%) | 0 (0.0%) |
| Total | 185 (100.0%) | 127 (100.0%) |
Household Income by Mortgage Status in Munfordville
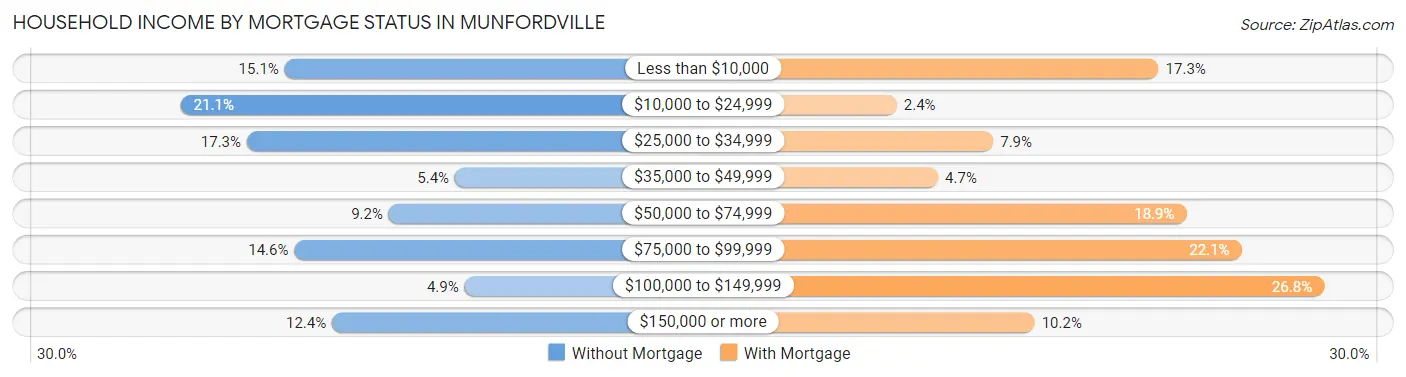
| Household Income | Without Mortgage | With Mortgage |
| Less than $10,000 | 28 (15.1%) | 22 (17.3%) |
| $10,000 to $24,999 | 39 (21.1%) | 3 (2.4%) |
| $25,000 to $34,999 | 32 (17.3%) | 10 (7.9%) |
| $35,000 to $49,999 | 10 (5.4%) | 6 (4.7%) |
| $50,000 to $74,999 | 17 (9.2%) | 24 (18.9%) |
| $75,000 to $99,999 | 27 (14.6%) | 28 (22.1%) |
| $100,000 to $149,999 | 9 (4.9%) | 34 (26.8%) |
| $150,000 or more | 23 (12.4%) | 13 (10.2%) |
| Total | 185 (100.0%) | 127 (100.0%) |
Property Value to Household Income Ratio in Munfordville
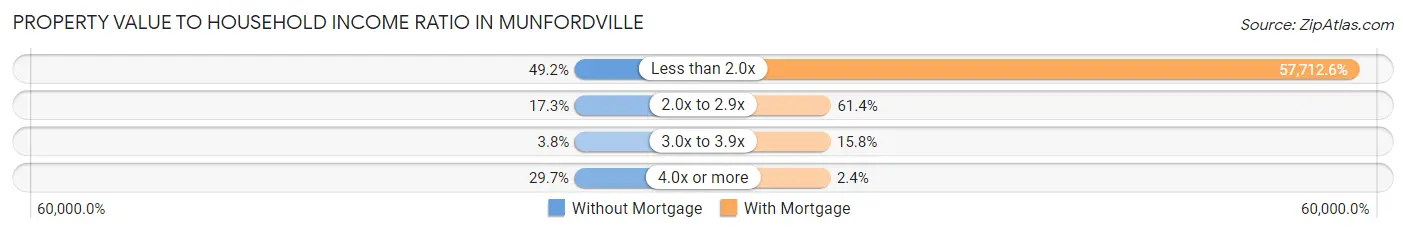
| Value-to-Income Ratio | Without Mortgage | With Mortgage |
| Less than 2.0x | 91 (49.2%) | 73,295 (57,712.6%) |
| 2.0x to 2.9x | 32 (17.3%) | 78 (61.4%) |
| 3.0x to 3.9x | 7 (3.8%) | 20 (15.8%) |
| 4.0x or more | 55 (29.7%) | 3 (2.4%) |
| Total | 185 (100.0%) | 127 (100.0%) |
Real Estate Taxes by Mortgage Status in Munfordville
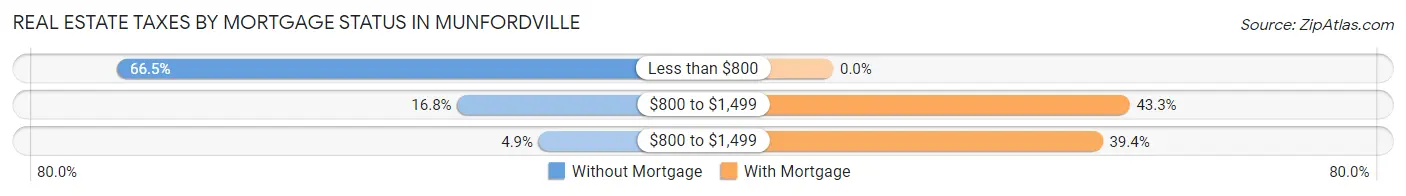
| Property Taxes | Without Mortgage | With Mortgage |
| Less than $800 | 123 (66.5%) | 0 (0.0%) |
| $800 to $1,499 | 31 (16.8%) | 55 (43.3%) |
| $800 to $1,499 | 9 (4.9%) | 50 (39.4%) |
| Total | 185 (100.0%) | 127 (100.0%) |
Health & Disability in Munfordville
Health Insurance Coverage by Age in Munfordville
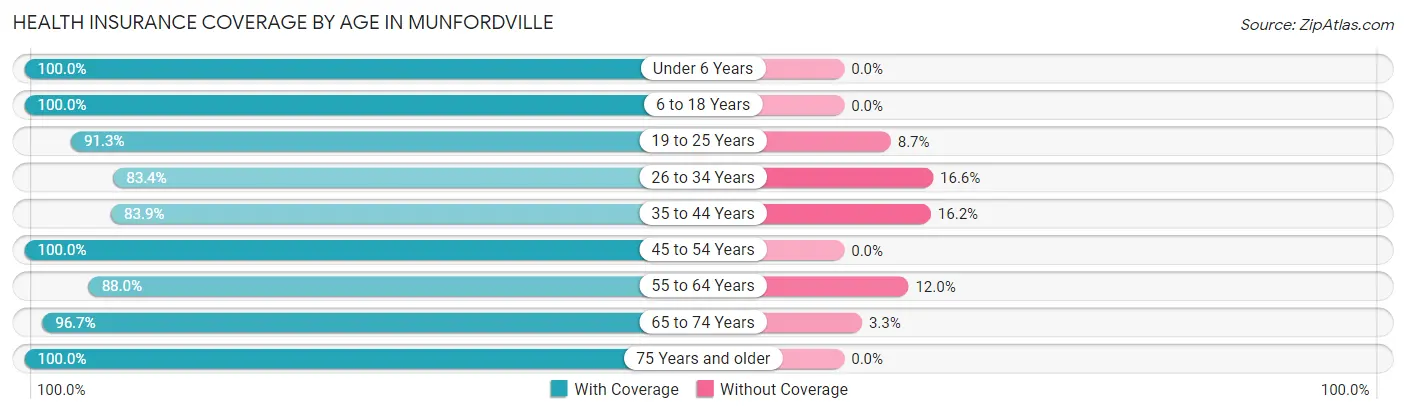
| Age Bracket | With Coverage | Without Coverage |
| Under 6 Years | 95 (100.0%) | 0 (0.0%) |
| 6 to 18 Years | 249 (100.0%) | 0 (0.0%) |
| 19 to 25 Years | 137 (91.3%) | 13 (8.7%) |
| 26 to 34 Years | 136 (83.4%) | 27 (16.6%) |
| 35 to 44 Years | 109 (83.9%) | 21 (16.2%) |
| 45 to 54 Years | 193 (100.0%) | 0 (0.0%) |
| 55 to 64 Years | 250 (88.0%) | 34 (12.0%) |
| 65 to 74 Years | 176 (96.7%) | 6 (3.3%) |
| 75 Years and older | 134 (100.0%) | 0 (0.0%) |
| Total | 1,479 (93.6%) | 101 (6.4%) |
Health Insurance Coverage by Citizenship Status in Munfordville

| Citizenship Status | With Coverage | Without Coverage |
| Native Born | 95 (100.0%) | 0 (0.0%) |
| Foreign Born, Citizen | 249 (100.0%) | 0 (0.0%) |
| Foreign Born, not a Citizen | 137 (91.3%) | 13 (8.7%) |
Health Insurance Coverage by Household Income in Munfordville
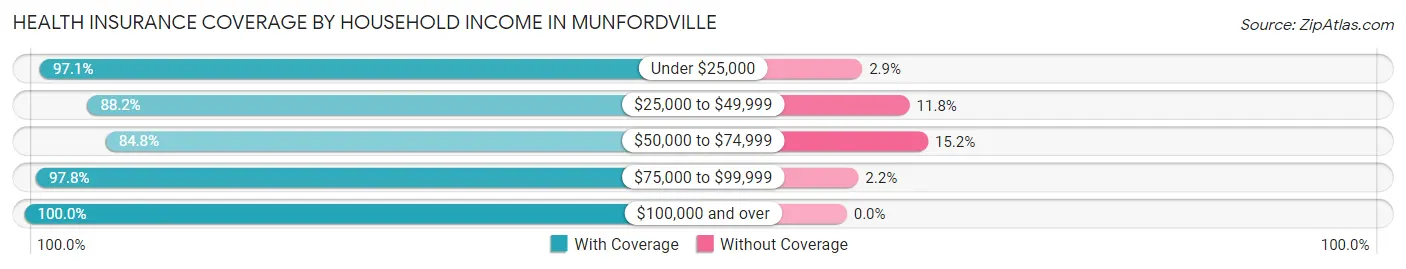
| Household Income | With Coverage | Without Coverage |
| Under $25,000 | 537 (97.1%) | 16 (2.9%) |
| $25,000 to $49,999 | 277 (88.2%) | 37 (11.8%) |
| $50,000 to $74,999 | 234 (84.8%) | 42 (15.2%) |
| $75,000 to $99,999 | 270 (97.8%) | 6 (2.2%) |
| $100,000 and over | 161 (100.0%) | 0 (0.0%) |
Public vs Private Health Insurance Coverage by Age in Munfordville
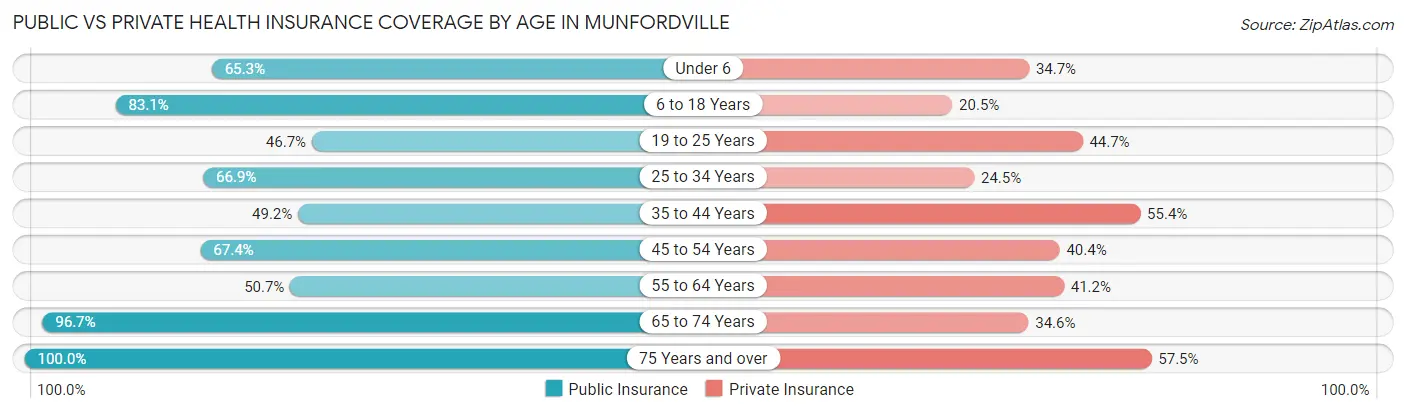
| Age Bracket | Public Insurance | Private Insurance |
| Under 6 | 62 (65.3%) | 33 (34.7%) |
| 6 to 18 Years | 207 (83.1%) | 51 (20.5%) |
| 19 to 25 Years | 70 (46.7%) | 67 (44.7%) |
| 25 to 34 Years | 109 (66.9%) | 40 (24.5%) |
| 35 to 44 Years | 64 (49.2%) | 72 (55.4%) |
| 45 to 54 Years | 130 (67.4%) | 78 (40.4%) |
| 55 to 64 Years | 144 (50.7%) | 117 (41.2%) |
| 65 to 74 Years | 176 (96.7%) | 63 (34.6%) |
| 75 Years and over | 134 (100.0%) | 77 (57.5%) |
| Total | 1,096 (69.4%) | 598 (37.9%) |
Disability Status by Sex by Age in Munfordville
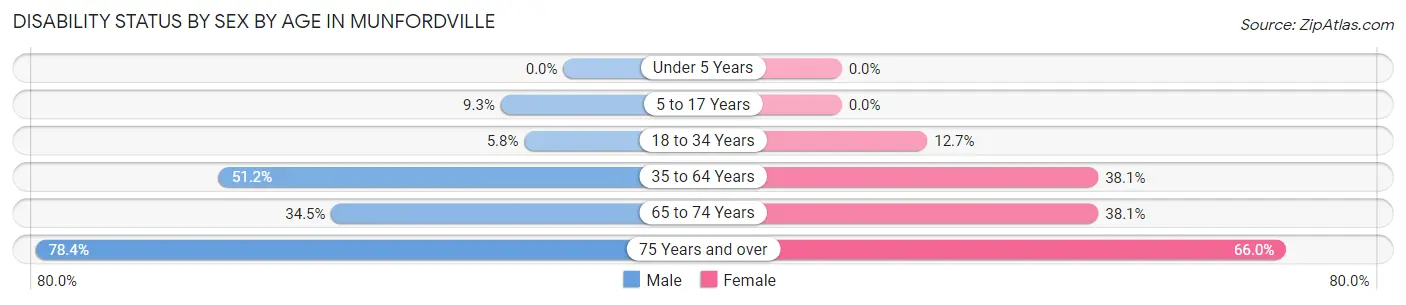
| Age Bracket | Male | Female |
| Under 5 Years | 0 (0.0%) | 0 (0.0%) |
| 5 to 17 Years | 16 (9.3%) | 0 (0.0%) |
| 18 to 34 Years | 8 (5.8%) | 24 (12.7%) |
| 35 to 64 Years | 156 (51.1%) | 115 (38.1%) |
| 65 to 74 Years | 41 (34.4%) | 24 (38.1%) |
| 75 Years and over | 29 (78.4%) | 64 (66.0%) |
Disability Class by Sex by Age in Munfordville
Disability Class: Hearing Difficulty
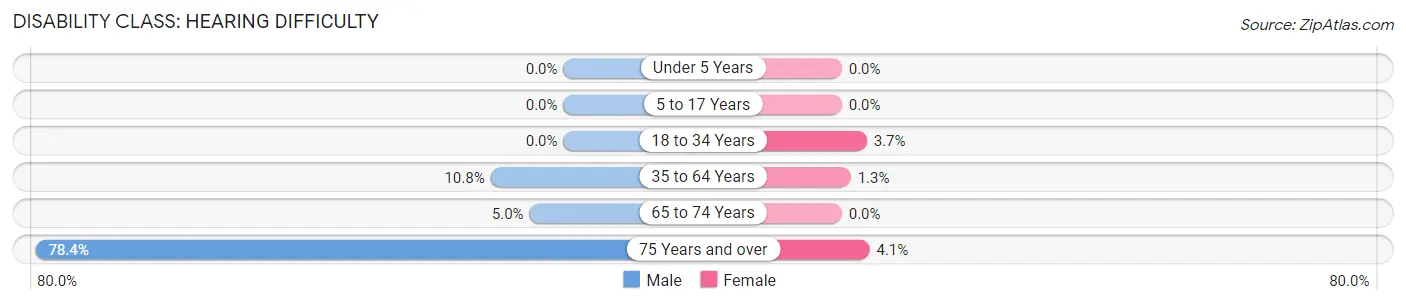
| Age Bracket | Male | Female |
| Under 5 Years | 0 (0.0%) | 0 (0.0%) |
| 5 to 17 Years | 0 (0.0%) | 0 (0.0%) |
| 18 to 34 Years | 0 (0.0%) | 7 (3.7%) |
| 35 to 64 Years | 33 (10.8%) | 4 (1.3%) |
| 65 to 74 Years | 6 (5.0%) | 0 (0.0%) |
| 75 Years and over | 29 (78.4%) | 4 (4.1%) |
Disability Class: Vision Difficulty
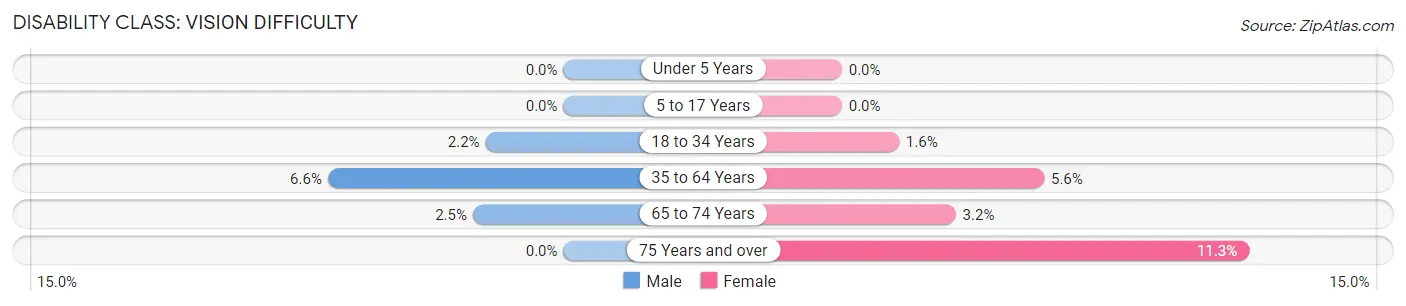
| Age Bracket | Male | Female |
| Under 5 Years | 0 (0.0%) | 0 (0.0%) |
| 5 to 17 Years | 0 (0.0%) | 0 (0.0%) |
| 18 to 34 Years | 3 (2.2%) | 3 (1.6%) |
| 35 to 64 Years | 20 (6.6%) | 17 (5.6%) |
| 65 to 74 Years | 3 (2.5%) | 2 (3.2%) |
| 75 Years and over | 0 (0.0%) | 11 (11.3%) |
Disability Class: Cognitive Difficulty
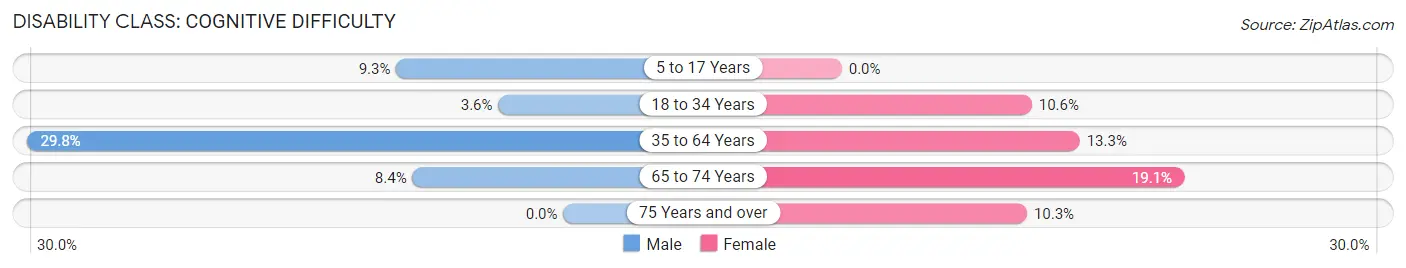
| Age Bracket | Male | Female |
| 5 to 17 Years | 16 (9.3%) | 0 (0.0%) |
| 18 to 34 Years | 5 (3.6%) | 20 (10.6%) |
| 35 to 64 Years | 91 (29.8%) | 40 (13.3%) |
| 65 to 74 Years | 10 (8.4%) | 12 (19.1%) |
| 75 Years and over | 0 (0.0%) | 10 (10.3%) |
Disability Class: Ambulatory Difficulty
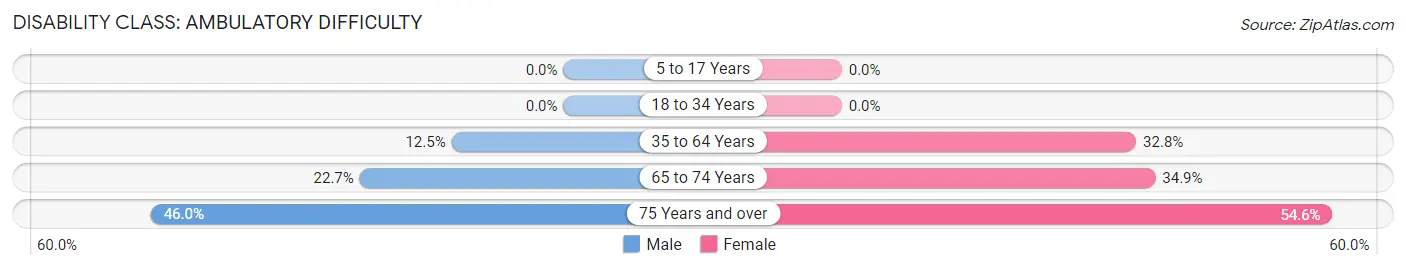
| Age Bracket | Male | Female |
| 5 to 17 Years | 0 (0.0%) | 0 (0.0%) |
| 18 to 34 Years | 0 (0.0%) | 0 (0.0%) |
| 35 to 64 Years | 38 (12.5%) | 99 (32.8%) |
| 65 to 74 Years | 27 (22.7%) | 22 (34.9%) |
| 75 Years and over | 17 (46.0%) | 53 (54.6%) |
Disability Class: Self-Care Difficulty
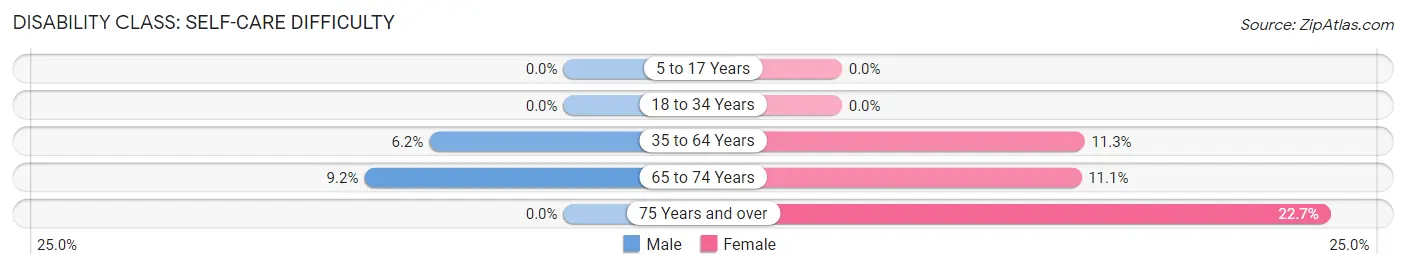
| Age Bracket | Male | Female |
| 5 to 17 Years | 0 (0.0%) | 0 (0.0%) |
| 18 to 34 Years | 0 (0.0%) | 0 (0.0%) |
| 35 to 64 Years | 19 (6.2%) | 34 (11.3%) |
| 65 to 74 Years | 11 (9.2%) | 7 (11.1%) |
| 75 Years and over | 0 (0.0%) | 22 (22.7%) |
Technology Access in Munfordville
Computing Device Access in Munfordville
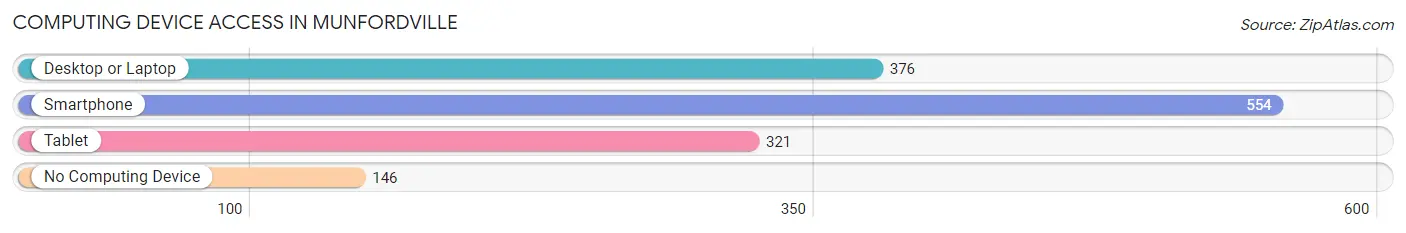
| Device Type | # Households | % Households |
| Desktop or Laptop | 376 | 51.6% |
| Smartphone | 554 | 76.1% |
| Tablet | 321 | 44.1% |
| No Computing Device | 146 | 20.1% |
| Total | 728 | 100.0% |
Internet Access in Munfordville
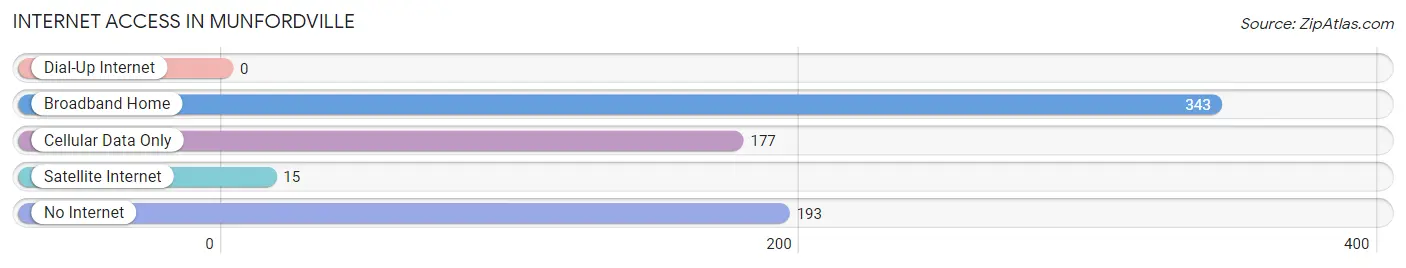
| Internet Type | # Households | % Households |
| Dial-Up Internet | 0 | 0.0% |
| Broadband Home | 343 | 47.1% |
| Cellular Data Only | 177 | 24.3% |
| Satellite Internet | 15 | 2.1% |
| No Internet | 193 | 26.5% |
| Total | 728 | 100.0% |
Munfordville Summary
Munfordville is a small town located in Hart County, Kentucky, United States. It is situated along the Green River, approximately halfway between Louisville and Nashville. The population was 1,717 at the 2010 census.
History
Munfordville was founded in 1816 by Colonel Alexander Munford, a Revolutionary War veteran. The town was named after him and was incorporated in 1820. Munfordville was the county seat of Hart County from 1819 to 1829, when it was moved to nearby Horse Cave.
Munfordville was an important stop on the Louisville and Nashville Railroad, which was completed in 1859. The town was the site of a major Civil War battle in 1862, when Confederate forces under General Braxton Bragg attempted to capture the town. The Union forces, led by General Don Carlos Buell, were able to repel the attack and the town remained in Union hands for the remainder of the war.
Geography
Munfordville is located at 37°14'45" North, 85°59'45" West (37.245833, -85.995833). According to the United States Census Bureau, the town has a total area of 1.2 square miles (3.1 km2), all land.
Economy
Munfordville's economy is largely based on agriculture and tourism. The town is home to several small businesses, including a grocery store, a hardware store, and a few restaurants. The town is also home to a number of antique stores and flea markets.
Demographics
As of the census of 2000, there were 1,717 people, 690 households, and 463 families residing in the town. The population density was 1,420.2 people per square mile (548.7/km2). There were 745 housing units at an average density of 612.2 per square mile (236.2/km2). The racial makeup of the town was 97.45% White, 0.88% African American, 0.35% Native American, 0.12% Asian, 0.12% Pacific Islander, 0.35% from other races, and 0.82% from two or more races. Hispanic or Latino of any race were 0.76% of the population.
There were 690 households, out of which 32.2% had children under the age of 18 living with them, 49.3% were married couples living together, 13.7% had a female householder with no husband present, and 32.2% were non-families. 28.3% of all households were made up of individuals, and 14.1% had someone living alone who was 65 years of age or older. The average household size was 2.48 and the average family size was 3.02.
In the town, the population was spread out, with 25.7% under the age of 18, 8.2% from 18 to 24, 28.2% from 25 to 44, 22.2% from 45 to 64, and 15.7% who were 65 years of age or older. The median age was 37 years. For every 100 females, there were 91.2 males. For every 100 females age 18 and over, there were 86.2 males.
The median income for a household in the town was $25,938, and the median income for a family was $31,250. Males had a median income of $26,250 versus $20,000 for females. The per capita income for the town was $13,945. About 15.2% of families and 18.2% of the population were below the poverty line, including 22.2% of those under age 18 and 19.2% of those age 65 or over.
Common Questions
What is Per Capita Income in Munfordville?
Per Capita income in Munfordville is $22,628.
What is the Median Family Income in Munfordville?
Median Family Income in Munfordville is $50,357.
What is the Median Household income in Munfordville?
Median Household Income in Munfordville is $26,953.
What is Income or Wage Gap in Munfordville?
Income or Wage Gap in Munfordville is 48.3%.
Women in Munfordville earn 51.7 cents for every dollar earned by a man.
What is Inequality or Gini Index in Munfordville?
Inequality or Gini Index in Munfordville is 0.57.
What is the Total Population of Munfordville?
Total Population of Munfordville is 1,746.
What is the Total Male Population of Munfordville?
Total Male Population of Munfordville is 961.
What is the Total Female Population of Munfordville?
Total Female Population of Munfordville is 785.
What is the Ratio of Males per 100 Females in Munfordville?
There are 122.42 Males per 100 Females in Munfordville.
What is the Ratio of Females per 100 Males in Munfordville?
There are 81.69 Females per 100 Males in Munfordville.
What is the Median Population Age in Munfordville?
Median Population Age in Munfordville is 41.1 Years.
What is the Average Family Size in Munfordville
Average Family Size in Munfordville is 2.8 People.
What is the Average Household Size in Munfordville
Average Household Size in Munfordville is 2.2 People.
How Large is the Labor Force in Munfordville?
There are 708 People in the Labor Forcein in Munfordville.
What is the Percentage of People in the Labor Force in Munfordville?
48.9% of People are in the Labor Force in Munfordville.
What is the Unemployment Rate in Munfordville?
Unemployment Rate in Munfordville is 4.5%.