Rolling Hills, KY Map & Demographics
Rolling Hills Map
Rolling Hills Overview
$49,691
PER CAPITA INCOME
$99,375
AVG FAMILY INCOME
$99,792
AVG HOUSEHOLD INCOME
3.3%
WAGE / INCOME GAP [ % ]
96.7¢/ $1
WAGE / INCOME GAP [ $ ]
$5,983
FAMILY INCOME DEFICIT
0.35
INEQUALITY / GINI INDEX
1,001
TOTAL POPULATION
551
MALE POPULATION
450
FEMALE POPULATION
122.44
MALES / 100 FEMALES
81.67
FEMALES / 100 MALES
37.5
MEDIAN AGE
2.9
AVG FAMILY SIZE
2.3
AVG HOUSEHOLD SIZE
621
LABOR FORCE [ PEOPLE ]
73.8%
PERCENT IN LABOR FORCE
3.4%
UNEMPLOYMENT RATE
Rolling Hills Area Codes
Income in Rolling Hills
Income Overview in Rolling Hills
Per Capita Income in Rolling Hills is $49,691, while median incomes of families and households are $99,375 and $99,792 respectively.
| Characteristic | Number | Measure |
| Per Capita Income | 1,001 | $49,691 |
| Median Family Income | 265 | $99,375 |
| Mean Family Income | 265 | $102,433 |
| Median Household Income | 441 | $99,792 |
| Mean Household Income | 441 | $112,467 |
| Income Deficit | 265 | $5,983 |
| Wage / Income Gap (%) | 1,001 | 3.29% |
| Wage / Income Gap ($) | 1,001 | 96.71¢ per $1 |
| Gini / Inequality Index | 1,001 | 0.35 |
Earnings by Sex in Rolling Hills
Average Earnings in Rolling Hills are $43,947, $43,250 for men and $44,722 for women, a difference of 3.3%.
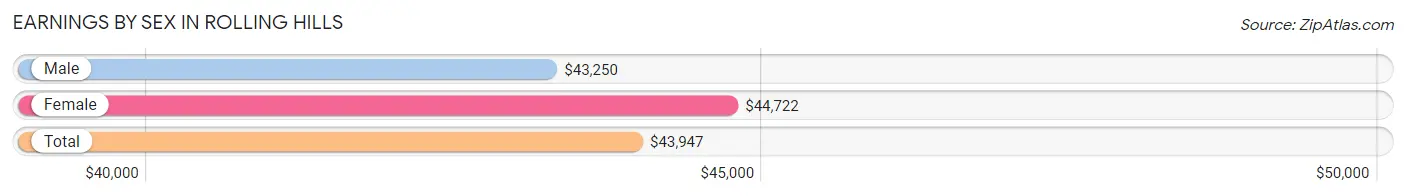
| Sex | Number | Average Earnings |
| Male | 396 (62.7%) | $43,250 |
| Female | 236 (37.3%) | $44,722 |
| Total | 632 (100.0%) | $43,947 |
Earnings by Sex by Income Bracket in Rolling Hills
The most common earnings brackets in Rolling Hills are $100,000+ for men (101 | 25.5%) and $100,000+ for women (36 | 15.2%).
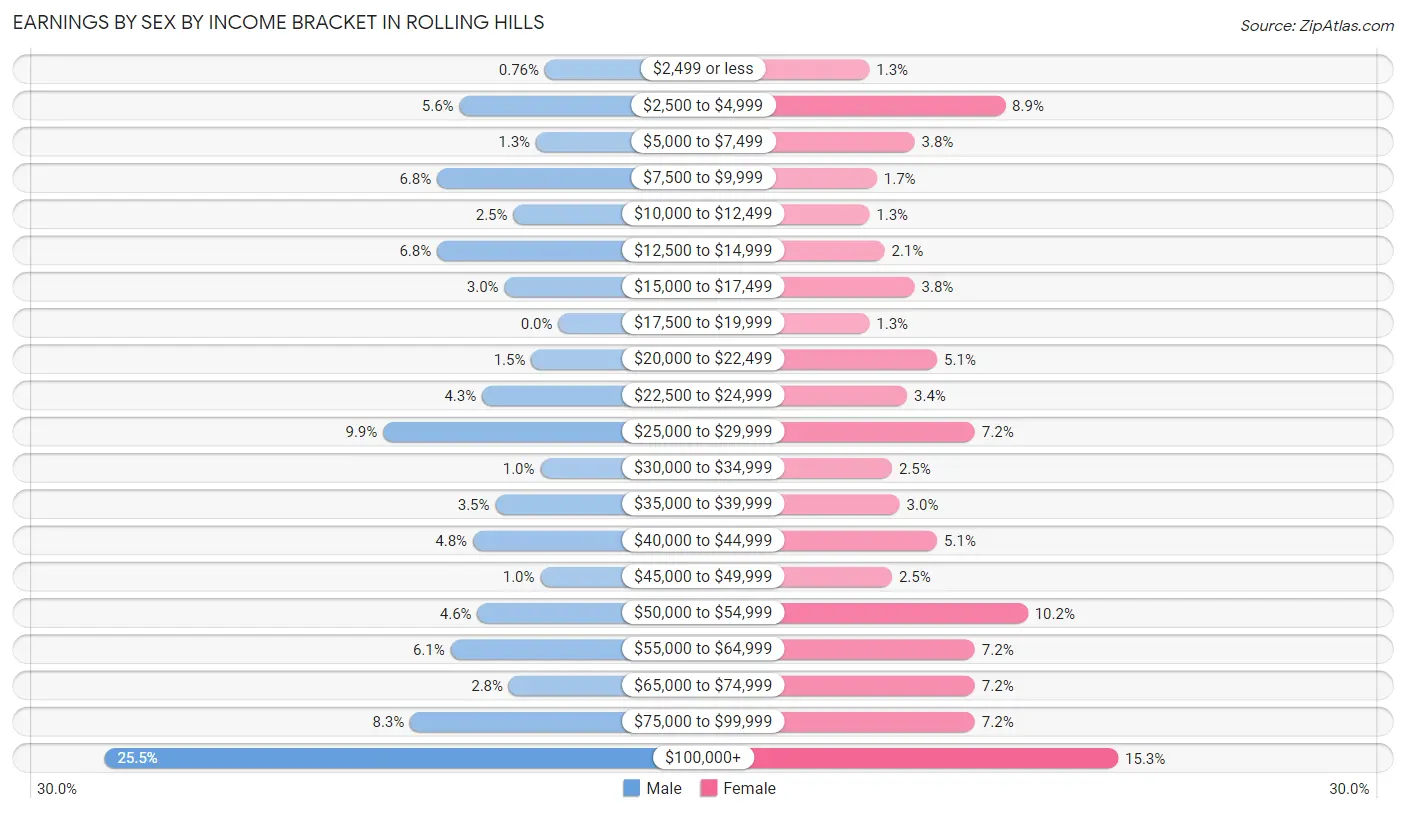
| Income | Male | Female |
| $2,499 or less | 3 (0.8%) | 3 (1.3%) |
| $2,500 to $4,999 | 22 (5.6%) | 21 (8.9%) |
| $5,000 to $7,499 | 5 (1.3%) | 9 (3.8%) |
| $7,500 to $9,999 | 27 (6.8%) | 4 (1.7%) |
| $10,000 to $12,499 | 10 (2.5%) | 3 (1.3%) |
| $12,500 to $14,999 | 27 (6.8%) | 5 (2.1%) |
| $15,000 to $17,499 | 12 (3.0%) | 9 (3.8%) |
| $17,500 to $19,999 | 0 (0.0%) | 3 (1.3%) |
| $20,000 to $22,499 | 6 (1.5%) | 12 (5.1%) |
| $22,500 to $24,999 | 17 (4.3%) | 8 (3.4%) |
| $25,000 to $29,999 | 39 (9.9%) | 17 (7.2%) |
| $30,000 to $34,999 | 4 (1.0%) | 6 (2.5%) |
| $35,000 to $39,999 | 14 (3.5%) | 7 (3.0%) |
| $40,000 to $44,999 | 19 (4.8%) | 12 (5.1%) |
| $45,000 to $49,999 | 4 (1.0%) | 6 (2.5%) |
| $50,000 to $54,999 | 18 (4.5%) | 24 (10.2%) |
| $55,000 to $64,999 | 24 (6.1%) | 17 (7.2%) |
| $65,000 to $74,999 | 11 (2.8%) | 17 (7.2%) |
| $75,000 to $99,999 | 33 (8.3%) | 17 (7.2%) |
| $100,000+ | 101 (25.5%) | 36 (15.2%) |
| Total | 396 (100.0%) | 236 (100.0%) |
Earnings by Sex by Educational Attainment in Rolling Hills
Average earnings in Rolling Hills are $53,000 for men and $49,167 for women, a difference of 7.2%. Men with an educational attainment of graduate degree enjoy the highest average annual earnings of $45,625, while those with high school diploma education earn the least with $23,000. Women with an educational attainment of graduate degree earn the most with the average annual earnings of $53,500, while those with high school diploma education have the smallest earnings of $20,833.
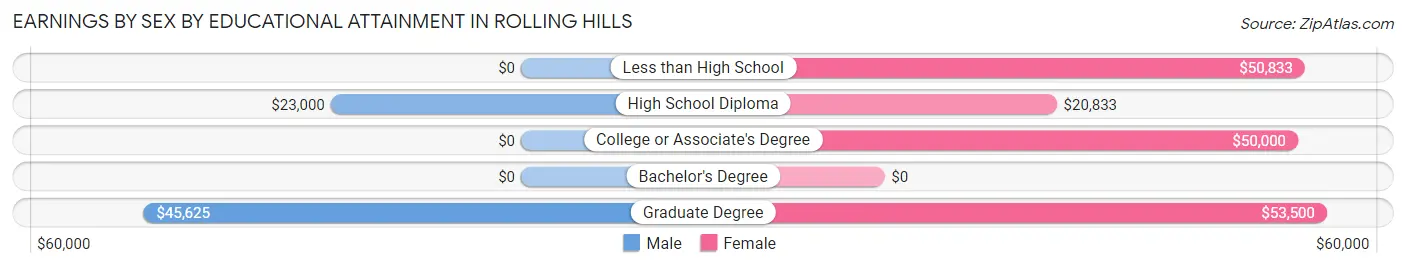
| Educational Attainment | Male Income | Female Income |
| Less than High School | - | - |
| High School Diploma | $23,000 | $20,833 |
| College or Associate's Degree | - | - |
| Bachelor's Degree | - | - |
| Graduate Degree | $45,625 | $53,500 |
| Total | $53,000 | $49,167 |
Family Income in Rolling Hills
Family Income Brackets in Rolling Hills
According to the Rolling Hills family income data, there are 84 families falling into the $100,000 to $149,999 income range, which is the most common income bracket and makes up 31.7% of all families. Conversely, the $10,000 to $14,999 income bracket is the least frequent group with only 3 families (1.1%) belonging to this category.
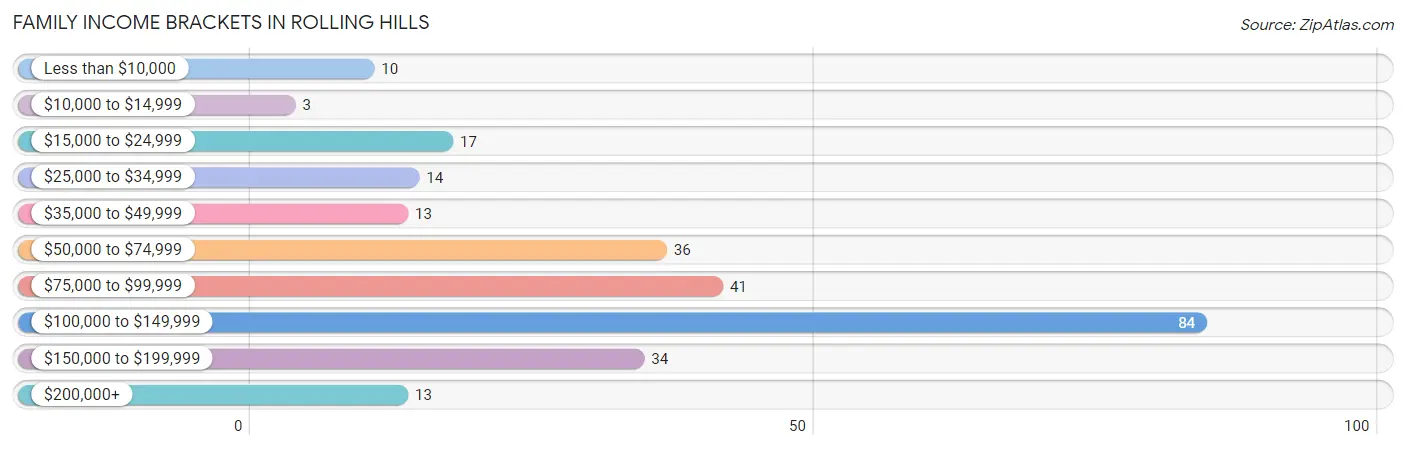
| Income Bracket | # Families | % Families |
| Less than $10,000 | 10 | 3.8% |
| $10,000 to $14,999 | 3 | 1.1% |
| $15,000 to $24,999 | 17 | 6.4% |
| $25,000 to $34,999 | 14 | 5.3% |
| $35,000 to $49,999 | 13 | 4.9% |
| $50,000 to $74,999 | 36 | 13.6% |
| $75,000 to $99,999 | 41 | 15.5% |
| $100,000 to $149,999 | 84 | 31.7% |
| $150,000 to $199,999 | 34 | 12.8% |
| $200,000+ | 13 | 4.9% |
Family Income by Famaliy Size in Rolling Hills
3-person families (83 | 31.3%) account for the highest median family income in Rolling Hills with $140,602 per family, while 3-person families (83 | 31.3%) have the highest median income of $46,867 per family member.
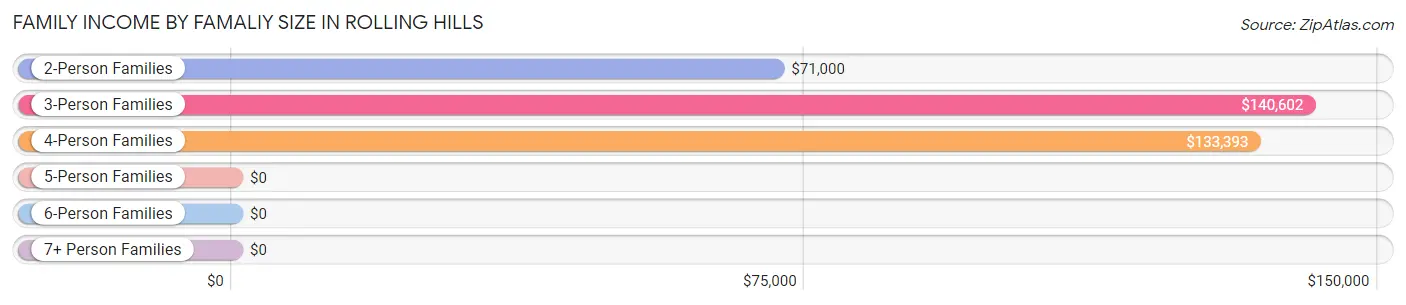
| Income Bracket | # Families | Median Income |
| 2-Person Families | 134 (50.6%) | $71,000 |
| 3-Person Families | 83 (31.3%) | $140,602 |
| 4-Person Families | 33 (12.4%) | $133,393 |
| 5-Person Families | 4 (1.5%) | $0 |
| 6-Person Families | 6 (2.3%) | $0 |
| 7+ Person Families | 5 (1.9%) | $0 |
| Total | 265 (100.0%) | $99,375 |
Family Income by Number of Earners in Rolling Hills
The median family income in Rolling Hills is $99,375, with families comprising 3+ earners (17) having the highest median family income of $133,250, while families with no earners (31) have the lowest median family income of $69,375, accounting for 6.4% and 11.7% of families, respectively.
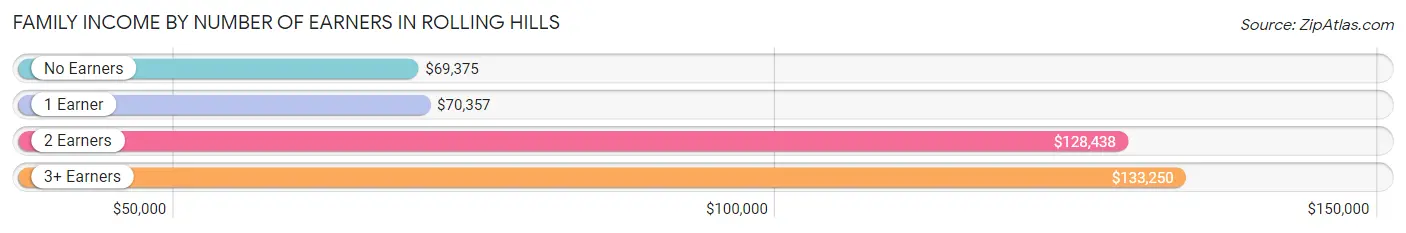
| Number of Earners | # Families | Median Income |
| No Earners | 31 (11.7%) | $69,375 |
| 1 Earner | 60 (22.6%) | $70,357 |
| 2 Earners | 157 (59.3%) | $128,438 |
| 3+ Earners | 17 (6.4%) | $133,250 |
| Total | 265 (100.0%) | $99,375 |
Household Income in Rolling Hills
Household Income Brackets in Rolling Hills
With 97 households falling in the category, the $100,000 to $149,999 income range is the most frequent in Rolling Hills, accounting for 22.0% of all households. In contrast, only 5 households (1.1%) fall into the $10,000 to $14,999 income bracket, making it the least populous group.
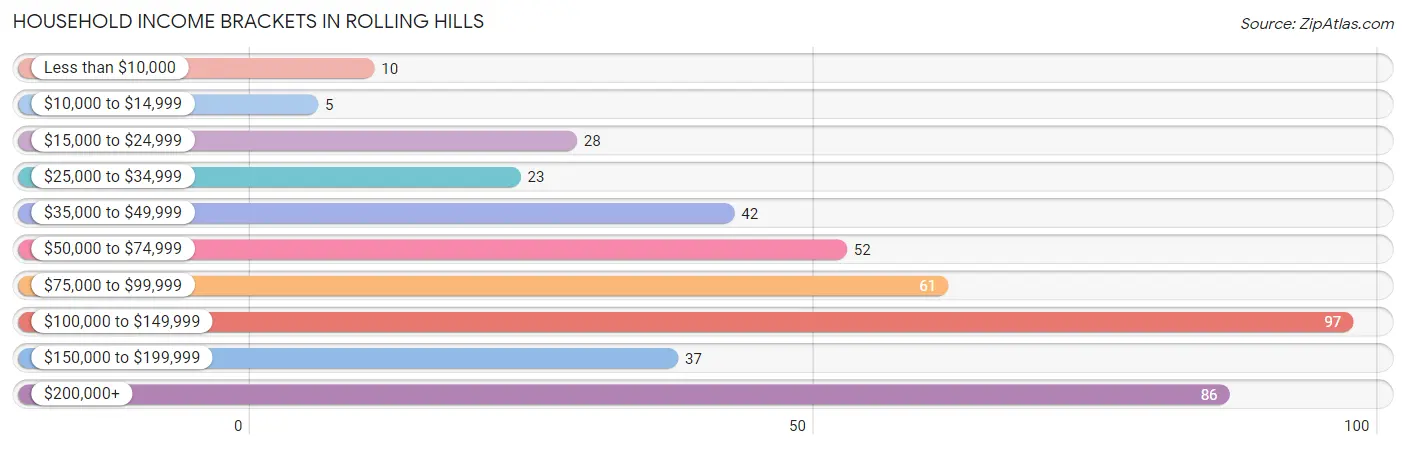
| Income Bracket | # Households | % Households |
| Less than $10,000 | 10 | 2.3% |
| $10,000 to $14,999 | 5 | 1.1% |
| $15,000 to $24,999 | 28 | 6.3% |
| $25,000 to $34,999 | 23 | 5.2% |
| $35,000 to $49,999 | 42 | 9.5% |
| $50,000 to $74,999 | 52 | 11.8% |
| $75,000 to $99,999 | 61 | 13.8% |
| $100,000 to $149,999 | 97 | 22.0% |
| $150,000 to $199,999 | 37 | 8.4% |
| $200,000+ | 86 | 19.5% |
Household Income by Householder Age in Rolling Hills
The median household income in Rolling Hills is $99,792, with the highest median household income of $165,833 found in the 25 to 44 years age bracket for the primary householder. A total of 190 households (43.1%) fall into this category. Meanwhile, the 15 to 24 years age bracket for the primary householder has the lowest median household income of $0, with 22 households (5.0%) in this group.
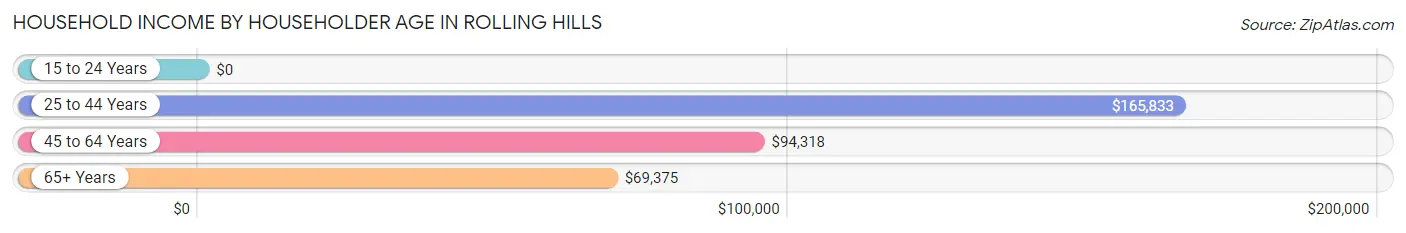
| Income Bracket | # Households | Median Income |
| 15 to 24 Years | 22 (5.0%) | $0 |
| 25 to 44 Years | 190 (43.1%) | $165,833 |
| 45 to 64 Years | 122 (27.7%) | $94,318 |
| 65+ Years | 107 (24.3%) | $69,375 |
| Total | 441 (100.0%) | $99,792 |
Poverty in Rolling Hills
Income Below Poverty by Sex and Age in Rolling Hills
With 8.5% poverty level for males and 9.6% for females among the residents of Rolling Hills, 18 to 24 year old males and under 5 year old females are the most vulnerable to poverty, with 33 males (63.5%) and 15 females (60.0%) in their respective age groups living below the poverty level.
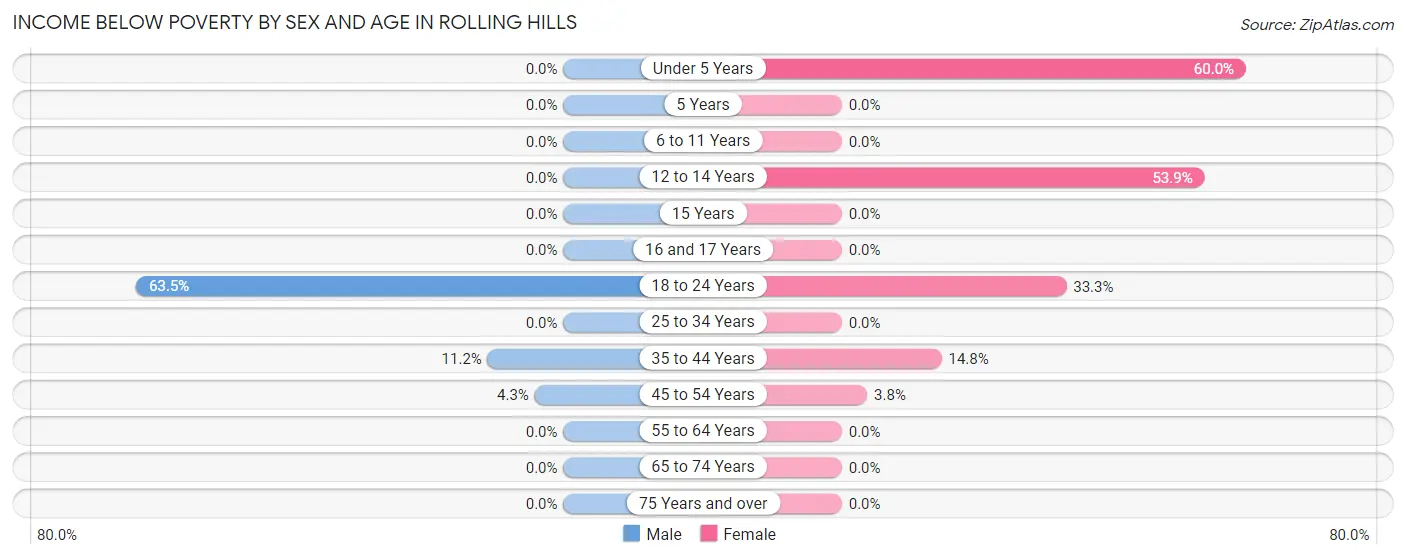
| Age Bracket | Male | Female |
| Under 5 Years | 0 (0.0%) | 15 (60.0%) |
| 5 Years | 0 (0.0%) | 0 (0.0%) |
| 6 to 11 Years | 0 (0.0%) | 0 (0.0%) |
| 12 to 14 Years | 0 (0.0%) | 7 (53.8%) |
| 15 Years | 0 (0.0%) | 0 (0.0%) |
| 16 and 17 Years | 0 (0.0%) | 0 (0.0%) |
| 18 to 24 Years | 33 (63.5%) | 7 (33.3%) |
| 25 to 34 Years | 0 (0.0%) | 0 (0.0%) |
| 35 to 44 Years | 10 (11.2%) | 12 (14.8%) |
| 45 to 54 Years | 4 (4.3%) | 2 (3.8%) |
| 55 to 64 Years | 0 (0.0%) | 0 (0.0%) |
| 65 to 74 Years | 0 (0.0%) | 0 (0.0%) |
| 75 Years and over | 0 (0.0%) | 0 (0.0%) |
| Total | 47 (8.5%) | 43 (9.6%) |
Income Above Poverty by Sex and Age in Rolling Hills
According to the poverty statistics in Rolling Hills, males aged under 5 years and females aged 5 years are the age groups that are most secure financially, with 100.0% of males and 100.0% of females in these age groups living above the poverty line.
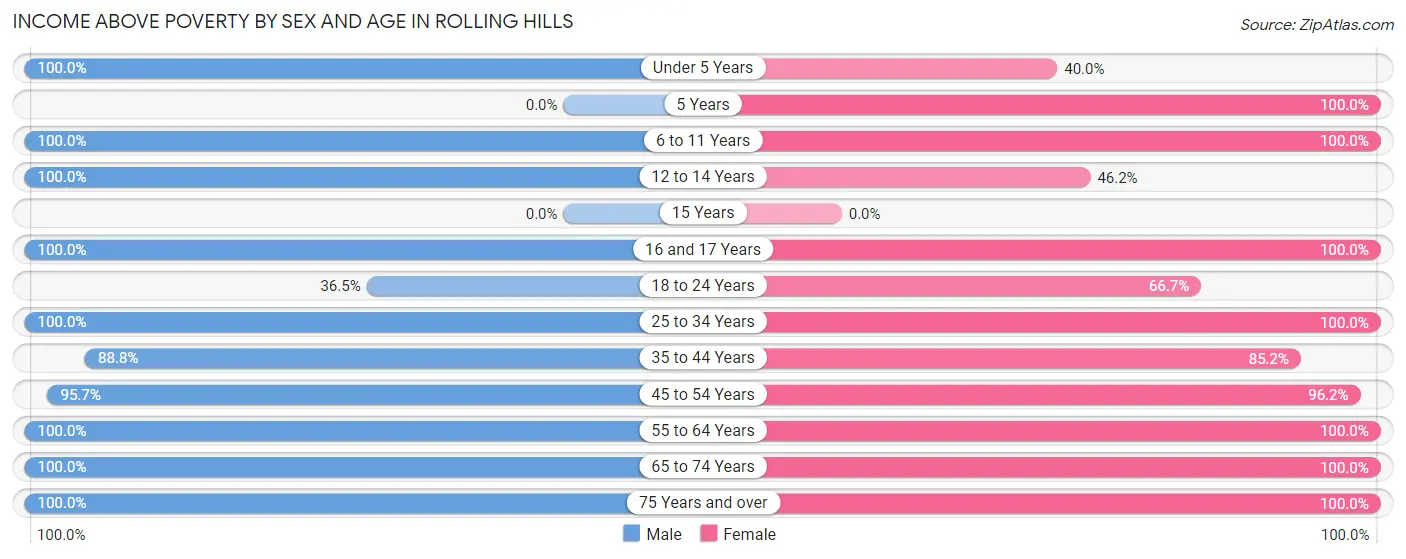
| Age Bracket | Male | Female |
| Under 5 Years | 11 (100.0%) | 10 (40.0%) |
| 5 Years | 0 (0.0%) | 3 (100.0%) |
| 6 to 11 Years | 33 (100.0%) | 64 (100.0%) |
| 12 to 14 Years | 11 (100.0%) | 6 (46.2%) |
| 15 Years | 0 (0.0%) | 0 (0.0%) |
| 16 and 17 Years | 15 (100.0%) | 9 (100.0%) |
| 18 to 24 Years | 19 (36.5%) | 14 (66.7%) |
| 25 to 34 Years | 133 (100.0%) | 67 (100.0%) |
| 35 to 44 Years | 79 (88.8%) | 69 (85.2%) |
| 45 to 54 Years | 90 (95.7%) | 51 (96.2%) |
| 55 to 64 Years | 37 (100.0%) | 25 (100.0%) |
| 65 to 74 Years | 44 (100.0%) | 50 (100.0%) |
| 75 Years and over | 32 (100.0%) | 39 (100.0%) |
| Total | 504 (91.5%) | 407 (90.4%) |
Income Below Poverty Among Married-Couple Families in Rolling Hills
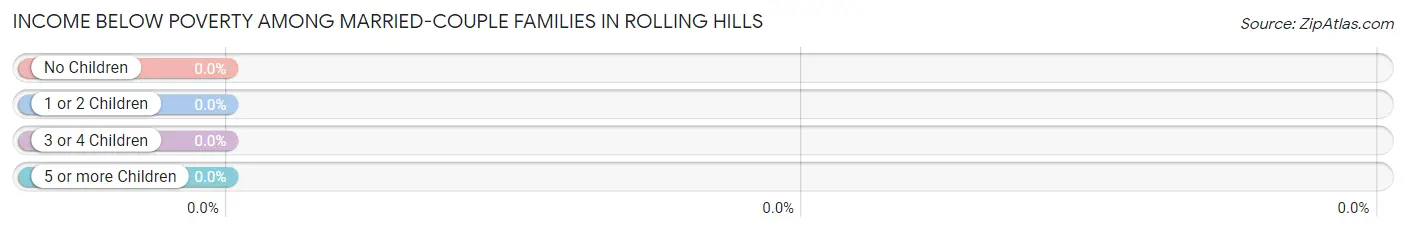
| Children | Above Poverty | Below Poverty |
| No Children | 114 (100.0%) | 0 (0.0%) |
| 1 or 2 Children | 79 (100.0%) | 0 (0.0%) |
| 3 or 4 Children | 0 (0.0%) | 0 (0.0%) |
| 5 or more Children | 5 (100.0%) | 0 (0.0%) |
| Total | 198 (100.0%) | 0 (0.0%) |
Income Below Poverty Among Single-Parent Households in Rolling Hills
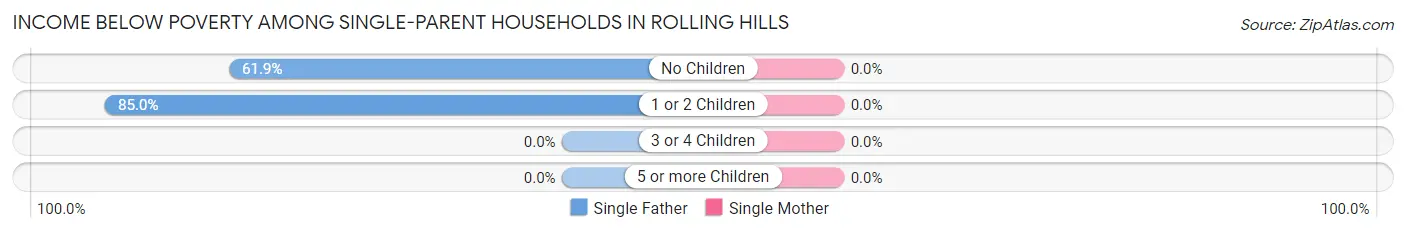
| Children | Single Father | Single Mother |
| No Children | 13 (61.9%) | 0 (0.0%) |
| 1 or 2 Children | 17 (85.0%) | 0 (0.0%) |
| 3 or 4 Children | 0 (0.0%) | 0 (0.0%) |
| 5 or more Children | 0 (0.0%) | 0 (0.0%) |
| Total | 30 (73.2%) | 0 (0.0%) |
Income Below Poverty Among Married-Couple vs Single-Parent Households in Rolling Hills
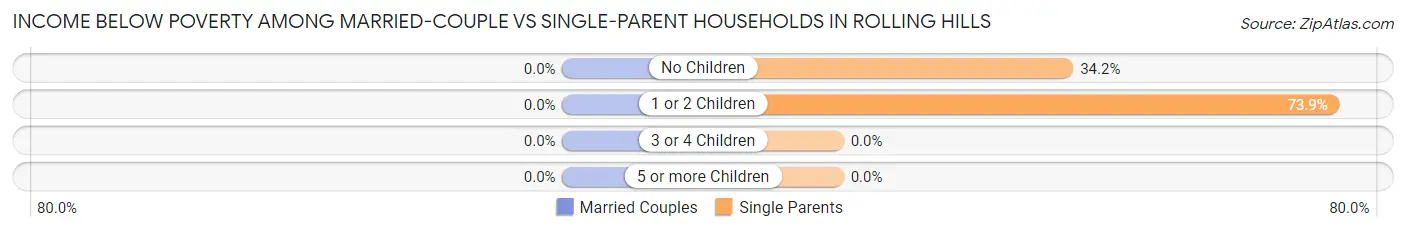
| Children | Married-Couple Families | Single-Parent Households |
| No Children | 0 (0.0%) | 13 (34.2%) |
| 1 or 2 Children | 0 (0.0%) | 17 (73.9%) |
| 3 or 4 Children | 0 (0.0%) | 0 (0.0%) |
| 5 or more Children | 0 (0.0%) | 0 (0.0%) |
| Total | 0 (0.0%) | 30 (44.8%) |
Race in Rolling Hills
The most populous races in Rolling Hills are White / Caucasian (773 | 77.2%), Black / African American (121 | 12.1%), and Hispanic or Latino (59 | 5.9%).
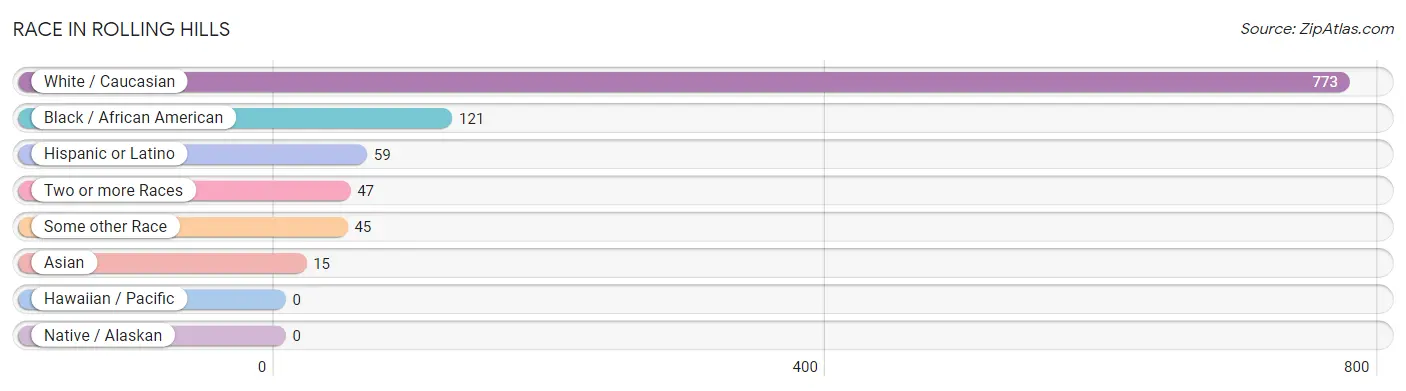
| Race | # Population | % Population |
| Asian | 15 | 1.5% |
| Black / African American | 121 | 12.1% |
| Hawaiian / Pacific | 0 | 0.0% |
| Hispanic or Latino | 59 | 5.9% |
| Native / Alaskan | 0 | 0.0% |
| White / Caucasian | 773 | 77.2% |
| Two or more Races | 47 | 4.7% |
| Some other Race | 45 | 4.5% |
| Total | 1,001 | 100.0% |
Ancestry in Rolling Hills
The most populous ancestries reported in Rolling Hills are German (203 | 20.3%), English (187 | 18.7%), Irish (129 | 12.9%), American (83 | 8.3%), and Peruvian (27 | 2.7%), together accounting for 62.8% of all Rolling Hills residents.
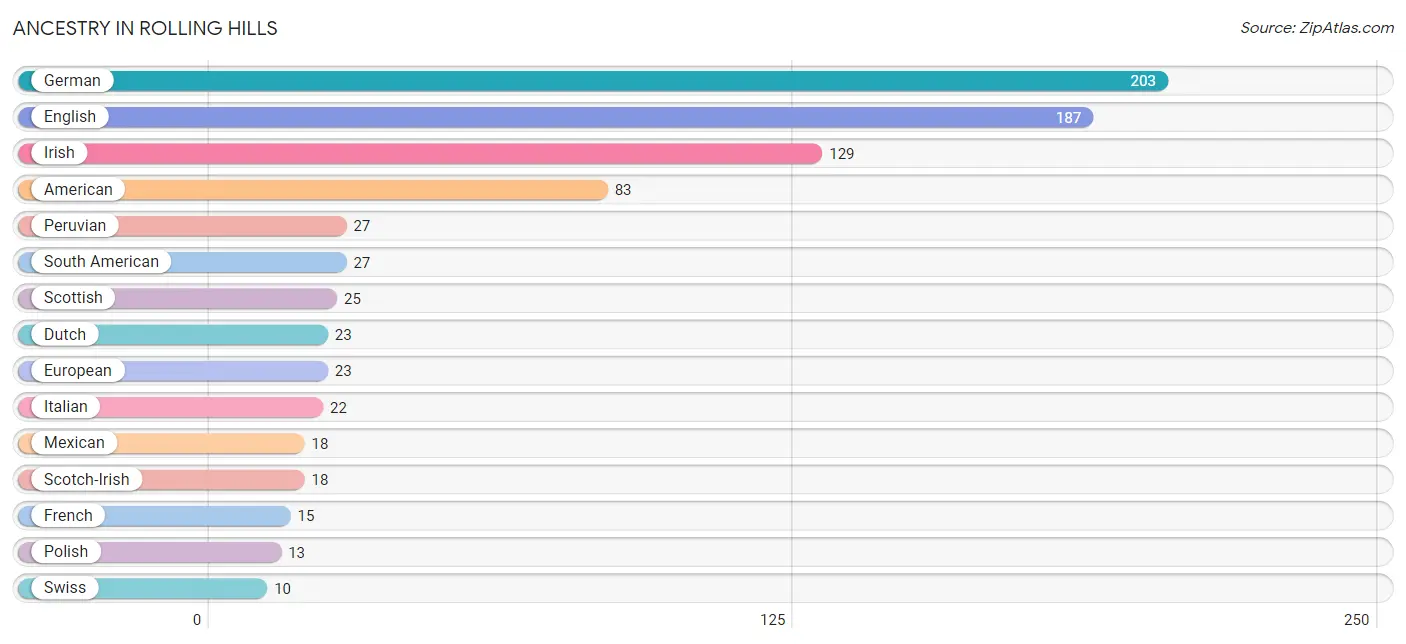
| Ancestry | # Population | % Population |
| American | 83 | 8.3% |
| Arab | 2 | 0.2% |
| British | 5 | 0.5% |
| Creek | 6 | 0.6% |
| Danish | 3 | 0.3% |
| Dutch | 23 | 2.3% |
| English | 187 | 18.7% |
| European | 23 | 2.3% |
| French | 15 | 1.5% |
| German | 203 | 20.3% |
| Indian (Asian) | 7 | 0.7% |
| Irish | 129 | 12.9% |
| Italian | 22 | 2.2% |
| Korean | 3 | 0.3% |
| Lebanese | 2 | 0.2% |
| Lithuanian | 3 | 0.3% |
| Mexican | 18 | 1.8% |
| Peruvian | 27 | 2.7% |
| Polish | 13 | 1.3% |
| Russian | 2 | 0.2% |
| Scotch-Irish | 18 | 1.8% |
| Scottish | 25 | 2.5% |
| South American | 27 | 2.7% |
| Swedish | 4 | 0.4% |
| Swiss | 10 | 1.0% |
| Welsh | 10 | 1.0% | View All 26 Rows |
Immigrants in Rolling Hills
The most numerous immigrant groups reported in Rolling Hills came from Latin America (48 | 4.8%), Peru (27 | 2.7%), South America (27 | 2.7%), Central America (21 | 2.1%), and Asia (12 | 1.2%), together accounting for 13.5% of all Rolling Hills residents.
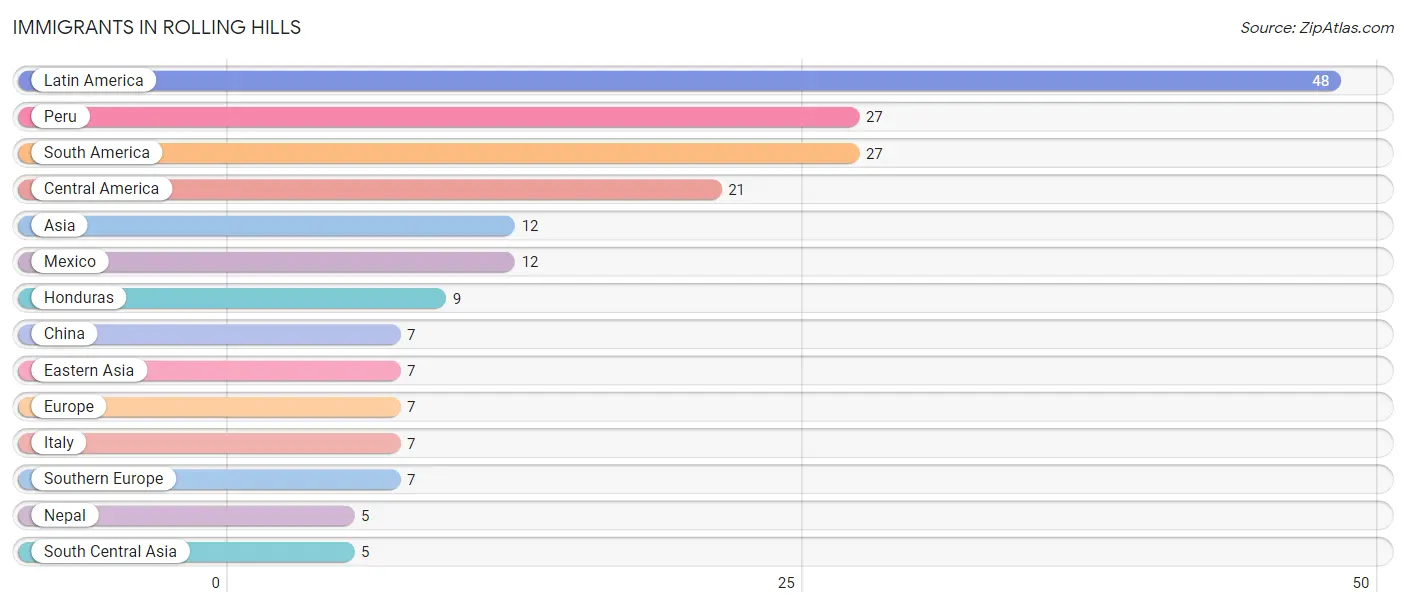
| Immigration Origin | # Population | % Population |
| Asia | 12 | 1.2% |
| Central America | 21 | 2.1% |
| China | 7 | 0.7% |
| Eastern Asia | 7 | 0.7% |
| Europe | 7 | 0.7% |
| Honduras | 9 | 0.9% |
| Italy | 7 | 0.7% |
| Latin America | 48 | 4.8% |
| Mexico | 12 | 1.2% |
| Nepal | 5 | 0.5% |
| Peru | 27 | 2.7% |
| South America | 27 | 2.7% |
| South Central Asia | 5 | 0.5% |
| Southern Europe | 7 | 0.7% | View All 14 Rows |
Sex and Age in Rolling Hills
Sex and Age in Rolling Hills
The most populous age groups in Rolling Hills are 25 to 29 Years (116 | 21.0%) for men and 5 to 9 Years (58 | 12.9%) for women.
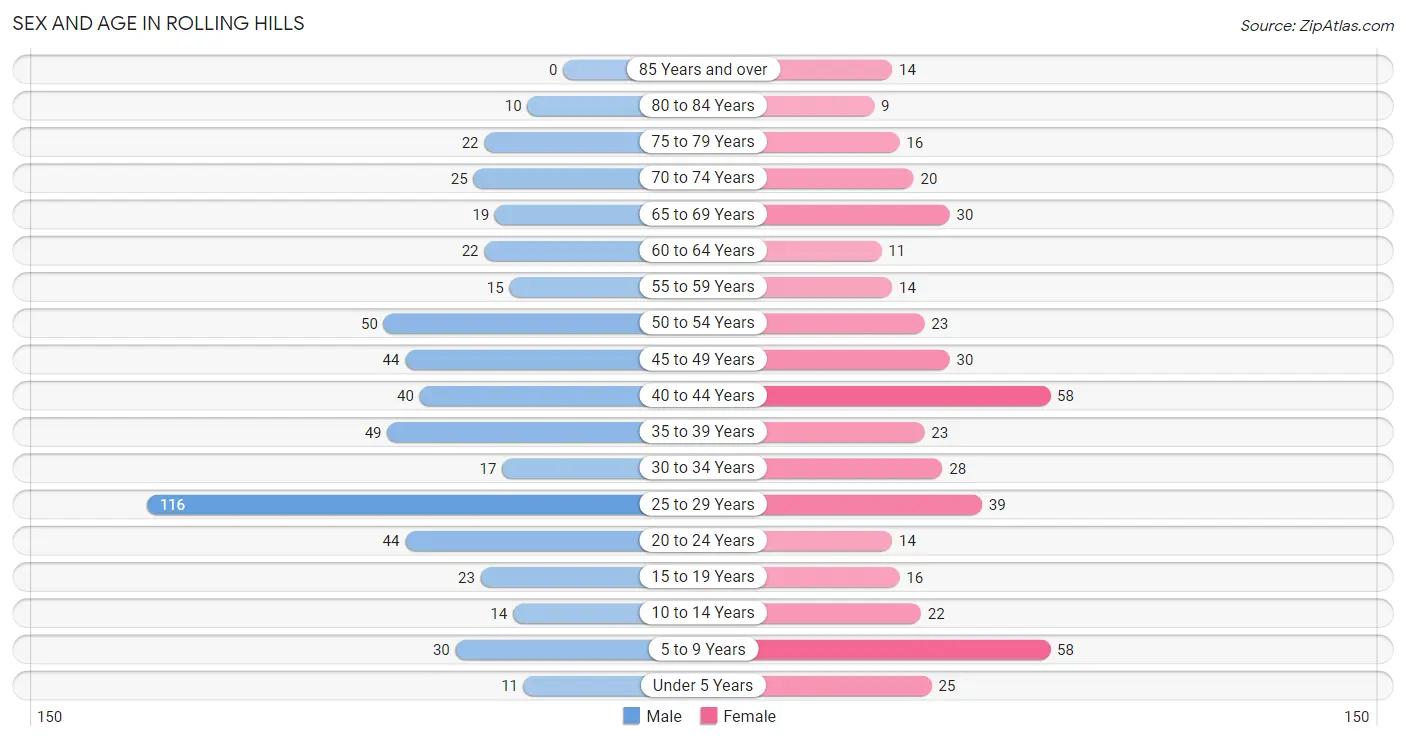
| Age Bracket | Male | Female |
| Under 5 Years | 11 (2.0%) | 25 (5.6%) |
| 5 to 9 Years | 30 (5.4%) | 58 (12.9%) |
| 10 to 14 Years | 14 (2.5%) | 22 (4.9%) |
| 15 to 19 Years | 23 (4.2%) | 16 (3.6%) |
| 20 to 24 Years | 44 (8.0%) | 14 (3.1%) |
| 25 to 29 Years | 116 (21.0%) | 39 (8.7%) |
| 30 to 34 Years | 17 (3.1%) | 28 (6.2%) |
| 35 to 39 Years | 49 (8.9%) | 23 (5.1%) |
| 40 to 44 Years | 40 (7.3%) | 58 (12.9%) |
| 45 to 49 Years | 44 (8.0%) | 30 (6.7%) |
| 50 to 54 Years | 50 (9.1%) | 23 (5.1%) |
| 55 to 59 Years | 15 (2.7%) | 14 (3.1%) |
| 60 to 64 Years | 22 (4.0%) | 11 (2.4%) |
| 65 to 69 Years | 19 (3.5%) | 30 (6.7%) |
| 70 to 74 Years | 25 (4.5%) | 20 (4.4%) |
| 75 to 79 Years | 22 (4.0%) | 16 (3.6%) |
| 80 to 84 Years | 10 (1.8%) | 9 (2.0%) |
| 85 Years and over | 0 (0.0%) | 14 (3.1%) |
| Total | 551 (100.0%) | 450 (100.0%) |
Families and Households in Rolling Hills
Median Family Size in Rolling Hills
The median family size in Rolling Hills is 2.92 persons per family, with single female/mother families (26 | 9.8%) accounting for the largest median family size of 3.27 persons per family. On the other hand, single male/father families (41 | 15.5%) represent the smallest median family size with 2.78 persons per family.
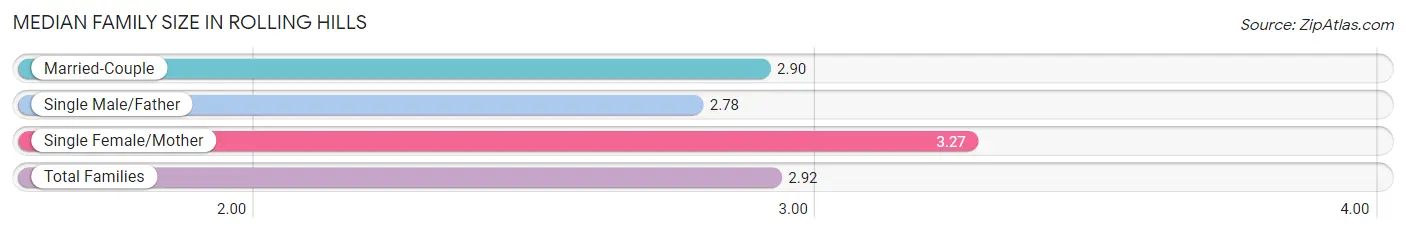
| Family Type | # Families | Family Size |
| Married-Couple | 198 (74.7%) | 2.90 |
| Single Male/Father | 41 (15.5%) | 2.78 |
| Single Female/Mother | 26 (9.8%) | 3.27 |
| Total Families | 265 (100.0%) | 2.92 |
Median Household Size in Rolling Hills
The median household size in Rolling Hills is 2.27 persons per household, with single female/mother households (26 | 5.9%) accounting for the largest median household size of 3.27 persons per household. non-family households (176 | 39.9%) represent the smallest median household size with 1.18 persons per household.
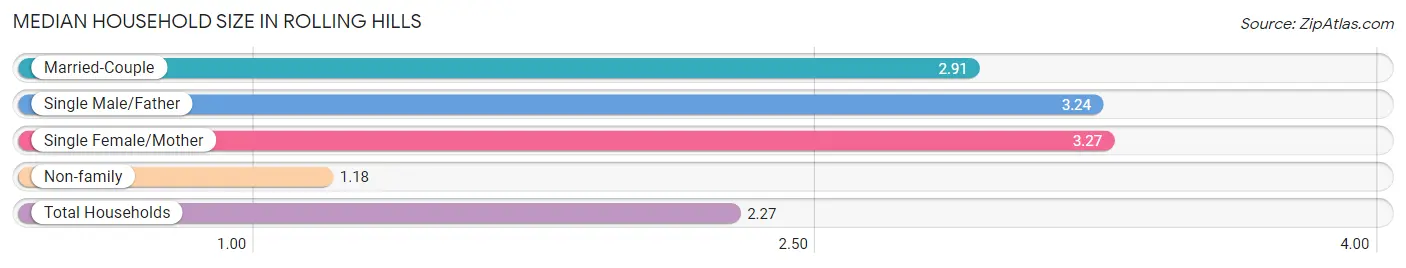
| Household Type | # Households | Household Size |
| Married-Couple | 198 (44.9%) | 2.91 |
| Single Male/Father | 41 (9.3%) | 3.24 |
| Single Female/Mother | 26 (5.9%) | 3.27 |
| Non-family | 176 (39.9%) | 1.18 |
| Total Households | 441 (100.0%) | 2.27 |
Household Size by Marriage Status in Rolling Hills
Out of a total of 441 households in Rolling Hills, 265 (60.1%) are family households, while 176 (39.9%) are nonfamily households. The most numerous type of family households are 2-person households, comprising 121, and the most common type of nonfamily households are 1-person households, comprising 146.
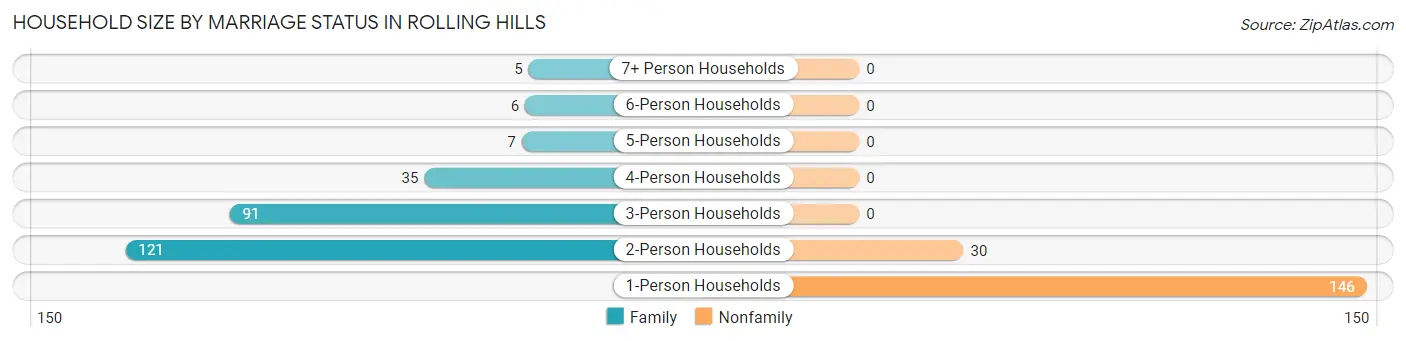
| Household Size | Family Households | Nonfamily Households |
| 1-Person Households | - | 146 (33.1%) |
| 2-Person Households | 121 (27.4%) | 30 (6.8%) |
| 3-Person Households | 91 (20.6%) | 0 (0.0%) |
| 4-Person Households | 35 (7.9%) | 0 (0.0%) |
| 5-Person Households | 7 (1.6%) | 0 (0.0%) |
| 6-Person Households | 6 (1.4%) | 0 (0.0%) |
| 7+ Person Households | 5 (1.1%) | 0 (0.0%) |
| Total | 265 (60.1%) | 176 (39.9%) |
Female Fertility in Rolling Hills
Fertility by Age in Rolling Hills
Average fertility rate in Rolling Hills is 139.0 births per 1,000 women. Women in the age bracket of 15 to 19 years have the highest fertility rate with 250.0 births per 1,000 women. Women in the age bracket of 20 to 34 years acount for 48.3% of all women with births.
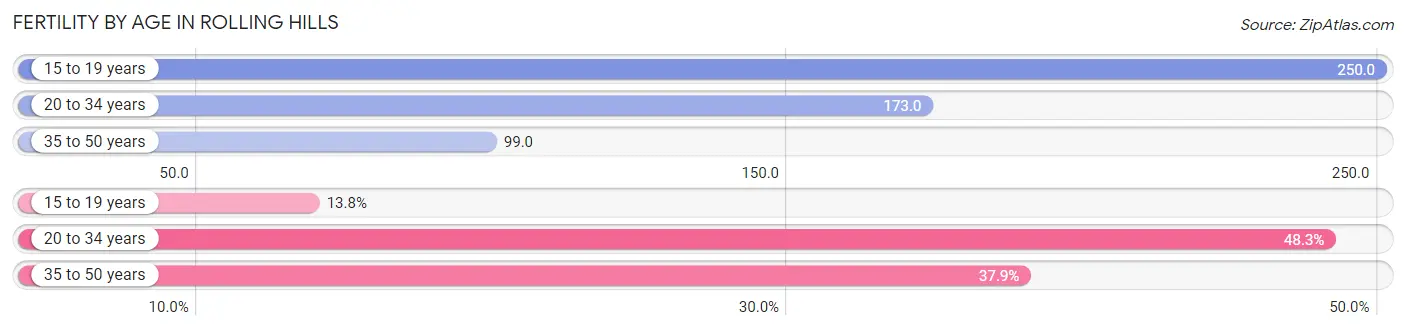
| Age Bracket | Women with Births | Births / 1,000 Women |
| 15 to 19 years | 4 (13.8%) | 250.0 |
| 20 to 34 years | 14 (48.3%) | 173.0 |
| 35 to 50 years | 11 (37.9%) | 99.0 |
| Total | 29 (100.0%) | 139.0 |
Fertility by Age by Marriage Status in Rolling Hills
55.2% of women with births (29) in Rolling Hills are married. The highest percentage of unmarried women with births falls into 15 to 19 years age bracket with 100.0% of them unmarried at the time of birth, while the lowest percentage of unmarried women with births belong to 20 to 34 years age bracket with 0.0% of them unmarried.
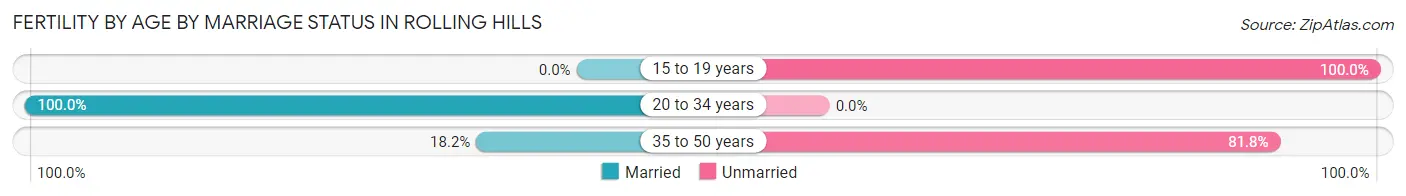
| Age Bracket | Married | Unmarried |
| 15 to 19 years | 0 (0.0%) | 4 (100.0%) |
| 20 to 34 years | 14 (100.0%) | 0 (0.0%) |
| 35 to 50 years | 2 (18.2%) | 9 (81.8%) |
| Total | 16 (55.2%) | 13 (44.8%) |
Fertility by Education in Rolling Hills
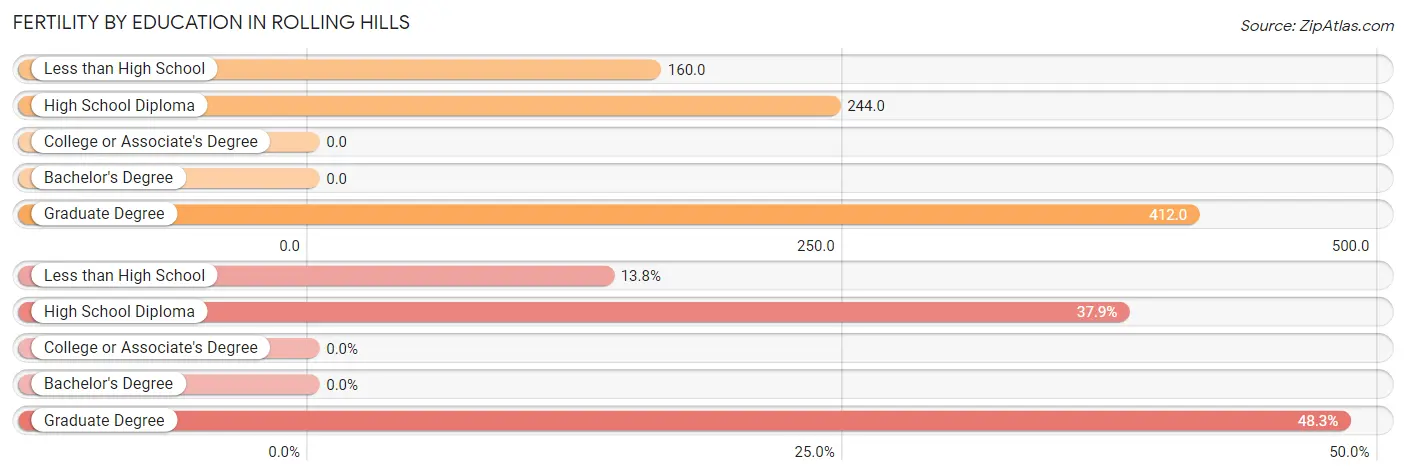
| Educational Attainment | Women with Births | Births / 1,000 Women |
| Less than High School | 4 (13.8%) | 160.0 |
| High School Diploma | 11 (37.9%) | 244.0 |
| College or Associate's Degree | 0 (0.0%) | 0.0 |
| Bachelor's Degree | 0 (0.0%) | 0.0 |
| Graduate Degree | 14 (48.3%) | 412.0 |
| Total | 29 (100.0%) | 139.0 |
Fertility by Education by Marriage Status in Rolling Hills
44.8% of women with births in Rolling Hills are unmarried. Women with the educational attainment of graduate degree are most likely to be married with 100.0% of them married at childbirth, while women with the educational attainment of less than high school are least likely to be married with 100.0% of them unmarried at childbirth.
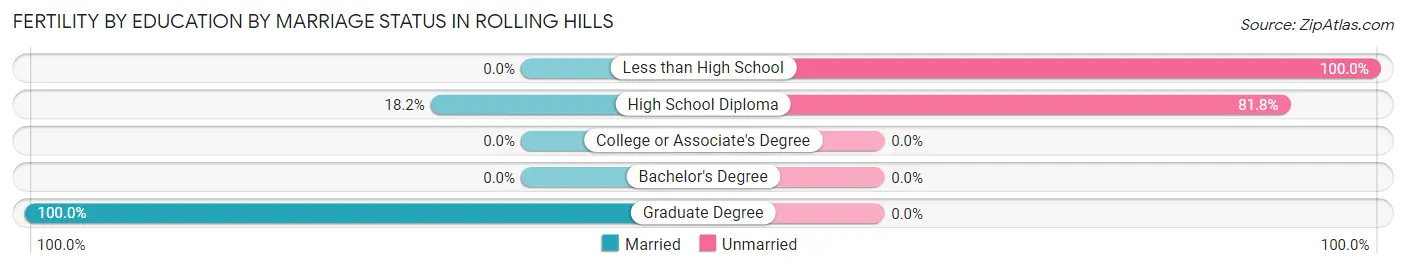
| Educational Attainment | Married | Unmarried |
| Less than High School | 0 (0.0%) | 4 (100.0%) |
| High School Diploma | 2 (18.2%) | 9 (81.8%) |
| College or Associate's Degree | 0 (0.0%) | 0 (0.0%) |
| Bachelor's Degree | 0 (0.0%) | 0 (0.0%) |
| Graduate Degree | 14 (100.0%) | 0 (0.0%) |
| Total | 16 (55.2%) | 13 (44.8%) |
Employment Characteristics in Rolling Hills
Employment by Class of Employer in Rolling Hills
Among the 594 employed individuals in Rolling Hills, private company employees (470 | 79.1%), not-for-profit organizations (57 | 9.6%), and self-employed (not incorporated) (24 | 4.0%) make up the most common classes of employment.
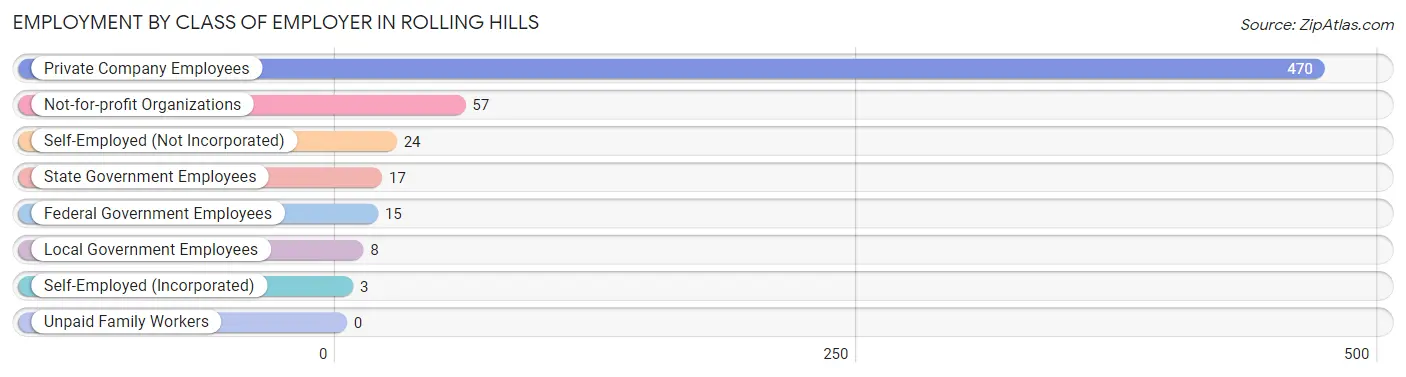
| Employer Class | # Employees | % Employees |
| Private Company Employees | 470 | 79.1% |
| Self-Employed (Incorporated) | 3 | 0.5% |
| Self-Employed (Not Incorporated) | 24 | 4.0% |
| Not-for-profit Organizations | 57 | 9.6% |
| Local Government Employees | 8 | 1.3% |
| State Government Employees | 17 | 2.9% |
| Federal Government Employees | 15 | 2.5% |
| Unpaid Family Workers | 0 | 0.0% |
| Total | 594 | 100.0% |
Employment Status by Age in Rolling Hills
According to the labor force statistics for Rolling Hills, out of the total population over 16 years of age (841), 73.8% or 621 individuals are in the labor force, with 3.4% or 21 of them unemployed. The age group with the highest labor force participation rate is 30 to 34 years, with 100.0% or 45 individuals in the labor force. Within the labor force, the 16 to 19 years age range has the highest percentage of unemployed individuals, with 50.0% or 6 of them being unemployed.
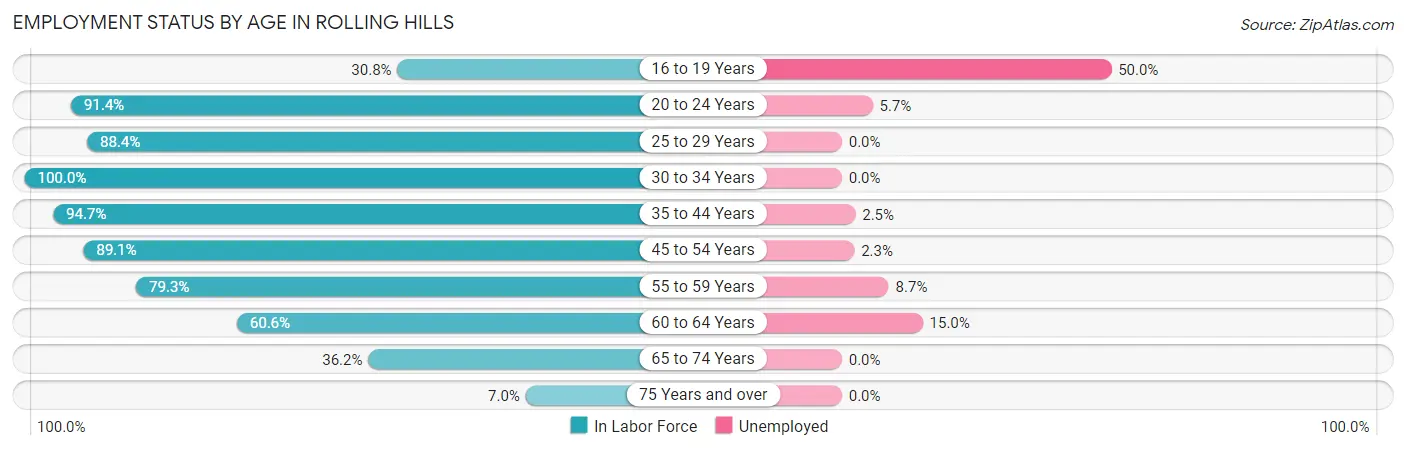
| Age Bracket | In Labor Force | Unemployed |
| 16 to 19 Years | 12 (30.8%) | 6 (50.0%) |
| 20 to 24 Years | 53 (91.4%) | 3 (5.7%) |
| 25 to 29 Years | 137 (88.4%) | 0 (0.0%) |
| 30 to 34 Years | 45 (100.0%) | 0 (0.0%) |
| 35 to 44 Years | 161 (94.7%) | 4 (2.5%) |
| 45 to 54 Years | 131 (89.1%) | 3 (2.3%) |
| 55 to 59 Years | 23 (79.3%) | 2 (8.7%) |
| 60 to 64 Years | 20 (60.6%) | 3 (15.0%) |
| 65 to 74 Years | 34 (36.2%) | 0 (0.0%) |
| 75 Years and over | 5 (7.0%) | 0 (0.0%) |
| Total | 621 (73.8%) | 21 (3.4%) |
Employment Status by Educational Attainment in Rolling Hills
According to labor force statistics for Rolling Hills, 89.3% of individuals (517) out of the total population between 25 and 64 years of age (579) are in the labor force, with 2.3% or 12 of them being unemployed. The group with the highest labor force participation rate are those with the educational attainment of college / associate degree, with 97.3% or 217 individuals in the labor force. Within the labor force, individuals with less than high school education have the highest percentage of unemployment, with 15.8% or 3 of them being unemployed.
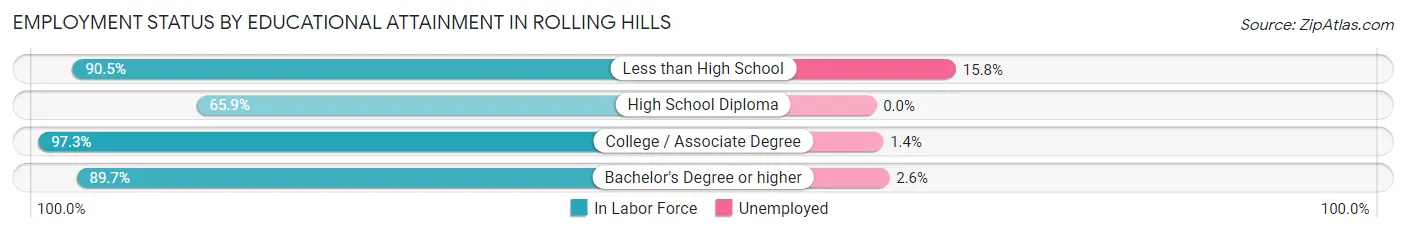
| Educational Attainment | In Labor Force | Unemployed |
| Less than High School | 19 (90.5%) | 3 (15.8%) |
| High School Diploma | 54 (65.9%) | 0 (0.0%) |
| College / Associate Degree | 217 (97.3%) | 3 (1.4%) |
| Bachelor's Degree or higher | 227 (89.7%) | 7 (2.6%) |
| Total | 517 (89.3%) | 13 (2.3%) |
Employment Occupations by Sex in Rolling Hills
Management, Business, Science and Arts Occupations
The most common Management, Business, Science and Arts occupations in Rolling Hills are Management (69 | 11.5%), Community & Social Service (62 | 10.3%), Business & Financial (38 | 6.3%), Education Instruction & Library (36 | 6.0%), and Computers, Engineering & Science (30 | 5.0%).
Management, Business, Science and Arts Occupations by Sex
Within the Management, Business, Science and Arts occupations in Rolling Hills, the most male-oriented occupations are Computers & Mathematics (100.0%), Architecture & Engineering (100.0%), and Computers, Engineering & Science (90.0%), while the most female-oriented occupations are Life, Physical & Social Science (100.0%), Education, Arts & Media (88.2%), and Business & Financial (84.2%).
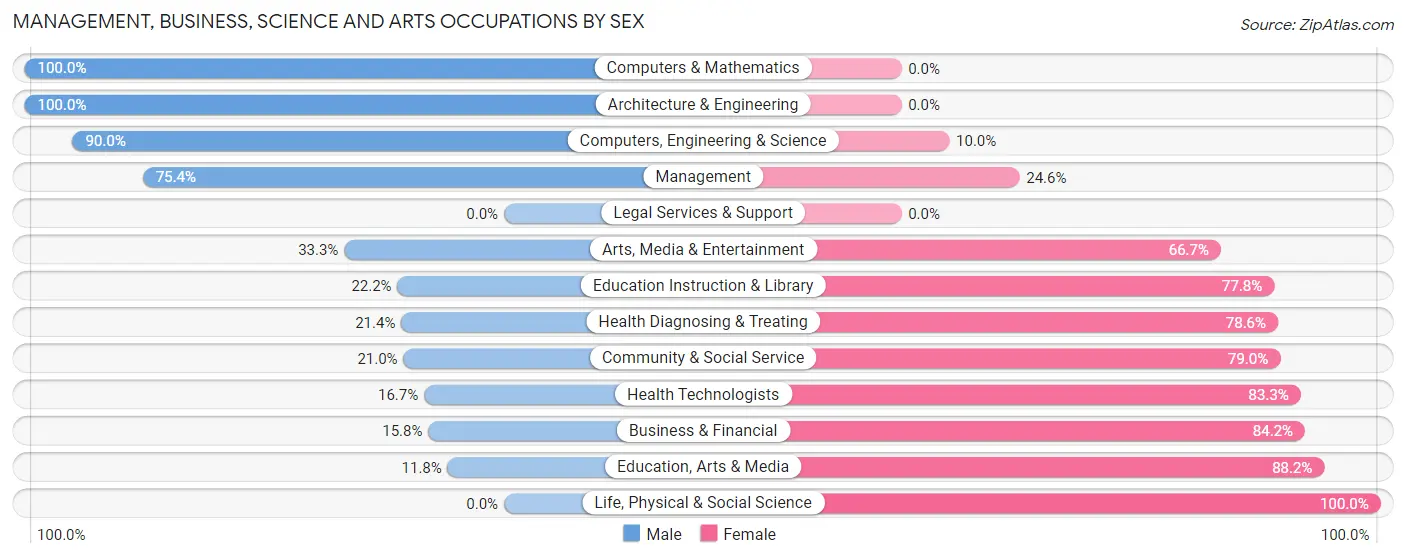
| Occupation | Male | Female |
| Management | 52 (75.4%) | 17 (24.6%) |
| Business & Financial | 6 (15.8%) | 32 (84.2%) |
| Computers, Engineering & Science | 27 (90.0%) | 3 (10.0%) |
| Computers & Mathematics | 22 (100.0%) | 0 (0.0%) |
| Architecture & Engineering | 5 (100.0%) | 0 (0.0%) |
| Life, Physical & Social Science | 0 (0.0%) | 3 (100.0%) |
| Community & Social Service | 13 (21.0%) | 49 (79.0%) |
| Education, Arts & Media | 2 (11.8%) | 15 (88.2%) |
| Legal Services & Support | 0 (0.0%) | 0 (0.0%) |
| Education Instruction & Library | 8 (22.2%) | 28 (77.8%) |
| Arts, Media & Entertainment | 3 (33.3%) | 6 (66.7%) |
| Health Diagnosing & Treating | 6 (21.4%) | 22 (78.6%) |
| Health Technologists | 4 (16.7%) | 20 (83.3%) |
| Total (Category) | 104 (45.8%) | 123 (54.2%) |
| Total (Overall) | 382 (63.7%) | 218 (36.3%) |
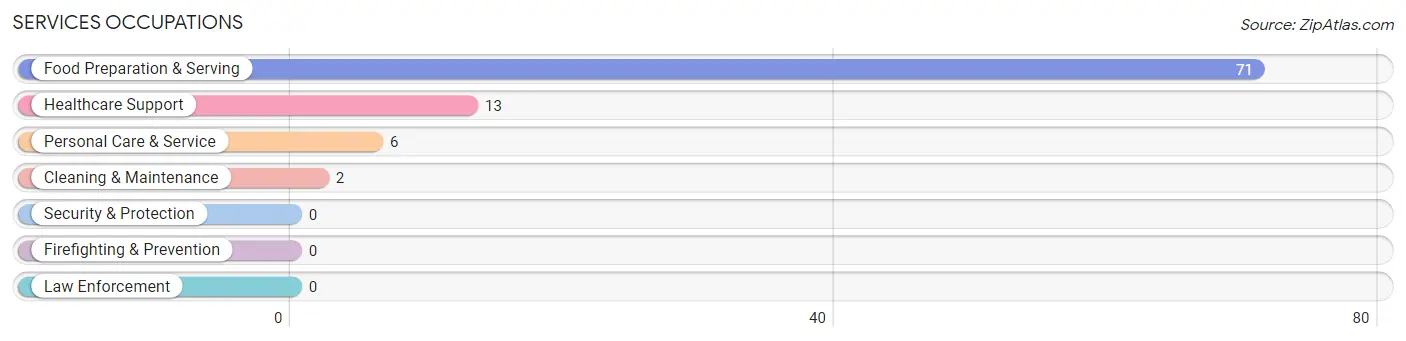
Services Occupations
The most common Services occupations in Rolling Hills are Food Preparation & Serving (71 | 11.8%), Healthcare Support (13 | 2.2%), Personal Care & Service (6 | 1.0%), and Cleaning & Maintenance (2 | 0.3%).
Services Occupations by Sex
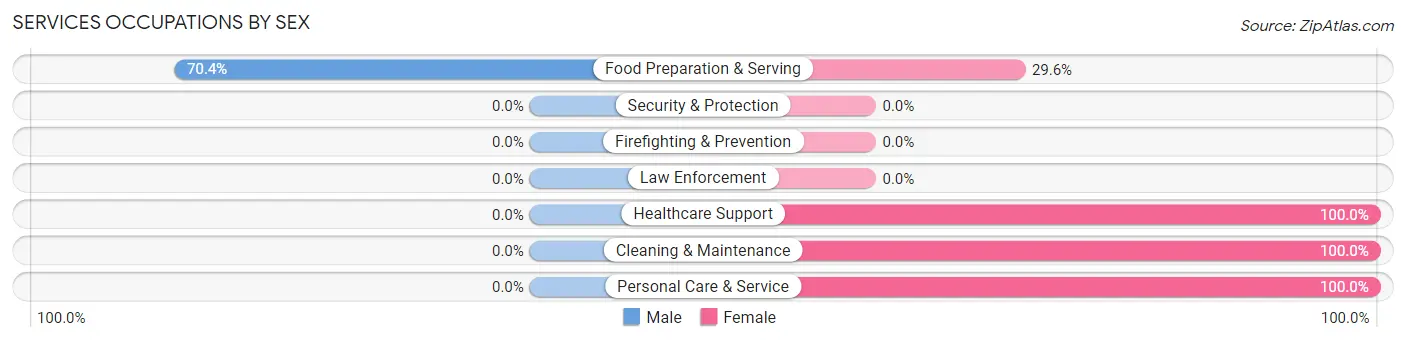
| Occupation | Male | Female |
| Healthcare Support | 0 (0.0%) | 13 (100.0%) |
| Security & Protection | 0 (0.0%) | 0 (0.0%) |
| Firefighting & Prevention | 0 (0.0%) | 0 (0.0%) |
| Law Enforcement | 0 (0.0%) | 0 (0.0%) |
| Food Preparation & Serving | 50 (70.4%) | 21 (29.6%) |
| Cleaning & Maintenance | 0 (0.0%) | 2 (100.0%) |
| Personal Care & Service | 0 (0.0%) | 6 (100.0%) |
| Total (Category) | 50 (54.3%) | 42 (45.7%) |
| Total (Overall) | 382 (63.7%) | 218 (36.3%) |
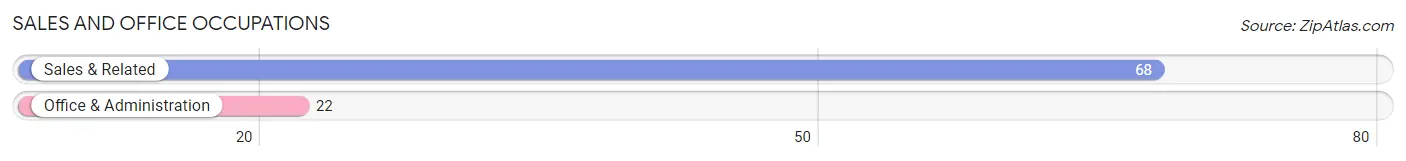
Sales and Office Occupations
The most common Sales and Office occupations in Rolling Hills are Sales & Related (68 | 11.3%), and Office & Administration (22 | 3.7%).
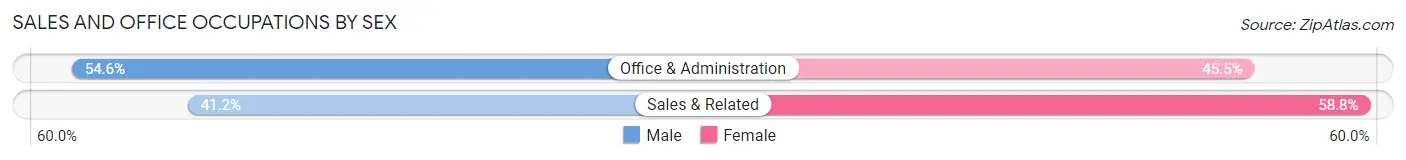
Sales and Office Occupations by Sex
| Occupation | Male | Female |
| Sales & Related | 28 (41.2%) | 40 (58.8%) |
| Office & Administration | 12 (54.5%) | 10 (45.5%) |
| Total (Category) | 40 (44.4%) | 50 (55.6%) |
| Total (Overall) | 382 (63.7%) | 218 (36.3%) |
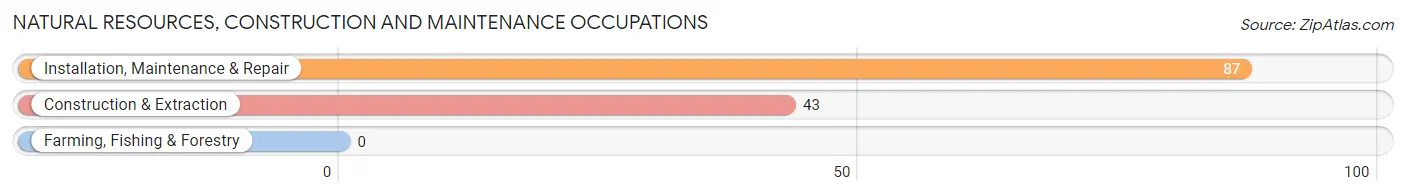
Natural Resources, Construction and Maintenance Occupations
The most common Natural Resources, Construction and Maintenance occupations in Rolling Hills are Installation, Maintenance & Repair (87 | 14.5%), and Construction & Extraction (43 | 7.2%).
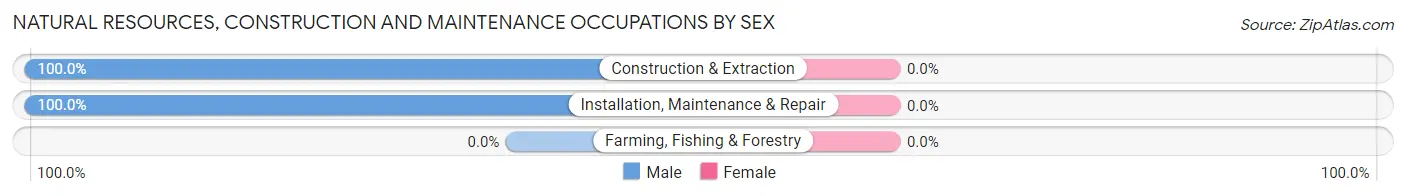
Natural Resources, Construction and Maintenance Occupations by Sex
| Occupation | Male | Female |
| Farming, Fishing & Forestry | 0 (0.0%) | 0 (0.0%) |
| Construction & Extraction | 43 (100.0%) | 0 (0.0%) |
| Installation, Maintenance & Repair | 87 (100.0%) | 0 (0.0%) |
| Total (Category) | 130 (100.0%) | 0 (0.0%) |
| Total (Overall) | 382 (63.7%) | 218 (36.3%) |
Production, Transportation and Moving Occupations
The most common Production, Transportation and Moving occupations in Rolling Hills are Material Moving (41 | 6.8%), Production (10 | 1.7%), and Transportation (10 | 1.7%).
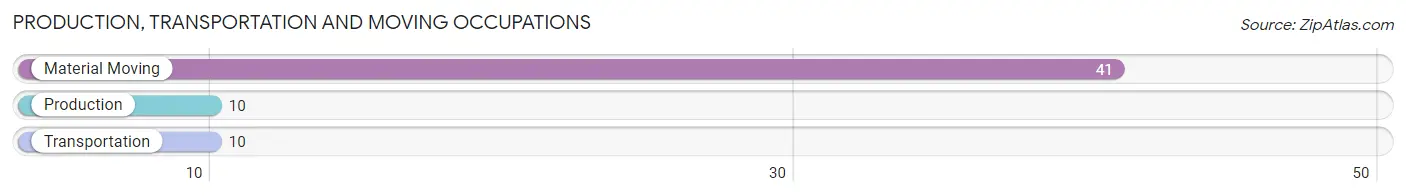
Production, Transportation and Moving Occupations by Sex
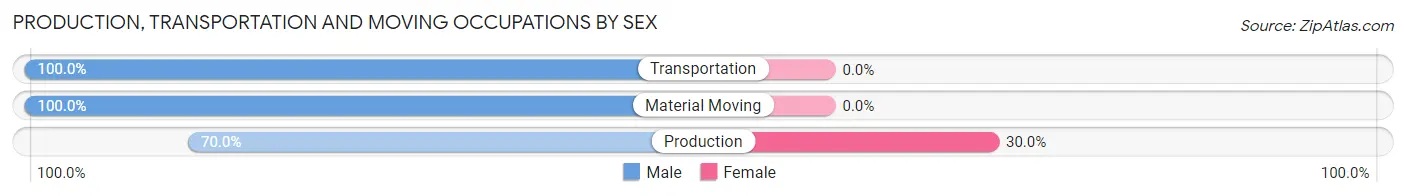
| Occupation | Male | Female |
| Production | 7 (70.0%) | 3 (30.0%) |
| Transportation | 10 (100.0%) | 0 (0.0%) |
| Material Moving | 41 (100.0%) | 0 (0.0%) |
| Total (Category) | 58 (95.1%) | 3 (4.9%) |
| Total (Overall) | 382 (63.7%) | 218 (36.3%) |
Employment Industries by Sex in Rolling Hills
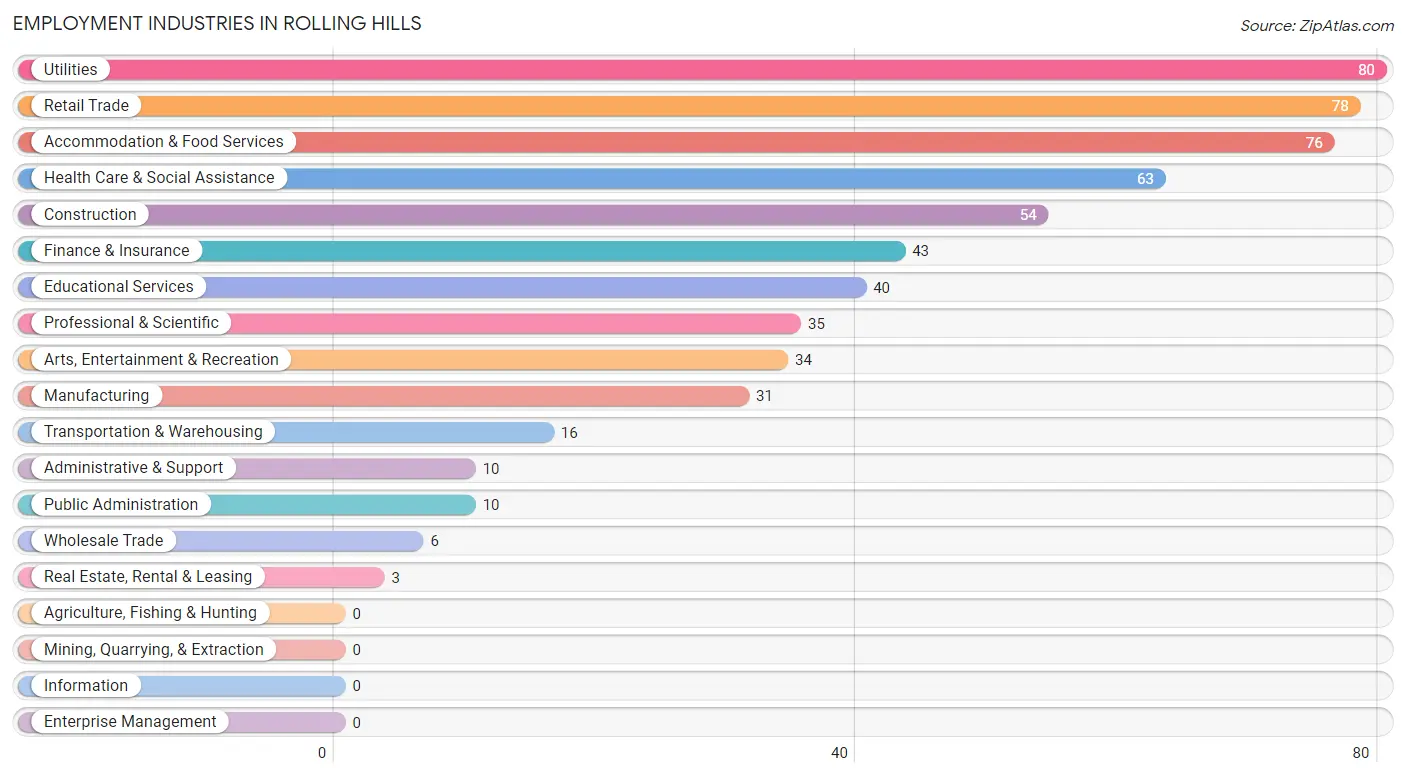
Employment Industries in Rolling Hills
The major employment industries in Rolling Hills include Utilities (80 | 13.3%), Retail Trade (78 | 13.0%), Accommodation & Food Services (76 | 12.7%), Health Care & Social Assistance (63 | 10.5%), and Construction (54 | 9.0%).
Employment Industries by Sex in Rolling Hills
The Rolling Hills industries that see more men than women are Construction (100.0%), Transportation & Warehousing (100.0%), and Utilities (100.0%), whereas the industries that tend to have a higher number of women are Health Care & Social Assistance (79.4%), Educational Services (77.5%), and Professional & Scientific (68.6%).
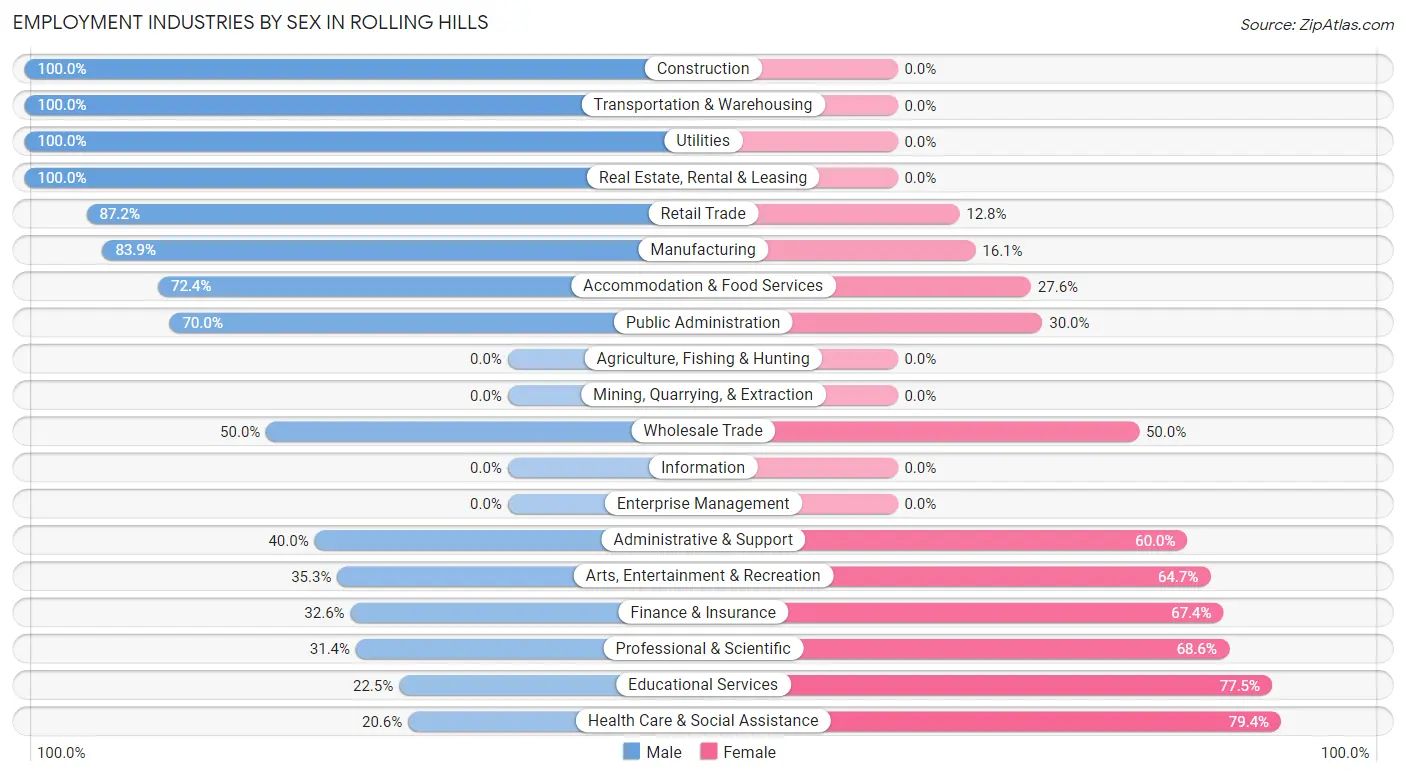
| Industry | Male | Female |
| Agriculture, Fishing & Hunting | 0 (0.0%) | 0 (0.0%) |
| Mining, Quarrying, & Extraction | 0 (0.0%) | 0 (0.0%) |
| Construction | 54 (100.0%) | 0 (0.0%) |
| Manufacturing | 26 (83.9%) | 5 (16.1%) |
| Wholesale Trade | 3 (50.0%) | 3 (50.0%) |
| Retail Trade | 68 (87.2%) | 10 (12.8%) |
| Transportation & Warehousing | 16 (100.0%) | 0 (0.0%) |
| Utilities | 80 (100.0%) | 0 (0.0%) |
| Information | 0 (0.0%) | 0 (0.0%) |
| Finance & Insurance | 14 (32.6%) | 29 (67.4%) |
| Real Estate, Rental & Leasing | 3 (100.0%) | 0 (0.0%) |
| Professional & Scientific | 11 (31.4%) | 24 (68.6%) |
| Enterprise Management | 0 (0.0%) | 0 (0.0%) |
| Administrative & Support | 4 (40.0%) | 6 (60.0%) |
| Educational Services | 9 (22.5%) | 31 (77.5%) |
| Health Care & Social Assistance | 13 (20.6%) | 50 (79.4%) |
| Arts, Entertainment & Recreation | 12 (35.3%) | 22 (64.7%) |
| Accommodation & Food Services | 55 (72.4%) | 21 (27.6%) |
| Public Administration | 7 (70.0%) | 3 (30.0%) |
| Total | 382 (63.7%) | 218 (36.3%) |
Education in Rolling Hills
School Enrollment in Rolling Hills
The most common levels of schooling among the 213 students in Rolling Hills are kindergarten (45 | 21.1%), elementary school (43 | 20.2%), and graduate / professional (35 | 16.4%).
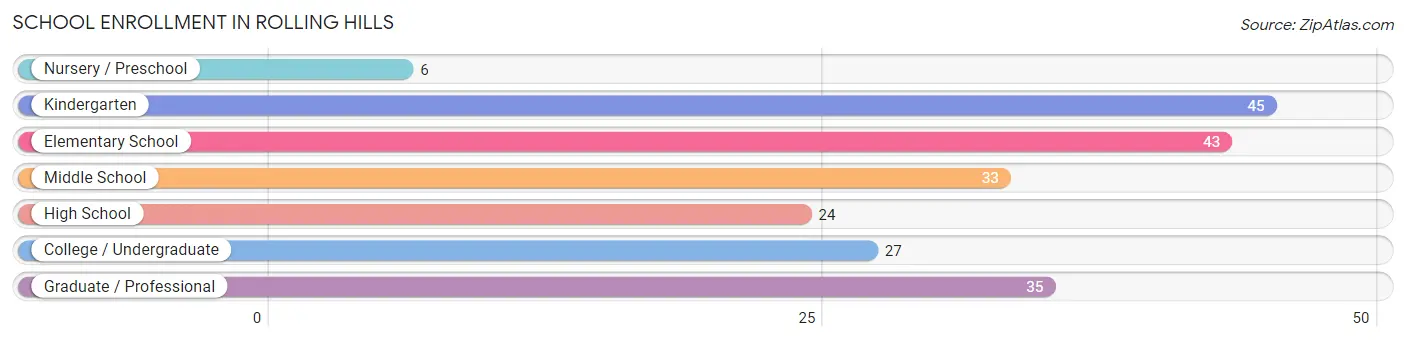
| School Level | # Students | % Students |
| Nursery / Preschool | 6 | 2.8% |
| Kindergarten | 45 | 21.1% |
| Elementary School | 43 | 20.2% |
| Middle School | 33 | 15.5% |
| High School | 24 | 11.3% |
| College / Undergraduate | 27 | 12.7% |
| Graduate / Professional | 35 | 16.4% |
| Total | 213 | 100.0% |
School Enrollment by Age by Funding Source in Rolling Hills
Out of a total of 213 students who are enrolled in schools in Rolling Hills, 70 (32.9%) attend a private institution, while the remaining 143 (67.1%) are enrolled in public schools. The age group of 3 to 4 year olds has the highest likelihood of being enrolled in private schools, with 3 (100.0% in the age bracket) enrolled. Conversely, the age group of 10 to 14 year olds has the lowest likelihood of being enrolled in a private school, with 36 (100.0% in the age bracket) attending a public institution.
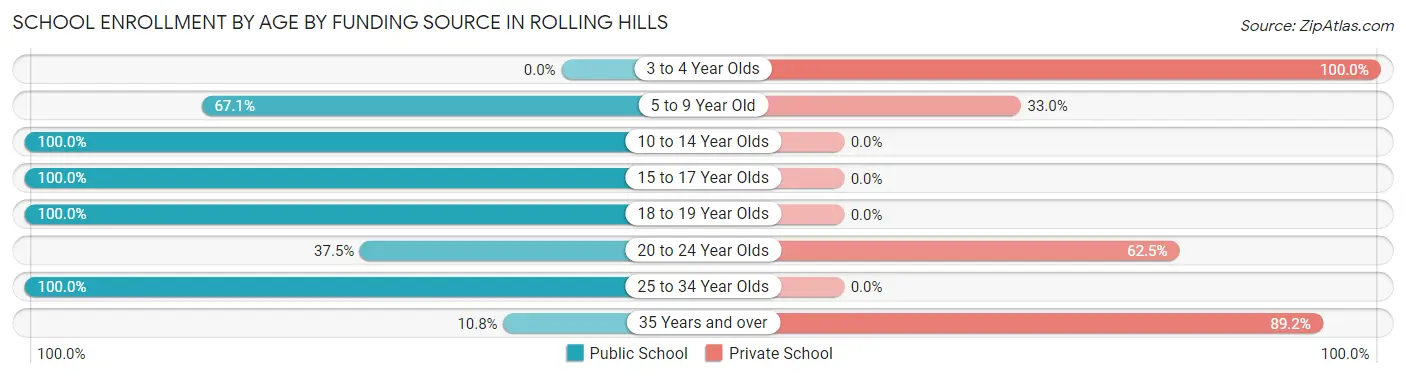
| Age Bracket | Public School | Private School |
| 3 to 4 Year Olds | 0 (0.0%) | 3 (100.0%) |
| 5 to 9 Year Old | 59 (67.0%) | 29 (33.0%) |
| 10 to 14 Year Olds | 36 (100.0%) | 0 (0.0%) |
| 15 to 17 Year Olds | 24 (100.0%) | 0 (0.0%) |
| 18 to 19 Year Olds | 11 (100.0%) | 0 (0.0%) |
| 20 to 24 Year Olds | 3 (37.5%) | 5 (62.5%) |
| 25 to 34 Year Olds | 6 (100.0%) | 0 (0.0%) |
| 35 Years and over | 4 (10.8%) | 33 (89.2%) |
| Total | 143 (67.1%) | 70 (32.9%) |
Educational Attainment by Field of Study in Rolling Hills
Business (66 | 19.8%), education (51 | 15.3%), literature & languages (39 | 11.7%), psychology (23 | 6.9%), and science & technology (23 | 6.9%) are the most common fields of study among 334 individuals in Rolling Hills who have obtained a bachelor's degree or higher.
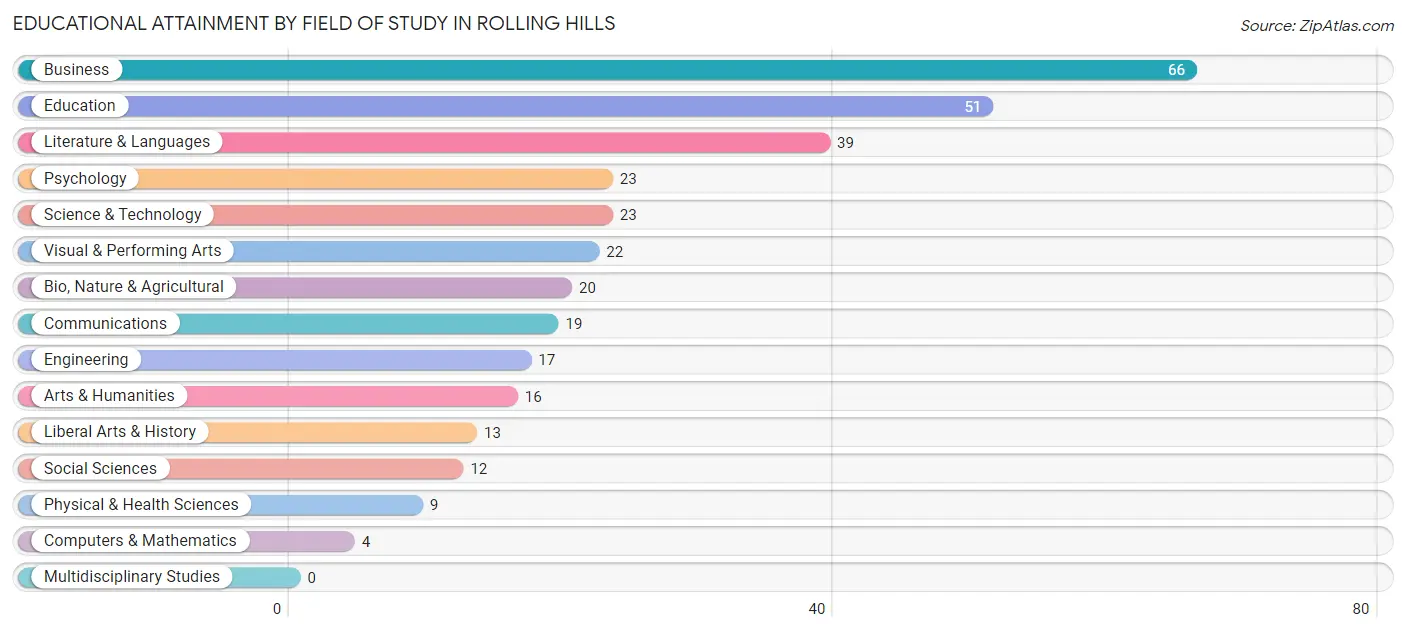
| Field of Study | # Graduates | % Graduates |
| Computers & Mathematics | 4 | 1.2% |
| Bio, Nature & Agricultural | 20 | 6.0% |
| Physical & Health Sciences | 9 | 2.7% |
| Psychology | 23 | 6.9% |
| Social Sciences | 12 | 3.6% |
| Engineering | 17 | 5.1% |
| Multidisciplinary Studies | 0 | 0.0% |
| Science & Technology | 23 | 6.9% |
| Business | 66 | 19.8% |
| Education | 51 | 15.3% |
| Literature & Languages | 39 | 11.7% |
| Liberal Arts & History | 13 | 3.9% |
| Visual & Performing Arts | 22 | 6.6% |
| Communications | 19 | 5.7% |
| Arts & Humanities | 16 | 4.8% |
| Total | 334 | 100.0% |
Transportation & Commute in Rolling Hills
Vehicle Availability by Sex in Rolling Hills
The most prevalent vehicle ownership categories in Rolling Hills are males with 2 vehicles (143, accounting for 37.4%) and females with 2 vehicles (118, making up 67.4%).
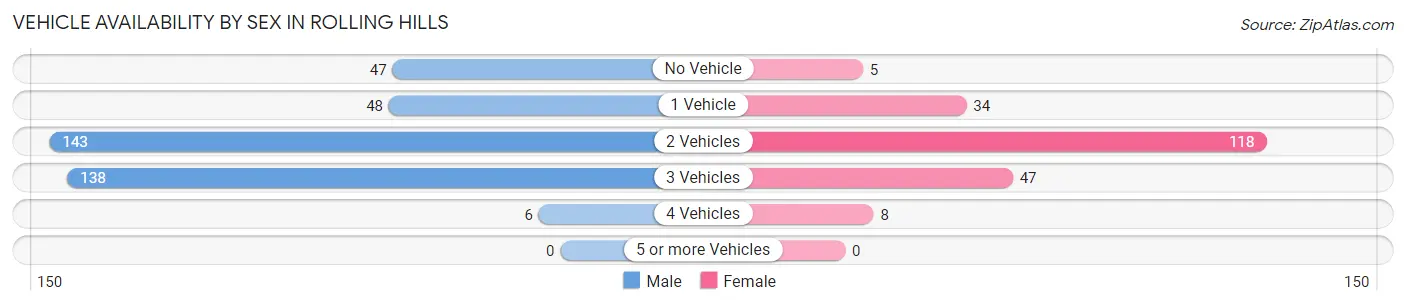
| Vehicles Available | Male | Female |
| No Vehicle | 47 (12.3%) | 5 (2.4%) |
| 1 Vehicle | 48 (12.6%) | 34 (16.0%) |
| 2 Vehicles | 143 (37.4%) | 118 (55.7%) |
| 3 Vehicles | 138 (36.1%) | 47 (22.2%) |
| 4 Vehicles | 6 (1.6%) | 8 (3.8%) |
| 5 or more Vehicles | 0 (0.0%) | 0 (0.0%) |
| Total | 382 (100.0%) | 212 (100.0%) |
Commute Time in Rolling Hills
The most frequently occuring commute durations in Rolling Hills are 20 to 24 minutes (137 commuters, 27.2%), 25 to 29 minutes (98 commuters, 19.5%), and 15 to 19 minutes (79 commuters, 15.7%).
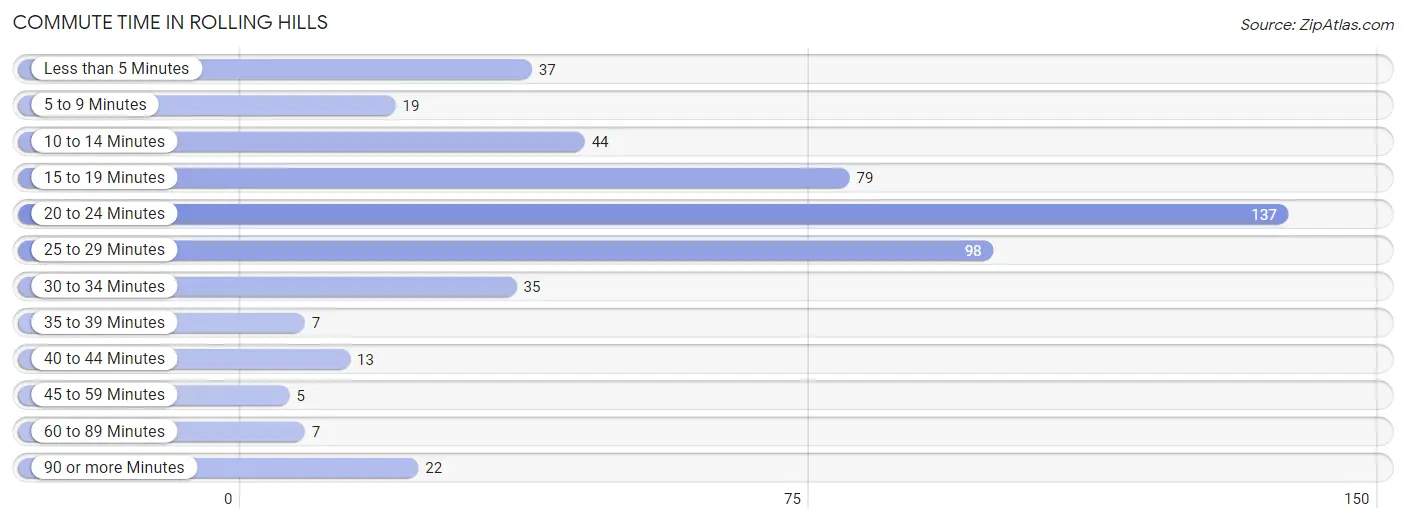
| Commute Time | # Commuters | % Commuters |
| Less than 5 Minutes | 37 | 7.4% |
| 5 to 9 Minutes | 19 | 3.8% |
| 10 to 14 Minutes | 44 | 8.7% |
| 15 to 19 Minutes | 79 | 15.7% |
| 20 to 24 Minutes | 137 | 27.2% |
| 25 to 29 Minutes | 98 | 19.5% |
| 30 to 34 Minutes | 35 | 7.0% |
| 35 to 39 Minutes | 7 | 1.4% |
| 40 to 44 Minutes | 13 | 2.6% |
| 45 to 59 Minutes | 5 | 1.0% |
| 60 to 89 Minutes | 7 | 1.4% |
| 90 or more Minutes | 22 | 4.4% |
Commute Time by Sex in Rolling Hills
The most common commute times in Rolling Hills are 20 to 24 minutes (95 commuters, 26.6%) for males and 20 to 24 minutes (42 commuters, 28.8%) for females.
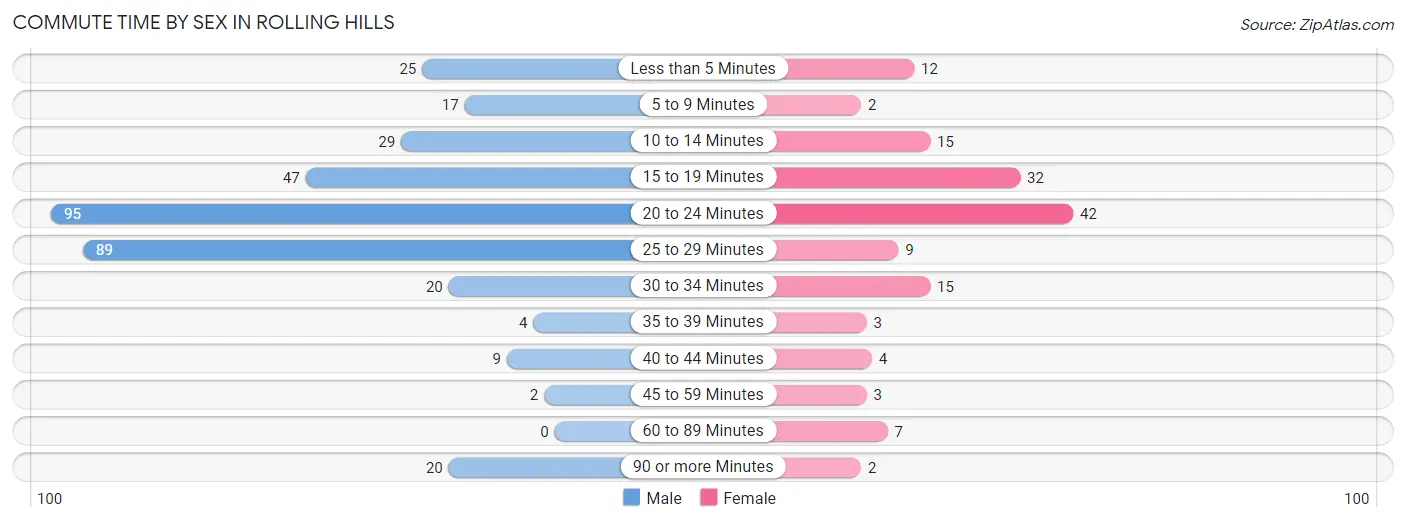
| Commute Time | Male | Female |
| Less than 5 Minutes | 25 (7.0%) | 12 (8.2%) |
| 5 to 9 Minutes | 17 (4.8%) | 2 (1.4%) |
| 10 to 14 Minutes | 29 (8.1%) | 15 (10.3%) |
| 15 to 19 Minutes | 47 (13.2%) | 32 (21.9%) |
| 20 to 24 Minutes | 95 (26.6%) | 42 (28.8%) |
| 25 to 29 Minutes | 89 (24.9%) | 9 (6.2%) |
| 30 to 34 Minutes | 20 (5.6%) | 15 (10.3%) |
| 35 to 39 Minutes | 4 (1.1%) | 3 (2.1%) |
| 40 to 44 Minutes | 9 (2.5%) | 4 (2.7%) |
| 45 to 59 Minutes | 2 (0.6%) | 3 (2.1%) |
| 60 to 89 Minutes | 0 (0.0%) | 7 (4.8%) |
| 90 or more Minutes | 20 (5.6%) | 2 (1.4%) |
Time of Departure to Work by Sex in Rolling Hills
The most frequent times of departure to work in Rolling Hills are 6:00 AM to 6:29 AM (95, 26.6%) for males and 7:00 AM to 7:29 AM (40, 27.4%) for females.
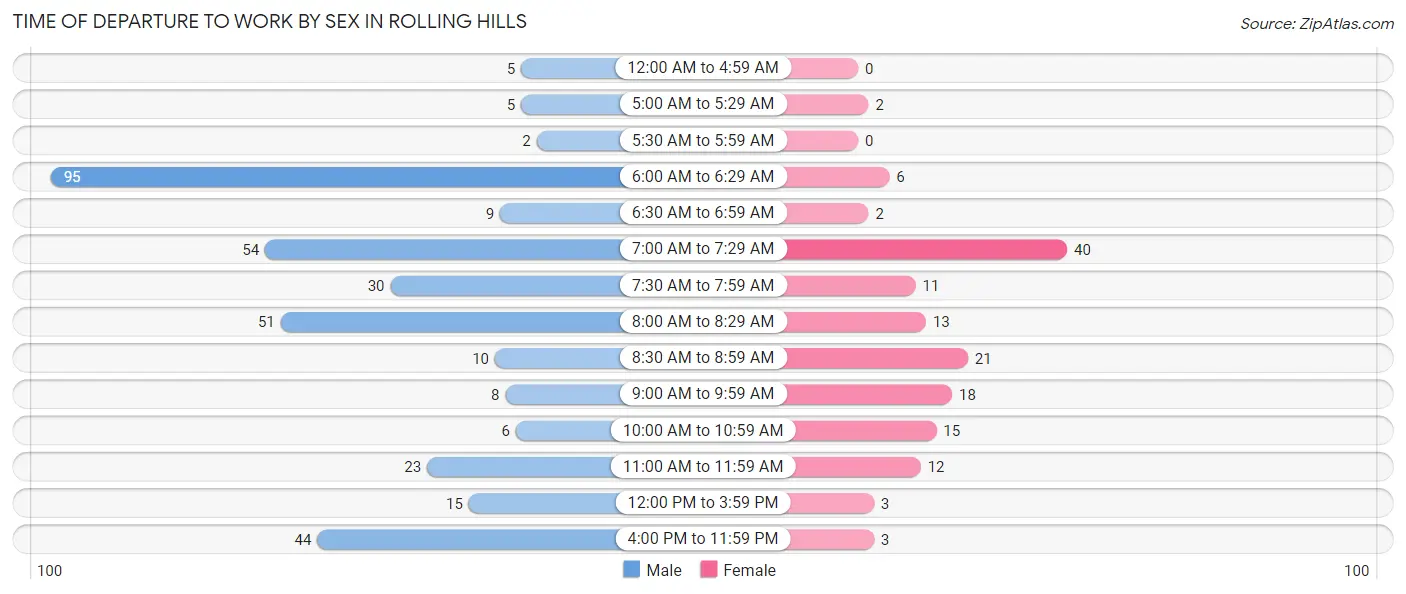
| Time of Departure | Male | Female |
| 12:00 AM to 4:59 AM | 5 (1.4%) | 0 (0.0%) |
| 5:00 AM to 5:29 AM | 5 (1.4%) | 2 (1.4%) |
| 5:30 AM to 5:59 AM | 2 (0.6%) | 0 (0.0%) |
| 6:00 AM to 6:29 AM | 95 (26.6%) | 6 (4.1%) |
| 6:30 AM to 6:59 AM | 9 (2.5%) | 2 (1.4%) |
| 7:00 AM to 7:29 AM | 54 (15.1%) | 40 (27.4%) |
| 7:30 AM to 7:59 AM | 30 (8.4%) | 11 (7.5%) |
| 8:00 AM to 8:29 AM | 51 (14.3%) | 13 (8.9%) |
| 8:30 AM to 8:59 AM | 10 (2.8%) | 21 (14.4%) |
| 9:00 AM to 9:59 AM | 8 (2.2%) | 18 (12.3%) |
| 10:00 AM to 10:59 AM | 6 (1.7%) | 15 (10.3%) |
| 11:00 AM to 11:59 AM | 23 (6.4%) | 12 (8.2%) |
| 12:00 PM to 3:59 PM | 15 (4.2%) | 3 (2.1%) |
| 4:00 PM to 11:59 PM | 44 (12.3%) | 3 (2.1%) |
| Total | 357 (100.0%) | 146 (100.0%) |
Housing Occupancy in Rolling Hills
Occupancy by Ownership in Rolling Hills
Of the total 441 dwellings in Rolling Hills, owner-occupied units account for 336 (76.2%), while renter-occupied units make up 105 (23.8%).
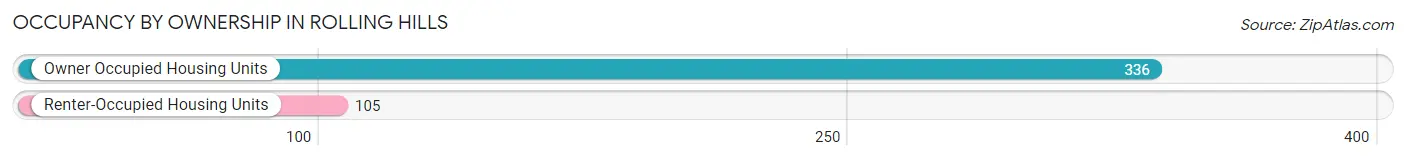
| Occupancy | # Housing Units | % Housing Units |
| Owner Occupied Housing Units | 336 | 76.2% |
| Renter-Occupied Housing Units | 105 | 23.8% |
| Total Occupied Housing Units | 441 | 100.0% |
Occupancy by Household Size in Rolling Hills
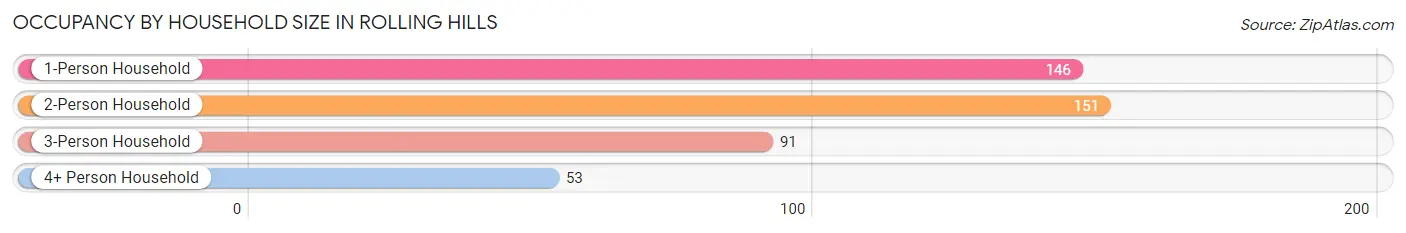
| Household Size | # Housing Units | % Housing Units |
| 1-Person Household | 146 | 33.1% |
| 2-Person Household | 151 | 34.2% |
| 3-Person Household | 91 | 20.6% |
| 4+ Person Household | 53 | 12.0% |
| Total Housing Units | 441 | 100.0% |
Occupancy by Ownership by Household Size in Rolling Hills
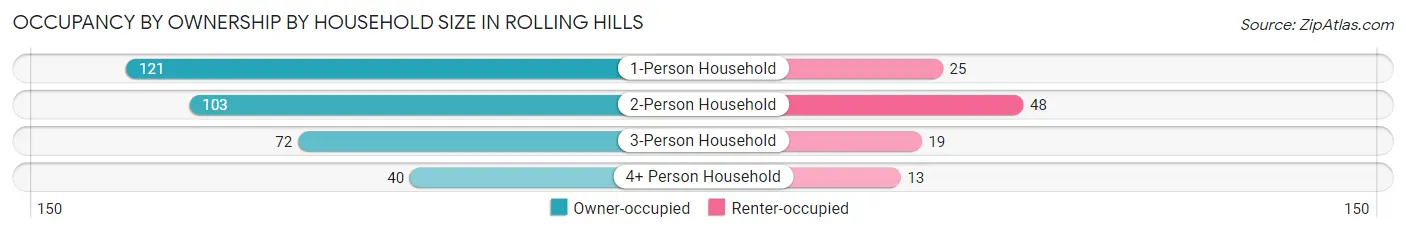
| Household Size | Owner-occupied | Renter-occupied |
| 1-Person Household | 121 (82.9%) | 25 (17.1%) |
| 2-Person Household | 103 (68.2%) | 48 (31.8%) |
| 3-Person Household | 72 (79.1%) | 19 (20.9%) |
| 4+ Person Household | 40 (75.5%) | 13 (24.5%) |
| Total Housing Units | 336 (76.2%) | 105 (23.8%) |
Occupancy by Educational Attainment in Rolling Hills
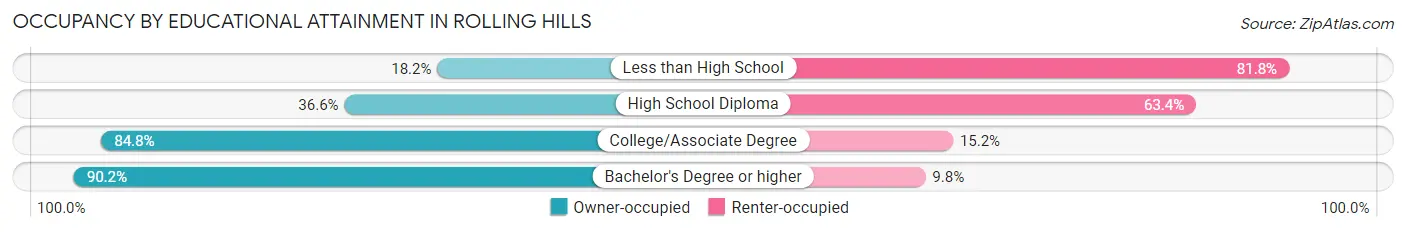
| Household Size | Owner-occupied | Renter-occupied |
| Less than High School | 2 (18.2%) | 9 (81.8%) |
| High School Diploma | 30 (36.6%) | 52 (63.4%) |
| College/Associate Degree | 156 (84.8%) | 28 (15.2%) |
| Bachelor's Degree or higher | 148 (90.2%) | 16 (9.8%) |
Occupancy by Age of Householder in Rolling Hills
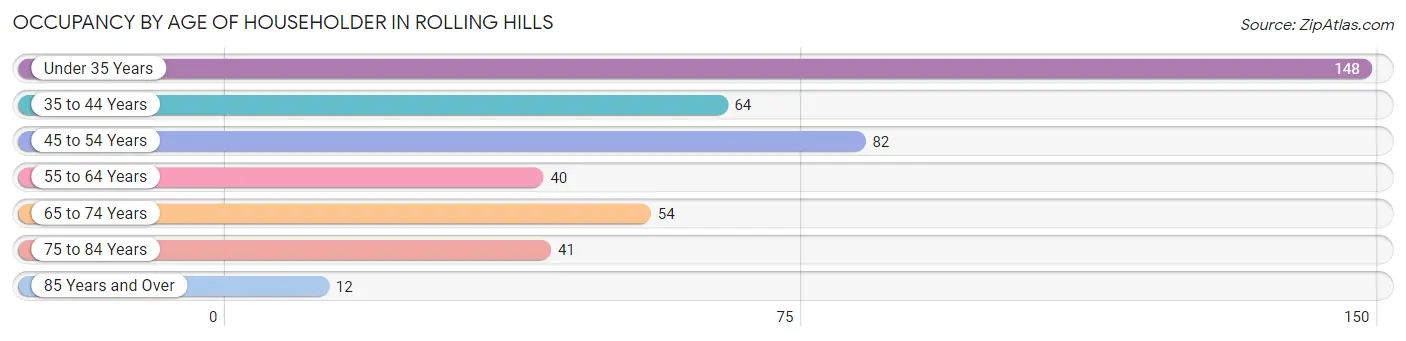
| Age Bracket | # Households | % Households |
| Under 35 Years | 148 | 33.6% |
| 35 to 44 Years | 64 | 14.5% |
| 45 to 54 Years | 82 | 18.6% |
| 55 to 64 Years | 40 | 9.1% |
| 65 to 74 Years | 54 | 12.2% |
| 75 to 84 Years | 41 | 9.3% |
| 85 Years and Over | 12 | 2.7% |
| Total | 441 | 100.0% |
Housing Finances in Rolling Hills
Median Income by Occupancy in Rolling Hills
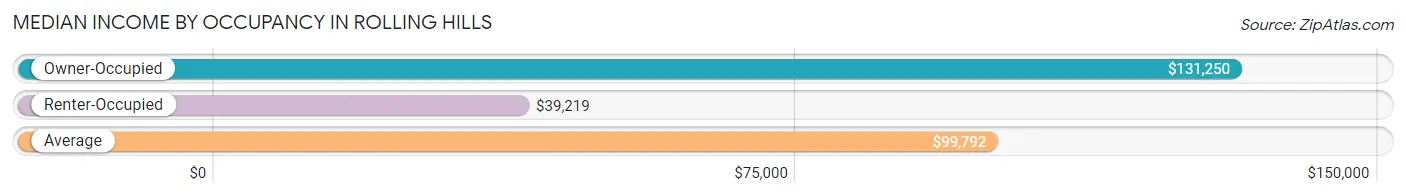
| Occupancy Type | # Households | Median Income |
| Owner-Occupied | 336 (76.2%) | $131,250 |
| Renter-Occupied | 105 (23.8%) | $39,219 |
| Average | 441 (100.0%) | $99,792 |
Occupancy by Householder Income Bracket in Rolling Hills
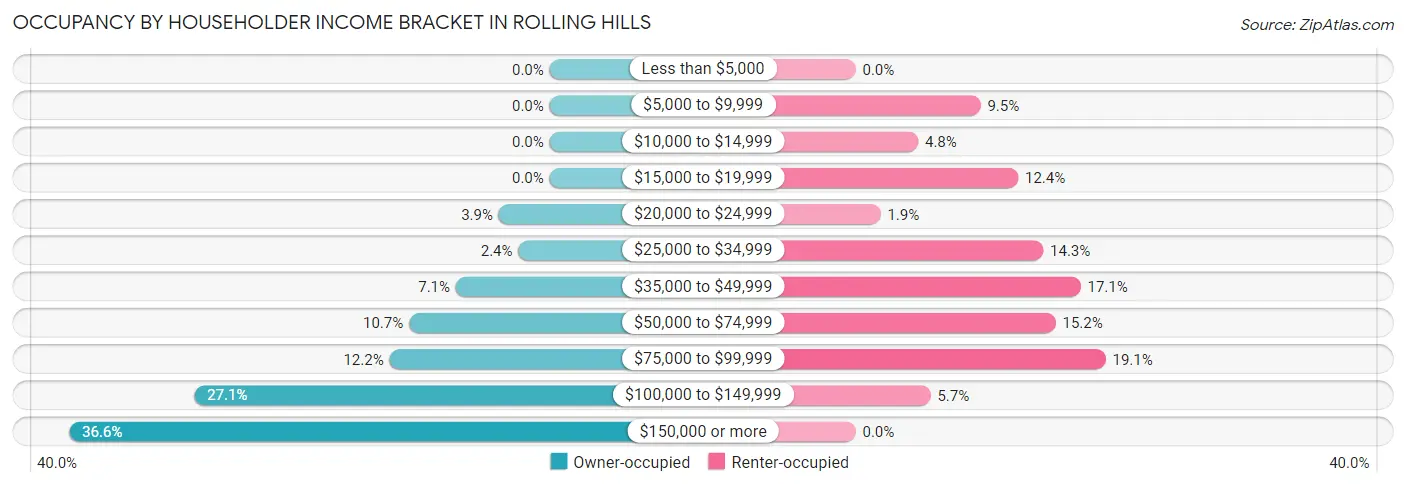
| Income Bracket | Owner-occupied | Renter-occupied |
| Less than $5,000 | 0 (0.0%) | 0 (0.0%) |
| $5,000 to $9,999 | 0 (0.0%) | 10 (9.5%) |
| $10,000 to $14,999 | 0 (0.0%) | 5 (4.8%) |
| $15,000 to $19,999 | 0 (0.0%) | 13 (12.4%) |
| $20,000 to $24,999 | 13 (3.9%) | 2 (1.9%) |
| $25,000 to $34,999 | 8 (2.4%) | 15 (14.3%) |
| $35,000 to $49,999 | 24 (7.1%) | 18 (17.1%) |
| $50,000 to $74,999 | 36 (10.7%) | 16 (15.2%) |
| $75,000 to $99,999 | 41 (12.2%) | 20 (19.1%) |
| $100,000 to $149,999 | 91 (27.1%) | 6 (5.7%) |
| $150,000 or more | 123 (36.6%) | 0 (0.0%) |
| Total | 336 (100.0%) | 105 (100.0%) |
Monthly Housing Cost Tiers in Rolling Hills
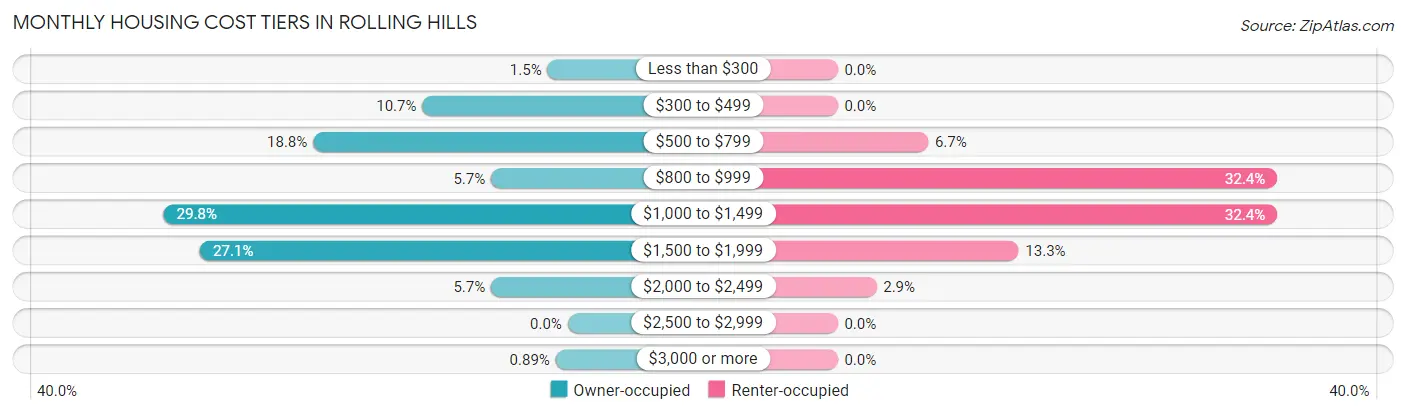
| Monthly Cost | Owner-occupied | Renter-occupied |
| Less than $300 | 5 (1.5%) | 0 (0.0%) |
| $300 to $499 | 36 (10.7%) | 0 (0.0%) |
| $500 to $799 | 63 (18.8%) | 7 (6.7%) |
| $800 to $999 | 19 (5.7%) | 34 (32.4%) |
| $1,000 to $1,499 | 100 (29.8%) | 34 (32.4%) |
| $1,500 to $1,999 | 91 (27.1%) | 14 (13.3%) |
| $2,000 to $2,499 | 19 (5.7%) | 3 (2.9%) |
| $2,500 to $2,999 | 0 (0.0%) | 0 (0.0%) |
| $3,000 or more | 3 (0.9%) | 0 (0.0%) |
| Total | 336 (100.0%) | 105 (100.0%) |
Physical Housing Characteristics in Rolling Hills
Housing Structures in Rolling Hills
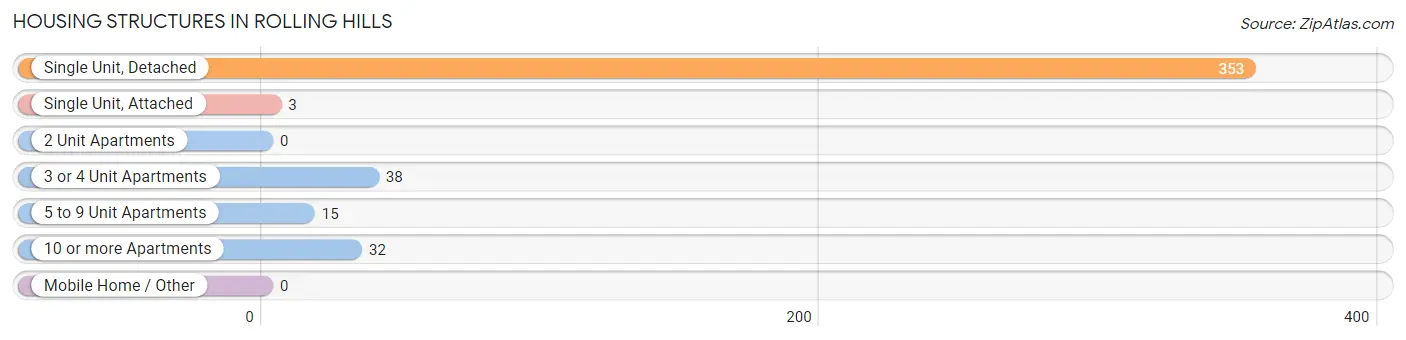
| Structure Type | # Housing Units | % Housing Units |
| Single Unit, Detached | 353 | 80.0% |
| Single Unit, Attached | 3 | 0.7% |
| 2 Unit Apartments | 0 | 0.0% |
| 3 or 4 Unit Apartments | 38 | 8.6% |
| 5 to 9 Unit Apartments | 15 | 3.4% |
| 10 or more Apartments | 32 | 7.3% |
| Mobile Home / Other | 0 | 0.0% |
| Total | 441 | 100.0% |
Housing Structures by Occupancy in Rolling Hills
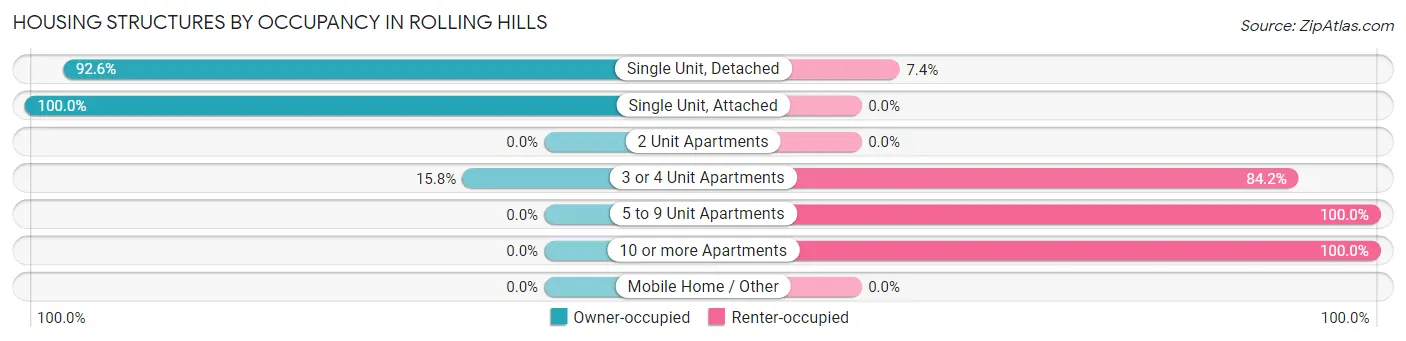
| Structure Type | Owner-occupied | Renter-occupied |
| Single Unit, Detached | 327 (92.6%) | 26 (7.4%) |
| Single Unit, Attached | 3 (100.0%) | 0 (0.0%) |
| 2 Unit Apartments | 0 (0.0%) | 0 (0.0%) |
| 3 or 4 Unit Apartments | 6 (15.8%) | 32 (84.2%) |
| 5 to 9 Unit Apartments | 0 (0.0%) | 15 (100.0%) |
| 10 or more Apartments | 0 (0.0%) | 32 (100.0%) |
| Mobile Home / Other | 0 (0.0%) | 0 (0.0%) |
| Total | 336 (76.2%) | 105 (23.8%) |
Housing Structures by Number of Rooms in Rolling Hills
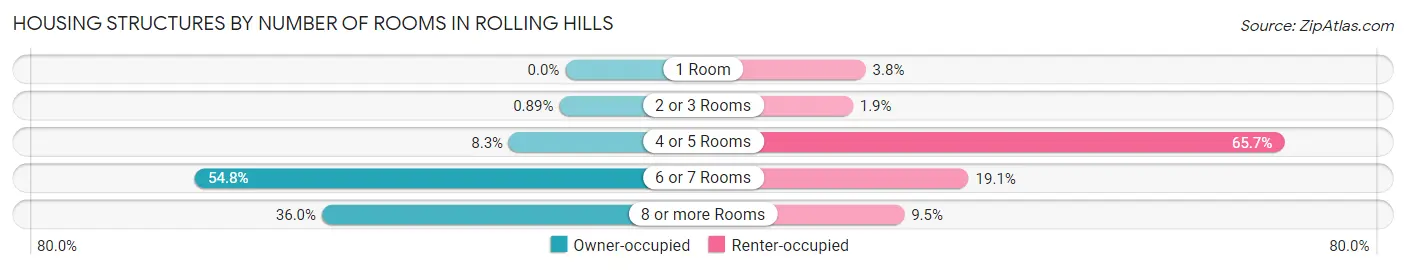
| Number of Rooms | Owner-occupied | Renter-occupied |
| 1 Room | 0 (0.0%) | 4 (3.8%) |
| 2 or 3 Rooms | 3 (0.9%) | 2 (1.9%) |
| 4 or 5 Rooms | 28 (8.3%) | 69 (65.7%) |
| 6 or 7 Rooms | 184 (54.8%) | 20 (19.1%) |
| 8 or more Rooms | 121 (36.0%) | 10 (9.5%) |
| Total | 336 (100.0%) | 105 (100.0%) |
Housing Structure by Heating Type in Rolling Hills
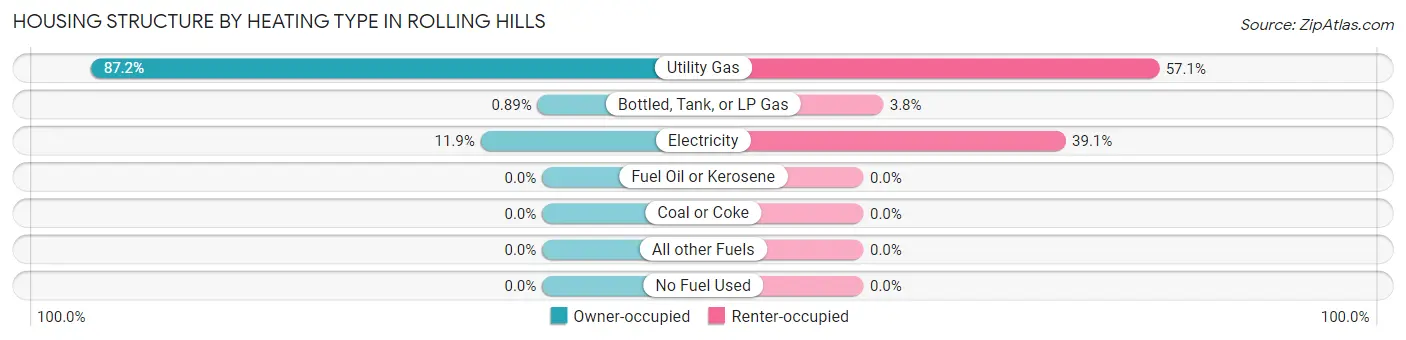
| Heating Type | Owner-occupied | Renter-occupied |
| Utility Gas | 293 (87.2%) | 60 (57.1%) |
| Bottled, Tank, or LP Gas | 3 (0.9%) | 4 (3.8%) |
| Electricity | 40 (11.9%) | 41 (39.1%) |
| Fuel Oil or Kerosene | 0 (0.0%) | 0 (0.0%) |
| Coal or Coke | 0 (0.0%) | 0 (0.0%) |
| All other Fuels | 0 (0.0%) | 0 (0.0%) |
| No Fuel Used | 0 (0.0%) | 0 (0.0%) |
| Total | 336 (100.0%) | 105 (100.0%) |
Household Vehicle Usage in Rolling Hills
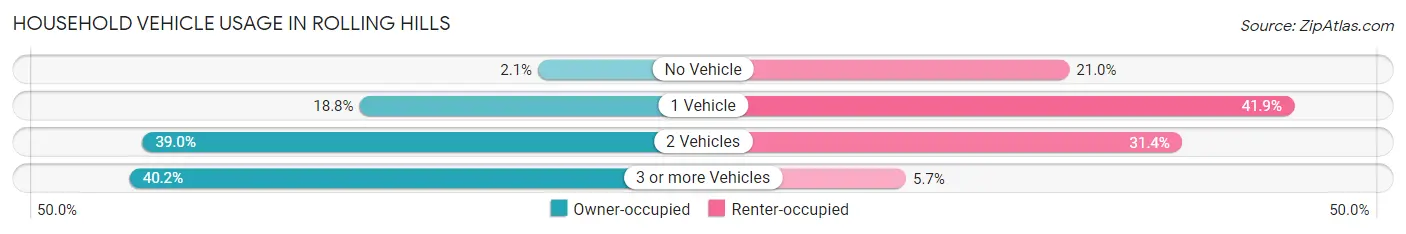
| Vehicles per Household | Owner-occupied | Renter-occupied |
| No Vehicle | 7 (2.1%) | 22 (20.9%) |
| 1 Vehicle | 63 (18.8%) | 44 (41.9%) |
| 2 Vehicles | 131 (39.0%) | 33 (31.4%) |
| 3 or more Vehicles | 135 (40.2%) | 6 (5.7%) |
| Total | 336 (100.0%) | 105 (100.0%) |
Real Estate & Mortgages in Rolling Hills
Real Estate and Mortgage Overview in Rolling Hills
| Characteristic | Without Mortgage | With Mortgage |
| Housing Units | 104 | 232 |
| Median Property Value | $234,800 | $275,900 |
| Median Household Income | $72,000 | $114 |
| Monthly Housing Costs | $561 | $3 |
| Real Estate Taxes | $1,736 | $2 |
Property Value by Mortgage Status in Rolling Hills
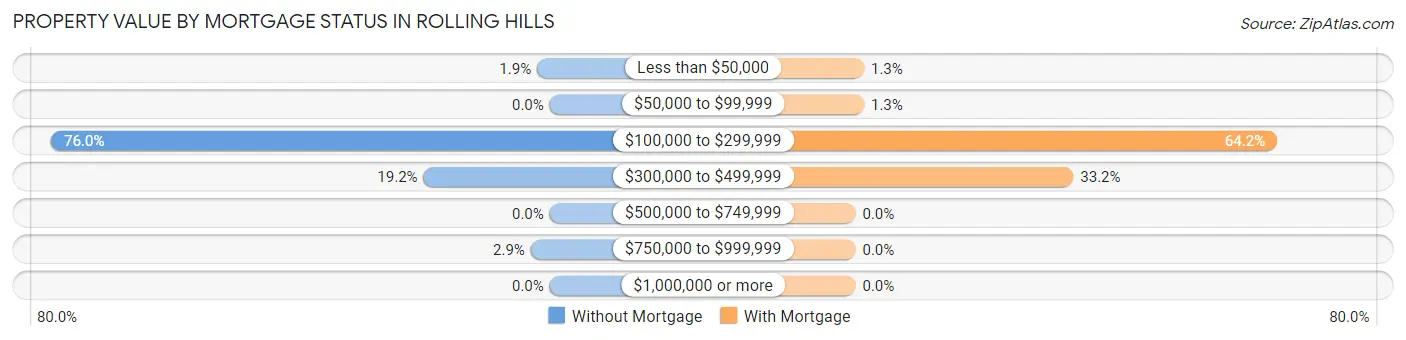
| Property Value | Without Mortgage | With Mortgage |
| Less than $50,000 | 2 (1.9%) | 3 (1.3%) |
| $50,000 to $99,999 | 0 (0.0%) | 3 (1.3%) |
| $100,000 to $299,999 | 79 (76.0%) | 149 (64.2%) |
| $300,000 to $499,999 | 20 (19.2%) | 77 (33.2%) |
| $500,000 to $749,999 | 0 (0.0%) | 0 (0.0%) |
| $750,000 to $999,999 | 3 (2.9%) | 0 (0.0%) |
| $1,000,000 or more | 0 (0.0%) | 0 (0.0%) |
| Total | 104 (100.0%) | 232 (100.0%) |
Household Income by Mortgage Status in Rolling Hills
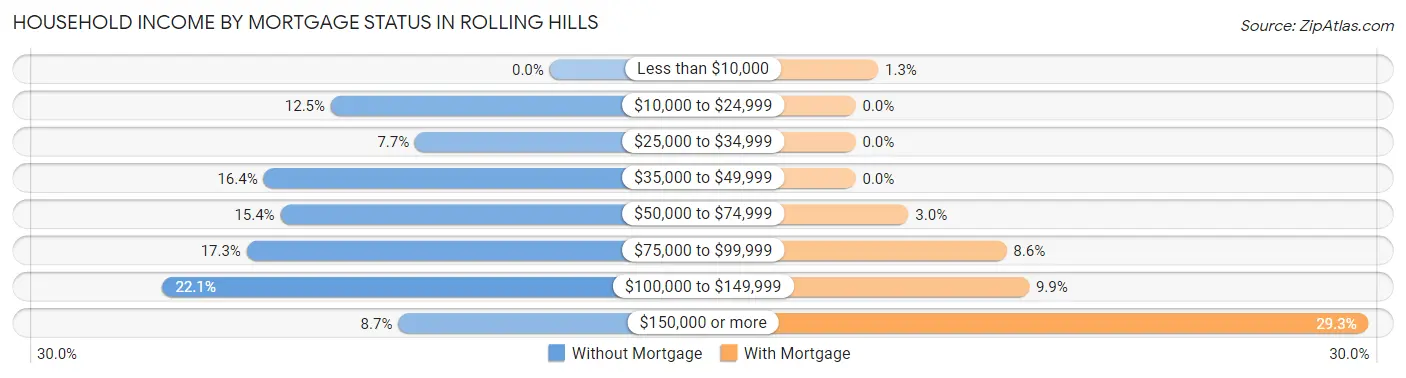
| Household Income | Without Mortgage | With Mortgage |
| Less than $10,000 | 0 (0.0%) | 3 (1.3%) |
| $10,000 to $24,999 | 13 (12.5%) | 0 (0.0%) |
| $25,000 to $34,999 | 8 (7.7%) | 0 (0.0%) |
| $35,000 to $49,999 | 17 (16.4%) | 0 (0.0%) |
| $50,000 to $74,999 | 16 (15.4%) | 7 (3.0%) |
| $75,000 to $99,999 | 18 (17.3%) | 20 (8.6%) |
| $100,000 to $149,999 | 23 (22.1%) | 23 (9.9%) |
| $150,000 or more | 9 (8.6%) | 68 (29.3%) |
| Total | 104 (100.0%) | 232 (100.0%) |
Property Value to Household Income Ratio in Rolling Hills
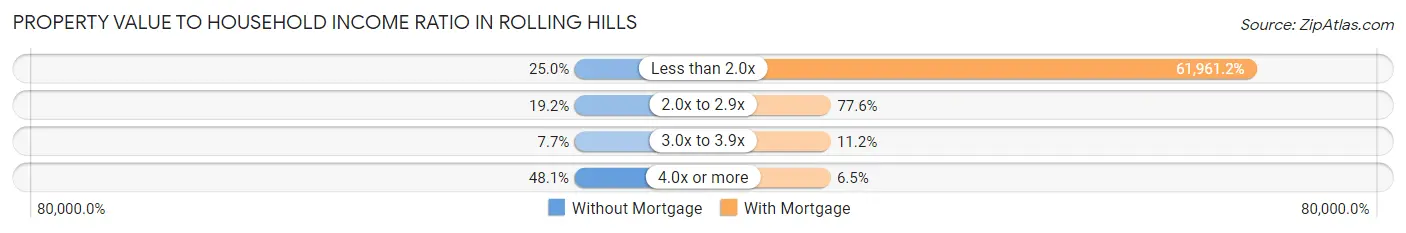
| Value-to-Income Ratio | Without Mortgage | With Mortgage |
| Less than 2.0x | 26 (25.0%) | 143,750 (61,961.2%) |
| 2.0x to 2.9x | 20 (19.2%) | 180 (77.6%) |
| 3.0x to 3.9x | 8 (7.7%) | 26 (11.2%) |
| 4.0x or more | 50 (48.1%) | 15 (6.5%) |
| Total | 104 (100.0%) | 232 (100.0%) |
Real Estate Taxes by Mortgage Status in Rolling Hills
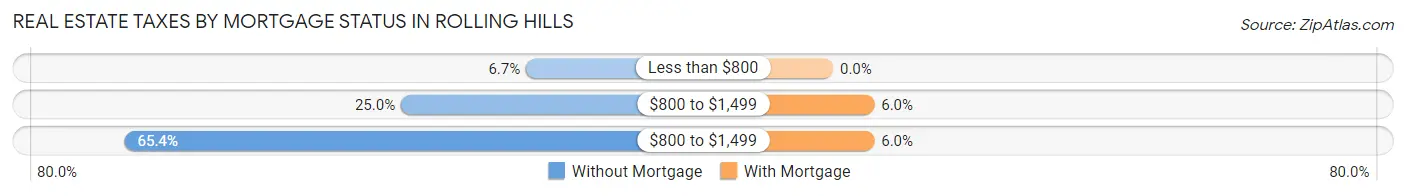
| Property Taxes | Without Mortgage | With Mortgage |
| Less than $800 | 7 (6.7%) | 0 (0.0%) |
| $800 to $1,499 | 26 (25.0%) | 14 (6.0%) |
| $800 to $1,499 | 68 (65.4%) | 14 (6.0%) |
| Total | 104 (100.0%) | 232 (100.0%) |
Health & Disability in Rolling Hills
Health Insurance Coverage by Age in Rolling Hills
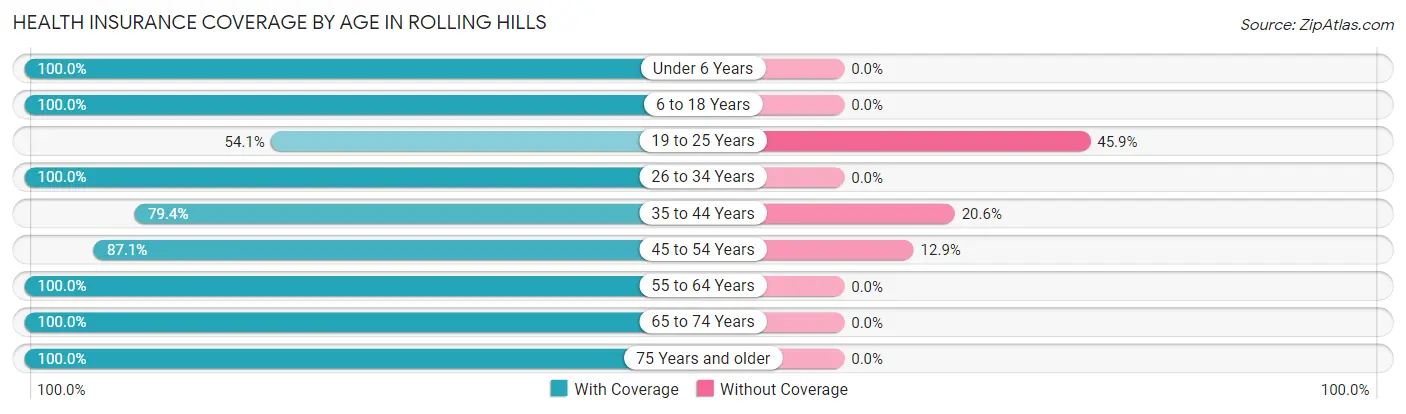
| Age Bracket | With Coverage | Without Coverage |
| Under 6 Years | 39 (100.0%) | 0 (0.0%) |
| 6 to 18 Years | 151 (100.0%) | 0 (0.0%) |
| 19 to 25 Years | 46 (54.1%) | 39 (45.9%) |
| 26 to 34 Years | 182 (100.0%) | 0 (0.0%) |
| 35 to 44 Years | 135 (79.4%) | 35 (20.6%) |
| 45 to 54 Years | 128 (87.1%) | 19 (12.9%) |
| 55 to 64 Years | 62 (100.0%) | 0 (0.0%) |
| 65 to 74 Years | 94 (100.0%) | 0 (0.0%) |
| 75 Years and older | 71 (100.0%) | 0 (0.0%) |
| Total | 908 (90.7%) | 93 (9.3%) |
Health Insurance Coverage by Citizenship Status in Rolling Hills
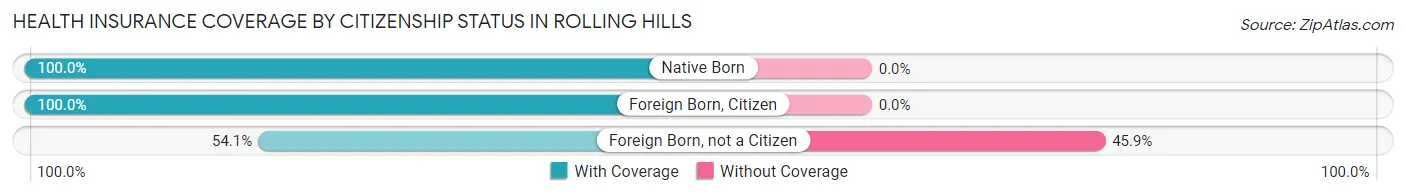
| Citizenship Status | With Coverage | Without Coverage |
| Native Born | 39 (100.0%) | 0 (0.0%) |
| Foreign Born, Citizen | 151 (100.0%) | 0 (0.0%) |
| Foreign Born, not a Citizen | 46 (54.1%) | 39 (45.9%) |
Health Insurance Coverage by Household Income in Rolling Hills
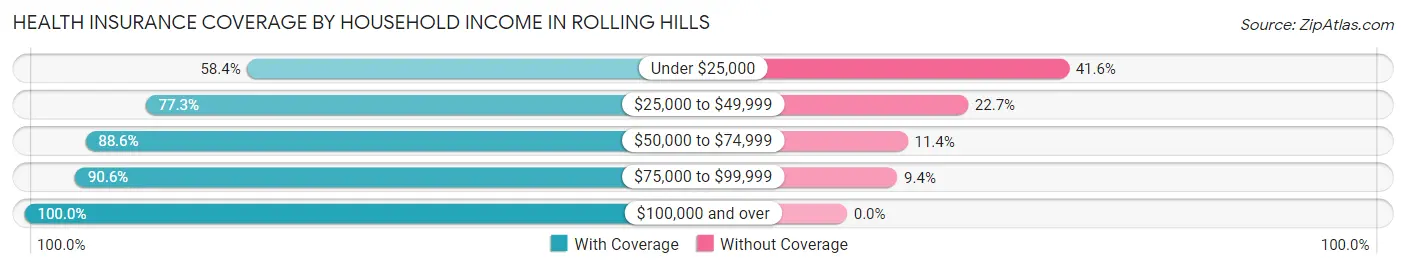
| Household Income | With Coverage | Without Coverage |
| Under $25,000 | 52 (58.4%) | 37 (41.6%) |
| $25,000 to $49,999 | 92 (77.3%) | 27 (22.7%) |
| $50,000 to $74,999 | 109 (88.6%) | 14 (11.4%) |
| $75,000 to $99,999 | 144 (90.6%) | 15 (9.4%) |
| $100,000 and over | 511 (100.0%) | 0 (0.0%) |
Public vs Private Health Insurance Coverage by Age in Rolling Hills
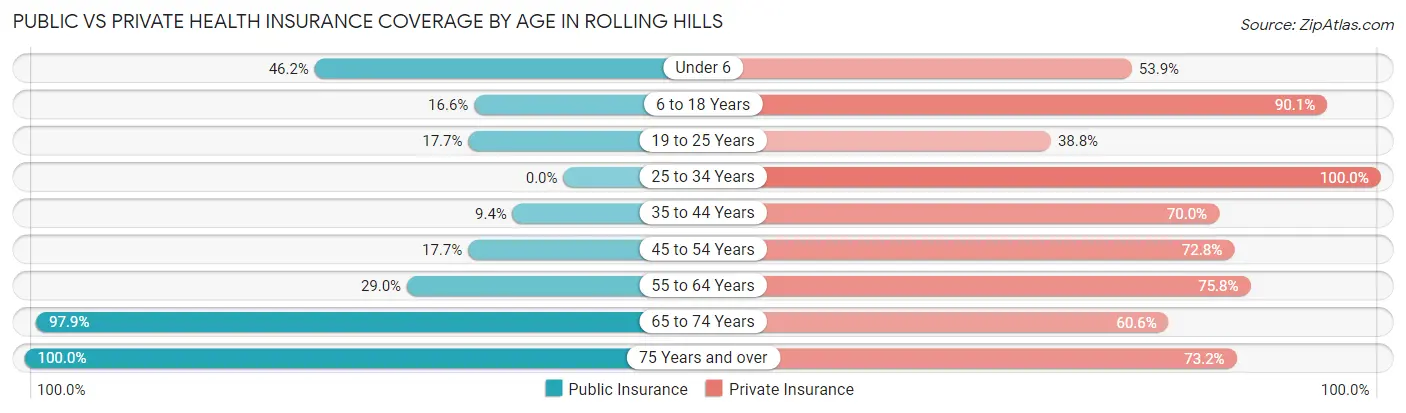
| Age Bracket | Public Insurance | Private Insurance |
| Under 6 | 18 (46.2%) | 21 (53.8%) |
| 6 to 18 Years | 25 (16.6%) | 136 (90.1%) |
| 19 to 25 Years | 15 (17.6%) | 33 (38.8%) |
| 25 to 34 Years | 0 (0.0%) | 182 (100.0%) |
| 35 to 44 Years | 16 (9.4%) | 119 (70.0%) |
| 45 to 54 Years | 26 (17.7%) | 107 (72.8%) |
| 55 to 64 Years | 18 (29.0%) | 47 (75.8%) |
| 65 to 74 Years | 92 (97.9%) | 57 (60.6%) |
| 75 Years and over | 71 (100.0%) | 52 (73.2%) |
| Total | 281 (28.1%) | 754 (75.3%) |
Disability Status by Sex by Age in Rolling Hills
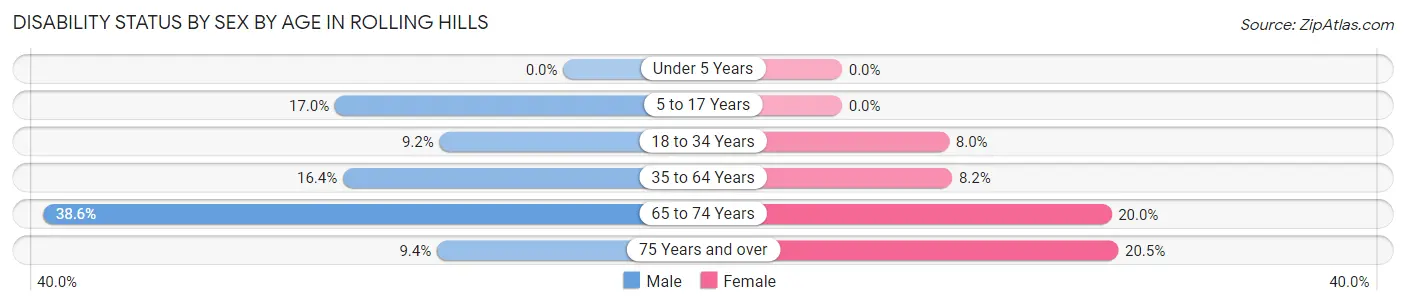
| Age Bracket | Male | Female |
| Under 5 Years | 0 (0.0%) | 0 (0.0%) |
| 5 to 17 Years | 10 (17.0%) | 0 (0.0%) |
| 18 to 34 Years | 17 (9.2%) | 7 (8.0%) |
| 35 to 64 Years | 36 (16.4%) | 13 (8.2%) |
| 65 to 74 Years | 17 (38.6%) | 10 (20.0%) |
| 75 Years and over | 3 (9.4%) | 8 (20.5%) |
Disability Class by Sex by Age in Rolling Hills
Disability Class: Hearing Difficulty
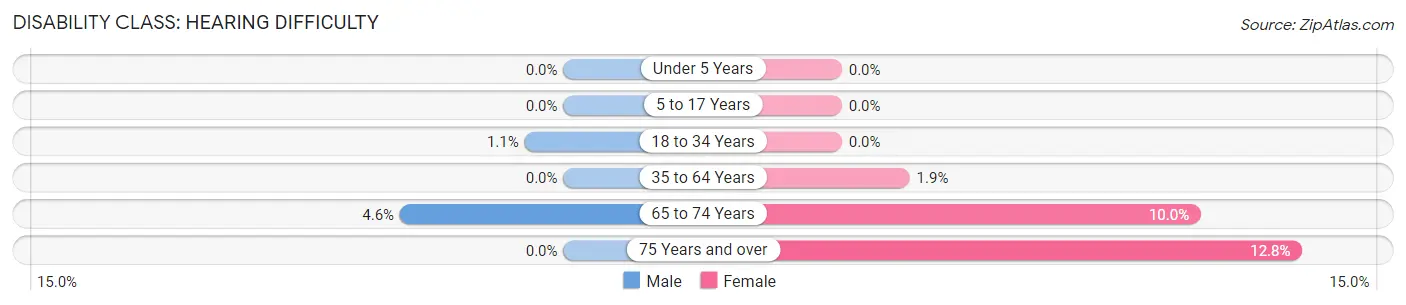
| Age Bracket | Male | Female |
| Under 5 Years | 0 (0.0%) | 0 (0.0%) |
| 5 to 17 Years | 0 (0.0%) | 0 (0.0%) |
| 18 to 34 Years | 2 (1.1%) | 0 (0.0%) |
| 35 to 64 Years | 0 (0.0%) | 3 (1.9%) |
| 65 to 74 Years | 2 (4.5%) | 5 (10.0%) |
| 75 Years and over | 0 (0.0%) | 5 (12.8%) |
Disability Class: Vision Difficulty
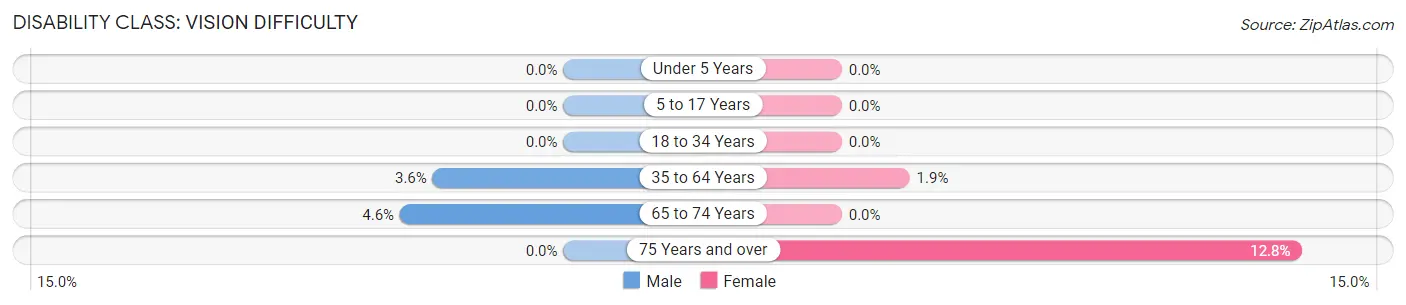
| Age Bracket | Male | Female |
| Under 5 Years | 0 (0.0%) | 0 (0.0%) |
| 5 to 17 Years | 0 (0.0%) | 0 (0.0%) |
| 18 to 34 Years | 0 (0.0%) | 0 (0.0%) |
| 35 to 64 Years | 8 (3.6%) | 3 (1.9%) |
| 65 to 74 Years | 2 (4.5%) | 0 (0.0%) |
| 75 Years and over | 0 (0.0%) | 5 (12.8%) |
Disability Class: Cognitive Difficulty
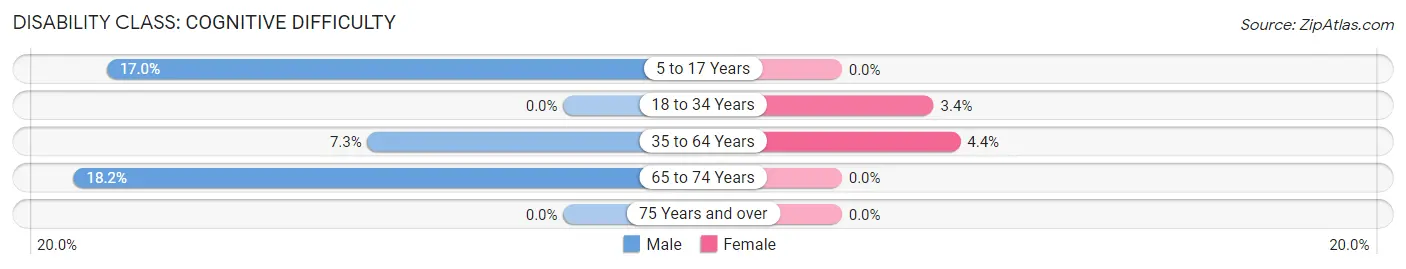
| Age Bracket | Male | Female |
| 5 to 17 Years | 10 (17.0%) | 0 (0.0%) |
| 18 to 34 Years | 0 (0.0%) | 3 (3.4%) |
| 35 to 64 Years | 16 (7.3%) | 7 (4.4%) |
| 65 to 74 Years | 8 (18.2%) | 0 (0.0%) |
| 75 Years and over | 0 (0.0%) | 0 (0.0%) |
Disability Class: Ambulatory Difficulty
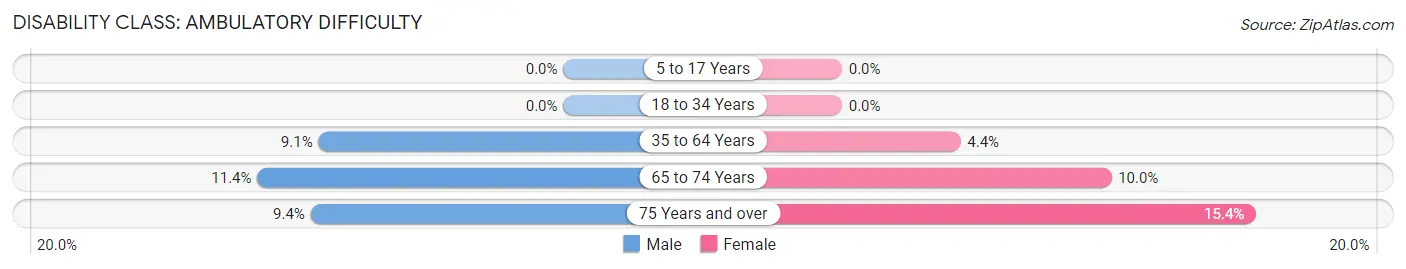
| Age Bracket | Male | Female |
| 5 to 17 Years | 0 (0.0%) | 0 (0.0%) |
| 18 to 34 Years | 0 (0.0%) | 0 (0.0%) |
| 35 to 64 Years | 20 (9.1%) | 7 (4.4%) |
| 65 to 74 Years | 5 (11.4%) | 5 (10.0%) |
| 75 Years and over | 3 (9.4%) | 6 (15.4%) |
Disability Class: Self-Care Difficulty
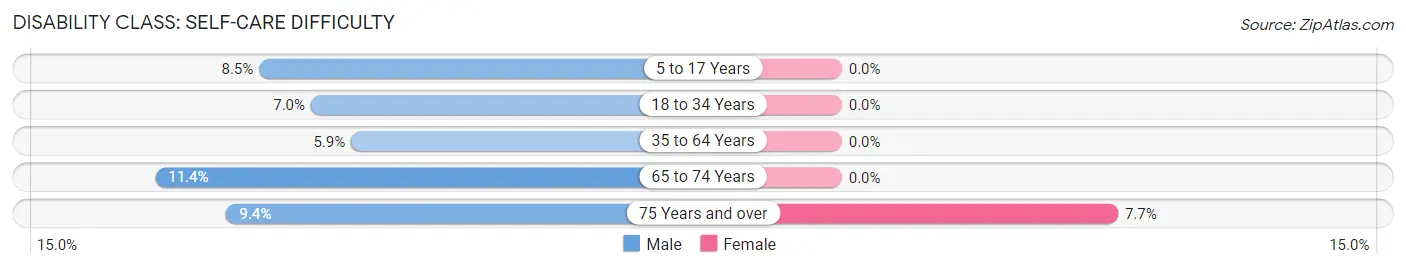
| Age Bracket | Male | Female |
| 5 to 17 Years | 5 (8.5%) | 0 (0.0%) |
| 18 to 34 Years | 13 (7.0%) | 0 (0.0%) |
| 35 to 64 Years | 13 (5.9%) | 0 (0.0%) |
| 65 to 74 Years | 5 (11.4%) | 0 (0.0%) |
| 75 Years and over | 3 (9.4%) | 3 (7.7%) |
Technology Access in Rolling Hills
Computing Device Access in Rolling Hills
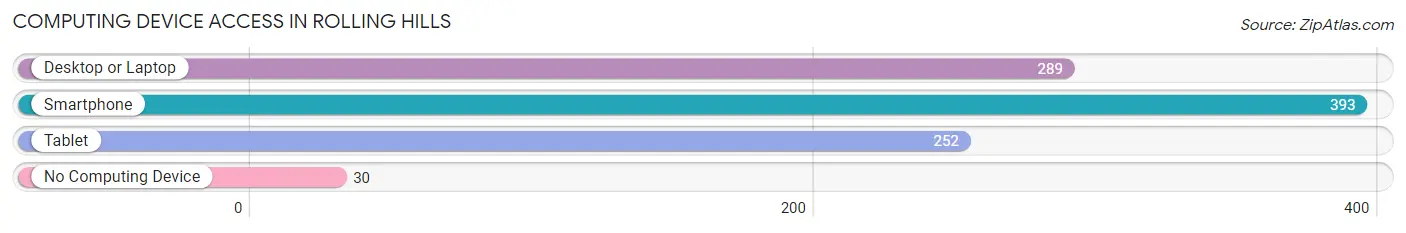
| Device Type | # Households | % Households |
| Desktop or Laptop | 289 | 65.5% |
| Smartphone | 393 | 89.1% |
| Tablet | 252 | 57.1% |
| No Computing Device | 30 | 6.8% |
| Total | 441 | 100.0% |
Internet Access in Rolling Hills
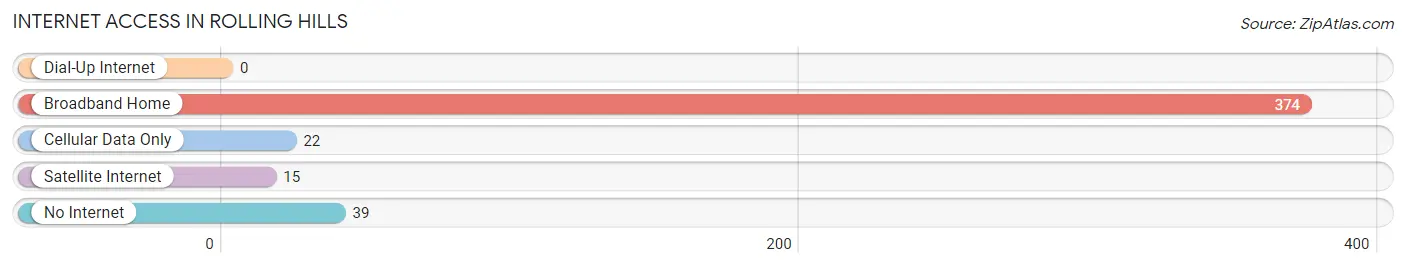
| Internet Type | # Households | % Households |
| Dial-Up Internet | 0 | 0.0% |
| Broadband Home | 374 | 84.8% |
| Cellular Data Only | 22 | 5.0% |
| Satellite Internet | 15 | 3.4% |
| No Internet | 39 | 8.8% |
| Total | 441 | 100.0% |
Rolling Hills Summary
Rolling Hills, Kentucky is a small town located in the Appalachian Mountains of Eastern Kentucky. It is situated in the foothills of the Cumberland Plateau, and is surrounded by rolling hills and lush forests. The town is located in the county of Harlan, and is part of the Harlan Micropolitan Statistical Area. The population of Rolling Hills was estimated to be 1,845 in the year 2000.
History
Rolling Hills was first settled in the late 1700s by a group of settlers from North Carolina. The town was originally known as “Rolling Hills Settlement” and was located in the area now known as Harlan County. The town was officially incorporated in 1820, and the name was changed to Rolling Hills in 1825.
The town was originally a farming community, and the main crops grown were corn, wheat, and tobacco. The town also had a few small businesses, such as a general store, a blacksmith, and a sawmill.
In the late 1800s, the town began to grow and develop. The railroad was built through the town in 1887, and this allowed for the transportation of goods and people. This led to the growth of the town, and it soon became a center for commerce and industry.
The town was also home to several coal mines, and this led to an influx of miners and their families. This increased the population of the town, and it soon became a bustling community.
Geography
Rolling Hills is located in the Appalachian Mountains of Eastern Kentucky. It is situated in the foothills of the Cumberland Plateau, and is surrounded by rolling hills and lush forests. The town is located in the county of Harlan, and is part of the Harlan Micropolitan Statistical Area.
The town is located at an elevation of 1,000 feet above sea level, and the climate is humid subtropical. The average temperature in the summer is around 75 degrees Fahrenheit, and the average temperature in the winter is around 40 degrees Fahrenheit.
Economy
The economy of Rolling Hills is largely based on agriculture and tourism. The town is home to several farms, and the main crops grown are corn, wheat, and tobacco. The town also has several small businesses, such as a general store, a blacksmith, and a sawmill.
The town is also home to several coal mines, and this has led to an influx of miners and their families. This has increased the population of the town, and it has become a center for commerce and industry.
The town is also a popular tourist destination, and it is home to several attractions, such as the Harlan County Museum, the Harlan County Courthouse, and the Harlan County Historical Society.
Demographics
The population of Rolling Hills was estimated to be 1,845 in the year 2000. The population is largely white, with a small percentage of African Americans and Native Americans. The median household income is around $30,000, and the median age is around 40 years old. The town has a low unemployment rate, and the majority of the population is employed in the agricultural and tourism industries.
Common Questions
What is Per Capita Income in Rolling Hills?
Per Capita income in Rolling Hills is $49,691.
What is the Median Family Income in Rolling Hills?
Median Family Income in Rolling Hills is $99,375.
What is the Median Household income in Rolling Hills?
Median Household Income in Rolling Hills is $99,792.
What is Income or Wage Gap in Rolling Hills?
Income or Wage Gap in Rolling Hills is 3.3%.
Women in Rolling Hills earn 96.7 cents for every dollar earned by a man.
What is Family Income Deficit in Rolling Hills?
Family Income Deficit in Rolling Hills is $5,983.
Families that are below poverty line in Rolling Hills earn $5,983 less on average than the poverty threshold level.
What is Inequality or Gini Index in Rolling Hills?
Inequality or Gini Index in Rolling Hills is 0.35.
What is the Total Population of Rolling Hills?
Total Population of Rolling Hills is 1,001.
What is the Total Male Population of Rolling Hills?
Total Male Population of Rolling Hills is 551.
What is the Total Female Population of Rolling Hills?
Total Female Population of Rolling Hills is 450.
What is the Ratio of Males per 100 Females in Rolling Hills?
There are 122.44 Males per 100 Females in Rolling Hills.
What is the Ratio of Females per 100 Males in Rolling Hills?
There are 81.67 Females per 100 Males in Rolling Hills.
What is the Median Population Age in Rolling Hills?
Median Population Age in Rolling Hills is 37.5 Years.
What is the Average Family Size in Rolling Hills
Average Family Size in Rolling Hills is 2.9 People.
What is the Average Household Size in Rolling Hills
Average Household Size in Rolling Hills is 2.3 People.
How Large is the Labor Force in Rolling Hills?
There are 621 People in the Labor Forcein in Rolling Hills.
What is the Percentage of People in the Labor Force in Rolling Hills?
73.8% of People are in the Labor Force in Rolling Hills.
What is the Unemployment Rate in Rolling Hills?
Unemployment Rate in Rolling Hills is 3.4%.