Cloverport, KY Map & Demographics
Cloverport Map
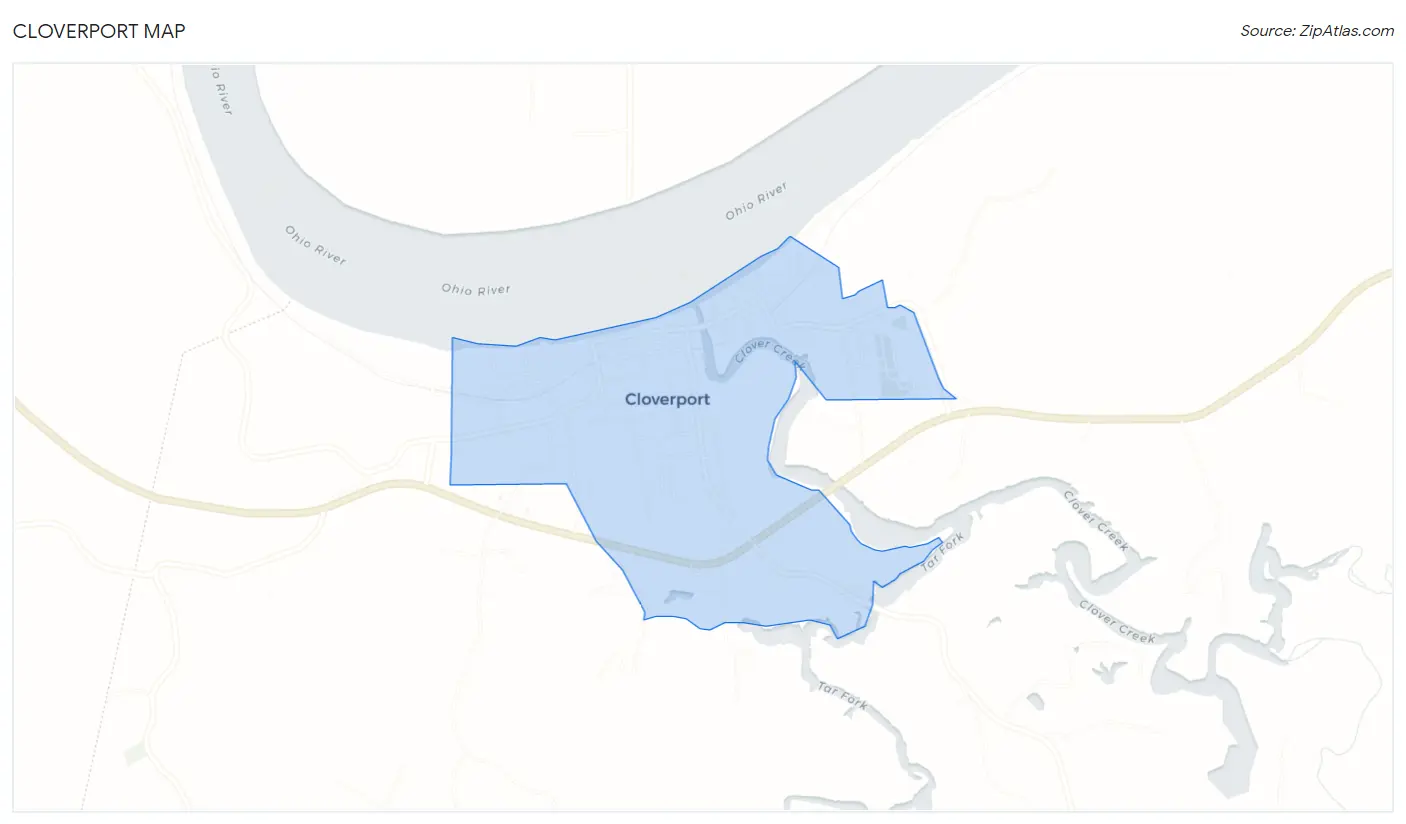
Cloverport Overview
$17,742
PER CAPITA INCOME
$44,148
AVG FAMILY INCOME
$33,250
AVG HOUSEHOLD INCOME
44.7%
WAGE / INCOME GAP [ % ]
55.3¢/ $1
WAGE / INCOME GAP [ $ ]
0.46
INEQUALITY / GINI INDEX
1,185
TOTAL POPULATION
603
MALE POPULATION
582
FEMALE POPULATION
103.61
MALES / 100 FEMALES
96.52
FEMALES / 100 MALES
46.6
MEDIAN AGE
3.3
AVG FAMILY SIZE
2.5
AVG HOUSEHOLD SIZE
443
LABOR FORCE [ PEOPLE ]
45.1%
PERCENT IN LABOR FORCE
18.1%
UNEMPLOYMENT RATE
Cloverport Zip Codes
Cloverport Area Codes
Income in Cloverport
Income Overview in Cloverport
Per Capita Income in Cloverport is $17,742, while median incomes of families and households are $44,148 and $33,250 respectively.
| Characteristic | Number | Measure |
| Per Capita Income | 1,185 | $17,742 |
| Median Family Income | 273 | $44,148 |
| Mean Family Income | 273 | $50,278 |
| Median Household Income | 466 | $33,250 |
| Mean Household Income | 466 | $41,663 |
| Income Deficit | 273 | $0 |
| Wage / Income Gap (%) | 1,185 | 44.74% |
| Wage / Income Gap ($) | 1,185 | 55.26¢ per $1 |
| Gini / Inequality Index | 1,185 | 0.46 |
Earnings by Sex in Cloverport
Average Earnings in Cloverport are $26,518, $32,961 for men and $18,214 for women, a difference of 44.7%.
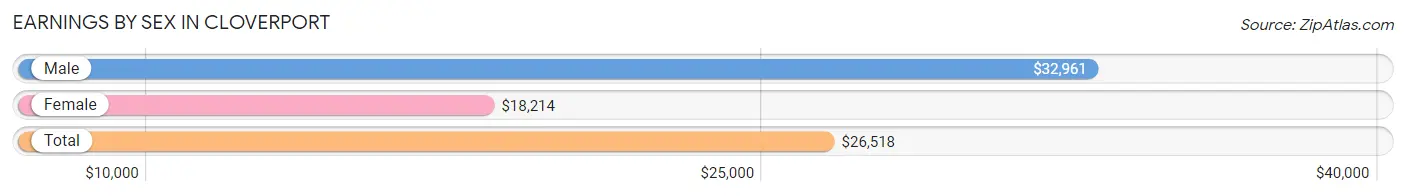
| Sex | Number | Average Earnings |
| Male | 245 (56.8%) | $32,961 |
| Female | 186 (43.2%) | $18,214 |
| Total | 431 (100.0%) | $26,518 |
Earnings by Sex by Income Bracket in Cloverport
The most common earnings brackets in Cloverport are $30,000 to $34,999 for men (37 | 15.1%) and $40,000 to $44,999 for women (29 | 15.6%).
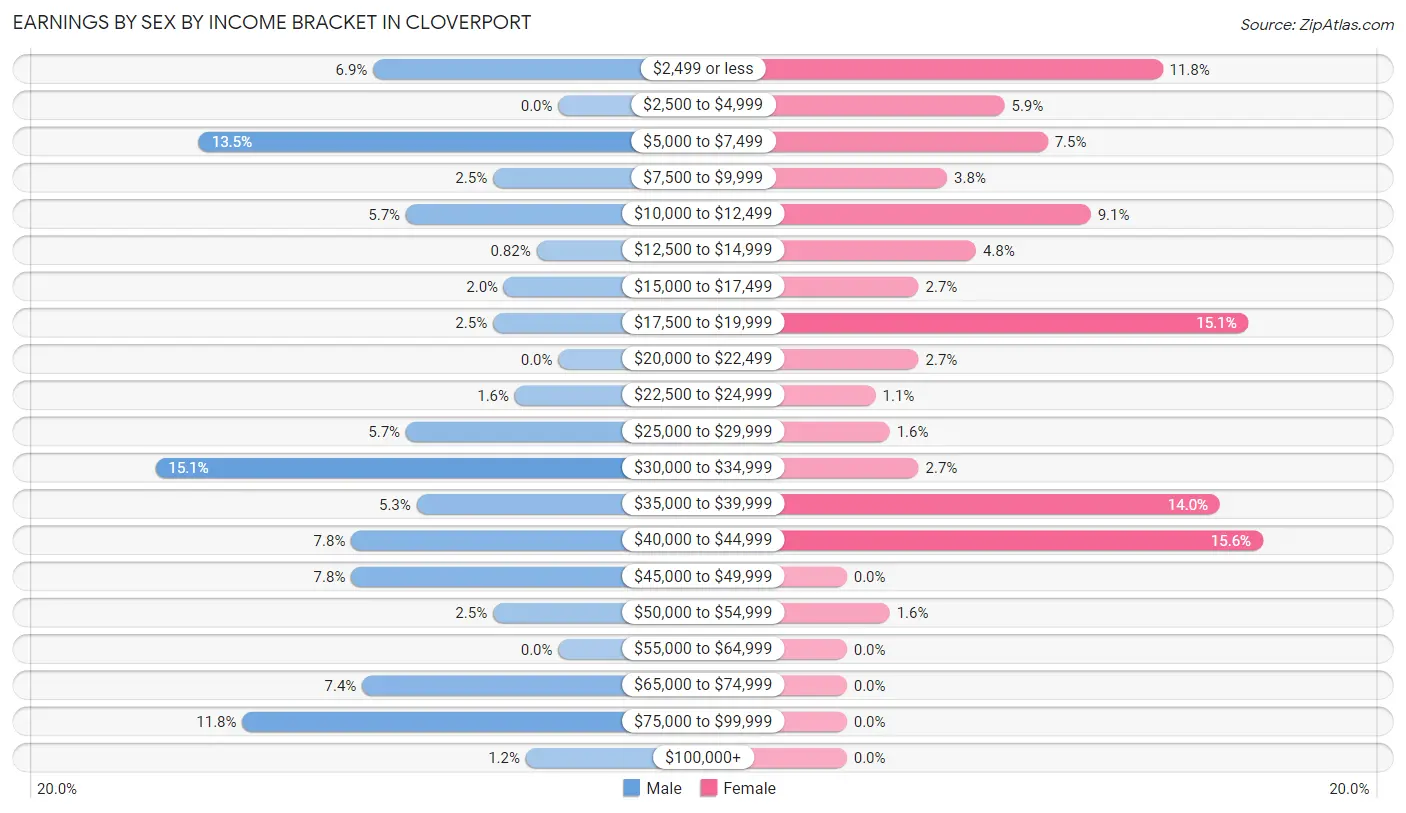
| Income | Male | Female |
| $2,499 or less | 17 (6.9%) | 22 (11.8%) |
| $2,500 to $4,999 | 0 (0.0%) | 11 (5.9%) |
| $5,000 to $7,499 | 33 (13.5%) | 14 (7.5%) |
| $7,500 to $9,999 | 6 (2.5%) | 7 (3.8%) |
| $10,000 to $12,499 | 14 (5.7%) | 17 (9.1%) |
| $12,500 to $14,999 | 2 (0.8%) | 9 (4.8%) |
| $15,000 to $17,499 | 5 (2.0%) | 5 (2.7%) |
| $17,500 to $19,999 | 6 (2.5%) | 28 (15.0%) |
| $20,000 to $22,499 | 0 (0.0%) | 5 (2.7%) |
| $22,500 to $24,999 | 4 (1.6%) | 2 (1.1%) |
| $25,000 to $29,999 | 14 (5.7%) | 3 (1.6%) |
| $30,000 to $34,999 | 37 (15.1%) | 5 (2.7%) |
| $35,000 to $39,999 | 13 (5.3%) | 26 (14.0%) |
| $40,000 to $44,999 | 19 (7.8%) | 29 (15.6%) |
| $45,000 to $49,999 | 19 (7.8%) | 0 (0.0%) |
| $50,000 to $54,999 | 6 (2.5%) | 3 (1.6%) |
| $55,000 to $64,999 | 0 (0.0%) | 0 (0.0%) |
| $65,000 to $74,999 | 18 (7.3%) | 0 (0.0%) |
| $75,000 to $99,999 | 29 (11.8%) | 0 (0.0%) |
| $100,000+ | 3 (1.2%) | 0 (0.0%) |
| Total | 245 (100.0%) | 186 (100.0%) |
Earnings by Sex by Educational Attainment in Cloverport
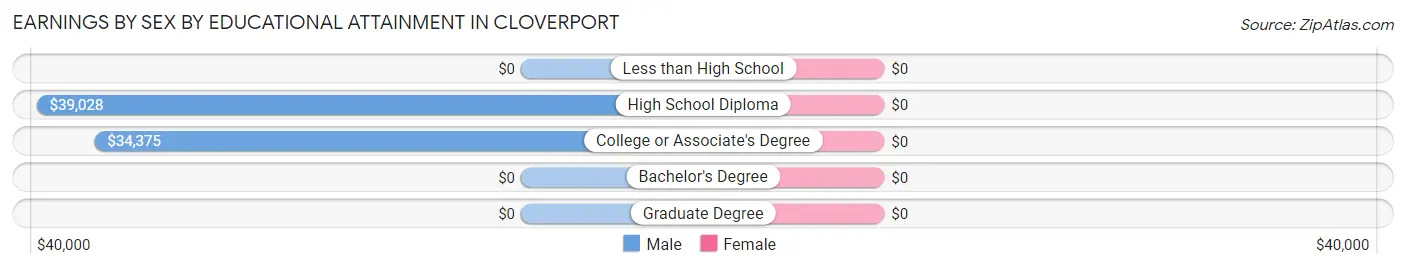
| Educational Attainment | Male Income | Female Income |
| Less than High School | - | - |
| High School Diploma | $39,028 | $0 |
| College or Associate's Degree | $34,375 | $0 |
| Bachelor's Degree | - | - |
| Graduate Degree | - | - |
| Total | $38,056 | $18,043 |
Family Income in Cloverport
Family Income Brackets in Cloverport
According to the Cloverport family income data, there are 64 families falling into the $75,000 to $99,999 income range, which is the most common income bracket and makes up 23.4% of all families.
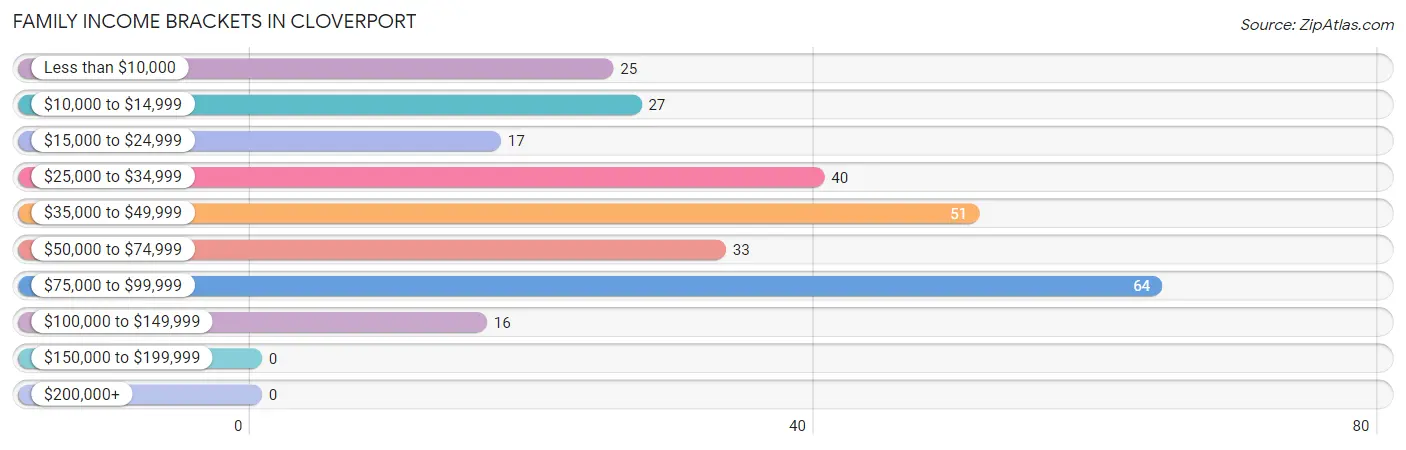
| Income Bracket | # Families | % Families |
| Less than $10,000 | 25 | 9.2% |
| $10,000 to $14,999 | 27 | 9.9% |
| $15,000 to $24,999 | 17 | 6.2% |
| $25,000 to $34,999 | 40 | 14.7% |
| $35,000 to $49,999 | 51 | 18.7% |
| $50,000 to $74,999 | 33 | 12.1% |
| $75,000 to $99,999 | 64 | 23.4% |
| $100,000 to $149,999 | 16 | 5.9% |
| $150,000 to $199,999 | 0 | 0.0% |
| $200,000+ | 0 | 0.0% |
Family Income by Famaliy Size in Cloverport
5-person families (15 | 5.5%) account for the highest median family income in Cloverport with $81,042 per family, while 2-person families (163 | 59.7%) have the highest median income of $21,782 per family member.
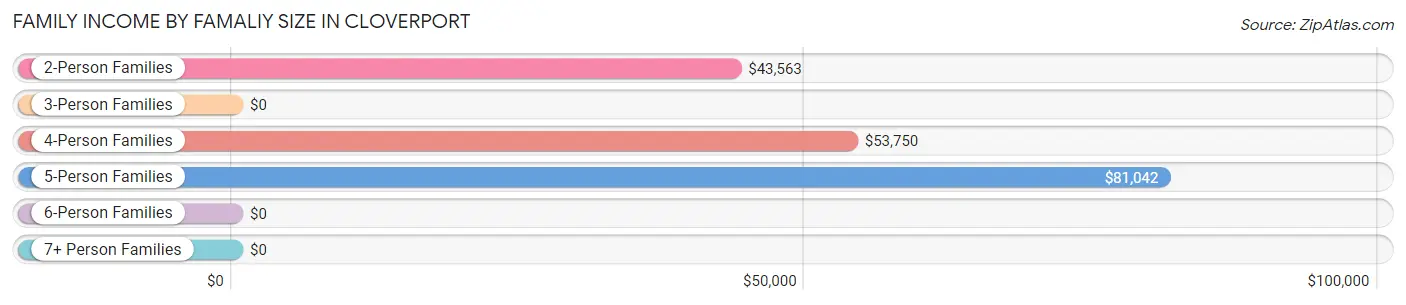
| Income Bracket | # Families | Median Income |
| 2-Person Families | 163 (59.7%) | $43,563 |
| 3-Person Families | 57 (20.9%) | $0 |
| 4-Person Families | 34 (12.4%) | $53,750 |
| 5-Person Families | 15 (5.5%) | $81,042 |
| 6-Person Families | 2 (0.7%) | $0 |
| 7+ Person Families | 2 (0.7%) | $0 |
| Total | 273 (100.0%) | $44,148 |
Family Income by Number of Earners in Cloverport
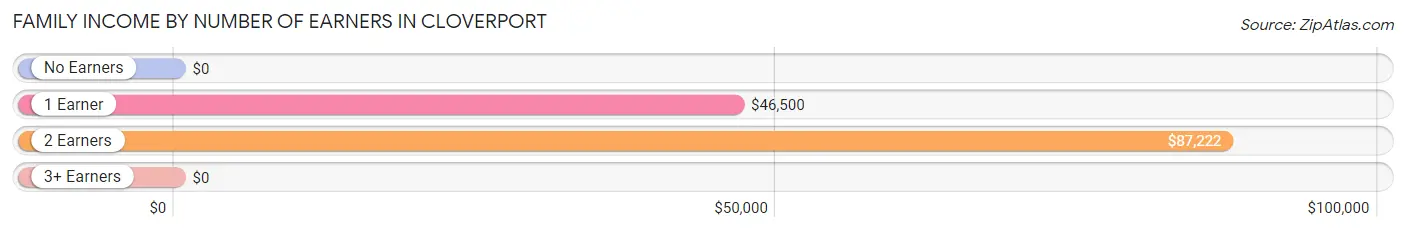
| Number of Earners | # Families | Median Income |
| No Earners | 73 (26.7%) | $0 |
| 1 Earner | 138 (50.5%) | $46,500 |
| 2 Earners | 56 (20.5%) | $87,222 |
| 3+ Earners | 6 (2.2%) | $0 |
| Total | 273 (100.0%) | $44,148 |
Household Income in Cloverport
Household Income Brackets in Cloverport
With 82 households falling in the category, the $75,000 to $99,999 income range is the most frequent in Cloverport, accounting for 17.6% of all households.
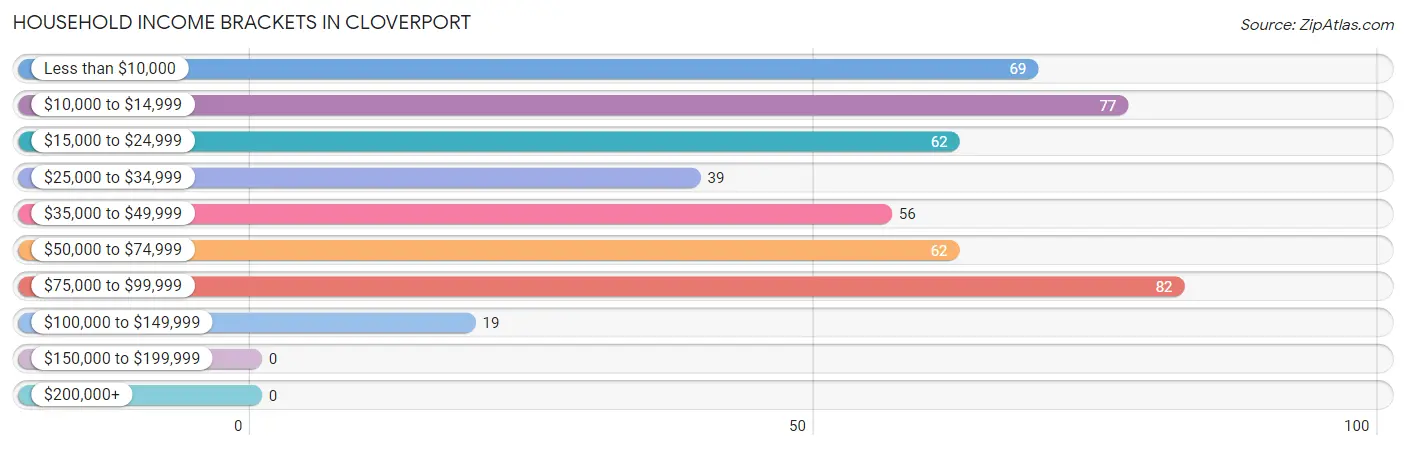
| Income Bracket | # Households | % Households |
| Less than $10,000 | 69 | 14.8% |
| $10,000 to $14,999 | 77 | 16.5% |
| $15,000 to $24,999 | 62 | 13.3% |
| $25,000 to $34,999 | 39 | 8.4% |
| $35,000 to $49,999 | 56 | 12.0% |
| $50,000 to $74,999 | 62 | 13.3% |
| $75,000 to $99,999 | 82 | 17.6% |
| $100,000 to $149,999 | 19 | 4.1% |
| $150,000 to $199,999 | 0 | 0.0% |
| $200,000+ | 0 | 0.0% |
Household Income by Householder Age in Cloverport
The median household income in Cloverport is $33,250, with the highest median household income of $86,111 found in the 15 to 24 years age bracket for the primary householder. A total of 22 households (4.7%) fall into this category. Meanwhile, the 25 to 44 years age bracket for the primary householder has the lowest median household income of $0, with 92 households (19.7%) in this group.
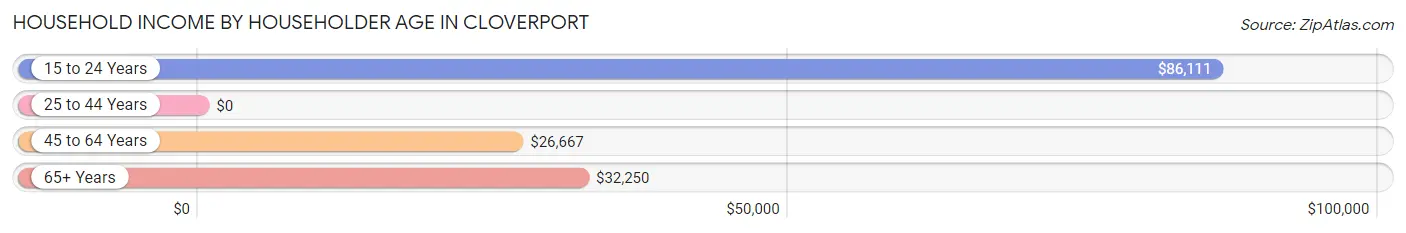
| Income Bracket | # Households | Median Income |
| 15 to 24 Years | 22 (4.7%) | $86,111 |
| 25 to 44 Years | 92 (19.7%) | $0 |
| 45 to 64 Years | 170 (36.5%) | $26,667 |
| 65+ Years | 182 (39.1%) | $32,250 |
| Total | 466 (100.0%) | $33,250 |
Poverty in Cloverport
Income Below Poverty by Sex and Age in Cloverport
With 35.2% poverty level for males and 35.0% for females among the residents of Cloverport, 12 to 14 year old males and 16 and 17 year old females are the most vulnerable to poverty, with 22 males (62.9%) and 5 females (83.3%) in their respective age groups living below the poverty level.
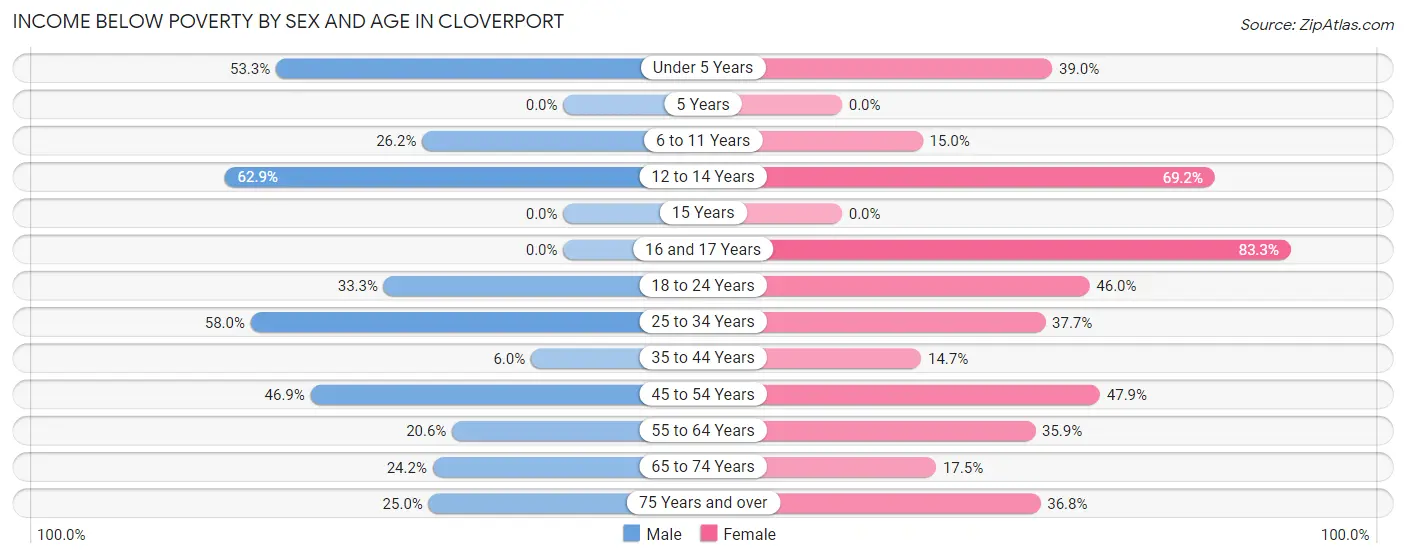
| Age Bracket | Male | Female |
| Under 5 Years | 24 (53.3%) | 16 (39.0%) |
| 5 Years | 0 (0.0%) | 0 (0.0%) |
| 6 to 11 Years | 11 (26.2%) | 3 (15.0%) |
| 12 to 14 Years | 22 (62.9%) | 9 (69.2%) |
| 15 Years | 0 (0.0%) | 0 (0.0%) |
| 16 and 17 Years | 0 (0.0%) | 5 (83.3%) |
| 18 to 24 Years | 26 (33.3%) | 17 (46.0%) |
| 25 to 34 Years | 47 (58.0%) | 20 (37.7%) |
| 35 to 44 Years | 3 (6.0%) | 5 (14.7%) |
| 45 to 54 Years | 38 (46.9%) | 57 (47.9%) |
| 55 to 64 Years | 13 (20.6%) | 33 (35.9%) |
| 65 to 74 Years | 16 (24.2%) | 18 (17.5%) |
| 75 Years and over | 12 (25.0%) | 21 (36.8%) |
| Total | 212 (35.2%) | 204 (35.0%) |
Income Above Poverty by Sex and Age in Cloverport
According to the poverty statistics in Cloverport, males aged 16 and 17 years and females aged 5 years are the age groups that are most secure financially, with 100.0% of males and 100.0% of females in these age groups living above the poverty line.
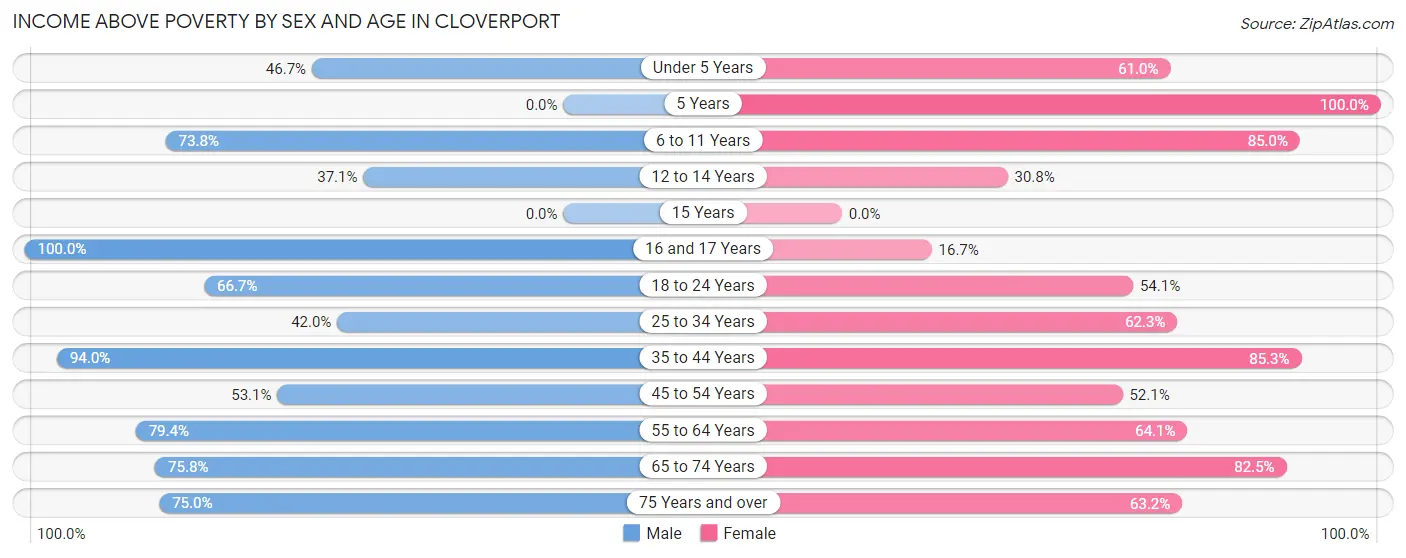
| Age Bracket | Male | Female |
| Under 5 Years | 21 (46.7%) | 25 (61.0%) |
| 5 Years | 0 (0.0%) | 7 (100.0%) |
| 6 to 11 Years | 31 (73.8%) | 17 (85.0%) |
| 12 to 14 Years | 13 (37.1%) | 4 (30.8%) |
| 15 Years | 0 (0.0%) | 0 (0.0%) |
| 16 and 17 Years | 14 (100.0%) | 1 (16.7%) |
| 18 to 24 Years | 52 (66.7%) | 20 (54.0%) |
| 25 to 34 Years | 34 (42.0%) | 33 (62.3%) |
| 35 to 44 Years | 47 (94.0%) | 29 (85.3%) |
| 45 to 54 Years | 43 (53.1%) | 62 (52.1%) |
| 55 to 64 Years | 50 (79.4%) | 59 (64.1%) |
| 65 to 74 Years | 50 (75.8%) | 85 (82.5%) |
| 75 Years and over | 36 (75.0%) | 36 (63.2%) |
| Total | 391 (64.8%) | 378 (64.9%) |
Income Below Poverty Among Married-Couple Families in Cloverport
The poverty statistics for married-couple families in Cloverport show that 18.1% or 30 of the total 166 families live below the poverty line. Families with 5 or more children have the highest poverty rate of 100.0%, comprising of 2 families. On the other hand, families with 3 or 4 children have the lowest poverty rate of 0.0%, which includes 0 families.
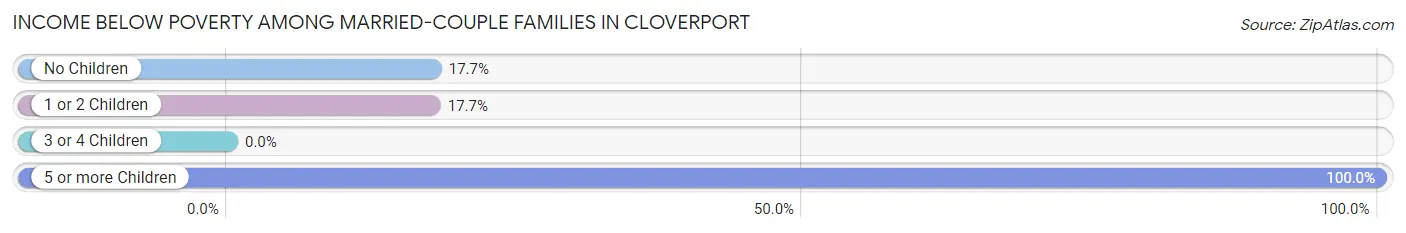
| Children | Above Poverty | Below Poverty |
| No Children | 102 (82.3%) | 22 (17.7%) |
| 1 or 2 Children | 28 (82.4%) | 6 (17.6%) |
| 3 or 4 Children | 6 (100.0%) | 0 (0.0%) |
| 5 or more Children | 0 (0.0%) | 2 (100.0%) |
| Total | 136 (81.9%) | 30 (18.1%) |
Income Below Poverty Among Single-Parent Households in Cloverport
According to the poverty data in Cloverport, 11.8% or 4 single-father households and 50.7% or 37 single-mother households are living below the poverty line. Among single-father households, those with no children have the highest poverty rate, with 4 households (57.1%) experiencing poverty. Likewise, among single-mother households, those with 3 or 4 children have the highest poverty rate, with 6 households (100.0%) falling below the poverty line.
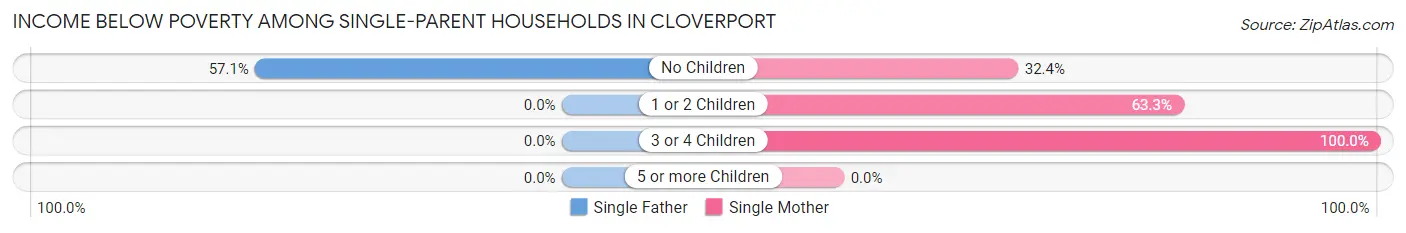
| Children | Single Father | Single Mother |
| No Children | 4 (57.1%) | 12 (32.4%) |
| 1 or 2 Children | 0 (0.0%) | 19 (63.3%) |
| 3 or 4 Children | 0 (0.0%) | 6 (100.0%) |
| 5 or more Children | 0 (0.0%) | 0 (0.0%) |
| Total | 4 (11.8%) | 37 (50.7%) |
Income Below Poverty Among Married-Couple vs Single-Parent Households in Cloverport
The poverty data for Cloverport shows that 30 of the married-couple family households (18.1%) and 41 of the single-parent households (38.3%) are living below the poverty level. Within the married-couple family households, those with 5 or more children have the highest poverty rate, with 2 households (100.0%) falling below the poverty line. Among the single-parent households, those with 3 or 4 children have the highest poverty rate, with 6 household (100.0%) living below poverty.
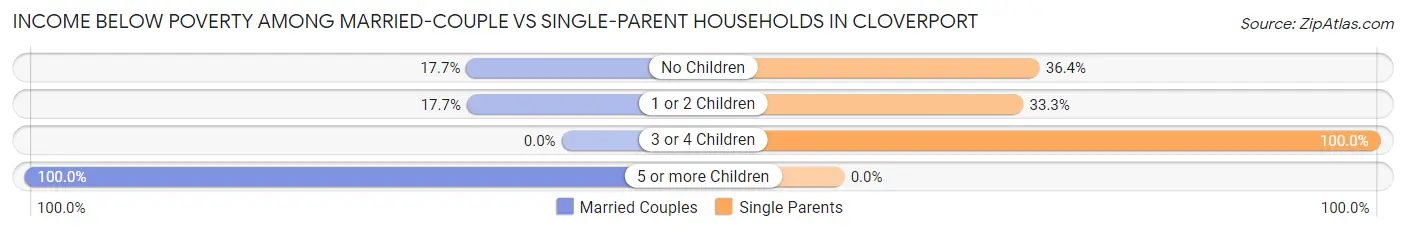
| Children | Married-Couple Families | Single-Parent Households |
| No Children | 22 (17.7%) | 16 (36.4%) |
| 1 or 2 Children | 6 (17.6%) | 19 (33.3%) |
| 3 or 4 Children | 0 (0.0%) | 6 (100.0%) |
| 5 or more Children | 2 (100.0%) | 0 (0.0%) |
| Total | 30 (18.1%) | 41 (38.3%) |
Race in Cloverport
The most populous races in Cloverport are White / Caucasian (1,151 | 97.1%), Two or more Races (34 | 2.9%), and Hispanic or Latino (20 | 1.7%).
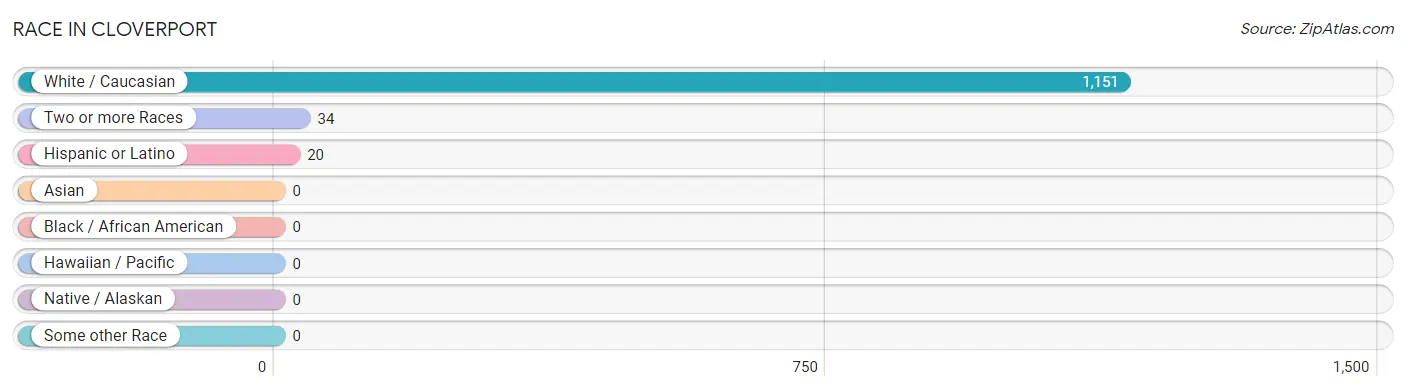
| Race | # Population | % Population |
| Asian | 0 | 0.0% |
| Black / African American | 0 | 0.0% |
| Hawaiian / Pacific | 0 | 0.0% |
| Hispanic or Latino | 20 | 1.7% |
| Native / Alaskan | 0 | 0.0% |
| White / Caucasian | 1,151 | 97.1% |
| Two or more Races | 34 | 2.9% |
| Some other Race | 0 | 0.0% |
| Total | 1,185 | 100.0% |
Ancestry in Cloverport
The most populous ancestries reported in Cloverport are American (143 | 12.1%), Irish (142 | 12.0%), English (108 | 9.1%), German (61 | 5.1%), and Scottish (30 | 2.5%), together accounting for 40.8% of all Cloverport residents.
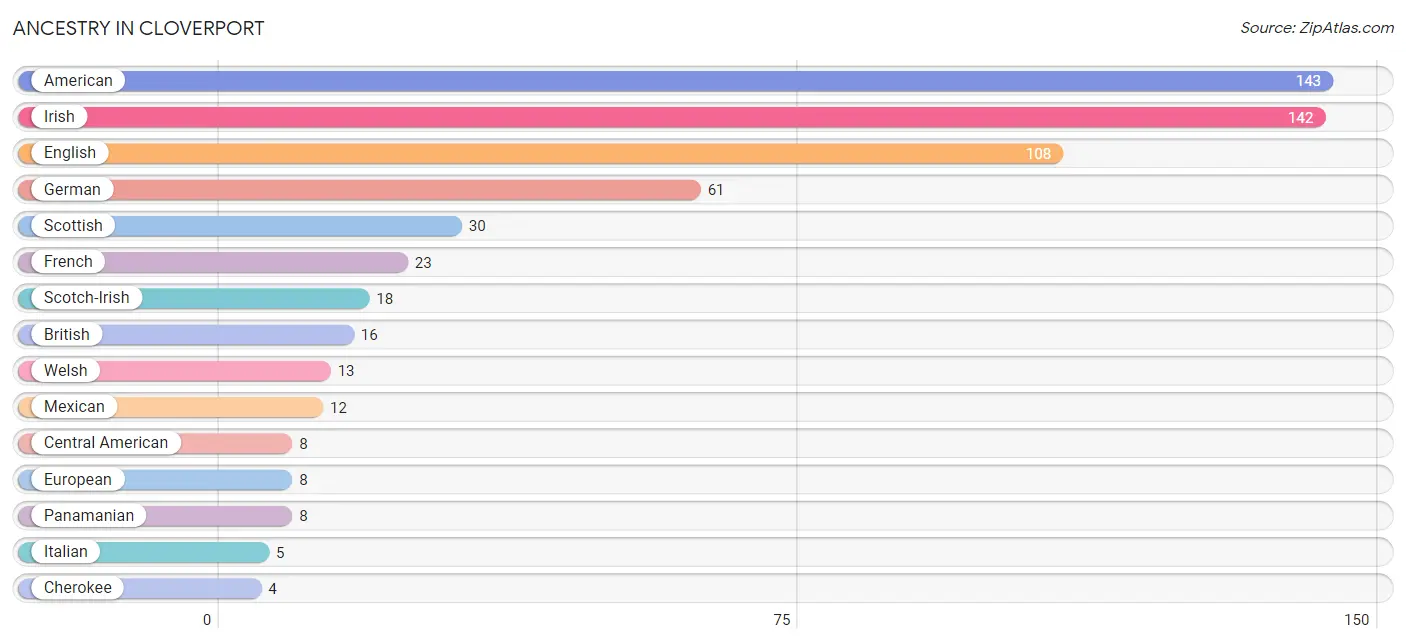
| Ancestry | # Population | % Population |
| American | 143 | 12.1% |
| Arab | 2 | 0.2% |
| Bhutanese | 3 | 0.3% |
| British | 16 | 1.3% |
| Central American | 8 | 0.7% |
| Cherokee | 4 | 0.3% |
| English | 108 | 9.1% |
| European | 8 | 0.7% |
| French | 23 | 1.9% |
| German | 61 | 5.1% |
| Irish | 142 | 12.0% |
| Italian | 5 | 0.4% |
| Lebanese | 2 | 0.2% |
| Mexican | 12 | 1.0% |
| Panamanian | 8 | 0.7% |
| Scotch-Irish | 18 | 1.5% |
| Scottish | 30 | 2.5% |
| Swedish | 3 | 0.3% |
| Welsh | 13 | 1.1% | View All 19 Rows |
Immigrants in Cloverport

| Immigration Origin | # Population | % Population | View All 0 Rows |
Sex and Age in Cloverport
Sex and Age in Cloverport
The most populous age groups in Cloverport are 25 to 29 Years (74 | 12.3%) for men and 50 to 54 Years (78 | 13.4%) for women.
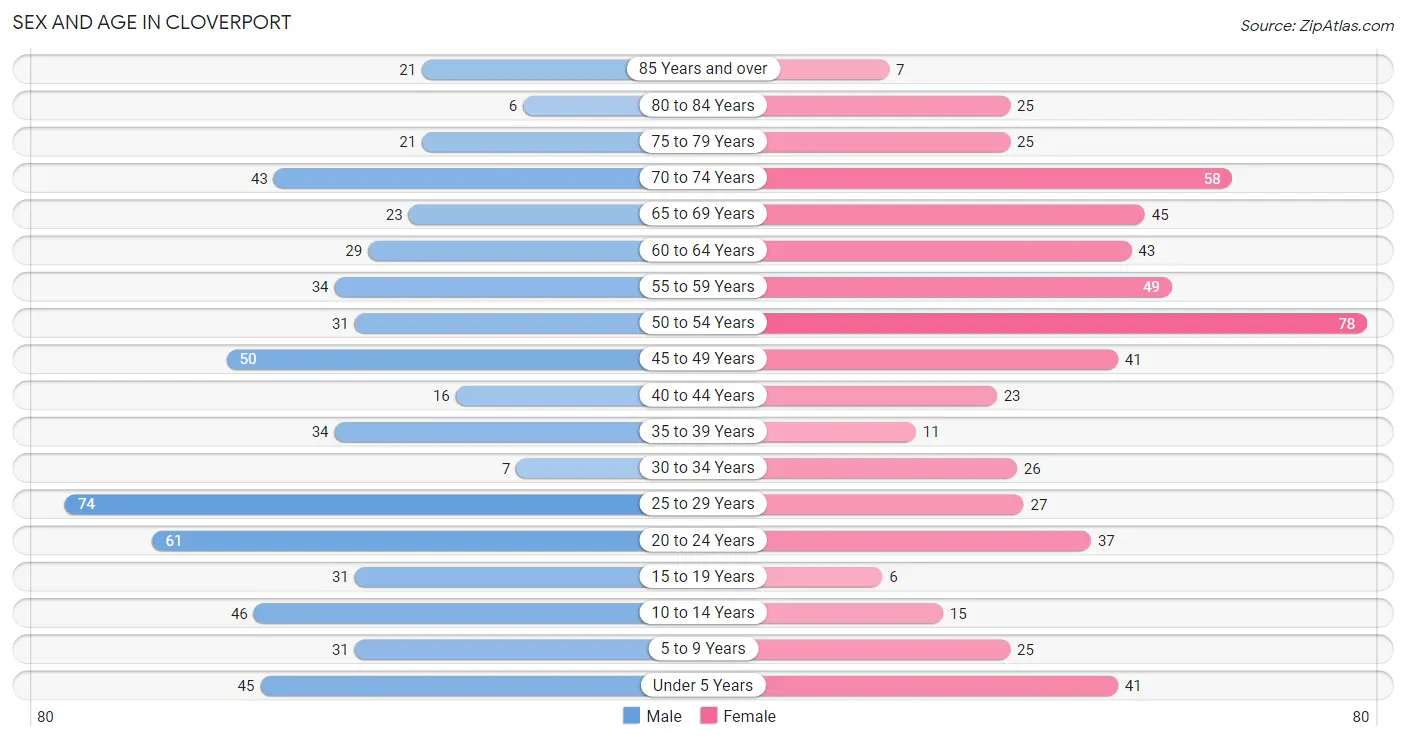
| Age Bracket | Male | Female |
| Under 5 Years | 45 (7.5%) | 41 (7.0%) |
| 5 to 9 Years | 31 (5.1%) | 25 (4.3%) |
| 10 to 14 Years | 46 (7.6%) | 15 (2.6%) |
| 15 to 19 Years | 31 (5.1%) | 6 (1.0%) |
| 20 to 24 Years | 61 (10.1%) | 37 (6.4%) |
| 25 to 29 Years | 74 (12.3%) | 27 (4.6%) |
| 30 to 34 Years | 7 (1.2%) | 26 (4.5%) |
| 35 to 39 Years | 34 (5.6%) | 11 (1.9%) |
| 40 to 44 Years | 16 (2.6%) | 23 (4.0%) |
| 45 to 49 Years | 50 (8.3%) | 41 (7.0%) |
| 50 to 54 Years | 31 (5.1%) | 78 (13.4%) |
| 55 to 59 Years | 34 (5.6%) | 49 (8.4%) |
| 60 to 64 Years | 29 (4.8%) | 43 (7.4%) |
| 65 to 69 Years | 23 (3.8%) | 45 (7.7%) |
| 70 to 74 Years | 43 (7.1%) | 58 (10.0%) |
| 75 to 79 Years | 21 (3.5%) | 25 (4.3%) |
| 80 to 84 Years | 6 (1.0%) | 25 (4.3%) |
| 85 Years and over | 21 (3.5%) | 7 (1.2%) |
| Total | 603 (100.0%) | 582 (100.0%) |
Families and Households in Cloverport
Median Family Size in Cloverport
The median family size in Cloverport is 3.32 persons per family, with single female/mother families (73 | 26.7%) accounting for the largest median family size of 4.64 persons per family. On the other hand, single male/father families (34 | 12.4%) represent the smallest median family size with 2.38 persons per family.
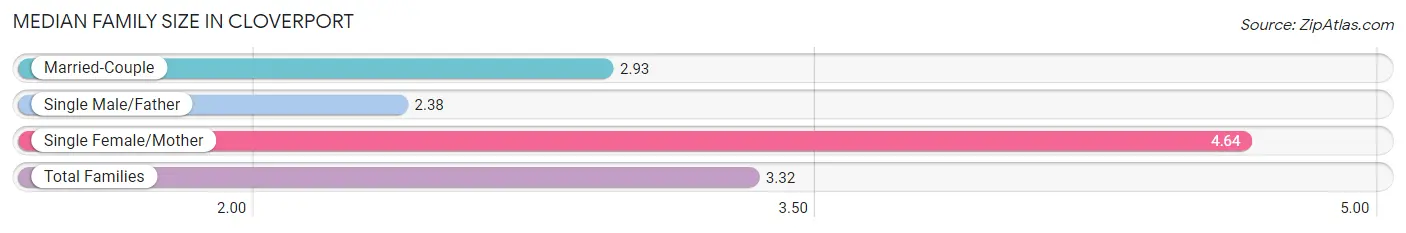
| Family Type | # Families | Family Size |
| Married-Couple | 166 (60.8%) | 2.93 |
| Single Male/Father | 34 (12.4%) | 2.38 |
| Single Female/Mother | 73 (26.7%) | 4.64 |
| Total Families | 273 (100.0%) | 3.32 |
Median Household Size in Cloverport
The median household size in Cloverport is 2.54 persons per household, with single female/mother households (73 | 15.7%) accounting for the largest median household size of 4.96 persons per household. non-family households (193 | 41.4%) represent the smallest median household size with 1.24 persons per household.
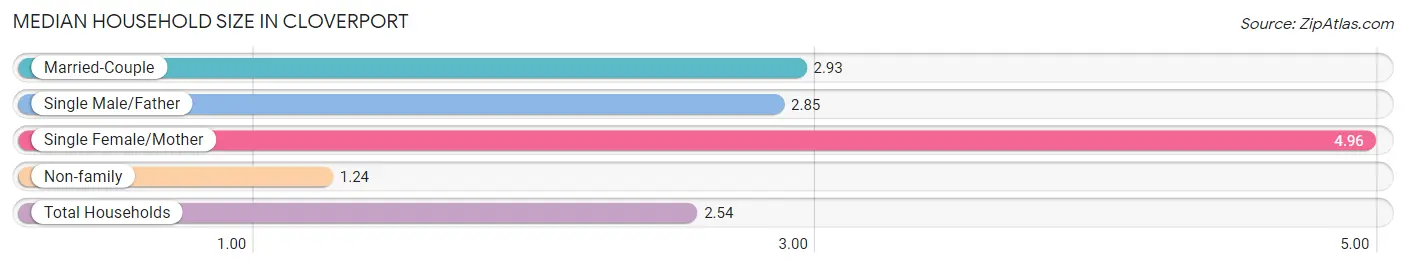
| Household Type | # Households | Household Size |
| Married-Couple | 166 (35.6%) | 2.93 |
| Single Male/Father | 34 (7.3%) | 2.85 |
| Single Female/Mother | 73 (15.7%) | 4.96 |
| Non-family | 193 (41.4%) | 1.24 |
| Total Households | 466 (100.0%) | 2.54 |
Household Size by Marriage Status in Cloverport
Out of a total of 466 households in Cloverport, 273 (58.6%) are family households, while 193 (41.4%) are nonfamily households. The most numerous type of family households are 2-person households, comprising 132, and the most common type of nonfamily households are 1-person households, comprising 172.
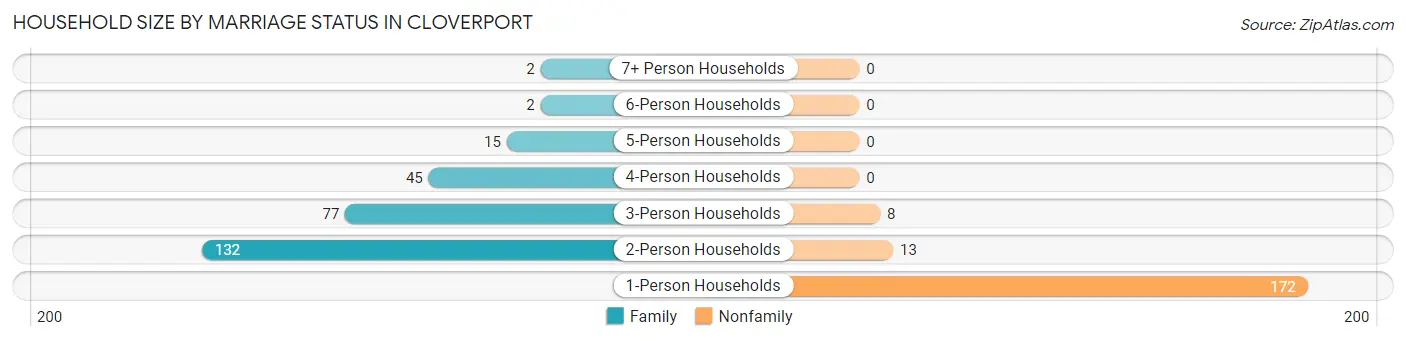
| Household Size | Family Households | Nonfamily Households |
| 1-Person Households | - | 172 (36.9%) |
| 2-Person Households | 132 (28.3%) | 13 (2.8%) |
| 3-Person Households | 77 (16.5%) | 8 (1.7%) |
| 4-Person Households | 45 (9.7%) | 0 (0.0%) |
| 5-Person Households | 15 (3.2%) | 0 (0.0%) |
| 6-Person Households | 2 (0.4%) | 0 (0.0%) |
| 7+ Person Households | 2 (0.4%) | 0 (0.0%) |
| Total | 273 (58.6%) | 193 (41.4%) |
Female Fertility in Cloverport
Fertility by Age in Cloverport
Average fertility rate in Cloverport is 130.0 births per 1,000 women. Women in the age bracket of 20 to 34 years have the highest fertility rate with 267.0 births per 1,000 women. Women in the age bracket of 20 to 34 years acount for 100.0% of all women with births.
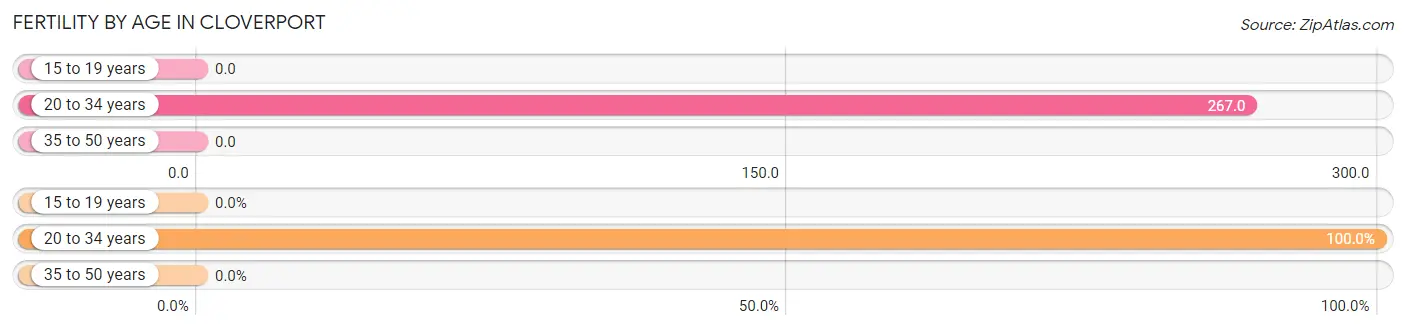
| Age Bracket | Women with Births | Births / 1,000 Women |
| 15 to 19 years | 0 (0.0%) | 0.0 |
| 20 to 34 years | 24 (100.0%) | 267.0 |
| 35 to 50 years | 0 (0.0%) | 0.0 |
| Total | 24 (100.0%) | 130.0 |
Fertility by Age by Marriage Status in Cloverport
33.3% of women with births (24) in Cloverport are married. The highest percentage of unmarried women with births falls into 20 to 34 years age bracket with 66.7% of them unmarried at the time of birth, while the lowest percentage of unmarried women with births belong to 20 to 34 years age bracket with 66.7% of them unmarried.
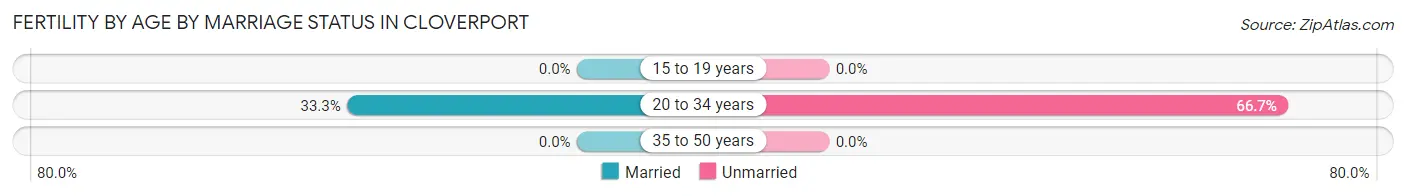
| Age Bracket | Married | Unmarried |
| 15 to 19 years | 0 (0.0%) | 0 (0.0%) |
| 20 to 34 years | 8 (33.3%) | 16 (66.7%) |
| 35 to 50 years | 0 (0.0%) | 0 (0.0%) |
| Total | 8 (33.3%) | 16 (66.7%) |
Fertility by Education in Cloverport
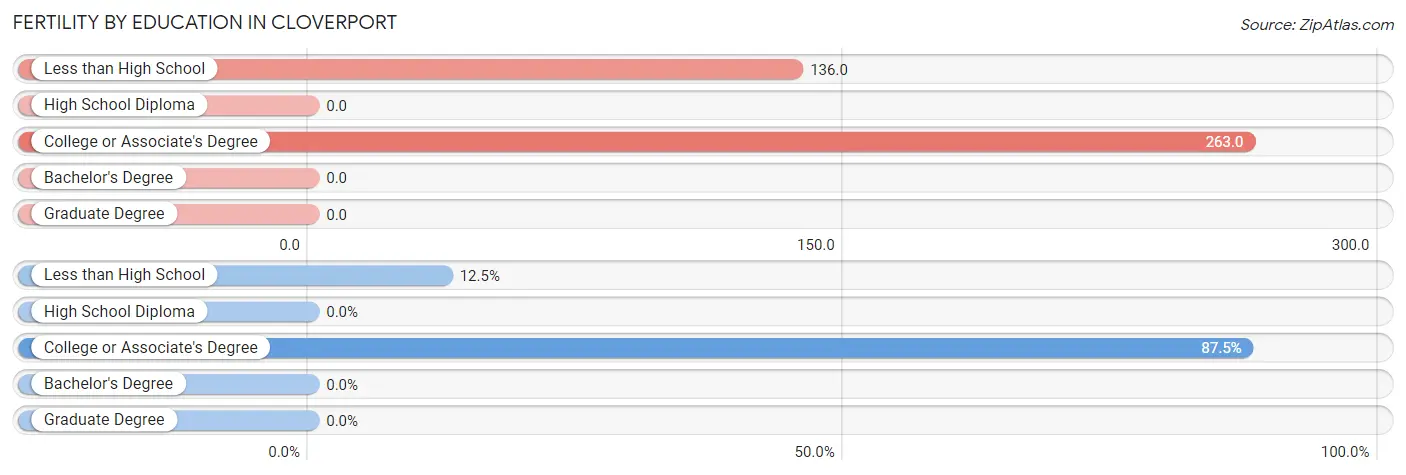
| Educational Attainment | Women with Births | Births / 1,000 Women |
| Less than High School | 3 (12.5%) | 136.0 |
| High School Diploma | 0 (0.0%) | 0.0 |
| College or Associate's Degree | 21 (87.5%) | 263.0 |
| Bachelor's Degree | 0 (0.0%) | 0.0 |
| Graduate Degree | 0 (0.0%) | 0.0 |
| Total | 24 (100.0%) | 130.0 |
Fertility by Education by Marriage Status in Cloverport
66.7% of women with births in Cloverport are unmarried. Women with the educational attainment of college or associate's degree are most likely to be married with 38.1% of them married at childbirth, while women with the educational attainment of less than high school are least likely to be married with 100.0% of them unmarried at childbirth.
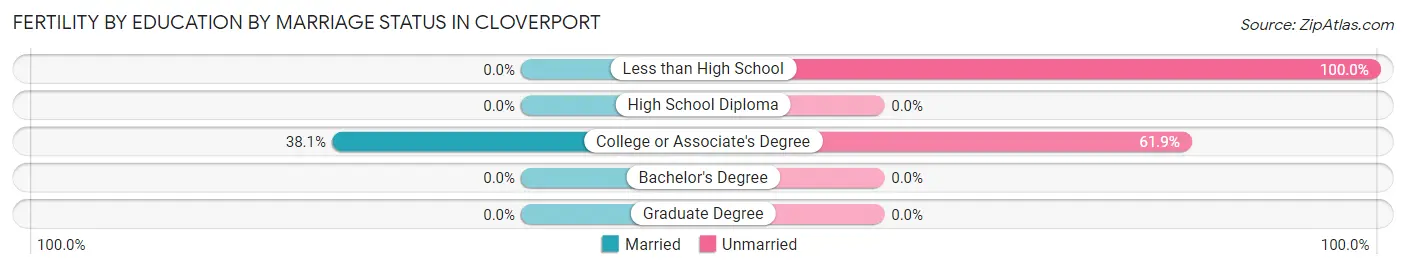
| Educational Attainment | Married | Unmarried |
| Less than High School | 0 (0.0%) | 3 (100.0%) |
| High School Diploma | 0 (0.0%) | 0 (0.0%) |
| College or Associate's Degree | 8 (38.1%) | 13 (61.9%) |
| Bachelor's Degree | 0 (0.0%) | 0 (0.0%) |
| Graduate Degree | 0 (0.0%) | 0 (0.0%) |
| Total | 8 (33.3%) | 16 (66.7%) |
Employment Characteristics in Cloverport
Employment by Class of Employer in Cloverport
Among the 355 employed individuals in Cloverport, private company employees (281 | 79.1%), local government employees (30 | 8.5%), and self-employed (not incorporated) (15 | 4.2%) make up the most common classes of employment.
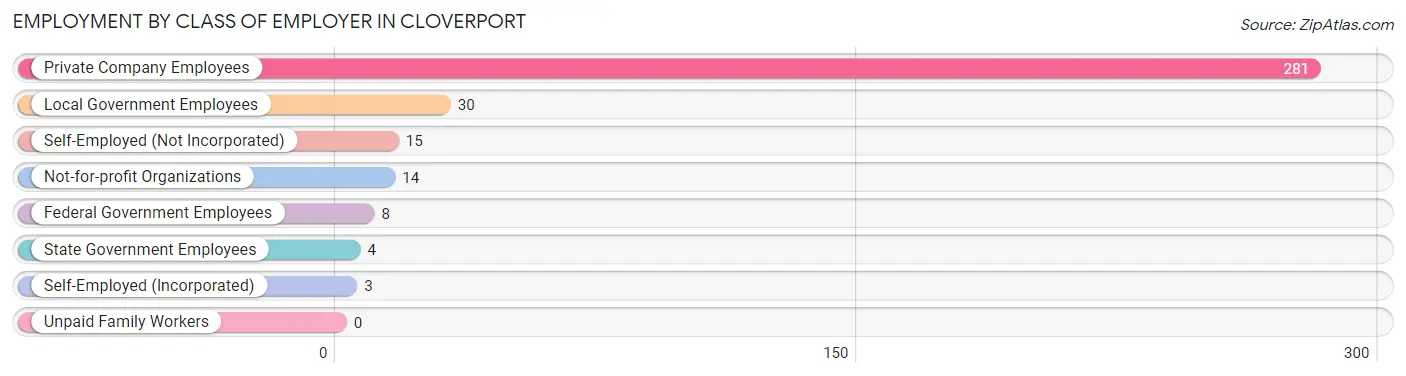
| Employer Class | # Employees | % Employees |
| Private Company Employees | 281 | 79.1% |
| Self-Employed (Incorporated) | 3 | 0.9% |
| Self-Employed (Not Incorporated) | 15 | 4.2% |
| Not-for-profit Organizations | 14 | 3.9% |
| Local Government Employees | 30 | 8.5% |
| State Government Employees | 4 | 1.1% |
| Federal Government Employees | 8 | 2.2% |
| Unpaid Family Workers | 0 | 0.0% |
| Total | 355 | 100.0% |
Employment Status by Age in Cloverport
According to the labor force statistics for Cloverport, out of the total population over 16 years of age (982), 45.1% or 443 individuals are in the labor force, with 18.1% or 80 of them unemployed. The age group with the highest labor force participation rate is 25 to 29 years, with 82.2% or 83 individuals in the labor force. Within the labor force, the 25 to 29 years age range has the highest percentage of unemployed individuals, with 45.8% or 38 of them being unemployed.
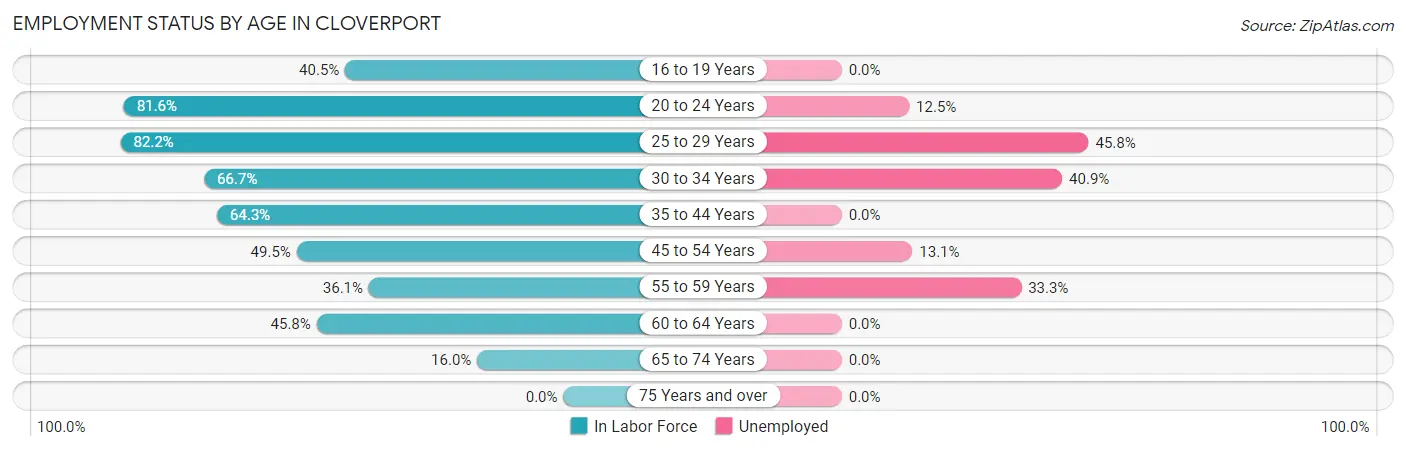
| Age Bracket | In Labor Force | Unemployed |
| 16 to 19 Years | 15 (40.5%) | 0 (0.0%) |
| 20 to 24 Years | 80 (81.6%) | 10 (12.5%) |
| 25 to 29 Years | 83 (82.2%) | 38 (45.8%) |
| 30 to 34 Years | 22 (66.7%) | 9 (40.9%) |
| 35 to 44 Years | 54 (64.3%) | 0 (0.0%) |
| 45 to 54 Years | 99 (49.5%) | 13 (13.1%) |
| 55 to 59 Years | 30 (36.1%) | 10 (33.3%) |
| 60 to 64 Years | 33 (45.8%) | 0 (0.0%) |
| 65 to 74 Years | 27 (16.0%) | 0 (0.0%) |
| 75 Years and over | 0 (0.0%) | 0 (0.0%) |
| Total | 443 (45.1%) | 80 (18.1%) |
Employment Status by Educational Attainment in Cloverport
According to labor force statistics for Cloverport, 56.0% of individuals (321) out of the total population between 25 and 64 years of age (573) are in the labor force, with 21.8% or 70 of them being unemployed. The group with the highest labor force participation rate are those with the educational attainment of college / associate degree, with 74.0% or 154 individuals in the labor force. Within the labor force, individuals with less than high school education have the highest percentage of unemployment, with 82.9% or 29 of them being unemployed.
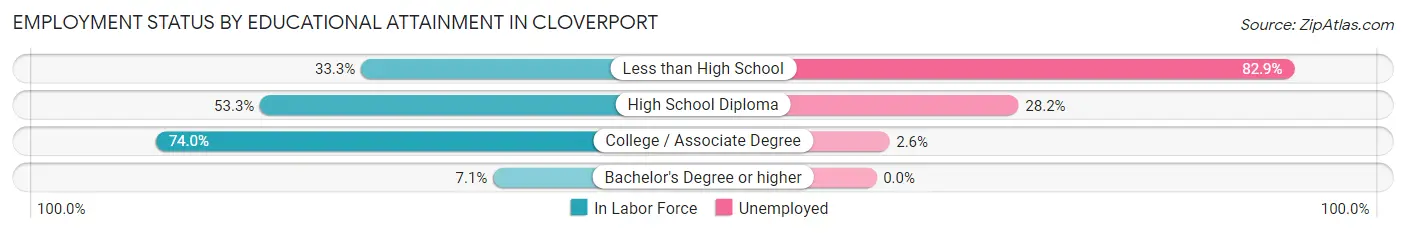
| Educational Attainment | In Labor Force | Unemployed |
| Less than High School | 35 (33.3%) | 87 (82.9%) |
| High School Diploma | 131 (53.3%) | 69 (28.2%) |
| College / Associate Degree | 154 (74.0%) | 5 (2.6%) |
| Bachelor's Degree or higher | 1 (7.1%) | 0 (0.0%) |
| Total | 321 (56.0%) | 125 (21.8%) |
Employment Occupations by Sex in Cloverport
Management, Business, Science and Arts Occupations
The most common Management, Business, Science and Arts occupations in Cloverport are Health Diagnosing & Treating (30 | 8.3%), Community & Social Service (28 | 7.7%), Education Instruction & Library (19 | 5.2%), Arts, Media & Entertainment (9 | 2.5%), and Management (7 | 1.9%).
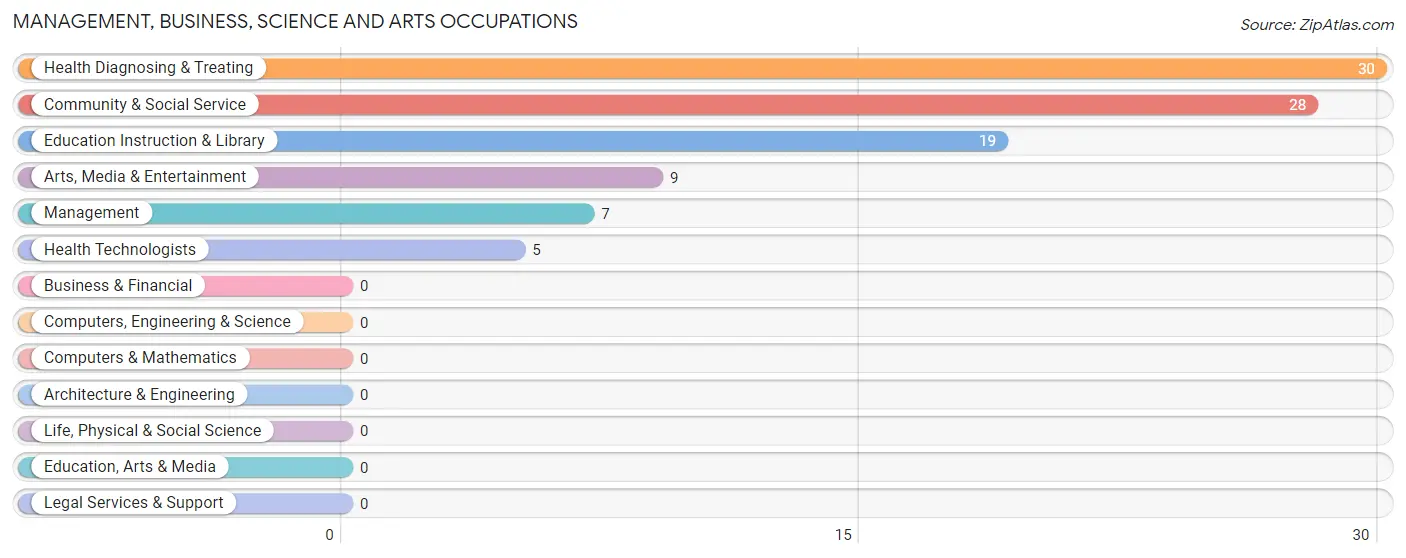
Management, Business, Science and Arts Occupations by Sex
Within the Management, Business, Science and Arts occupations in Cloverport, the most male-oriented occupations are Health Diagnosing & Treating (56.7%), Arts, Media & Entertainment (33.3%), and Community & Social Service (10.7%), while the most female-oriented occupations are Management (100.0%), Education Instruction & Library (100.0%), and Health Technologists (100.0%).
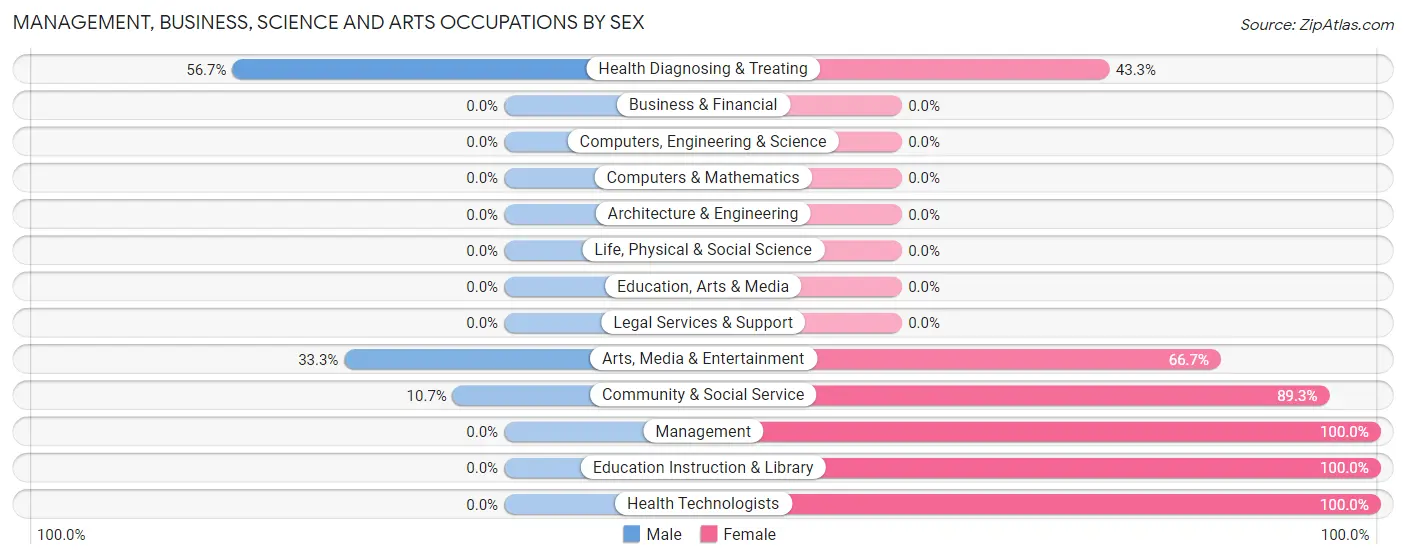
| Occupation | Male | Female |
| Management | 0 (0.0%) | 7 (100.0%) |
| Business & Financial | 0 (0.0%) | 0 (0.0%) |
| Computers, Engineering & Science | 0 (0.0%) | 0 (0.0%) |
| Computers & Mathematics | 0 (0.0%) | 0 (0.0%) |
| Architecture & Engineering | 0 (0.0%) | 0 (0.0%) |
| Life, Physical & Social Science | 0 (0.0%) | 0 (0.0%) |
| Community & Social Service | 3 (10.7%) | 25 (89.3%) |
| Education, Arts & Media | 0 (0.0%) | 0 (0.0%) |
| Legal Services & Support | 0 (0.0%) | 0 (0.0%) |
| Education Instruction & Library | 0 (0.0%) | 19 (100.0%) |
| Arts, Media & Entertainment | 3 (33.3%) | 6 (66.7%) |
| Health Diagnosing & Treating | 17 (56.7%) | 13 (43.3%) |
| Health Technologists | 0 (0.0%) | 5 (100.0%) |
| Total (Category) | 20 (30.8%) | 45 (69.2%) |
| Total (Overall) | 218 (60.1%) | 145 (39.9%) |
Services Occupations
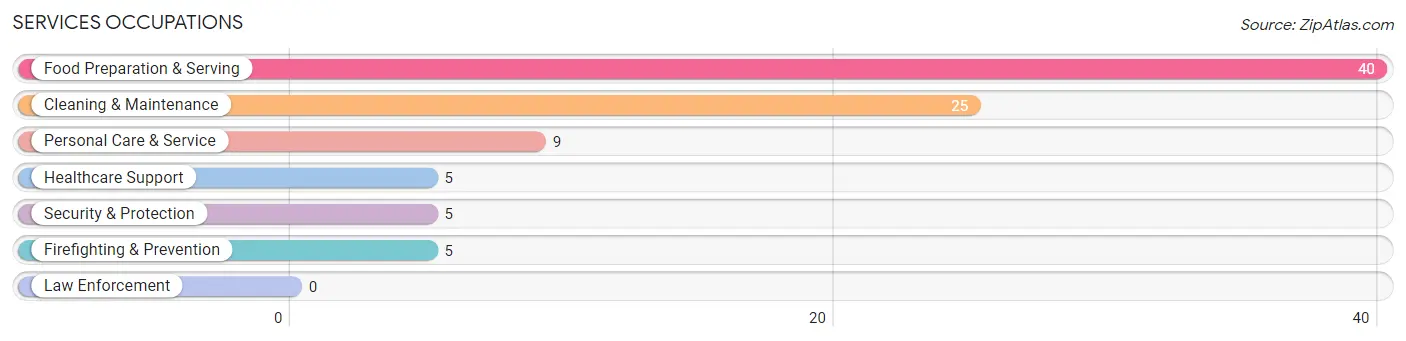
The most common Services occupations in Cloverport are Food Preparation & Serving (40 | 11.0%), Cleaning & Maintenance (25 | 6.9%), Personal Care & Service (9 | 2.5%), Healthcare Support (5 | 1.4%), and Security & Protection (5 | 1.4%).
Services Occupations by Sex
Within the Services occupations in Cloverport, the most male-oriented occupations are Personal Care & Service (100.0%), Cleaning & Maintenance (68.0%), and Food Preparation & Serving (45.0%), while the most female-oriented occupations are Healthcare Support (100.0%), Security & Protection (60.0%), and Firefighting & Prevention (60.0%).
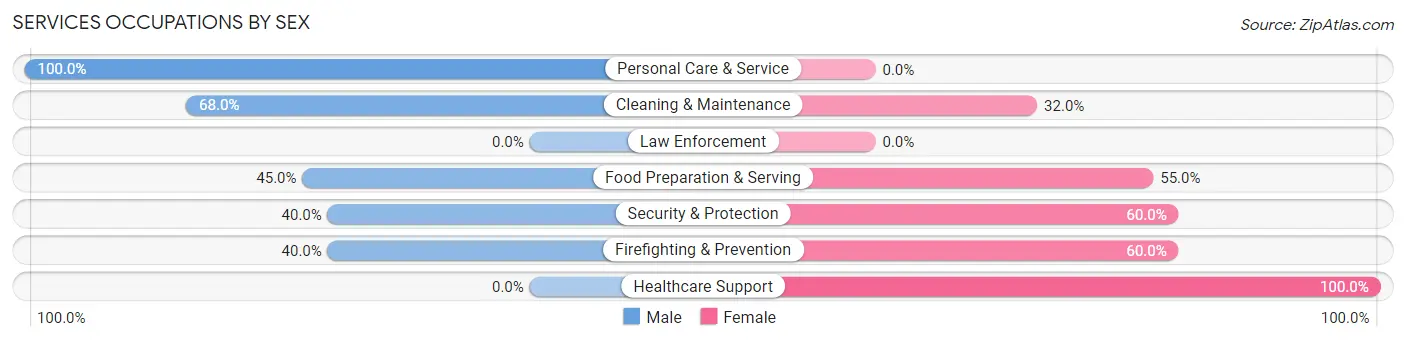
| Occupation | Male | Female |
| Healthcare Support | 0 (0.0%) | 5 (100.0%) |
| Security & Protection | 2 (40.0%) | 3 (60.0%) |
| Firefighting & Prevention | 2 (40.0%) | 3 (60.0%) |
| Law Enforcement | 0 (0.0%) | 0 (0.0%) |
| Food Preparation & Serving | 18 (45.0%) | 22 (55.0%) |
| Cleaning & Maintenance | 17 (68.0%) | 8 (32.0%) |
| Personal Care & Service | 9 (100.0%) | 0 (0.0%) |
| Total (Category) | 46 (54.8%) | 38 (45.2%) |
| Total (Overall) | 218 (60.1%) | 145 (39.9%) |
Sales and Office Occupations
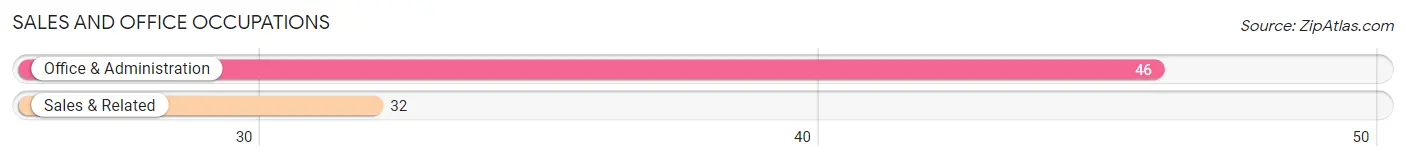
The most common Sales and Office occupations in Cloverport are Office & Administration (46 | 12.7%), and Sales & Related (32 | 8.8%).
Sales and Office Occupations by Sex
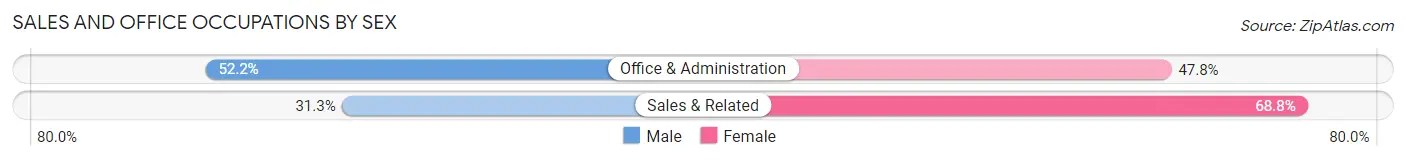
| Occupation | Male | Female |
| Sales & Related | 10 (31.2%) | 22 (68.8%) |
| Office & Administration | 24 (52.2%) | 22 (47.8%) |
| Total (Category) | 34 (43.6%) | 44 (56.4%) |
| Total (Overall) | 218 (60.1%) | 145 (39.9%) |
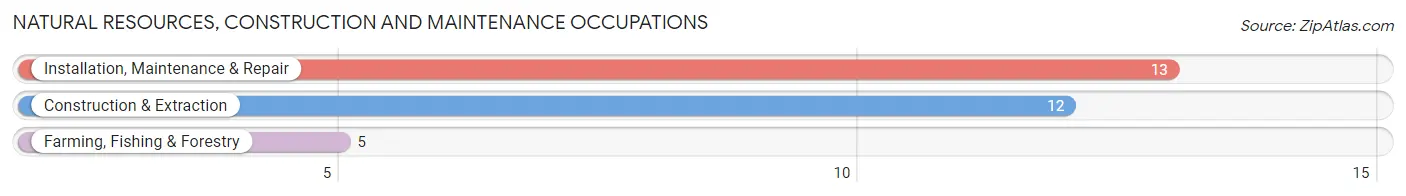
Natural Resources, Construction and Maintenance Occupations
The most common Natural Resources, Construction and Maintenance occupations in Cloverport are Installation, Maintenance & Repair (13 | 3.6%), Construction & Extraction (12 | 3.3%), and Farming, Fishing & Forestry (5 | 1.4%).
Natural Resources, Construction and Maintenance Occupations by Sex
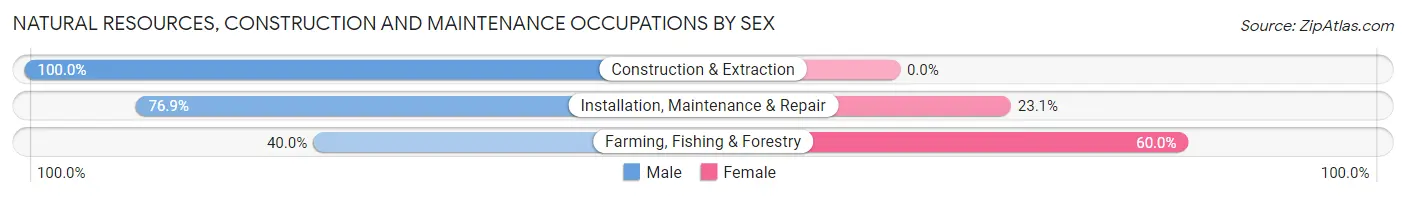
| Occupation | Male | Female |
| Farming, Fishing & Forestry | 2 (40.0%) | 3 (60.0%) |
| Construction & Extraction | 12 (100.0%) | 0 (0.0%) |
| Installation, Maintenance & Repair | 10 (76.9%) | 3 (23.1%) |
| Total (Category) | 24 (80.0%) | 6 (20.0%) |
| Total (Overall) | 218 (60.1%) | 145 (39.9%) |
Production, Transportation and Moving Occupations
The most common Production, Transportation and Moving occupations in Cloverport are Production (86 | 23.7%), Material Moving (13 | 3.6%), and Transportation (7 | 1.9%).
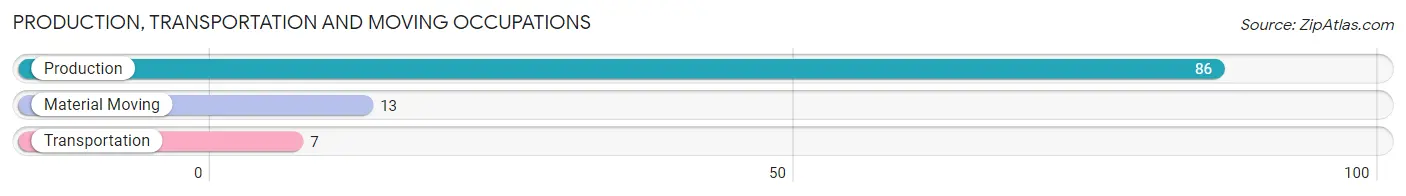
Production, Transportation and Moving Occupations by Sex
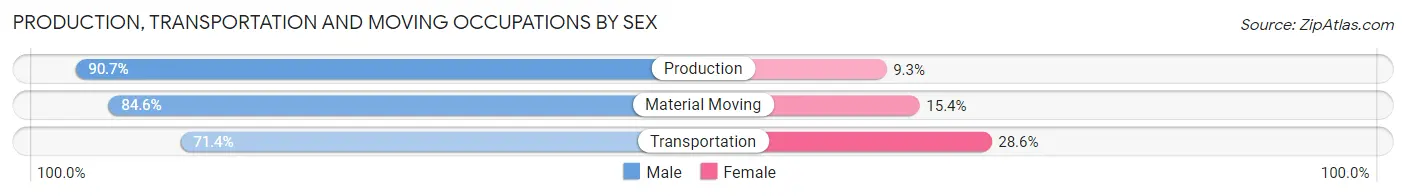
| Occupation | Male | Female |
| Production | 78 (90.7%) | 8 (9.3%) |
| Transportation | 5 (71.4%) | 2 (28.6%) |
| Material Moving | 11 (84.6%) | 2 (15.4%) |
| Total (Category) | 94 (88.7%) | 12 (11.3%) |
| Total (Overall) | 218 (60.1%) | 145 (39.9%) |
Employment Industries by Sex in Cloverport
Employment Industries in Cloverport
The major employment industries in Cloverport include Manufacturing (116 | 32.0%), Retail Trade (63 | 17.4%), Accommodation & Food Services (39 | 10.7%), Educational Services (38 | 10.5%), and Health Care & Social Assistance (27 | 7.4%).
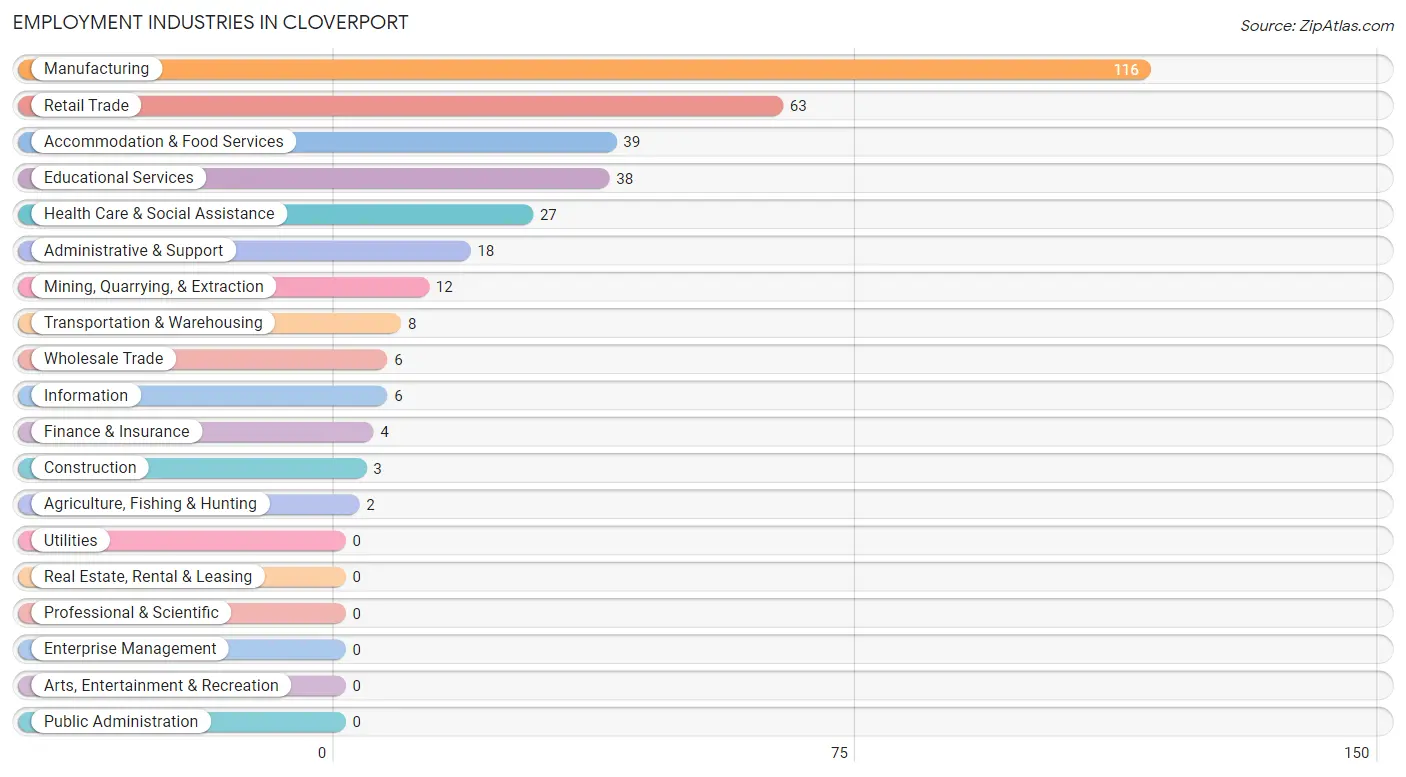
Employment Industries by Sex in Cloverport
The Cloverport industries that see more men than women are Agriculture, Fishing & Hunting (100.0%), Mining, Quarrying, & Extraction (100.0%), and Construction (100.0%), whereas the industries that tend to have a higher number of women are Information (100.0%), Finance & Insurance (100.0%), and Health Care & Social Assistance (100.0%).
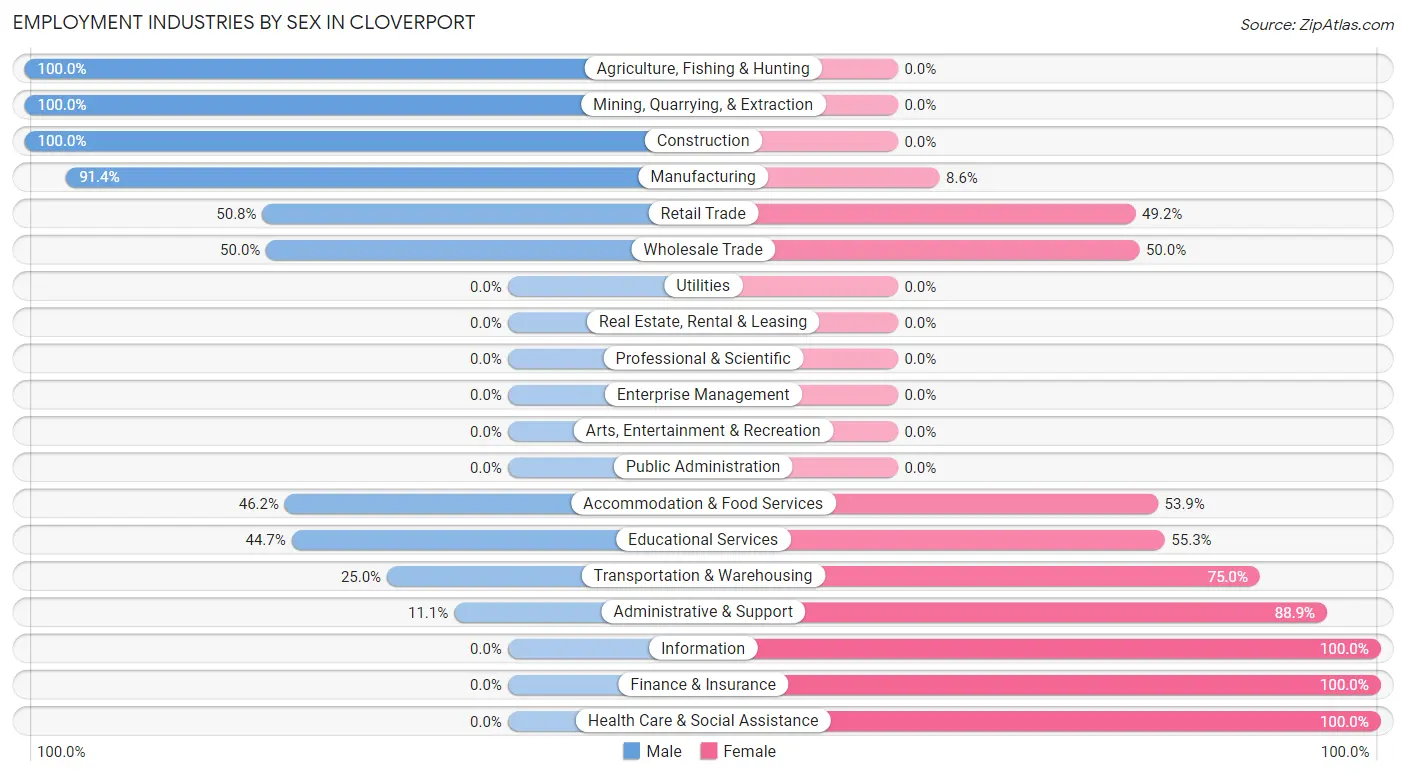
| Industry | Male | Female |
| Agriculture, Fishing & Hunting | 2 (100.0%) | 0 (0.0%) |
| Mining, Quarrying, & Extraction | 12 (100.0%) | 0 (0.0%) |
| Construction | 3 (100.0%) | 0 (0.0%) |
| Manufacturing | 106 (91.4%) | 10 (8.6%) |
| Wholesale Trade | 3 (50.0%) | 3 (50.0%) |
| Retail Trade | 32 (50.8%) | 31 (49.2%) |
| Transportation & Warehousing | 2 (25.0%) | 6 (75.0%) |
| Utilities | 0 (0.0%) | 0 (0.0%) |
| Information | 0 (0.0%) | 6 (100.0%) |
| Finance & Insurance | 0 (0.0%) | 4 (100.0%) |
| Real Estate, Rental & Leasing | 0 (0.0%) | 0 (0.0%) |
| Professional & Scientific | 0 (0.0%) | 0 (0.0%) |
| Enterprise Management | 0 (0.0%) | 0 (0.0%) |
| Administrative & Support | 2 (11.1%) | 16 (88.9%) |
| Educational Services | 17 (44.7%) | 21 (55.3%) |
| Health Care & Social Assistance | 0 (0.0%) | 27 (100.0%) |
| Arts, Entertainment & Recreation | 0 (0.0%) | 0 (0.0%) |
| Accommodation & Food Services | 18 (46.2%) | 21 (53.8%) |
| Public Administration | 0 (0.0%) | 0 (0.0%) |
| Total | 218 (60.1%) | 145 (39.9%) |
Education in Cloverport
School Enrollment in Cloverport
The most common levels of schooling among the 208 students in Cloverport are elementary school (47 | 22.6%), middle school (44 | 21.1%), and high school (39 | 18.8%).
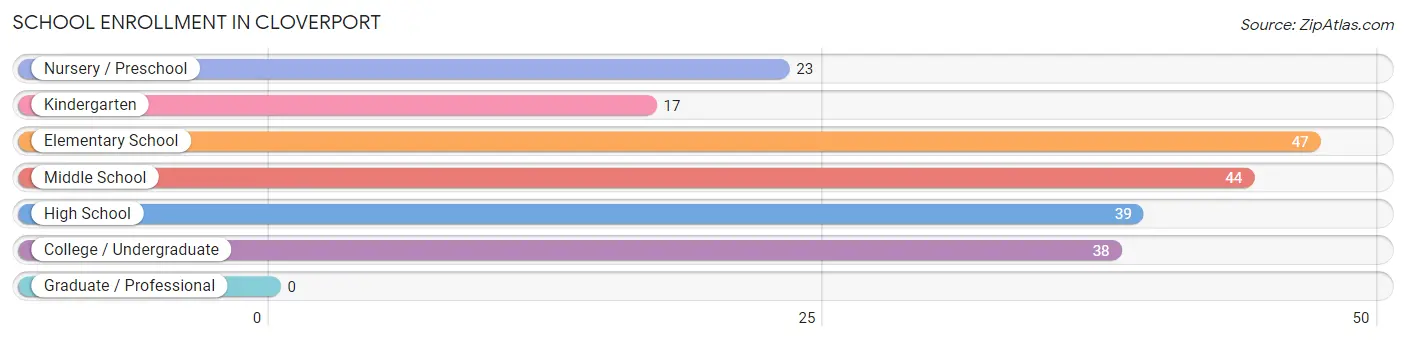
| School Level | # Students | % Students |
| Nursery / Preschool | 23 | 11.1% |
| Kindergarten | 17 | 8.2% |
| Elementary School | 47 | 22.6% |
| Middle School | 44 | 21.1% |
| High School | 39 | 18.8% |
| College / Undergraduate | 38 | 18.3% |
| Graduate / Professional | 0 | 0.0% |
| Total | 208 | 100.0% |
School Enrollment by Age by Funding Source in Cloverport
Out of a total of 208 students who are enrolled in schools in Cloverport, 9 (4.3%) attend a private institution, while the remaining 199 (95.7%) are enrolled in public schools. The age group of 25 to 34 year olds has the highest likelihood of being enrolled in private schools, with 2 (12.5% in the age bracket) enrolled. Conversely, the age group of 3 to 4 year olds has the lowest likelihood of being enrolled in a private school, with 23 (100.0% in the age bracket) attending a public institution.
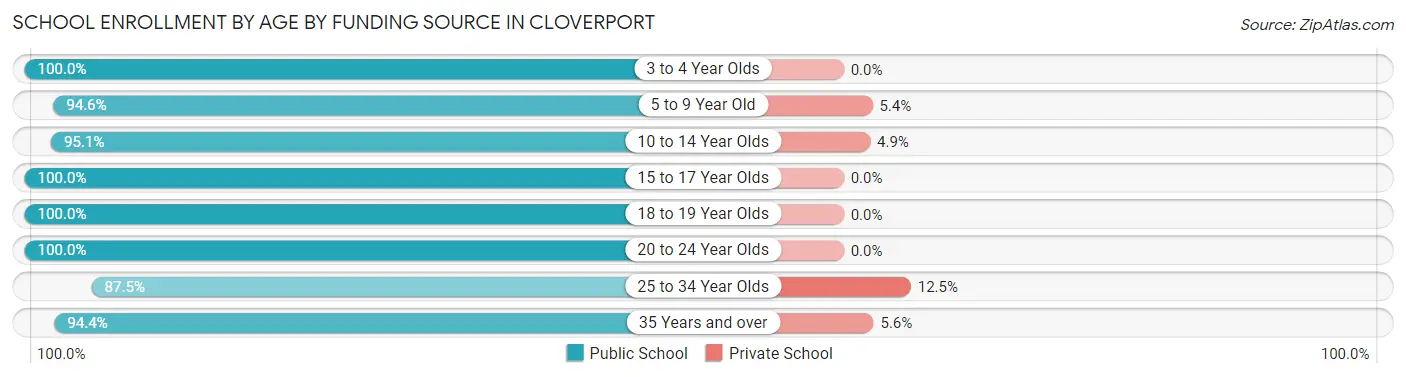
| Age Bracket | Public School | Private School |
| 3 to 4 Year Olds | 23 (100.0%) | 0 (0.0%) |
| 5 to 9 Year Old | 53 (94.6%) | 3 (5.4%) |
| 10 to 14 Year Olds | 58 (95.1%) | 3 (4.9%) |
| 15 to 17 Year Olds | 20 (100.0%) | 0 (0.0%) |
| 18 to 19 Year Olds | 9 (100.0%) | 0 (0.0%) |
| 20 to 24 Year Olds | 5 (100.0%) | 0 (0.0%) |
| 25 to 34 Year Olds | 14 (87.5%) | 2 (12.5%) |
| 35 Years and over | 17 (94.4%) | 1 (5.6%) |
| Total | 199 (95.7%) | 9 (4.3%) |
Educational Attainment by Field of Study in Cloverport
Business (24 | 72.7%), education (8 | 24.2%), and science & technology (1 | 3.0%) are the most common fields of study among 33 individuals in Cloverport who have obtained a bachelor's degree or higher.
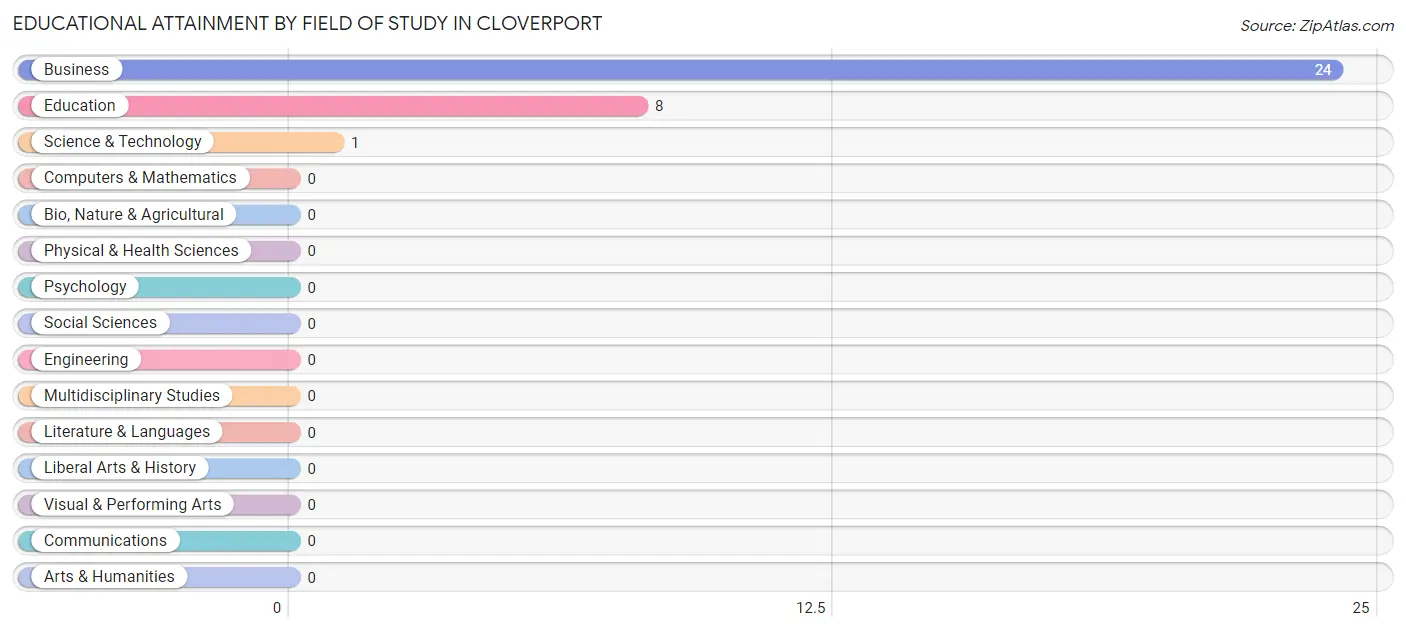
| Field of Study | # Graduates | % Graduates |
| Computers & Mathematics | 0 | 0.0% |
| Bio, Nature & Agricultural | 0 | 0.0% |
| Physical & Health Sciences | 0 | 0.0% |
| Psychology | 0 | 0.0% |
| Social Sciences | 0 | 0.0% |
| Engineering | 0 | 0.0% |
| Multidisciplinary Studies | 0 | 0.0% |
| Science & Technology | 1 | 3.0% |
| Business | 24 | 72.7% |
| Education | 8 | 24.2% |
| Literature & Languages | 0 | 0.0% |
| Liberal Arts & History | 0 | 0.0% |
| Visual & Performing Arts | 0 | 0.0% |
| Communications | 0 | 0.0% |
| Arts & Humanities | 0 | 0.0% |
| Total | 33 | 100.0% |
Transportation & Commute in Cloverport
Vehicle Availability by Sex in Cloverport
The most prevalent vehicle ownership categories in Cloverport are males with 3 vehicles (109, accounting for 50.0%) and females with 3 vehicles (37, making up 79.6%).
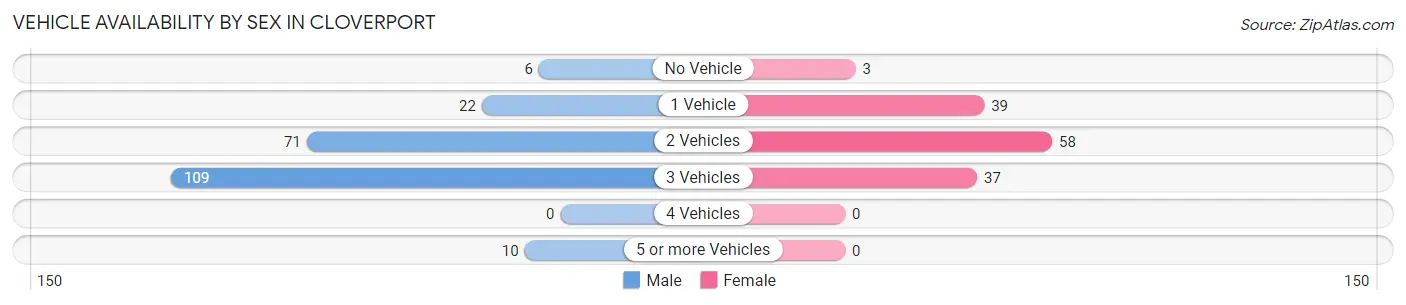
| Vehicles Available | Male | Female |
| No Vehicle | 6 (2.8%) | 3 (2.2%) |
| 1 Vehicle | 22 (10.1%) | 39 (28.5%) |
| 2 Vehicles | 71 (32.6%) | 58 (42.3%) |
| 3 Vehicles | 109 (50.0%) | 37 (27.0%) |
| 4 Vehicles | 0 (0.0%) | 0 (0.0%) |
| 5 or more Vehicles | 10 (4.6%) | 0 (0.0%) |
| Total | 218 (100.0%) | 137 (100.0%) |
Commute Time in Cloverport
The most frequently occuring commute durations in Cloverport are 20 to 24 minutes (105 commuters, 30.9%), 15 to 19 minutes (56 commuters, 16.5%), and 25 to 29 minutes (54 commuters, 15.9%).
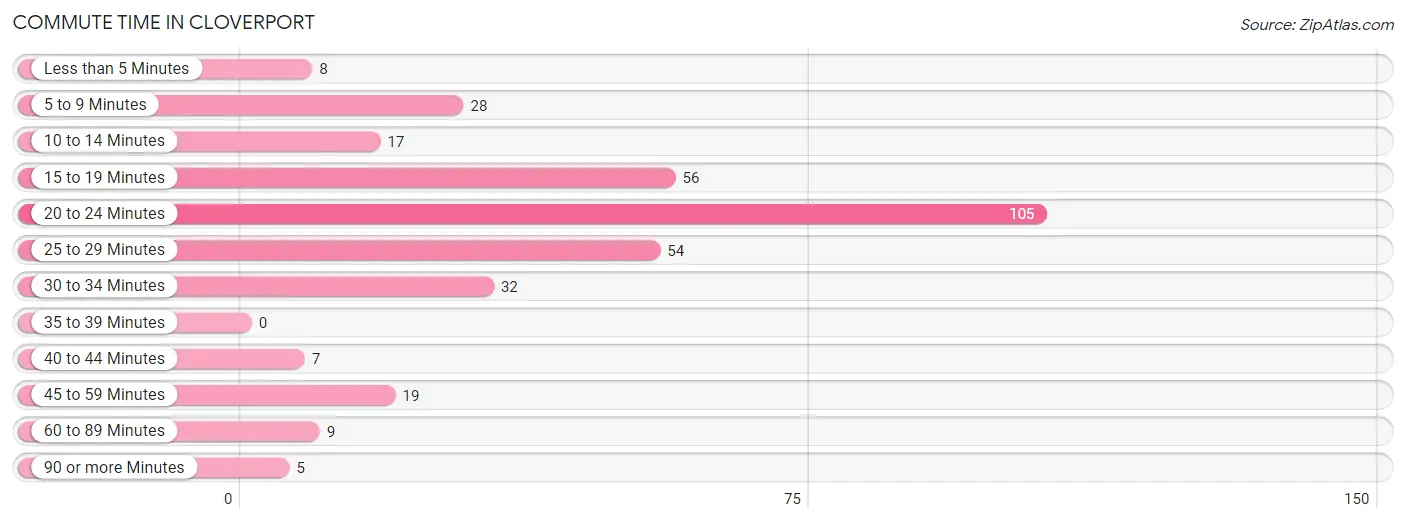
| Commute Time | # Commuters | % Commuters |
| Less than 5 Minutes | 8 | 2.4% |
| 5 to 9 Minutes | 28 | 8.2% |
| 10 to 14 Minutes | 17 | 5.0% |
| 15 to 19 Minutes | 56 | 16.5% |
| 20 to 24 Minutes | 105 | 30.9% |
| 25 to 29 Minutes | 54 | 15.9% |
| 30 to 34 Minutes | 32 | 9.4% |
| 35 to 39 Minutes | 0 | 0.0% |
| 40 to 44 Minutes | 7 | 2.1% |
| 45 to 59 Minutes | 19 | 5.6% |
| 60 to 89 Minutes | 9 | 2.6% |
| 90 or more Minutes | 5 | 1.5% |
Commute Time by Sex in Cloverport
The most common commute times in Cloverport are 20 to 24 minutes (53 commuters, 25.4%) for males and 20 to 24 minutes (52 commuters, 39.7%) for females.
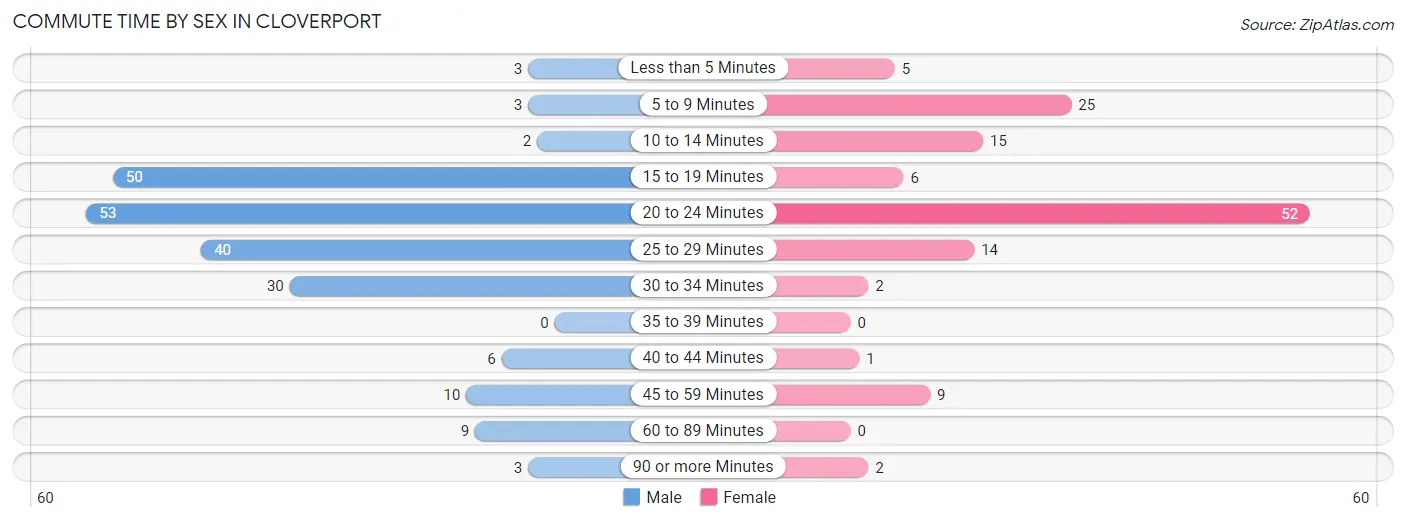
| Commute Time | Male | Female |
| Less than 5 Minutes | 3 (1.4%) | 5 (3.8%) |
| 5 to 9 Minutes | 3 (1.4%) | 25 (19.1%) |
| 10 to 14 Minutes | 2 (1.0%) | 15 (11.5%) |
| 15 to 19 Minutes | 50 (23.9%) | 6 (4.6%) |
| 20 to 24 Minutes | 53 (25.4%) | 52 (39.7%) |
| 25 to 29 Minutes | 40 (19.1%) | 14 (10.7%) |
| 30 to 34 Minutes | 30 (14.3%) | 2 (1.5%) |
| 35 to 39 Minutes | 0 (0.0%) | 0 (0.0%) |
| 40 to 44 Minutes | 6 (2.9%) | 1 (0.8%) |
| 45 to 59 Minutes | 10 (4.8%) | 9 (6.9%) |
| 60 to 89 Minutes | 9 (4.3%) | 0 (0.0%) |
| 90 or more Minutes | 3 (1.4%) | 2 (1.5%) |
Time of Departure to Work by Sex in Cloverport
The most frequent times of departure to work in Cloverport are 12:00 PM to 3:59 PM (55, 26.3%) for males and 12:00 PM to 3:59 PM (37, 28.2%) for females.
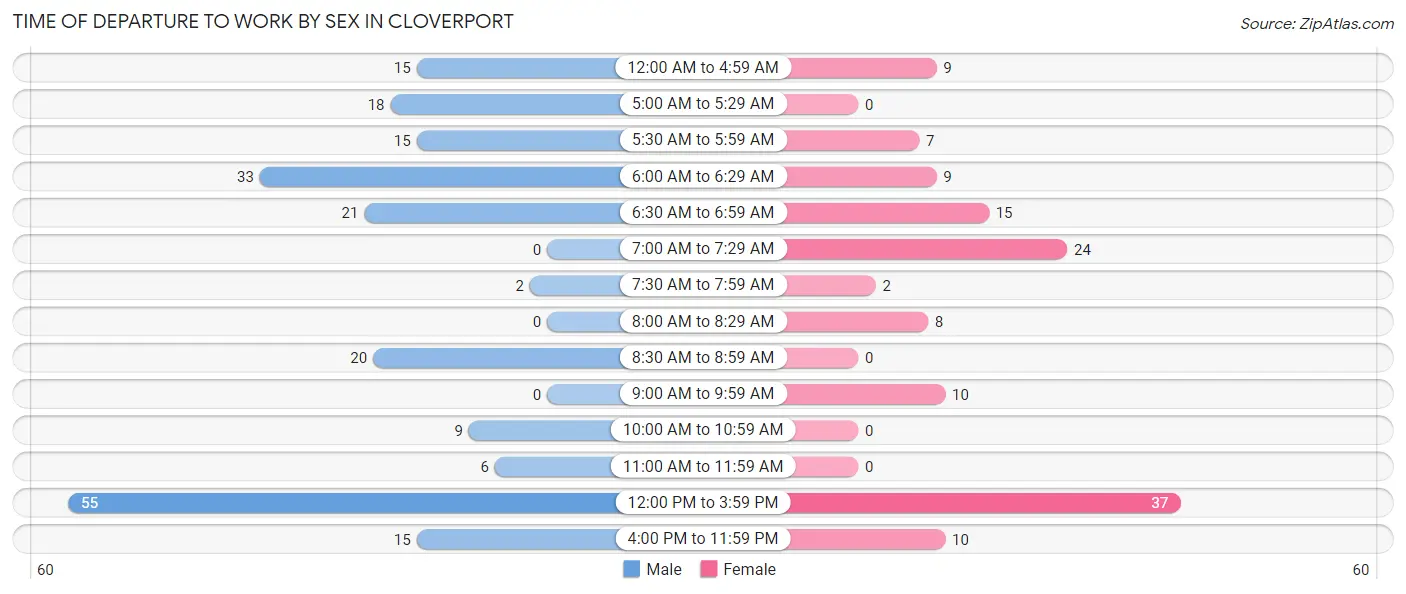
| Time of Departure | Male | Female |
| 12:00 AM to 4:59 AM | 15 (7.2%) | 9 (6.9%) |
| 5:00 AM to 5:29 AM | 18 (8.6%) | 0 (0.0%) |
| 5:30 AM to 5:59 AM | 15 (7.2%) | 7 (5.3%) |
| 6:00 AM to 6:29 AM | 33 (15.8%) | 9 (6.9%) |
| 6:30 AM to 6:59 AM | 21 (10.1%) | 15 (11.5%) |
| 7:00 AM to 7:29 AM | 0 (0.0%) | 24 (18.3%) |
| 7:30 AM to 7:59 AM | 2 (1.0%) | 2 (1.5%) |
| 8:00 AM to 8:29 AM | 0 (0.0%) | 8 (6.1%) |
| 8:30 AM to 8:59 AM | 20 (9.6%) | 0 (0.0%) |
| 9:00 AM to 9:59 AM | 0 (0.0%) | 10 (7.6%) |
| 10:00 AM to 10:59 AM | 9 (4.3%) | 0 (0.0%) |
| 11:00 AM to 11:59 AM | 6 (2.9%) | 0 (0.0%) |
| 12:00 PM to 3:59 PM | 55 (26.3%) | 37 (28.2%) |
| 4:00 PM to 11:59 PM | 15 (7.2%) | 10 (7.6%) |
| Total | 209 (100.0%) | 131 (100.0%) |
Housing Occupancy in Cloverport
Occupancy by Ownership in Cloverport
Of the total 466 dwellings in Cloverport, owner-occupied units account for 304 (65.2%), while renter-occupied units make up 162 (34.8%).
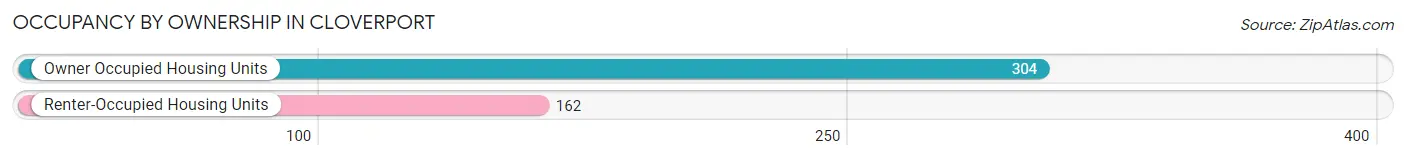
| Occupancy | # Housing Units | % Housing Units |
| Owner Occupied Housing Units | 304 | 65.2% |
| Renter-Occupied Housing Units | 162 | 34.8% |
| Total Occupied Housing Units | 466 | 100.0% |
Occupancy by Household Size in Cloverport
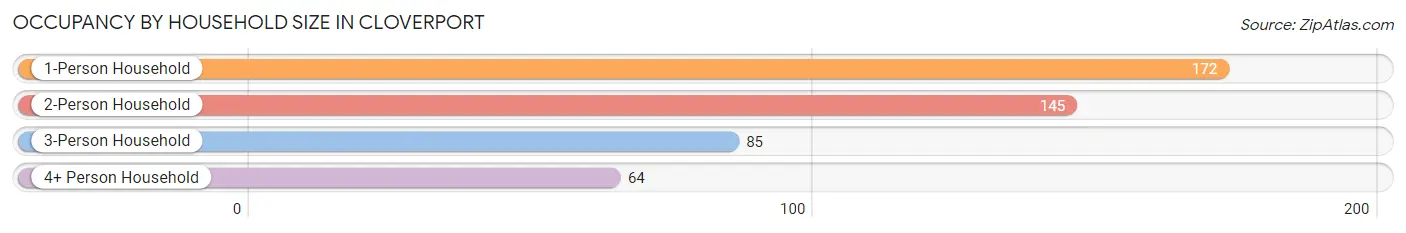
| Household Size | # Housing Units | % Housing Units |
| 1-Person Household | 172 | 36.9% |
| 2-Person Household | 145 | 31.1% |
| 3-Person Household | 85 | 18.2% |
| 4+ Person Household | 64 | 13.7% |
| Total Housing Units | 466 | 100.0% |
Occupancy by Ownership by Household Size in Cloverport
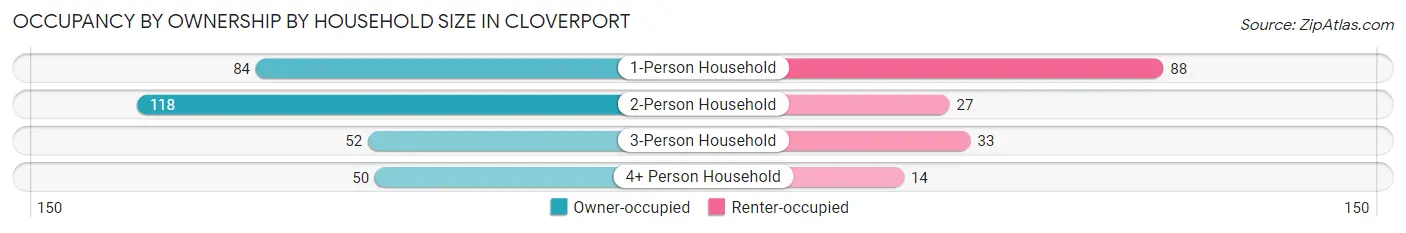
| Household Size | Owner-occupied | Renter-occupied |
| 1-Person Household | 84 (48.8%) | 88 (51.2%) |
| 2-Person Household | 118 (81.4%) | 27 (18.6%) |
| 3-Person Household | 52 (61.2%) | 33 (38.8%) |
| 4+ Person Household | 50 (78.1%) | 14 (21.9%) |
| Total Housing Units | 304 (65.2%) | 162 (34.8%) |
Occupancy by Educational Attainment in Cloverport
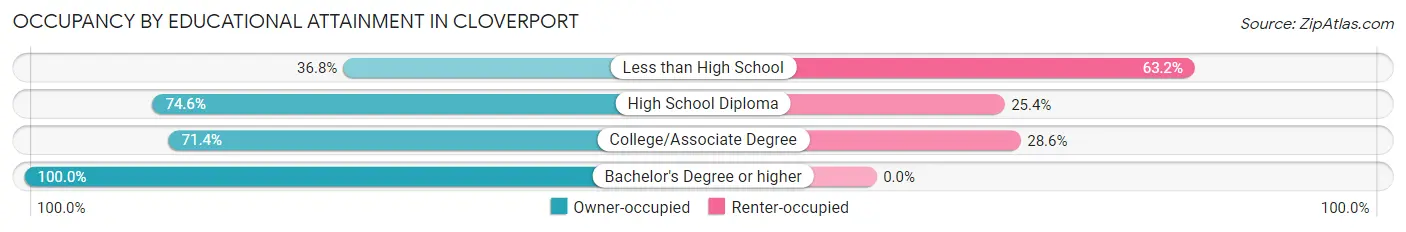
| Household Size | Owner-occupied | Renter-occupied |
| Less than High School | 42 (36.8%) | 72 (63.2%) |
| High School Diploma | 147 (74.6%) | 50 (25.4%) |
| College/Associate Degree | 100 (71.4%) | 40 (28.6%) |
| Bachelor's Degree or higher | 15 (100.0%) | 0 (0.0%) |
Occupancy by Age of Householder in Cloverport
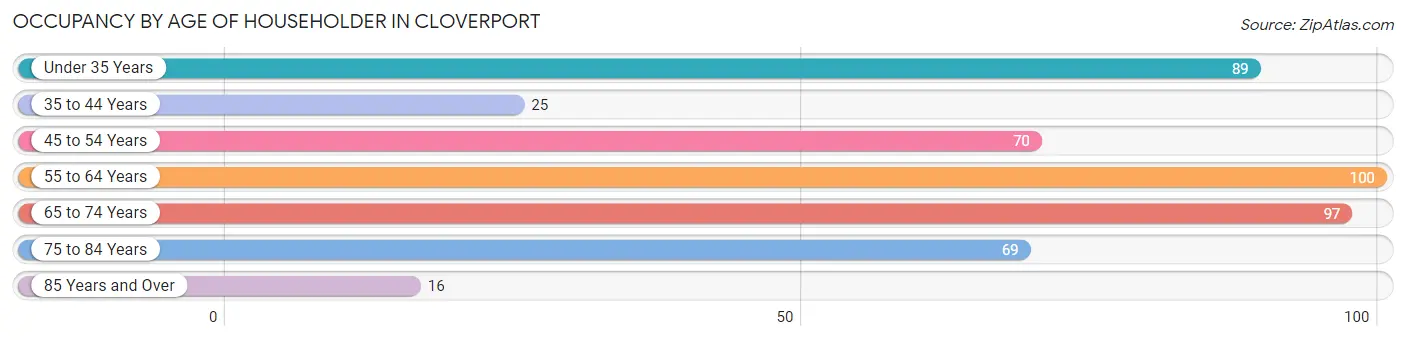
| Age Bracket | # Households | % Households |
| Under 35 Years | 89 | 19.1% |
| 35 to 44 Years | 25 | 5.4% |
| 45 to 54 Years | 70 | 15.0% |
| 55 to 64 Years | 100 | 21.5% |
| 65 to 74 Years | 97 | 20.8% |
| 75 to 84 Years | 69 | 14.8% |
| 85 Years and Over | 16 | 3.4% |
| Total | 466 | 100.0% |
Housing Finances in Cloverport
Median Income by Occupancy in Cloverport
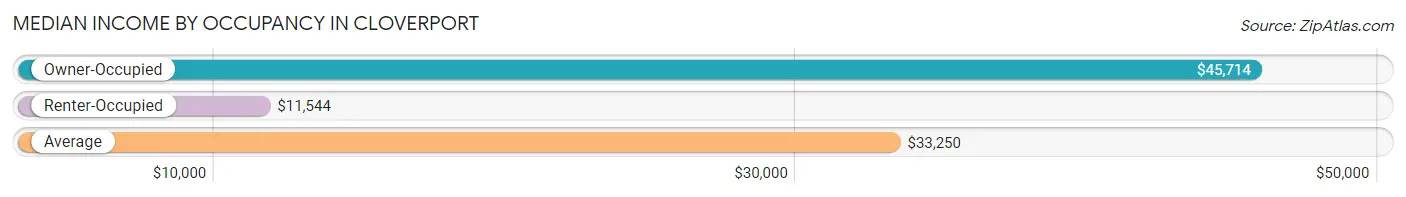
| Occupancy Type | # Households | Median Income |
| Owner-Occupied | 304 (65.2%) | $45,714 |
| Renter-Occupied | 162 (34.8%) | $11,544 |
| Average | 466 (100.0%) | $33,250 |
Occupancy by Householder Income Bracket in Cloverport
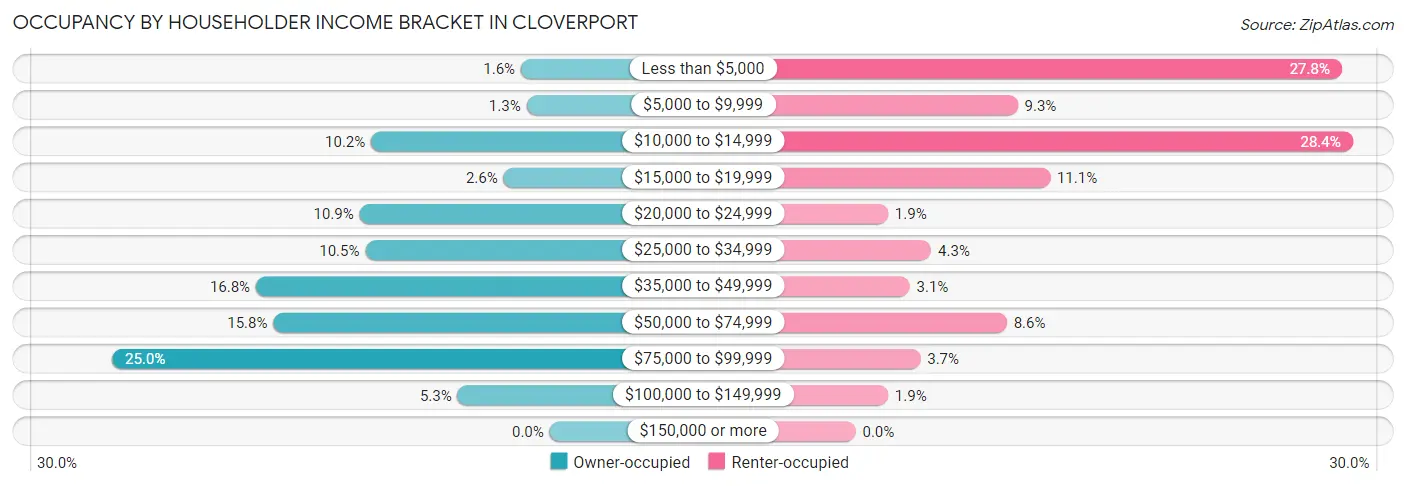
| Income Bracket | Owner-occupied | Renter-occupied |
| Less than $5,000 | 5 (1.6%) | 45 (27.8%) |
| $5,000 to $9,999 | 4 (1.3%) | 15 (9.3%) |
| $10,000 to $14,999 | 31 (10.2%) | 46 (28.4%) |
| $15,000 to $19,999 | 8 (2.6%) | 18 (11.1%) |
| $20,000 to $24,999 | 33 (10.9%) | 3 (1.8%) |
| $25,000 to $34,999 | 32 (10.5%) | 7 (4.3%) |
| $35,000 to $49,999 | 51 (16.8%) | 5 (3.1%) |
| $50,000 to $74,999 | 48 (15.8%) | 14 (8.6%) |
| $75,000 to $99,999 | 76 (25.0%) | 6 (3.7%) |
| $100,000 to $149,999 | 16 (5.3%) | 3 (1.8%) |
| $150,000 or more | 0 (0.0%) | 0 (0.0%) |
| Total | 304 (100.0%) | 162 (100.0%) |
Monthly Housing Cost Tiers in Cloverport
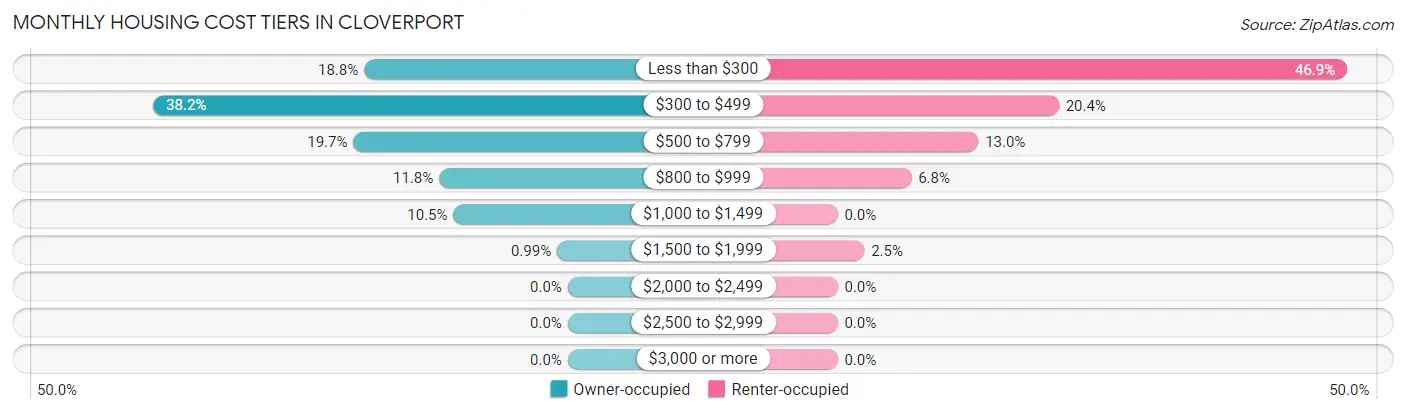
| Monthly Cost | Owner-occupied | Renter-occupied |
| Less than $300 | 57 (18.8%) | 76 (46.9%) |
| $300 to $499 | 116 (38.2%) | 33 (20.4%) |
| $500 to $799 | 60 (19.7%) | 21 (13.0%) |
| $800 to $999 | 36 (11.8%) | 11 (6.8%) |
| $1,000 to $1,499 | 32 (10.5%) | 0 (0.0%) |
| $1,500 to $1,999 | 3 (1.0%) | 4 (2.5%) |
| $2,000 to $2,499 | 0 (0.0%) | 0 (0.0%) |
| $2,500 to $2,999 | 0 (0.0%) | 0 (0.0%) |
| $3,000 or more | 0 (0.0%) | 0 (0.0%) |
| Total | 304 (100.0%) | 162 (100.0%) |
Physical Housing Characteristics in Cloverport
Housing Structures in Cloverport
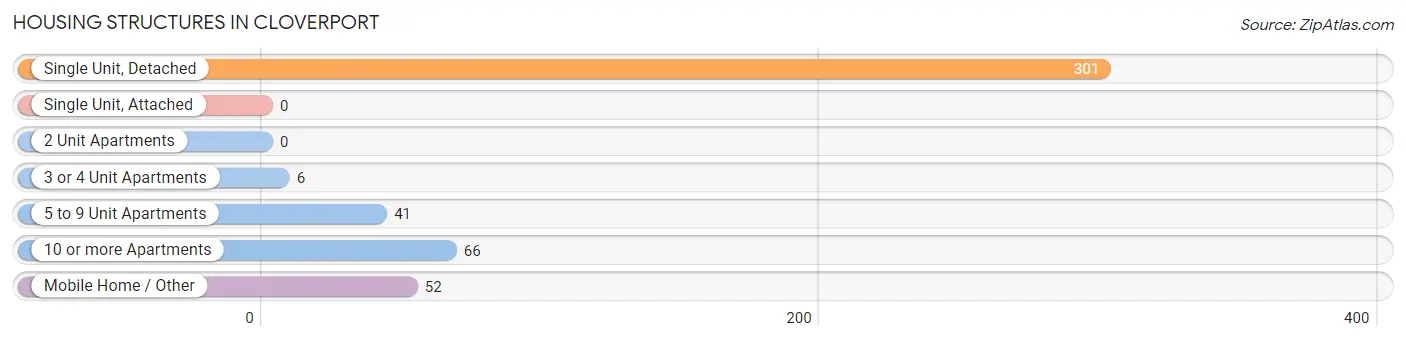
| Structure Type | # Housing Units | % Housing Units |
| Single Unit, Detached | 301 | 64.6% |
| Single Unit, Attached | 0 | 0.0% |
| 2 Unit Apartments | 0 | 0.0% |
| 3 or 4 Unit Apartments | 6 | 1.3% |
| 5 to 9 Unit Apartments | 41 | 8.8% |
| 10 or more Apartments | 66 | 14.2% |
| Mobile Home / Other | 52 | 11.2% |
| Total | 466 | 100.0% |
Housing Structures by Occupancy in Cloverport
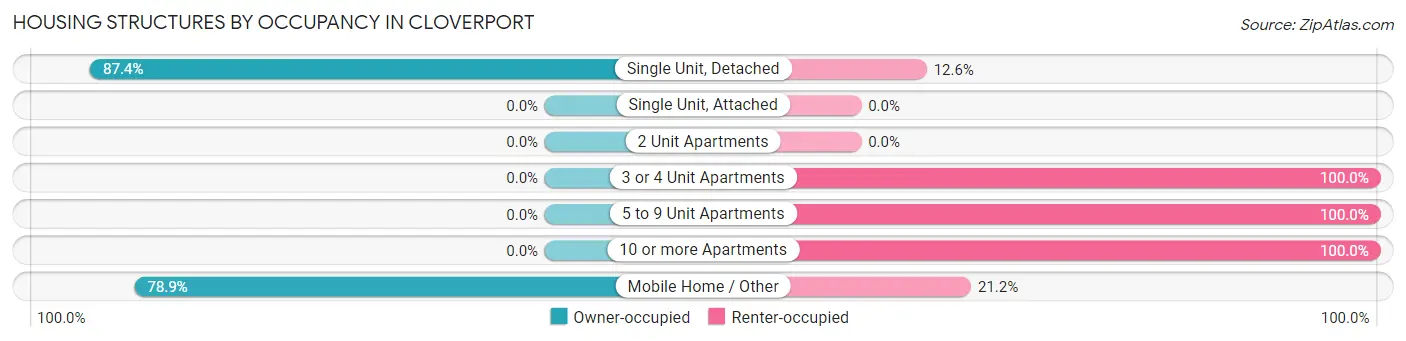
| Structure Type | Owner-occupied | Renter-occupied |
| Single Unit, Detached | 263 (87.4%) | 38 (12.6%) |
| Single Unit, Attached | 0 (0.0%) | 0 (0.0%) |
| 2 Unit Apartments | 0 (0.0%) | 0 (0.0%) |
| 3 or 4 Unit Apartments | 0 (0.0%) | 6 (100.0%) |
| 5 to 9 Unit Apartments | 0 (0.0%) | 41 (100.0%) |
| 10 or more Apartments | 0 (0.0%) | 66 (100.0%) |
| Mobile Home / Other | 41 (78.8%) | 11 (21.1%) |
| Total | 304 (65.2%) | 162 (34.8%) |
Housing Structures by Number of Rooms in Cloverport
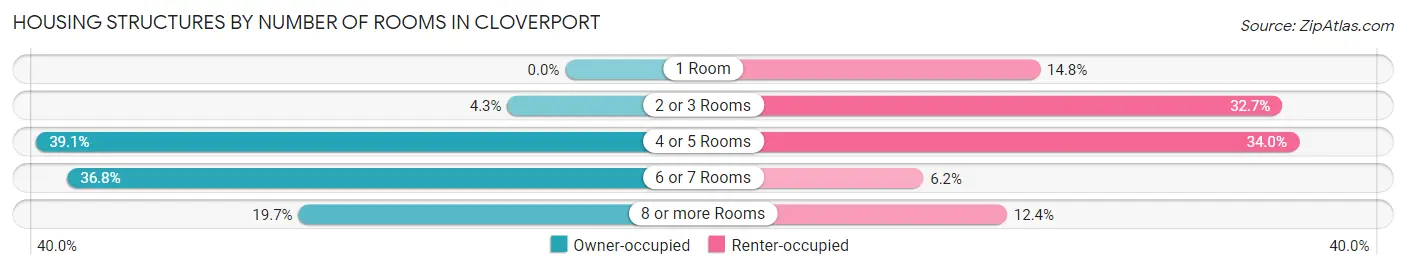
| Number of Rooms | Owner-occupied | Renter-occupied |
| 1 Room | 0 (0.0%) | 24 (14.8%) |
| 2 or 3 Rooms | 13 (4.3%) | 53 (32.7%) |
| 4 or 5 Rooms | 119 (39.1%) | 55 (34.0%) |
| 6 or 7 Rooms | 112 (36.8%) | 10 (6.2%) |
| 8 or more Rooms | 60 (19.7%) | 20 (12.3%) |
| Total | 304 (100.0%) | 162 (100.0%) |
Housing Structure by Heating Type in Cloverport
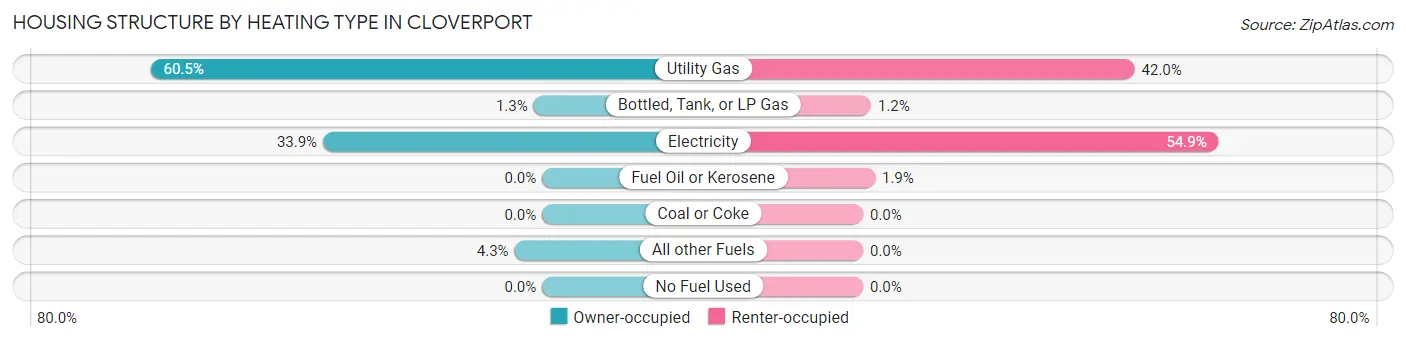
| Heating Type | Owner-occupied | Renter-occupied |
| Utility Gas | 184 (60.5%) | 68 (42.0%) |
| Bottled, Tank, or LP Gas | 4 (1.3%) | 2 (1.2%) |
| Electricity | 103 (33.9%) | 89 (54.9%) |
| Fuel Oil or Kerosene | 0 (0.0%) | 3 (1.8%) |
| Coal or Coke | 0 (0.0%) | 0 (0.0%) |
| All other Fuels | 13 (4.3%) | 0 (0.0%) |
| No Fuel Used | 0 (0.0%) | 0 (0.0%) |
| Total | 304 (100.0%) | 162 (100.0%) |
Household Vehicle Usage in Cloverport
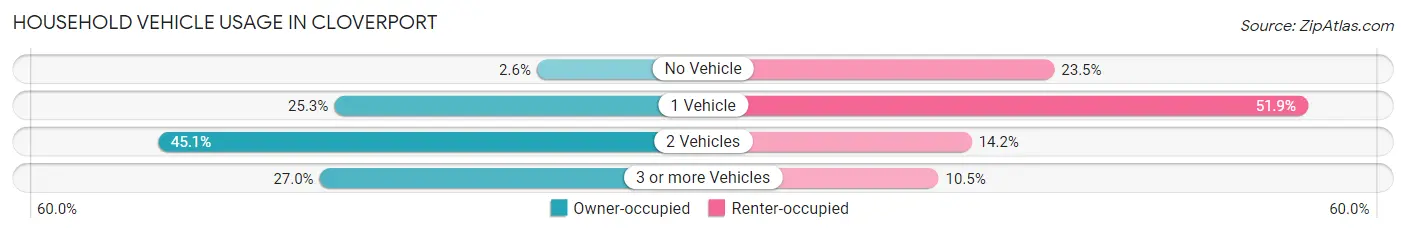
| Vehicles per Household | Owner-occupied | Renter-occupied |
| No Vehicle | 8 (2.6%) | 38 (23.5%) |
| 1 Vehicle | 77 (25.3%) | 84 (51.8%) |
| 2 Vehicles | 137 (45.1%) | 23 (14.2%) |
| 3 or more Vehicles | 82 (27.0%) | 17 (10.5%) |
| Total | 304 (100.0%) | 162 (100.0%) |
Real Estate & Mortgages in Cloverport
Real Estate and Mortgage Overview in Cloverport
| Characteristic | Without Mortgage | With Mortgage |
| Housing Units | 206 | 98 |
| Median Property Value | $70,000 | $92,500 |
| Median Household Income | $37,500 | $0 |
| Monthly Housing Costs | $363 | $0 |
| Real Estate Taxes | $495 | $2 |
Property Value by Mortgage Status in Cloverport
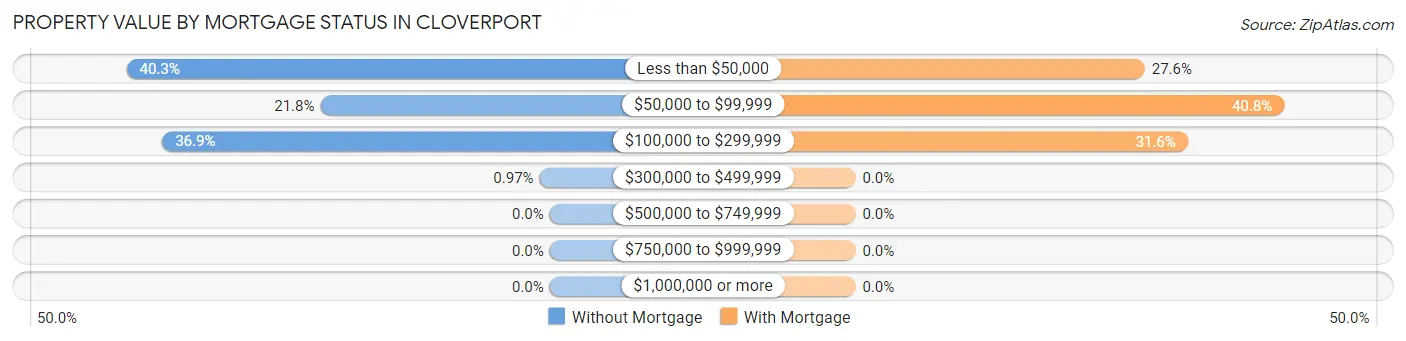
| Property Value | Without Mortgage | With Mortgage |
| Less than $50,000 | 83 (40.3%) | 27 (27.6%) |
| $50,000 to $99,999 | 45 (21.8%) | 40 (40.8%) |
| $100,000 to $299,999 | 76 (36.9%) | 31 (31.6%) |
| $300,000 to $499,999 | 2 (1.0%) | 0 (0.0%) |
| $500,000 to $749,999 | 0 (0.0%) | 0 (0.0%) |
| $750,000 to $999,999 | 0 (0.0%) | 0 (0.0%) |
| $1,000,000 or more | 0 (0.0%) | 0 (0.0%) |
| Total | 206 (100.0%) | 98 (100.0%) |
Household Income by Mortgage Status in Cloverport
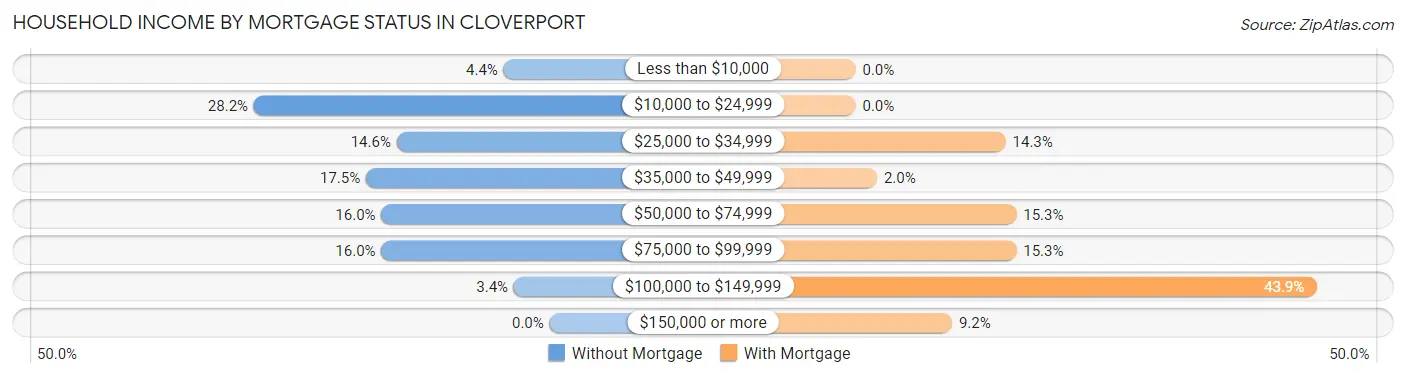
| Household Income | Without Mortgage | With Mortgage |
| Less than $10,000 | 9 (4.4%) | 0 (0.0%) |
| $10,000 to $24,999 | 58 (28.2%) | 0 (0.0%) |
| $25,000 to $34,999 | 30 (14.6%) | 14 (14.3%) |
| $35,000 to $49,999 | 36 (17.5%) | 2 (2.0%) |
| $50,000 to $74,999 | 33 (16.0%) | 15 (15.3%) |
| $75,000 to $99,999 | 33 (16.0%) | 15 (15.3%) |
| $100,000 to $149,999 | 7 (3.4%) | 43 (43.9%) |
| $150,000 or more | 0 (0.0%) | 9 (9.2%) |
| Total | 206 (100.0%) | 98 (100.0%) |
Property Value to Household Income Ratio in Cloverport
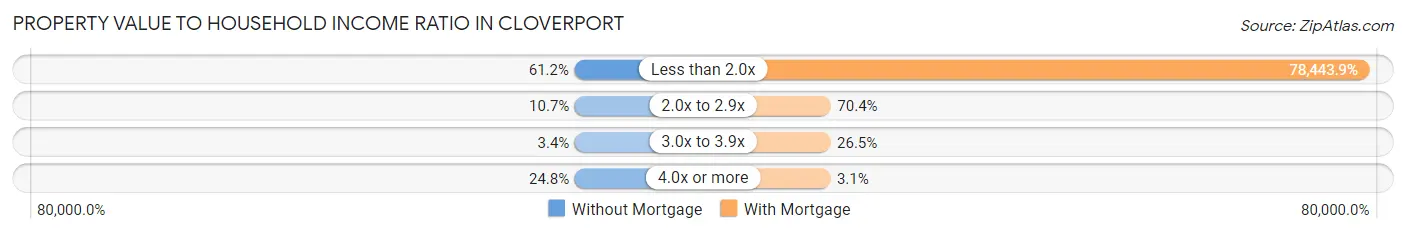
| Value-to-Income Ratio | Without Mortgage | With Mortgage |
| Less than 2.0x | 126 (61.2%) | 76,875 (78,443.9%) |
| 2.0x to 2.9x | 22 (10.7%) | 69 (70.4%) |
| 3.0x to 3.9x | 7 (3.4%) | 26 (26.5%) |
| 4.0x or more | 51 (24.8%) | 3 (3.1%) |
| Total | 206 (100.0%) | 98 (100.0%) |
Real Estate Taxes by Mortgage Status in Cloverport
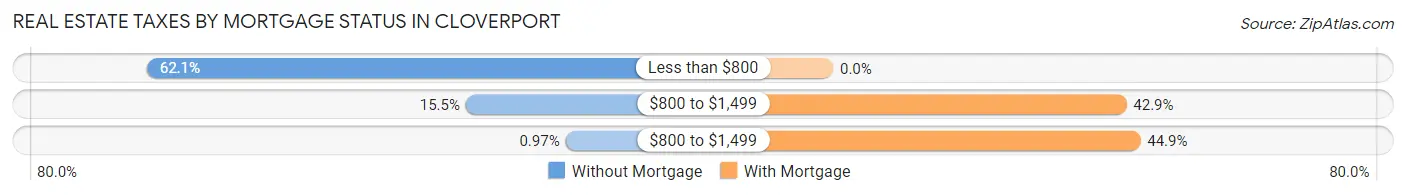
| Property Taxes | Without Mortgage | With Mortgage |
| Less than $800 | 128 (62.1%) | 0 (0.0%) |
| $800 to $1,499 | 32 (15.5%) | 42 (42.9%) |
| $800 to $1,499 | 2 (1.0%) | 44 (44.9%) |
| Total | 206 (100.0%) | 98 (100.0%) |
Health & Disability in Cloverport
Health Insurance Coverage by Age in Cloverport
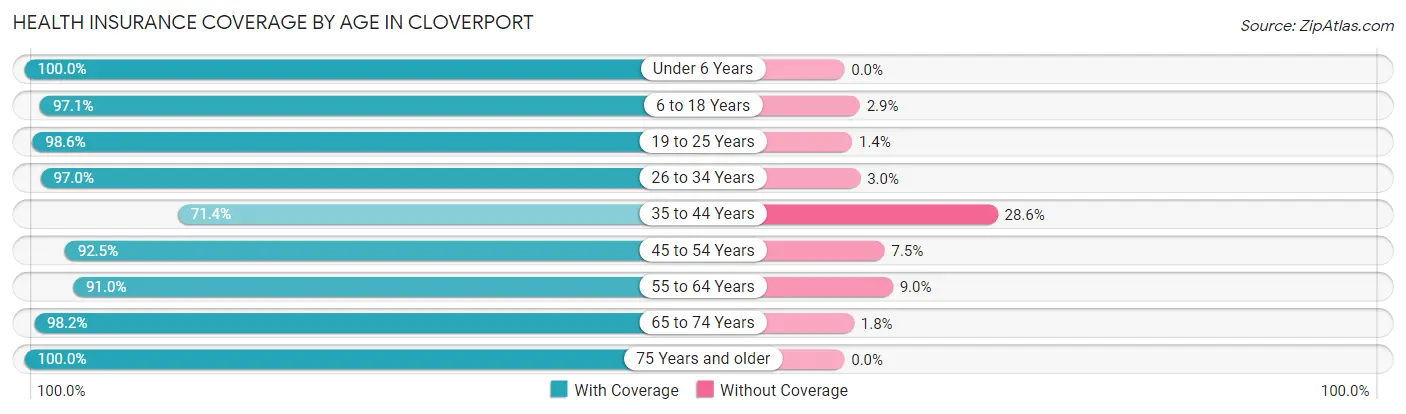
| Age Bracket | With Coverage | Without Coverage |
| Under 6 Years | 93 (100.0%) | 0 (0.0%) |
| 6 to 18 Years | 135 (97.1%) | 4 (2.9%) |
| 19 to 25 Years | 137 (98.6%) | 2 (1.4%) |
| 26 to 34 Years | 98 (97.0%) | 3 (3.0%) |
| 35 to 44 Years | 60 (71.4%) | 24 (28.6%) |
| 45 to 54 Years | 185 (92.5%) | 15 (7.5%) |
| 55 to 64 Years | 141 (91.0%) | 14 (9.0%) |
| 65 to 74 Years | 166 (98.2%) | 3 (1.8%) |
| 75 Years and older | 105 (100.0%) | 0 (0.0%) |
| Total | 1,120 (94.5%) | 65 (5.5%) |
Health Insurance Coverage by Citizenship Status in Cloverport
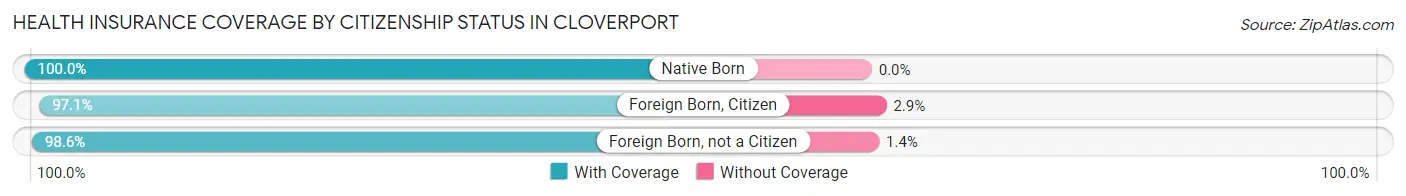
| Citizenship Status | With Coverage | Without Coverage |
| Native Born | 93 (100.0%) | 0 (0.0%) |
| Foreign Born, Citizen | 135 (97.1%) | 4 (2.9%) |
| Foreign Born, not a Citizen | 137 (98.6%) | 2 (1.4%) |
Health Insurance Coverage by Household Income in Cloverport
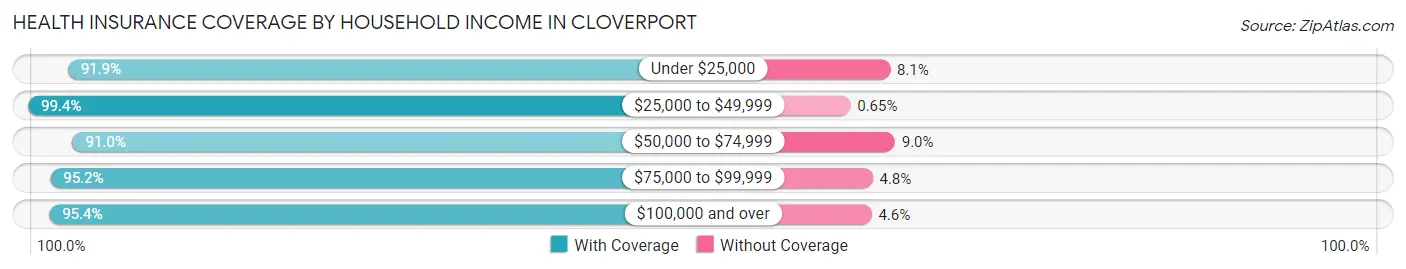
| Household Income | With Coverage | Without Coverage |
| Under $25,000 | 363 (91.9%) | 32 (8.1%) |
| $25,000 to $49,999 | 306 (99.4%) | 2 (0.6%) |
| $50,000 to $74,999 | 172 (91.0%) | 17 (9.0%) |
| $75,000 to $99,999 | 217 (95.2%) | 11 (4.8%) |
| $100,000 and over | 62 (95.4%) | 3 (4.6%) |
Public vs Private Health Insurance Coverage by Age in Cloverport
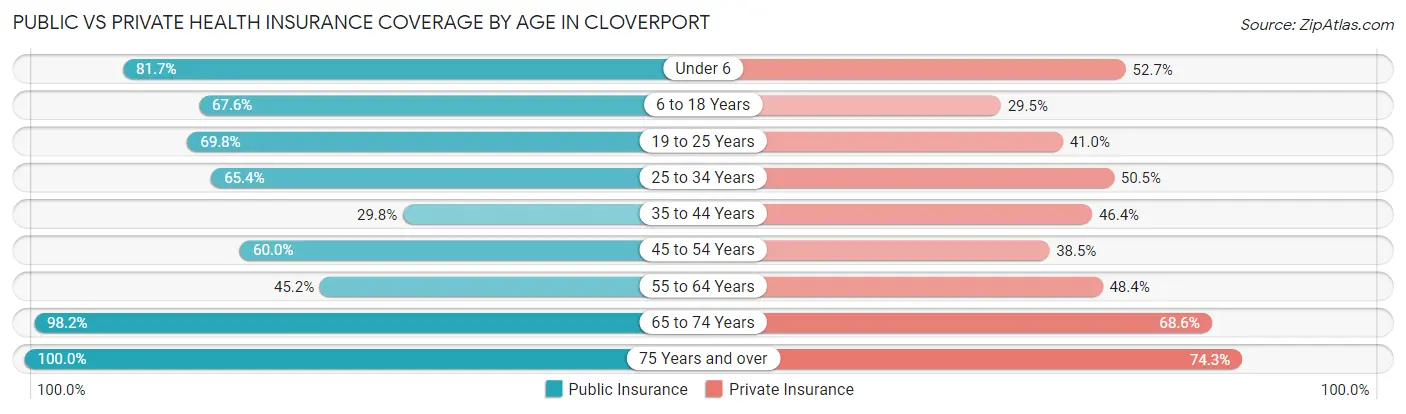
| Age Bracket | Public Insurance | Private Insurance |
| Under 6 | 76 (81.7%) | 49 (52.7%) |
| 6 to 18 Years | 94 (67.6%) | 41 (29.5%) |
| 19 to 25 Years | 97 (69.8%) | 57 (41.0%) |
| 25 to 34 Years | 66 (65.3%) | 51 (50.5%) |
| 35 to 44 Years | 25 (29.8%) | 39 (46.4%) |
| 45 to 54 Years | 120 (60.0%) | 77 (38.5%) |
| 55 to 64 Years | 70 (45.2%) | 75 (48.4%) |
| 65 to 74 Years | 166 (98.2%) | 116 (68.6%) |
| 75 Years and over | 105 (100.0%) | 78 (74.3%) |
| Total | 819 (69.1%) | 583 (49.2%) |
Disability Status by Sex by Age in Cloverport
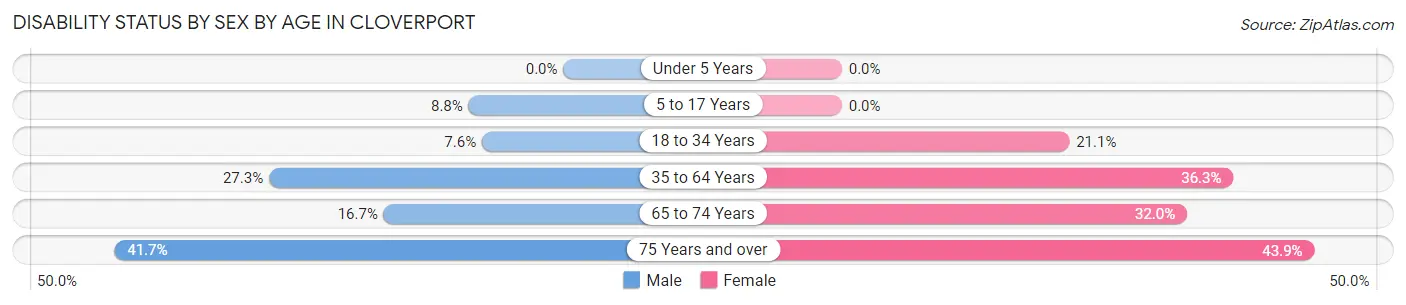
| Age Bracket | Male | Female |
| Under 5 Years | 0 (0.0%) | 0 (0.0%) |
| 5 to 17 Years | 8 (8.8%) | 0 (0.0%) |
| 18 to 34 Years | 12 (7.5%) | 19 (21.1%) |
| 35 to 64 Years | 53 (27.3%) | 89 (36.3%) |
| 65 to 74 Years | 11 (16.7%) | 33 (32.0%) |
| 75 Years and over | 20 (41.7%) | 25 (43.9%) |
Disability Class by Sex by Age in Cloverport
Disability Class: Hearing Difficulty
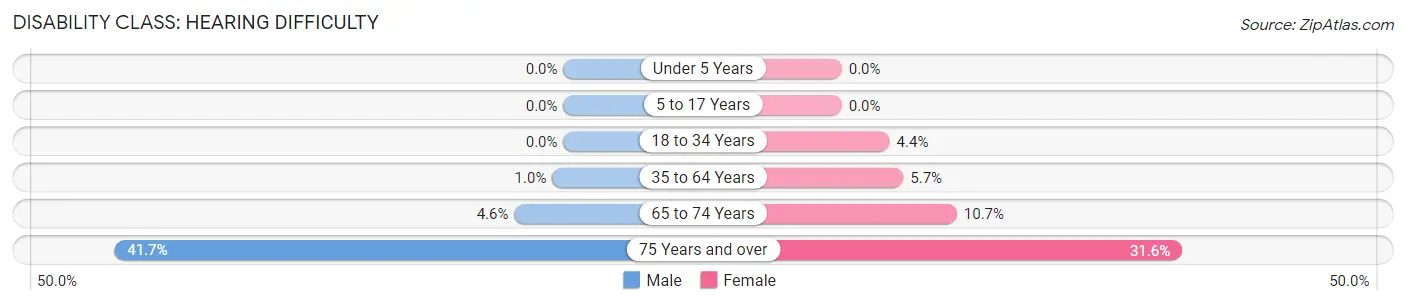
| Age Bracket | Male | Female |
| Under 5 Years | 0 (0.0%) | 0 (0.0%) |
| 5 to 17 Years | 0 (0.0%) | 0 (0.0%) |
| 18 to 34 Years | 0 (0.0%) | 4 (4.4%) |
| 35 to 64 Years | 2 (1.0%) | 14 (5.7%) |
| 65 to 74 Years | 3 (4.5%) | 11 (10.7%) |
| 75 Years and over | 20 (41.7%) | 18 (31.6%) |
Disability Class: Vision Difficulty
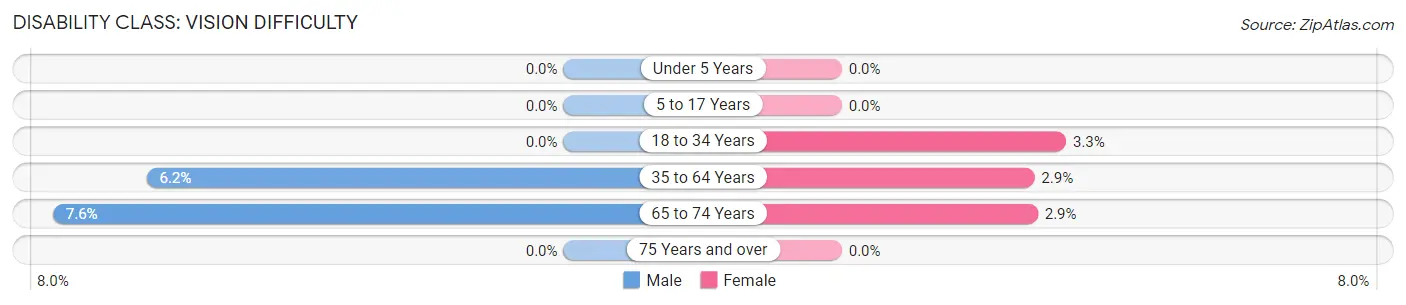
| Age Bracket | Male | Female |
| Under 5 Years | 0 (0.0%) | 0 (0.0%) |
| 5 to 17 Years | 0 (0.0%) | 0 (0.0%) |
| 18 to 34 Years | 0 (0.0%) | 3 (3.3%) |
| 35 to 64 Years | 12 (6.2%) | 7 (2.9%) |
| 65 to 74 Years | 5 (7.6%) | 3 (2.9%) |
| 75 Years and over | 0 (0.0%) | 0 (0.0%) |
Disability Class: Cognitive Difficulty
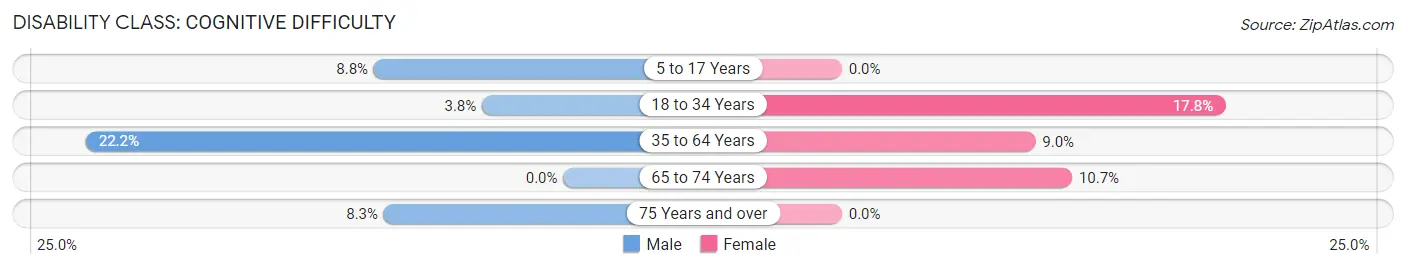
| Age Bracket | Male | Female |
| 5 to 17 Years | 8 (8.8%) | 0 (0.0%) |
| 18 to 34 Years | 6 (3.8%) | 16 (17.8%) |
| 35 to 64 Years | 43 (22.2%) | 22 (9.0%) |
| 65 to 74 Years | 0 (0.0%) | 11 (10.7%) |
| 75 Years and over | 4 (8.3%) | 0 (0.0%) |
Disability Class: Ambulatory Difficulty
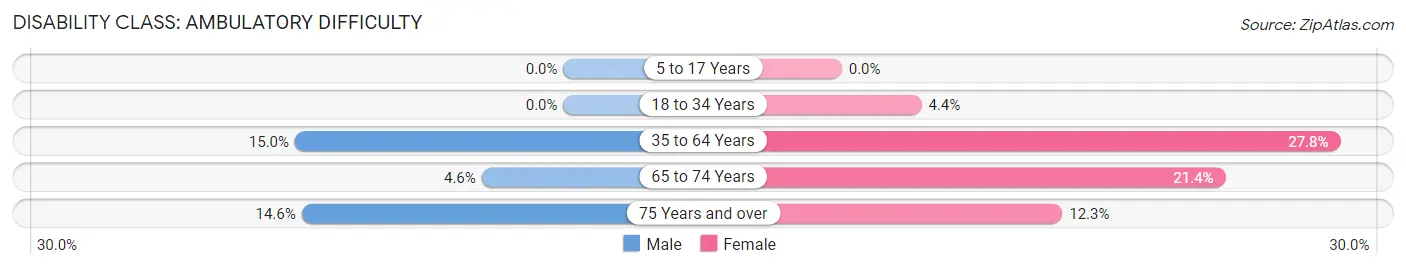
| Age Bracket | Male | Female |
| 5 to 17 Years | 0 (0.0%) | 0 (0.0%) |
| 18 to 34 Years | 0 (0.0%) | 4 (4.4%) |
| 35 to 64 Years | 29 (14.9%) | 68 (27.8%) |
| 65 to 74 Years | 3 (4.5%) | 22 (21.4%) |
| 75 Years and over | 7 (14.6%) | 7 (12.3%) |
Disability Class: Self-Care Difficulty
| Age Bracket | Male | Female |
| 5 to 17 Years | 0 (0.0%) | 0 (0.0%) |
| 18 to 34 Years | 3 (1.9%) | 0 (0.0%) |
| 35 to 64 Years | 24 (12.4%) | 18 (7.3%) |
| 65 to 74 Years | 3 (4.5%) | 0 (0.0%) |
| 75 Years and over | 0 (0.0%) | 4 (7.0%) |
Technology Access in Cloverport
Computing Device Access in Cloverport
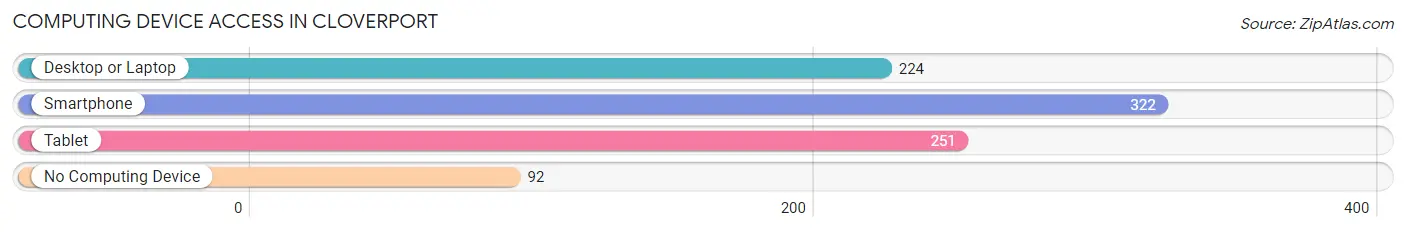
| Device Type | # Households | % Households |
| Desktop or Laptop | 224 | 48.1% |
| Smartphone | 322 | 69.1% |
| Tablet | 251 | 53.9% |
| No Computing Device | 92 | 19.7% |
| Total | 466 | 100.0% |
Internet Access in Cloverport
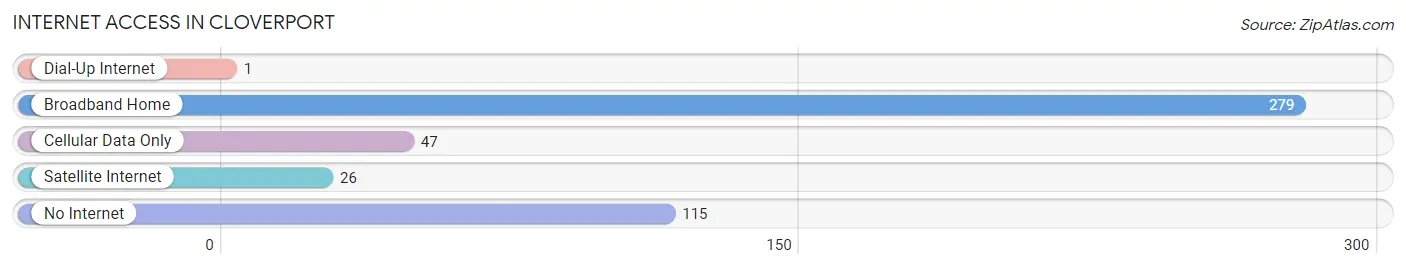
| Internet Type | # Households | % Households |
| Dial-Up Internet | 1 | 0.2% |
| Broadband Home | 279 | 59.9% |
| Cellular Data Only | 47 | 10.1% |
| Satellite Internet | 26 | 5.6% |
| No Internet | 115 | 24.7% |
| Total | 466 | 100.0% |
Cloverport Summary
Cloverport, Kentucky is a small city located in Breckinridge County, Kentucky. It is situated on the banks of the Ohio River, and is the county seat of Breckinridge County. The city has a population of 1,845 as of the 2010 census, and is part of the Louisville/Jefferson County Metropolitan Statistical Area.
History
Cloverport was founded in 1810 by William and John Clover, two brothers who had moved to the area from Virginia. The town was originally known as Cloversport, but the name was changed to Cloverport in 1818. The town was incorporated in 1837, and the first post office was established in 1838.
The town was an important port on the Ohio River, and was a major shipping point for tobacco, hemp, and other goods. The town was also a major stop on the Louisville and Nashville Railroad, which ran through the town from 1858 to 1971.
Geography
Cloverport is located in Breckinridge County, Kentucky, on the banks of the Ohio River. The city has a total area of 1.2 square miles, all of which is land. The city is located about 40 miles southwest of Louisville, and about 30 miles east of Owensboro.
The city is situated in a hilly region, and is surrounded by rolling hills and farmland. The city is located in the Eastern Coal Field region of Kentucky, and is part of the Louisville/Jefferson County Metropolitan Statistical Area.
Economy
Cloverport’s economy is largely based on agriculture and tourism. The city is home to several small businesses, including a grocery store, a hardware store, and a few restaurants. The city is also home to a number of antique stores, which attract tourists from all over the region.
The city is also home to a number of manufacturing companies, including a furniture factory, a plastics factory, and a metal fabrication plant. The city is also home to a number of small farms, which produce a variety of crops, including corn, soybeans, and tobacco.
Demographics
As of the 2010 census, Cloverport had a population of 1,845. The racial makeup of the city was 95.3% White, 2.2% African American, 0.3% Native American, 0.2% Asian, 0.1% Pacific Islander, 0.7% from other races, and 1.3% from two or more races. Hispanic or Latino of any race were 1.7% of the population.
The median income for a household in the city was $30,938, and the median income for a family was $37,813. The per capita income for the city was $17,845. About 17.2% of families and 20.2% of the population were below the poverty line, including 28.3% of those under age 18 and 15.2% of those age 65 or over.
Cloverport is a small city with a rich history and a vibrant economy. The city is home to a number of small businesses, farms, and manufacturing companies, and is a popular tourist destination. The city has a diverse population, and is a great place to live and work.
Common Questions
What is Per Capita Income in Cloverport?
Per Capita income in Cloverport is $17,742.
What is the Median Family Income in Cloverport?
Median Family Income in Cloverport is $44,148.
What is the Median Household income in Cloverport?
Median Household Income in Cloverport is $33,250.
What is Income or Wage Gap in Cloverport?
Income or Wage Gap in Cloverport is 44.7%.
Women in Cloverport earn 55.3 cents for every dollar earned by a man.
What is Inequality or Gini Index in Cloverport?
Inequality or Gini Index in Cloverport is 0.46.
What is the Total Population of Cloverport?
Total Population of Cloverport is 1,185.
What is the Total Male Population of Cloverport?
Total Male Population of Cloverport is 603.
What is the Total Female Population of Cloverport?
Total Female Population of Cloverport is 582.
What is the Ratio of Males per 100 Females in Cloverport?
There are 103.61 Males per 100 Females in Cloverport.
What is the Ratio of Females per 100 Males in Cloverport?
There are 96.52 Females per 100 Males in Cloverport.
What is the Median Population Age in Cloverport?
Median Population Age in Cloverport is 46.6 Years.
What is the Average Family Size in Cloverport
Average Family Size in Cloverport is 3.3 People.
What is the Average Household Size in Cloverport
Average Household Size in Cloverport is 2.5 People.
How Large is the Labor Force in Cloverport?
There are 443 People in the Labor Forcein in Cloverport.
What is the Percentage of People in the Labor Force in Cloverport?
45.1% of People are in the Labor Force in Cloverport.
What is the Unemployment Rate in Cloverport?
Unemployment Rate in Cloverport is 18.1%.