Harlan, KY Map & Demographics
Harlan Map
Harlan Overview
$21,108
PER CAPITA INCOME
$33,854
AVG FAMILY INCOME
$24,936
AVG HOUSEHOLD INCOME
27.1%
WAGE / INCOME GAP [ % ]
72.9¢/ $1
WAGE / INCOME GAP [ $ ]
0.53
INEQUALITY / GINI INDEX
1,908
TOTAL POPULATION
747
MALE POPULATION
1,161
FEMALE POPULATION
64.34
MALES / 100 FEMALES
155.42
FEMALES / 100 MALES
41.0
MEDIAN AGE
2.8
AVG FAMILY SIZE
2.2
AVG HOUSEHOLD SIZE
723
LABOR FORCE [ PEOPLE ]
46.6%
PERCENT IN LABOR FORCE
11.8%
UNEMPLOYMENT RATE
Harlan Zip Codes
Harlan Area Codes
Income in Harlan
Income Overview in Harlan
Per Capita Income in Harlan is $21,108, while median incomes of families and households are $33,854 and $24,936 respectively.
| Characteristic | Number | Measure |
| Per Capita Income | 1,908 | $21,108 |
| Median Family Income | 508 | $33,854 |
| Mean Family Income | 508 | $55,746 |
| Median Household Income | 878 | $24,936 |
| Mean Household Income | 878 | $44,843 |
| Income Deficit | 508 | $0 |
| Wage / Income Gap (%) | 1,908 | 27.08% |
| Wage / Income Gap ($) | 1,908 | 72.92¢ per $1 |
| Gini / Inequality Index | 1,908 | 0.53 |
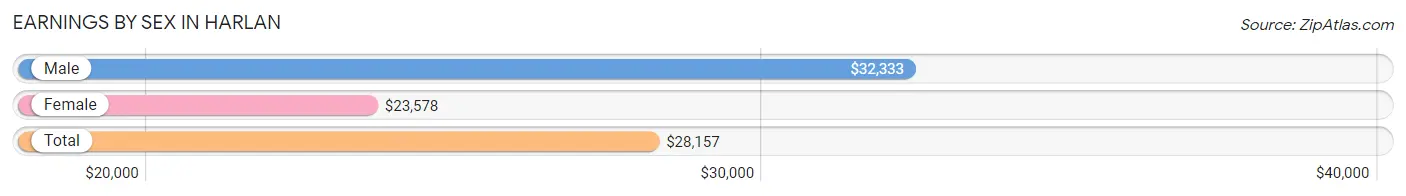
Earnings by Sex in Harlan
Average Earnings in Harlan are $28,157, $32,333 for men and $23,578 for women, a difference of 27.1%.
| Sex | Number | Average Earnings |
| Male | 236 (31.7%) | $32,333 |
| Female | 509 (68.3%) | $23,578 |
| Total | 745 (100.0%) | $28,157 |
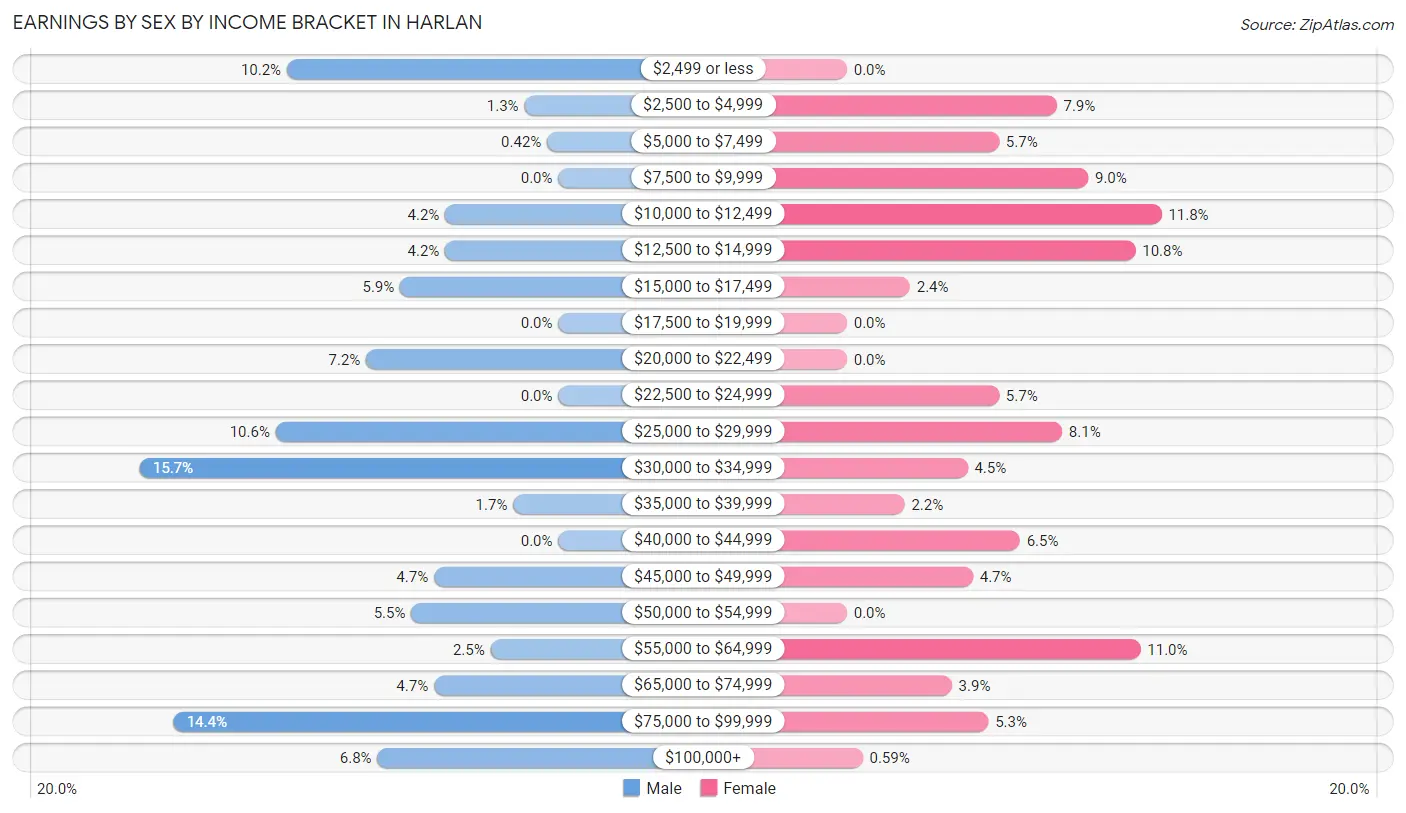
Earnings by Sex by Income Bracket in Harlan
The most common earnings brackets in Harlan are $30,000 to $34,999 for men (37 | 15.7%) and $10,000 to $12,499 for women (60 | 11.8%).
| Income | Male | Female |
| $2,499 or less | 24 (10.2%) | 0 (0.0%) |
| $2,500 to $4,999 | 3 (1.3%) | 40 (7.9%) |
| $5,000 to $7,499 | 1 (0.4%) | 29 (5.7%) |
| $7,500 to $9,999 | 0 (0.0%) | 46 (9.0%) |
| $10,000 to $12,499 | 10 (4.2%) | 60 (11.8%) |
| $12,500 to $14,999 | 10 (4.2%) | 55 (10.8%) |
| $15,000 to $17,499 | 14 (5.9%) | 12 (2.4%) |
| $17,500 to $19,999 | 0 (0.0%) | 0 (0.0%) |
| $20,000 to $22,499 | 17 (7.2%) | 0 (0.0%) |
| $22,500 to $24,999 | 0 (0.0%) | 29 (5.7%) |
| $25,000 to $29,999 | 25 (10.6%) | 41 (8.1%) |
| $30,000 to $34,999 | 37 (15.7%) | 23 (4.5%) |
| $35,000 to $39,999 | 4 (1.7%) | 11 (2.2%) |
| $40,000 to $44,999 | 0 (0.0%) | 33 (6.5%) |
| $45,000 to $49,999 | 11 (4.7%) | 24 (4.7%) |
| $50,000 to $54,999 | 13 (5.5%) | 0 (0.0%) |
| $55,000 to $64,999 | 6 (2.5%) | 56 (11.0%) |
| $65,000 to $74,999 | 11 (4.7%) | 20 (3.9%) |
| $75,000 to $99,999 | 34 (14.4%) | 27 (5.3%) |
| $100,000+ | 16 (6.8%) | 3 (0.6%) |
| Total | 236 (100.0%) | 509 (100.0%) |
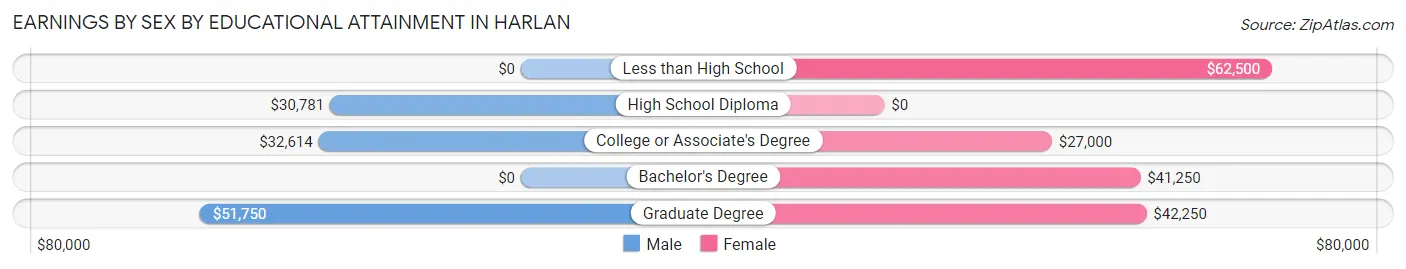
Earnings by Sex by Educational Attainment in Harlan
Average earnings in Harlan are $34,432 for men and $35,114 for women, a difference of 1.9%. Men with an educational attainment of graduate degree enjoy the highest average annual earnings of $51,750, while those with high school diploma education earn the least with $30,781. Women with an educational attainment of less than high school earn the most with the average annual earnings of $62,500, while those with college or associate's degree education have the smallest earnings of $27,000.
| Educational Attainment | Male Income | Female Income |
| Less than High School | - | - |
| High School Diploma | $30,781 | $0 |
| College or Associate's Degree | $32,614 | $27,000 |
| Bachelor's Degree | - | - |
| Graduate Degree | $51,750 | $42,250 |
| Total | $34,432 | $35,114 |
Family Income in Harlan
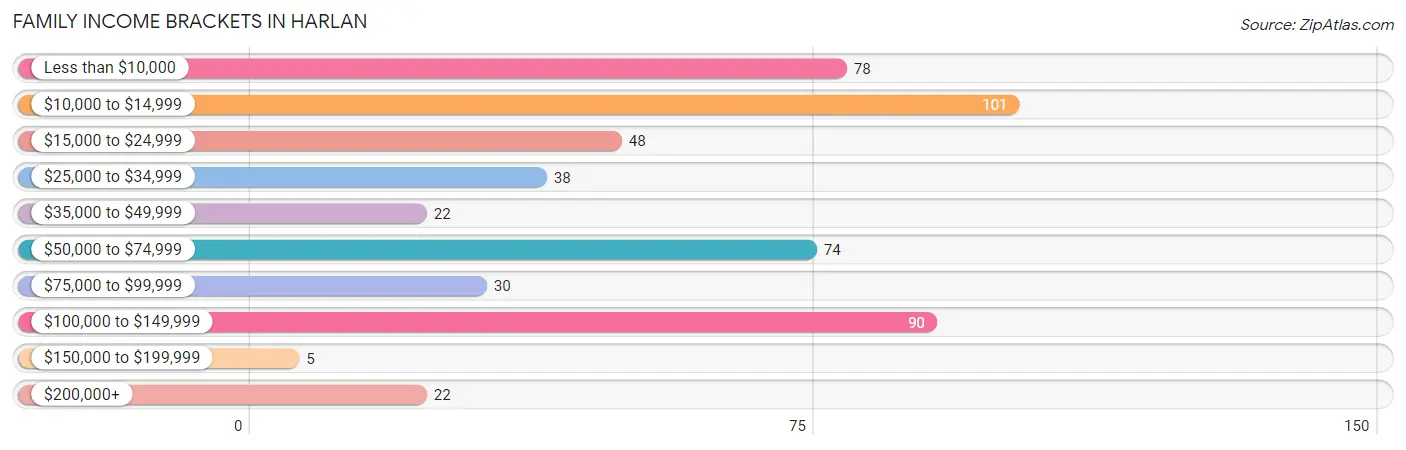
Family Income Brackets in Harlan
According to the Harlan family income data, there are 101 families falling into the $10,000 to $14,999 income range, which is the most common income bracket and makes up 19.9% of all families. Conversely, the $150,000 to $199,999 income bracket is the least frequent group with only 5 families (1.0%) belonging to this category.
| Income Bracket | # Families | % Families |
| Less than $10,000 | 78 | 15.4% |
| $10,000 to $14,999 | 101 | 19.9% |
| $15,000 to $24,999 | 48 | 9.4% |
| $25,000 to $34,999 | 38 | 7.5% |
| $35,000 to $49,999 | 22 | 4.3% |
| $50,000 to $74,999 | 74 | 14.6% |
| $75,000 to $99,999 | 30 | 5.9% |
| $100,000 to $149,999 | 90 | 17.7% |
| $150,000 to $199,999 | 5 | 1.0% |
| $200,000+ | 22 | 4.3% |
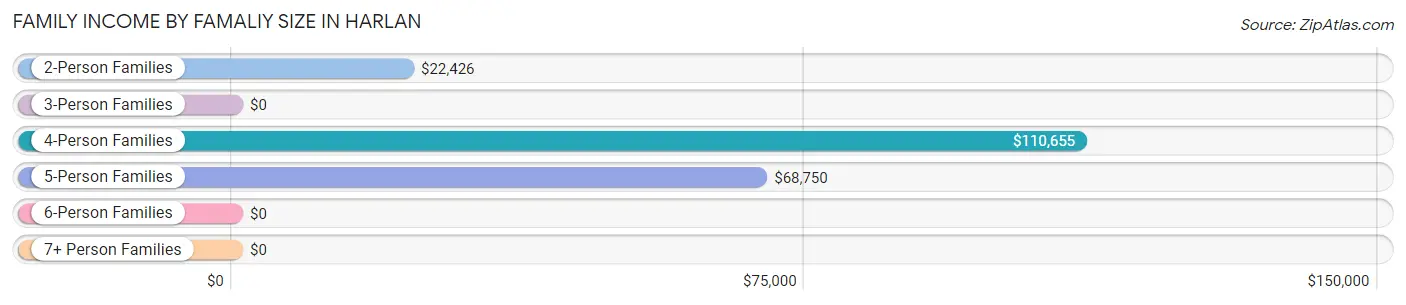
Family Income by Famaliy Size in Harlan
4-person families (65 | 12.8%) account for the highest median family income in Harlan with $110,655 per family, while 4-person families (65 | 12.8%) have the highest median income of $27,664 per family member.
| Income Bracket | # Families | Median Income |
| 2-Person Families | 323 (63.6%) | $22,426 |
| 3-Person Families | 85 (16.7%) | $0 |
| 4-Person Families | 65 (12.8%) | $110,655 |
| 5-Person Families | 30 (5.9%) | $68,750 |
| 6-Person Families | 2 (0.4%) | $0 |
| 7+ Person Families | 3 (0.6%) | $0 |
| Total | 508 (100.0%) | $33,854 |
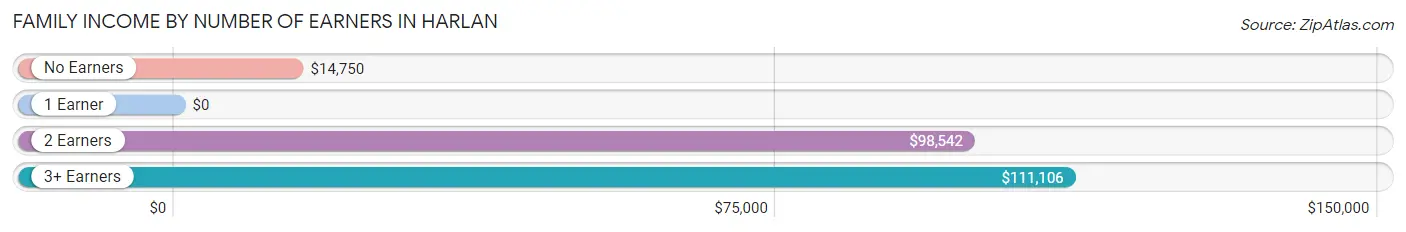
Family Income by Number of Earners in Harlan
| Number of Earners | # Families | Median Income |
| No Earners | 188 (37.0%) | $14,750 |
| 1 Earner | 194 (38.2%) | $0 |
| 2 Earners | 63 (12.4%) | $98,542 |
| 3+ Earners | 63 (12.4%) | $111,106 |
| Total | 508 (100.0%) | $33,854 |
Household Income in Harlan
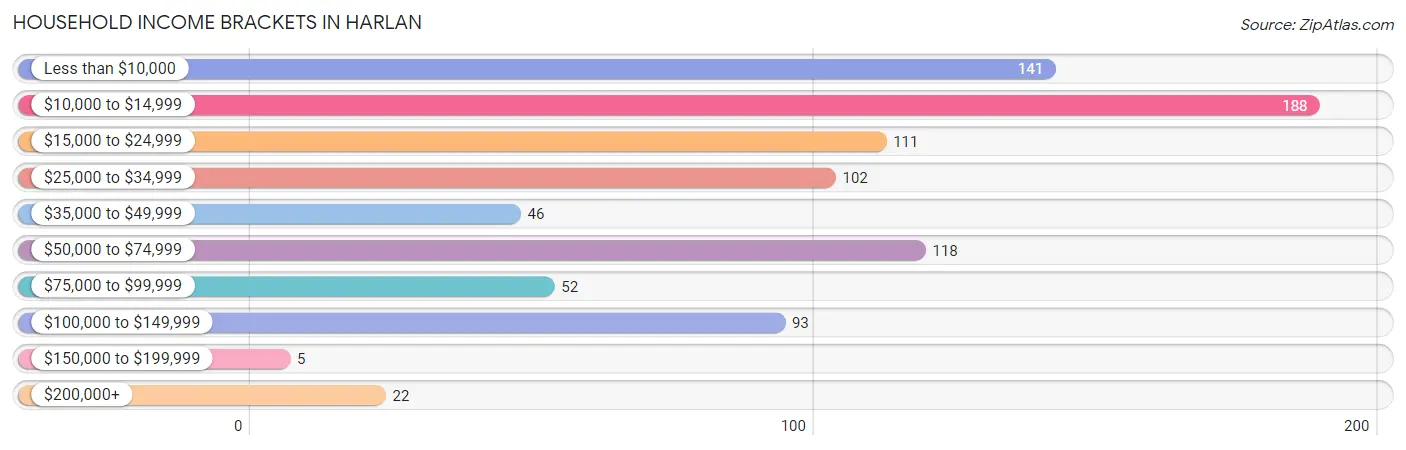
Household Income Brackets in Harlan
With 188 households falling in the category, the $10,000 to $14,999 income range is the most frequent in Harlan, accounting for 21.4% of all households. In contrast, only 5 households (0.6%) fall into the $150,000 to $199,999 income bracket, making it the least populous group.
| Income Bracket | # Households | % Households |
| Less than $10,000 | 141 | 16.1% |
| $10,000 to $14,999 | 188 | 21.4% |
| $15,000 to $24,999 | 111 | 12.6% |
| $25,000 to $34,999 | 102 | 11.6% |
| $35,000 to $49,999 | 46 | 5.2% |
| $50,000 to $74,999 | 118 | 13.4% |
| $75,000 to $99,999 | 52 | 5.9% |
| $100,000 to $149,999 | 93 | 10.6% |
| $150,000 to $199,999 | 5 | 0.6% |
| $200,000+ | 22 | 2.5% |
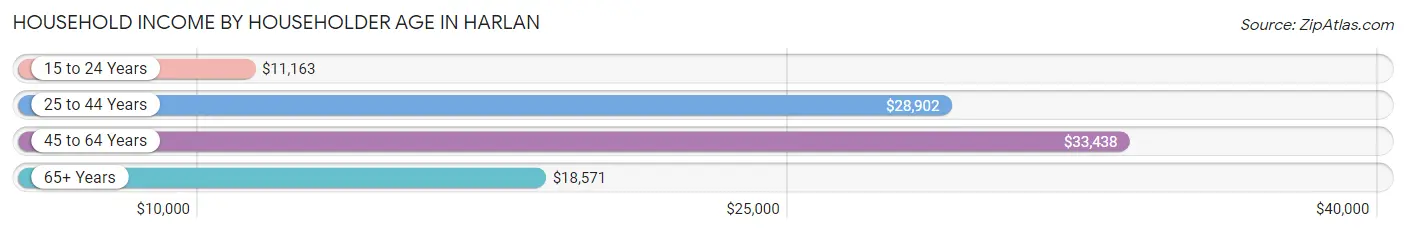
Household Income by Householder Age in Harlan
The median household income in Harlan is $24,936, with the highest median household income of $33,438 found in the 45 to 64 years age bracket for the primary householder. A total of 350 households (39.9%) fall into this category. Meanwhile, the 15 to 24 years age bracket for the primary householder has the lowest median household income of $11,163, with 56 households (6.4%) in this group.
| Income Bracket | # Households | Median Income |
| 15 to 24 Years | 56 (6.4%) | $11,163 |
| 25 to 44 Years | 290 (33.0%) | $28,902 |
| 45 to 64 Years | 350 (39.9%) | $33,438 |
| 65+ Years | 182 (20.7%) | $18,571 |
| Total | 878 (100.0%) | $24,936 |
Poverty in Harlan
Income Below Poverty by Sex and Age in Harlan
With 36.3% poverty level for males and 44.8% for females among the residents of Harlan, 5 year old males and 6 to 11 year old females are the most vulnerable to poverty, with 37 males (100.0%) and 61 females (76.2%) in their respective age groups living below the poverty level.
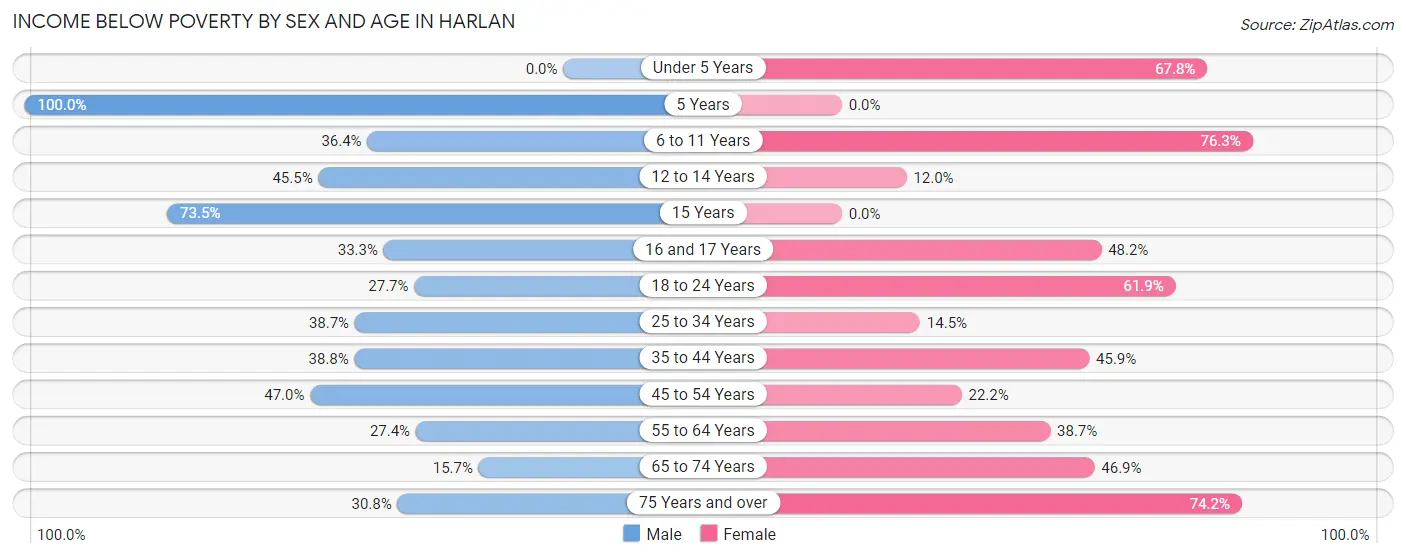
| Age Bracket | Male | Female |
| Under 5 Years | 0 (0.0%) | 59 (67.8%) |
| 5 Years | 37 (100.0%) | 0 (0.0%) |
| 6 to 11 Years | 16 (36.4%) | 61 (76.2%) |
| 12 to 14 Years | 10 (45.5%) | 3 (12.0%) |
| 15 Years | 25 (73.5%) | 0 (0.0%) |
| 16 and 17 Years | 7 (33.3%) | 26 (48.1%) |
| 18 to 24 Years | 13 (27.7%) | 83 (61.9%) |
| 25 to 34 Years | 41 (38.7%) | 19 (14.5%) |
| 35 to 44 Years | 31 (38.8%) | 73 (45.9%) |
| 45 to 54 Years | 31 (47.0%) | 32 (22.2%) |
| 55 to 64 Years | 29 (27.4%) | 70 (38.7%) |
| 65 to 74 Years | 19 (15.7%) | 45 (46.9%) |
| 75 Years and over | 12 (30.8%) | 49 (74.2%) |
| Total | 271 (36.3%) | 520 (44.8%) |
Income Above Poverty by Sex and Age in Harlan
According to the poverty statistics in Harlan, males aged under 5 years and females aged 15 years are the age groups that are most secure financially, with 100.0% of males and 100.0% of females in these age groups living above the poverty line.
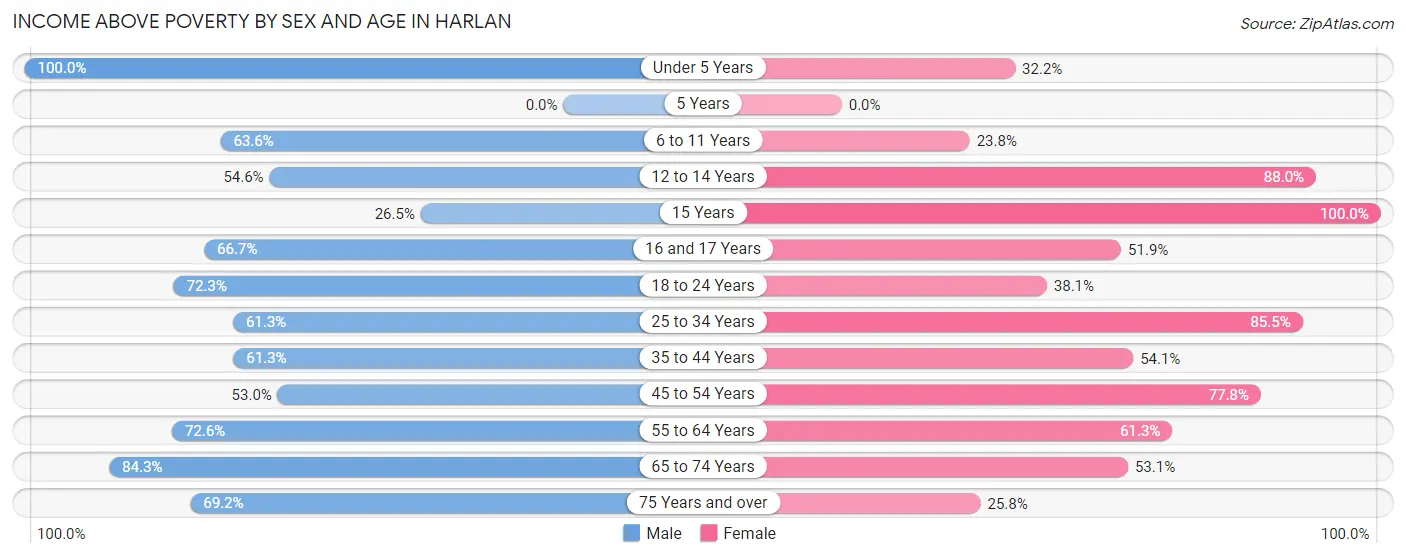
| Age Bracket | Male | Female |
| Under 5 Years | 24 (100.0%) | 28 (32.2%) |
| 5 Years | 0 (0.0%) | 0 (0.0%) |
| 6 to 11 Years | 28 (63.6%) | 19 (23.7%) |
| 12 to 14 Years | 12 (54.5%) | 22 (88.0%) |
| 15 Years | 9 (26.5%) | 4 (100.0%) |
| 16 and 17 Years | 14 (66.7%) | 28 (51.8%) |
| 18 to 24 Years | 34 (72.3%) | 51 (38.1%) |
| 25 to 34 Years | 65 (61.3%) | 112 (85.5%) |
| 35 to 44 Years | 49 (61.3%) | 86 (54.1%) |
| 45 to 54 Years | 35 (53.0%) | 112 (77.8%) |
| 55 to 64 Years | 77 (72.6%) | 111 (61.3%) |
| 65 to 74 Years | 102 (84.3%) | 51 (53.1%) |
| 75 Years and over | 27 (69.2%) | 17 (25.8%) |
| Total | 476 (63.7%) | 641 (55.2%) |
Income Below Poverty Among Married-Couple Families in Harlan
The poverty statistics for married-couple families in Harlan show that 14.1% or 36 of the total 256 families live below the poverty line. Families with 1 or 2 children have the highest poverty rate of 33.9%, comprising of 20 families. On the other hand, families with no children have the lowest poverty rate of 7.6%, which includes 14 families.
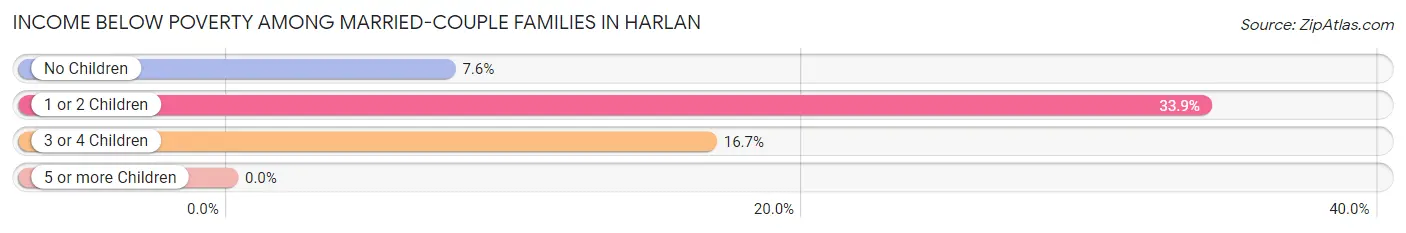
| Children | Above Poverty | Below Poverty |
| No Children | 171 (92.4%) | 14 (7.6%) |
| 1 or 2 Children | 39 (66.1%) | 20 (33.9%) |
| 3 or 4 Children | 10 (83.3%) | 2 (16.7%) |
| 5 or more Children | 0 (0.0%) | 0 (0.0%) |
| Total | 220 (85.9%) | 36 (14.1%) |
Income Below Poverty Among Single-Parent Households in Harlan
According to the poverty data in Harlan, 14.3% or 3 single-father households and 72.3% or 167 single-mother households are living below the poverty line. Among single-father households, those with 1 or 2 children have the highest poverty rate, with 3 households (18.8%) experiencing poverty. Likewise, among single-mother households, those with no children have the highest poverty rate, with 30 households (83.3%) falling below the poverty line.
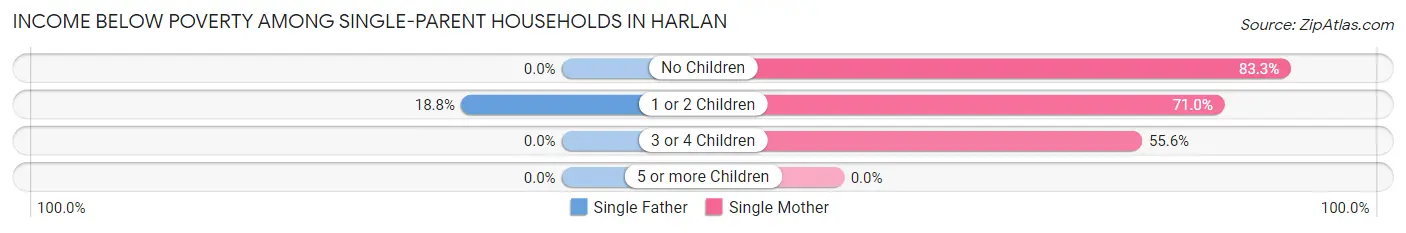
| Children | Single Father | Single Mother |
| No Children | 0 (0.0%) | 30 (83.3%) |
| 1 or 2 Children | 3 (18.8%) | 132 (71.0%) |
| 3 or 4 Children | 0 (0.0%) | 5 (55.6%) |
| 5 or more Children | 0 (0.0%) | 0 (0.0%) |
| Total | 3 (14.3%) | 167 (72.3%) |
Income Below Poverty Among Married-Couple vs Single-Parent Households in Harlan
The poverty data for Harlan shows that 36 of the married-couple family households (14.1%) and 170 of the single-parent households (67.5%) are living below the poverty level. Within the married-couple family households, those with 1 or 2 children have the highest poverty rate, with 20 households (33.9%) falling below the poverty line. Among the single-parent households, those with no children have the highest poverty rate, with 30 household (73.2%) living below poverty.
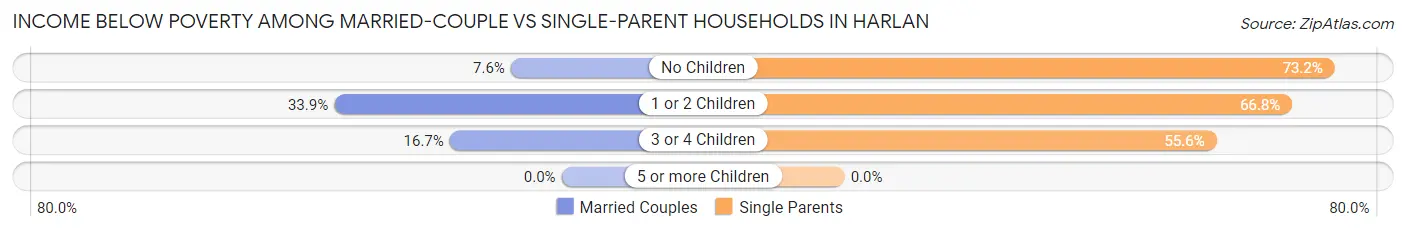
| Children | Married-Couple Families | Single-Parent Households |
| No Children | 14 (7.6%) | 30 (73.2%) |
| 1 or 2 Children | 20 (33.9%) | 135 (66.8%) |
| 3 or 4 Children | 2 (16.7%) | 5 (55.6%) |
| 5 or more Children | 0 (0.0%) | 0 (0.0%) |
| Total | 36 (14.1%) | 170 (67.5%) |
Race in Harlan
The most populous races in Harlan are White / Caucasian (1,729 | 90.6%), Black / African American (127 | 6.7%), and Asian (30 | 1.6%).
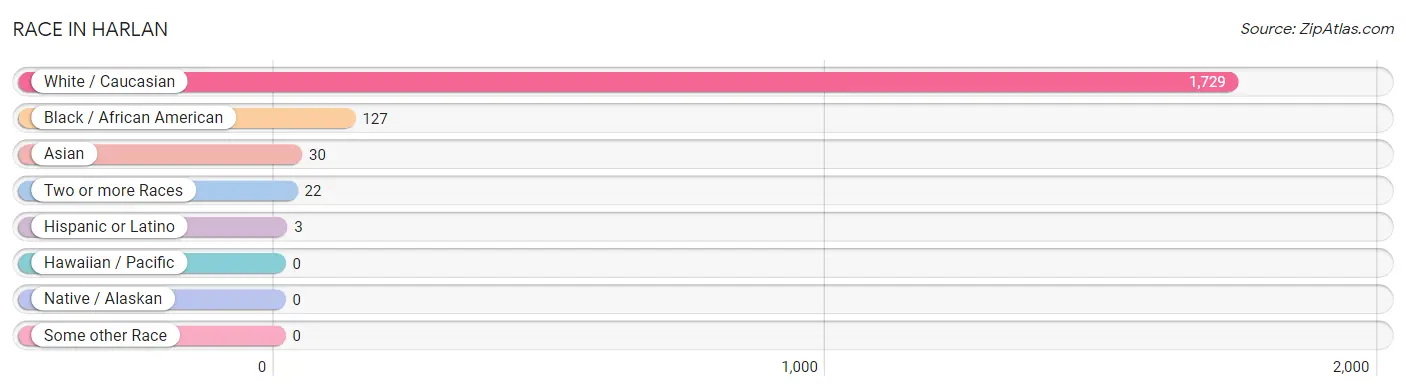
| Race | # Population | % Population |
| Asian | 30 | 1.6% |
| Black / African American | 127 | 6.7% |
| Hawaiian / Pacific | 0 | 0.0% |
| Hispanic or Latino | 3 | 0.2% |
| Native / Alaskan | 0 | 0.0% |
| White / Caucasian | 1,729 | 90.6% |
| Two or more Races | 22 | 1.1% |
| Some other Race | 0 | 0.0% |
| Total | 1,908 | 100.0% |
Ancestry in Harlan
The most populous ancestries reported in Harlan are American (313 | 16.4%), English (291 | 15.2%), German (242 | 12.7%), Irish (175 | 9.2%), and Italian (63 | 3.3%), together accounting for 56.8% of all Harlan residents.
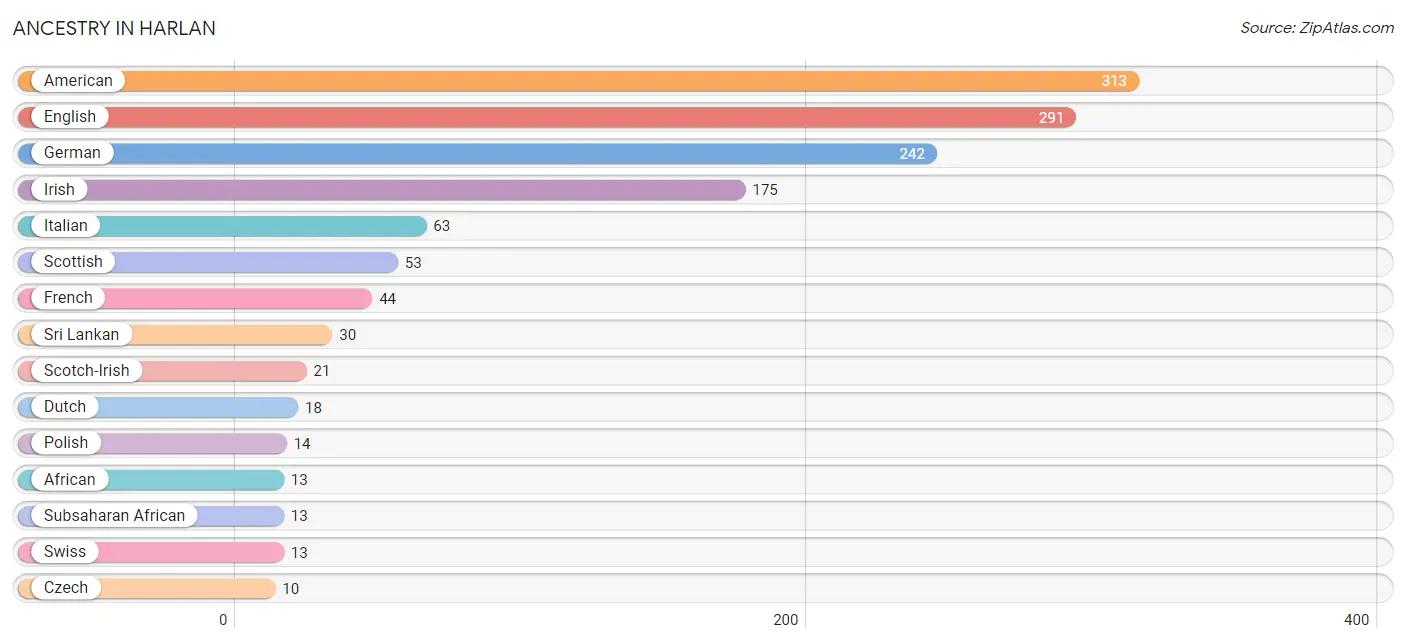
| Ancestry | # Population | % Population |
| African | 13 | 0.7% |
| American | 313 | 16.4% |
| Cherokee | 4 | 0.2% |
| Czech | 10 | 0.5% |
| Dutch | 18 | 0.9% |
| English | 291 | 15.2% |
| European | 9 | 0.5% |
| French | 44 | 2.3% |
| German | 242 | 12.7% |
| Irish | 175 | 9.2% |
| Italian | 63 | 3.3% |
| Mexican | 3 | 0.2% |
| Polish | 14 | 0.7% |
| Portuguese | 3 | 0.2% |
| Scotch-Irish | 21 | 1.1% |
| Scottish | 53 | 2.8% |
| Sri Lankan | 30 | 1.6% |
| Subsaharan African | 13 | 0.7% |
| Swiss | 13 | 0.7% |
| Welsh | 10 | 0.5% | View All 20 Rows |
Immigrants in Harlan
The most numerous immigrant groups reported in Harlan came from , and Canada (3 | 0.2%), together accounting for 0.2% of all Harlan residents.

| Immigration Origin | # Population | % Population |
| Canada | 3 | 0.2% | View All 1 Rows |
Sex and Age in Harlan
Sex and Age in Harlan
The most populous age groups in Harlan are 70 to 74 Years (78 | 10.4%) for men and 60 to 64 Years (118 | 10.2%) for women.
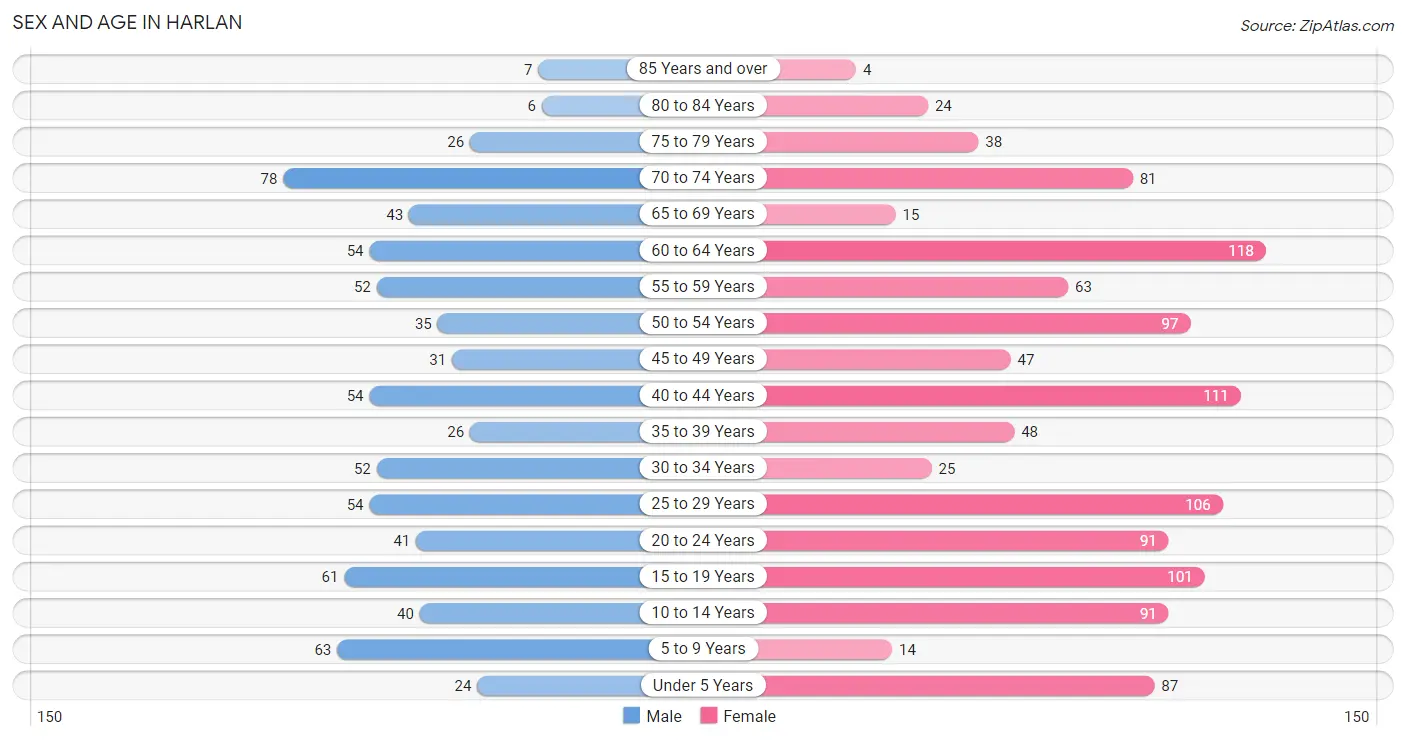
| Age Bracket | Male | Female |
| Under 5 Years | 24 (3.2%) | 87 (7.5%) |
| 5 to 9 Years | 63 (8.4%) | 14 (1.2%) |
| 10 to 14 Years | 40 (5.3%) | 91 (7.8%) |
| 15 to 19 Years | 61 (8.2%) | 101 (8.7%) |
| 20 to 24 Years | 41 (5.5%) | 91 (7.8%) |
| 25 to 29 Years | 54 (7.2%) | 106 (9.1%) |
| 30 to 34 Years | 52 (7.0%) | 25 (2.1%) |
| 35 to 39 Years | 26 (3.5%) | 48 (4.1%) |
| 40 to 44 Years | 54 (7.2%) | 111 (9.6%) |
| 45 to 49 Years | 31 (4.2%) | 47 (4.1%) |
| 50 to 54 Years | 35 (4.7%) | 97 (8.4%) |
| 55 to 59 Years | 52 (7.0%) | 63 (5.4%) |
| 60 to 64 Years | 54 (7.2%) | 118 (10.2%) |
| 65 to 69 Years | 43 (5.8%) | 15 (1.3%) |
| 70 to 74 Years | 78 (10.4%) | 81 (7.0%) |
| 75 to 79 Years | 26 (3.5%) | 38 (3.3%) |
| 80 to 84 Years | 6 (0.8%) | 24 (2.1%) |
| 85 Years and over | 7 (0.9%) | 4 (0.3%) |
| Total | 747 (100.0%) | 1,161 (100.0%) |
Families and Households in Harlan
Median Family Size in Harlan
The median family size in Harlan is 2.82 persons per family, with married-couple families (256 | 50.4%) accounting for the largest median family size of 2.84 persons per family. On the other hand, single male/father families (21 | 4.1%) represent the smallest median family size with 2.81 persons per family.
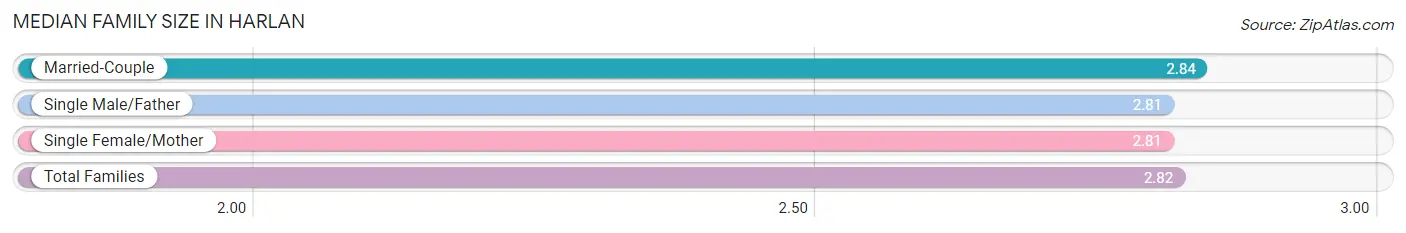
| Family Type | # Families | Family Size |
| Married-Couple | 256 (50.4%) | 2.84 |
| Single Male/Father | 21 (4.1%) | 2.81 |
| Single Female/Mother | 231 (45.5%) | 2.81 |
| Total Families | 508 (100.0%) | 2.82 |
Median Household Size in Harlan
The median household size in Harlan is 2.17 persons per household, with single male/father households (21 | 2.4%) accounting for the largest median household size of 3.29 persons per household. non-family households (370 | 42.1%) represent the smallest median household size with 1.20 persons per household.
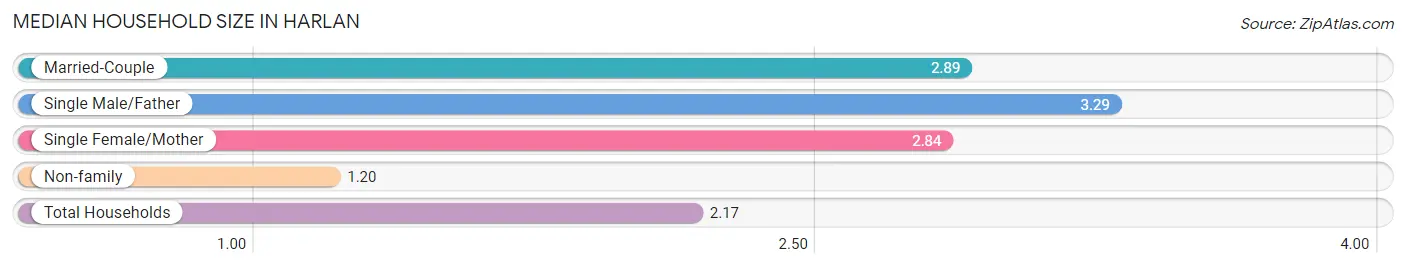
| Household Type | # Households | Household Size |
| Married-Couple | 256 (29.2%) | 2.89 |
| Single Male/Father | 21 (2.4%) | 3.29 |
| Single Female/Mother | 231 (26.3%) | 2.84 |
| Non-family | 370 (42.1%) | 1.20 |
| Total Households | 878 (100.0%) | 2.17 |
Household Size by Marriage Status in Harlan
Out of a total of 878 households in Harlan, 508 (57.9%) are family households, while 370 (42.1%) are nonfamily households. The most numerous type of family households are 2-person households, comprising 309, and the most common type of nonfamily households are 1-person households, comprising 345.
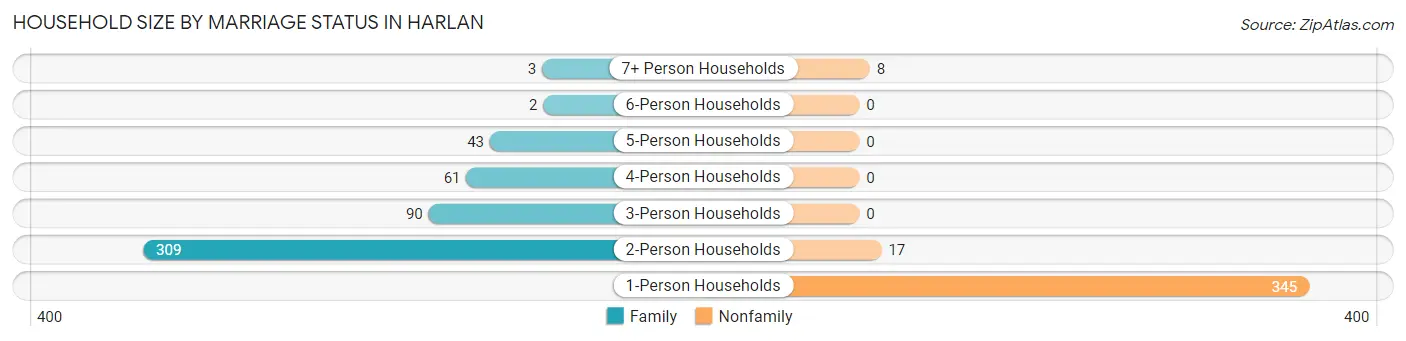
| Household Size | Family Households | Nonfamily Households |
| 1-Person Households | - | 345 (39.3%) |
| 2-Person Households | 309 (35.2%) | 17 (1.9%) |
| 3-Person Households | 90 (10.2%) | 0 (0.0%) |
| 4-Person Households | 61 (7.0%) | 0 (0.0%) |
| 5-Person Households | 43 (4.9%) | 0 (0.0%) |
| 6-Person Households | 2 (0.2%) | 0 (0.0%) |
| 7+ Person Households | 3 (0.3%) | 8 (0.9%) |
| Total | 508 (57.9%) | 370 (42.1%) |
Female Fertility in Harlan
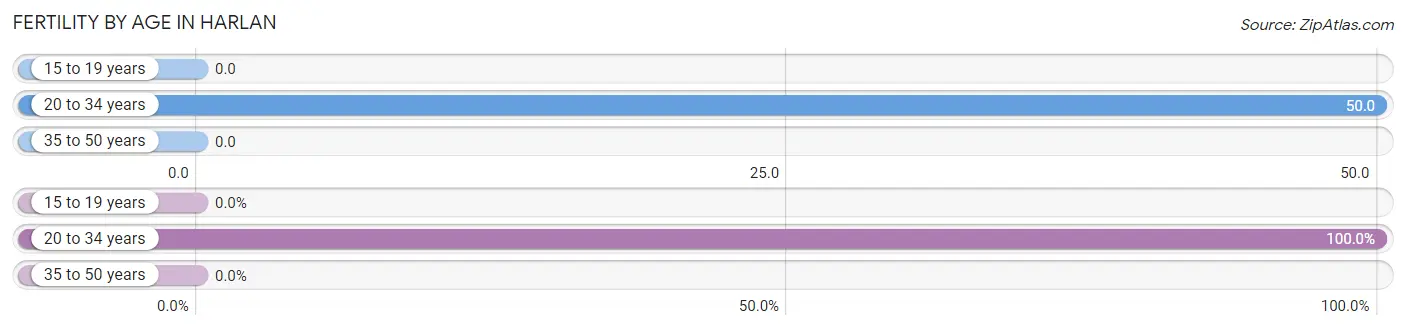
Fertility by Age in Harlan
Average fertility rate in Harlan is 20.0 births per 1,000 women. Women in the age bracket of 20 to 34 years have the highest fertility rate with 50.0 births per 1,000 women. Women in the age bracket of 20 to 34 years acount for 100.0% of all women with births.
| Age Bracket | Women with Births | Births / 1,000 Women |
| 15 to 19 years | 0 (0.0%) | 0.0 |
| 20 to 34 years | 11 (100.0%) | 50.0 |
| 35 to 50 years | 0 (0.0%) | 0.0 |
| Total | 11 (100.0%) | 20.0 |
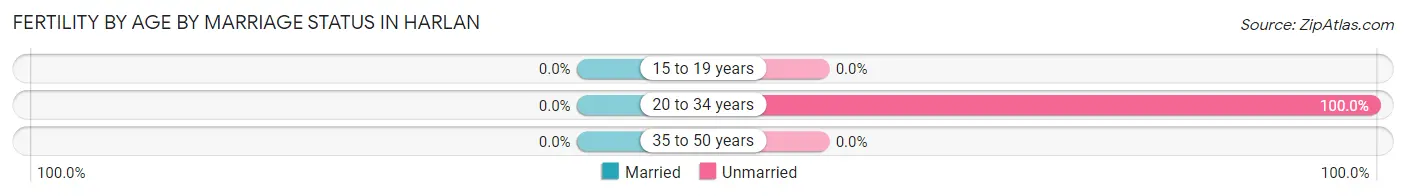
Fertility by Age by Marriage Status in Harlan
| Age Bracket | Married | Unmarried |
| 15 to 19 years | 0 (0.0%) | 0 (0.0%) |
| 20 to 34 years | 0 (0.0%) | 11 (100.0%) |
| 35 to 50 years | 0 (0.0%) | 0 (0.0%) |
| Total | 0 (0.0%) | 11 (100.0%) |
Fertility by Education in Harlan
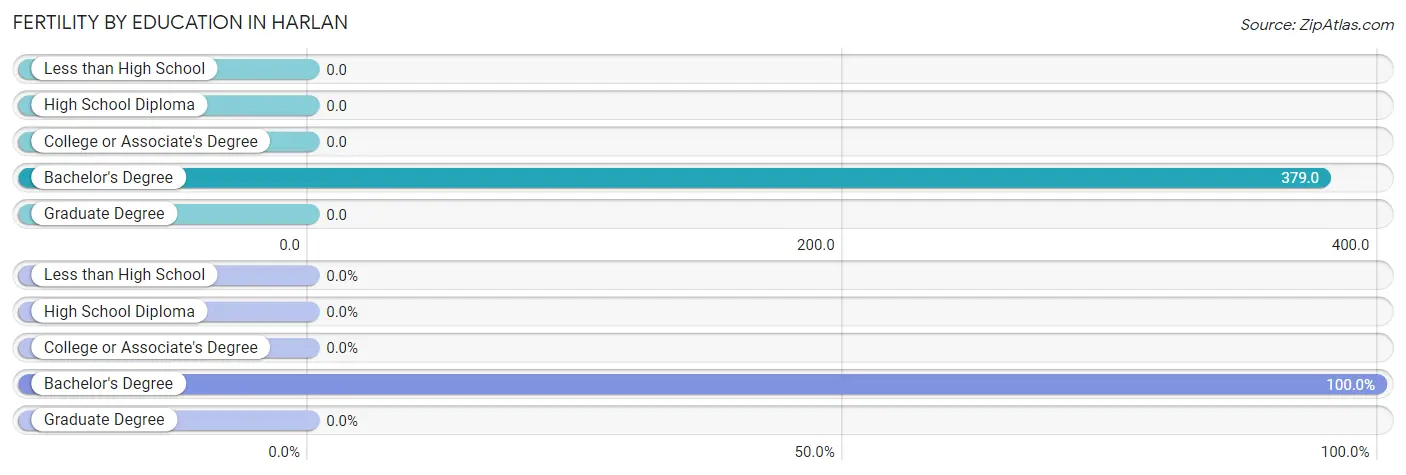
| Educational Attainment | Women with Births | Births / 1,000 Women |
| Less than High School | 0 (0.0%) | 0.0 |
| High School Diploma | 0 (0.0%) | 0.0 |
| College or Associate's Degree | 0 (0.0%) | 0.0 |
| Bachelor's Degree | 11 (100.0%) | 379.0 |
| Graduate Degree | 0 (0.0%) | 0.0 |
| Total | 11 (100.0%) | 20.0 |
Fertility by Education by Marriage Status in Harlan
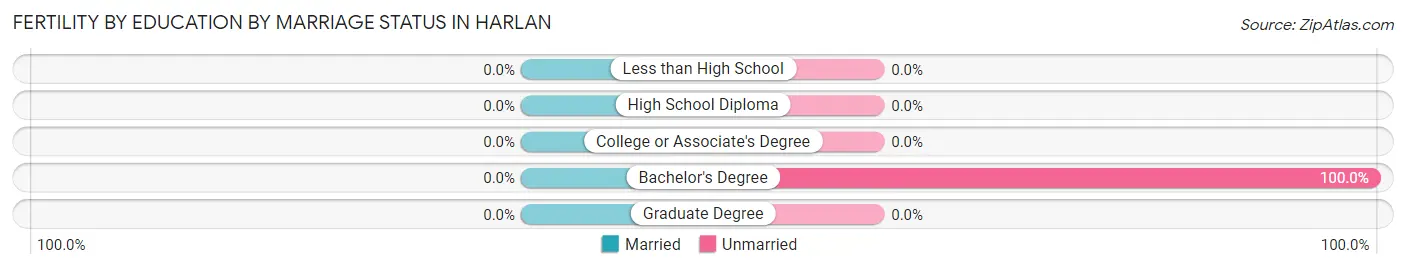
| Educational Attainment | Married | Unmarried |
| Less than High School | 0 (0.0%) | 0 (0.0%) |
| High School Diploma | 0 (0.0%) | 0 (0.0%) |
| College or Associate's Degree | 0 (0.0%) | 0 (0.0%) |
| Bachelor's Degree | 0 (0.0%) | 11 (100.0%) |
| Graduate Degree | 0 (0.0%) | 0 (0.0%) |
| Total | 0 (0.0%) | 11 (100.0%) |
Employment Characteristics in Harlan
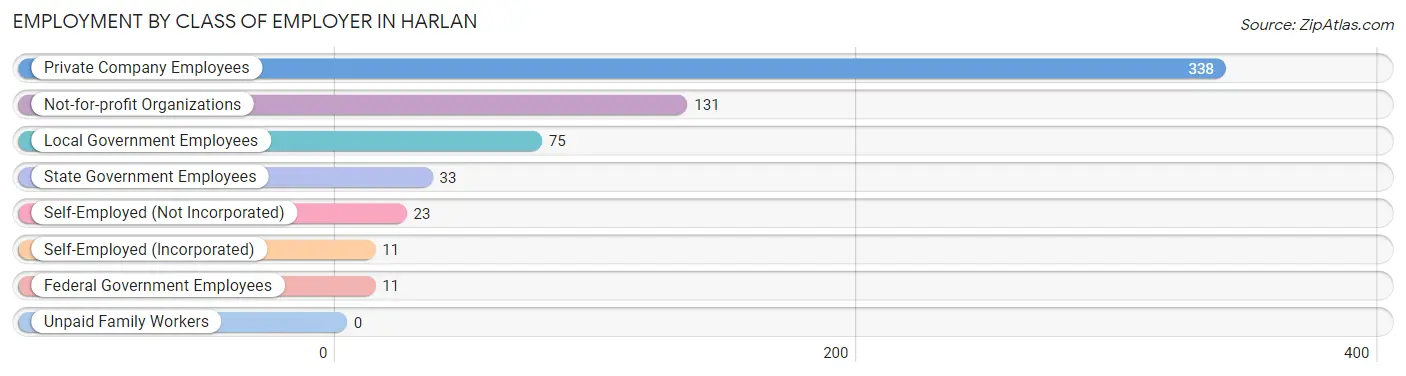
Employment by Class of Employer in Harlan
Among the 622 employed individuals in Harlan, private company employees (338 | 54.3%), not-for-profit organizations (131 | 21.1%), and local government employees (75 | 12.1%) make up the most common classes of employment.
| Employer Class | # Employees | % Employees |
| Private Company Employees | 338 | 54.3% |
| Self-Employed (Incorporated) | 11 | 1.8% |
| Self-Employed (Not Incorporated) | 23 | 3.7% |
| Not-for-profit Organizations | 131 | 21.1% |
| Local Government Employees | 75 | 12.1% |
| State Government Employees | 33 | 5.3% |
| Federal Government Employees | 11 | 1.8% |
| Unpaid Family Workers | 0 | 0.0% |
| Total | 622 | 100.0% |
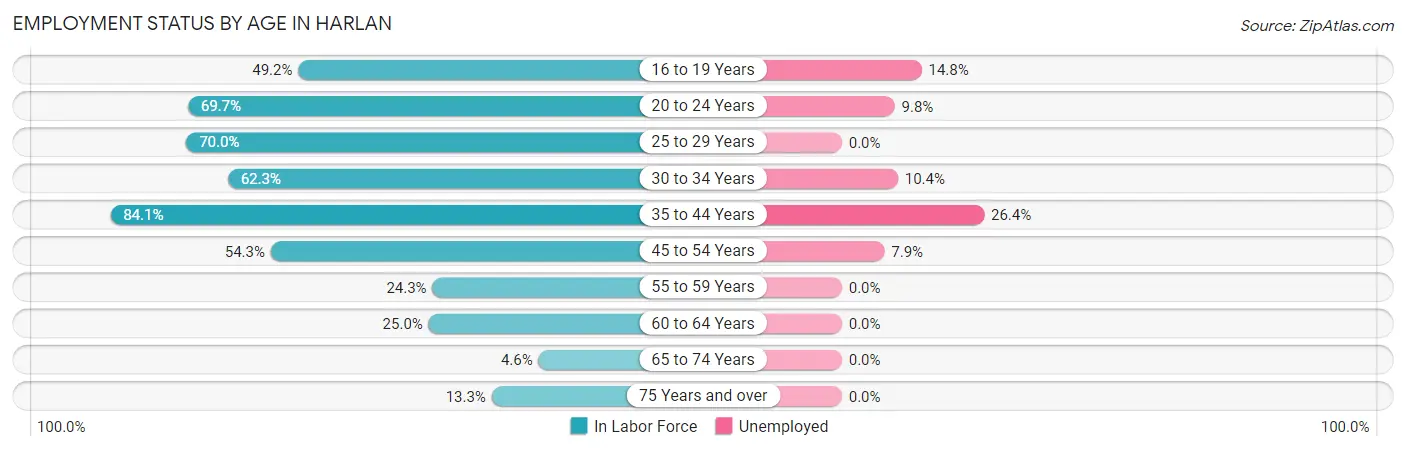
Employment Status by Age in Harlan
According to the labor force statistics for Harlan, out of the total population over 16 years of age (1,551), 46.6% or 723 individuals are in the labor force, with 11.8% or 85 of them unemployed. The age group with the highest labor force participation rate is 35 to 44 years, with 84.1% or 201 individuals in the labor force. Within the labor force, the 35 to 44 years age range has the highest percentage of unemployed individuals, with 26.4% or 53 of them being unemployed.
| Age Bracket | In Labor Force | Unemployed |
| 16 to 19 Years | 61 (49.2%) | 9 (14.8%) |
| 20 to 24 Years | 92 (69.7%) | 9 (9.8%) |
| 25 to 29 Years | 112 (70.0%) | 0 (0.0%) |
| 30 to 34 Years | 48 (62.3%) | 5 (10.4%) |
| 35 to 44 Years | 201 (84.1%) | 53 (26.4%) |
| 45 to 54 Years | 114 (54.3%) | 9 (7.9%) |
| 55 to 59 Years | 28 (24.3%) | 0 (0.0%) |
| 60 to 64 Years | 43 (25.0%) | 0 (0.0%) |
| 65 to 74 Years | 10 (4.6%) | 0 (0.0%) |
| 75 Years and over | 14 (13.3%) | 0 (0.0%) |
| Total | 723 (46.6%) | 85 (11.8%) |
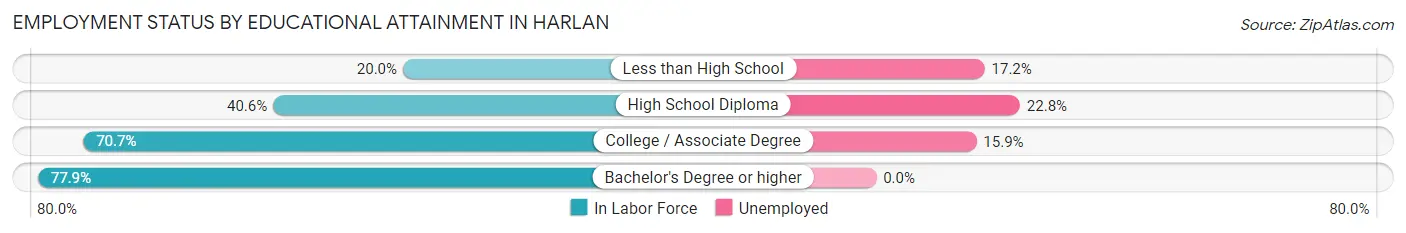
Employment Status by Educational Attainment in Harlan
According to labor force statistics for Harlan, 56.1% of individuals (546) out of the total population between 25 and 64 years of age (973) are in the labor force, with 12.3% or 67 of them being unemployed. The group with the highest labor force participation rate are those with the educational attainment of bachelor's degree or higher, with 77.9% or 176 individuals in the labor force. Within the labor force, individuals with high school diploma education have the highest percentage of unemployment, with 22.8% or 26 of them being unemployed.
| Educational Attainment | In Labor Force | Unemployed |
| Less than High School | 29 (20.0%) | 25 (17.2%) |
| High School Diploma | 114 (40.6%) | 64 (22.8%) |
| College / Associate Degree | 227 (70.7%) | 51 (15.9%) |
| Bachelor's Degree or higher | 176 (77.9%) | 0 (0.0%) |
| Total | 546 (56.1%) | 120 (12.3%) |
Employment Occupations by Sex in Harlan
Management, Business, Science and Arts Occupations
The most common Management, Business, Science and Arts occupations in Harlan are Community & Social Service (119 | 18.6%), Health Diagnosing & Treating (86 | 13.5%), Education Instruction & Library (77 | 12.1%), Health Technologists (60 | 9.4%), and Management (45 | 7.0%).
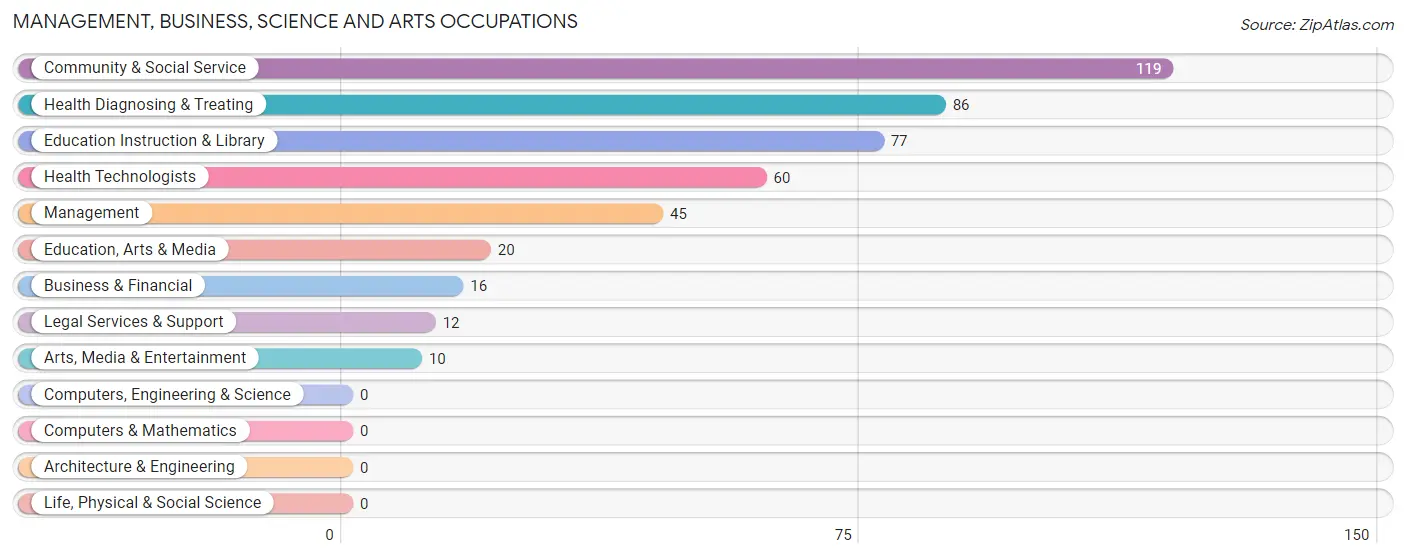
Management, Business, Science and Arts Occupations by Sex
Within the Management, Business, Science and Arts occupations in Harlan, the most male-oriented occupations are Education, Arts & Media (100.0%), Legal Services & Support (58.3%), and Business & Financial (50.0%), while the most female-oriented occupations are Health Diagnosing & Treating (95.4%), Health Technologists (93.3%), and Education Instruction & Library (81.8%).
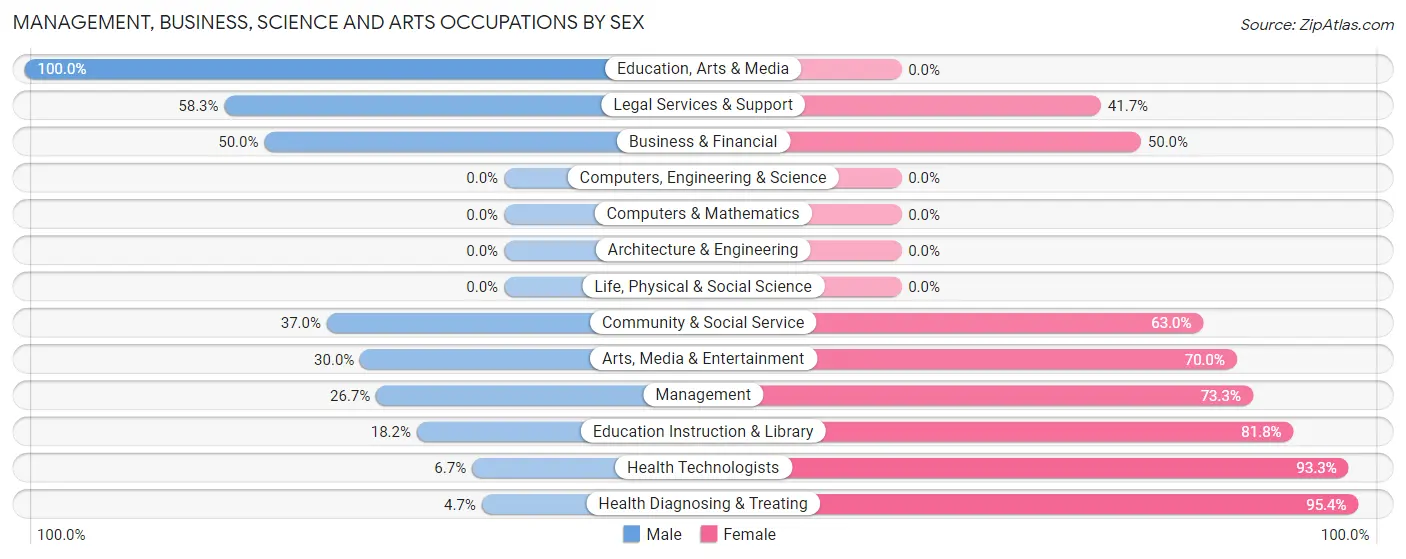
| Occupation | Male | Female |
| Management | 12 (26.7%) | 33 (73.3%) |
| Business & Financial | 8 (50.0%) | 8 (50.0%) |
| Computers, Engineering & Science | 0 (0.0%) | 0 (0.0%) |
| Computers & Mathematics | 0 (0.0%) | 0 (0.0%) |
| Architecture & Engineering | 0 (0.0%) | 0 (0.0%) |
| Life, Physical & Social Science | 0 (0.0%) | 0 (0.0%) |
| Community & Social Service | 44 (37.0%) | 75 (63.0%) |
| Education, Arts & Media | 20 (100.0%) | 0 (0.0%) |
| Legal Services & Support | 7 (58.3%) | 5 (41.7%) |
| Education Instruction & Library | 14 (18.2%) | 63 (81.8%) |
| Arts, Media & Entertainment | 3 (30.0%) | 7 (70.0%) |
| Health Diagnosing & Treating | 4 (4.6%) | 82 (95.4%) |
| Health Technologists | 4 (6.7%) | 56 (93.3%) |
| Total (Category) | 68 (25.6%) | 198 (74.4%) |
| Total (Overall) | 224 (35.1%) | 414 (64.9%) |
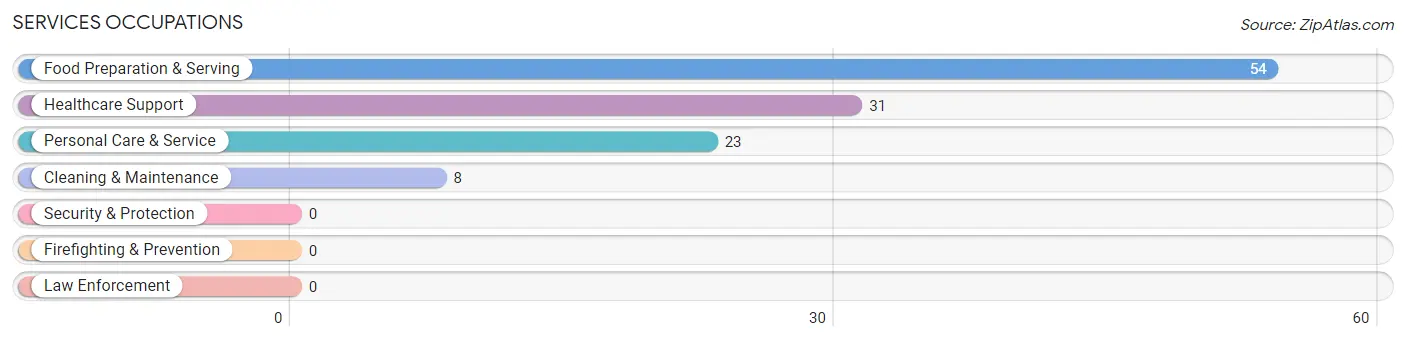
Services Occupations
The most common Services occupations in Harlan are Food Preparation & Serving (54 | 8.5%), Healthcare Support (31 | 4.9%), Personal Care & Service (23 | 3.6%), and Cleaning & Maintenance (8 | 1.3%).
Services Occupations by Sex
Within the Services occupations in Harlan, the most male-oriented occupations are Healthcare Support (58.1%), and Personal Care & Service (52.2%), while the most female-oriented occupations are Food Preparation & Serving (100.0%), Cleaning & Maintenance (100.0%), and Personal Care & Service (47.8%).
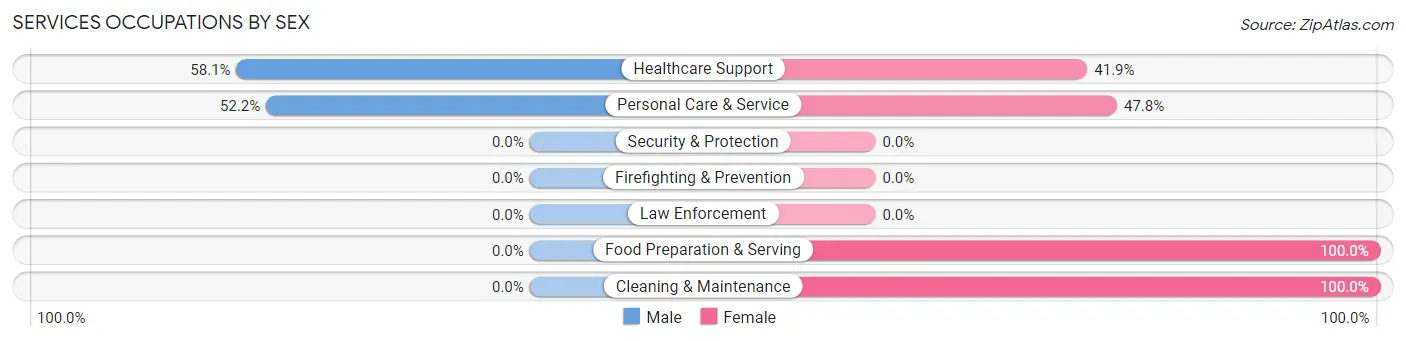
| Occupation | Male | Female |
| Healthcare Support | 18 (58.1%) | 13 (41.9%) |
| Security & Protection | 0 (0.0%) | 0 (0.0%) |
| Firefighting & Prevention | 0 (0.0%) | 0 (0.0%) |
| Law Enforcement | 0 (0.0%) | 0 (0.0%) |
| Food Preparation & Serving | 0 (0.0%) | 54 (100.0%) |
| Cleaning & Maintenance | 0 (0.0%) | 8 (100.0%) |
| Personal Care & Service | 12 (52.2%) | 11 (47.8%) |
| Total (Category) | 30 (25.9%) | 86 (74.1%) |
| Total (Overall) | 224 (35.1%) | 414 (64.9%) |
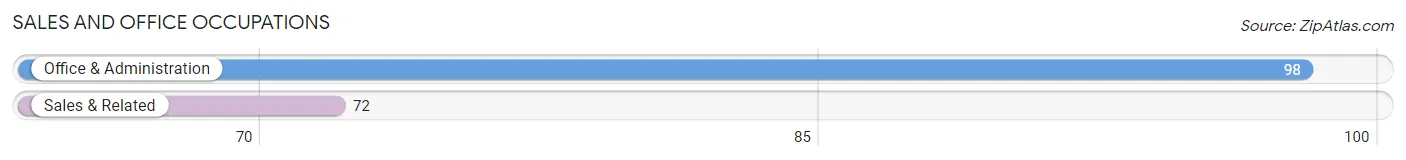
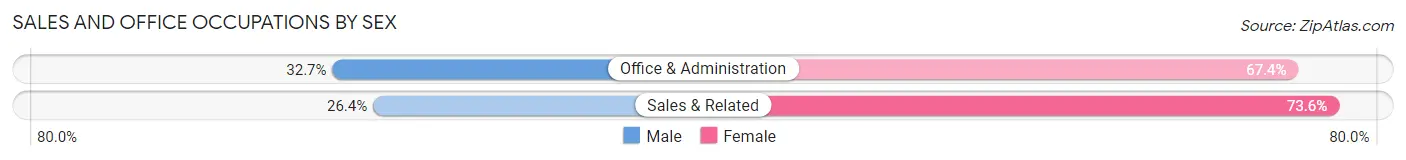
Sales and Office Occupations
The most common Sales and Office occupations in Harlan are Office & Administration (98 | 15.4%), and Sales & Related (72 | 11.3%).
Sales and Office Occupations by Sex
| Occupation | Male | Female |
| Sales & Related | 19 (26.4%) | 53 (73.6%) |
| Office & Administration | 32 (32.7%) | 66 (67.3%) |
| Total (Category) | 51 (30.0%) | 119 (70.0%) |
| Total (Overall) | 224 (35.1%) | 414 (64.9%) |
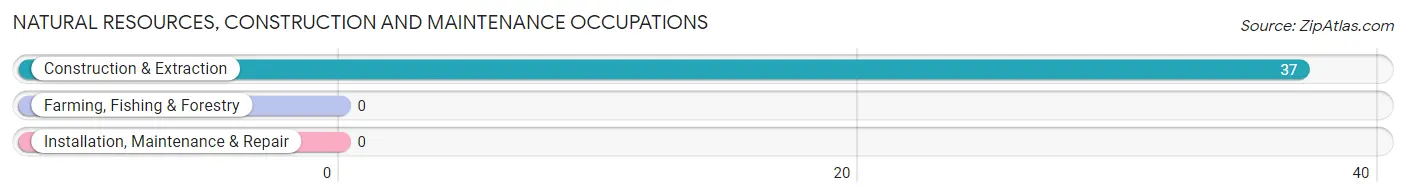
Natural Resources, Construction and Maintenance Occupations
The most common Natural Resources, Construction and Maintenance occupations in Harlan are , and Construction & Extraction (37 | 5.8%).
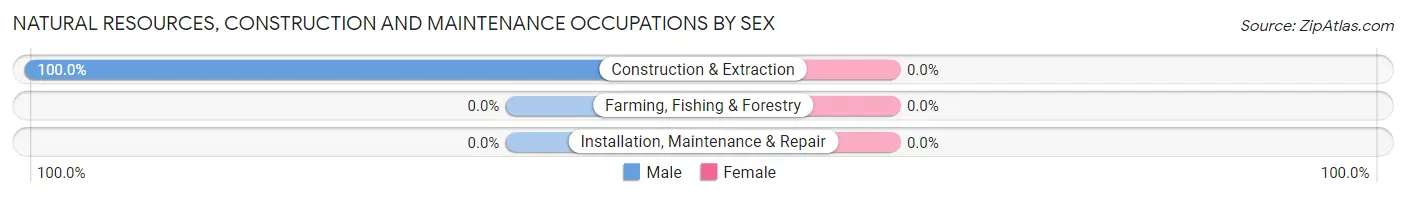
Natural Resources, Construction and Maintenance Occupations by Sex
| Occupation | Male | Female |
| Farming, Fishing & Forestry | 0 (0.0%) | 0 (0.0%) |
| Construction & Extraction | 37 (100.0%) | 0 (0.0%) |
| Installation, Maintenance & Repair | 0 (0.0%) | 0 (0.0%) |
| Total (Category) | 37 (100.0%) | 0 (0.0%) |
| Total (Overall) | 224 (35.1%) | 414 (64.9%) |
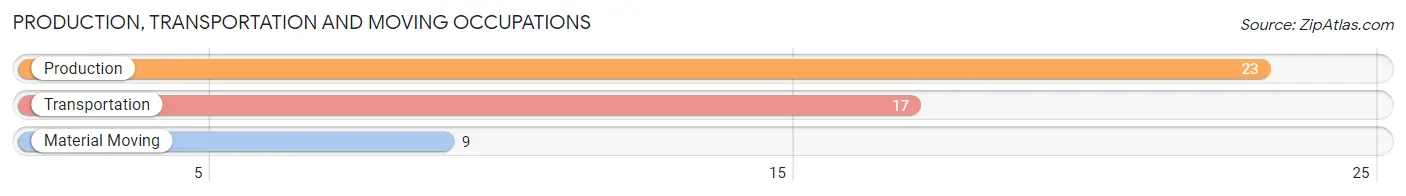
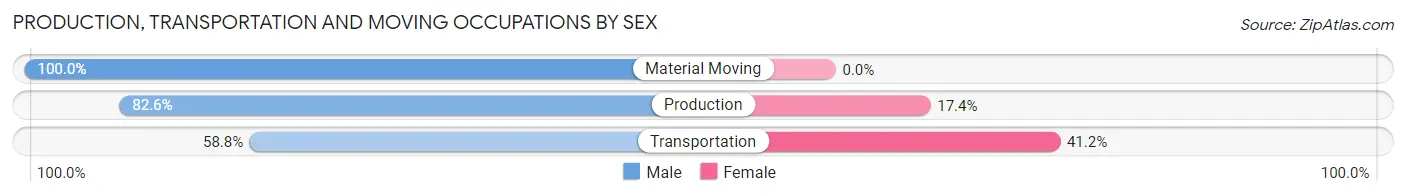
Production, Transportation and Moving Occupations
The most common Production, Transportation and Moving occupations in Harlan are Production (23 | 3.6%), Transportation (17 | 2.7%), and Material Moving (9 | 1.4%).
Production, Transportation and Moving Occupations by Sex
| Occupation | Male | Female |
| Production | 19 (82.6%) | 4 (17.4%) |
| Transportation | 10 (58.8%) | 7 (41.2%) |
| Material Moving | 9 (100.0%) | 0 (0.0%) |
| Total (Category) | 38 (77.5%) | 11 (22.5%) |
| Total (Overall) | 224 (35.1%) | 414 (64.9%) |
Employment Industries by Sex in Harlan
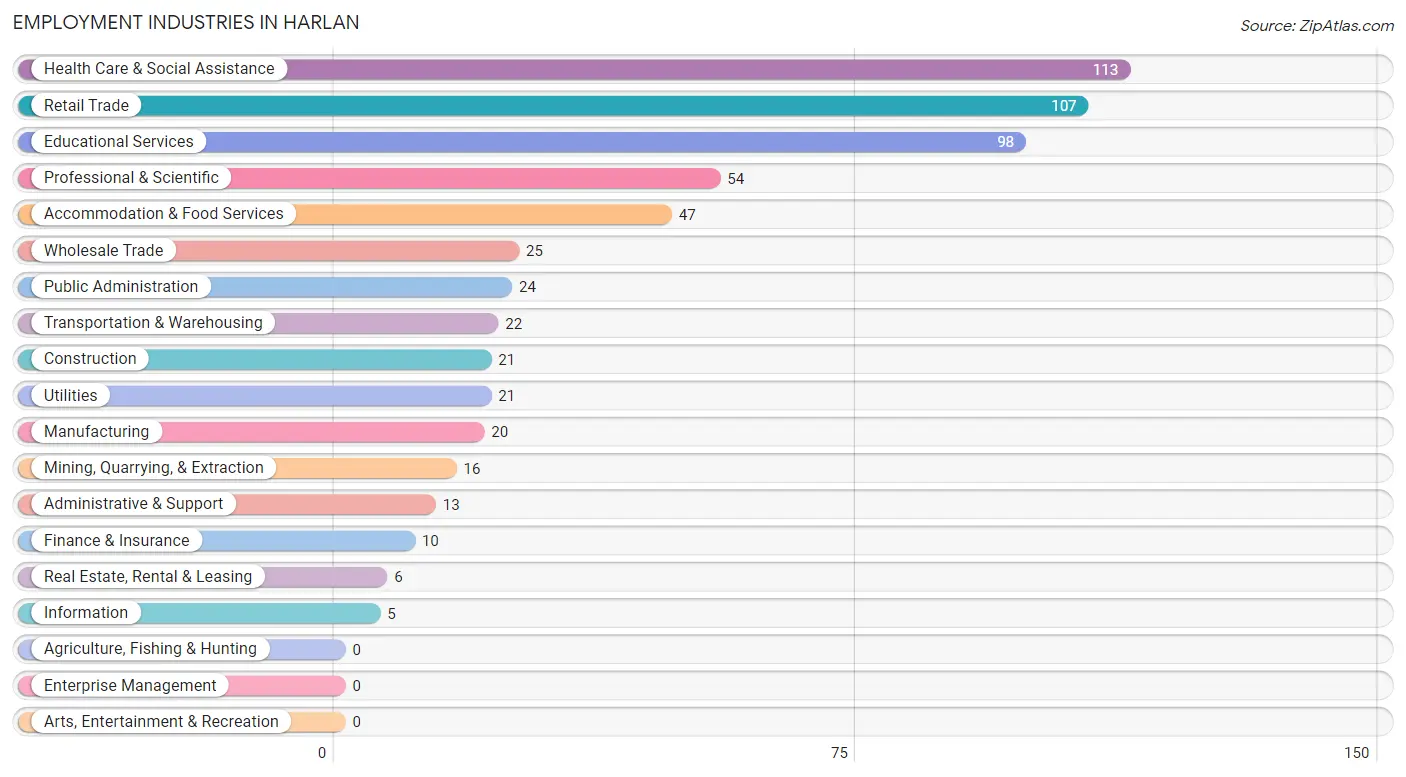
Employment Industries in Harlan
The major employment industries in Harlan include Health Care & Social Assistance (113 | 17.7%), Retail Trade (107 | 16.8%), Educational Services (98 | 15.4%), Professional & Scientific (54 | 8.5%), and Accommodation & Food Services (47 | 7.4%).
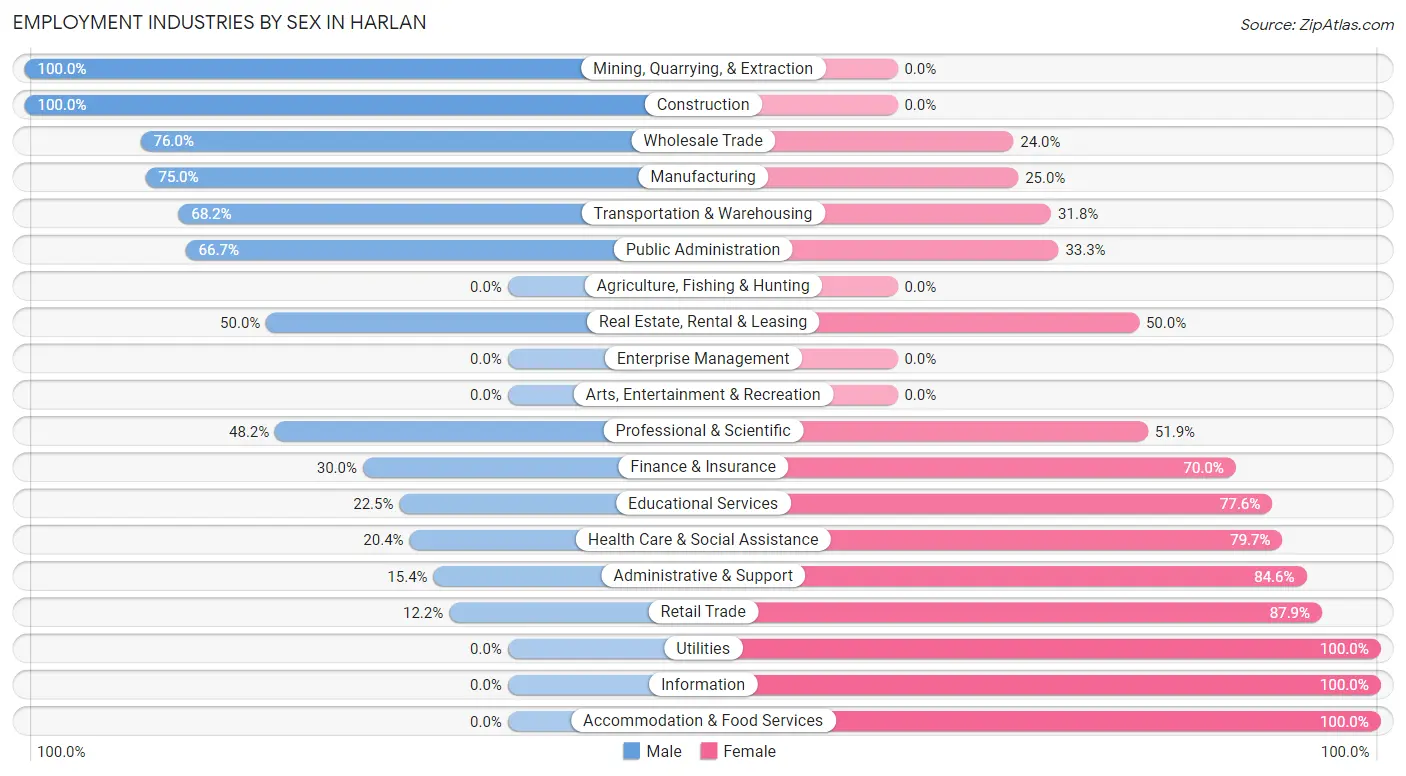
Employment Industries by Sex in Harlan
The Harlan industries that see more men than women are Mining, Quarrying, & Extraction (100.0%), Construction (100.0%), and Wholesale Trade (76.0%), whereas the industries that tend to have a higher number of women are Utilities (100.0%), Information (100.0%), and Accommodation & Food Services (100.0%).
| Industry | Male | Female |
| Agriculture, Fishing & Hunting | 0 (0.0%) | 0 (0.0%) |
| Mining, Quarrying, & Extraction | 16 (100.0%) | 0 (0.0%) |
| Construction | 21 (100.0%) | 0 (0.0%) |
| Manufacturing | 15 (75.0%) | 5 (25.0%) |
| Wholesale Trade | 19 (76.0%) | 6 (24.0%) |
| Retail Trade | 13 (12.1%) | 94 (87.8%) |
| Transportation & Warehousing | 15 (68.2%) | 7 (31.8%) |
| Utilities | 0 (0.0%) | 21 (100.0%) |
| Information | 0 (0.0%) | 5 (100.0%) |
| Finance & Insurance | 3 (30.0%) | 7 (70.0%) |
| Real Estate, Rental & Leasing | 3 (50.0%) | 3 (50.0%) |
| Professional & Scientific | 26 (48.1%) | 28 (51.8%) |
| Enterprise Management | 0 (0.0%) | 0 (0.0%) |
| Administrative & Support | 2 (15.4%) | 11 (84.6%) |
| Educational Services | 22 (22.5%) | 76 (77.5%) |
| Health Care & Social Assistance | 23 (20.3%) | 90 (79.6%) |
| Arts, Entertainment & Recreation | 0 (0.0%) | 0 (0.0%) |
| Accommodation & Food Services | 0 (0.0%) | 47 (100.0%) |
| Public Administration | 16 (66.7%) | 8 (33.3%) |
| Total | 224 (35.1%) | 414 (64.9%) |
Education in Harlan
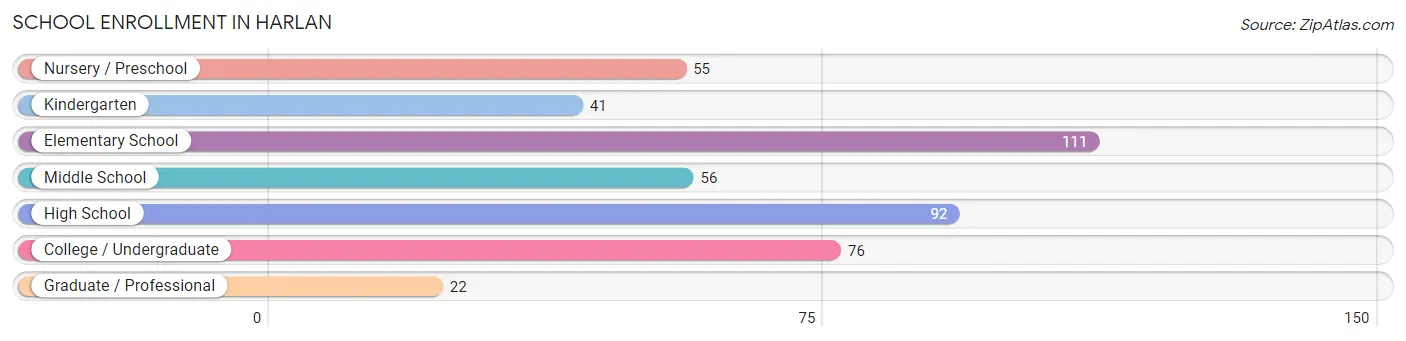
School Enrollment in Harlan
The most common levels of schooling among the 453 students in Harlan are elementary school (111 | 24.5%), high school (92 | 20.3%), and college / undergraduate (76 | 16.8%).
| School Level | # Students | % Students |
| Nursery / Preschool | 55 | 12.1% |
| Kindergarten | 41 | 9.0% |
| Elementary School | 111 | 24.5% |
| Middle School | 56 | 12.4% |
| High School | 92 | 20.3% |
| College / Undergraduate | 76 | 16.8% |
| Graduate / Professional | 22 | 4.9% |
| Total | 453 | 100.0% |
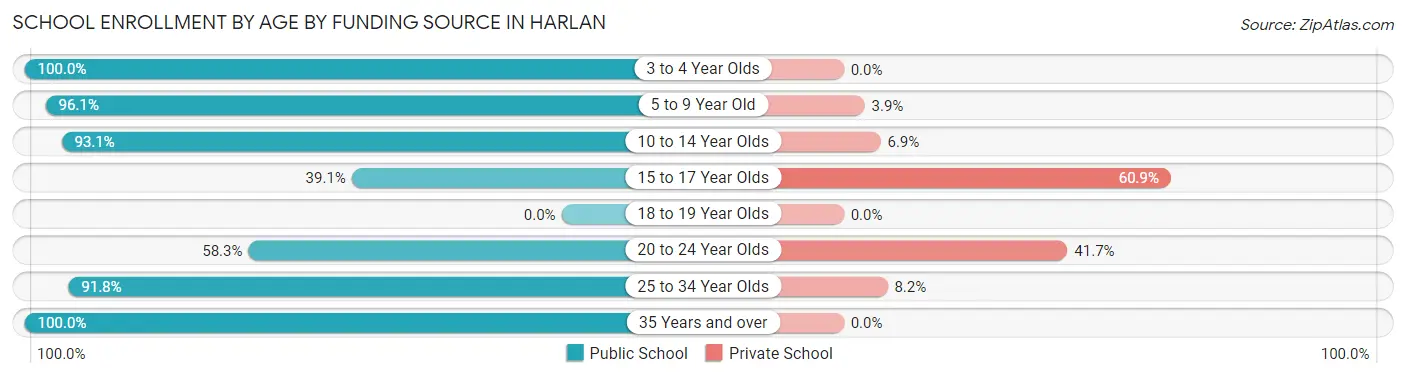
School Enrollment by Age by Funding Source in Harlan
Out of a total of 453 students who are enrolled in schools in Harlan, 84 (18.5%) attend a private institution, while the remaining 369 (81.5%) are enrolled in public schools. The age group of 15 to 17 year olds has the highest likelihood of being enrolled in private schools, with 53 (60.9% in the age bracket) enrolled. Conversely, the age group of 3 to 4 year olds has the lowest likelihood of being enrolled in a private school, with 55 (100.0% in the age bracket) attending a public institution.
| Age Bracket | Public School | Private School |
| 3 to 4 Year Olds | 55 (100.0%) | 0 (0.0%) |
| 5 to 9 Year Old | 74 (96.1%) | 3 (3.9%) |
| 10 to 14 Year Olds | 122 (93.1%) | 9 (6.9%) |
| 15 to 17 Year Olds | 34 (39.1%) | 53 (60.9%) |
| 18 to 19 Year Olds | 0 (0.0%) | 0 (0.0%) |
| 20 to 24 Year Olds | 21 (58.3%) | 15 (41.7%) |
| 25 to 34 Year Olds | 45 (91.8%) | 4 (8.2%) |
| 35 Years and over | 18 (100.0%) | 0 (0.0%) |
| Total | 369 (81.5%) | 84 (18.5%) |
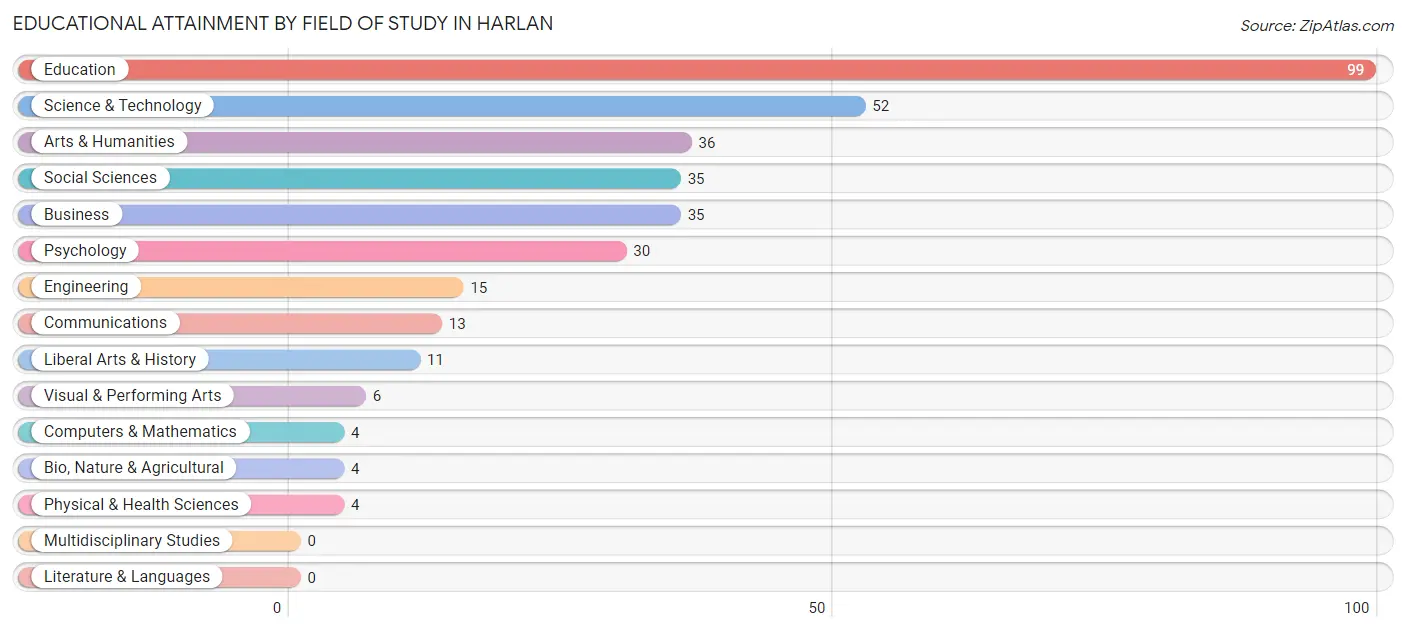
Educational Attainment by Field of Study in Harlan
Education (99 | 28.8%), science & technology (52 | 15.1%), arts & humanities (36 | 10.5%), social sciences (35 | 10.2%), and business (35 | 10.2%) are the most common fields of study among 344 individuals in Harlan who have obtained a bachelor's degree or higher.
| Field of Study | # Graduates | % Graduates |
| Computers & Mathematics | 4 | 1.2% |
| Bio, Nature & Agricultural | 4 | 1.2% |
| Physical & Health Sciences | 4 | 1.2% |
| Psychology | 30 | 8.7% |
| Social Sciences | 35 | 10.2% |
| Engineering | 15 | 4.4% |
| Multidisciplinary Studies | 0 | 0.0% |
| Science & Technology | 52 | 15.1% |
| Business | 35 | 10.2% |
| Education | 99 | 28.8% |
| Literature & Languages | 0 | 0.0% |
| Liberal Arts & History | 11 | 3.2% |
| Visual & Performing Arts | 6 | 1.7% |
| Communications | 13 | 3.8% |
| Arts & Humanities | 36 | 10.5% |
| Total | 344 | 100.0% |
Transportation & Commute in Harlan
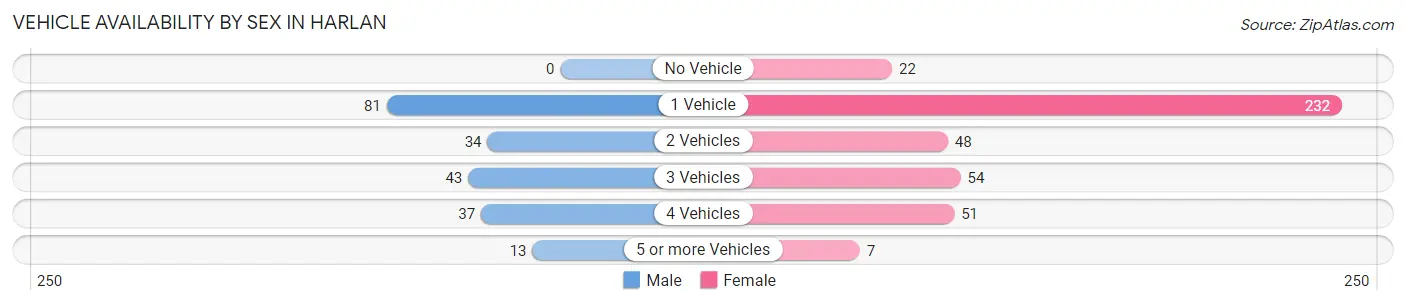
Vehicle Availability by Sex in Harlan
The most prevalent vehicle ownership categories in Harlan are males with 1 vehicle (81, accounting for 38.9%) and females with 1 vehicle (232, making up 19.6%).
| Vehicles Available | Male | Female |
| No Vehicle | 0 (0.0%) | 22 (5.3%) |
| 1 Vehicle | 81 (38.9%) | 232 (56.0%) |
| 2 Vehicles | 34 (16.4%) | 48 (11.6%) |
| 3 Vehicles | 43 (20.7%) | 54 (13.0%) |
| 4 Vehicles | 37 (17.8%) | 51 (12.3%) |
| 5 or more Vehicles | 13 (6.2%) | 7 (1.7%) |
| Total | 208 (100.0%) | 414 (100.0%) |
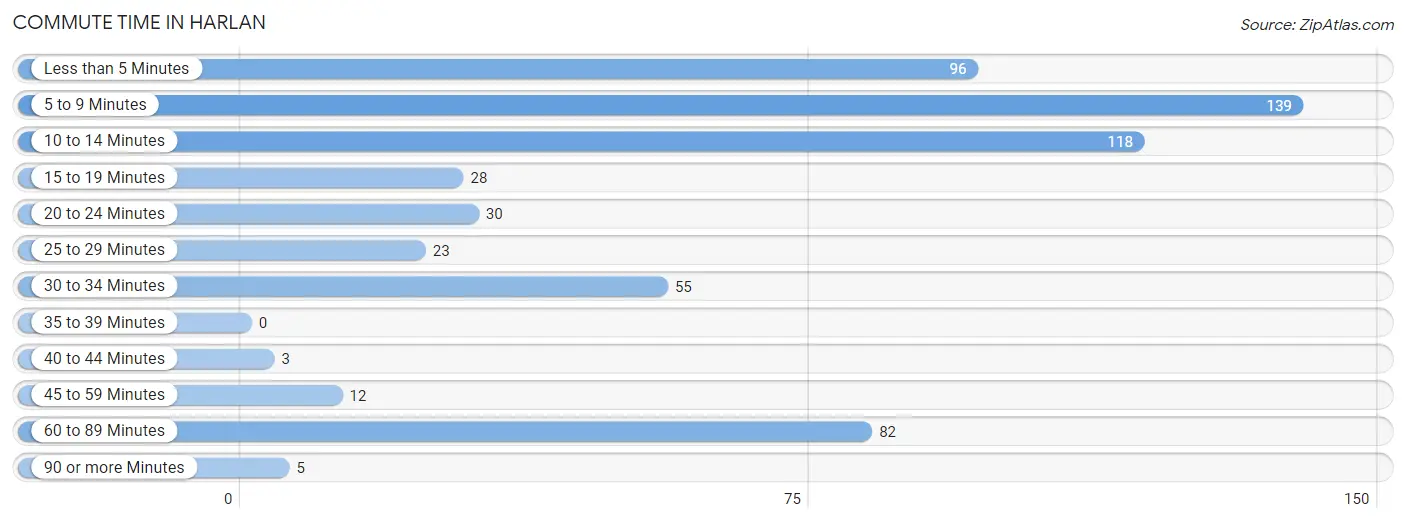
Commute Time in Harlan
The most frequently occuring commute durations in Harlan are 5 to 9 minutes (139 commuters, 23.5%), 10 to 14 minutes (118 commuters, 20.0%), and less than 5 minutes (96 commuters, 16.2%).
| Commute Time | # Commuters | % Commuters |
| Less than 5 Minutes | 96 | 16.2% |
| 5 to 9 Minutes | 139 | 23.5% |
| 10 to 14 Minutes | 118 | 20.0% |
| 15 to 19 Minutes | 28 | 4.7% |
| 20 to 24 Minutes | 30 | 5.1% |
| 25 to 29 Minutes | 23 | 3.9% |
| 30 to 34 Minutes | 55 | 9.3% |
| 35 to 39 Minutes | 0 | 0.0% |
| 40 to 44 Minutes | 3 | 0.5% |
| 45 to 59 Minutes | 12 | 2.0% |
| 60 to 89 Minutes | 82 | 13.9% |
| 90 or more Minutes | 5 | 0.9% |
Commute Time by Sex in Harlan
The most common commute times in Harlan are 5 to 9 minutes (57 commuters, 29.5%) for males and 10 to 14 minutes (109 commuters, 27.4%) for females.
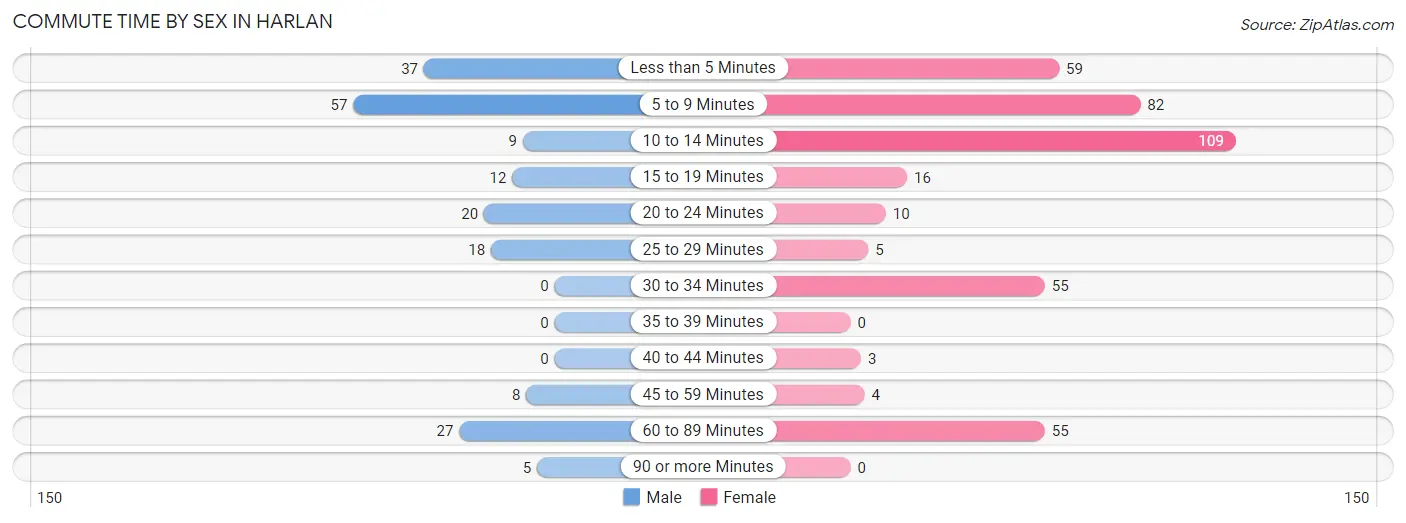
| Commute Time | Male | Female |
| Less than 5 Minutes | 37 (19.2%) | 59 (14.8%) |
| 5 to 9 Minutes | 57 (29.5%) | 82 (20.6%) |
| 10 to 14 Minutes | 9 (4.7%) | 109 (27.4%) |
| 15 to 19 Minutes | 12 (6.2%) | 16 (4.0%) |
| 20 to 24 Minutes | 20 (10.4%) | 10 (2.5%) |
| 25 to 29 Minutes | 18 (9.3%) | 5 (1.3%) |
| 30 to 34 Minutes | 0 (0.0%) | 55 (13.8%) |
| 35 to 39 Minutes | 0 (0.0%) | 0 (0.0%) |
| 40 to 44 Minutes | 0 (0.0%) | 3 (0.7%) |
| 45 to 59 Minutes | 8 (4.2%) | 4 (1.0%) |
| 60 to 89 Minutes | 27 (14.0%) | 55 (13.8%) |
| 90 or more Minutes | 5 (2.6%) | 0 (0.0%) |
Time of Departure to Work by Sex in Harlan
The most frequent times of departure to work in Harlan are 7:30 AM to 7:59 AM (34, 17.6%) for males and 7:30 AM to 7:59 AM (90, 22.6%) for females.
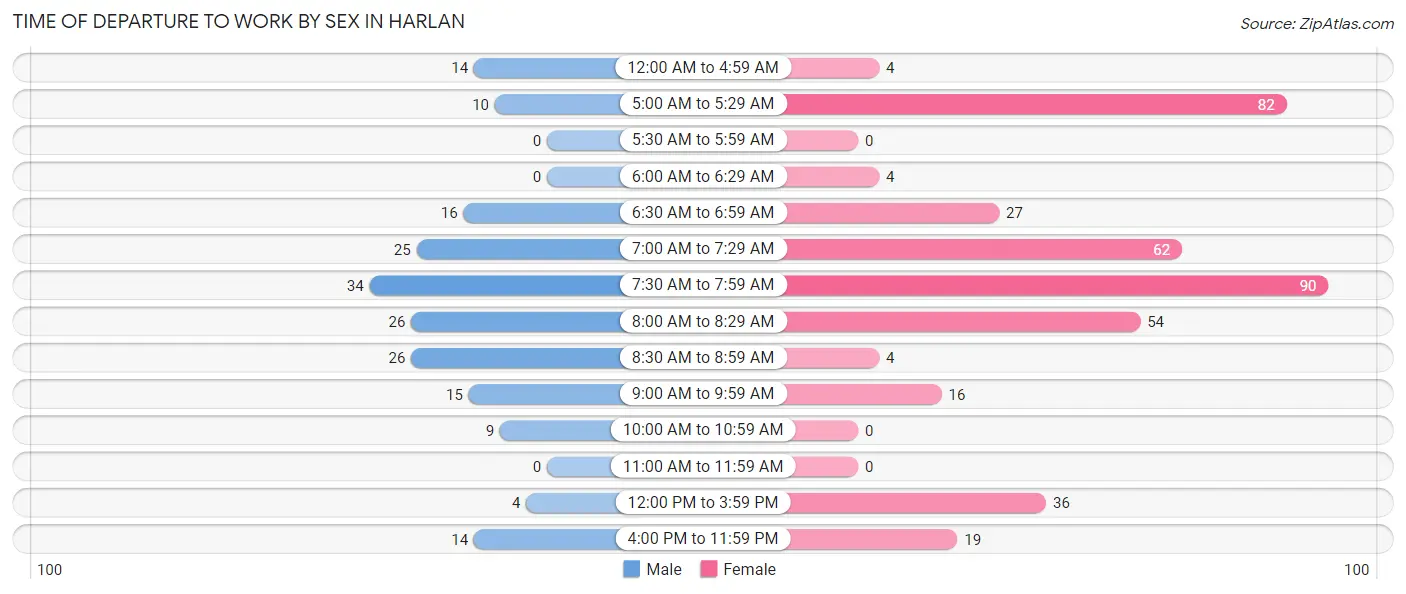
| Time of Departure | Male | Female |
| 12:00 AM to 4:59 AM | 14 (7.2%) | 4 (1.0%) |
| 5:00 AM to 5:29 AM | 10 (5.2%) | 82 (20.6%) |
| 5:30 AM to 5:59 AM | 0 (0.0%) | 0 (0.0%) |
| 6:00 AM to 6:29 AM | 0 (0.0%) | 4 (1.0%) |
| 6:30 AM to 6:59 AM | 16 (8.3%) | 27 (6.8%) |
| 7:00 AM to 7:29 AM | 25 (13.0%) | 62 (15.6%) |
| 7:30 AM to 7:59 AM | 34 (17.6%) | 90 (22.6%) |
| 8:00 AM to 8:29 AM | 26 (13.5%) | 54 (13.6%) |
| 8:30 AM to 8:59 AM | 26 (13.5%) | 4 (1.0%) |
| 9:00 AM to 9:59 AM | 15 (7.8%) | 16 (4.0%) |
| 10:00 AM to 10:59 AM | 9 (4.7%) | 0 (0.0%) |
| 11:00 AM to 11:59 AM | 0 (0.0%) | 0 (0.0%) |
| 12:00 PM to 3:59 PM | 4 (2.1%) | 36 (9.0%) |
| 4:00 PM to 11:59 PM | 14 (7.2%) | 19 (4.8%) |
| Total | 193 (100.0%) | 398 (100.0%) |
Housing Occupancy in Harlan
Occupancy by Ownership in Harlan
Of the total 878 dwellings in Harlan, owner-occupied units account for 312 (35.5%), while renter-occupied units make up 566 (64.5%).
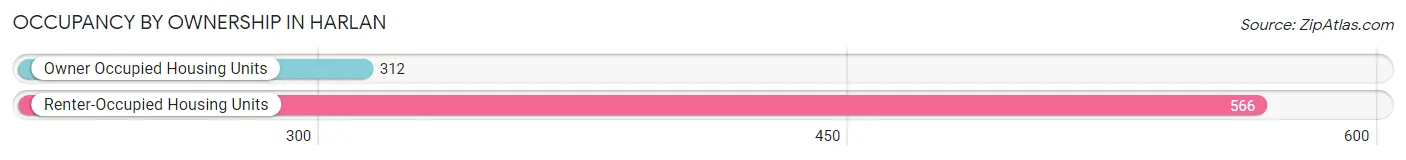
| Occupancy | # Housing Units | % Housing Units |
| Owner Occupied Housing Units | 312 | 35.5% |
| Renter-Occupied Housing Units | 566 | 64.5% |
| Total Occupied Housing Units | 878 | 100.0% |
Occupancy by Household Size in Harlan
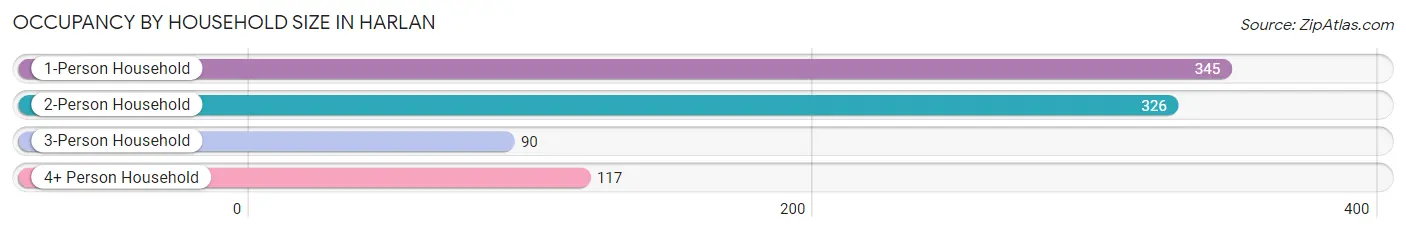
| Household Size | # Housing Units | % Housing Units |
| 1-Person Household | 345 | 39.3% |
| 2-Person Household | 326 | 37.1% |
| 3-Person Household | 90 | 10.2% |
| 4+ Person Household | 117 | 13.3% |
| Total Housing Units | 878 | 100.0% |
Occupancy by Ownership by Household Size in Harlan
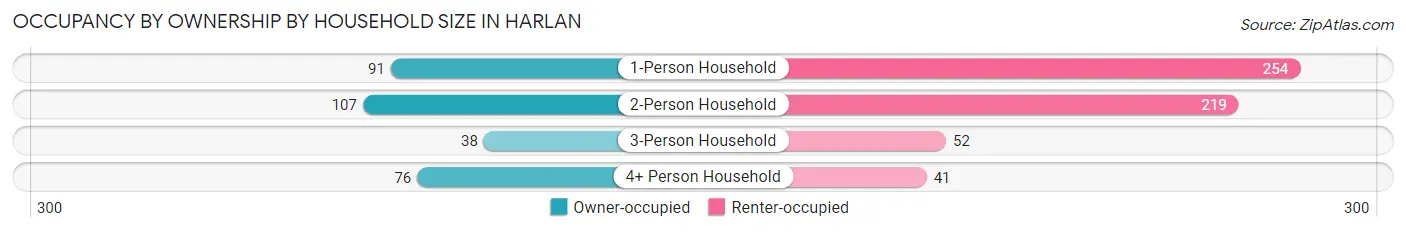
| Household Size | Owner-occupied | Renter-occupied |
| 1-Person Household | 91 (26.4%) | 254 (73.6%) |
| 2-Person Household | 107 (32.8%) | 219 (67.2%) |
| 3-Person Household | 38 (42.2%) | 52 (57.8%) |
| 4+ Person Household | 76 (65.0%) | 41 (35.0%) |
| Total Housing Units | 312 (35.5%) | 566 (64.5%) |
Occupancy by Educational Attainment in Harlan
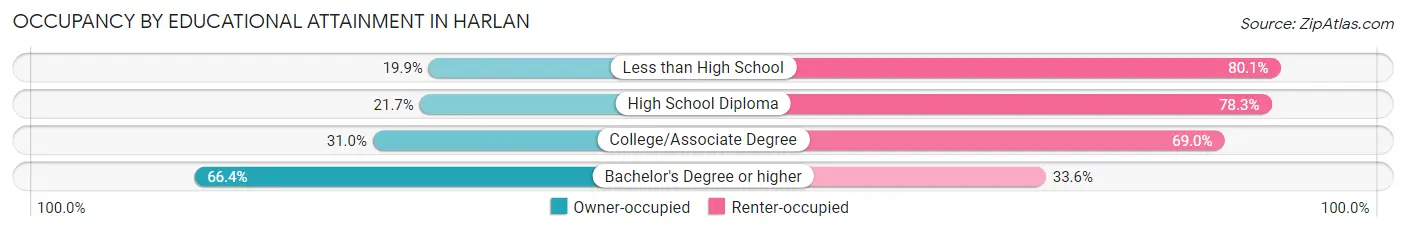
| Household Size | Owner-occupied | Renter-occupied |
| Less than High School | 32 (19.9%) | 129 (80.1%) |
| High School Diploma | 49 (21.7%) | 177 (78.3%) |
| College/Associate Degree | 83 (31.0%) | 185 (69.0%) |
| Bachelor's Degree or higher | 148 (66.4%) | 75 (33.6%) |
Occupancy by Age of Householder in Harlan
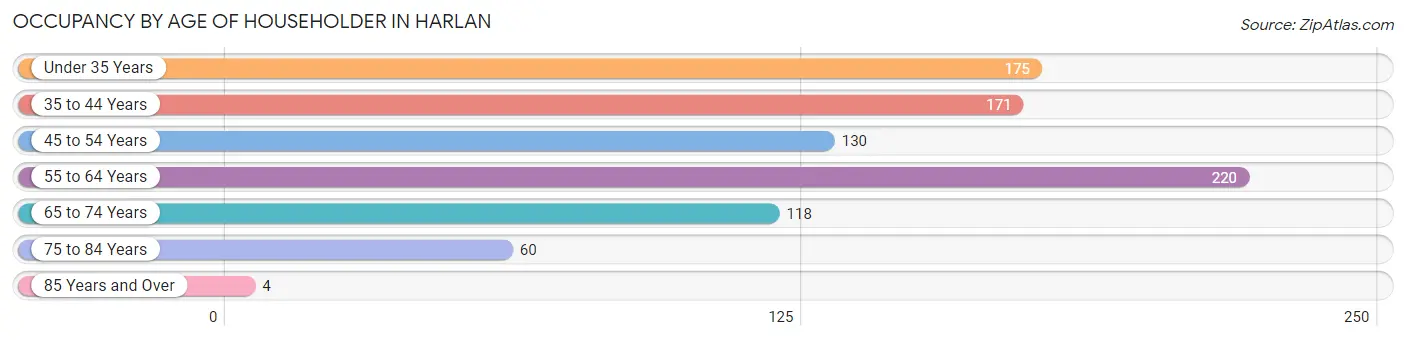
| Age Bracket | # Households | % Households |
| Under 35 Years | 175 | 19.9% |
| 35 to 44 Years | 171 | 19.5% |
| 45 to 54 Years | 130 | 14.8% |
| 55 to 64 Years | 220 | 25.1% |
| 65 to 74 Years | 118 | 13.4% |
| 75 to 84 Years | 60 | 6.8% |
| 85 Years and Over | 4 | 0.5% |
| Total | 878 | 100.0% |
Housing Finances in Harlan
Median Income by Occupancy in Harlan
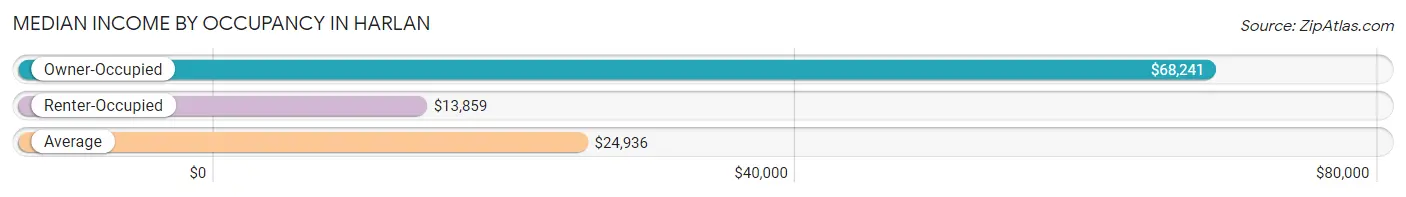
| Occupancy Type | # Households | Median Income |
| Owner-Occupied | 312 (35.5%) | $68,241 |
| Renter-Occupied | 566 (64.5%) | $13,859 |
| Average | 878 (100.0%) | $24,936 |
Occupancy by Householder Income Bracket in Harlan
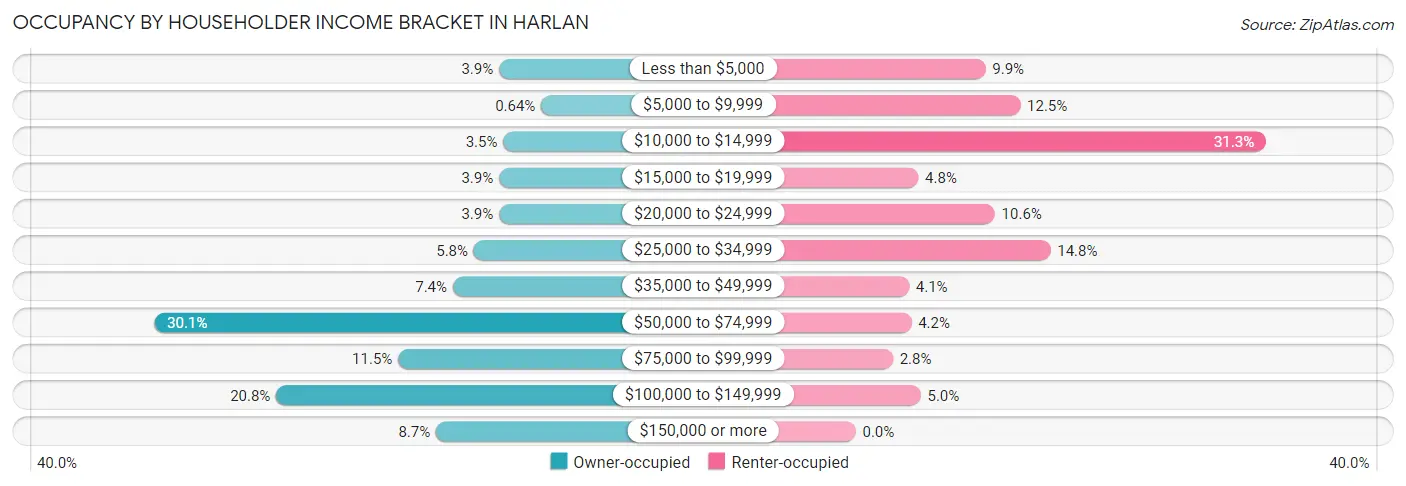
| Income Bracket | Owner-occupied | Renter-occupied |
| Less than $5,000 | 12 (3.8%) | 56 (9.9%) |
| $5,000 to $9,999 | 2 (0.6%) | 71 (12.5%) |
| $10,000 to $14,999 | 11 (3.5%) | 177 (31.3%) |
| $15,000 to $19,999 | 12 (3.8%) | 27 (4.8%) |
| $20,000 to $24,999 | 12 (3.8%) | 60 (10.6%) |
| $25,000 to $34,999 | 18 (5.8%) | 84 (14.8%) |
| $35,000 to $49,999 | 23 (7.4%) | 23 (4.1%) |
| $50,000 to $74,999 | 94 (30.1%) | 24 (4.2%) |
| $75,000 to $99,999 | 36 (11.5%) | 16 (2.8%) |
| $100,000 to $149,999 | 65 (20.8%) | 28 (5.0%) |
| $150,000 or more | 27 (8.6%) | 0 (0.0%) |
| Total | 312 (100.0%) | 566 (100.0%) |
Monthly Housing Cost Tiers in Harlan
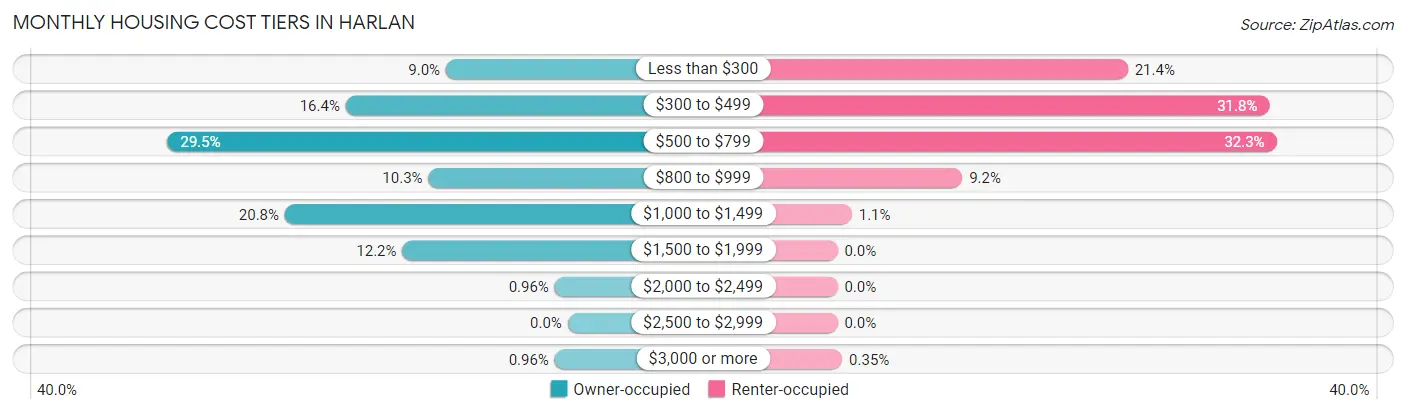
| Monthly Cost | Owner-occupied | Renter-occupied |
| Less than $300 | 28 (9.0%) | 121 (21.4%) |
| $300 to $499 | 51 (16.4%) | 180 (31.8%) |
| $500 to $799 | 92 (29.5%) | 183 (32.3%) |
| $800 to $999 | 32 (10.3%) | 52 (9.2%) |
| $1,000 to $1,499 | 65 (20.8%) | 6 (1.1%) |
| $1,500 to $1,999 | 38 (12.2%) | 0 (0.0%) |
| $2,000 to $2,499 | 3 (1.0%) | 0 (0.0%) |
| $2,500 to $2,999 | 0 (0.0%) | 0 (0.0%) |
| $3,000 or more | 3 (1.0%) | 2 (0.4%) |
| Total | 312 (100.0%) | 566 (100.0%) |
Physical Housing Characteristics in Harlan
Housing Structures in Harlan
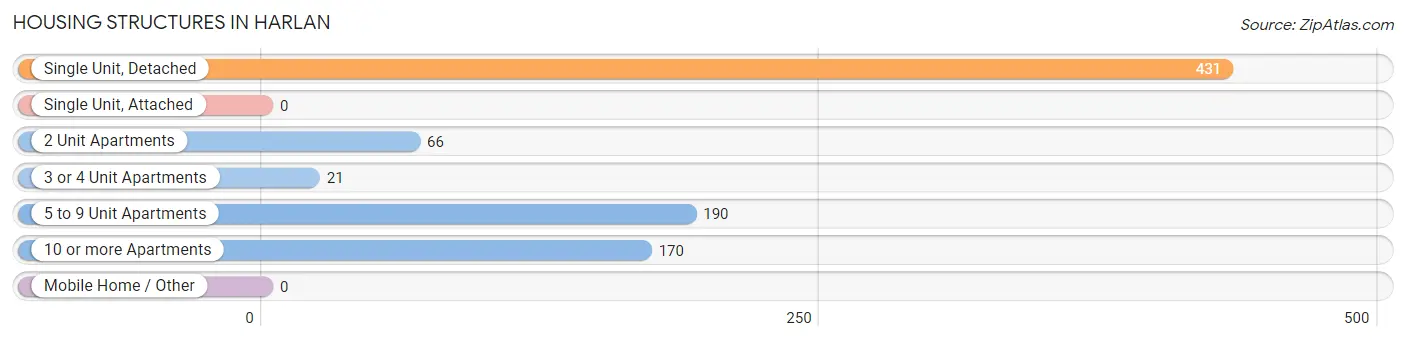
| Structure Type | # Housing Units | % Housing Units |
| Single Unit, Detached | 431 | 49.1% |
| Single Unit, Attached | 0 | 0.0% |
| 2 Unit Apartments | 66 | 7.5% |
| 3 or 4 Unit Apartments | 21 | 2.4% |
| 5 to 9 Unit Apartments | 190 | 21.6% |
| 10 or more Apartments | 170 | 19.4% |
| Mobile Home / Other | 0 | 0.0% |
| Total | 878 | 100.0% |
Housing Structures by Occupancy in Harlan
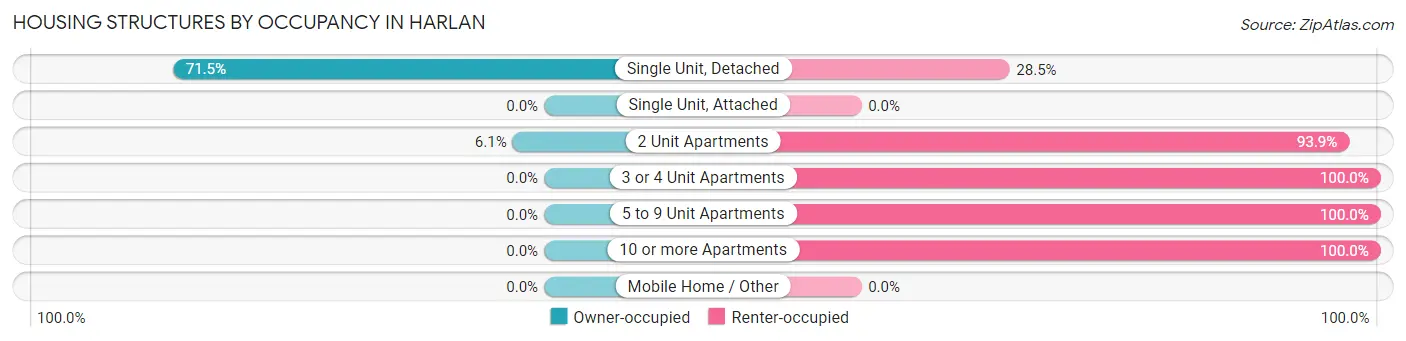
| Structure Type | Owner-occupied | Renter-occupied |
| Single Unit, Detached | 308 (71.5%) | 123 (28.5%) |
| Single Unit, Attached | 0 (0.0%) | 0 (0.0%) |
| 2 Unit Apartments | 4 (6.1%) | 62 (93.9%) |
| 3 or 4 Unit Apartments | 0 (0.0%) | 21 (100.0%) |
| 5 to 9 Unit Apartments | 0 (0.0%) | 190 (100.0%) |
| 10 or more Apartments | 0 (0.0%) | 170 (100.0%) |
| Mobile Home / Other | 0 (0.0%) | 0 (0.0%) |
| Total | 312 (35.5%) | 566 (64.5%) |
Housing Structures by Number of Rooms in Harlan
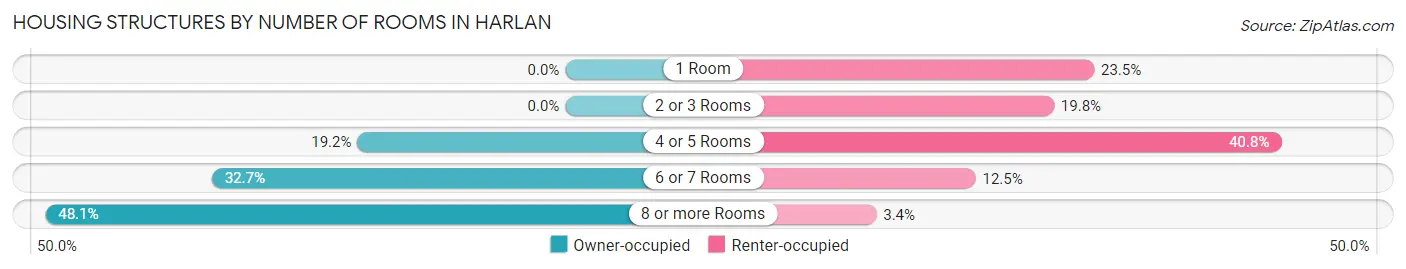
| Number of Rooms | Owner-occupied | Renter-occupied |
| 1 Room | 0 (0.0%) | 133 (23.5%) |
| 2 or 3 Rooms | 0 (0.0%) | 112 (19.8%) |
| 4 or 5 Rooms | 60 (19.2%) | 231 (40.8%) |
| 6 or 7 Rooms | 102 (32.7%) | 71 (12.5%) |
| 8 or more Rooms | 150 (48.1%) | 19 (3.4%) |
| Total | 312 (100.0%) | 566 (100.0%) |
Housing Structure by Heating Type in Harlan
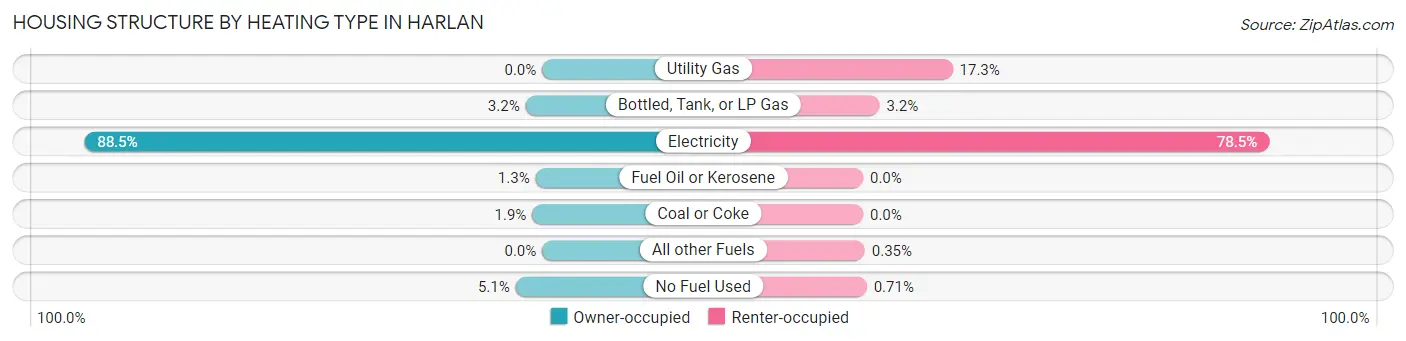
| Heating Type | Owner-occupied | Renter-occupied |
| Utility Gas | 0 (0.0%) | 98 (17.3%) |
| Bottled, Tank, or LP Gas | 10 (3.2%) | 18 (3.2%) |
| Electricity | 276 (88.5%) | 444 (78.4%) |
| Fuel Oil or Kerosene | 4 (1.3%) | 0 (0.0%) |
| Coal or Coke | 6 (1.9%) | 0 (0.0%) |
| All other Fuels | 0 (0.0%) | 2 (0.4%) |
| No Fuel Used | 16 (5.1%) | 4 (0.7%) |
| Total | 312 (100.0%) | 566 (100.0%) |
Household Vehicle Usage in Harlan
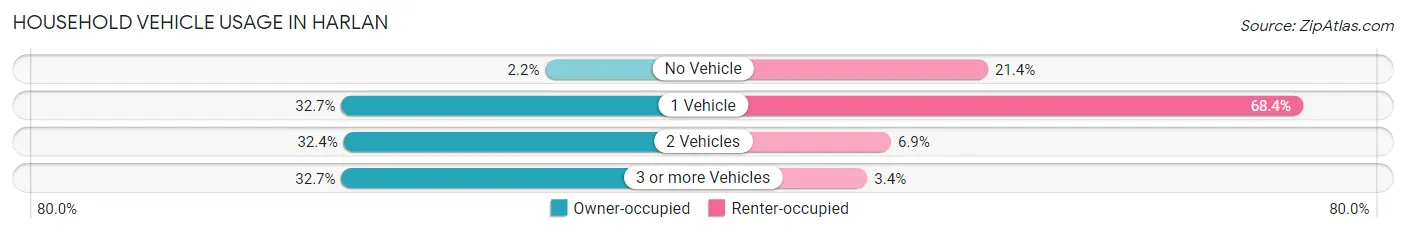
| Vehicles per Household | Owner-occupied | Renter-occupied |
| No Vehicle | 7 (2.2%) | 121 (21.4%) |
| 1 Vehicle | 102 (32.7%) | 387 (68.4%) |
| 2 Vehicles | 101 (32.4%) | 39 (6.9%) |
| 3 or more Vehicles | 102 (32.7%) | 19 (3.4%) |
| Total | 312 (100.0%) | 566 (100.0%) |
Real Estate & Mortgages in Harlan
Real Estate and Mortgage Overview in Harlan
| Characteristic | Without Mortgage | With Mortgage |
| Housing Units | 164 | 148 |
| Median Property Value | $106,800 | $150,800 |
| Median Household Income | $63,333 | $22 |
| Monthly Housing Costs | $506 | $3 |
| Real Estate Taxes | $1,193 | $0 |
Property Value by Mortgage Status in Harlan
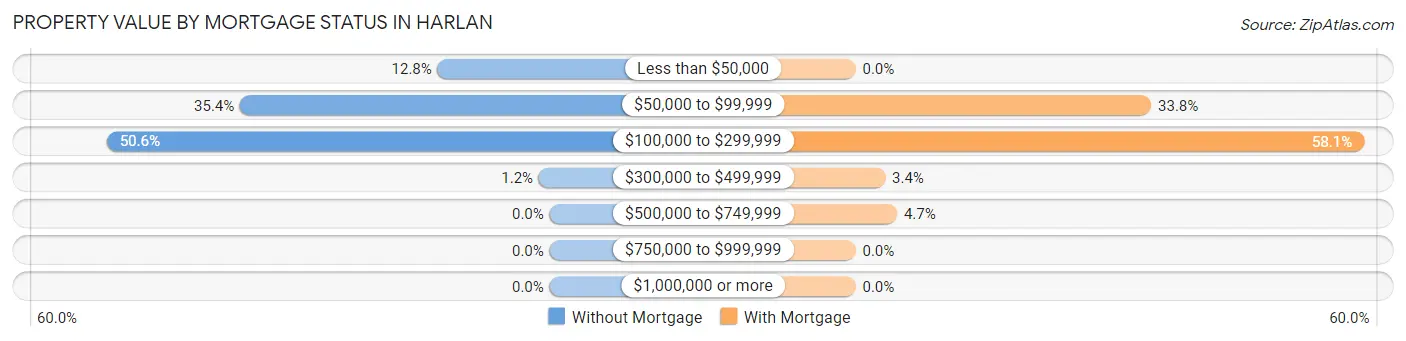
| Property Value | Without Mortgage | With Mortgage |
| Less than $50,000 | 21 (12.8%) | 0 (0.0%) |
| $50,000 to $99,999 | 58 (35.4%) | 50 (33.8%) |
| $100,000 to $299,999 | 83 (50.6%) | 86 (58.1%) |
| $300,000 to $499,999 | 2 (1.2%) | 5 (3.4%) |
| $500,000 to $749,999 | 0 (0.0%) | 7 (4.7%) |
| $750,000 to $999,999 | 0 (0.0%) | 0 (0.0%) |
| $1,000,000 or more | 0 (0.0%) | 0 (0.0%) |
| Total | 164 (100.0%) | 148 (100.0%) |
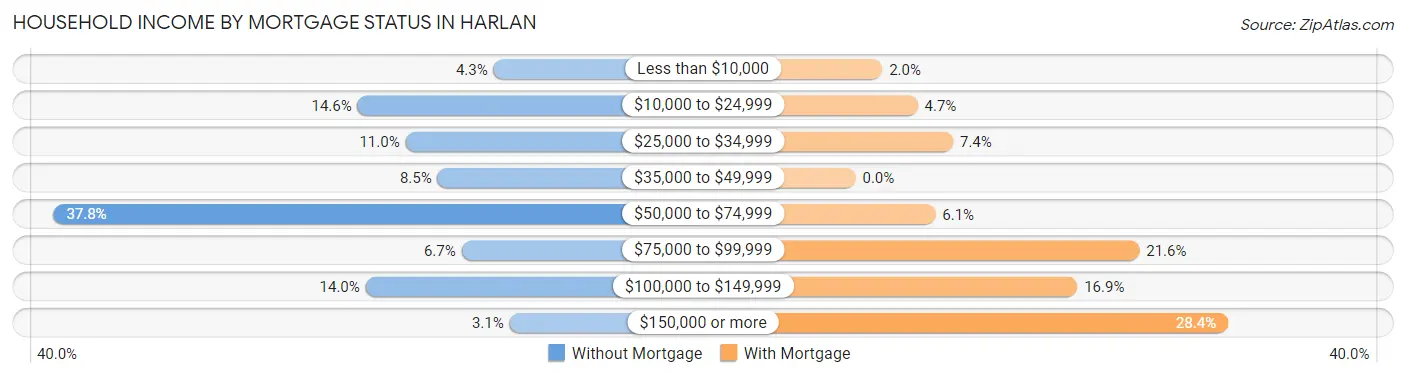
Household Income by Mortgage Status in Harlan
| Household Income | Without Mortgage | With Mortgage |
| Less than $10,000 | 7 (4.3%) | 3 (2.0%) |
| $10,000 to $24,999 | 24 (14.6%) | 7 (4.7%) |
| $25,000 to $34,999 | 18 (11.0%) | 11 (7.4%) |
| $35,000 to $49,999 | 14 (8.5%) | 0 (0.0%) |
| $50,000 to $74,999 | 62 (37.8%) | 9 (6.1%) |
| $75,000 to $99,999 | 11 (6.7%) | 32 (21.6%) |
| $100,000 to $149,999 | 23 (14.0%) | 25 (16.9%) |
| $150,000 or more | 5 (3.0%) | 42 (28.4%) |
| Total | 164 (100.0%) | 148 (100.0%) |
Property Value to Household Income Ratio in Harlan
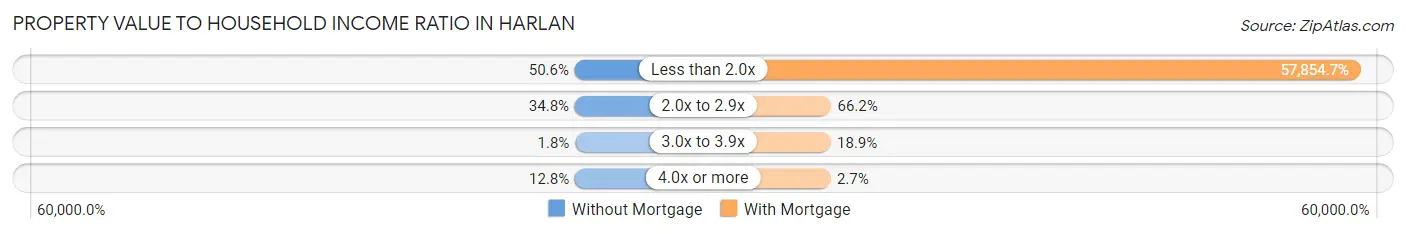
| Value-to-Income Ratio | Without Mortgage | With Mortgage |
| Less than 2.0x | 83 (50.6%) | 85,625 (57,854.7%) |
| 2.0x to 2.9x | 57 (34.8%) | 98 (66.2%) |
| 3.0x to 3.9x | 3 (1.8%) | 28 (18.9%) |
| 4.0x or more | 21 (12.8%) | 4 (2.7%) |
| Total | 164 (100.0%) | 148 (100.0%) |
Real Estate Taxes by Mortgage Status in Harlan
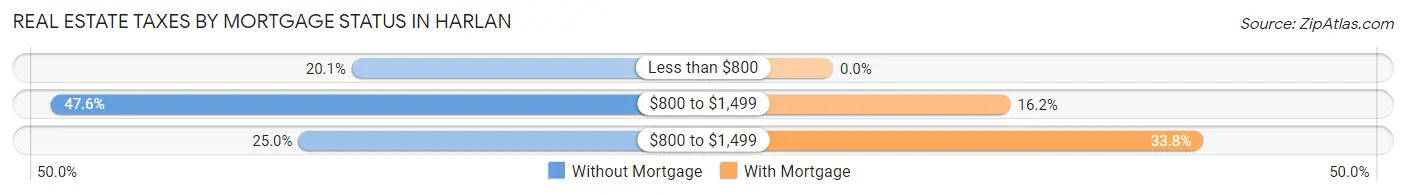
| Property Taxes | Without Mortgage | With Mortgage |
| Less than $800 | 33 (20.1%) | 0 (0.0%) |
| $800 to $1,499 | 78 (47.6%) | 24 (16.2%) |
| $800 to $1,499 | 41 (25.0%) | 50 (33.8%) |
| Total | 164 (100.0%) | 148 (100.0%) |
Health & Disability in Harlan
Health Insurance Coverage by Age in Harlan
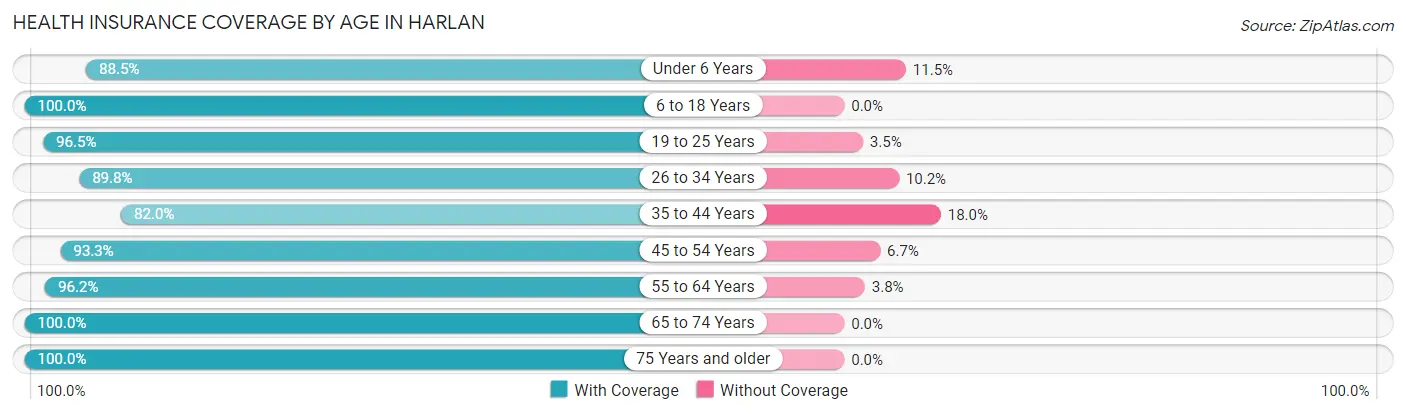
| Age Bracket | With Coverage | Without Coverage |
| Under 6 Years | 131 (88.5%) | 17 (11.5%) |
| 6 to 18 Years | 284 (100.0%) | 0 (0.0%) |
| 19 to 25 Years | 195 (96.5%) | 7 (3.5%) |
| 26 to 34 Years | 194 (89.8%) | 22 (10.2%) |
| 35 to 44 Years | 196 (82.0%) | 43 (18.0%) |
| 45 to 54 Years | 196 (93.3%) | 14 (6.7%) |
| 55 to 64 Years | 276 (96.2%) | 11 (3.8%) |
| 65 to 74 Years | 217 (100.0%) | 0 (0.0%) |
| 75 Years and older | 105 (100.0%) | 0 (0.0%) |
| Total | 1,794 (94.0%) | 114 (6.0%) |
Health Insurance Coverage by Citizenship Status in Harlan
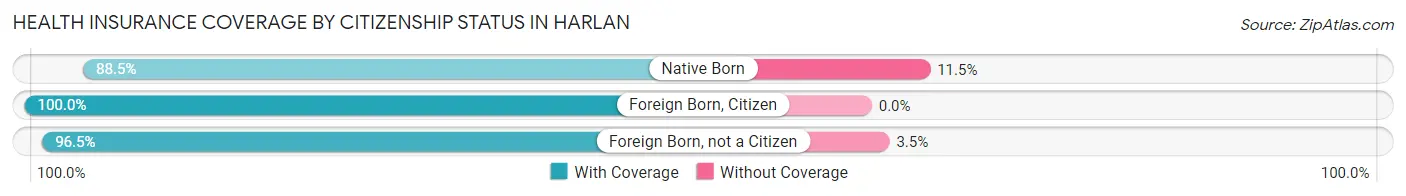
| Citizenship Status | With Coverage | Without Coverage |
| Native Born | 131 (88.5%) | 17 (11.5%) |
| Foreign Born, Citizen | 284 (100.0%) | 0 (0.0%) |
| Foreign Born, not a Citizen | 195 (96.5%) | 7 (3.5%) |
Health Insurance Coverage by Household Income in Harlan
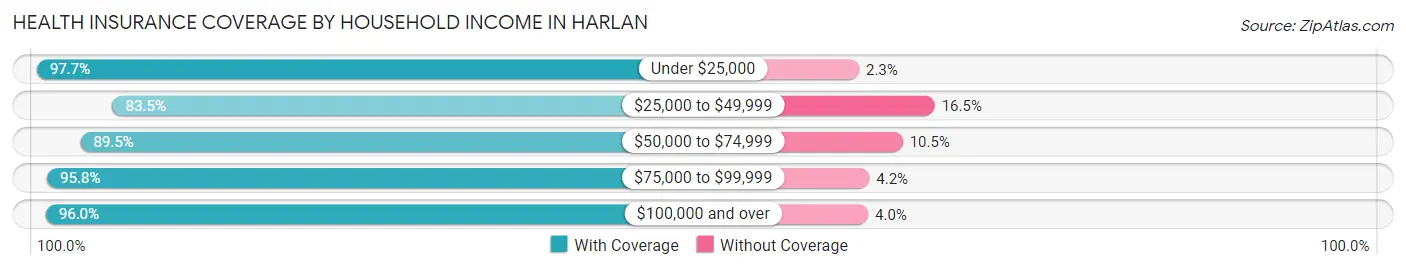
| Household Income | With Coverage | Without Coverage |
| Under $25,000 | 767 (97.7%) | 18 (2.3%) |
| $25,000 to $49,999 | 228 (83.5%) | 45 (16.5%) |
| $50,000 to $74,999 | 231 (89.5%) | 27 (10.5%) |
| $75,000 to $99,999 | 159 (95.8%) | 7 (4.2%) |
| $100,000 and over | 409 (96.0%) | 17 (4.0%) |
Public vs Private Health Insurance Coverage by Age in Harlan
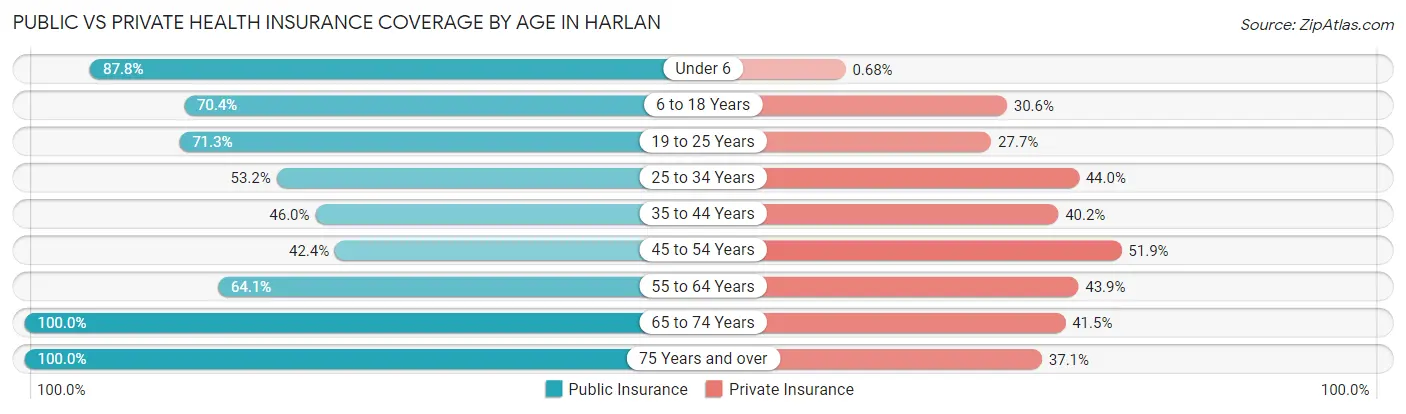
| Age Bracket | Public Insurance | Private Insurance |
| Under 6 | 130 (87.8%) | 1 (0.7%) |
| 6 to 18 Years | 200 (70.4%) | 87 (30.6%) |
| 19 to 25 Years | 144 (71.3%) | 56 (27.7%) |
| 25 to 34 Years | 115 (53.2%) | 95 (44.0%) |
| 35 to 44 Years | 110 (46.0%) | 96 (40.2%) |
| 45 to 54 Years | 89 (42.4%) | 109 (51.9%) |
| 55 to 64 Years | 184 (64.1%) | 126 (43.9%) |
| 65 to 74 Years | 217 (100.0%) | 90 (41.5%) |
| 75 Years and over | 105 (100.0%) | 39 (37.1%) |
| Total | 1,294 (67.8%) | 699 (36.6%) |
Disability Status by Sex by Age in Harlan
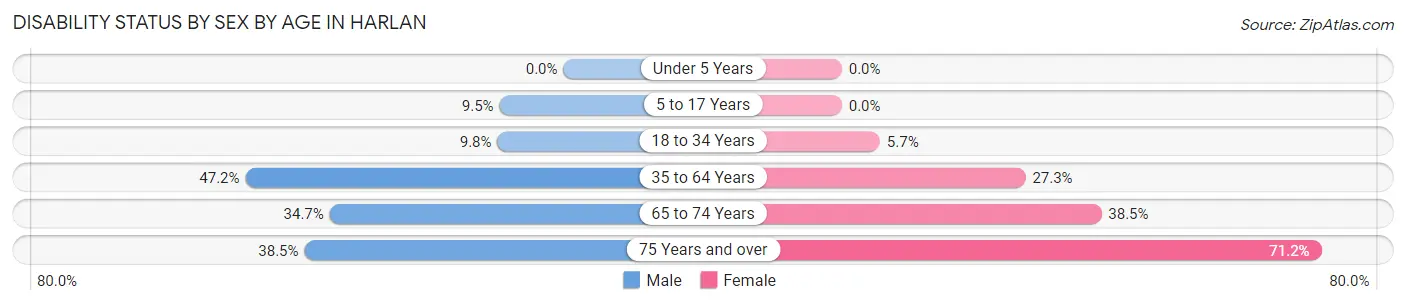
| Age Bracket | Male | Female |
| Under 5 Years | 0 (0.0%) | 0 (0.0%) |
| 5 to 17 Years | 15 (9.5%) | 0 (0.0%) |
| 18 to 34 Years | 15 (9.8%) | 15 (5.7%) |
| 35 to 64 Years | 119 (47.2%) | 132 (27.3%) |
| 65 to 74 Years | 42 (34.7%) | 37 (38.5%) |
| 75 Years and over | 15 (38.5%) | 47 (71.2%) |
Disability Class by Sex by Age in Harlan
Disability Class: Hearing Difficulty
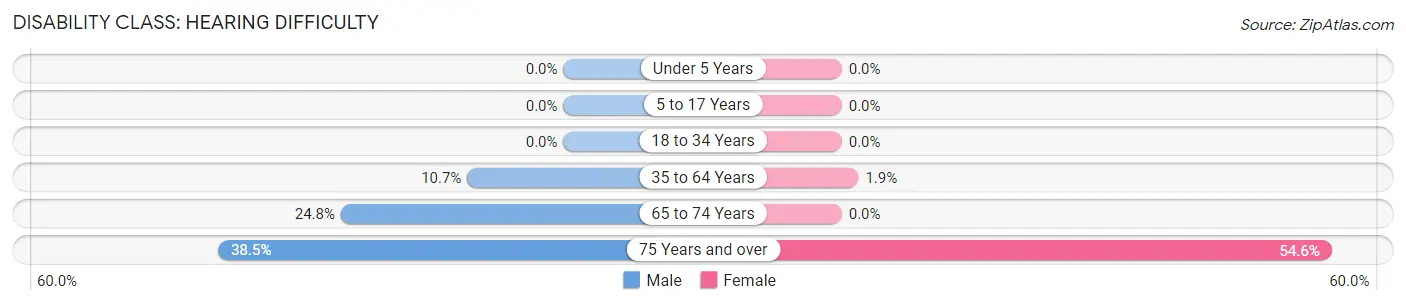
| Age Bracket | Male | Female |
| Under 5 Years | 0 (0.0%) | 0 (0.0%) |
| 5 to 17 Years | 0 (0.0%) | 0 (0.0%) |
| 18 to 34 Years | 0 (0.0%) | 0 (0.0%) |
| 35 to 64 Years | 27 (10.7%) | 9 (1.9%) |
| 65 to 74 Years | 30 (24.8%) | 0 (0.0%) |
| 75 Years and over | 15 (38.5%) | 36 (54.5%) |
Disability Class: Vision Difficulty
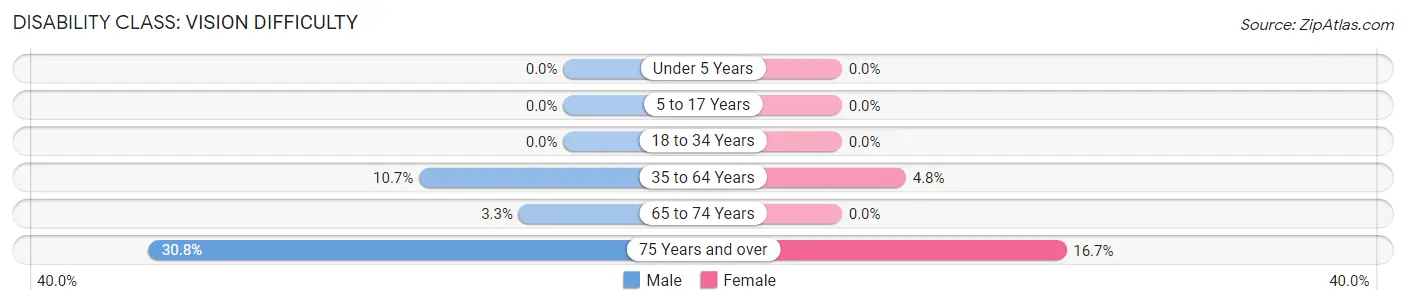
| Age Bracket | Male | Female |
| Under 5 Years | 0 (0.0%) | 0 (0.0%) |
| 5 to 17 Years | 0 (0.0%) | 0 (0.0%) |
| 18 to 34 Years | 0 (0.0%) | 0 (0.0%) |
| 35 to 64 Years | 27 (10.7%) | 23 (4.8%) |
| 65 to 74 Years | 4 (3.3%) | 0 (0.0%) |
| 75 Years and over | 12 (30.8%) | 11 (16.7%) |
Disability Class: Cognitive Difficulty
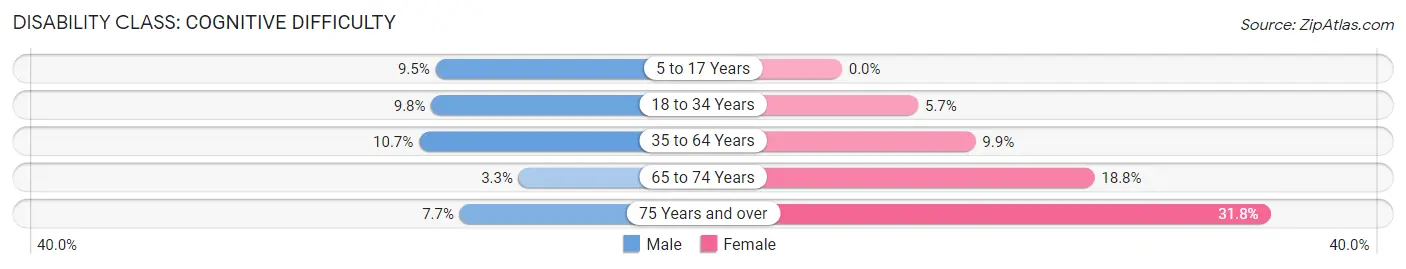
| Age Bracket | Male | Female |
| 5 to 17 Years | 15 (9.5%) | 0 (0.0%) |
| 18 to 34 Years | 15 (9.8%) | 15 (5.7%) |
| 35 to 64 Years | 27 (10.7%) | 48 (9.9%) |
| 65 to 74 Years | 4 (3.3%) | 18 (18.8%) |
| 75 Years and over | 3 (7.7%) | 21 (31.8%) |
Disability Class: Ambulatory Difficulty
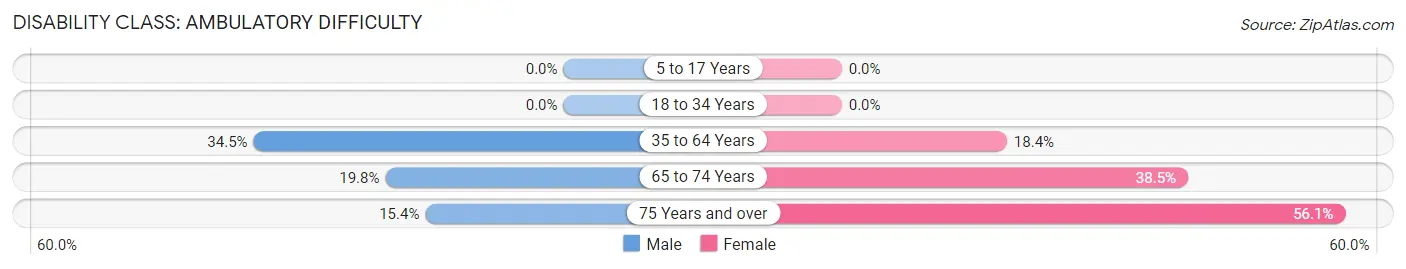
| Age Bracket | Male | Female |
| 5 to 17 Years | 0 (0.0%) | 0 (0.0%) |
| 18 to 34 Years | 0 (0.0%) | 0 (0.0%) |
| 35 to 64 Years | 87 (34.5%) | 89 (18.4%) |
| 65 to 74 Years | 24 (19.8%) | 37 (38.5%) |
| 75 Years and over | 6 (15.4%) | 37 (56.1%) |
Disability Class: Self-Care Difficulty
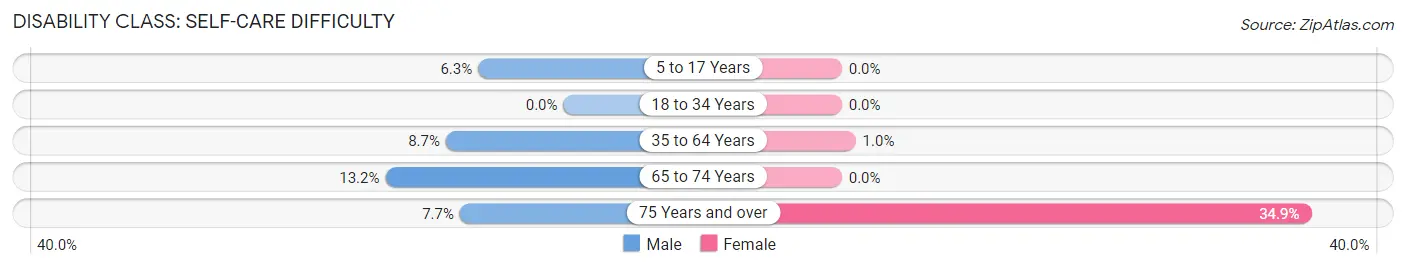
| Age Bracket | Male | Female |
| 5 to 17 Years | 10 (6.3%) | 0 (0.0%) |
| 18 to 34 Years | 0 (0.0%) | 0 (0.0%) |
| 35 to 64 Years | 22 (8.7%) | 5 (1.0%) |
| 65 to 74 Years | 16 (13.2%) | 0 (0.0%) |
| 75 Years and over | 3 (7.7%) | 23 (34.8%) |
Technology Access in Harlan
Computing Device Access in Harlan
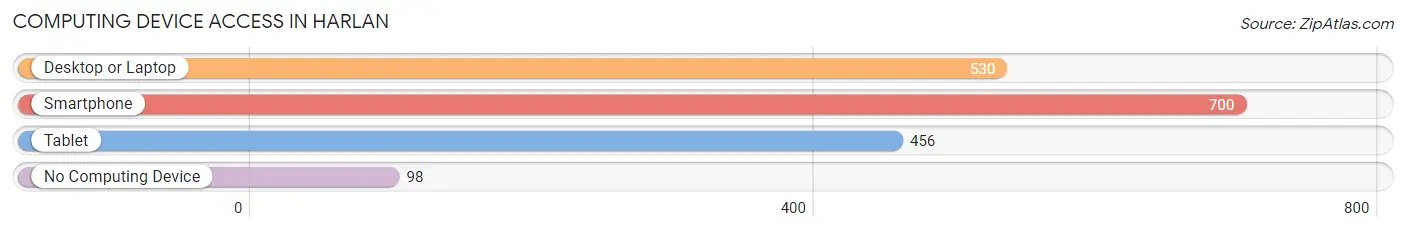
| Device Type | # Households | % Households |
| Desktop or Laptop | 530 | 60.4% |
| Smartphone | 700 | 79.7% |
| Tablet | 456 | 51.9% |
| No Computing Device | 98 | 11.2% |
| Total | 878 | 100.0% |
Internet Access in Harlan
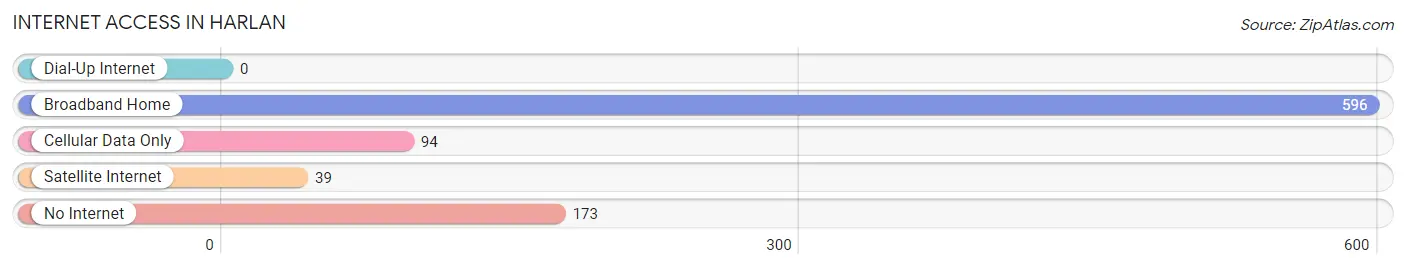
| Internet Type | # Households | % Households |
| Dial-Up Internet | 0 | 0.0% |
| Broadband Home | 596 | 67.9% |
| Cellular Data Only | 94 | 10.7% |
| Satellite Internet | 39 | 4.4% |
| No Internet | 173 | 19.7% |
| Total | 878 | 100.0% |
Harlan Summary
Harlan is a city located in Harlan County, Kentucky, United States. It is the county seat of Harlan County and is located in the southeastern corner of the state. The population was 1,745 at the 2010 census.
Geography
Harlan is located at the junction of US 421 and US 119, approximately 25 miles (40 km) south of the Kentucky-Virginia border. The city is situated in the Appalachian Mountains, and is surrounded by the Cumberland Plateau. The city is located in the Cumberland Gap National Historical Park, and is the gateway to the Daniel Boone National Forest.
The city is located in a valley, with the Cumberland Mountains to the east and the Pine Mountain Range to the west. The city is located at an elevation of 1,890 feet (576 m).
Climate
Harlan has a humid subtropical climate, with hot, humid summers and mild winters. The average annual temperature is 57.2 °F (14 °C). The average annual precipitation is 44.3 inches (112 cm).
Demographics
As of the 2010 census, there were 1,745 people, 745 households, and 463 families residing in the city. The population density was 1,092.3 people per square mile (422.2/km2). There were 845 housing units at an average density of 531.3 per square mile (205.2/km2). The racial makeup of the city was 97.2% White, 0.9% African American, 0.2% Native American, 0.2% Asian, 0.1% Pacific Islander, 0.2% from other races, and 1.2% from two or more races. Hispanic or Latino of any race were 0.7% of the population.
Economy
Harlan's economy is largely based on coal mining and related industries. The city is home to several coal mines, including the Harlan County Coal Mine, which is the largest coal mine in the state. The city is also home to several manufacturing companies, including Harlan Industries, which produces a variety of products, including furniture, clothing, and automotive parts.
The city is also home to several retail stores, including a Walmart Supercenter, a Kmart, and a Dollar General. The city is also home to several restaurants, including a McDonald's, a Burger King, and a Subway.
Education
Harlan is served by the Harlan County Public Schools system. The city is home to two elementary schools, one middle school, and one high school. The city is also home to a branch of the Southeast Kentucky Community and Technical College.
Conclusion
Harlan is a city located in Harlan County, Kentucky, United States. It is the county seat of Harlan County and is located in the southeastern corner of the state. The city is situated in the Appalachian Mountains, and is surrounded by the Cumberland Plateau. The city is located in a valley, with the Cumberland Mountains to the east and the Pine Mountain Range to the west. The population was 1,745 at the 2010 census. The city's economy is largely based on coal mining and related industries, and the city is home to several retail stores, restaurants, and manufacturing companies. The city is served by the Harlan County Public Schools system, and is home to a branch of the Southeast Kentucky Community and Technical College.
Common Questions
What is Per Capita Income in Harlan?
Per Capita income in Harlan is $21,108.
What is the Median Family Income in Harlan?
Median Family Income in Harlan is $33,854.
What is the Median Household income in Harlan?
Median Household Income in Harlan is $24,936.
What is Income or Wage Gap in Harlan?
Income or Wage Gap in Harlan is 27.1%.
Women in Harlan earn 72.9 cents for every dollar earned by a man.
What is Inequality or Gini Index in Harlan?
Inequality or Gini Index in Harlan is 0.53.
What is the Total Population of Harlan?
Total Population of Harlan is 1,908.
What is the Total Male Population of Harlan?
Total Male Population of Harlan is 747.
What is the Total Female Population of Harlan?
Total Female Population of Harlan is 1,161.
What is the Ratio of Males per 100 Females in Harlan?
There are 64.34 Males per 100 Females in Harlan.
What is the Ratio of Females per 100 Males in Harlan?
There are 155.42 Females per 100 Males in Harlan.
What is the Median Population Age in Harlan?
Median Population Age in Harlan is 41.0 Years.
What is the Average Family Size in Harlan
Average Family Size in Harlan is 2.8 People.
What is the Average Household Size in Harlan
Average Household Size in Harlan is 2.2 People.
How Large is the Labor Force in Harlan?
There are 723 People in the Labor Forcein in Harlan.
What is the Percentage of People in the Labor Force in Harlan?
46.6% of People are in the Labor Force in Harlan.
What is the Unemployment Rate in Harlan?
Unemployment Rate in Harlan is 11.8%.