Murray, KY Map & Demographics
Murray Map
Murray Overview
$22,900
PER CAPITA INCOME
$65,829
AVG FAMILY INCOME
$37,421
AVG HOUSEHOLD INCOME
48.6%
WAGE / INCOME GAP [ % ]
51.4¢/ $1
WAGE / INCOME GAP [ $ ]
$12,356
FAMILY INCOME DEFICIT
0.51
INEQUALITY / GINI INDEX
17,414
TOTAL POPULATION
8,299
MALE POPULATION
9,115
FEMALE POPULATION
91.05
MALES / 100 FEMALES
109.83
FEMALES / 100 MALES
25.6
MEDIAN AGE
2.9
AVG FAMILY SIZE
2.2
AVG HOUSEHOLD SIZE
8,685
LABOR FORCE [ PEOPLE ]
57.5%
PERCENT IN LABOR FORCE
5.1%
UNEMPLOYMENT RATE
Murray Zip Codes
Murray Area Codes
Income in Murray
Income Overview in Murray
Per Capita Income in Murray is $22,900, while median incomes of families and households are $65,829 and $37,421 respectively.
| Characteristic | Number | Measure |
| Per Capita Income | 17,414 | $22,900 |
| Median Family Income | 3,183 | $65,829 |
| Mean Family Income | 3,183 | $81,348 |
| Median Household Income | 6,611 | $37,421 |
| Mean Household Income | 6,611 | $56,745 |
| Income Deficit | 3,183 | $12,356 |
| Wage / Income Gap (%) | 17,414 | 48.55% |
| Wage / Income Gap ($) | 17,414 | 51.45¢ per $1 |
| Gini / Inequality Index | 17,414 | 0.51 |
Earnings by Sex in Murray
Average Earnings in Murray are $20,495, $29,174 for men and $15,010 for women, a difference of 48.5%.
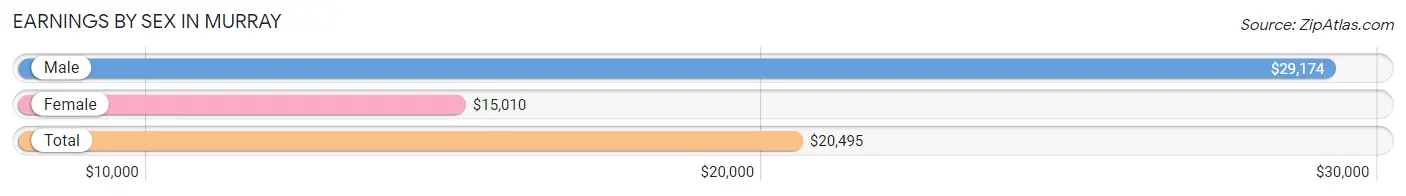
| Sex | Number | Average Earnings |
| Male | 4,300 (46.3%) | $29,174 |
| Female | 4,998 (53.7%) | $15,010 |
| Total | 9,298 (100.0%) | $20,495 |
Earnings by Sex by Income Bracket in Murray
The most common earnings brackets in Murray are $25,000 to $29,999 for men (360 | 8.4%) and $2,499 or less for women (612 | 12.2%).
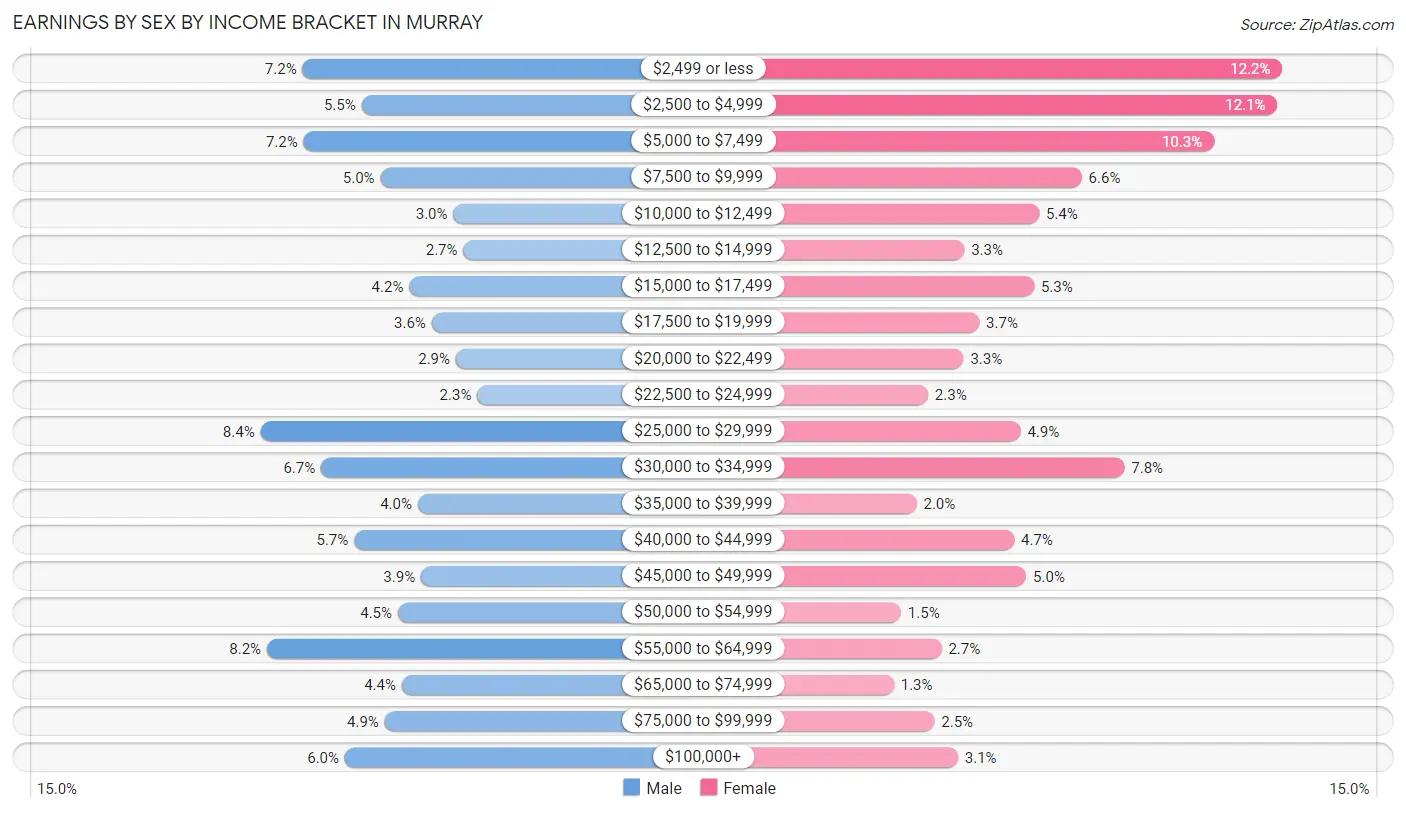
| Income | Male | Female |
| $2,499 or less | 309 (7.2%) | 612 (12.2%) |
| $2,500 to $4,999 | 238 (5.5%) | 605 (12.1%) |
| $5,000 to $7,499 | 308 (7.2%) | 516 (10.3%) |
| $7,500 to $9,999 | 215 (5.0%) | 330 (6.6%) |
| $10,000 to $12,499 | 127 (2.9%) | 270 (5.4%) |
| $12,500 to $14,999 | 115 (2.7%) | 165 (3.3%) |
| $15,000 to $17,499 | 180 (4.2%) | 263 (5.3%) |
| $17,500 to $19,999 | 153 (3.6%) | 186 (3.7%) |
| $20,000 to $22,499 | 124 (2.9%) | 164 (3.3%) |
| $22,500 to $24,999 | 98 (2.3%) | 114 (2.3%) |
| $25,000 to $29,999 | 360 (8.4%) | 244 (4.9%) |
| $30,000 to $34,999 | 287 (6.7%) | 390 (7.8%) |
| $35,000 to $39,999 | 170 (4.0%) | 98 (2.0%) |
| $40,000 to $44,999 | 247 (5.7%) | 235 (4.7%) |
| $45,000 to $49,999 | 166 (3.9%) | 252 (5.0%) |
| $50,000 to $54,999 | 194 (4.5%) | 76 (1.5%) |
| $55,000 to $64,999 | 352 (8.2%) | 133 (2.7%) |
| $65,000 to $74,999 | 189 (4.4%) | 66 (1.3%) |
| $75,000 to $99,999 | 210 (4.9%) | 123 (2.5%) |
| $100,000+ | 258 (6.0%) | 156 (3.1%) |
| Total | 4,300 (100.0%) | 4,998 (100.0%) |
Earnings by Sex by Educational Attainment in Murray
Average earnings in Murray are $42,583 for men and $32,322 for women, a difference of 24.1%. Men with an educational attainment of graduate degree enjoy the highest average annual earnings of $70,417, while those with high school diploma education earn the least with $29,788. Women with an educational attainment of graduate degree earn the most with the average annual earnings of $58,269, while those with high school diploma education have the smallest earnings of $20,143.
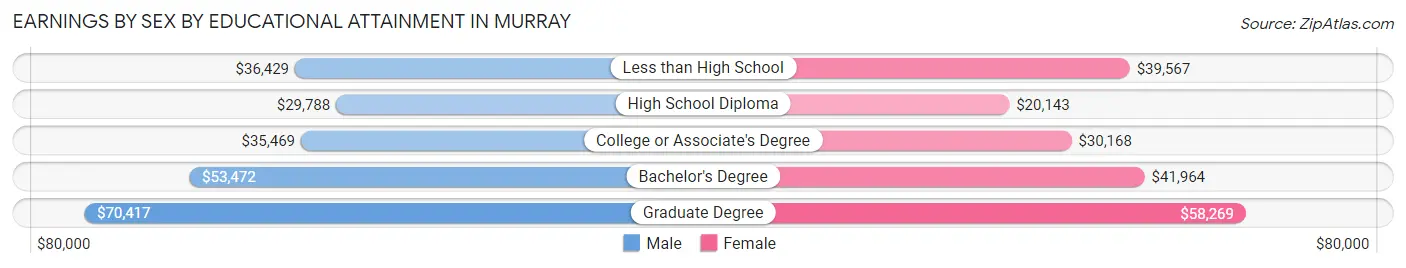
| Educational Attainment | Male Income | Female Income |
| Less than High School | $36,429 | $39,567 |
| High School Diploma | $29,788 | $20,143 |
| College or Associate's Degree | $35,469 | $30,168 |
| Bachelor's Degree | $53,472 | $41,964 |
| Graduate Degree | $70,417 | $58,269 |
| Total | $42,583 | $32,322 |
Family Income in Murray
Family Income Brackets in Murray
According to the Murray family income data, there are 637 families falling into the $100,000 to $149,999 income range, which is the most common income bracket and makes up 20.0% of all families. Conversely, the $10,000 to $14,999 income bracket is the least frequent group with only 92 families (2.9%) belonging to this category.
| Income Bracket | # Families | % Families |
| Less than $10,000 | 216 | 6.8% |
| $10,000 to $14,999 | 92 | 2.9% |
| $15,000 to $24,999 | 140 | 4.4% |
| $25,000 to $34,999 | 535 | 16.8% |
| $35,000 to $49,999 | 318 | 10.0% |
| $50,000 to $74,999 | 382 | 12.0% |
| $75,000 to $99,999 | 481 | 15.1% |
| $100,000 to $149,999 | 637 | 20.0% |
| $150,000 to $199,999 | 194 | 6.1% |
| $200,000+ | 185 | 5.8% |
Family Income by Famaliy Size in Murray
6-person families (42 | 1.3%) account for the highest median family income in Murray with $105,294 per family, while 3-person families (554 | 17.4%) have the highest median income of $30,852 per family member.
| Income Bracket | # Families | Median Income |
| 2-Person Families | 1,644 (51.6%) | $54,167 |
| 3-Person Families | 554 (17.4%) | $92,556 |
| 4-Person Families | 734 (23.1%) | $85,539 |
| 5-Person Families | 198 (6.2%) | $0 |
| 6-Person Families | 42 (1.3%) | $105,294 |
| 7+ Person Families | 11 (0.4%) | $0 |
| Total | 3,183 (100.0%) | $65,829 |
Family Income by Number of Earners in Murray
The median family income in Murray is $65,829, with families comprising 3+ earners (221) having the highest median family income of $146,458, while families with no earners (645) have the lowest median family income of $29,261, accounting for 6.9% and 20.3% of families, respectively.
| Number of Earners | # Families | Median Income |
| No Earners | 645 (20.3%) | $29,261 |
| 1 Earner | 1,104 (34.7%) | $39,847 |
| 2 Earners | 1,213 (38.1%) | $100,297 |
| 3+ Earners | 221 (6.9%) | $146,458 |
| Total | 3,183 (100.0%) | $65,829 |
Household Income in Murray
Household Income Brackets in Murray
With 972 households falling in the category, the less than $10,000 income range is the most frequent in Murray, accounting for 14.7% of all households. In contrast, only 205 households (3.1%) fall into the $150,000 to $199,999 income bracket, making it the least populous group.
| Income Bracket | # Households | % Households |
| Less than $10,000 | 972 | 14.7% |
| $10,000 to $14,999 | 483 | 7.3% |
| $15,000 to $24,999 | 773 | 11.7% |
| $25,000 to $34,999 | 912 | 13.8% |
| $35,000 to $49,999 | 840 | 12.7% |
| $50,000 to $74,999 | 873 | 13.2% |
| $75,000 to $99,999 | 635 | 9.6% |
| $100,000 to $149,999 | 701 | 10.6% |
| $150,000 to $199,999 | 205 | 3.1% |
| $200,000+ | 231 | 3.5% |
Household Income by Householder Age in Murray
The median household income in Murray is $37,421, with the highest median household income of $44,420 found in the 45 to 64 years age bracket for the primary householder. A total of 1,737 households (26.3%) fall into this category. Meanwhile, the 15 to 24 years age bracket for the primary householder has the lowest median household income of $19,348, with 1,206 households (18.2%) in this group.
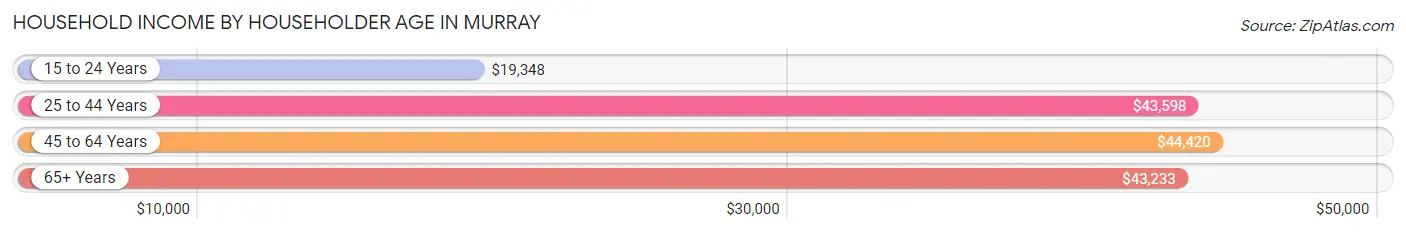
| Income Bracket | # Households | Median Income |
| 15 to 24 Years | 1,206 (18.2%) | $19,348 |
| 25 to 44 Years | 2,264 (34.3%) | $43,598 |
| 45 to 64 Years | 1,737 (26.3%) | $44,420 |
| 65+ Years | 1,404 (21.2%) | $43,233 |
| Total | 6,611 (100.0%) | $37,421 |
Poverty in Murray
Income Below Poverty by Sex and Age in Murray
With 21.9% poverty level for males and 28.5% for females among the residents of Murray, 18 to 24 year old males and 18 to 24 year old females are the most vulnerable to poverty, with 694 males (43.4%) and 840 females (51.7%) in their respective age groups living below the poverty level.
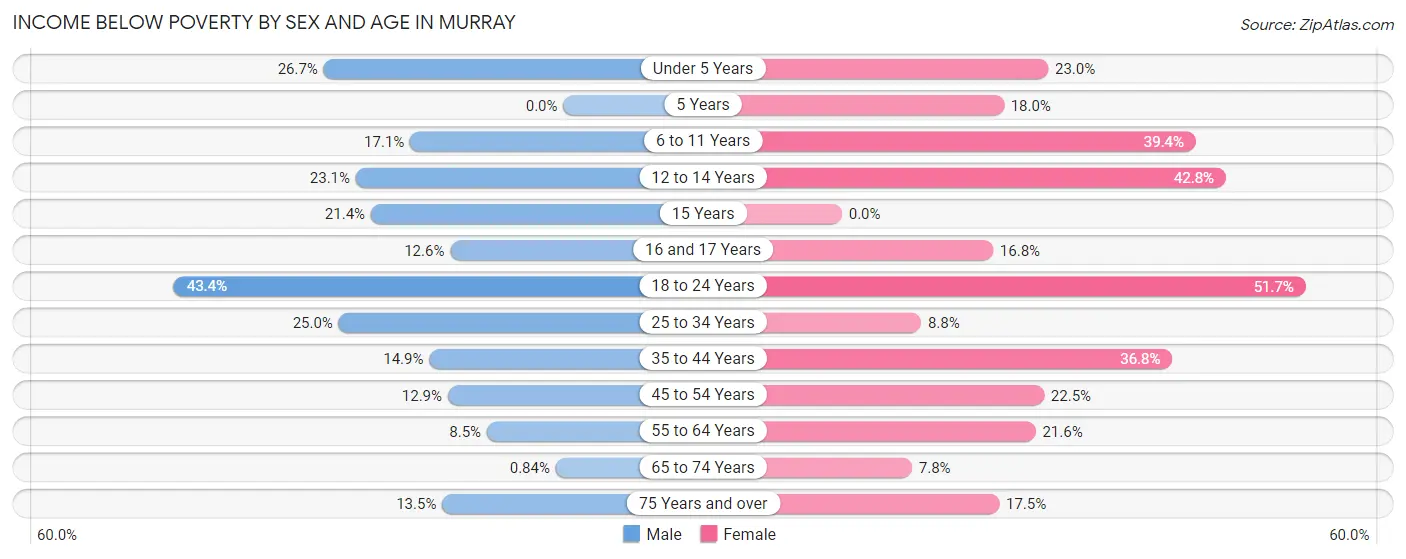
| Age Bracket | Male | Female |
| Under 5 Years | 67 (26.7%) | 82 (23.0%) |
| 5 Years | 0 (0.0%) | 11 (18.0%) |
| 6 to 11 Years | 73 (17.1%) | 194 (39.4%) |
| 12 to 14 Years | 61 (23.1%) | 83 (42.8%) |
| 15 Years | 9 (21.4%) | 0 (0.0%) |
| 16 and 17 Years | 16 (12.6%) | 17 (16.8%) |
| 18 to 24 Years | 694 (43.4%) | 840 (51.7%) |
| 25 to 34 Years | 310 (25.0%) | 89 (8.8%) |
| 35 to 44 Years | 99 (14.9%) | 294 (36.8%) |
| 45 to 54 Years | 85 (12.9%) | 163 (22.5%) |
| 55 to 64 Years | 60 (8.5%) | 162 (21.6%) |
| 65 to 74 Years | 4 (0.8%) | 44 (7.8%) |
| 75 Years and over | 63 (13.5%) | 97 (17.5%) |
| Total | 1,541 (21.9%) | 2,076 (28.5%) |
Income Above Poverty by Sex and Age in Murray
According to the poverty statistics in Murray, males aged 5 years and females aged 15 years are the age groups that are most secure financially, with 100.0% of males and 100.0% of females in these age groups living above the poverty line.
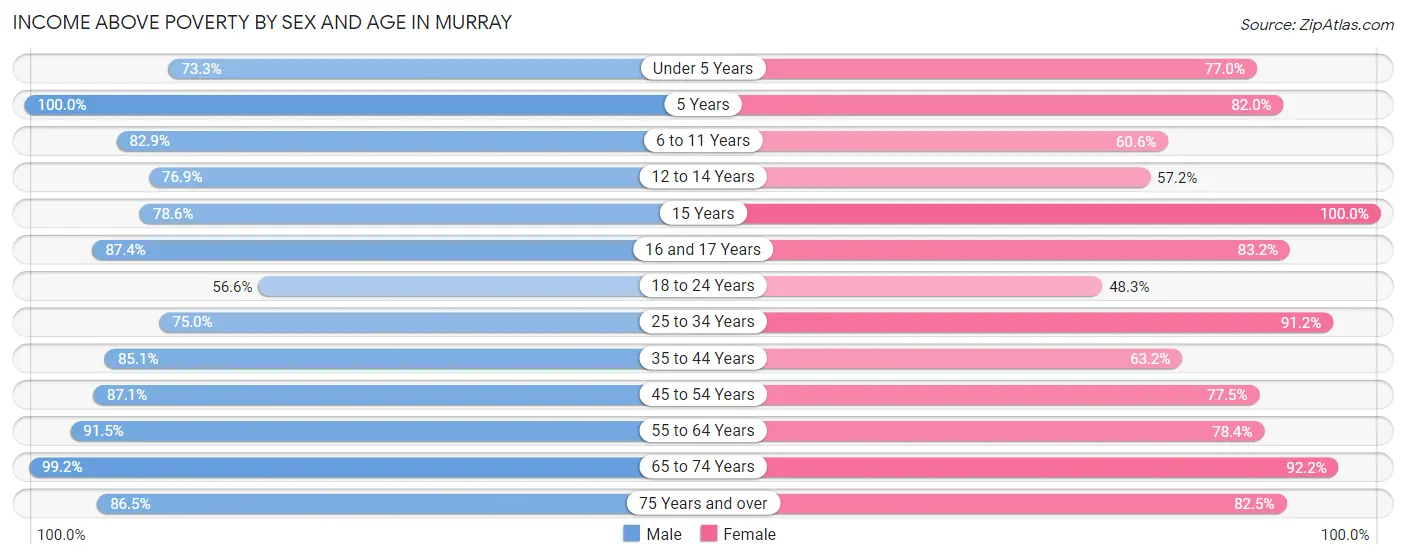
| Age Bracket | Male | Female |
| Under 5 Years | 184 (73.3%) | 275 (77.0%) |
| 5 Years | 119 (100.0%) | 50 (82.0%) |
| 6 to 11 Years | 355 (82.9%) | 298 (60.6%) |
| 12 to 14 Years | 203 (76.9%) | 111 (57.2%) |
| 15 Years | 33 (78.6%) | 39 (100.0%) |
| 16 and 17 Years | 111 (87.4%) | 84 (83.2%) |
| 18 to 24 Years | 906 (56.6%) | 786 (48.3%) |
| 25 to 34 Years | 929 (75.0%) | 920 (91.2%) |
| 35 to 44 Years | 564 (85.1%) | 505 (63.2%) |
| 45 to 54 Years | 576 (87.1%) | 561 (77.5%) |
| 55 to 64 Years | 645 (91.5%) | 589 (78.4%) |
| 65 to 74 Years | 470 (99.2%) | 520 (92.2%) |
| 75 Years and over | 404 (86.5%) | 457 (82.5%) |
| Total | 5,499 (78.1%) | 5,195 (71.5%) |
Income Below Poverty Among Married-Couple Families in Murray
The poverty statistics for married-couple families in Murray show that 4.8% or 102 of the total 2,131 families live below the poverty line. Families with no children have the highest poverty rate of 5.6%, comprising of 65 families. On the other hand, families with 3 or 4 children have the lowest poverty rate of 0.0%, which includes 0 families.
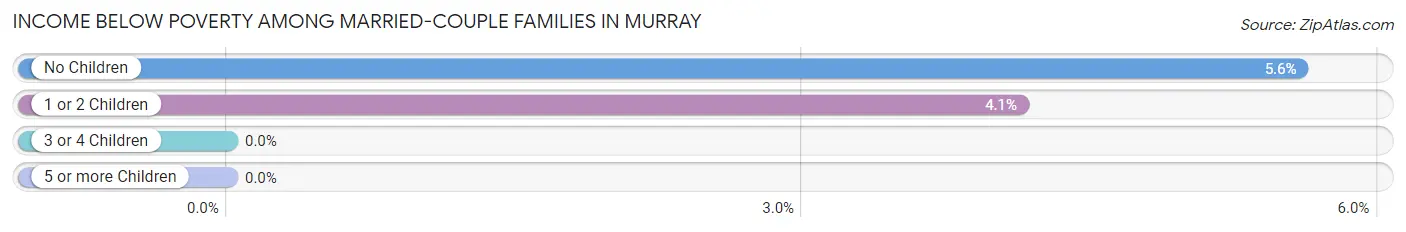
| Children | Above Poverty | Below Poverty |
| No Children | 1,097 (94.4%) | 65 (5.6%) |
| 1 or 2 Children | 859 (95.9%) | 37 (4.1%) |
| 3 or 4 Children | 73 (100.0%) | 0 (0.0%) |
| 5 or more Children | 0 (0.0%) | 0 (0.0%) |
| Total | 2,029 (95.2%) | 102 (4.8%) |
Income Below Poverty Among Single-Parent Households in Murray
According to the poverty data in Murray, 21.2% or 76 single-father households and 42.2% or 293 single-mother households are living below the poverty line. Among single-father households, those with 1 or 2 children have the highest poverty rate, with 64 households (26.8%) experiencing poverty. Likewise, among single-mother households, those with 3 or 4 children have the highest poverty rate, with 52 households (70.3%) falling below the poverty line.
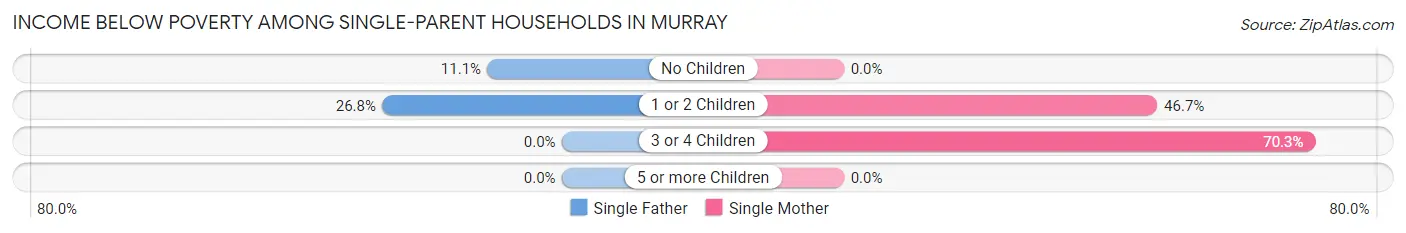
| Children | Single Father | Single Mother |
| No Children | 12 (11.1%) | 0 (0.0%) |
| 1 or 2 Children | 64 (26.8%) | 241 (46.7%) |
| 3 or 4 Children | 0 (0.0%) | 52 (70.3%) |
| 5 or more Children | 0 (0.0%) | 0 (0.0%) |
| Total | 76 (21.2%) | 293 (42.2%) |
Income Below Poverty Among Married-Couple vs Single-Parent Households in Murray
The poverty data for Murray shows that 102 of the married-couple family households (4.8%) and 369 of the single-parent households (35.1%) are living below the poverty level. Within the married-couple family households, those with no children have the highest poverty rate, with 65 households (5.6%) falling below the poverty line. Among the single-parent households, those with 3 or 4 children have the highest poverty rate, with 52 household (61.2%) living below poverty.
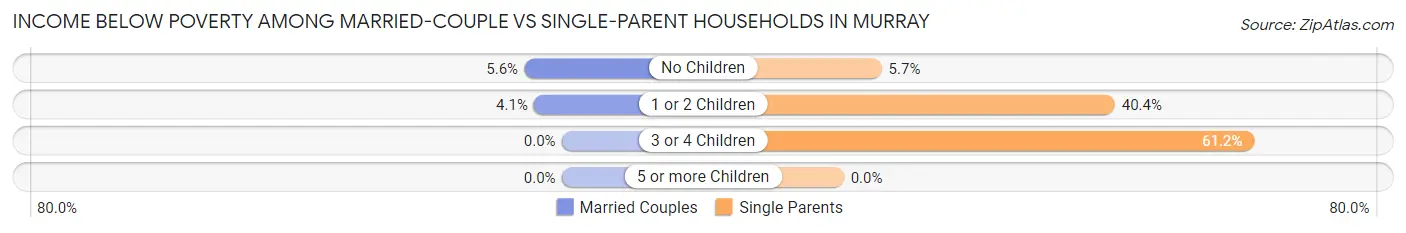
| Children | Married-Couple Families | Single-Parent Households |
| No Children | 65 (5.6%) | 12 (5.7%) |
| 1 or 2 Children | 37 (4.1%) | 305 (40.4%) |
| 3 or 4 Children | 0 (0.0%) | 52 (61.2%) |
| 5 or more Children | 0 (0.0%) | 0 (0.0%) |
| Total | 102 (4.8%) | 369 (35.1%) |
Race in Murray
The most populous races in Murray are White / Caucasian (14,771 | 84.8%), Black / African American (1,109 | 6.4%), and Two or more Races (589 | 3.4%).
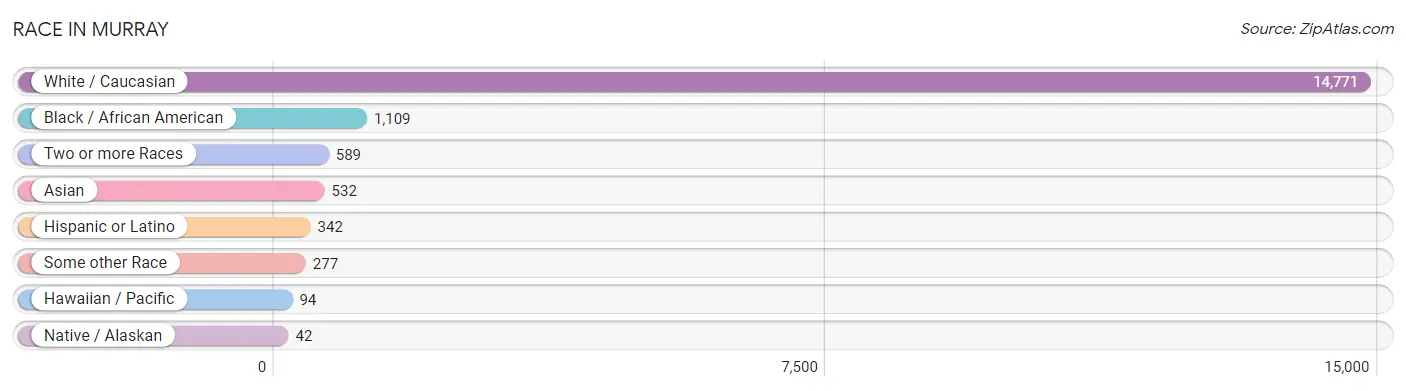
| Race | # Population | % Population |
| Asian | 532 | 3.1% |
| Black / African American | 1,109 | 6.4% |
| Hawaiian / Pacific | 94 | 0.5% |
| Hispanic or Latino | 342 | 2.0% |
| Native / Alaskan | 42 | 0.2% |
| White / Caucasian | 14,771 | 84.8% |
| Two or more Races | 589 | 3.4% |
| Some other Race | 277 | 1.6% |
| Total | 17,414 | 100.0% |
Ancestry in Murray
The most populous ancestries reported in Murray are English (4,574 | 26.3%), American (1,779 | 10.2%), German (1,658 | 9.5%), Irish (1,427 | 8.2%), and European (692 | 4.0%), together accounting for 58.2% of all Murray residents.
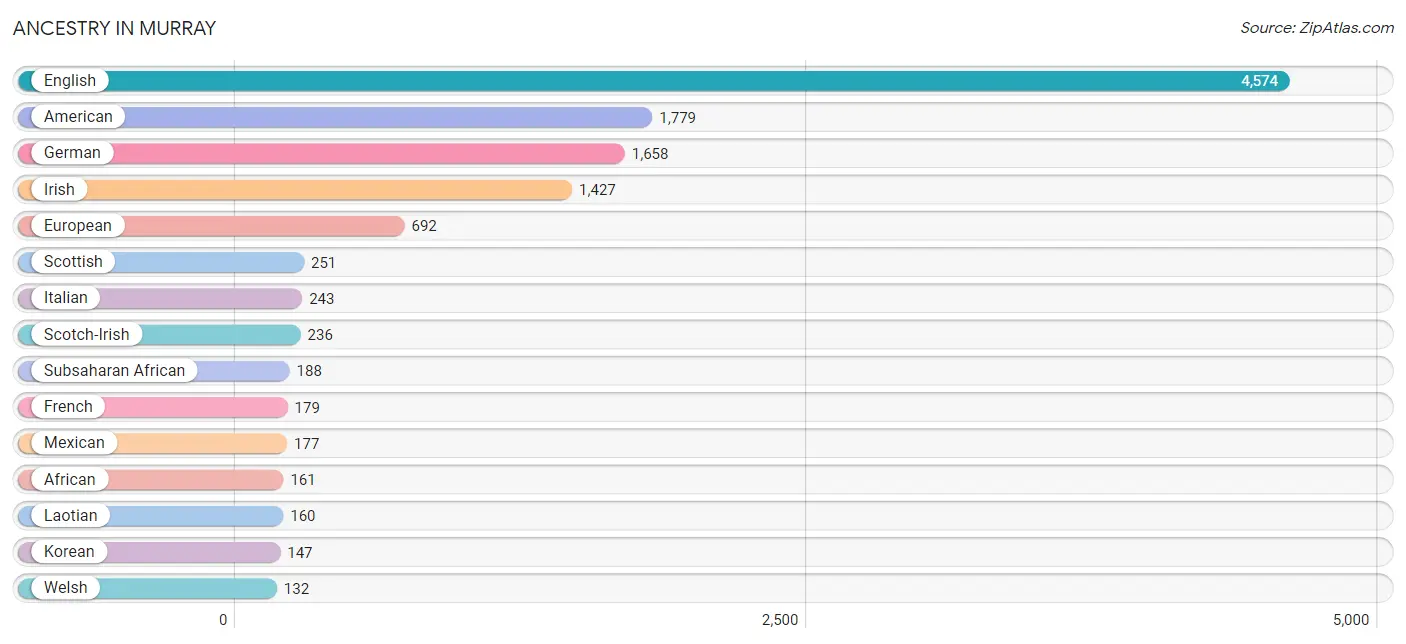
| Ancestry | # Population | % Population |
| African | 161 | 0.9% |
| American | 1,779 | 10.2% |
| Arab | 38 | 0.2% |
| Austrian | 10 | 0.1% |
| Bahamian | 41 | 0.2% |
| Belizean | 40 | 0.2% |
| Bhutanese | 45 | 0.3% |
| Blackfeet | 14 | 0.1% |
| Bolivian | 6 | 0.0% |
| British | 119 | 0.7% |
| Burmese | 73 | 0.4% |
| Central American | 3 | 0.0% |
| Cherokee | 78 | 0.4% |
| Choctaw | 25 | 0.1% |
| Colombian | 11 | 0.1% |
| Creek | 4 | 0.0% |
| Croatian | 4 | 0.0% |
| Cuban | 20 | 0.1% |
| Danish | 19 | 0.1% |
| Dominican | 16 | 0.1% |
| Dutch | 129 | 0.7% |
| Eastern European | 11 | 0.1% |
| English | 4,574 | 26.3% |
| European | 692 | 4.0% |
| French | 179 | 1.0% |
| French Canadian | 35 | 0.2% |
| German | 1,658 | 9.5% |
| Greek | 79 | 0.4% |
| Guatemalan | 3 | 0.0% |
| Indian (Asian) | 15 | 0.1% |
| Irish | 1,427 | 8.2% |
| Italian | 243 | 1.4% |
| Japanese | 119 | 0.7% |
| Korean | 147 | 0.8% |
| Laotian | 160 | 0.9% |
| Lithuanian | 18 | 0.1% |
| Mexican | 177 | 1.0% |
| Native Hawaiian | 94 | 0.5% |
| New Zealander | 12 | 0.1% |
| Nigerian | 27 | 0.2% |
| Norwegian | 87 | 0.5% |
| Polish | 95 | 0.5% |
| Puerto Rican | 48 | 0.3% |
| Russian | 40 | 0.2% |
| Samoan | 10 | 0.1% |
| Scandinavian | 48 | 0.3% |
| Scotch-Irish | 236 | 1.4% |
| Scottish | 251 | 1.4% |
| South American | 17 | 0.1% |
| Spanish | 21 | 0.1% |
| Sri Lankan | 11 | 0.1% |
| Subsaharan African | 188 | 1.1% |
| Swedish | 108 | 0.6% |
| Swiss | 11 | 0.1% |
| Thai | 53 | 0.3% |
| Trinidadian and Tobagonian | 11 | 0.1% |
| Turkish | 8 | 0.1% |
| Welsh | 132 | 0.8% | View All 58 Rows |
Immigrants in Murray
The most numerous immigrant groups reported in Murray came from Asia (457 | 2.6%), South Eastern Asia (362 | 2.1%), Latin America (168 | 1.0%), Central America (157 | 0.9%), and Philippines (147 | 0.8%), together accounting for 7.4% of all Murray residents.
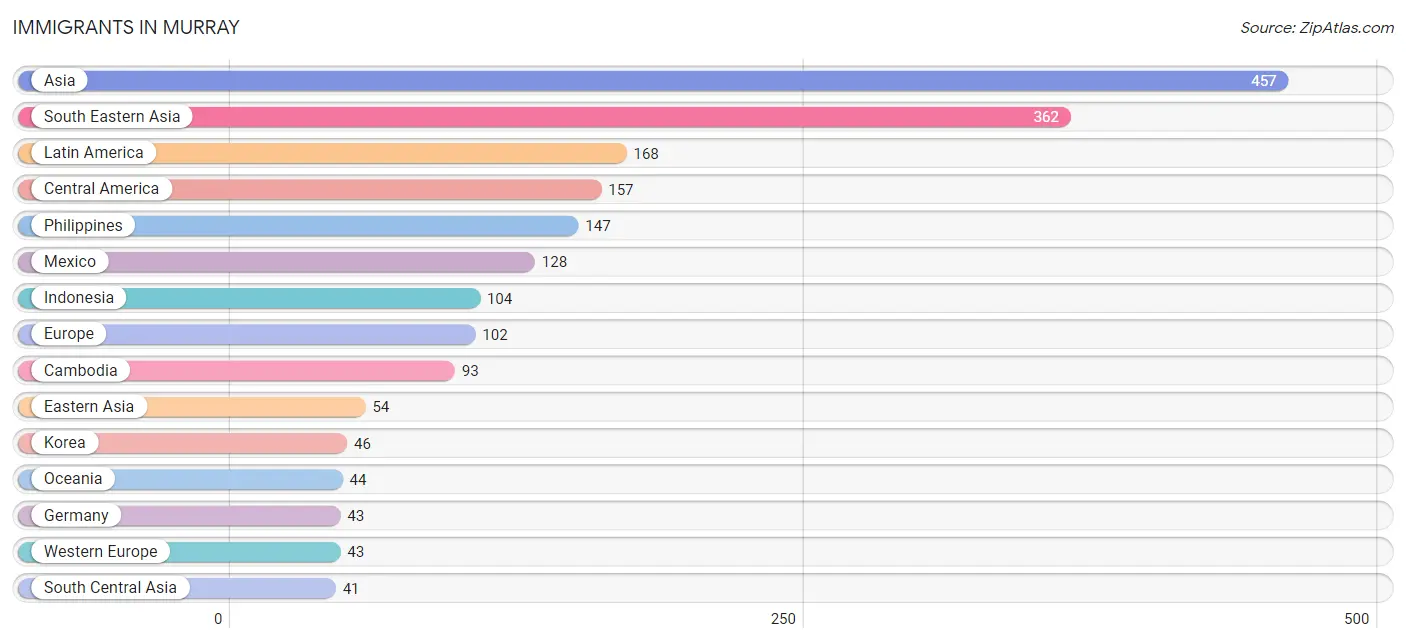
| Immigration Origin | # Population | % Population |
| Africa | 27 | 0.2% |
| Asia | 457 | 2.6% |
| Australia | 32 | 0.2% |
| Cambodia | 93 | 0.5% |
| Canada | 8 | 0.1% |
| Caribbean | 11 | 0.1% |
| Central America | 157 | 0.9% |
| China | 8 | 0.1% |
| Eastern Asia | 54 | 0.3% |
| Eastern Europe | 35 | 0.2% |
| Europe | 102 | 0.6% |
| Germany | 43 | 0.3% |
| Guatemala | 29 | 0.2% |
| India | 34 | 0.2% |
| Indonesia | 104 | 0.6% |
| Italy | 24 | 0.1% |
| Korea | 46 | 0.3% |
| Latin America | 168 | 1.0% |
| Mexico | 128 | 0.7% |
| Nigeria | 27 | 0.2% |
| Oceania | 44 | 0.3% |
| Philippines | 147 | 0.8% |
| Russia | 35 | 0.2% |
| South Central Asia | 41 | 0.2% |
| South Eastern Asia | 362 | 2.1% |
| Southern Europe | 24 | 0.1% |
| Trinidad and Tobago | 11 | 0.1% |
| Uzbekistan | 7 | 0.0% |
| Vietnam | 11 | 0.1% |
| Western Africa | 27 | 0.2% |
| Western Europe | 43 | 0.3% | View All 31 Rows |
Sex and Age in Murray
Sex and Age in Murray
The most populous age groups in Murray are 20 to 24 Years (1,755 | 21.1%) for men and 20 to 24 Years (1,874 | 20.6%) for women.
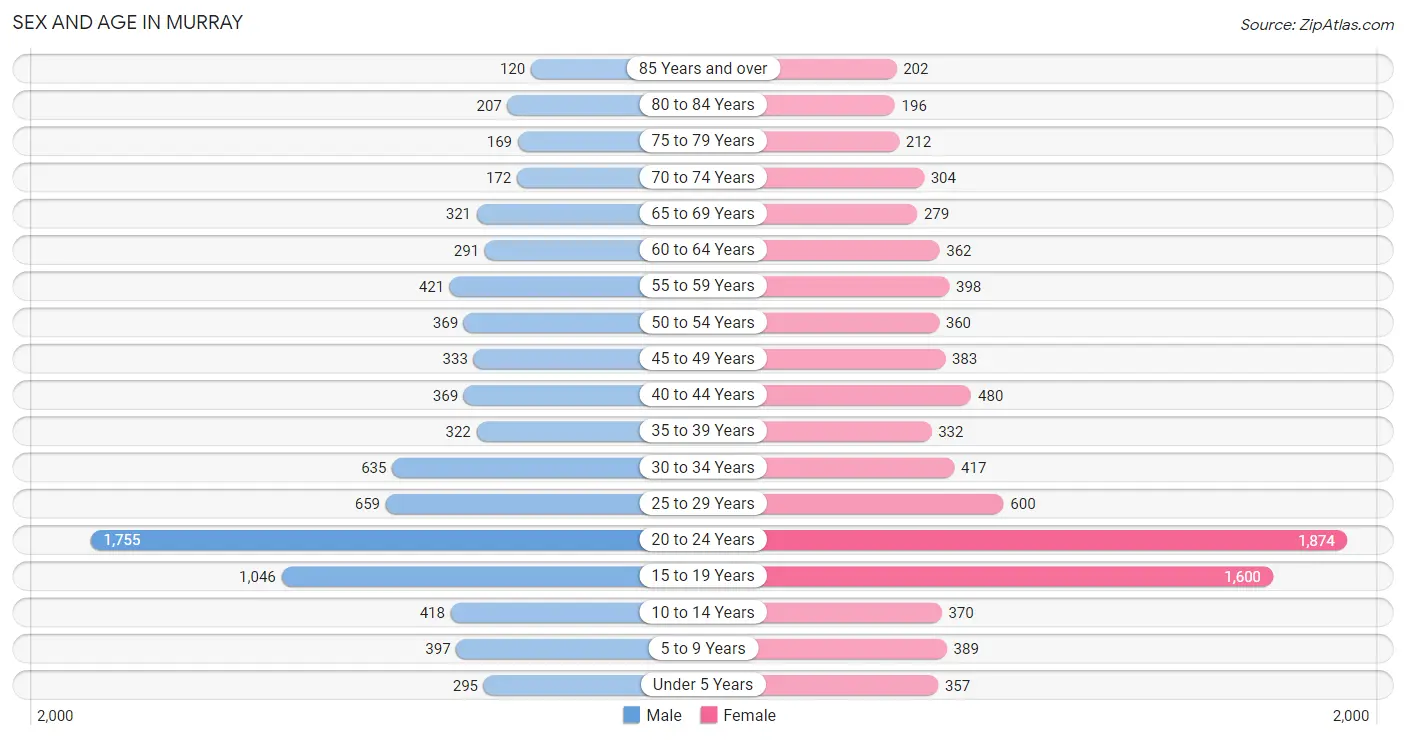
| Age Bracket | Male | Female |
| Under 5 Years | 295 (3.5%) | 357 (3.9%) |
| 5 to 9 Years | 397 (4.8%) | 389 (4.3%) |
| 10 to 14 Years | 418 (5.0%) | 370 (4.1%) |
| 15 to 19 Years | 1,046 (12.6%) | 1,600 (17.5%) |
| 20 to 24 Years | 1,755 (21.1%) | 1,874 (20.6%) |
| 25 to 29 Years | 659 (7.9%) | 600 (6.6%) |
| 30 to 34 Years | 635 (7.6%) | 417 (4.6%) |
| 35 to 39 Years | 322 (3.9%) | 332 (3.6%) |
| 40 to 44 Years | 369 (4.4%) | 480 (5.3%) |
| 45 to 49 Years | 333 (4.0%) | 383 (4.2%) |
| 50 to 54 Years | 369 (4.4%) | 360 (4.0%) |
| 55 to 59 Years | 421 (5.1%) | 398 (4.4%) |
| 60 to 64 Years | 291 (3.5%) | 362 (4.0%) |
| 65 to 69 Years | 321 (3.9%) | 279 (3.1%) |
| 70 to 74 Years | 172 (2.1%) | 304 (3.3%) |
| 75 to 79 Years | 169 (2.0%) | 212 (2.3%) |
| 80 to 84 Years | 207 (2.5%) | 196 (2.1%) |
| 85 Years and over | 120 (1.5%) | 202 (2.2%) |
| Total | 8,299 (100.0%) | 9,115 (100.0%) |
Families and Households in Murray
Median Family Size in Murray
The median family size in Murray is 2.93 persons per family, with married-couple families (2,131 | 66.9%) accounting for the largest median family size of 3.05 persons per family. On the other hand, single male/father families (358 | 11.3%) represent the smallest median family size with 2.21 persons per family.
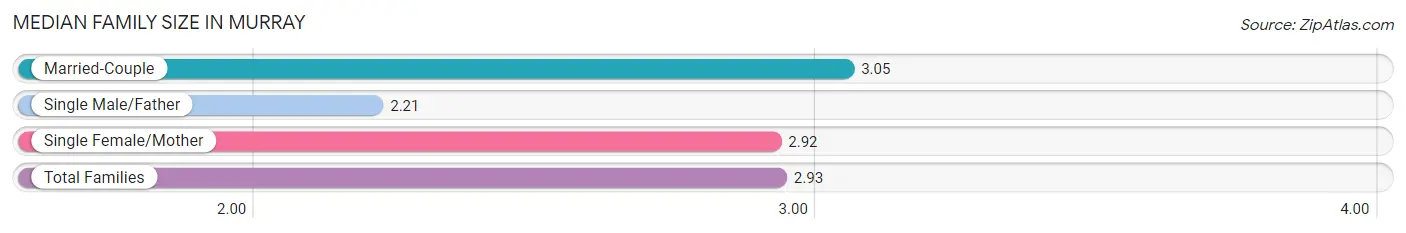
| Family Type | # Families | Family Size |
| Married-Couple | 2,131 (66.9%) | 3.05 |
| Single Male/Father | 358 (11.3%) | 2.21 |
| Single Female/Mother | 694 (21.8%) | 2.92 |
| Total Families | 3,183 (100.0%) | 2.93 |
Median Household Size in Murray
The median household size in Murray is 2.17 persons per household, with single female/mother households (694 | 10.5%) accounting for the largest median household size of 3.09 persons per household. non-family households (3,428 | 51.8%) represent the smallest median household size with 1.38 persons per household.
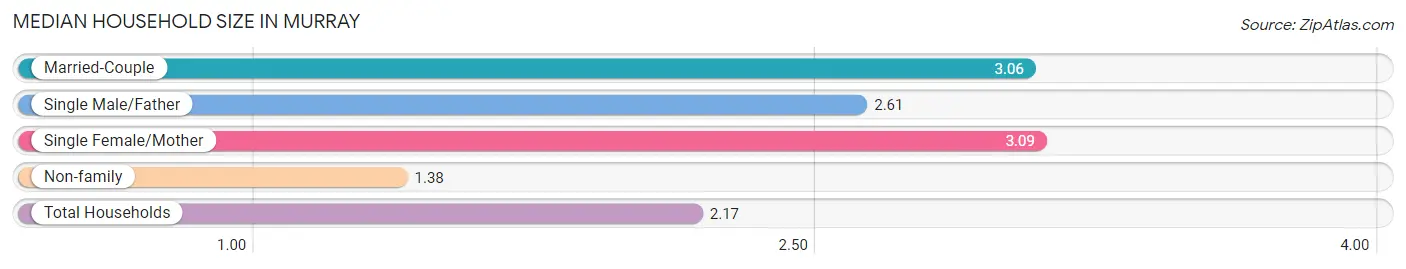
| Household Type | # Households | Household Size |
| Married-Couple | 2,131 (32.2%) | 3.06 |
| Single Male/Father | 358 (5.4%) | 2.61 |
| Single Female/Mother | 694 (10.5%) | 3.09 |
| Non-family | 3,428 (51.8%) | 1.38 |
| Total Households | 6,611 (100.0%) | 2.17 |
Household Size by Marriage Status in Murray
Out of a total of 6,611 households in Murray, 3,183 (48.1%) are family households, while 3,428 (51.8%) are nonfamily households. The most numerous type of family households are 2-person households, comprising 1,421, and the most common type of nonfamily households are 1-person households, comprising 2,503.
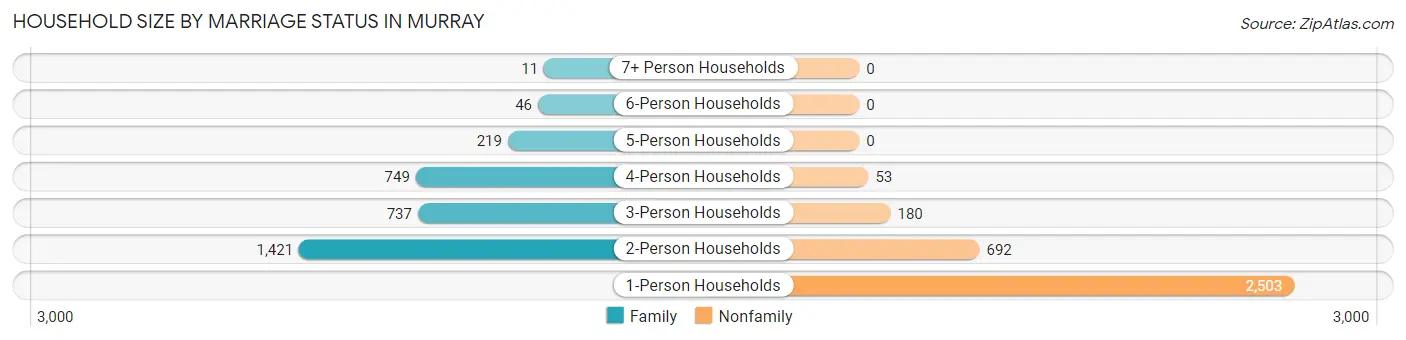
| Household Size | Family Households | Nonfamily Households |
| 1-Person Households | - | 2,503 (37.9%) |
| 2-Person Households | 1,421 (21.5%) | 692 (10.5%) |
| 3-Person Households | 737 (11.2%) | 180 (2.7%) |
| 4-Person Households | 749 (11.3%) | 53 (0.8%) |
| 5-Person Households | 219 (3.3%) | 0 (0.0%) |
| 6-Person Households | 46 (0.7%) | 0 (0.0%) |
| 7+ Person Households | 11 (0.2%) | 0 (0.0%) |
| Total | 3,183 (48.1%) | 3,428 (51.8%) |
Female Fertility in Murray
Fertility by Age in Murray
Average fertility rate in Murray is 60.0 births per 1,000 women. Women in the age bracket of 20 to 34 years have the highest fertility rate with 109.0 births per 1,000 women. Women in the age bracket of 20 to 34 years acount for 90.5% of all women with births.
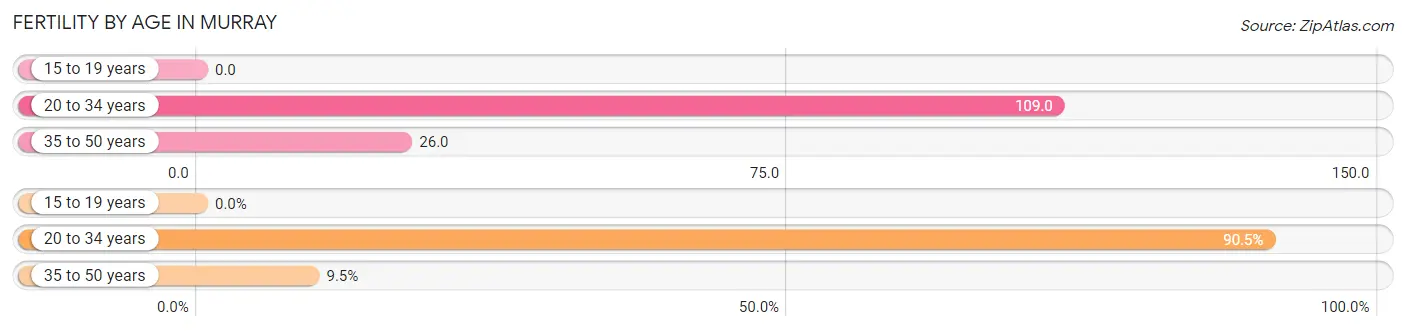
| Age Bracket | Women with Births | Births / 1,000 Women |
| 15 to 19 years | 0 (0.0%) | 0.0 |
| 20 to 34 years | 316 (90.5%) | 109.0 |
| 35 to 50 years | 33 (9.5%) | 26.0 |
| Total | 349 (100.0%) | 60.0 |
Fertility by Age by Marriage Status in Murray
61.0% of women with births (349) in Murray are married. The highest percentage of unmarried women with births falls into 20 to 34 years age bracket with 42.4% of them unmarried at the time of birth, while the lowest percentage of unmarried women with births belong to 35 to 50 years age bracket with 6.1% of them unmarried.
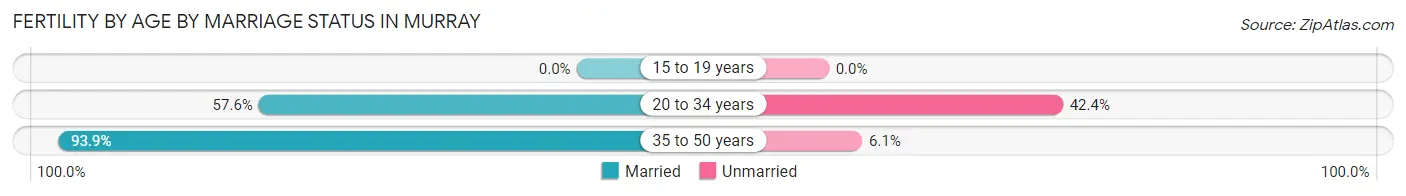
| Age Bracket | Married | Unmarried |
| 15 to 19 years | 0 (0.0%) | 0 (0.0%) |
| 20 to 34 years | 182 (57.6%) | 134 (42.4%) |
| 35 to 50 years | 31 (93.9%) | 2 (6.1%) |
| Total | 213 (61.0%) | 136 (39.0%) |
Fertility by Education in Murray
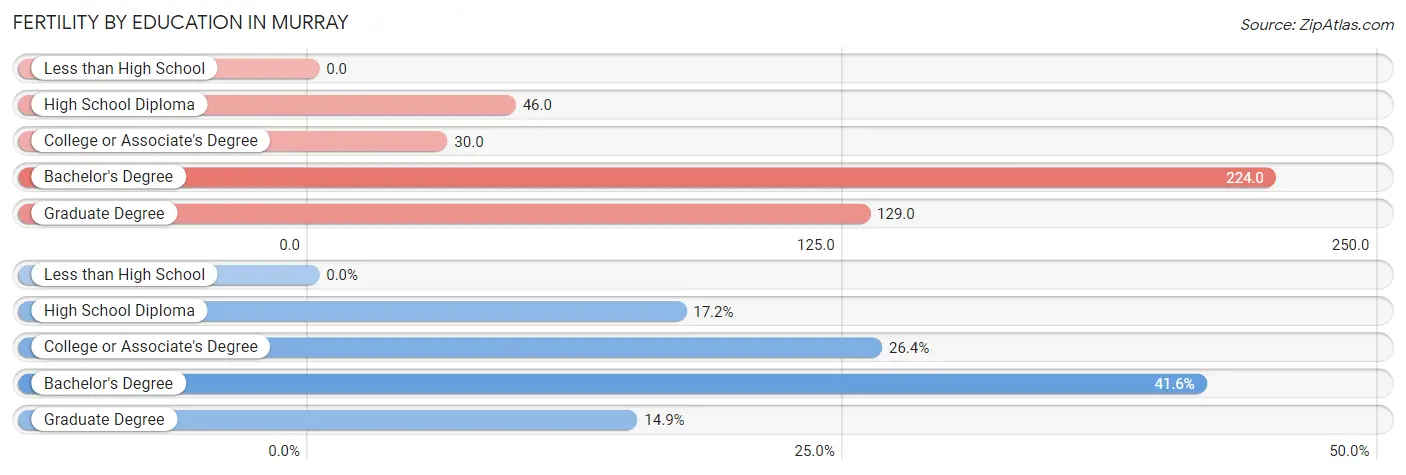
| Educational Attainment | Women with Births | Births / 1,000 Women |
| Less than High School | 0 (0.0%) | 0.0 |
| High School Diploma | 60 (17.2%) | 46.0 |
| College or Associate's Degree | 92 (26.4%) | 30.0 |
| Bachelor's Degree | 145 (41.5%) | 224.0 |
| Graduate Degree | 52 (14.9%) | 129.0 |
| Total | 349 (100.0%) | 60.0 |
Fertility by Education by Marriage Status in Murray
39.0% of women with births in Murray are unmarried. Women with the educational attainment of bachelor's degree are most likely to be married with 100.0% of them married at childbirth, while women with the educational attainment of high school diploma are least likely to be married with 100.0% of them unmarried at childbirth.
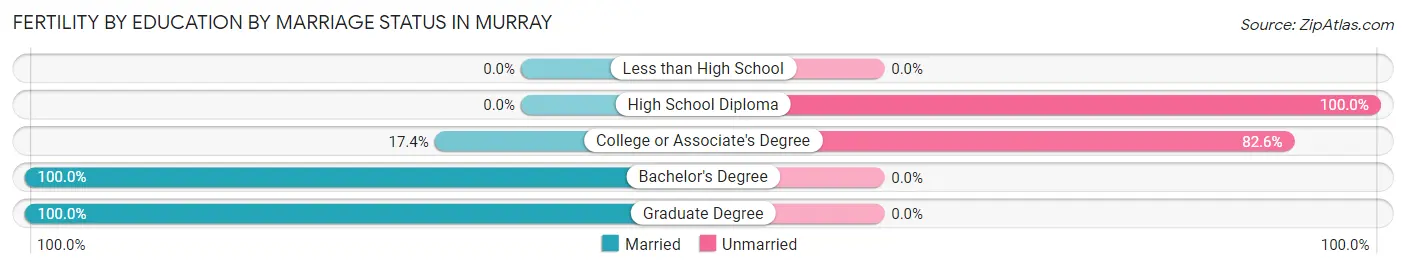
| Educational Attainment | Married | Unmarried |
| Less than High School | 0 (0.0%) | 0 (0.0%) |
| High School Diploma | 0 (0.0%) | 60 (100.0%) |
| College or Associate's Degree | 16 (17.4%) | 76 (82.6%) |
| Bachelor's Degree | 145 (100.0%) | 0 (0.0%) |
| Graduate Degree | 52 (100.0%) | 0 (0.0%) |
| Total | 213 (61.0%) | 136 (39.0%) |
Employment Characteristics in Murray
Employment by Class of Employer in Murray
Among the 8,171 employed individuals in Murray, private company employees (5,652 | 69.2%), state government employees (1,094 | 13.4%), and not-for-profit organizations (446 | 5.5%) make up the most common classes of employment.
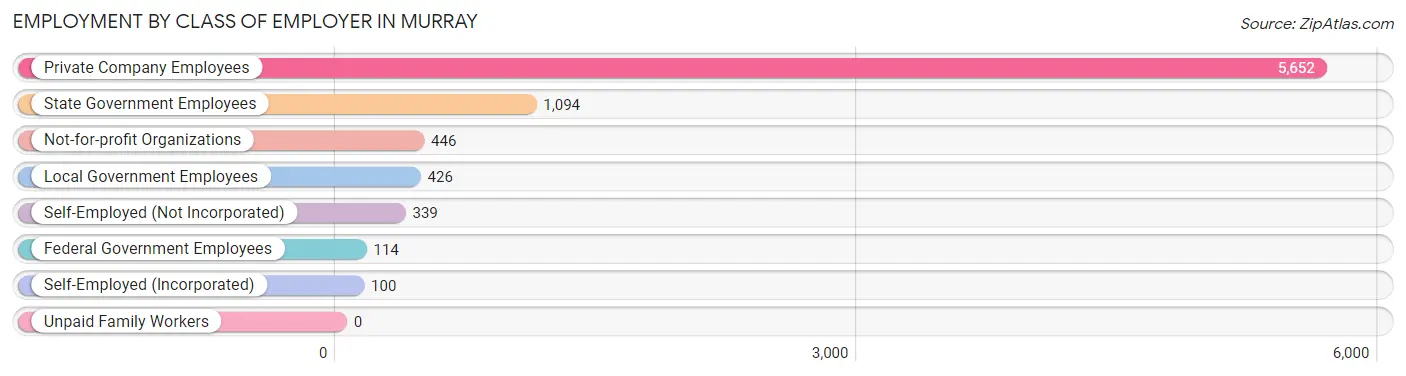
| Employer Class | # Employees | % Employees |
| Private Company Employees | 5,652 | 69.2% |
| Self-Employed (Incorporated) | 100 | 1.2% |
| Self-Employed (Not Incorporated) | 339 | 4.2% |
| Not-for-profit Organizations | 446 | 5.5% |
| Local Government Employees | 426 | 5.2% |
| State Government Employees | 1,094 | 13.4% |
| Federal Government Employees | 114 | 1.4% |
| Unpaid Family Workers | 0 | 0.0% |
| Total | 8,171 | 100.0% |
Employment Status by Age in Murray
According to the labor force statistics for Murray, out of the total population over 16 years of age (15,105), 57.5% or 8,685 individuals are in the labor force, with 5.1% or 443 of them unemployed. The age group with the highest labor force participation rate is 30 to 34 years, with 79.8% or 839 individuals in the labor force. Within the labor force, the 20 to 24 years age range has the highest percentage of unemployed individuals, with 8.7% or 217 of them being unemployed.
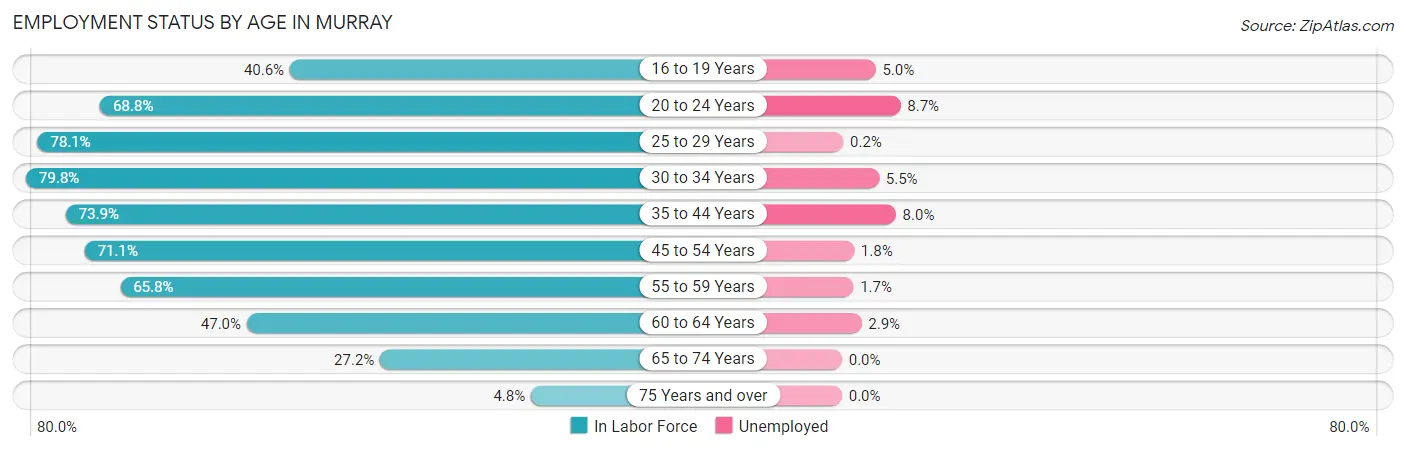
| Age Bracket | In Labor Force | Unemployed |
| 16 to 19 Years | 1,041 (40.6%) | 52 (5.0%) |
| 20 to 24 Years | 2,497 (68.8%) | 217 (8.7%) |
| 25 to 29 Years | 983 (78.1%) | 2 (0.2%) |
| 30 to 34 Years | 839 (79.8%) | 46 (5.5%) |
| 35 to 44 Years | 1,111 (73.9%) | 89 (8.0%) |
| 45 to 54 Years | 1,027 (71.1%) | 18 (1.8%) |
| 55 to 59 Years | 539 (65.8%) | 9 (1.7%) |
| 60 to 64 Years | 307 (47.0%) | 9 (2.9%) |
| 65 to 74 Years | 293 (27.2%) | 0 (0.0%) |
| 75 Years and over | 53 (4.8%) | 0 (0.0%) |
| Total | 8,685 (57.5%) | 443 (5.1%) |
Employment Status by Educational Attainment in Murray
According to labor force statistics for Murray, 71.4% of individuals (4,806) out of the total population between 25 and 64 years of age (6,731) are in the labor force, with 3.6% or 173 of them being unemployed. The group with the highest labor force participation rate are those with the educational attainment of bachelor's degree or higher, with 86.1% or 2,154 individuals in the labor force. Within the labor force, individuals with high school diploma education have the highest percentage of unemployment, with 10.7% or 107 of them being unemployed.
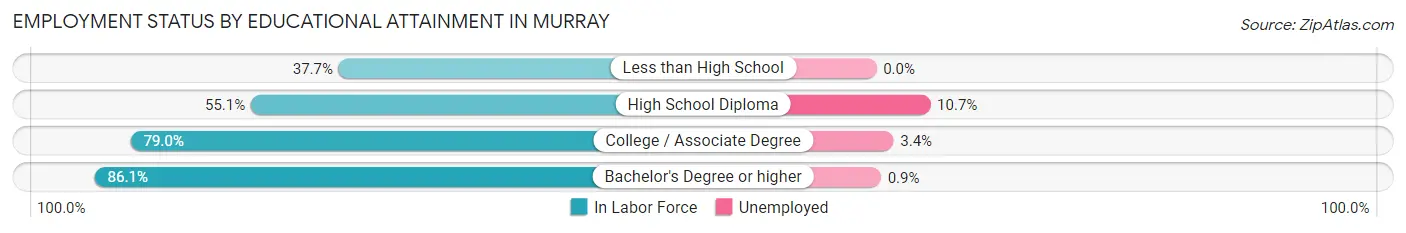
| Educational Attainment | In Labor Force | Unemployed |
| Less than High School | 232 (37.7%) | 0 (0.0%) |
| High School Diploma | 1,003 (55.1%) | 195 (10.7%) |
| College / Associate Degree | 1,416 (79.0%) | 61 (3.4%) |
| Bachelor's Degree or higher | 2,154 (86.1%) | 23 (0.9%) |
| Total | 4,806 (71.4%) | 242 (3.6%) |
Employment Occupations by Sex in Murray
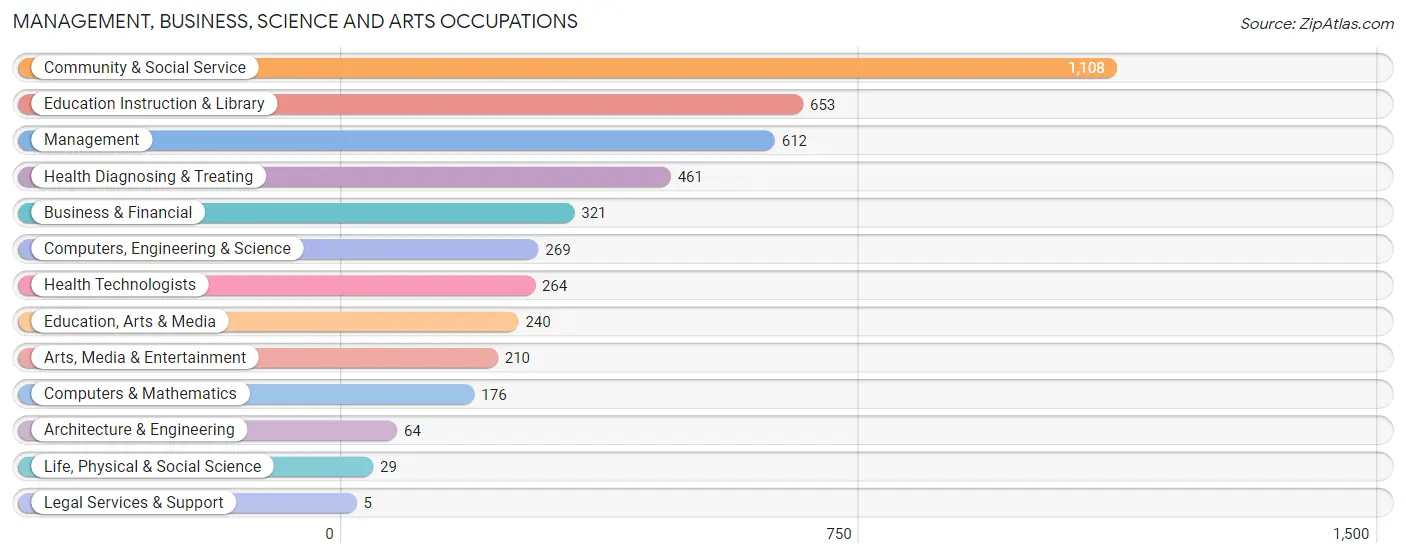
Management, Business, Science and Arts Occupations
The most common Management, Business, Science and Arts occupations in Murray are Community & Social Service (1,108 | 13.4%), Education Instruction & Library (653 | 7.9%), Management (612 | 7.4%), Health Diagnosing & Treating (461 | 5.6%), and Business & Financial (321 | 3.9%).
Management, Business, Science and Arts Occupations by Sex
Within the Management, Business, Science and Arts occupations in Murray, the most male-oriented occupations are Architecture & Engineering (100.0%), Legal Services & Support (100.0%), and Life, Physical & Social Science (93.1%), while the most female-oriented occupations are Health Technologists (81.1%), Health Diagnosing & Treating (79.8%), and Education Instruction & Library (75.0%).
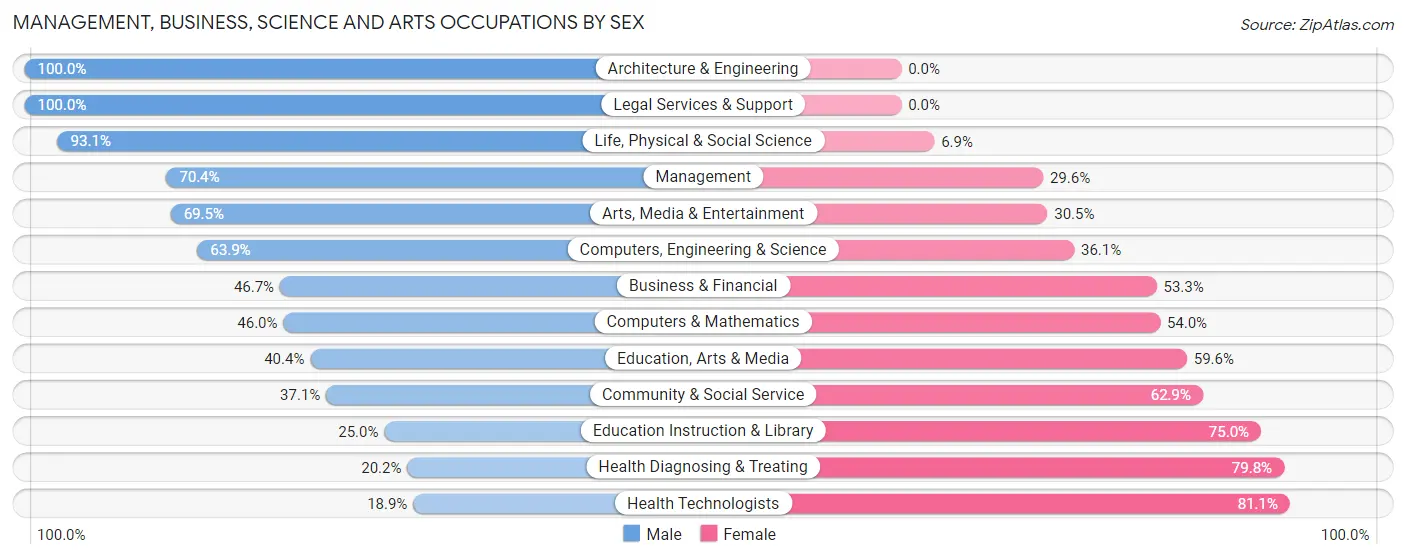
| Occupation | Male | Female |
| Management | 431 (70.4%) | 181 (29.6%) |
| Business & Financial | 150 (46.7%) | 171 (53.3%) |
| Computers, Engineering & Science | 172 (63.9%) | 97 (36.1%) |
| Computers & Mathematics | 81 (46.0%) | 95 (54.0%) |
| Architecture & Engineering | 64 (100.0%) | 0 (0.0%) |
| Life, Physical & Social Science | 27 (93.1%) | 2 (6.9%) |
| Community & Social Service | 411 (37.1%) | 697 (62.9%) |
| Education, Arts & Media | 97 (40.4%) | 143 (59.6%) |
| Legal Services & Support | 5 (100.0%) | 0 (0.0%) |
| Education Instruction & Library | 163 (25.0%) | 490 (75.0%) |
| Arts, Media & Entertainment | 146 (69.5%) | 64 (30.5%) |
| Health Diagnosing & Treating | 93 (20.2%) | 368 (79.8%) |
| Health Technologists | 50 (18.9%) | 214 (81.1%) |
| Total (Category) | 1,257 (45.4%) | 1,514 (54.6%) |
| Total (Overall) | 3,811 (46.2%) | 4,437 (53.8%) |
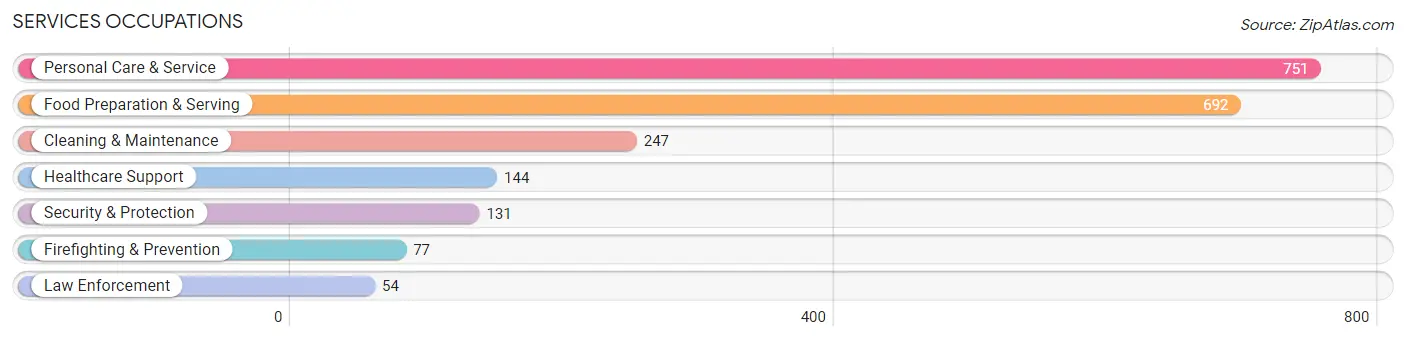
Services Occupations
The most common Services occupations in Murray are Personal Care & Service (751 | 9.1%), Food Preparation & Serving (692 | 8.4%), Cleaning & Maintenance (247 | 3.0%), Healthcare Support (144 | 1.8%), and Security & Protection (131 | 1.6%).
Services Occupations by Sex
Within the Services occupations in Murray, the most male-oriented occupations are Security & Protection (100.0%), Firefighting & Prevention (100.0%), and Law Enforcement (100.0%), while the most female-oriented occupations are Healthcare Support (88.9%), Food Preparation & Serving (70.8%), and Personal Care & Service (66.8%).
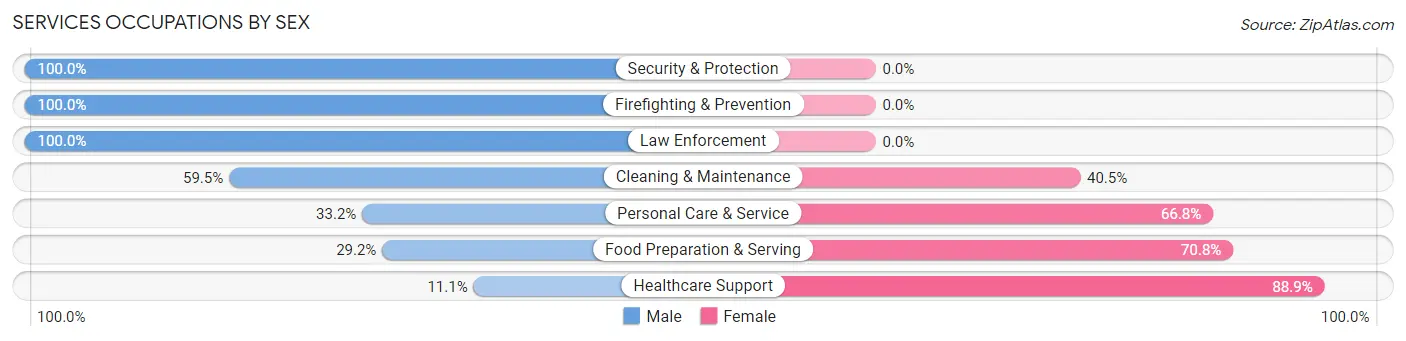
| Occupation | Male | Female |
| Healthcare Support | 16 (11.1%) | 128 (88.9%) |
| Security & Protection | 131 (100.0%) | 0 (0.0%) |
| Firefighting & Prevention | 77 (100.0%) | 0 (0.0%) |
| Law Enforcement | 54 (100.0%) | 0 (0.0%) |
| Food Preparation & Serving | 202 (29.2%) | 490 (70.8%) |
| Cleaning & Maintenance | 147 (59.5%) | 100 (40.5%) |
| Personal Care & Service | 249 (33.2%) | 502 (66.8%) |
| Total (Category) | 745 (37.9%) | 1,220 (62.1%) |
| Total (Overall) | 3,811 (46.2%) | 4,437 (53.8%) |
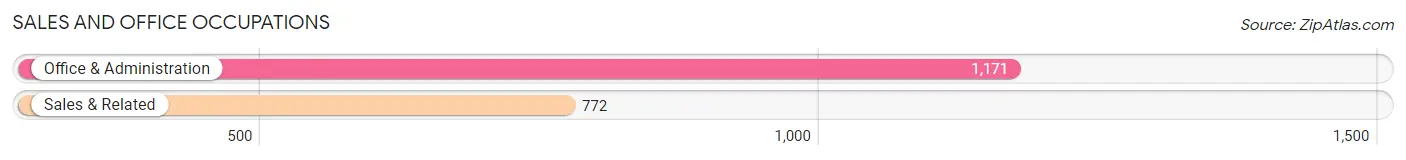
Sales and Office Occupations
The most common Sales and Office occupations in Murray are Office & Administration (1,171 | 14.2%), and Sales & Related (772 | 9.4%).
Sales and Office Occupations by Sex
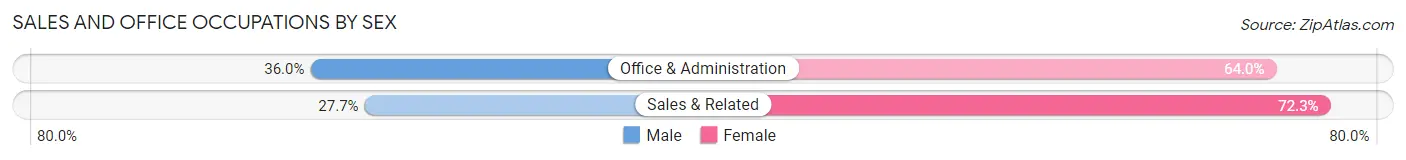
| Occupation | Male | Female |
| Sales & Related | 214 (27.7%) | 558 (72.3%) |
| Office & Administration | 422 (36.0%) | 749 (64.0%) |
| Total (Category) | 636 (32.7%) | 1,307 (67.3%) |
| Total (Overall) | 3,811 (46.2%) | 4,437 (53.8%) |
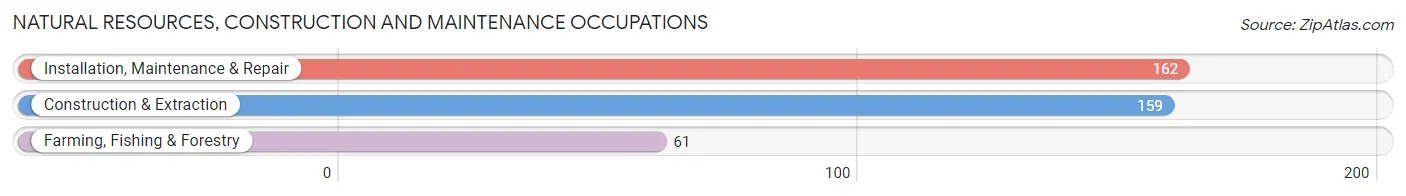
Natural Resources, Construction and Maintenance Occupations
The most common Natural Resources, Construction and Maintenance occupations in Murray are Installation, Maintenance & Repair (162 | 2.0%), Construction & Extraction (159 | 1.9%), and Farming, Fishing & Forestry (61 | 0.7%).
Natural Resources, Construction and Maintenance Occupations by Sex
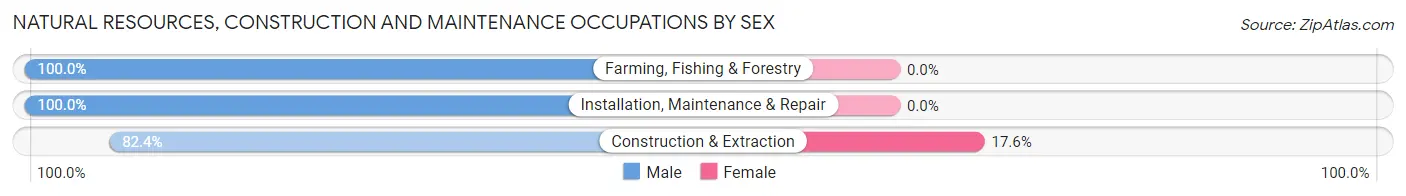
| Occupation | Male | Female |
| Farming, Fishing & Forestry | 61 (100.0%) | 0 (0.0%) |
| Construction & Extraction | 131 (82.4%) | 28 (17.6%) |
| Installation, Maintenance & Repair | 162 (100.0%) | 0 (0.0%) |
| Total (Category) | 354 (92.7%) | 28 (7.3%) |
| Total (Overall) | 3,811 (46.2%) | 4,437 (53.8%) |
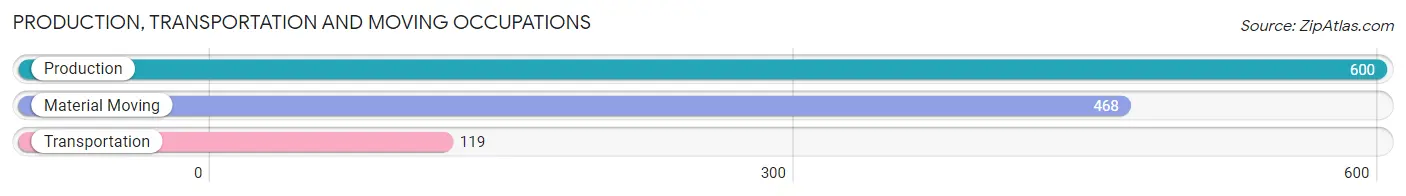
Production, Transportation and Moving Occupations
The most common Production, Transportation and Moving occupations in Murray are Production (600 | 7.3%), Material Moving (468 | 5.7%), and Transportation (119 | 1.4%).
Production, Transportation and Moving Occupations by Sex
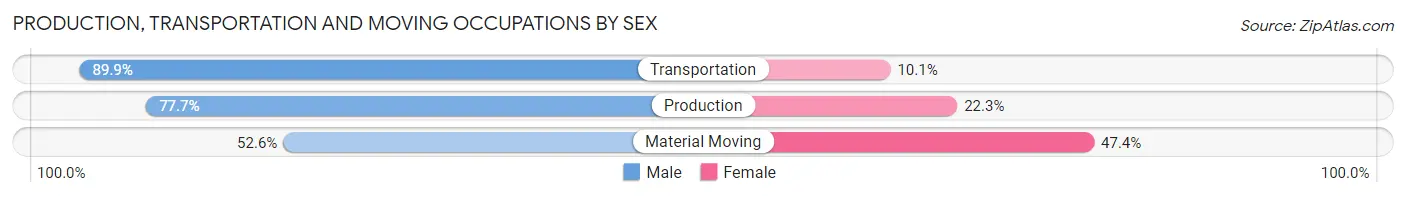
| Occupation | Male | Female |
| Production | 466 (77.7%) | 134 (22.3%) |
| Transportation | 107 (89.9%) | 12 (10.1%) |
| Material Moving | 246 (52.6%) | 222 (47.4%) |
| Total (Category) | 819 (69.0%) | 368 (31.0%) |
| Total (Overall) | 3,811 (46.2%) | 4,437 (53.8%) |
Employment Industries by Sex in Murray
Employment Industries in Murray
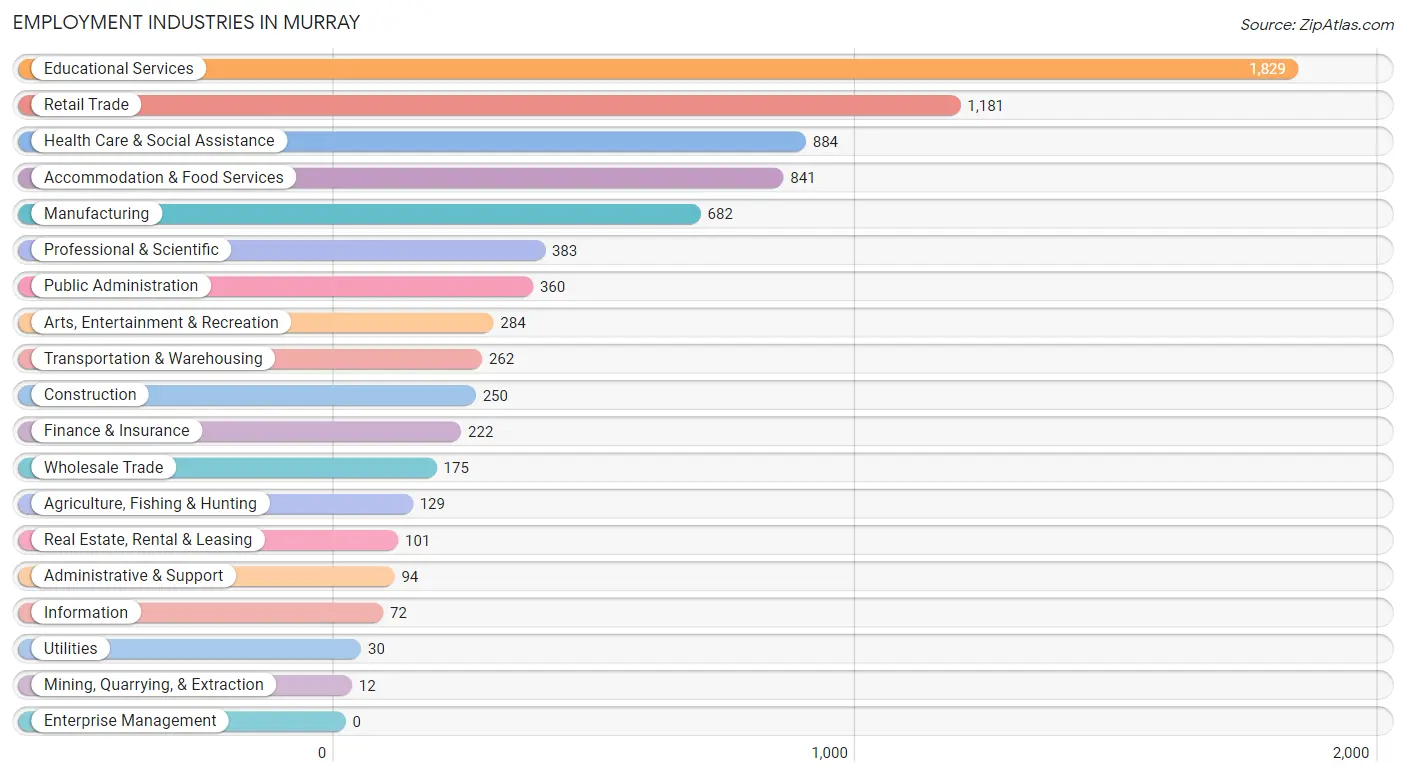
The major employment industries in Murray include Educational Services (1,829 | 22.2%), Retail Trade (1,181 | 14.3%), Health Care & Social Assistance (884 | 10.7%), Accommodation & Food Services (841 | 10.2%), and Manufacturing (682 | 8.3%).
Employment Industries by Sex in Murray
The Murray industries that see more men than women are Agriculture, Fishing & Hunting (100.0%), Mining, Quarrying, & Extraction (100.0%), and Utilities (100.0%), whereas the industries that tend to have a higher number of women are Real Estate, Rental & Leasing (90.1%), Health Care & Social Assistance (84.7%), and Wholesale Trade (73.7%).
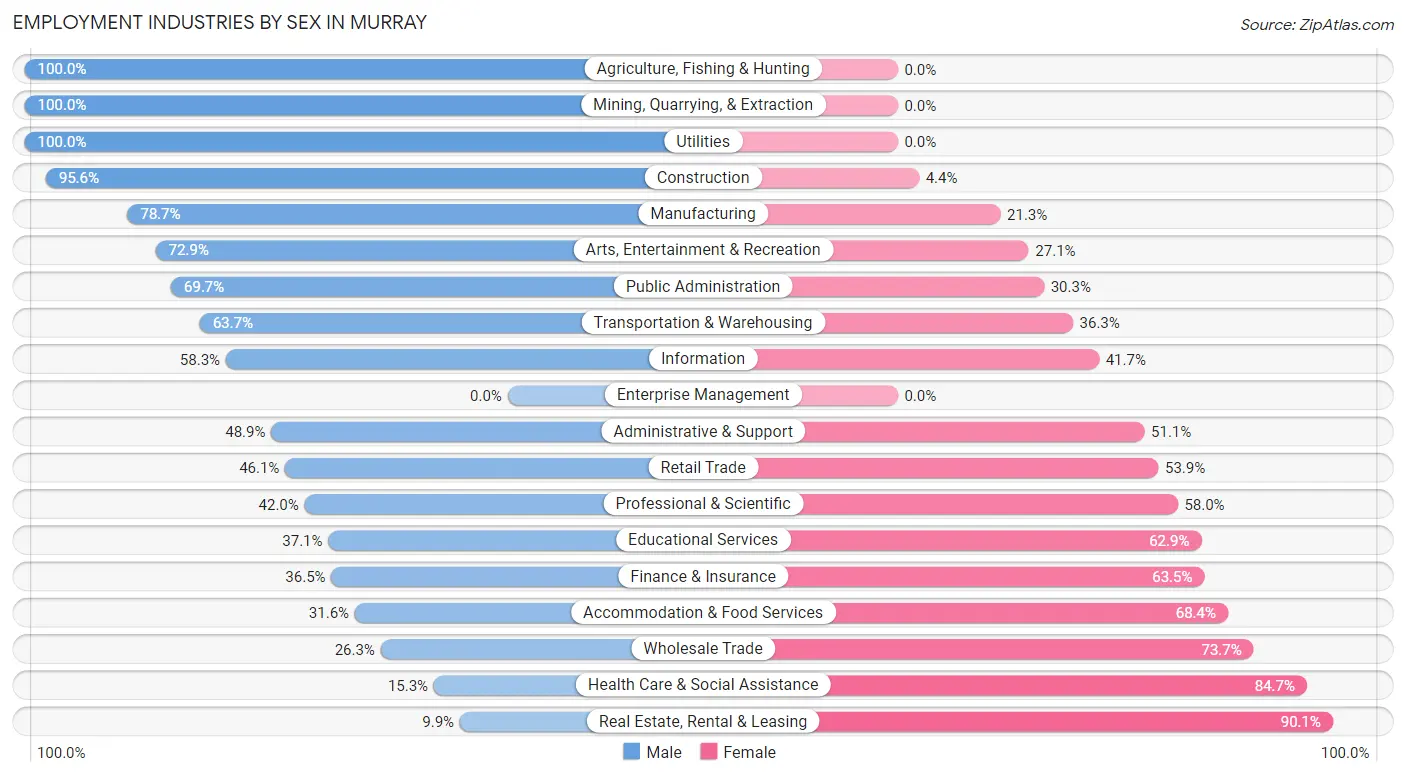
| Industry | Male | Female |
| Agriculture, Fishing & Hunting | 129 (100.0%) | 0 (0.0%) |
| Mining, Quarrying, & Extraction | 12 (100.0%) | 0 (0.0%) |
| Construction | 239 (95.6%) | 11 (4.4%) |
| Manufacturing | 537 (78.7%) | 145 (21.3%) |
| Wholesale Trade | 46 (26.3%) | 129 (73.7%) |
| Retail Trade | 544 (46.1%) | 637 (53.9%) |
| Transportation & Warehousing | 167 (63.7%) | 95 (36.3%) |
| Utilities | 30 (100.0%) | 0 (0.0%) |
| Information | 42 (58.3%) | 30 (41.7%) |
| Finance & Insurance | 81 (36.5%) | 141 (63.5%) |
| Real Estate, Rental & Leasing | 10 (9.9%) | 91 (90.1%) |
| Professional & Scientific | 161 (42.0%) | 222 (58.0%) |
| Enterprise Management | 0 (0.0%) | 0 (0.0%) |
| Administrative & Support | 46 (48.9%) | 48 (51.1%) |
| Educational Services | 679 (37.1%) | 1,150 (62.9%) |
| Health Care & Social Assistance | 135 (15.3%) | 749 (84.7%) |
| Arts, Entertainment & Recreation | 207 (72.9%) | 77 (27.1%) |
| Accommodation & Food Services | 266 (31.6%) | 575 (68.4%) |
| Public Administration | 251 (69.7%) | 109 (30.3%) |
| Total | 3,811 (46.2%) | 4,437 (53.8%) |
Education in Murray
School Enrollment in Murray
The most common levels of schooling among the 6,873 students in Murray are college / undergraduate (4,755 | 69.2%), elementary school (600 | 8.7%), and high school (541 | 7.9%).
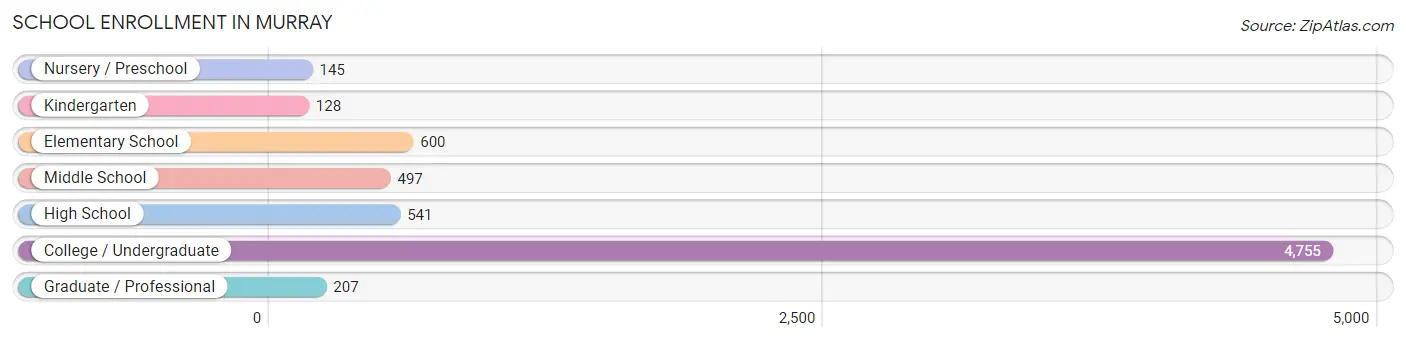
| School Level | # Students | % Students |
| Nursery / Preschool | 145 | 2.1% |
| Kindergarten | 128 | 1.9% |
| Elementary School | 600 | 8.7% |
| Middle School | 497 | 7.2% |
| High School | 541 | 7.9% |
| College / Undergraduate | 4,755 | 69.2% |
| Graduate / Professional | 207 | 3.0% |
| Total | 6,873 | 100.0% |
School Enrollment by Age by Funding Source in Murray
Out of a total of 6,873 students who are enrolled in schools in Murray, 735 (10.7%) attend a private institution, while the remaining 6,138 (89.3%) are enrolled in public schools. The age group of 25 to 34 year olds has the highest likelihood of being enrolled in private schools, with 145 (35.4% in the age bracket) enrolled. Conversely, the age group of 35 years and over has the lowest likelihood of being enrolled in a private school, with 140 (100.0% in the age bracket) attending a public institution.
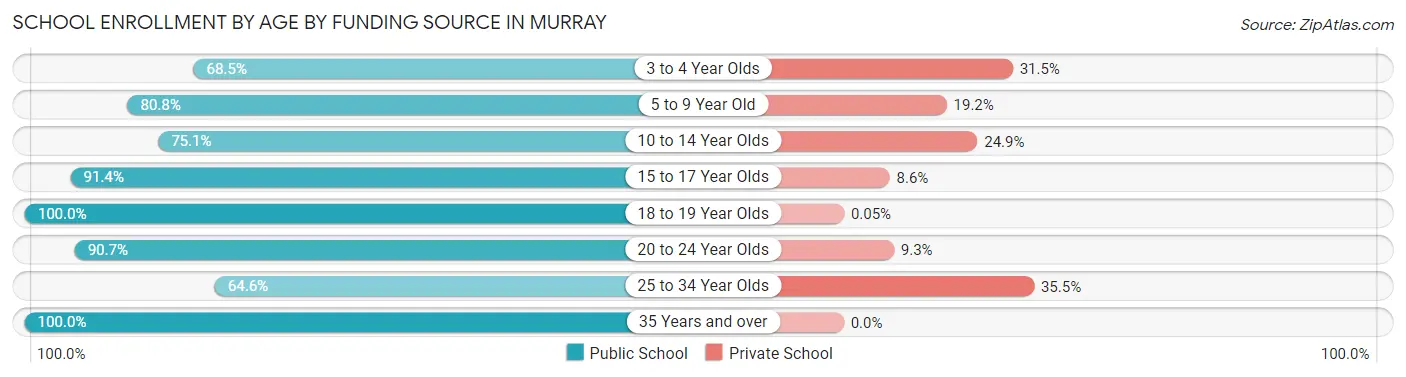
| Age Bracket | Public School | Private School |
| 3 to 4 Year Olds | 74 (68.5%) | 34 (31.5%) |
| 5 to 9 Year Old | 523 (80.8%) | 124 (19.2%) |
| 10 to 14 Year Olds | 498 (75.1%) | 165 (24.9%) |
| 15 to 17 Year Olds | 299 (91.4%) | 28 (8.6%) |
| 18 to 19 Year Olds | 2,050 (100.0%) | 1 (0.1%) |
| 20 to 24 Year Olds | 2,292 (90.7%) | 236 (9.3%) |
| 25 to 34 Year Olds | 264 (64.5%) | 145 (35.4%) |
| 35 Years and over | 140 (100.0%) | 0 (0.0%) |
| Total | 6,138 (89.3%) | 735 (10.7%) |
Educational Attainment by Field of Study in Murray
Education (612 | 17.8%), business (435 | 12.7%), bio, nature & agricultural (409 | 11.9%), science & technology (376 | 11.0%), and arts & humanities (320 | 9.3%) are the most common fields of study among 3,434 individuals in Murray who have obtained a bachelor's degree or higher.
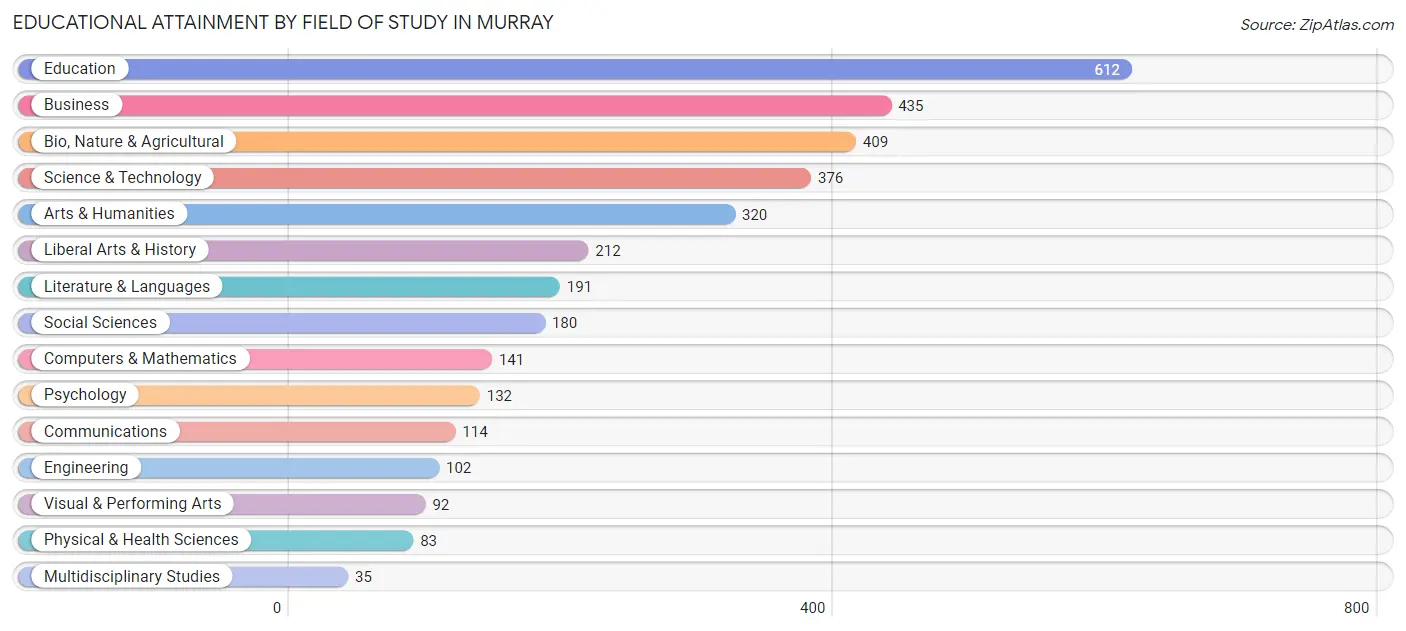
| Field of Study | # Graduates | % Graduates |
| Computers & Mathematics | 141 | 4.1% |
| Bio, Nature & Agricultural | 409 | 11.9% |
| Physical & Health Sciences | 83 | 2.4% |
| Psychology | 132 | 3.8% |
| Social Sciences | 180 | 5.2% |
| Engineering | 102 | 3.0% |
| Multidisciplinary Studies | 35 | 1.0% |
| Science & Technology | 376 | 11.0% |
| Business | 435 | 12.7% |
| Education | 612 | 17.8% |
| Literature & Languages | 191 | 5.6% |
| Liberal Arts & History | 212 | 6.2% |
| Visual & Performing Arts | 92 | 2.7% |
| Communications | 114 | 3.3% |
| Arts & Humanities | 320 | 9.3% |
| Total | 3,434 | 100.0% |
Transportation & Commute in Murray
Vehicle Availability by Sex in Murray
The most prevalent vehicle ownership categories in Murray are males with 2 vehicles (1,531, accounting for 45.8%) and females with 2 vehicles (1,271, making up 44.3%).
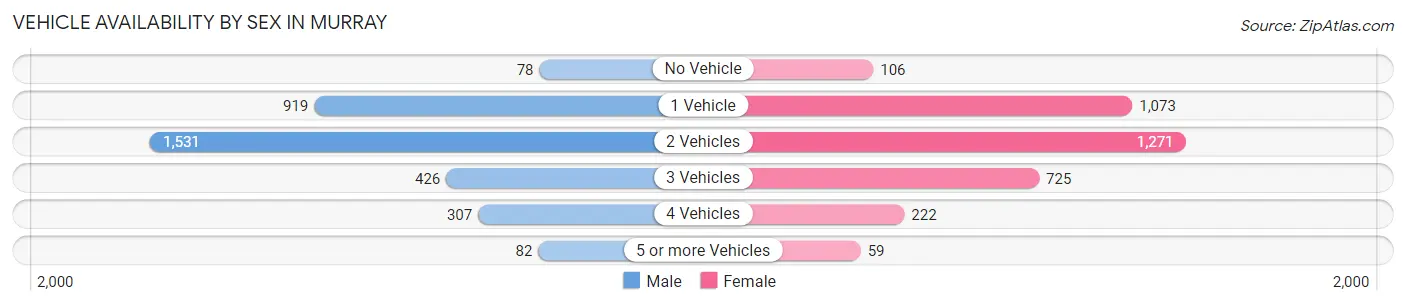
| Vehicles Available | Male | Female |
| No Vehicle | 78 (2.3%) | 106 (3.1%) |
| 1 Vehicle | 919 (27.5%) | 1,073 (31.0%) |
| 2 Vehicles | 1,531 (45.8%) | 1,271 (36.8%) |
| 3 Vehicles | 426 (12.7%) | 725 (21.0%) |
| 4 Vehicles | 307 (9.2%) | 222 (6.4%) |
| 5 or more Vehicles | 82 (2.5%) | 59 (1.7%) |
| Total | 3,343 (100.0%) | 3,456 (100.0%) |
Commute Time in Murray
The most frequently occuring commute durations in Murray are 5 to 9 minutes (3,913 commuters, 49.9%), 10 to 14 minutes (1,630 commuters, 20.8%), and 15 to 19 minutes (613 commuters, 7.8%).
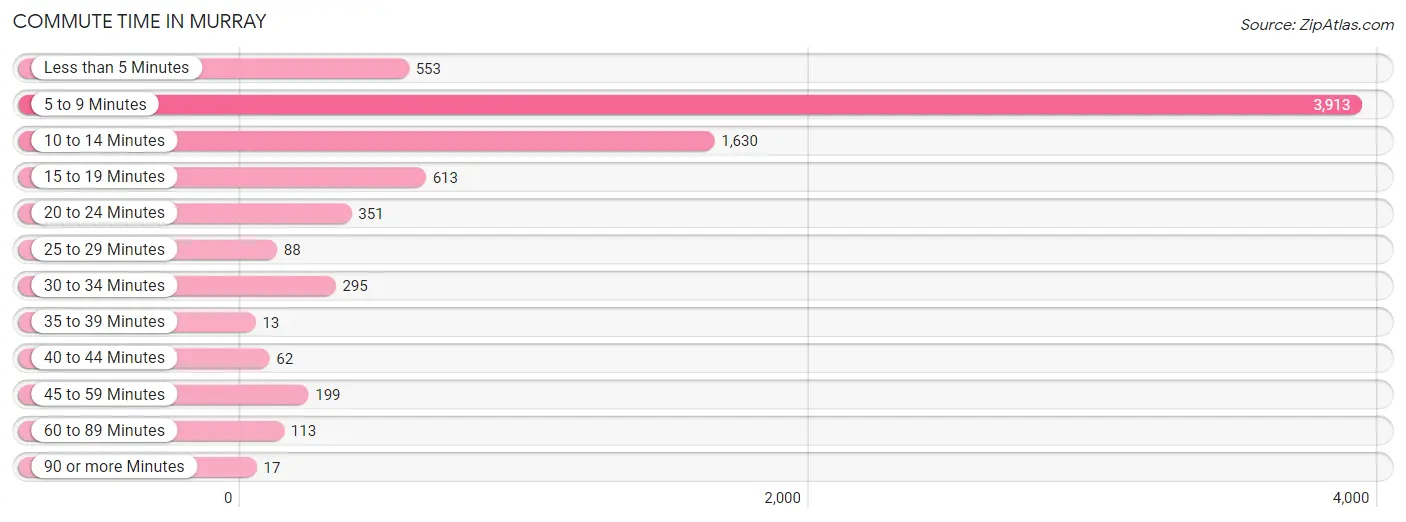
| Commute Time | # Commuters | % Commuters |
| Less than 5 Minutes | 553 | 7.0% |
| 5 to 9 Minutes | 3,913 | 49.9% |
| 10 to 14 Minutes | 1,630 | 20.8% |
| 15 to 19 Minutes | 613 | 7.8% |
| 20 to 24 Minutes | 351 | 4.5% |
| 25 to 29 Minutes | 88 | 1.1% |
| 30 to 34 Minutes | 295 | 3.8% |
| 35 to 39 Minutes | 13 | 0.2% |
| 40 to 44 Minutes | 62 | 0.8% |
| 45 to 59 Minutes | 199 | 2.5% |
| 60 to 89 Minutes | 113 | 1.4% |
| 90 or more Minutes | 17 | 0.2% |
Commute Time by Sex in Murray
The most common commute times in Murray are 5 to 9 minutes (1,749 commuters, 47.8%) for males and 5 to 9 minutes (2,164 commuters, 51.6%) for females.
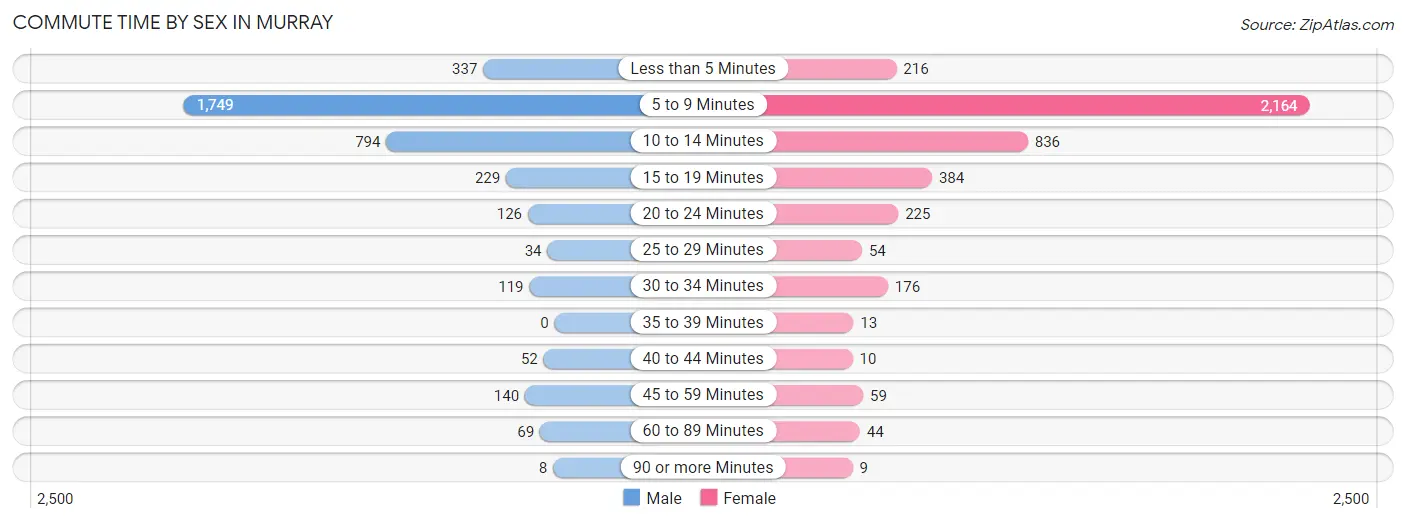
| Commute Time | Male | Female |
| Less than 5 Minutes | 337 (9.2%) | 216 (5.2%) |
| 5 to 9 Minutes | 1,749 (47.8%) | 2,164 (51.6%) |
| 10 to 14 Minutes | 794 (21.7%) | 836 (20.0%) |
| 15 to 19 Minutes | 229 (6.3%) | 384 (9.2%) |
| 20 to 24 Minutes | 126 (3.5%) | 225 (5.4%) |
| 25 to 29 Minutes | 34 (0.9%) | 54 (1.3%) |
| 30 to 34 Minutes | 119 (3.3%) | 176 (4.2%) |
| 35 to 39 Minutes | 0 (0.0%) | 13 (0.3%) |
| 40 to 44 Minutes | 52 (1.4%) | 10 (0.2%) |
| 45 to 59 Minutes | 140 (3.8%) | 59 (1.4%) |
| 60 to 89 Minutes | 69 (1.9%) | 44 (1.1%) |
| 90 or more Minutes | 8 (0.2%) | 9 (0.2%) |
Time of Departure to Work by Sex in Murray
The most frequent times of departure to work in Murray are 7:00 AM to 7:29 AM (548, 15.0%) for males and 7:30 AM to 7:59 AM (699, 16.7%) for females.
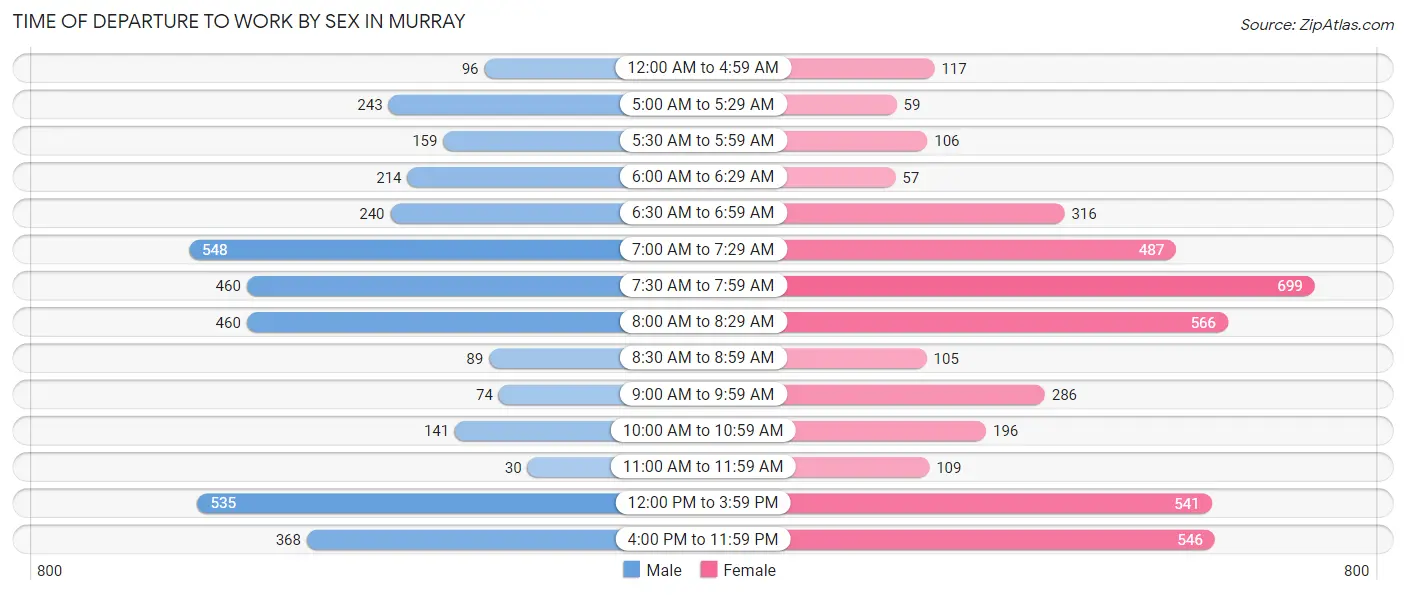
| Time of Departure | Male | Female |
| 12:00 AM to 4:59 AM | 96 (2.6%) | 117 (2.8%) |
| 5:00 AM to 5:29 AM | 243 (6.6%) | 59 (1.4%) |
| 5:30 AM to 5:59 AM | 159 (4.3%) | 106 (2.5%) |
| 6:00 AM to 6:29 AM | 214 (5.9%) | 57 (1.4%) |
| 6:30 AM to 6:59 AM | 240 (6.6%) | 316 (7.5%) |
| 7:00 AM to 7:29 AM | 548 (15.0%) | 487 (11.6%) |
| 7:30 AM to 7:59 AM | 460 (12.6%) | 699 (16.7%) |
| 8:00 AM to 8:29 AM | 460 (12.6%) | 566 (13.5%) |
| 8:30 AM to 8:59 AM | 89 (2.4%) | 105 (2.5%) |
| 9:00 AM to 9:59 AM | 74 (2.0%) | 286 (6.8%) |
| 10:00 AM to 10:59 AM | 141 (3.9%) | 196 (4.7%) |
| 11:00 AM to 11:59 AM | 30 (0.8%) | 109 (2.6%) |
| 12:00 PM to 3:59 PM | 535 (14.6%) | 541 (12.9%) |
| 4:00 PM to 11:59 PM | 368 (10.1%) | 546 (13.0%) |
| Total | 3,657 (100.0%) | 4,190 (100.0%) |
Housing Occupancy in Murray
Occupancy by Ownership in Murray
Of the total 6,611 dwellings in Murray, owner-occupied units account for 2,682 (40.6%), while renter-occupied units make up 3,929 (59.4%).
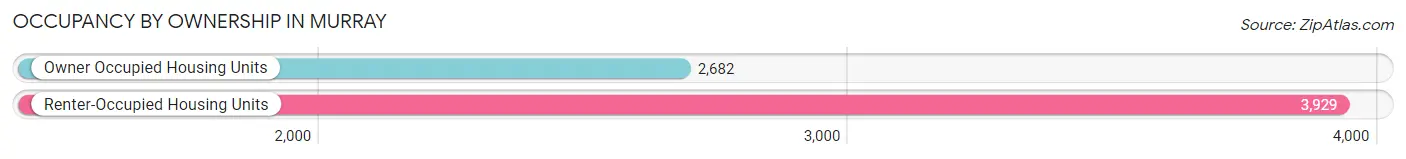
| Occupancy | # Housing Units | % Housing Units |
| Owner Occupied Housing Units | 2,682 | 40.6% |
| Renter-Occupied Housing Units | 3,929 | 59.4% |
| Total Occupied Housing Units | 6,611 | 100.0% |
Occupancy by Household Size in Murray
| Household Size | # Housing Units | % Housing Units |
| 1-Person Household | 2,503 | 37.9% |
| 2-Person Household | 2,113 | 32.0% |
| 3-Person Household | 917 | 13.9% |
| 4+ Person Household | 1,078 | 16.3% |
| Total Housing Units | 6,611 | 100.0% |
Occupancy by Ownership by Household Size in Murray
| Household Size | Owner-occupied | Renter-occupied |
| 1-Person Household | 790 (31.6%) | 1,713 (68.4%) |
| 2-Person Household | 900 (42.6%) | 1,213 (57.4%) |
| 3-Person Household | 399 (43.5%) | 518 (56.5%) |
| 4+ Person Household | 593 (55.0%) | 485 (45.0%) |
| Total Housing Units | 2,682 (40.6%) | 3,929 (59.4%) |
Occupancy by Educational Attainment in Murray
| Household Size | Owner-occupied | Renter-occupied |
| Less than High School | 188 (41.6%) | 264 (58.4%) |
| High School Diploma | 399 (25.5%) | 1,168 (74.5%) |
| College/Associate Degree | 819 (33.3%) | 1,643 (66.7%) |
| Bachelor's Degree or higher | 1,276 (59.9%) | 854 (40.1%) |
Occupancy by Age of Householder in Murray
| Age Bracket | # Households | % Households |
| Under 35 Years | 2,556 | 38.7% |
| 35 to 44 Years | 914 | 13.8% |
| 45 to 54 Years | 878 | 13.3% |
| 55 to 64 Years | 859 | 13.0% |
| 65 to 74 Years | 684 | 10.3% |
| 75 to 84 Years | 472 | 7.1% |
| 85 Years and Over | 248 | 3.7% |
| Total | 6,611 | 100.0% |
Housing Finances in Murray
Median Income by Occupancy in Murray
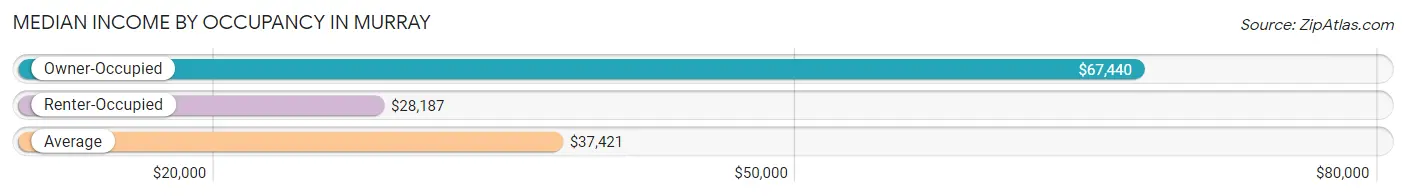
| Occupancy Type | # Households | Median Income |
| Owner-Occupied | 2,682 (40.6%) | $67,440 |
| Renter-Occupied | 3,929 (59.4%) | $28,187 |
| Average | 6,611 (100.0%) | $37,421 |
Occupancy by Householder Income Bracket in Murray
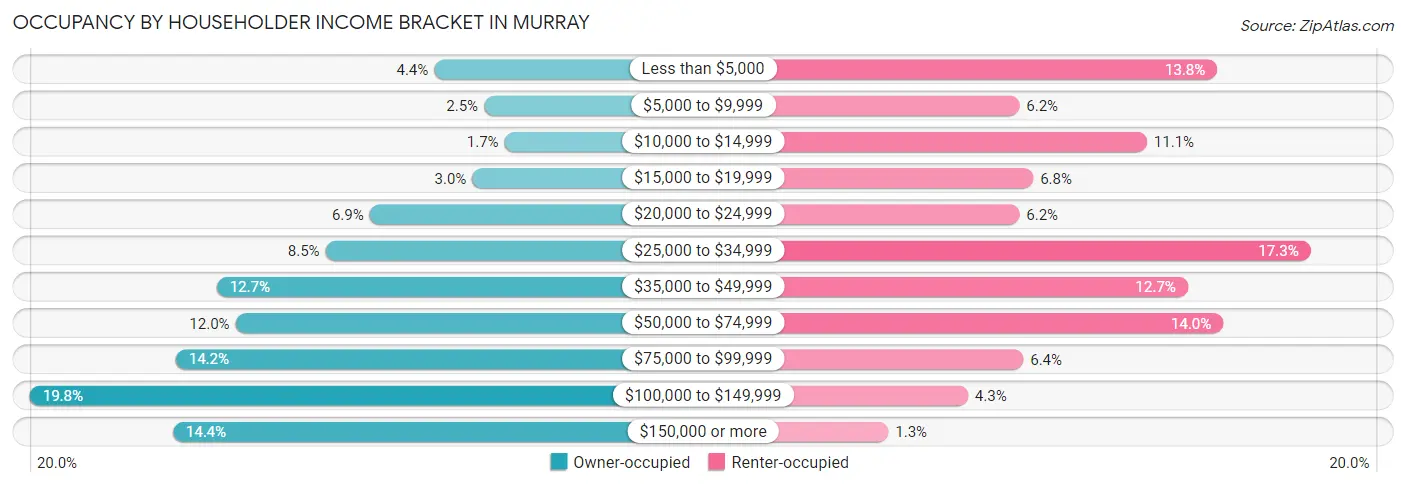
| Income Bracket | Owner-occupied | Renter-occupied |
| Less than $5,000 | 118 (4.4%) | 541 (13.8%) |
| $5,000 to $9,999 | 67 (2.5%) | 245 (6.2%) |
| $10,000 to $14,999 | 46 (1.7%) | 436 (11.1%) |
| $15,000 to $19,999 | 79 (2.9%) | 266 (6.8%) |
| $20,000 to $24,999 | 184 (6.9%) | 245 (6.2%) |
| $25,000 to $34,999 | 229 (8.5%) | 681 (17.3%) |
| $35,000 to $49,999 | 340 (12.7%) | 497 (12.7%) |
| $50,000 to $74,999 | 321 (12.0%) | 550 (14.0%) |
| $75,000 to $99,999 | 382 (14.2%) | 251 (6.4%) |
| $100,000 to $149,999 | 531 (19.8%) | 168 (4.3%) |
| $150,000 or more | 385 (14.3%) | 49 (1.3%) |
| Total | 2,682 (100.0%) | 3,929 (100.0%) |
Monthly Housing Cost Tiers in Murray
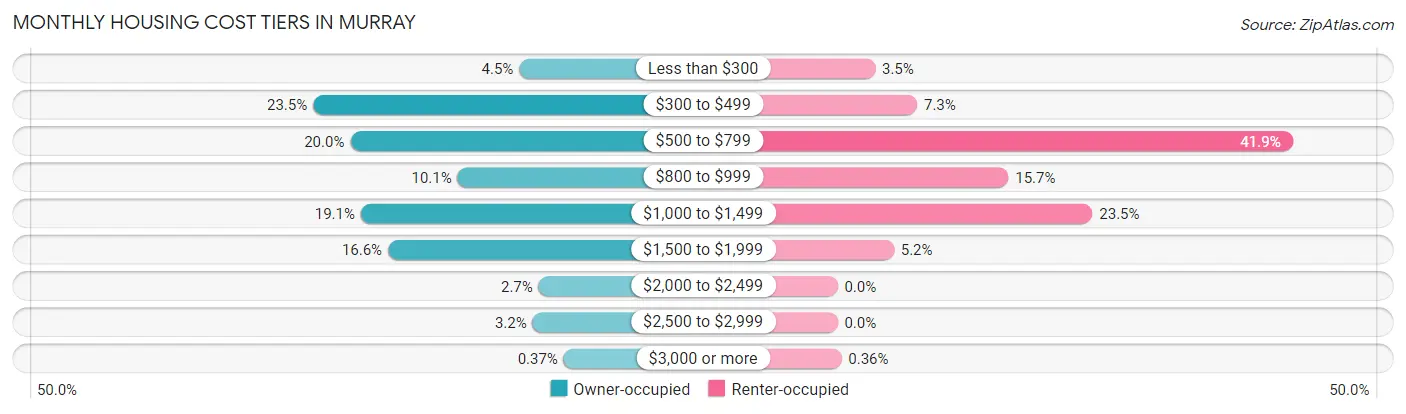
| Monthly Cost | Owner-occupied | Renter-occupied |
| Less than $300 | 120 (4.5%) | 136 (3.5%) |
| $300 to $499 | 629 (23.4%) | 288 (7.3%) |
| $500 to $799 | 537 (20.0%) | 1,646 (41.9%) |
| $800 to $999 | 272 (10.1%) | 618 (15.7%) |
| $1,000 to $1,499 | 511 (19.1%) | 922 (23.5%) |
| $1,500 to $1,999 | 444 (16.6%) | 204 (5.2%) |
| $2,000 to $2,499 | 72 (2.7%) | 0 (0.0%) |
| $2,500 to $2,999 | 87 (3.2%) | 0 (0.0%) |
| $3,000 or more | 10 (0.4%) | 14 (0.4%) |
| Total | 2,682 (100.0%) | 3,929 (100.0%) |
Physical Housing Characteristics in Murray
Housing Structures in Murray
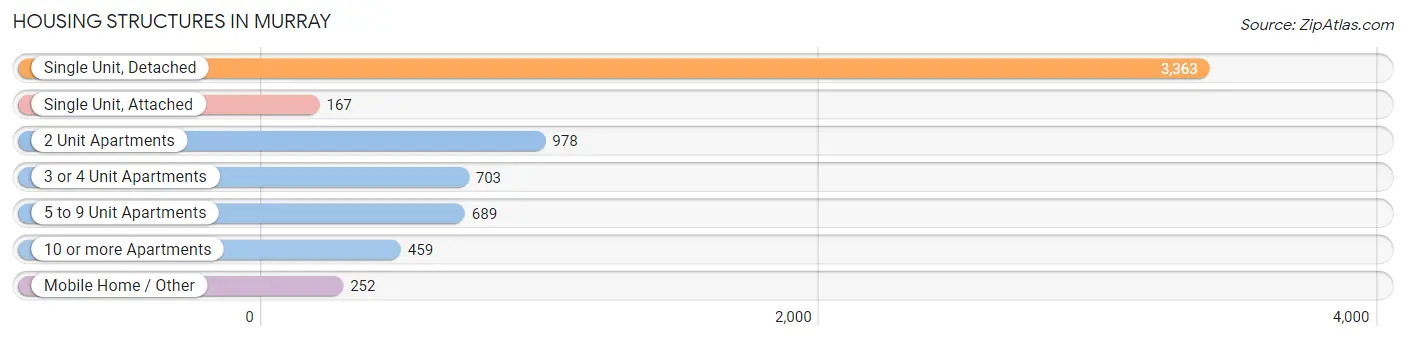
| Structure Type | # Housing Units | % Housing Units |
| Single Unit, Detached | 3,363 | 50.9% |
| Single Unit, Attached | 167 | 2.5% |
| 2 Unit Apartments | 978 | 14.8% |
| 3 or 4 Unit Apartments | 703 | 10.6% |
| 5 to 9 Unit Apartments | 689 | 10.4% |
| 10 or more Apartments | 459 | 6.9% |
| Mobile Home / Other | 252 | 3.8% |
| Total | 6,611 | 100.0% |
Housing Structures by Occupancy in Murray
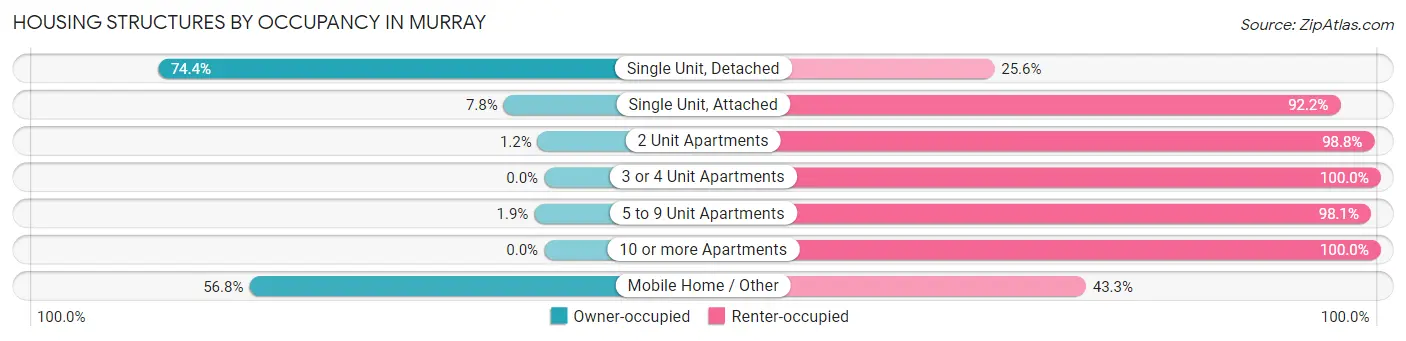
| Structure Type | Owner-occupied | Renter-occupied |
| Single Unit, Detached | 2,501 (74.4%) | 862 (25.6%) |
| Single Unit, Attached | 13 (7.8%) | 154 (92.2%) |
| 2 Unit Apartments | 12 (1.2%) | 966 (98.8%) |
| 3 or 4 Unit Apartments | 0 (0.0%) | 703 (100.0%) |
| 5 to 9 Unit Apartments | 13 (1.9%) | 676 (98.1%) |
| 10 or more Apartments | 0 (0.0%) | 459 (100.0%) |
| Mobile Home / Other | 143 (56.8%) | 109 (43.2%) |
| Total | 2,682 (40.6%) | 3,929 (59.4%) |
Housing Structures by Number of Rooms in Murray
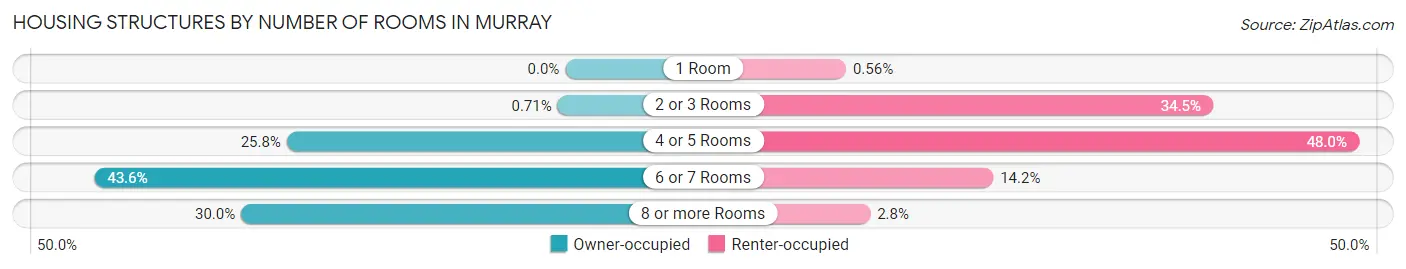
| Number of Rooms | Owner-occupied | Renter-occupied |
| 1 Room | 0 (0.0%) | 22 (0.6%) |
| 2 or 3 Rooms | 19 (0.7%) | 1,355 (34.5%) |
| 4 or 5 Rooms | 691 (25.8%) | 1,885 (48.0%) |
| 6 or 7 Rooms | 1,168 (43.5%) | 557 (14.2%) |
| 8 or more Rooms | 804 (30.0%) | 110 (2.8%) |
| Total | 2,682 (100.0%) | 3,929 (100.0%) |
Housing Structure by Heating Type in Murray
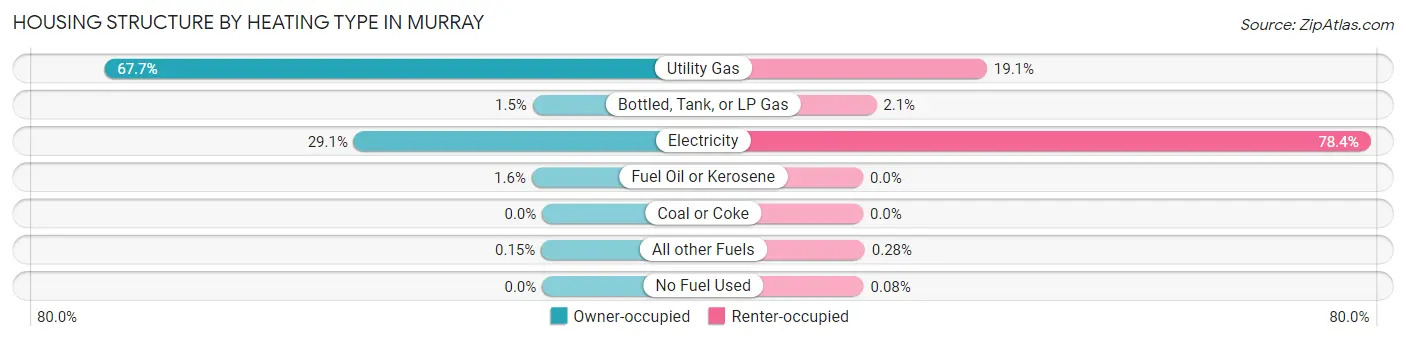
| Heating Type | Owner-occupied | Renter-occupied |
| Utility Gas | 1,815 (67.7%) | 752 (19.1%) |
| Bottled, Tank, or LP Gas | 39 (1.5%) | 81 (2.1%) |
| Electricity | 781 (29.1%) | 3,082 (78.4%) |
| Fuel Oil or Kerosene | 43 (1.6%) | 0 (0.0%) |
| Coal or Coke | 0 (0.0%) | 0 (0.0%) |
| All other Fuels | 4 (0.2%) | 11 (0.3%) |
| No Fuel Used | 0 (0.0%) | 3 (0.1%) |
| Total | 2,682 (100.0%) | 3,929 (100.0%) |
Household Vehicle Usage in Murray
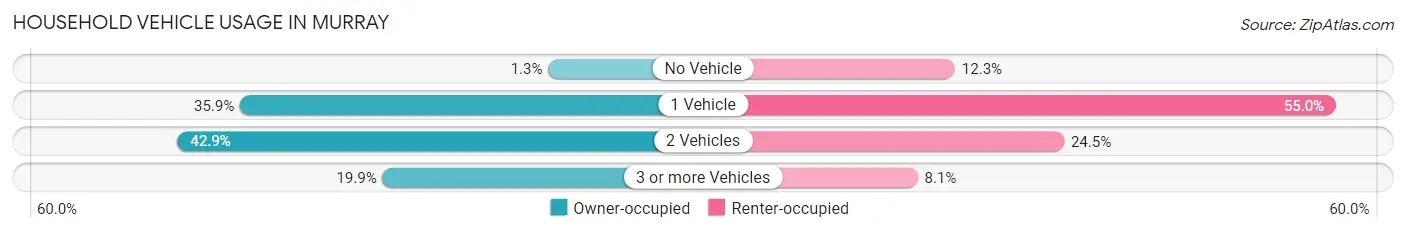
| Vehicles per Household | Owner-occupied | Renter-occupied |
| No Vehicle | 36 (1.3%) | 484 (12.3%) |
| 1 Vehicle | 962 (35.9%) | 2,161 (55.0%) |
| 2 Vehicles | 1,150 (42.9%) | 964 (24.5%) |
| 3 or more Vehicles | 534 (19.9%) | 320 (8.1%) |
| Total | 2,682 (100.0%) | 3,929 (100.0%) |
Real Estate & Mortgages in Murray
Real Estate and Mortgage Overview in Murray
| Characteristic | Without Mortgage | With Mortgage |
| Housing Units | 1,284 | 1,398 |
| Median Property Value | $182,000 | $189,800 |
| Median Household Income | $48,141 | $235 |
| Monthly Housing Costs | $474 | $10 |
| Real Estate Taxes | $1,170 | $23 |
Property Value by Mortgage Status in Murray
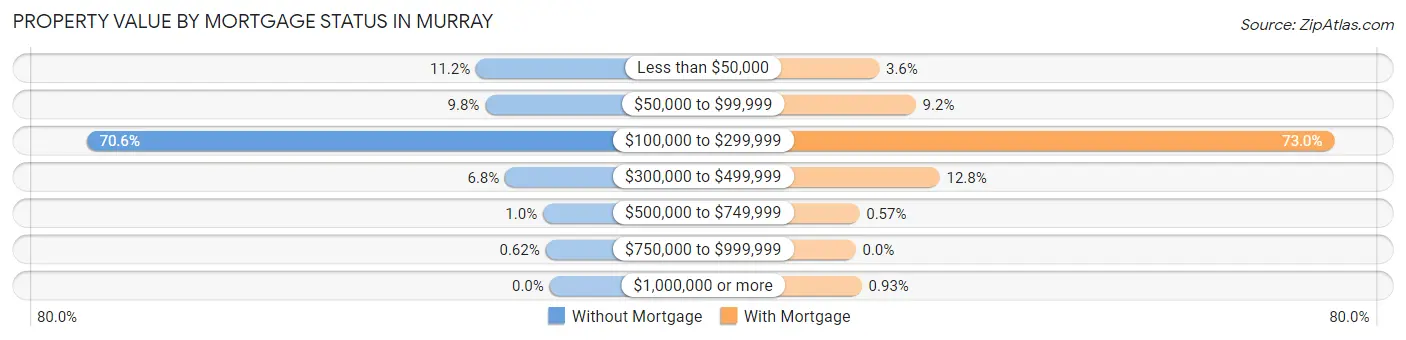
| Property Value | Without Mortgage | With Mortgage |
| Less than $50,000 | 144 (11.2%) | 50 (3.6%) |
| $50,000 to $99,999 | 126 (9.8%) | 128 (9.2%) |
| $100,000 to $299,999 | 906 (70.6%) | 1,020 (73.0%) |
| $300,000 to $499,999 | 87 (6.8%) | 179 (12.8%) |
| $500,000 to $749,999 | 13 (1.0%) | 8 (0.6%) |
| $750,000 to $999,999 | 8 (0.6%) | 0 (0.0%) |
| $1,000,000 or more | 0 (0.0%) | 13 (0.9%) |
| Total | 1,284 (100.0%) | 1,398 (100.0%) |
Household Income by Mortgage Status in Murray
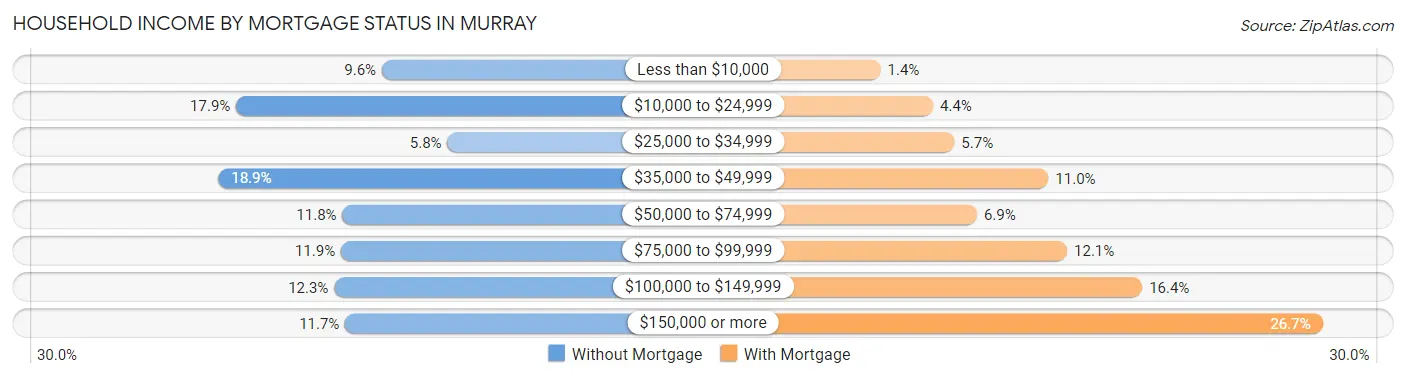
| Household Income | Without Mortgage | With Mortgage |
| Less than $10,000 | 123 (9.6%) | 20 (1.4%) |
| $10,000 to $24,999 | 230 (17.9%) | 62 (4.4%) |
| $25,000 to $34,999 | 75 (5.8%) | 79 (5.7%) |
| $35,000 to $49,999 | 243 (18.9%) | 154 (11.0%) |
| $50,000 to $74,999 | 152 (11.8%) | 97 (6.9%) |
| $75,000 to $99,999 | 153 (11.9%) | 169 (12.1%) |
| $100,000 to $149,999 | 158 (12.3%) | 229 (16.4%) |
| $150,000 or more | 150 (11.7%) | 373 (26.7%) |
| Total | 1,284 (100.0%) | 1,398 (100.0%) |
Property Value to Household Income Ratio in Murray
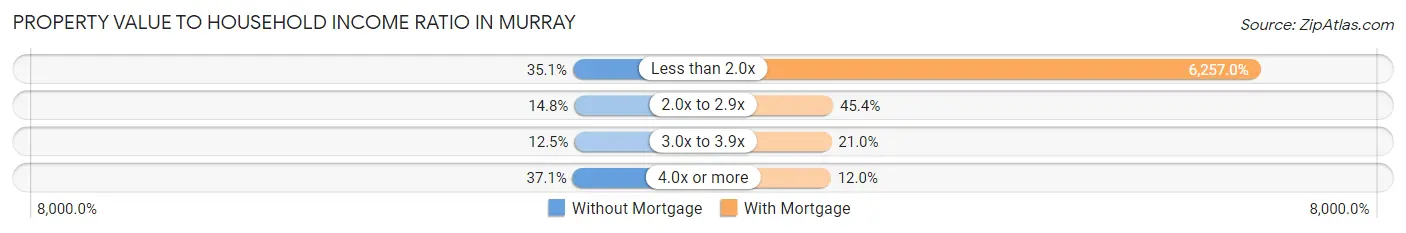
| Value-to-Income Ratio | Without Mortgage | With Mortgage |
| Less than 2.0x | 450 (35.0%) | 87,473 (6,257.0%) |
| 2.0x to 2.9x | 190 (14.8%) | 635 (45.4%) |
| 3.0x to 3.9x | 161 (12.5%) | 294 (21.0%) |
| 4.0x or more | 476 (37.1%) | 167 (11.9%) |
| Total | 1,284 (100.0%) | 1,398 (100.0%) |
Real Estate Taxes by Mortgage Status in Murray
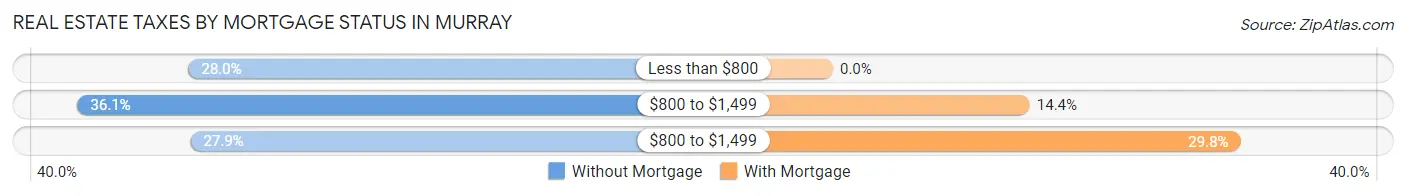
| Property Taxes | Without Mortgage | With Mortgage |
| Less than $800 | 360 (28.0%) | 0 (0.0%) |
| $800 to $1,499 | 464 (36.1%) | 201 (14.4%) |
| $800 to $1,499 | 358 (27.9%) | 416 (29.8%) |
| Total | 1,284 (100.0%) | 1,398 (100.0%) |
Health & Disability in Murray
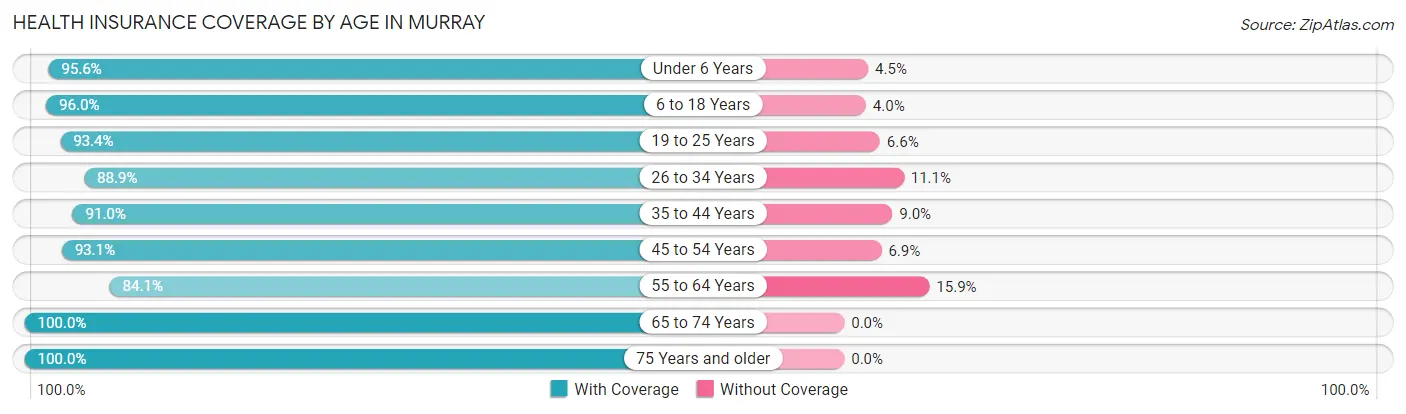
Health Insurance Coverage by Age in Murray
| Age Bracket | With Coverage | Without Coverage |
| Under 6 Years | 795 (95.6%) | 37 (4.4%) |
| 6 to 18 Years | 2,594 (96.0%) | 109 (4.0%) |
| 19 to 25 Years | 4,905 (93.4%) | 349 (6.6%) |
| 26 to 34 Years | 1,730 (88.9%) | 216 (11.1%) |
| 35 to 44 Years | 1,331 (91.0%) | 131 (9.0%) |
| 45 to 54 Years | 1,289 (93.1%) | 96 (6.9%) |
| 55 to 64 Years | 1,225 (84.1%) | 231 (15.9%) |
| 65 to 74 Years | 1,038 (100.0%) | 0 (0.0%) |
| 75 Years and older | 1,021 (100.0%) | 0 (0.0%) |
| Total | 15,928 (93.2%) | 1,169 (6.8%) |
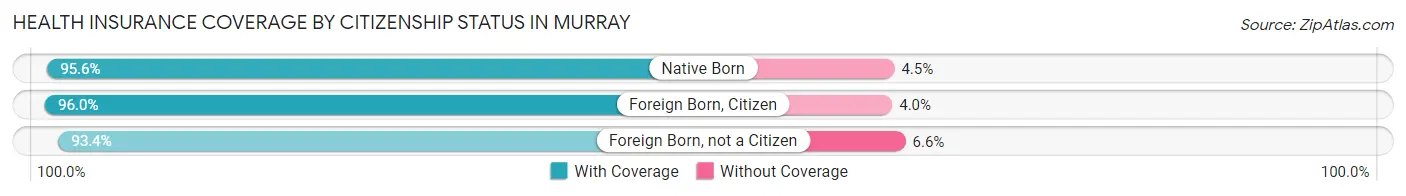
Health Insurance Coverage by Citizenship Status in Murray
| Citizenship Status | With Coverage | Without Coverage |
| Native Born | 795 (95.6%) | 37 (4.4%) |
| Foreign Born, Citizen | 2,594 (96.0%) | 109 (4.0%) |
| Foreign Born, not a Citizen | 4,905 (93.4%) | 349 (6.6%) |
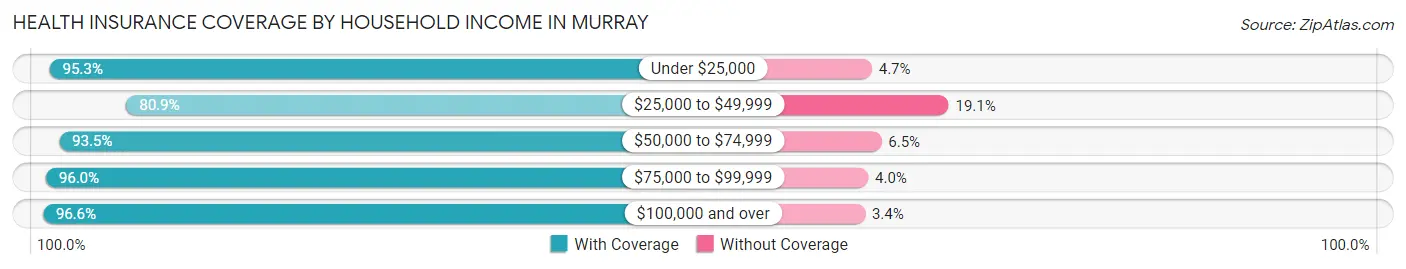
Health Insurance Coverage by Household Income in Murray
| Household Income | With Coverage | Without Coverage |
| Under $25,000 | 3,482 (95.3%) | 171 (4.7%) |
| $25,000 to $49,999 | 2,918 (80.9%) | 687 (19.1%) |
| $50,000 to $74,999 | 1,850 (93.5%) | 128 (6.5%) |
| $75,000 to $99,999 | 1,517 (96.0%) | 63 (4.0%) |
| $100,000 and over | 3,394 (96.6%) | 120 (3.4%) |
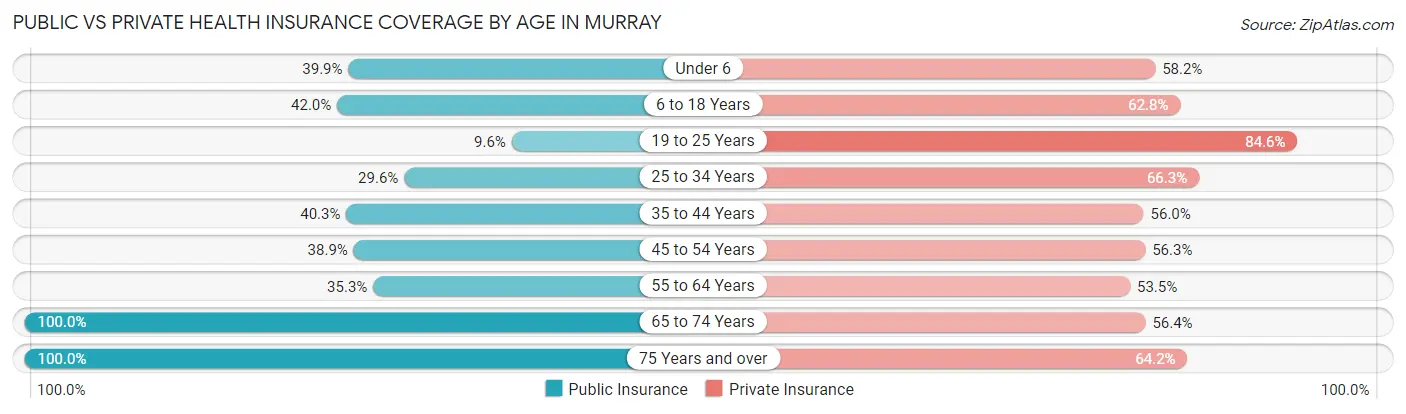
Public vs Private Health Insurance Coverage by Age in Murray
| Age Bracket | Public Insurance | Private Insurance |
| Under 6 | 332 (39.9%) | 484 (58.2%) |
| 6 to 18 Years | 1,135 (42.0%) | 1,698 (62.8%) |
| 19 to 25 Years | 504 (9.6%) | 4,442 (84.6%) |
| 25 to 34 Years | 575 (29.5%) | 1,290 (66.3%) |
| 35 to 44 Years | 589 (40.3%) | 819 (56.0%) |
| 45 to 54 Years | 539 (38.9%) | 780 (56.3%) |
| 55 to 64 Years | 514 (35.3%) | 779 (53.5%) |
| 65 to 74 Years | 1,038 (100.0%) | 585 (56.4%) |
| 75 Years and over | 1,021 (100.0%) | 655 (64.1%) |
| Total | 6,247 (36.5%) | 11,532 (67.4%) |
Disability Status by Sex by Age in Murray
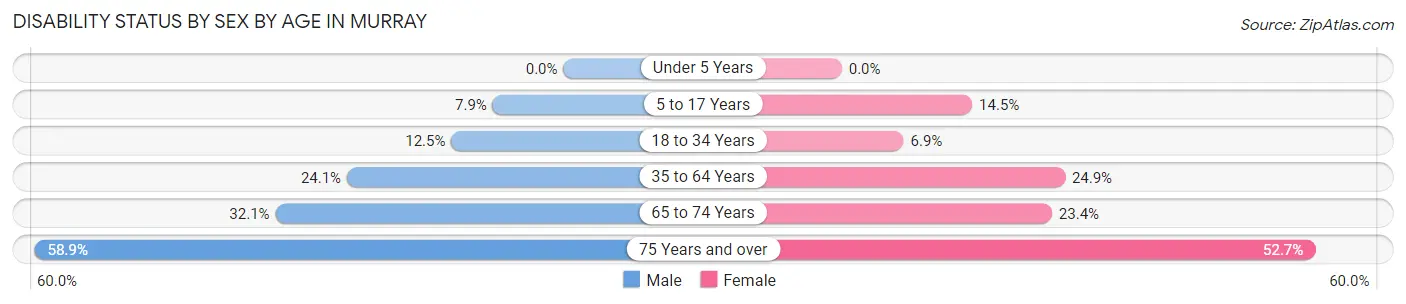
| Age Bracket | Male | Female |
| Under 5 Years | 0 (0.0%) | 0 (0.0%) |
| 5 to 17 Years | 78 (7.9%) | 132 (14.5%) |
| 18 to 34 Years | 481 (12.5%) | 298 (6.9%) |
| 35 to 64 Years | 489 (24.1%) | 565 (24.8%) |
| 65 to 74 Years | 152 (32.1%) | 132 (23.4%) |
| 75 Years and over | 275 (58.9%) | 292 (52.7%) |
Disability Class by Sex by Age in Murray
Disability Class: Hearing Difficulty
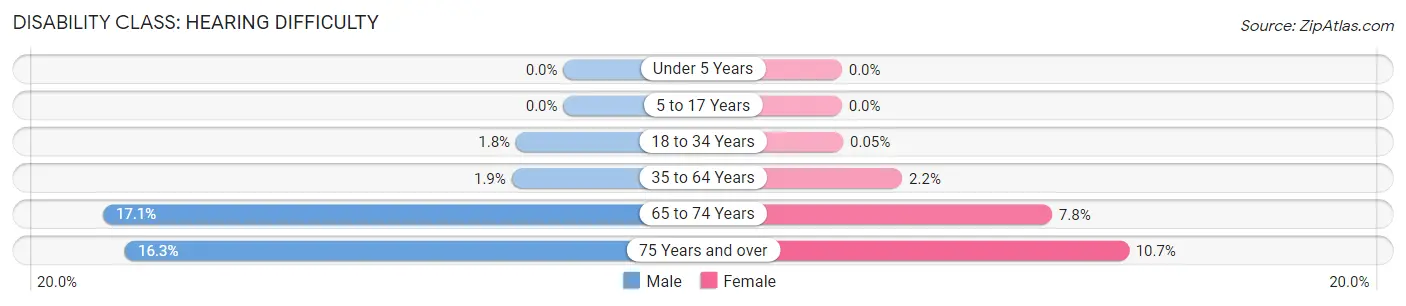
| Age Bracket | Male | Female |
| Under 5 Years | 0 (0.0%) | 0 (0.0%) |
| 5 to 17 Years | 0 (0.0%) | 0 (0.0%) |
| 18 to 34 Years | 68 (1.8%) | 2 (0.1%) |
| 35 to 64 Years | 39 (1.9%) | 51 (2.2%) |
| 65 to 74 Years | 81 (17.1%) | 44 (7.8%) |
| 75 Years and over | 76 (16.3%) | 59 (10.6%) |
Disability Class: Vision Difficulty
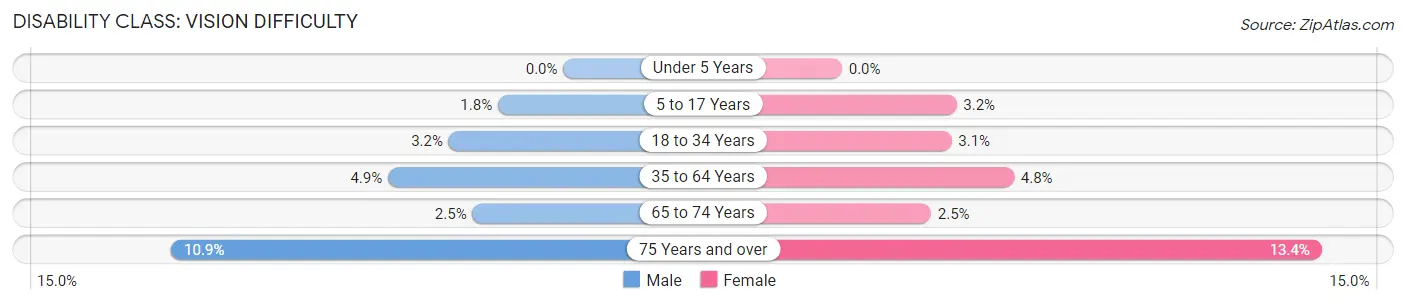
| Age Bracket | Male | Female |
| Under 5 Years | 0 (0.0%) | 0 (0.0%) |
| 5 to 17 Years | 18 (1.8%) | 29 (3.2%) |
| 18 to 34 Years | 123 (3.2%) | 132 (3.0%) |
| 35 to 64 Years | 99 (4.9%) | 109 (4.8%) |
| 65 to 74 Years | 12 (2.5%) | 14 (2.5%) |
| 75 Years and over | 51 (10.9%) | 74 (13.4%) |
Disability Class: Cognitive Difficulty
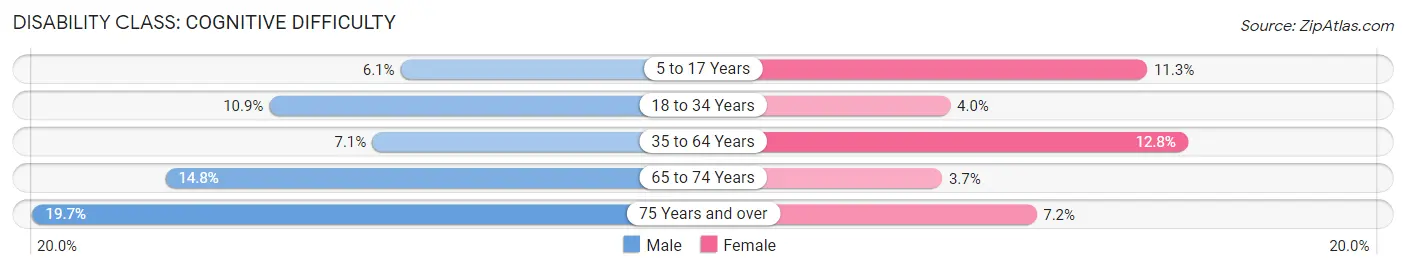
| Age Bracket | Male | Female |
| 5 to 17 Years | 60 (6.0%) | 103 (11.3%) |
| 18 to 34 Years | 421 (10.9%) | 174 (4.0%) |
| 35 to 64 Years | 144 (7.1%) | 292 (12.8%) |
| 65 to 74 Years | 70 (14.8%) | 21 (3.7%) |
| 75 Years and over | 92 (19.7%) | 40 (7.2%) |
Disability Class: Ambulatory Difficulty
| Age Bracket | Male | Female |
| 5 to 17 Years | 0 (0.0%) | 0 (0.0%) |
| 18 to 34 Years | 75 (1.9%) | 19 (0.4%) |
| 35 to 64 Years | 303 (14.9%) | 421 (18.5%) |
| 65 to 74 Years | 99 (20.9%) | 107 (19.0%) |
| 75 Years and over | 197 (42.2%) | 228 (41.2%) |
Disability Class: Self-Care Difficulty
| Age Bracket | Male | Female |
| 5 to 17 Years | 0 (0.0%) | 0 (0.0%) |
| 18 to 34 Years | 83 (2.1%) | 0 (0.0%) |
| 35 to 64 Years | 119 (5.9%) | 183 (8.1%) |
| 65 to 74 Years | 51 (10.8%) | 32 (5.7%) |
| 75 Years and over | 30 (6.4%) | 179 (32.3%) |
Technology Access in Murray
Computing Device Access in Murray
| Device Type | # Households | % Households |
| Desktop or Laptop | 5,271 | 79.7% |
| Smartphone | 5,743 | 86.9% |
| Tablet | 3,581 | 54.2% |
| No Computing Device | 402 | 6.1% |
| Total | 6,611 | 100.0% |
Internet Access in Murray
| Internet Type | # Households | % Households |
| Dial-Up Internet | 0 | 0.0% |
| Broadband Home | 4,206 | 63.6% |
| Cellular Data Only | 1,134 | 17.2% |
| Satellite Internet | 315 | 4.8% |
| No Internet | 1,102 | 16.7% |
| Total | 6,611 | 100.0% |
Murray Summary
Murray, Kentucky is a city located in Calloway County in the southwestern part of the state. It is the county seat and the largest city in the county. The city is situated along the banks of the Kentucky River and is home to Murray State University. The city has a population of 17,741 as of the 2010 census.
Geography
Murray is located in the Pennyrile region of Kentucky, which is characterized by rolling hills and fertile soil. The city is situated along the banks of the Kentucky River and is surrounded by the communities of Almo, Hazel, New Concord, and Dexter. The city is located approximately 120 miles northwest of Nashville, Tennessee and approximately 120 miles south of Louisville, Kentucky.
The city has a total area of 8.3 square miles, of which 8.2 square miles is land and 0.1 square miles is water. The terrain is mostly flat with some rolling hills. The climate is humid subtropical with hot summers and mild winters.
Economy
Murray is a regional center for commerce and industry. The city is home to Murray State University, which is the largest employer in the city. Other major employers include Murray-Calloway County Hospital, Murray Electric System, and the Murray-Calloway County Public Library.
The city is also home to several manufacturing companies, including Murray Manufacturing, Murray Plastics, and Murray Tool and Die. The city is also home to several retail stores, including Walmart, Kroger, and Lowe's.
Demographics
As of the 2010 census, the population of Murray was 17,741. The racial makeup of the city was 87.3% White, 8.2% African American, 0.3% Native American, 1.2% Asian, 0.1% Pacific Islander, 1.2% from other races, and 1.9% from two or more races. Hispanic or Latino of any race were 3.2% of the population.
The median income for a household in the city was $31,945, and the median income for a family was $41,945. The per capita income for the city was $17,845. About 17.2% of families and 22.2% of the population were below the poverty line, including 28.2% of those under age 18 and 11.2% of those age 65 or over.
Murray is served by the Murray Independent School District, which consists of four elementary schools, two middle schools, and one high school. The city is also home to Murray State University, which is a public university with an enrollment of over 10,000 students.
Murray is served by the Murray-Calloway County Public Library, which is a member of the Kentucky Library Network. The library offers a variety of services, including books, magazines, newspapers, audio books, DVDs, and online resources.
Murray is served by the Murray-Calloway County Airport, which is located just outside of the city limits. The airport offers commercial flights to Nashville, Tennessee and Louisville, Kentucky. The city is also served by the Murray-Calloway County Transit System, which provides public transportation throughout the city.
Murray is a vibrant city with a rich history and a bright future. The city is home to a diverse population and a strong economy. The city is home to a variety of businesses, educational institutions, and cultural attractions. Murray is a great place to live, work, and play.
Common Questions
What is Per Capita Income in Murray?
Per Capita income in Murray is $22,900.
What is the Median Family Income in Murray?
Median Family Income in Murray is $65,829.
What is the Median Household income in Murray?
Median Household Income in Murray is $37,421.
What is Income or Wage Gap in Murray?
Income or Wage Gap in Murray is 48.6%.
Women in Murray earn 51.4 cents for every dollar earned by a man.
What is Family Income Deficit in Murray?
Family Income Deficit in Murray is $12,356.
Families that are below poverty line in Murray earn $12,356 less on average than the poverty threshold level.
What is Inequality or Gini Index in Murray?
Inequality or Gini Index in Murray is 0.51.
What is the Total Population of Murray?
Total Population of Murray is 17,414.
What is the Total Male Population of Murray?
Total Male Population of Murray is 8,299.
What is the Total Female Population of Murray?
Total Female Population of Murray is 9,115.
What is the Ratio of Males per 100 Females in Murray?
There are 91.05 Males per 100 Females in Murray.
What is the Ratio of Females per 100 Males in Murray?
There are 109.83 Females per 100 Males in Murray.
What is the Median Population Age in Murray?
Median Population Age in Murray is 25.6 Years.
What is the Average Family Size in Murray
Average Family Size in Murray is 2.9 People.
What is the Average Household Size in Murray
Average Household Size in Murray is 2.2 People.
How Large is the Labor Force in Murray?
There are 8,685 People in the Labor Forcein in Murray.
What is the Percentage of People in the Labor Force in Murray?
57.5% of People are in the Labor Force in Murray.
What is the Unemployment Rate in Murray?
Unemployment Rate in Murray is 5.1%.