Keene, KY Map & Demographics
Keene Map
Keene Overview
$34,041
PER CAPITA INCOME
$120,875
AVG FAMILY INCOME
$120,688
AVG HOUSEHOLD INCOME
85.0%
WAGE / INCOME GAP [ % ]
15.0¢/ $1
WAGE / INCOME GAP [ $ ]
0.26
INEQUALITY / GINI INDEX
247
TOTAL POPULATION
141
MALE POPULATION
106
FEMALE POPULATION
133.02
MALES / 100 FEMALES
75.18
FEMALES / 100 MALES
48.4
MEDIAN AGE
4.2
AVG FAMILY SIZE
6.0
AVG HOUSEHOLD SIZE
209
LABOR FORCE [ PEOPLE ]
84.6%
PERCENT IN LABOR FORCE
Keene Zip Codes
Keene Area Codes
Income in Keene
Income Overview in Keene
Per Capita Income in Keene is $34,041, while median incomes of families and households are $120,875 and $120,688 respectively.
| Characteristic | Number | Measure |
| Per Capita Income | 247 | $34,041 |
| Median Family Income | 38 | $120,875 |
| Mean Family Income | 38 | $115,782 |
| Median Household Income | 41 | $120,688 |
| Mean Household Income | 41 | $111,251 |
| Income Deficit | 38 | $0 |
| Wage / Income Gap (%) | 247 | 84.99% |
| Wage / Income Gap ($) | 247 | 15.01¢ per $1 |
| Gini / Inequality Index | 247 | 0.26 |
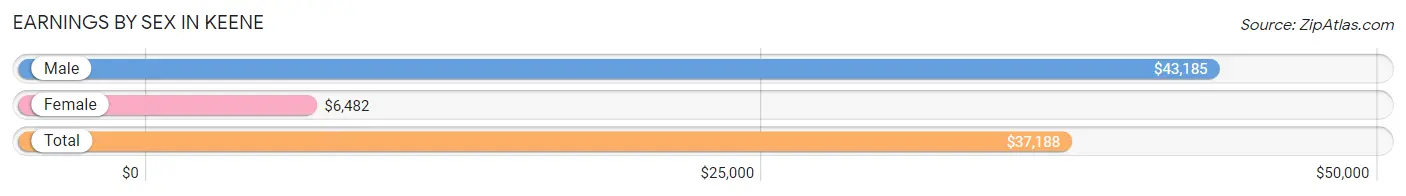
Earnings by Sex in Keene
Average Earnings in Keene are $37,188, $43,185 for men and $6,482 for women, a difference of 85.0%.
| Sex | Number | Average Earnings |
| Male | 134 (61.8%) | $43,185 |
| Female | 83 (38.3%) | $6,482 |
| Total | 217 (100.0%) | $37,188 |
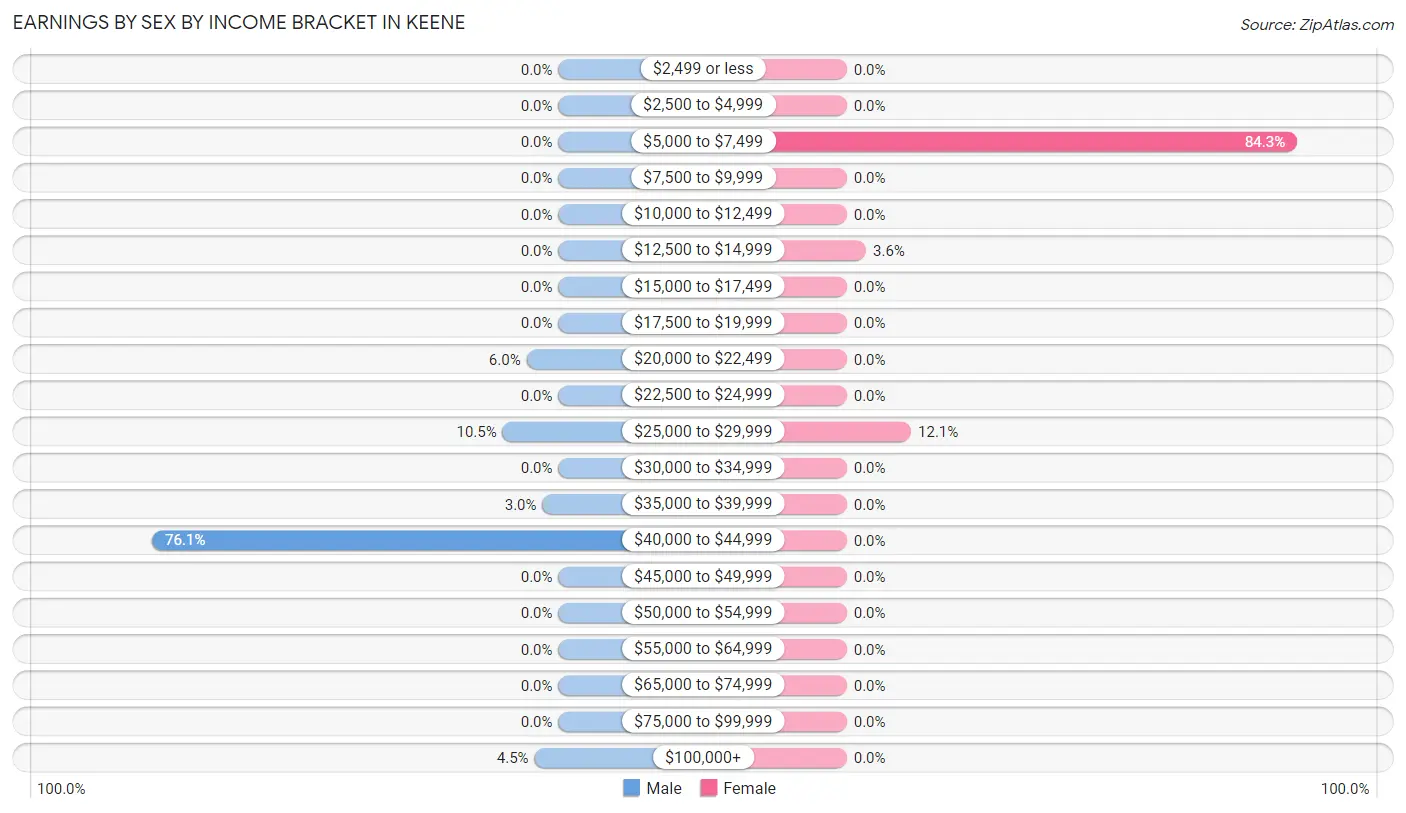
Earnings by Sex by Income Bracket in Keene
The most common earnings brackets in Keene are $40,000 to $44,999 for men (102 | 76.1%) and $5,000 to $7,499 for women (70 | 84.3%).
| Income | Male | Female |
| $2,499 or less | 0 (0.0%) | 0 (0.0%) |
| $2,500 to $4,999 | 0 (0.0%) | 0 (0.0%) |
| $5,000 to $7,499 | 0 (0.0%) | 70 (84.3%) |
| $7,500 to $9,999 | 0 (0.0%) | 0 (0.0%) |
| $10,000 to $12,499 | 0 (0.0%) | 0 (0.0%) |
| $12,500 to $14,999 | 0 (0.0%) | 3 (3.6%) |
| $15,000 to $17,499 | 0 (0.0%) | 0 (0.0%) |
| $17,500 to $19,999 | 0 (0.0%) | 0 (0.0%) |
| $20,000 to $22,499 | 8 (6.0%) | 0 (0.0%) |
| $22,500 to $24,999 | 0 (0.0%) | 0 (0.0%) |
| $25,000 to $29,999 | 14 (10.4%) | 10 (12.0%) |
| $30,000 to $34,999 | 0 (0.0%) | 0 (0.0%) |
| $35,000 to $39,999 | 4 (3.0%) | 0 (0.0%) |
| $40,000 to $44,999 | 102 (76.1%) | 0 (0.0%) |
| $45,000 to $49,999 | 0 (0.0%) | 0 (0.0%) |
| $50,000 to $54,999 | 0 (0.0%) | 0 (0.0%) |
| $55,000 to $64,999 | 0 (0.0%) | 0 (0.0%) |
| $65,000 to $74,999 | 0 (0.0%) | 0 (0.0%) |
| $75,000 to $99,999 | 0 (0.0%) | 0 (0.0%) |
| $100,000+ | 6 (4.5%) | 0 (0.0%) |
| Total | 134 (100.0%) | 83 (100.0%) |
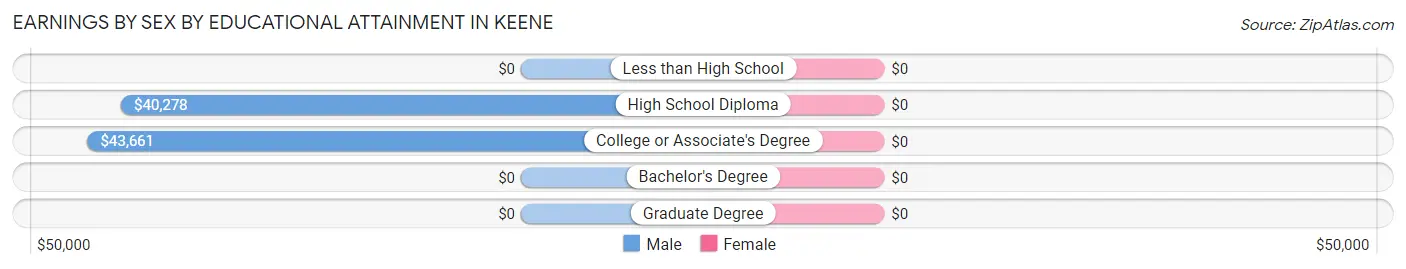
Earnings by Sex by Educational Attainment in Keene
| Educational Attainment | Male Income | Female Income |
| Less than High School | - | - |
| High School Diploma | $40,278 | $0 |
| College or Associate's Degree | $43,661 | $0 |
| Bachelor's Degree | - | - |
| Graduate Degree | - | - |
| Total | $43,185 | $6,482 |
Family Income in Keene
Family Income Brackets in Keene
According to the Keene family income data, there are 20 families falling into the $100,000 to $149,999 income range, which is the most common income bracket and makes up 52.6% of all families.
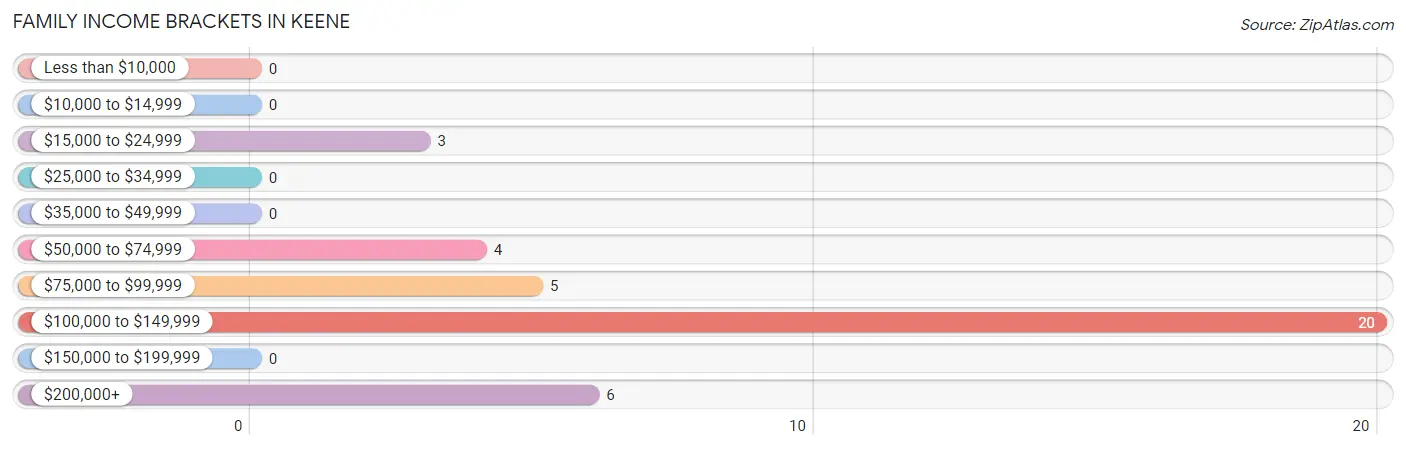
| Income Bracket | # Families | % Families |
| Less than $10,000 | 0 | 0.0% |
| $10,000 to $14,999 | 0 | 0.0% |
| $15,000 to $24,999 | 3 | 7.9% |
| $25,000 to $34,999 | 0 | 0.0% |
| $35,000 to $49,999 | 0 | 0.0% |
| $50,000 to $74,999 | 4 | 10.5% |
| $75,000 to $99,999 | 5 | 13.2% |
| $100,000 to $149,999 | 20 | 52.6% |
| $150,000 to $199,999 | 0 | 0.0% |
| $200,000+ | 6 | 15.8% |
Family Income by Famaliy Size in Keene
| Income Bracket | # Families | Median Income |
| 2-Person Families | 23 (60.5%) | $0 |
| 3-Person Families | 15 (39.5%) | $0 |
| 4-Person Families | 0 (0.0%) | $0 |
| 5-Person Families | 0 (0.0%) | $0 |
| 6-Person Families | 0 (0.0%) | $0 |
| 7+ Person Families | 0 (0.0%) | $0 |
| Total | 38 (100.0%) | $120,875 |
Family Income by Number of Earners in Keene
| Number of Earners | # Families | Median Income |
| No Earners | 0 (0.0%) | $0 |
| 1 Earner | 23 (60.5%) | $0 |
| 2 Earners | 4 (10.5%) | $0 |
| 3+ Earners | 11 (28.9%) | $0 |
| Total | 38 (100.0%) | $120,875 |
Household Income in Keene
Household Income Brackets in Keene
With 20 households falling in the category, the $100,000 to $149,999 income range is the most frequent in Keene, accounting for 48.8% of all households.
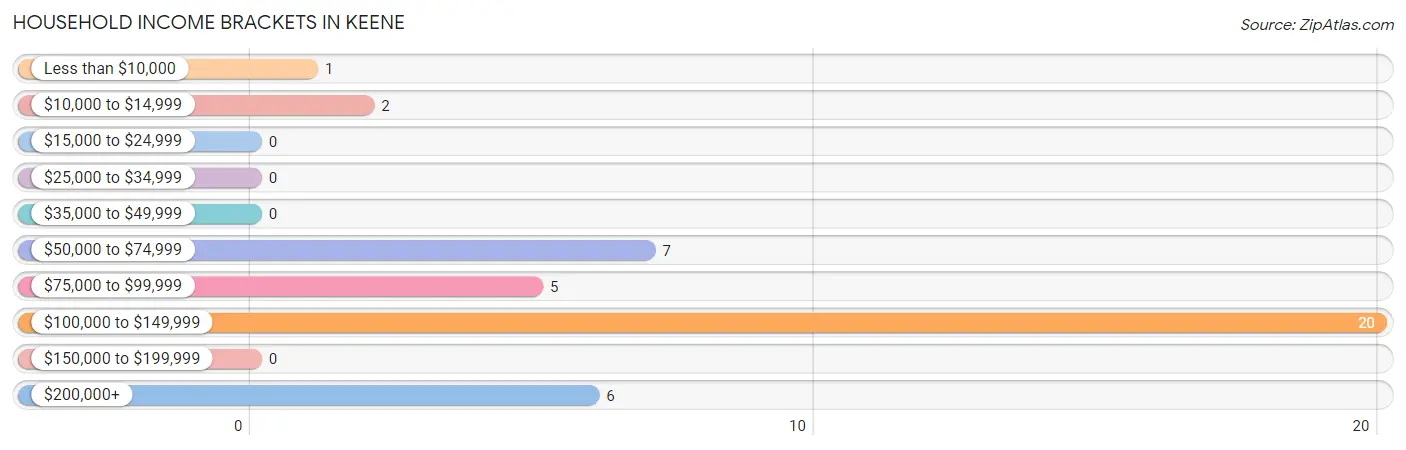
| Income Bracket | # Households | % Households |
| Less than $10,000 | 1 | 2.4% |
| $10,000 to $14,999 | 2 | 4.9% |
| $15,000 to $24,999 | 0 | 0.0% |
| $25,000 to $34,999 | 0 | 0.0% |
| $35,000 to $49,999 | 0 | 0.0% |
| $50,000 to $74,999 | 7 | 17.1% |
| $75,000 to $99,999 | 5 | 12.2% |
| $100,000 to $149,999 | 20 | 48.8% |
| $150,000 to $199,999 | 0 | 0.0% |
| $200,000+ | 6 | 14.6% |
Household Income by Householder Age in Keene
The median household income in Keene is $120,688, with the highest median household income of $120,938 found in the 65+ years age bracket for the primary householder. A total of 25 households (61.0%) fall into this category.
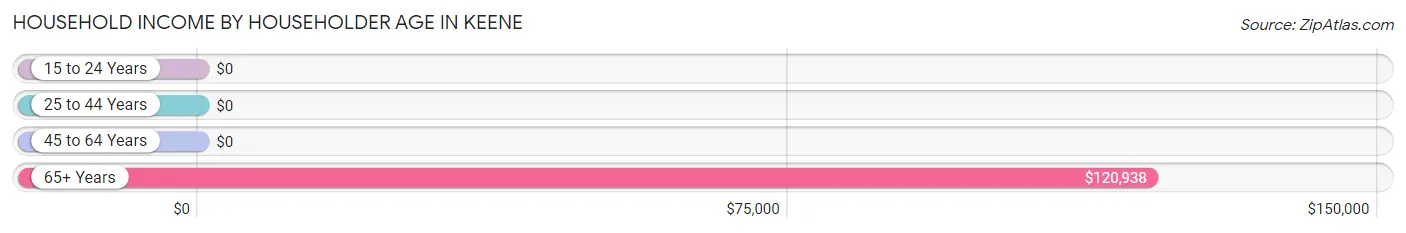
| Income Bracket | # Households | Median Income |
| 15 to 24 Years | 0 (0.0%) | $0 |
| 25 to 44 Years | 9 (22.0%) | $0 |
| 45 to 64 Years | 7 (17.1%) | $0 |
| 65+ Years | 25 (61.0%) | $120,938 |
| Total | 41 (100.0%) | $120,688 |
Poverty in Keene
Income Below Poverty by Sex and Age in Keene
With 2.1% poverty level for males and 67.9% for females among the residents of Keene, 75 year old and over males and 55 to 64 year old females are the most vulnerable to poverty, with 3 males (100.0%) and 71 females (100.0%) in their respective age groups living below the poverty level.
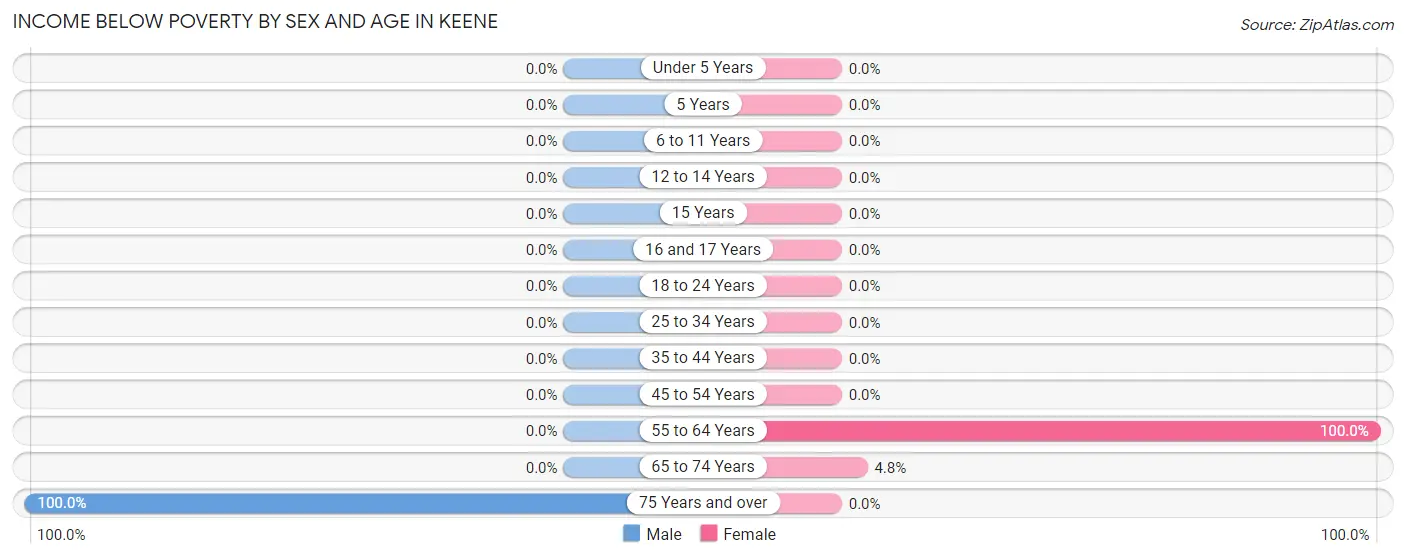
| Age Bracket | Male | Female |
| Under 5 Years | 0 (0.0%) | 0 (0.0%) |
| 5 Years | 0 (0.0%) | 0 (0.0%) |
| 6 to 11 Years | 0 (0.0%) | 0 (0.0%) |
| 12 to 14 Years | 0 (0.0%) | 0 (0.0%) |
| 15 Years | 0 (0.0%) | 0 (0.0%) |
| 16 and 17 Years | 0 (0.0%) | 0 (0.0%) |
| 18 to 24 Years | 0 (0.0%) | 0 (0.0%) |
| 25 to 34 Years | 0 (0.0%) | 0 (0.0%) |
| 35 to 44 Years | 0 (0.0%) | 0 (0.0%) |
| 45 to 54 Years | 0 (0.0%) | 0 (0.0%) |
| 55 to 64 Years | 0 (0.0%) | 71 (100.0%) |
| 65 to 74 Years | 0 (0.0%) | 1 (4.8%) |
| 75 Years and over | 3 (100.0%) | 0 (0.0%) |
| Total | 3 (2.1%) | 72 (67.9%) |
Income Above Poverty by Sex and Age in Keene
According to the poverty statistics in Keene, males aged 16 and 17 years and females aged 35 to 44 years are the age groups that are most secure financially, with 100.0% of males and 100.0% of females in these age groups living above the poverty line.
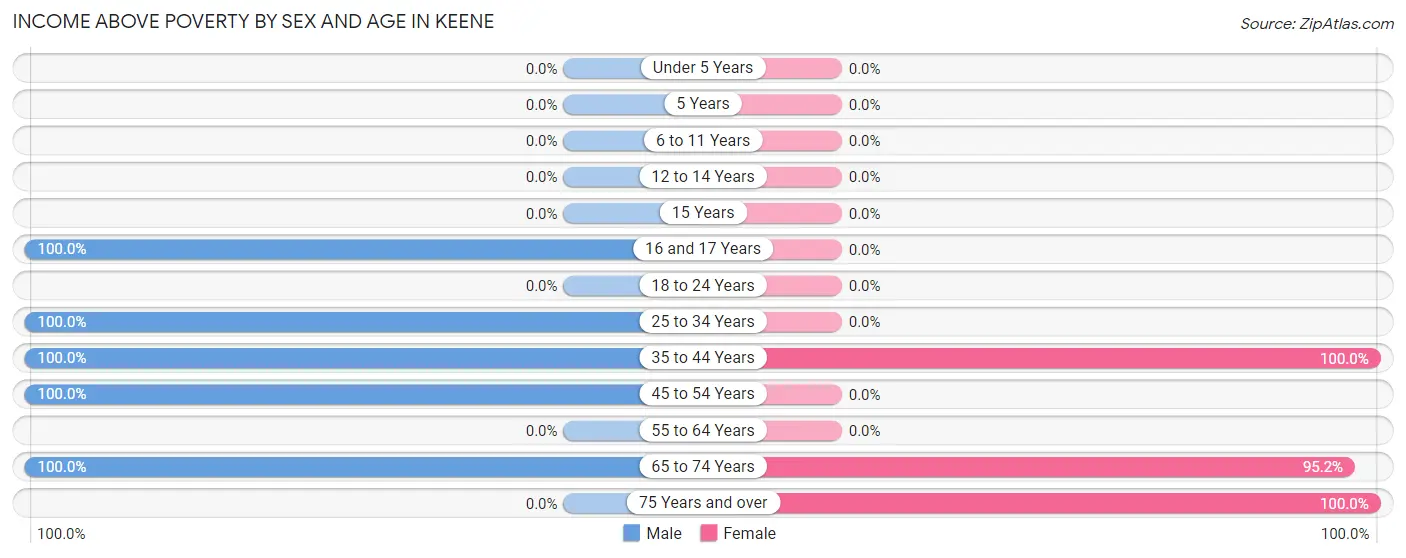
| Age Bracket | Male | Female |
| Under 5 Years | 0 (0.0%) | 0 (0.0%) |
| 5 Years | 0 (0.0%) | 0 (0.0%) |
| 6 to 11 Years | 0 (0.0%) | 0 (0.0%) |
| 12 to 14 Years | 0 (0.0%) | 0 (0.0%) |
| 15 Years | 0 (0.0%) | 0 (0.0%) |
| 16 and 17 Years | 4 (100.0%) | 0 (0.0%) |
| 18 to 24 Years | 0 (0.0%) | 0 (0.0%) |
| 25 to 34 Years | 16 (100.0%) | 0 (0.0%) |
| 35 to 44 Years | 88 (100.0%) | 13 (100.0%) |
| 45 to 54 Years | 12 (100.0%) | 0 (0.0%) |
| 55 to 64 Years | 0 (0.0%) | 0 (0.0%) |
| 65 to 74 Years | 18 (100.0%) | 20 (95.2%) |
| 75 Years and over | 0 (0.0%) | 1 (100.0%) |
| Total | 138 (97.9%) | 34 (32.1%) |
Income Below Poverty Among Married-Couple Families in Keene
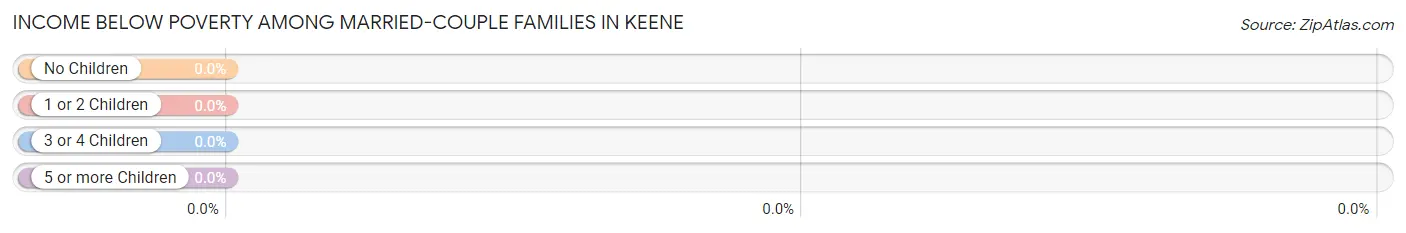
| Children | Above Poverty | Below Poverty |
| No Children | 31 (100.0%) | 0 (0.0%) |
| 1 or 2 Children | 4 (100.0%) | 0 (0.0%) |
| 3 or 4 Children | 0 (0.0%) | 0 (0.0%) |
| 5 or more Children | 0 (0.0%) | 0 (0.0%) |
| Total | 35 (100.0%) | 0 (0.0%) |
Income Below Poverty Among Single-Parent Households in Keene
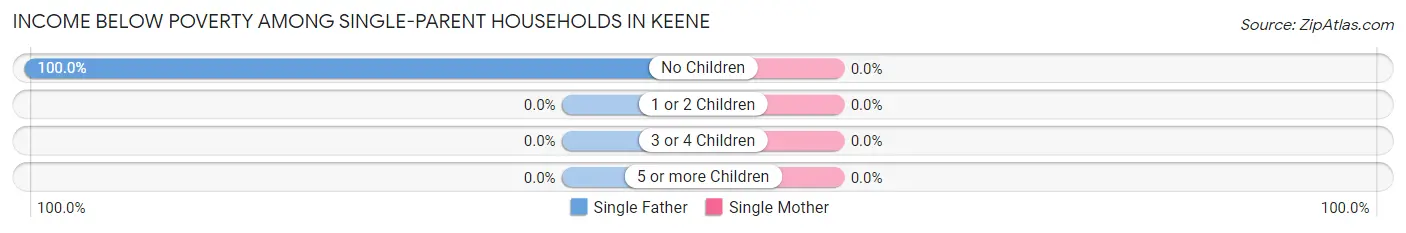
| Children | Single Father | Single Mother |
| No Children | 3 (100.0%) | 0 (0.0%) |
| 1 or 2 Children | 0 (0.0%) | 0 (0.0%) |
| 3 or 4 Children | 0 (0.0%) | 0 (0.0%) |
| 5 or more Children | 0 (0.0%) | 0 (0.0%) |
| Total | 3 (100.0%) | 0 (0.0%) |
Income Below Poverty Among Married-Couple vs Single-Parent Households in Keene
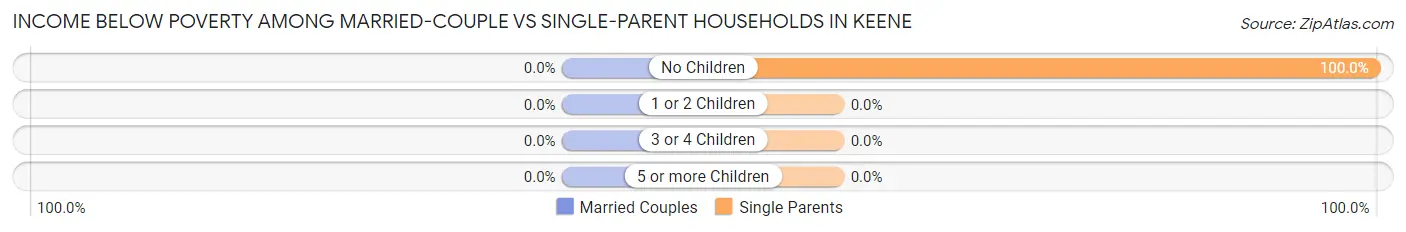
| Children | Married-Couple Families | Single-Parent Households |
| No Children | 0 (0.0%) | 3 (100.0%) |
| 1 or 2 Children | 0 (0.0%) | 0 (0.0%) |
| 3 or 4 Children | 0 (0.0%) | 0 (0.0%) |
| 5 or more Children | 0 (0.0%) | 0 (0.0%) |
| Total | 0 (0.0%) | 3 (100.0%) |
Race in Keene
The most populous races in Keene are Black / African American (197 | 79.8%), White / Caucasian (49 | 19.8%), and Hispanic or Latino (1 | 0.4%).
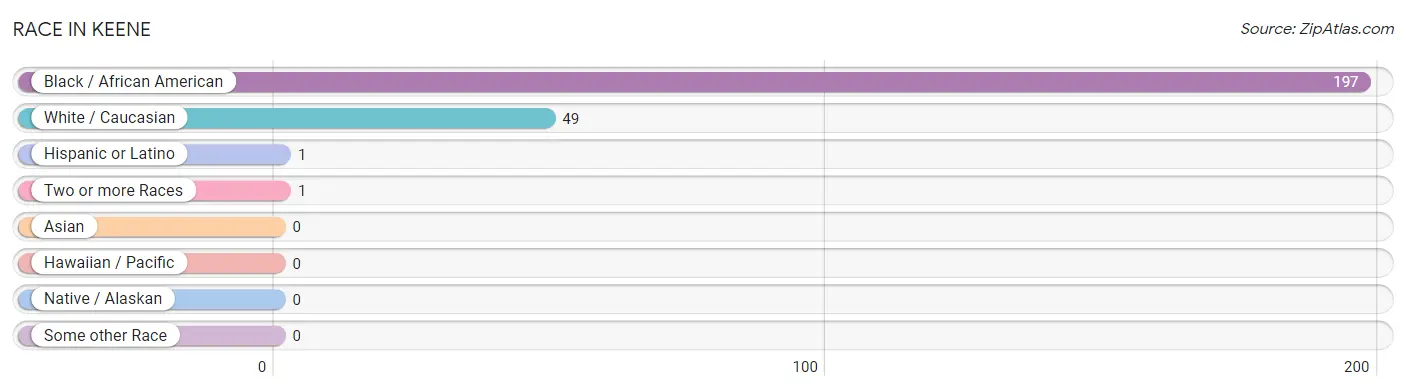
| Race | # Population | % Population |
| Asian | 0 | 0.0% |
| Black / African American | 197 | 79.8% |
| Hawaiian / Pacific | 0 | 0.0% |
| Hispanic or Latino | 1 | 0.4% |
| Native / Alaskan | 0 | 0.0% |
| White / Caucasian | 49 | 19.8% |
| Two or more Races | 1 | 0.4% |
| Some other Race | 0 | 0.0% |
| Total | 247 | 100.0% |
Ancestry in Keene
The most populous ancestries reported in Keene are English (14 | 5.7%), American (11 | 4.4%), Irish (7 | 2.8%), German (5 | 2.0%), and Swedish (5 | 2.0%), together accounting for 17.0% of all Keene residents.
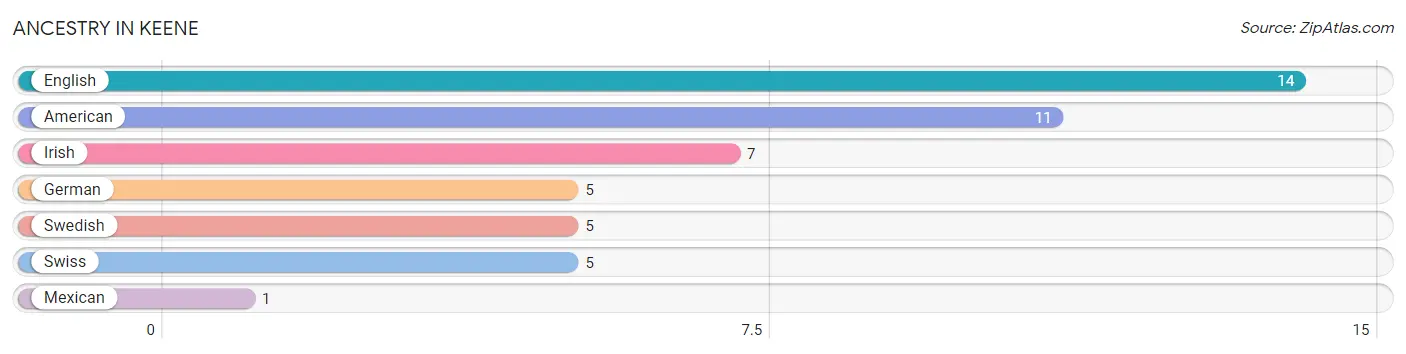
| Ancestry | # Population | % Population |
| American | 11 | 4.4% |
| English | 14 | 5.7% |
| German | 5 | 2.0% |
| Irish | 7 | 2.8% |
| Mexican | 1 | 0.4% |
| Swedish | 5 | 2.0% |
| Swiss | 5 | 2.0% | View All 7 Rows |
Immigrants in Keene

| Immigration Origin | # Population | % Population | View All 0 Rows |
Sex and Age in Keene
Sex and Age in Keene
The most populous age groups in Keene are 35 to 39 Years (88 | 62.4%) for men and 55 to 59 Years (70 | 66.0%) for women.
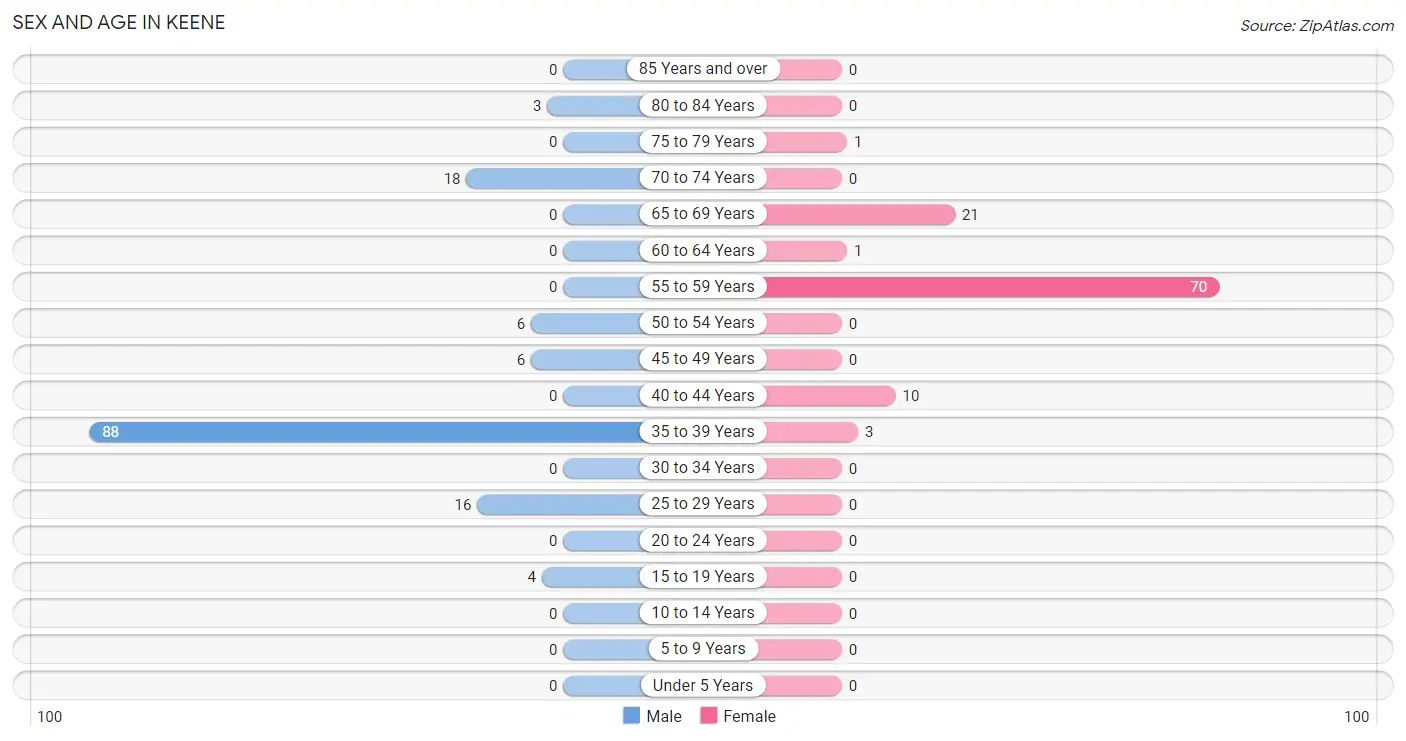
| Age Bracket | Male | Female |
| Under 5 Years | 0 (0.0%) | 0 (0.0%) |
| 5 to 9 Years | 0 (0.0%) | 0 (0.0%) |
| 10 to 14 Years | 0 (0.0%) | 0 (0.0%) |
| 15 to 19 Years | 4 (2.8%) | 0 (0.0%) |
| 20 to 24 Years | 0 (0.0%) | 0 (0.0%) |
| 25 to 29 Years | 16 (11.4%) | 0 (0.0%) |
| 30 to 34 Years | 0 (0.0%) | 0 (0.0%) |
| 35 to 39 Years | 88 (62.4%) | 3 (2.8%) |
| 40 to 44 Years | 0 (0.0%) | 10 (9.4%) |
| 45 to 49 Years | 6 (4.3%) | 0 (0.0%) |
| 50 to 54 Years | 6 (4.3%) | 0 (0.0%) |
| 55 to 59 Years | 0 (0.0%) | 70 (66.0%) |
| 60 to 64 Years | 0 (0.0%) | 1 (0.9%) |
| 65 to 69 Years | 0 (0.0%) | 21 (19.8%) |
| 70 to 74 Years | 18 (12.8%) | 0 (0.0%) |
| 75 to 79 Years | 0 (0.0%) | 1 (0.9%) |
| 80 to 84 Years | 3 (2.1%) | 0 (0.0%) |
| 85 Years and over | 0 (0.0%) | 0 (0.0%) |
| Total | 141 (100.0%) | 106 (100.0%) |
Families and Households in Keene
Median Family Size in Keene
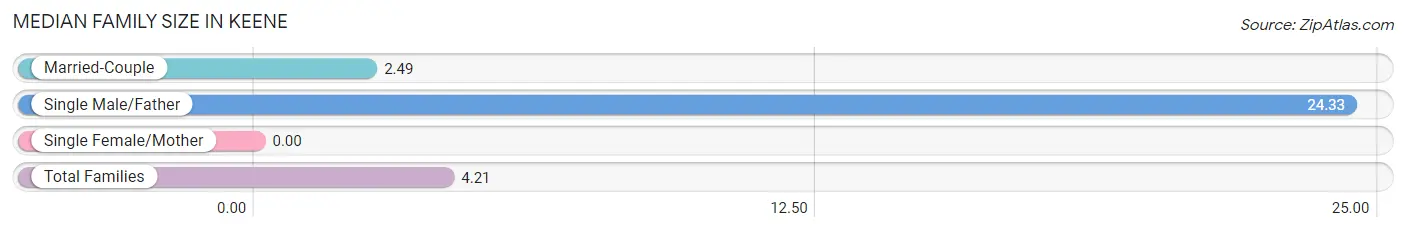
| Family Type | # Families | Family Size |
| Married-Couple | 35 (92.1%) | 2.49 |
| Single Male/Father | 3 (7.9%) | 24.33 |
| Single Female/Mother | 0 (0.0%) | - |
| Total Families | 38 (100.0%) | 4.21 |
Median Household Size in Keene
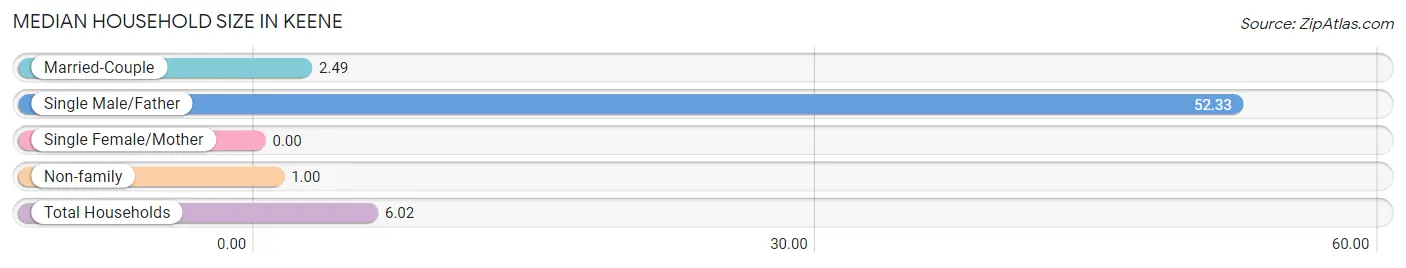
| Household Type | # Households | Household Size |
| Married-Couple | 35 (85.4%) | 2.49 |
| Single Male/Father | 3 (7.3%) | 52.33 |
| Single Female/Mother | 0 (0.0%) | - |
| Non-family | 3 (7.3%) | 1.00 |
| Total Households | 41 (100.0%) | 6.02 |
Household Size by Marriage Status in Keene
Out of a total of 41 households in Keene, 38 (92.7%) are family households, while 3 (7.3%) are nonfamily households. The most numerous type of family households are 2-person households, comprising 20, and the most common type of nonfamily households are 1-person households, comprising 3.
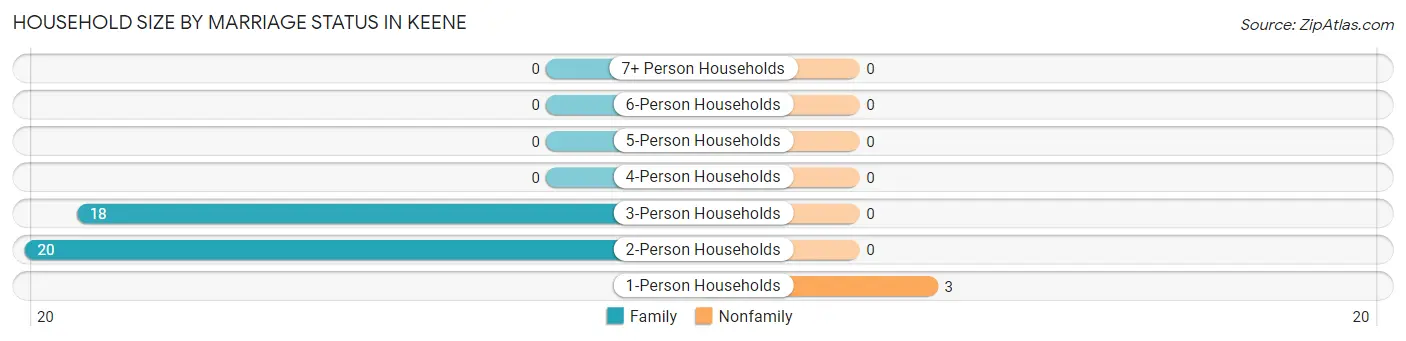
| Household Size | Family Households | Nonfamily Households |
| 1-Person Households | - | 3 (7.3%) |
| 2-Person Households | 20 (48.8%) | 0 (0.0%) |
| 3-Person Households | 18 (43.9%) | 0 (0.0%) |
| 4-Person Households | 0 (0.0%) | 0 (0.0%) |
| 5-Person Households | 0 (0.0%) | 0 (0.0%) |
| 6-Person Households | 0 (0.0%) | 0 (0.0%) |
| 7+ Person Households | 0 (0.0%) | 0 (0.0%) |
| Total | 38 (92.7%) | 3 (7.3%) |
Female Fertility in Keene
Fertility by Age in Keene
| Age Bracket | Women with Births | Births / 1,000 Women |
| 15 to 19 years | 0 (0.0%) | 0.0 |
| 20 to 34 years | 0 (0.0%) | 0.0 |
| 35 to 50 years | 0 (0.0%) | 0.0 |
| Total | 0 (0.0%) | 0.0 |
Fertility by Age by Marriage Status in Keene
| Age Bracket | Married | Unmarried |
| 15 to 19 years | 0 (0.0%) | 0 (0.0%) |
| 20 to 34 years | 0 (0.0%) | 0 (0.0%) |
| 35 to 50 years | 0 (0.0%) | 0 (0.0%) |
| Total | 0 (0.0%) | 0 (0.0%) |
Fertility by Education in Keene
| Educational Attainment | Women with Births | Births / 1,000 Women |
| Less than High School | 0 (0.0%) | 0.0 |
| High School Diploma | 0 (0.0%) | 0.0 |
| College or Associate's Degree | 0 (0.0%) | 0.0 |
| Bachelor's Degree | 0 (0.0%) | 0.0 |
| Graduate Degree | 0 (0.0%) | 0.0 |
| Total | 0 (0.0%) | 0.0 |
Fertility by Education by Marriage Status in Keene
| Educational Attainment | Married | Unmarried |
| Less than High School | 0 (0.0%) | 0 (0.0%) |
| High School Diploma | 0 (0.0%) | 0 (0.0%) |
| College or Associate's Degree | 0 (0.0%) | 0 (0.0%) |
| Bachelor's Degree | 0 (0.0%) | 0 (0.0%) |
| Graduate Degree | 0 (0.0%) | 0 (0.0%) |
| Total | 0 (0.0%) | 0 (0.0%) |
Employment Characteristics in Keene
Employment by Class of Employer in Keene
Among the 209 employed individuals in Keene, private company employees (186 | 89.0%), federal government employees (18 | 8.6%), and not-for-profit organizations (5 | 2.4%) make up the most common classes of employment.
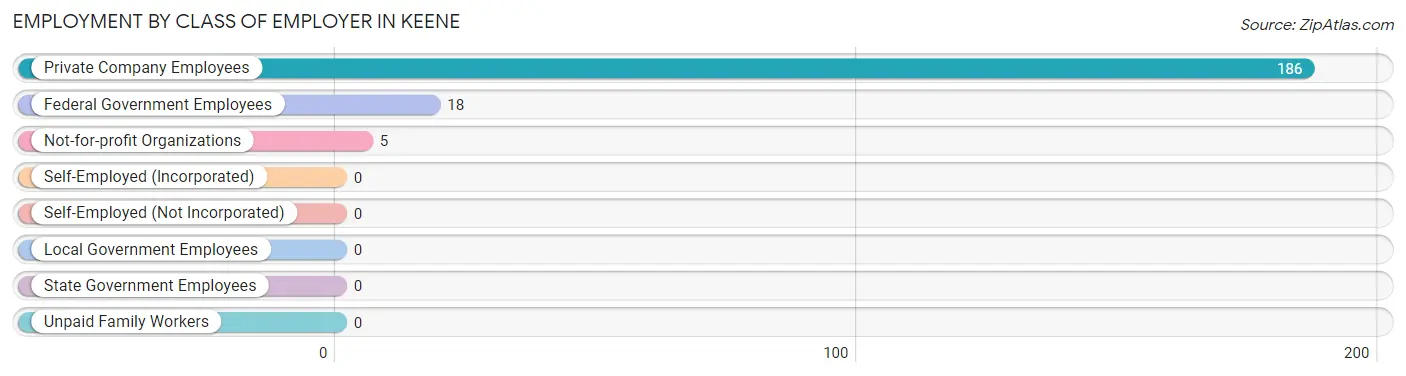
| Employer Class | # Employees | % Employees |
| Private Company Employees | 186 | 89.0% |
| Self-Employed (Incorporated) | 0 | 0.0% |
| Self-Employed (Not Incorporated) | 0 | 0.0% |
| Not-for-profit Organizations | 5 | 2.4% |
| Local Government Employees | 0 | 0.0% |
| State Government Employees | 0 | 0.0% |
| Federal Government Employees | 18 | 8.6% |
| Unpaid Family Workers | 0 | 0.0% |
| Total | 209 | 100.0% |
Employment Status by Age in Keene
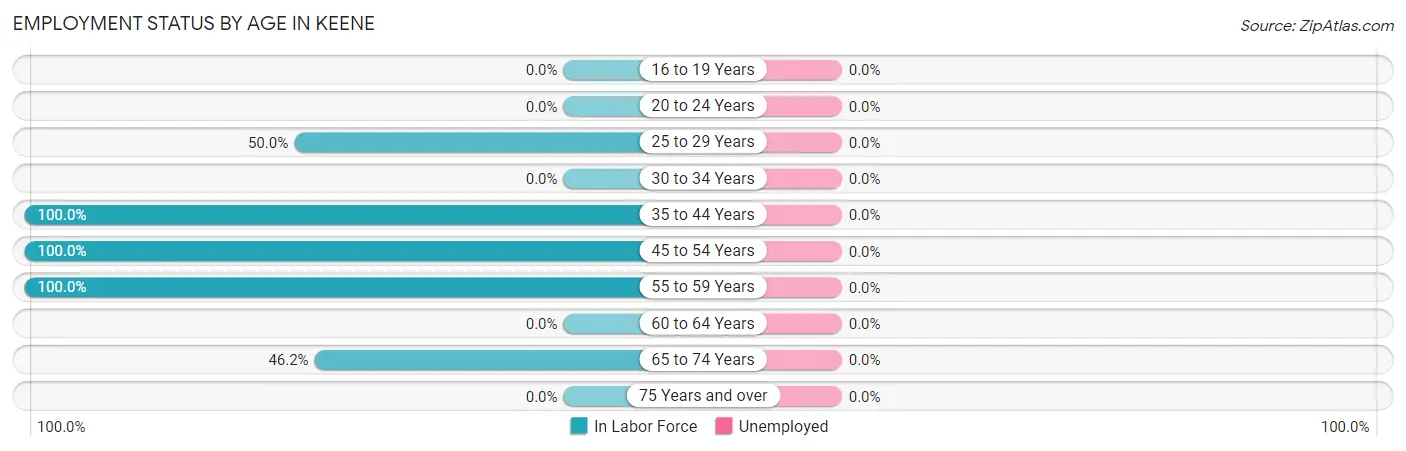
| Age Bracket | In Labor Force | Unemployed |
| 16 to 19 Years | 0 (0.0%) | 0 (0.0%) |
| 20 to 24 Years | 0 (0.0%) | 0 (0.0%) |
| 25 to 29 Years | 8 (50.0%) | 0 (0.0%) |
| 30 to 34 Years | 0 (0.0%) | 0 (0.0%) |
| 35 to 44 Years | 101 (100.0%) | 0 (0.0%) |
| 45 to 54 Years | 12 (100.0%) | 0 (0.0%) |
| 55 to 59 Years | 70 (100.0%) | 0 (0.0%) |
| 60 to 64 Years | 0 (0.0%) | 0 (0.0%) |
| 65 to 74 Years | 18 (46.2%) | 0 (0.0%) |
| 75 Years and over | 0 (0.0%) | 0 (0.0%) |
| Total | 209 (84.6%) | 0 (0.0%) |
Employment Status by Educational Attainment in Keene
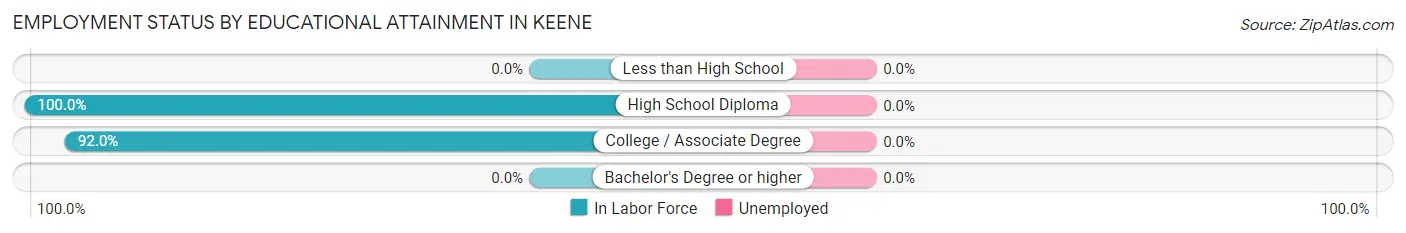
| Educational Attainment | In Labor Force | Unemployed |
| Less than High School | 0 (0.0%) | 0 (0.0%) |
| High School Diploma | 87 (100.0%) | 0 (0.0%) |
| College / Associate Degree | 104 (92.0%) | 0 (0.0%) |
| Bachelor's Degree or higher | 0 (0.0%) | 0 (0.0%) |
| Total | 191 (95.5%) | 0 (0.0%) |
Employment Occupations by Sex in Keene
Management, Business, Science and Arts Occupations
The most common Management, Business, Science and Arts occupations in Keene are , and Management (6 | 2.9%).
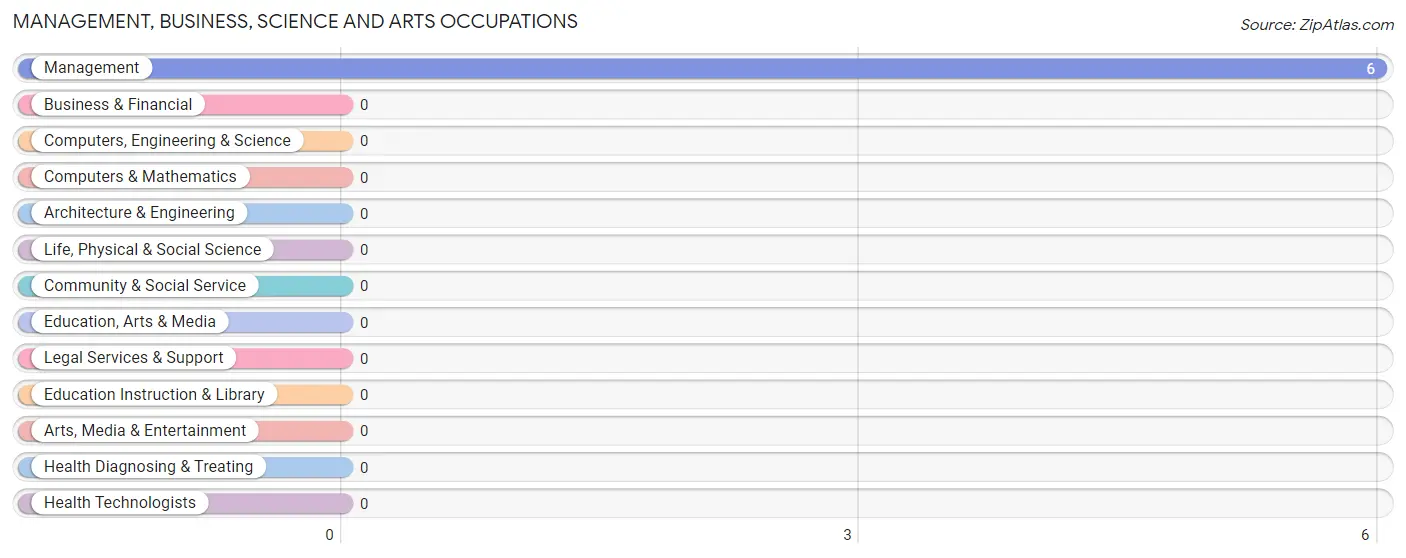
Management, Business, Science and Arts Occupations by Sex
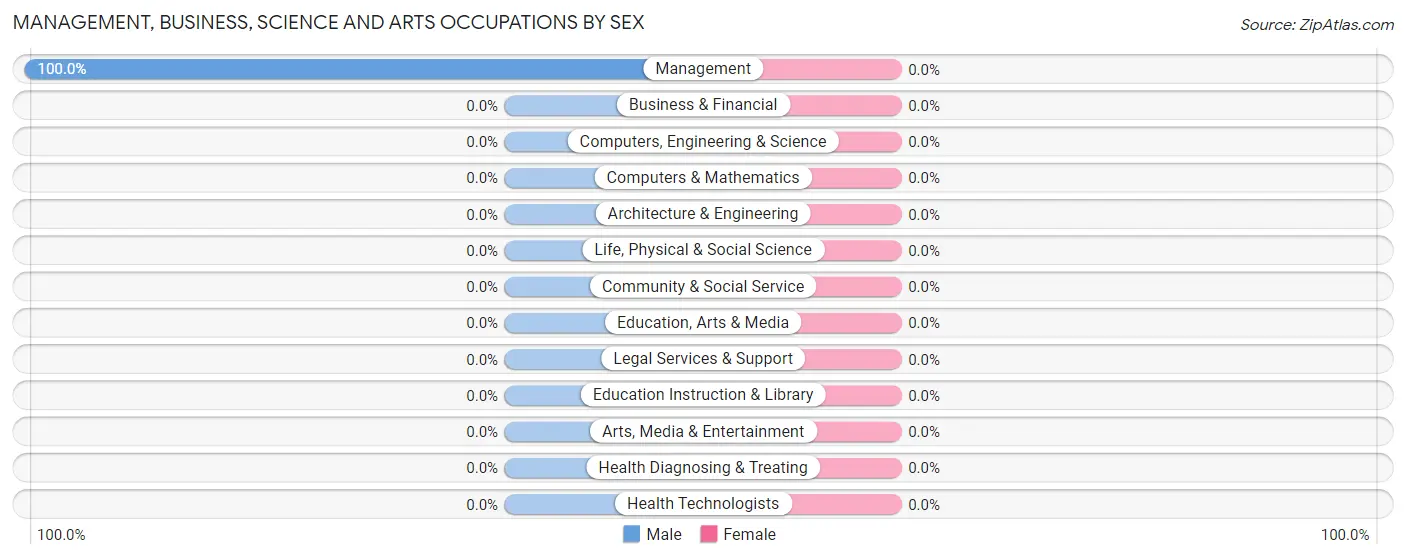
| Occupation | Male | Female |
| Management | 6 (100.0%) | 0 (0.0%) |
| Business & Financial | 0 (0.0%) | 0 (0.0%) |
| Computers, Engineering & Science | 0 (0.0%) | 0 (0.0%) |
| Computers & Mathematics | 0 (0.0%) | 0 (0.0%) |
| Architecture & Engineering | 0 (0.0%) | 0 (0.0%) |
| Life, Physical & Social Science | 0 (0.0%) | 0 (0.0%) |
| Community & Social Service | 0 (0.0%) | 0 (0.0%) |
| Education, Arts & Media | 0 (0.0%) | 0 (0.0%) |
| Legal Services & Support | 0 (0.0%) | 0 (0.0%) |
| Education Instruction & Library | 0 (0.0%) | 0 (0.0%) |
| Arts, Media & Entertainment | 0 (0.0%) | 0 (0.0%) |
| Health Diagnosing & Treating | 0 (0.0%) | 0 (0.0%) |
| Health Technologists | 0 (0.0%) | 0 (0.0%) |
| Total (Category) | 6 (100.0%) | 0 (0.0%) |
| Total (Overall) | 126 (60.3%) | 83 (39.7%) |
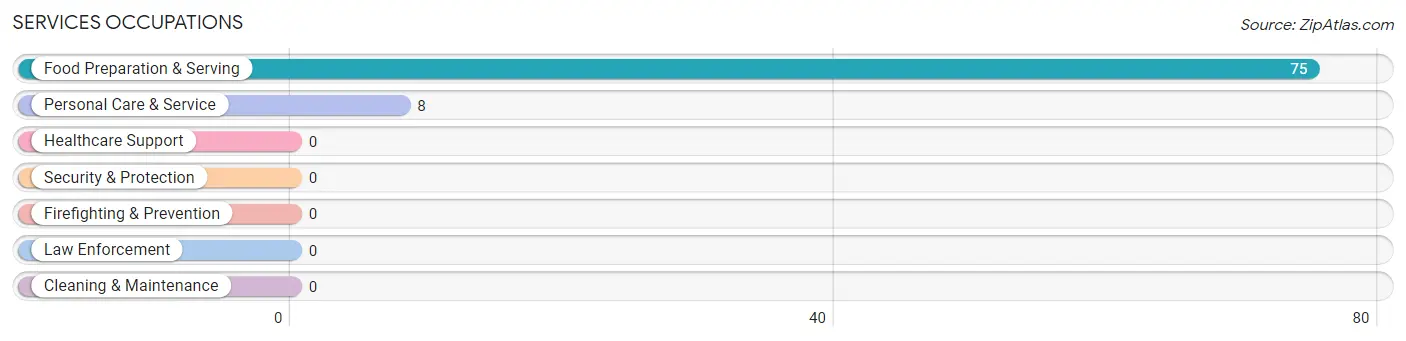
Services Occupations
The most common Services occupations in Keene are Food Preparation & Serving (75 | 35.9%), and Personal Care & Service (8 | 3.8%).
Services Occupations by Sex
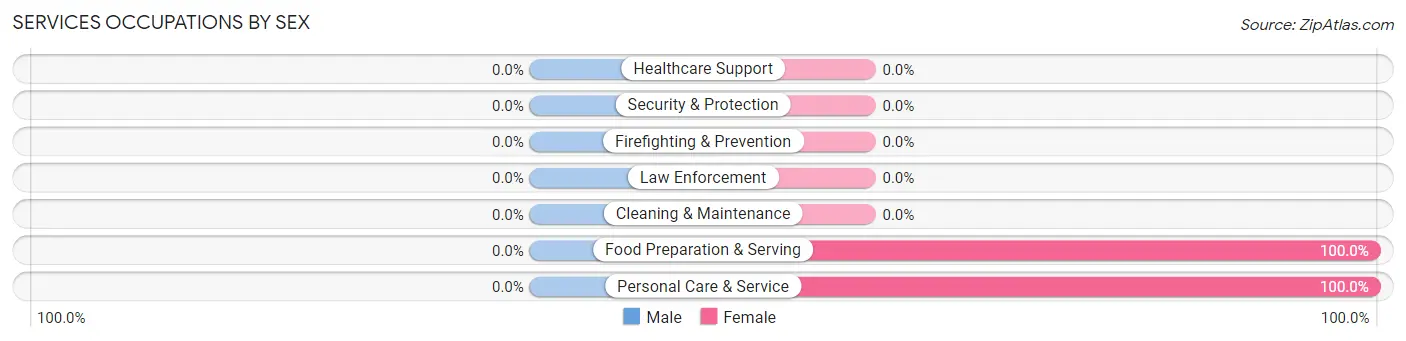
| Occupation | Male | Female |
| Healthcare Support | 0 (0.0%) | 0 (0.0%) |
| Security & Protection | 0 (0.0%) | 0 (0.0%) |
| Firefighting & Prevention | 0 (0.0%) | 0 (0.0%) |
| Law Enforcement | 0 (0.0%) | 0 (0.0%) |
| Food Preparation & Serving | 0 (0.0%) | 75 (100.0%) |
| Cleaning & Maintenance | 0 (0.0%) | 0 (0.0%) |
| Personal Care & Service | 0 (0.0%) | 8 (100.0%) |
| Total (Category) | 0 (0.0%) | 83 (100.0%) |
| Total (Overall) | 126 (60.3%) | 83 (39.7%) |
Sales and Office Occupations
The most common Sales and Office occupations in Keene are , and Sales & Related (84 | 40.2%).

Sales and Office Occupations by Sex

| Occupation | Male | Female |
| Sales & Related | 84 (100.0%) | 0 (0.0%) |
| Office & Administration | 0 (0.0%) | 0 (0.0%) |
| Total (Category) | 84 (100.0%) | 0 (0.0%) |
| Total (Overall) | 126 (60.3%) | 83 (39.7%) |
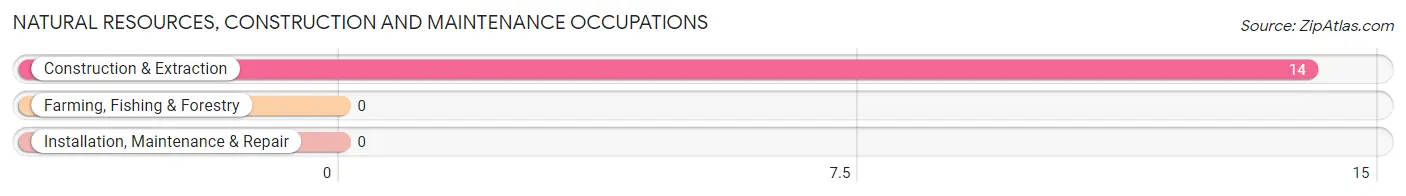
Natural Resources, Construction and Maintenance Occupations
The most common Natural Resources, Construction and Maintenance occupations in Keene are , and Construction & Extraction (14 | 6.7%).
Natural Resources, Construction and Maintenance Occupations by Sex

| Occupation | Male | Female |
| Farming, Fishing & Forestry | 0 (0.0%) | 0 (0.0%) |
| Construction & Extraction | 14 (100.0%) | 0 (0.0%) |
| Installation, Maintenance & Repair | 0 (0.0%) | 0 (0.0%) |
| Total (Category) | 14 (100.0%) | 0 (0.0%) |
| Total (Overall) | 126 (60.3%) | 83 (39.7%) |
Production, Transportation and Moving Occupations
The most common Production, Transportation and Moving occupations in Keene are Material Moving (18 | 8.6%), and Production (4 | 1.9%).
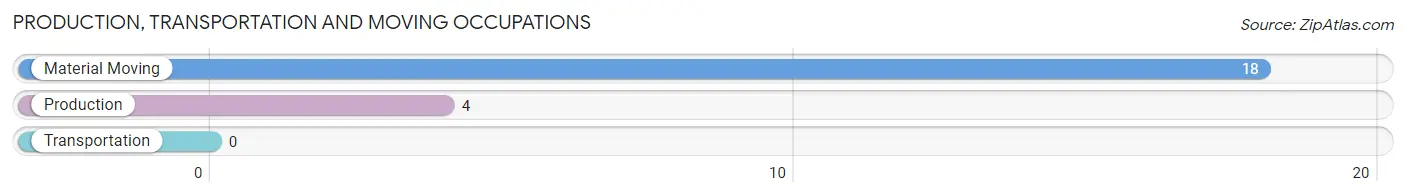
Production, Transportation and Moving Occupations by Sex
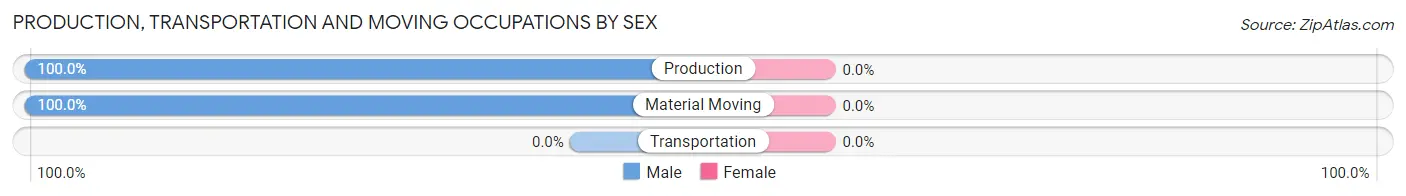
| Occupation | Male | Female |
| Production | 4 (100.0%) | 0 (0.0%) |
| Transportation | 0 (0.0%) | 0 (0.0%) |
| Material Moving | 18 (100.0%) | 0 (0.0%) |
| Total (Category) | 22 (100.0%) | 0 (0.0%) |
| Total (Overall) | 126 (60.3%) | 83 (39.7%) |
Employment Industries by Sex in Keene
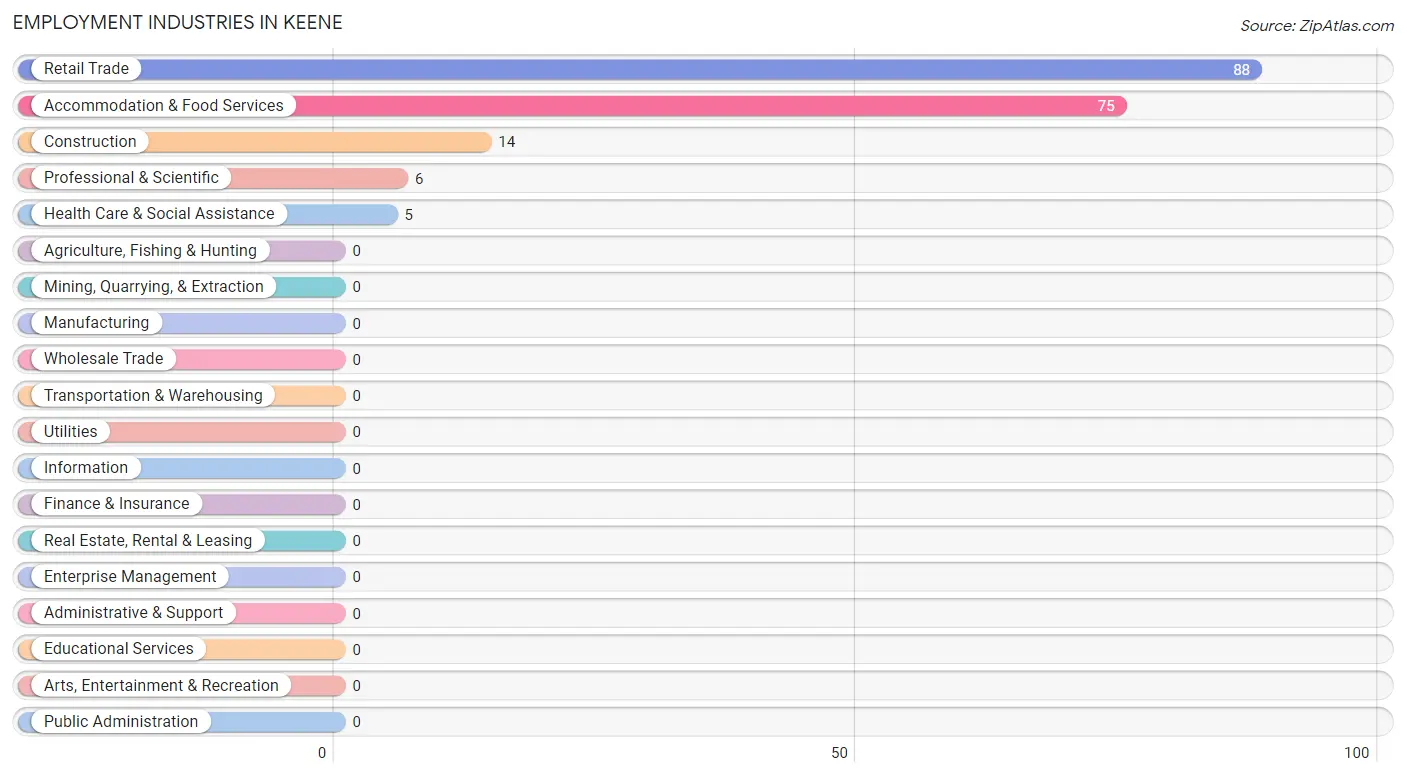
Employment Industries in Keene
The major employment industries in Keene include Retail Trade (88 | 42.1%), Accommodation & Food Services (75 | 35.9%), Construction (14 | 6.7%), Professional & Scientific (6 | 2.9%), and Health Care & Social Assistance (5 | 2.4%).
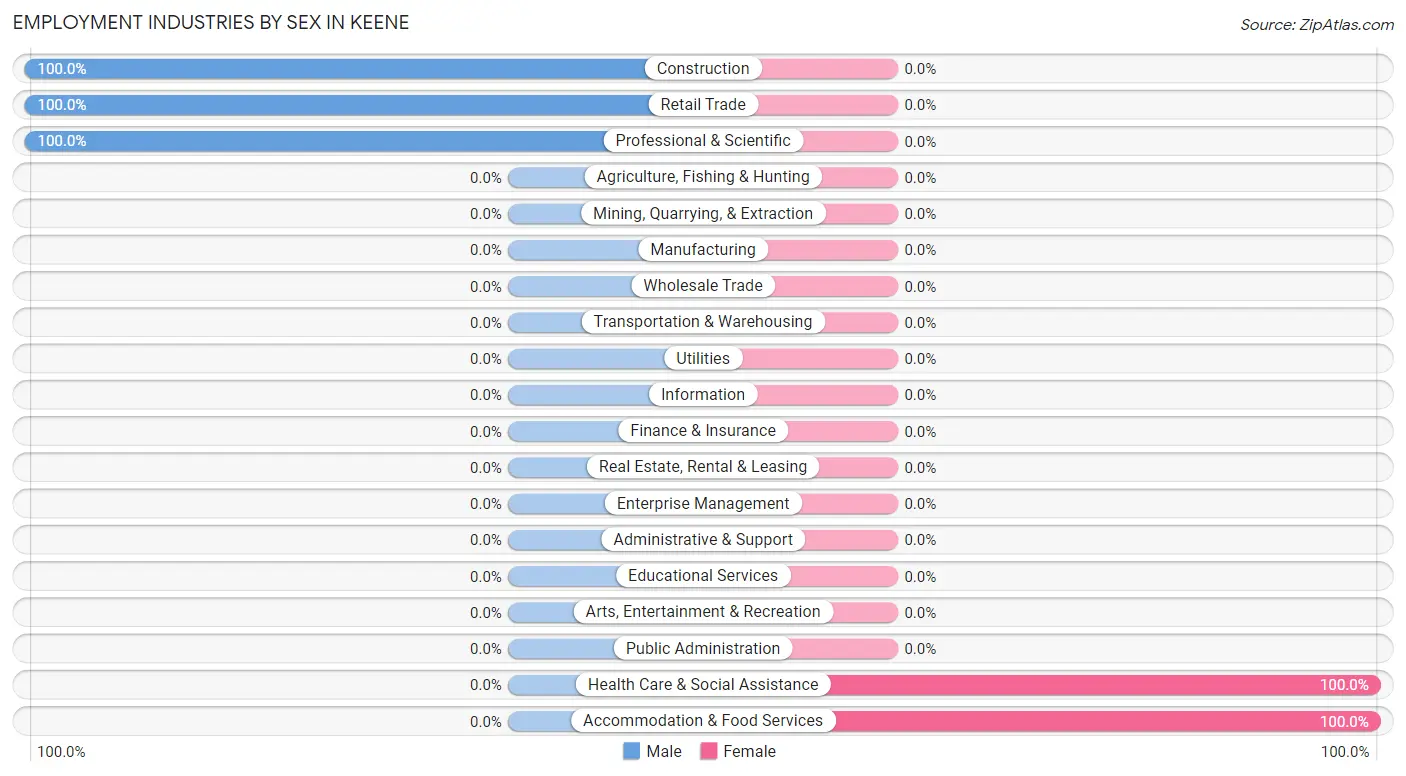
Employment Industries by Sex in Keene
The Keene industries that see more men than women are Construction (100.0%), Retail Trade (100.0%), and Professional & Scientific (100.0%), whereas the industries that tend to have a higher number of women are Health Care & Social Assistance (100.0%), and Accommodation & Food Services (100.0%).
| Industry | Male | Female |
| Agriculture, Fishing & Hunting | 0 (0.0%) | 0 (0.0%) |
| Mining, Quarrying, & Extraction | 0 (0.0%) | 0 (0.0%) |
| Construction | 14 (100.0%) | 0 (0.0%) |
| Manufacturing | 0 (0.0%) | 0 (0.0%) |
| Wholesale Trade | 0 (0.0%) | 0 (0.0%) |
| Retail Trade | 88 (100.0%) | 0 (0.0%) |
| Transportation & Warehousing | 0 (0.0%) | 0 (0.0%) |
| Utilities | 0 (0.0%) | 0 (0.0%) |
| Information | 0 (0.0%) | 0 (0.0%) |
| Finance & Insurance | 0 (0.0%) | 0 (0.0%) |
| Real Estate, Rental & Leasing | 0 (0.0%) | 0 (0.0%) |
| Professional & Scientific | 6 (100.0%) | 0 (0.0%) |
| Enterprise Management | 0 (0.0%) | 0 (0.0%) |
| Administrative & Support | 0 (0.0%) | 0 (0.0%) |
| Educational Services | 0 (0.0%) | 0 (0.0%) |
| Health Care & Social Assistance | 0 (0.0%) | 5 (100.0%) |
| Arts, Entertainment & Recreation | 0 (0.0%) | 0 (0.0%) |
| Accommodation & Food Services | 0 (0.0%) | 75 (100.0%) |
| Public Administration | 0 (0.0%) | 0 (0.0%) |
| Total | 126 (60.3%) | 83 (39.7%) |
Education in Keene
School Enrollment in Keene
The most common levels of schooling among the 12 students in Keene are college / undergraduate (8 | 66.7%), and high school (4 | 33.3%).
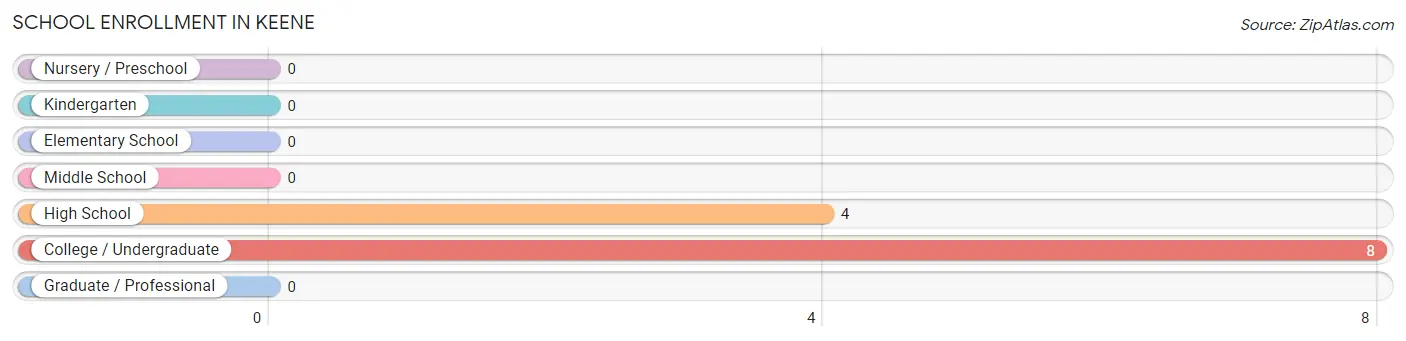
| School Level | # Students | % Students |
| Nursery / Preschool | 0 | 0.0% |
| Kindergarten | 0 | 0.0% |
| Elementary School | 0 | 0.0% |
| Middle School | 0 | 0.0% |
| High School | 4 | 33.3% |
| College / Undergraduate | 8 | 66.7% |
| Graduate / Professional | 0 | 0.0% |
| Total | 12 | 100.0% |
School Enrollment by Age by Funding Source in Keene
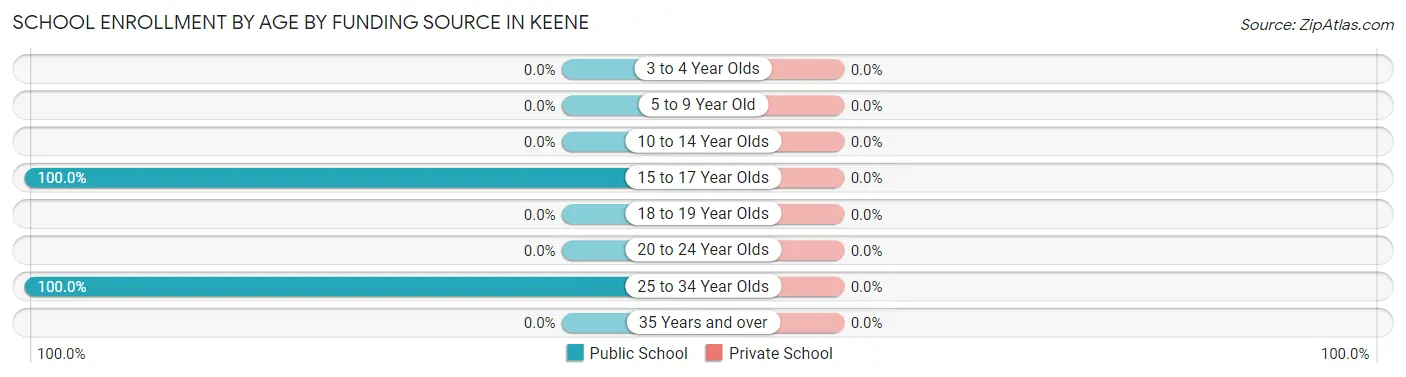
| Age Bracket | Public School | Private School |
| 3 to 4 Year Olds | 0 (0.0%) | 0 (0.0%) |
| 5 to 9 Year Old | 0 (0.0%) | 0 (0.0%) |
| 10 to 14 Year Olds | 0 (0.0%) | 0 (0.0%) |
| 15 to 17 Year Olds | 4 (100.0%) | 0 (0.0%) |
| 18 to 19 Year Olds | 0 (0.0%) | 0 (0.0%) |
| 20 to 24 Year Olds | 0 (0.0%) | 0 (0.0%) |
| 25 to 34 Year Olds | 8 (100.0%) | 0 (0.0%) |
| 35 Years and over | 0 (0.0%) | 0 (0.0%) |
| Total | 12 (100.0%) | 0 (0.0%) |
Educational Attainment by Field of Study in Keene
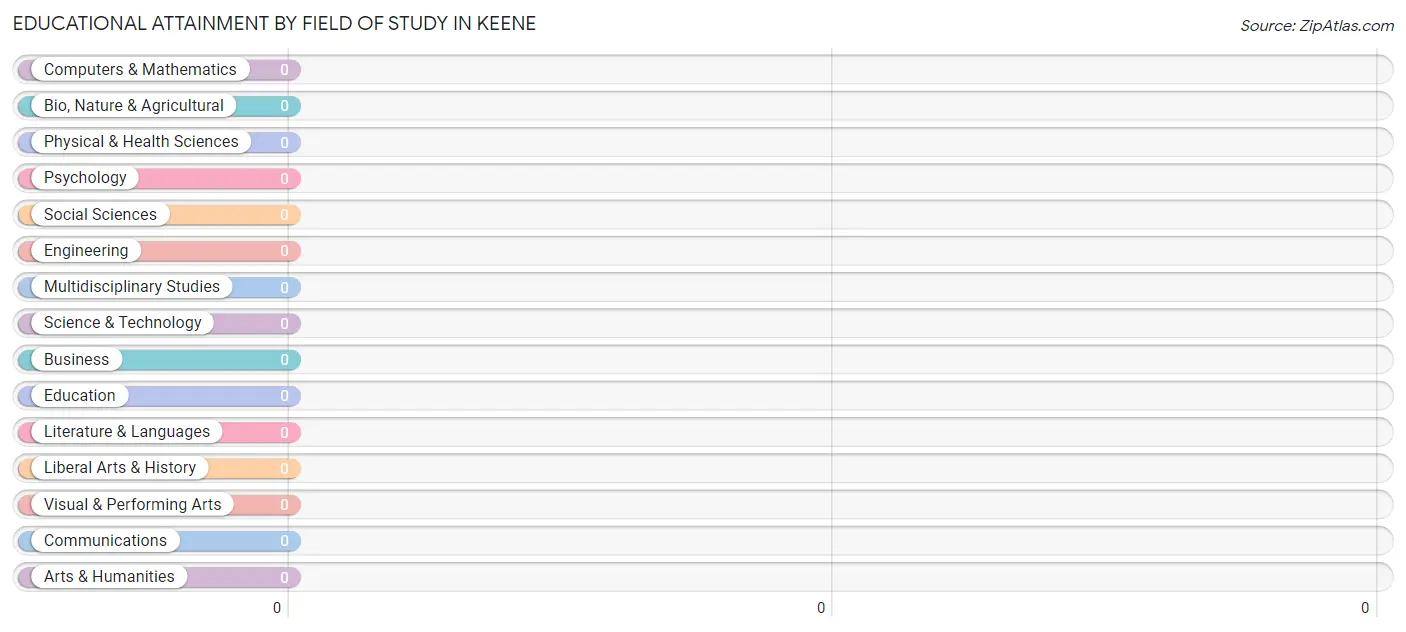
| Field of Study | # Graduates | % Graduates |
| Computers & Mathematics | 0 | 0.0% |
| Bio, Nature & Agricultural | 0 | 0.0% |
| Physical & Health Sciences | 0 | 0.0% |
| Psychology | 0 | 0.0% |
| Social Sciences | 0 | 0.0% |
| Engineering | 0 | 0.0% |
| Multidisciplinary Studies | 0 | 0.0% |
| Science & Technology | 0 | 0.0% |
| Business | 0 | 0.0% |
| Education | 0 | 0.0% |
| Literature & Languages | 0 | 0.0% |
| Liberal Arts & History | 0 | 0.0% |
| Visual & Performing Arts | 0 | 0.0% |
| Communications | 0 | 0.0% |
| Arts & Humanities | 0 | 0.0% |
| Total | 0 | 0.0% |
Transportation & Commute in Keene
Vehicle Availability by Sex in Keene
The most prevalent vehicle ownership categories in Keene are males with 3 vehicles (102, accounting for 80.9%) and females with 3 vehicles (70, making up 122.9%).
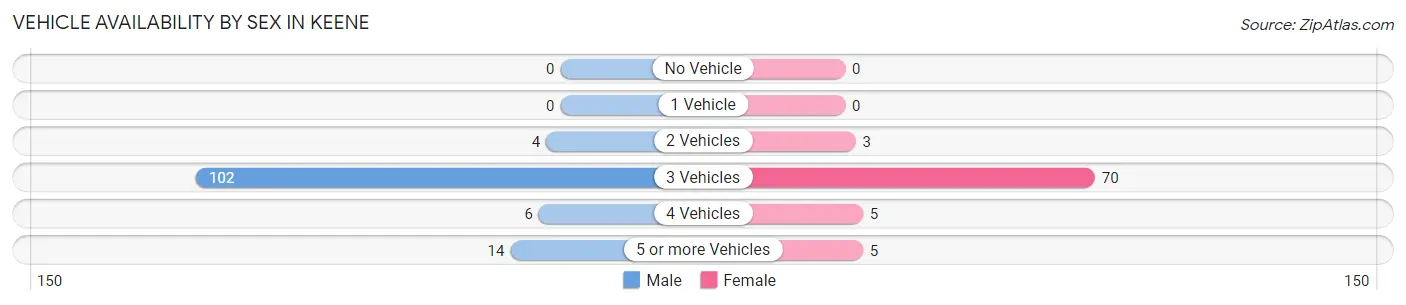
| Vehicles Available | Male | Female |
| No Vehicle | 0 (0.0%) | 0 (0.0%) |
| 1 Vehicle | 0 (0.0%) | 0 (0.0%) |
| 2 Vehicles | 4 (3.2%) | 3 (3.6%) |
| 3 Vehicles | 102 (80.9%) | 70 (84.3%) |
| 4 Vehicles | 6 (4.8%) | 5 (6.0%) |
| 5 or more Vehicles | 14 (11.1%) | 5 (6.0%) |
| Total | 126 (100.0%) | 83 (100.0%) |
Commute Time in Keene
The most frequently occuring commute durations in Keene are 20 to 24 minutes (120 commuters, 57.4%), 25 to 29 minutes (84 commuters, 40.2%), and 5 to 9 minutes (5 commuters, 2.4%).
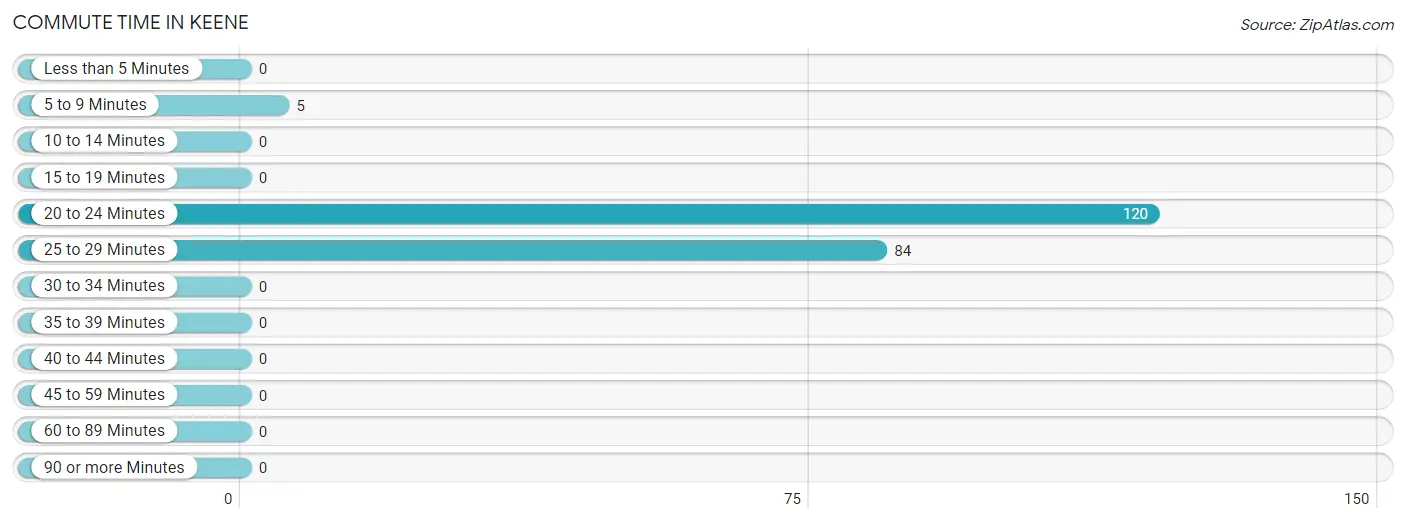
| Commute Time | # Commuters | % Commuters |
| Less than 5 Minutes | 0 | 0.0% |
| 5 to 9 Minutes | 5 | 2.4% |
| 10 to 14 Minutes | 0 | 0.0% |
| 15 to 19 Minutes | 0 | 0.0% |
| 20 to 24 Minutes | 120 | 57.4% |
| 25 to 29 Minutes | 84 | 40.2% |
| 30 to 34 Minutes | 0 | 0.0% |
| 35 to 39 Minutes | 0 | 0.0% |
| 40 to 44 Minutes | 0 | 0.0% |
| 45 to 59 Minutes | 0 | 0.0% |
| 60 to 89 Minutes | 0 | 0.0% |
| 90 or more Minutes | 0 | 0.0% |
Commute Time by Sex in Keene
The most common commute times in Keene are 25 to 29 minutes (84 commuters, 66.7%) for males and 20 to 24 minutes (78 commuters, 94.0%) for females.
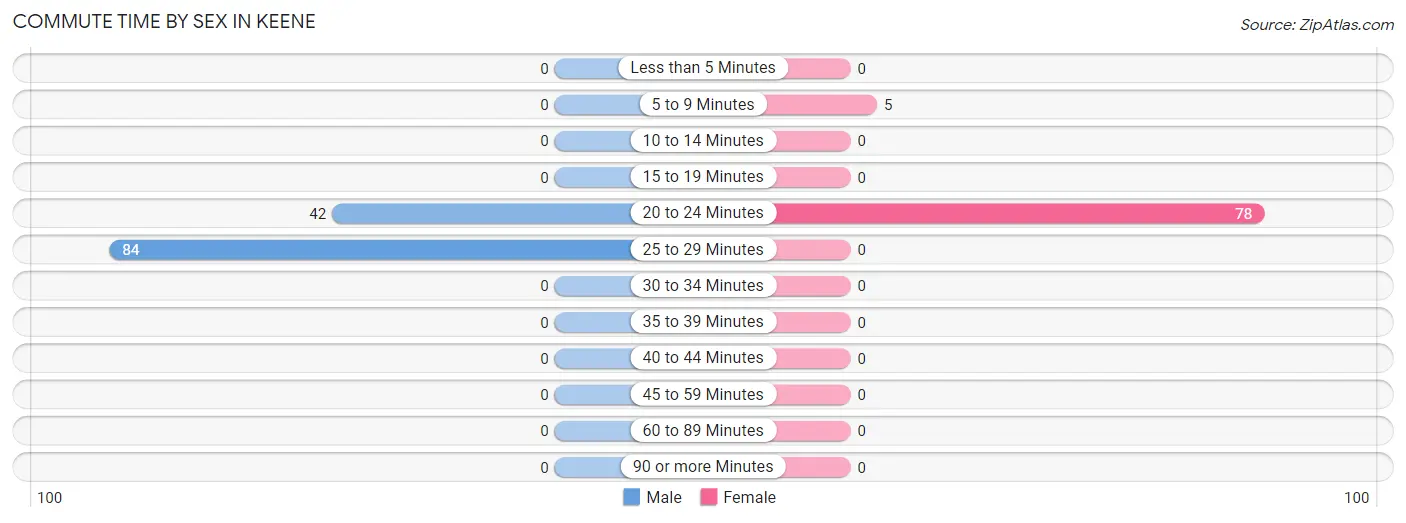
| Commute Time | Male | Female |
| Less than 5 Minutes | 0 (0.0%) | 0 (0.0%) |
| 5 to 9 Minutes | 0 (0.0%) | 5 (6.0%) |
| 10 to 14 Minutes | 0 (0.0%) | 0 (0.0%) |
| 15 to 19 Minutes | 0 (0.0%) | 0 (0.0%) |
| 20 to 24 Minutes | 42 (33.3%) | 78 (94.0%) |
| 25 to 29 Minutes | 84 (66.7%) | 0 (0.0%) |
| 30 to 34 Minutes | 0 (0.0%) | 0 (0.0%) |
| 35 to 39 Minutes | 0 (0.0%) | 0 (0.0%) |
| 40 to 44 Minutes | 0 (0.0%) | 0 (0.0%) |
| 45 to 59 Minutes | 0 (0.0%) | 0 (0.0%) |
| 60 to 89 Minutes | 0 (0.0%) | 0 (0.0%) |
| 90 or more Minutes | 0 (0.0%) | 0 (0.0%) |
Time of Departure to Work by Sex in Keene
The most frequent times of departure to work in Keene are 5:30 AM to 5:59 AM (84, 66.7%) for males and 11:00 AM to 11:59 AM (70, 84.3%) for females.
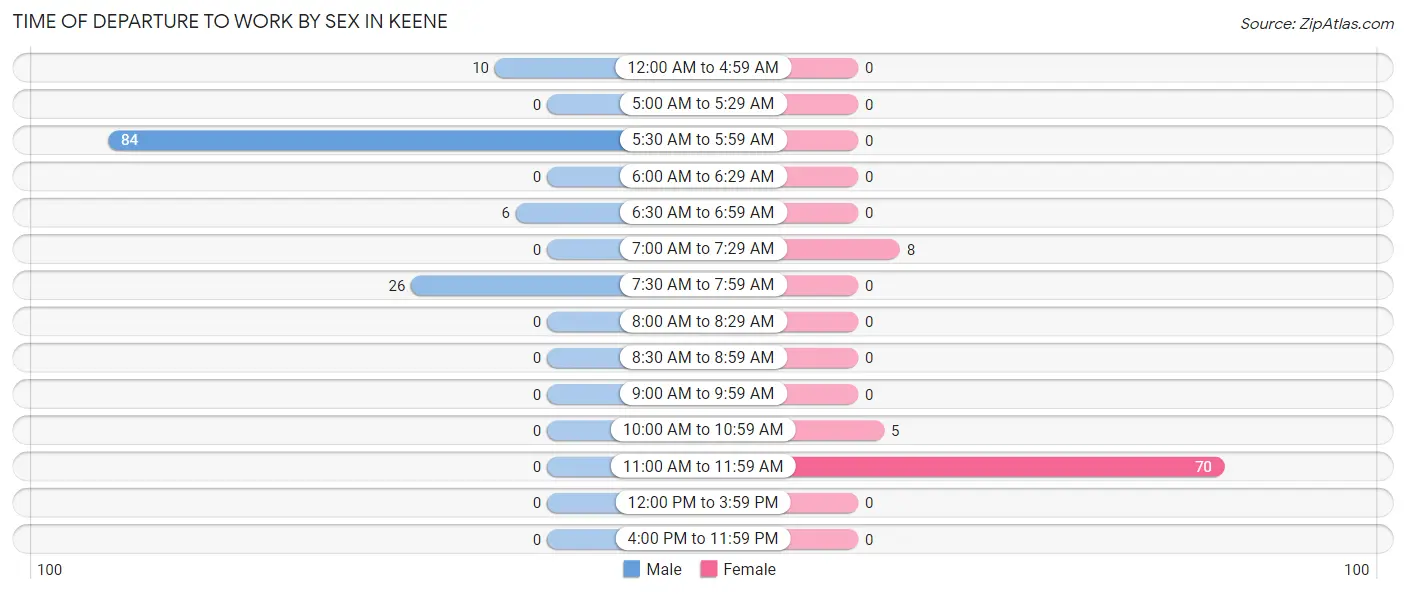
| Time of Departure | Male | Female |
| 12:00 AM to 4:59 AM | 10 (7.9%) | 0 (0.0%) |
| 5:00 AM to 5:29 AM | 0 (0.0%) | 0 (0.0%) |
| 5:30 AM to 5:59 AM | 84 (66.7%) | 0 (0.0%) |
| 6:00 AM to 6:29 AM | 0 (0.0%) | 0 (0.0%) |
| 6:30 AM to 6:59 AM | 6 (4.8%) | 0 (0.0%) |
| 7:00 AM to 7:29 AM | 0 (0.0%) | 8 (9.6%) |
| 7:30 AM to 7:59 AM | 26 (20.6%) | 0 (0.0%) |
| 8:00 AM to 8:29 AM | 0 (0.0%) | 0 (0.0%) |
| 8:30 AM to 8:59 AM | 0 (0.0%) | 0 (0.0%) |
| 9:00 AM to 9:59 AM | 0 (0.0%) | 0 (0.0%) |
| 10:00 AM to 10:59 AM | 0 (0.0%) | 5 (6.0%) |
| 11:00 AM to 11:59 AM | 0 (0.0%) | 70 (84.3%) |
| 12:00 PM to 3:59 PM | 0 (0.0%) | 0 (0.0%) |
| 4:00 PM to 11:59 PM | 0 (0.0%) | 0 (0.0%) |
| Total | 126 (100.0%) | 83 (100.0%) |
Housing Occupancy in Keene
Occupancy by Ownership in Keene
Of the total 41 dwellings in Keene, owner-occupied units account for 35 (85.4%), while renter-occupied units make up 6 (14.6%).
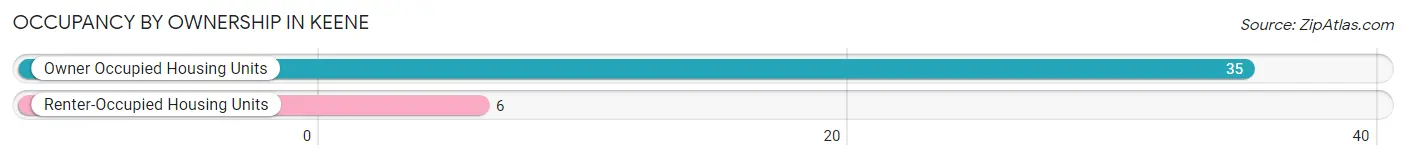
| Occupancy | # Housing Units | % Housing Units |
| Owner Occupied Housing Units | 35 | 85.4% |
| Renter-Occupied Housing Units | 6 | 14.6% |
| Total Occupied Housing Units | 41 | 100.0% |
Occupancy by Household Size in Keene
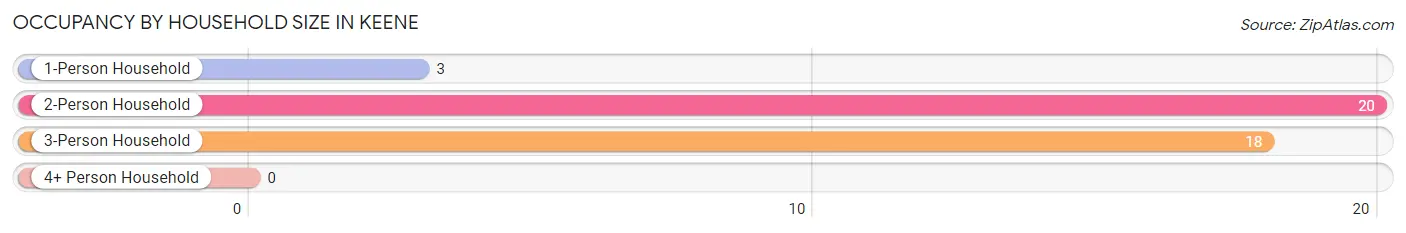
| Household Size | # Housing Units | % Housing Units |
| 1-Person Household | 3 | 7.3% |
| 2-Person Household | 20 | 48.8% |
| 3-Person Household | 18 | 43.9% |
| 4+ Person Household | 0 | 0.0% |
| Total Housing Units | 41 | 100.0% |
Occupancy by Ownership by Household Size in Keene
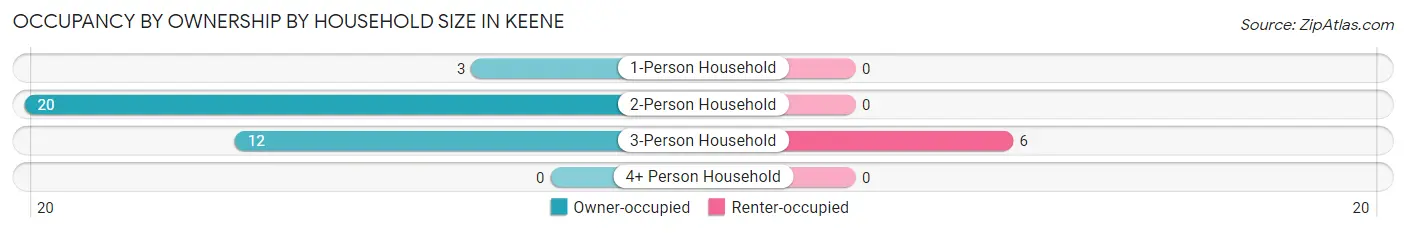
| Household Size | Owner-occupied | Renter-occupied |
| 1-Person Household | 3 (100.0%) | 0 (0.0%) |
| 2-Person Household | 20 (100.0%) | 0 (0.0%) |
| 3-Person Household | 12 (66.7%) | 6 (33.3%) |
| 4+ Person Household | 0 (0.0%) | 0 (0.0%) |
| Total Housing Units | 35 (85.4%) | 6 (14.6%) |
Occupancy by Educational Attainment in Keene
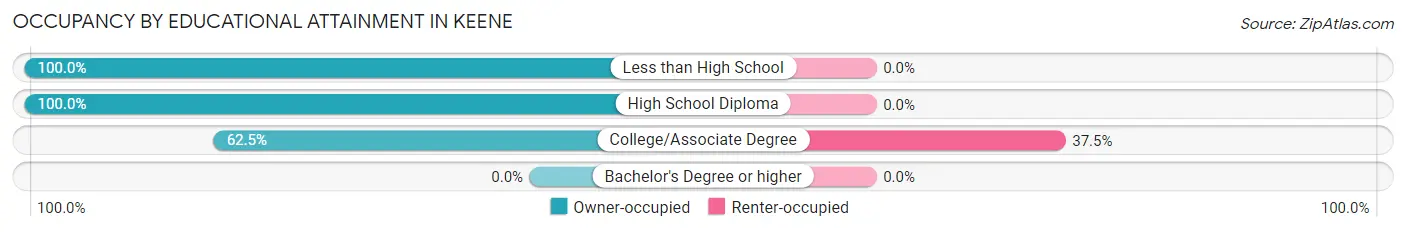
| Household Size | Owner-occupied | Renter-occupied |
| Less than High School | 24 (100.0%) | 0 (0.0%) |
| High School Diploma | 1 (100.0%) | 0 (0.0%) |
| College/Associate Degree | 10 (62.5%) | 6 (37.5%) |
| Bachelor's Degree or higher | 0 (0.0%) | 0 (0.0%) |
Occupancy by Age of Householder in Keene
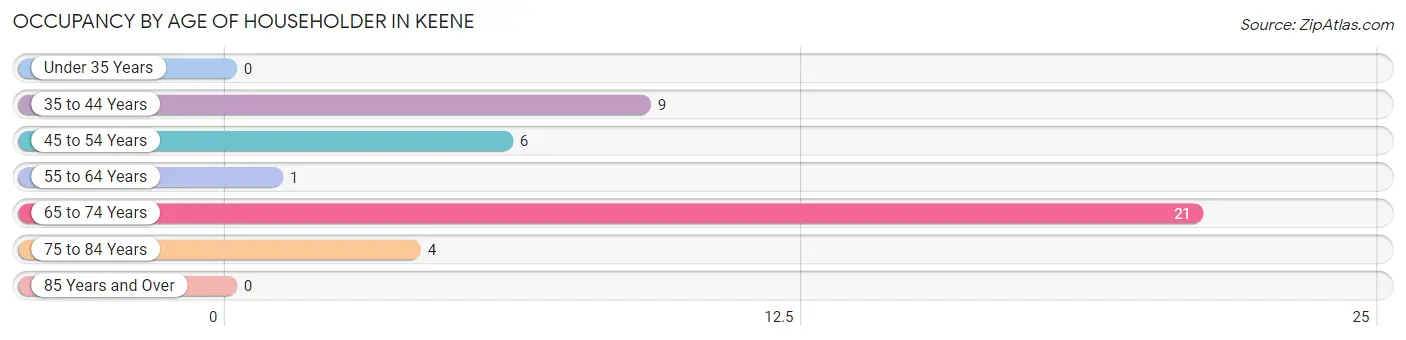
| Age Bracket | # Households | % Households |
| Under 35 Years | 0 | 0.0% |
| 35 to 44 Years | 9 | 22.0% |
| 45 to 54 Years | 6 | 14.6% |
| 55 to 64 Years | 1 | 2.4% |
| 65 to 74 Years | 21 | 51.2% |
| 75 to 84 Years | 4 | 9.8% |
| 85 Years and Over | 0 | 0.0% |
| Total | 41 | 100.0% |
Housing Finances in Keene
Median Income by Occupancy in Keene
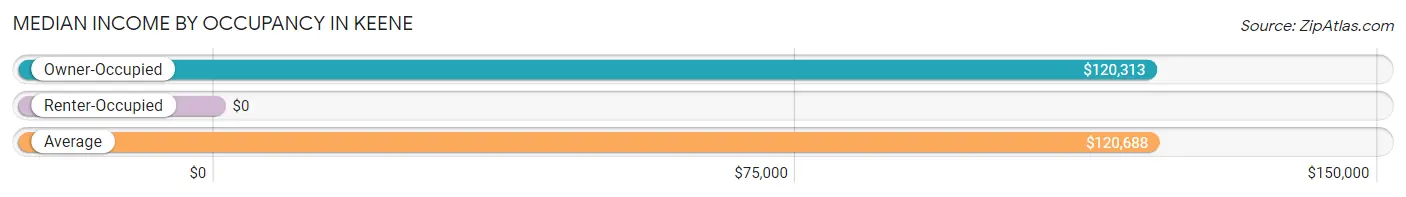
| Occupancy Type | # Households | Median Income |
| Owner-Occupied | 35 (85.4%) | $120,313 |
| Renter-Occupied | 6 (14.6%) | $0 |
| Average | 41 (100.0%) | $120,688 |
Occupancy by Householder Income Bracket in Keene
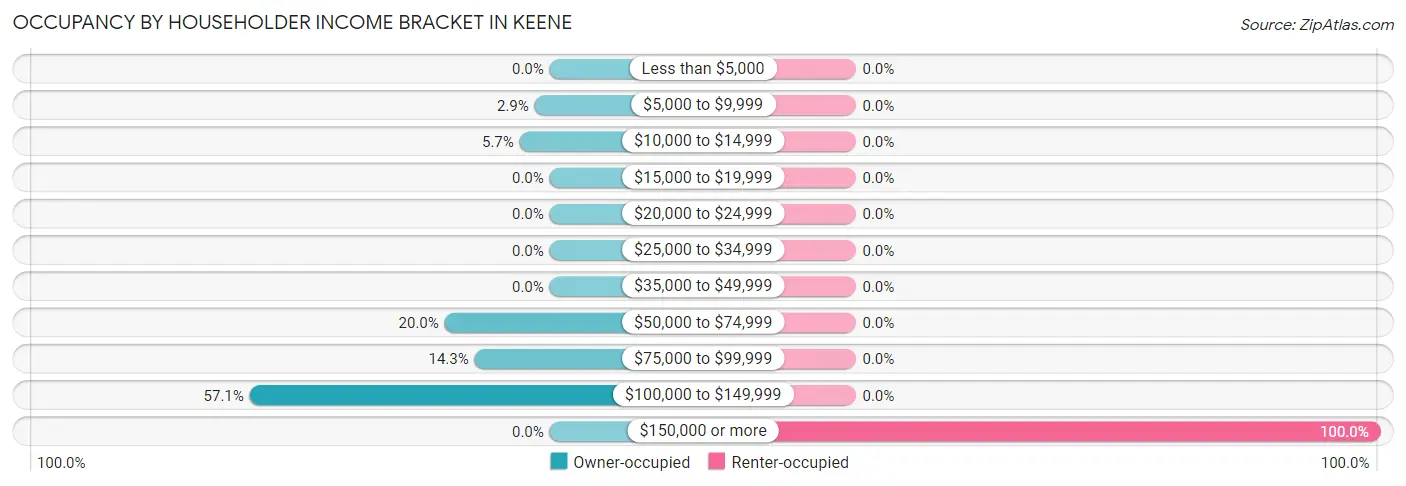
| Income Bracket | Owner-occupied | Renter-occupied |
| Less than $5,000 | 0 (0.0%) | 0 (0.0%) |
| $5,000 to $9,999 | 1 (2.9%) | 0 (0.0%) |
| $10,000 to $14,999 | 2 (5.7%) | 0 (0.0%) |
| $15,000 to $19,999 | 0 (0.0%) | 0 (0.0%) |
| $20,000 to $24,999 | 0 (0.0%) | 0 (0.0%) |
| $25,000 to $34,999 | 0 (0.0%) | 0 (0.0%) |
| $35,000 to $49,999 | 0 (0.0%) | 0 (0.0%) |
| $50,000 to $74,999 | 7 (20.0%) | 0 (0.0%) |
| $75,000 to $99,999 | 5 (14.3%) | 0 (0.0%) |
| $100,000 to $149,999 | 20 (57.1%) | 0 (0.0%) |
| $150,000 or more | 0 (0.0%) | 6 (100.0%) |
| Total | 35 (100.0%) | 6 (100.0%) |
Monthly Housing Cost Tiers in Keene
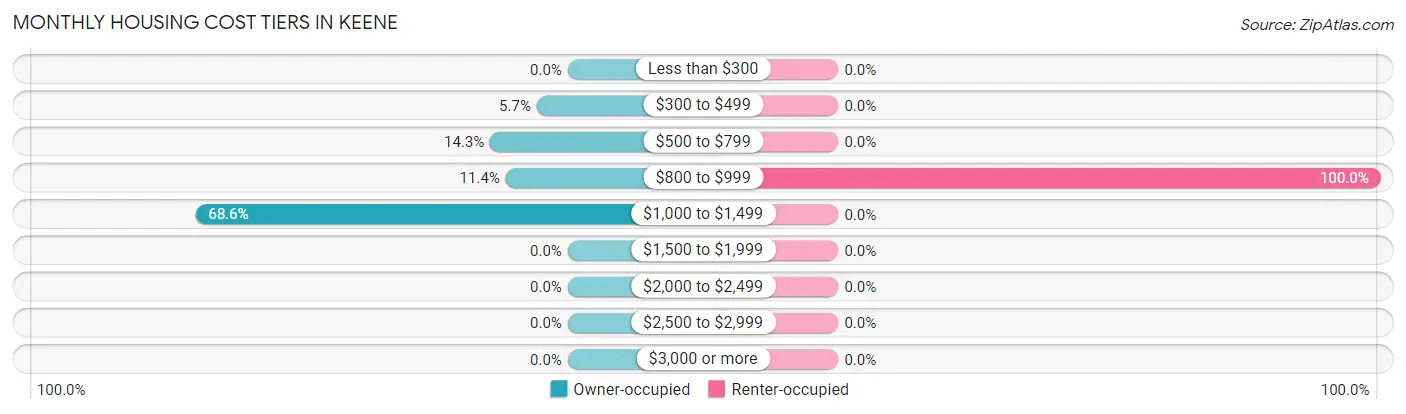
| Monthly Cost | Owner-occupied | Renter-occupied |
| Less than $300 | 0 (0.0%) | 0 (0.0%) |
| $300 to $499 | 2 (5.7%) | 0 (0.0%) |
| $500 to $799 | 5 (14.3%) | 0 (0.0%) |
| $800 to $999 | 4 (11.4%) | 6 (100.0%) |
| $1,000 to $1,499 | 24 (68.6%) | 0 (0.0%) |
| $1,500 to $1,999 | 0 (0.0%) | 0 (0.0%) |
| $2,000 to $2,499 | 0 (0.0%) | 0 (0.0%) |
| $2,500 to $2,999 | 0 (0.0%) | 0 (0.0%) |
| $3,000 or more | 0 (0.0%) | 0 (0.0%) |
| Total | 35 (100.0%) | 6 (100.0%) |
Physical Housing Characteristics in Keene
Housing Structures in Keene
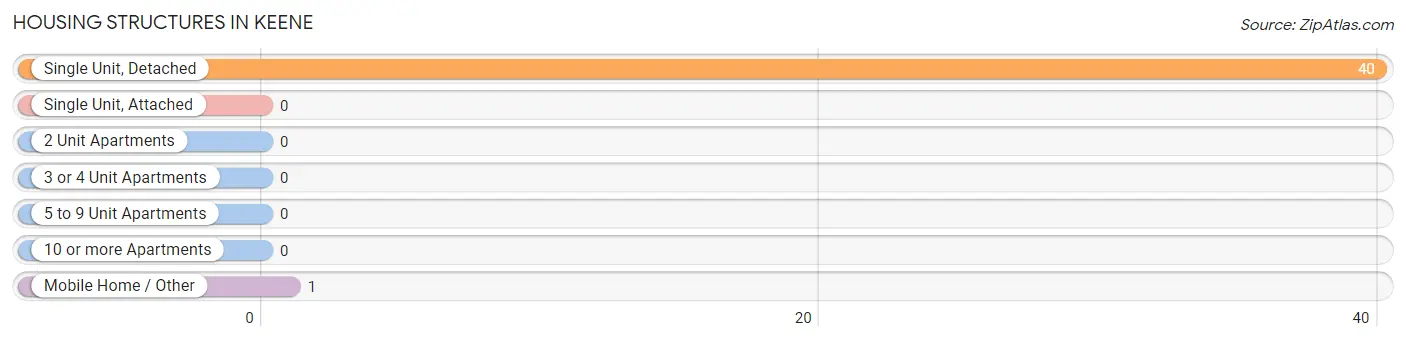
| Structure Type | # Housing Units | % Housing Units |
| Single Unit, Detached | 40 | 97.6% |
| Single Unit, Attached | 0 | 0.0% |
| 2 Unit Apartments | 0 | 0.0% |
| 3 or 4 Unit Apartments | 0 | 0.0% |
| 5 to 9 Unit Apartments | 0 | 0.0% |
| 10 or more Apartments | 0 | 0.0% |
| Mobile Home / Other | 1 | 2.4% |
| Total | 41 | 100.0% |
Housing Structures by Occupancy in Keene
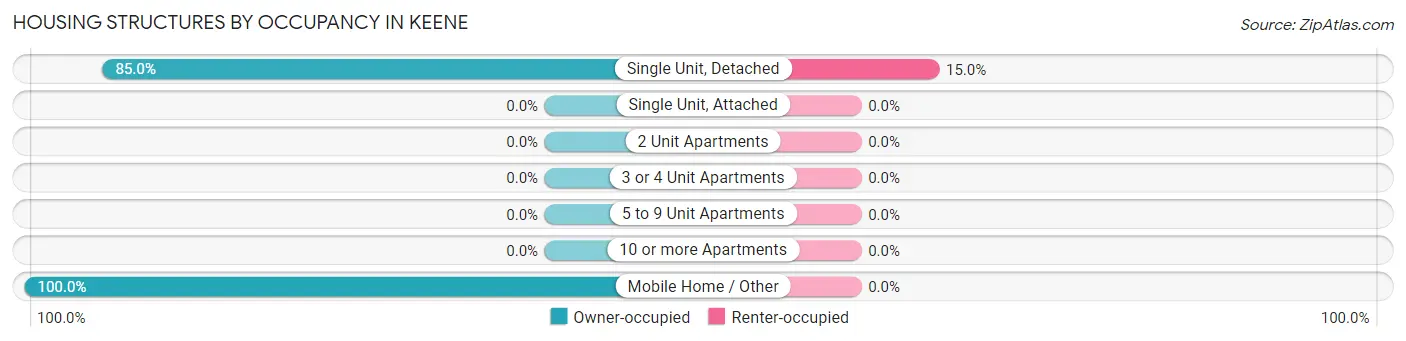
| Structure Type | Owner-occupied | Renter-occupied |
| Single Unit, Detached | 34 (85.0%) | 6 (15.0%) |
| Single Unit, Attached | 0 (0.0%) | 0 (0.0%) |
| 2 Unit Apartments | 0 (0.0%) | 0 (0.0%) |
| 3 or 4 Unit Apartments | 0 (0.0%) | 0 (0.0%) |
| 5 to 9 Unit Apartments | 0 (0.0%) | 0 (0.0%) |
| 10 or more Apartments | 0 (0.0%) | 0 (0.0%) |
| Mobile Home / Other | 1 (100.0%) | 0 (0.0%) |
| Total | 35 (85.4%) | 6 (14.6%) |
Housing Structures by Number of Rooms in Keene
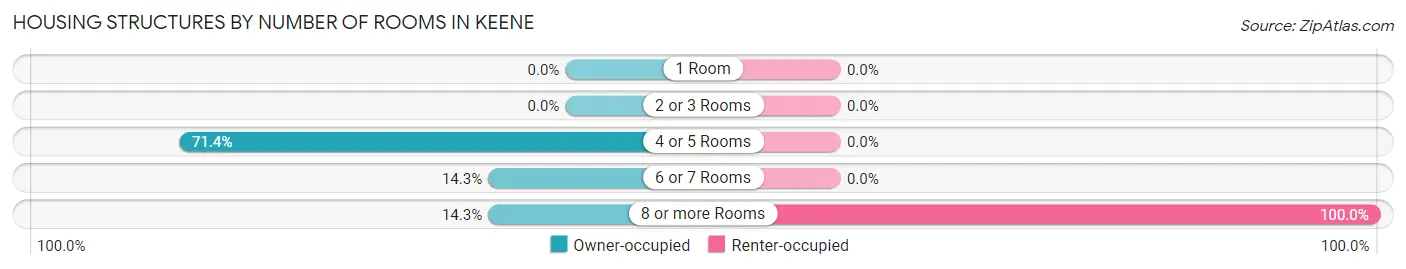
| Number of Rooms | Owner-occupied | Renter-occupied |
| 1 Room | 0 (0.0%) | 0 (0.0%) |
| 2 or 3 Rooms | 0 (0.0%) | 0 (0.0%) |
| 4 or 5 Rooms | 25 (71.4%) | 0 (0.0%) |
| 6 or 7 Rooms | 5 (14.3%) | 0 (0.0%) |
| 8 or more Rooms | 5 (14.3%) | 6 (100.0%) |
| Total | 35 (100.0%) | 6 (100.0%) |
Housing Structure by Heating Type in Keene
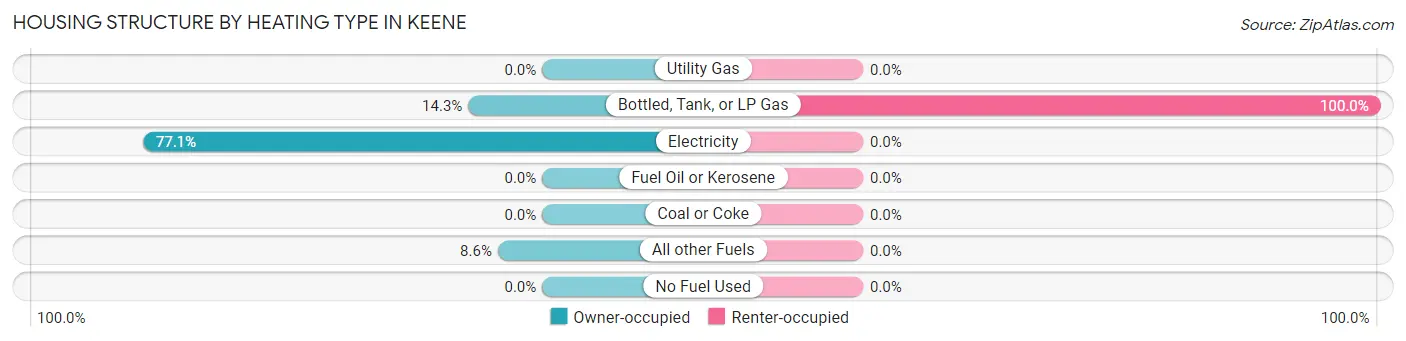
| Heating Type | Owner-occupied | Renter-occupied |
| Utility Gas | 0 (0.0%) | 0 (0.0%) |
| Bottled, Tank, or LP Gas | 5 (14.3%) | 6 (100.0%) |
| Electricity | 27 (77.1%) | 0 (0.0%) |
| Fuel Oil or Kerosene | 0 (0.0%) | 0 (0.0%) |
| Coal or Coke | 0 (0.0%) | 0 (0.0%) |
| All other Fuels | 3 (8.6%) | 0 (0.0%) |
| No Fuel Used | 0 (0.0%) | 0 (0.0%) |
| Total | 35 (100.0%) | 6 (100.0%) |
Household Vehicle Usage in Keene
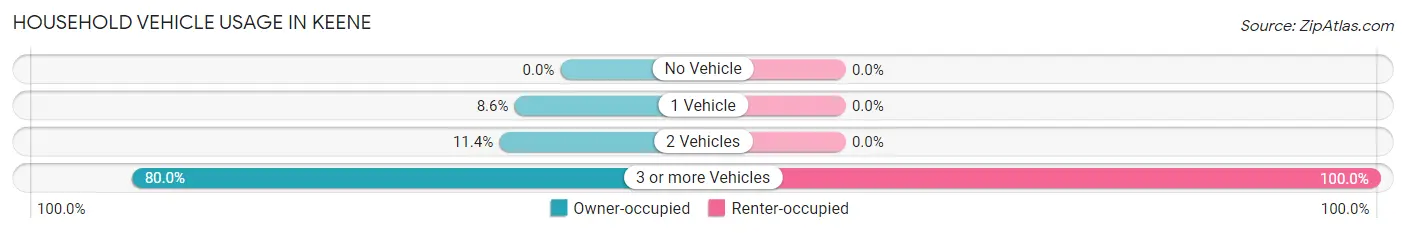
| Vehicles per Household | Owner-occupied | Renter-occupied |
| No Vehicle | 0 (0.0%) | 0 (0.0%) |
| 1 Vehicle | 3 (8.6%) | 0 (0.0%) |
| 2 Vehicles | 4 (11.4%) | 0 (0.0%) |
| 3 or more Vehicles | 28 (80.0%) | 6 (100.0%) |
| Total | 35 (100.0%) | 6 (100.0%) |
Real Estate & Mortgages in Keene
Real Estate and Mortgage Overview in Keene
| Characteristic | Without Mortgage | With Mortgage |
| Housing Units | 5 | 30 |
| Median Property Value | $32,500 | $0 |
| Median Household Income | - | - |
| Monthly Housing Costs | $817 | $0 |
| Real Estate Taxes | - | - |
Property Value by Mortgage Status in Keene
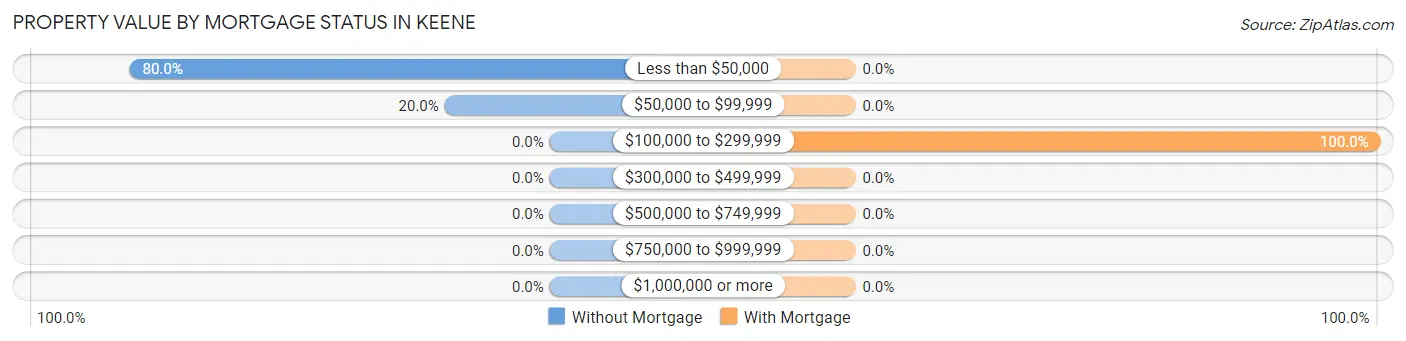
| Property Value | Without Mortgage | With Mortgage |
| Less than $50,000 | 4 (80.0%) | 0 (0.0%) |
| $50,000 to $99,999 | 1 (20.0%) | 0 (0.0%) |
| $100,000 to $299,999 | 0 (0.0%) | 30 (100.0%) |
| $300,000 to $499,999 | 0 (0.0%) | 0 (0.0%) |
| $500,000 to $749,999 | 0 (0.0%) | 0 (0.0%) |
| $750,000 to $999,999 | 0 (0.0%) | 0 (0.0%) |
| $1,000,000 or more | 0 (0.0%) | 0 (0.0%) |
| Total | 5 (100.0%) | 30 (100.0%) |
Household Income by Mortgage Status in Keene
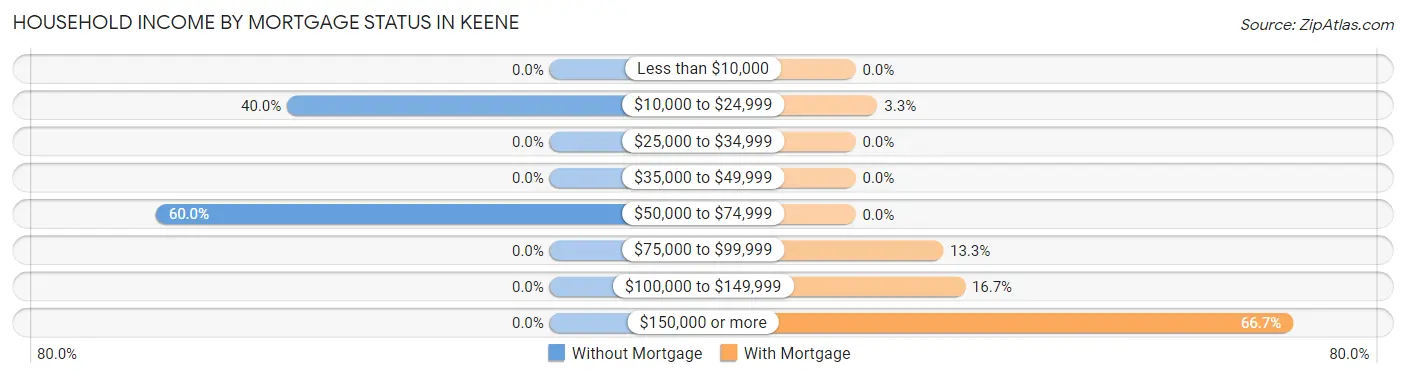
| Household Income | Without Mortgage | With Mortgage |
| Less than $10,000 | 0 (0.0%) | 0 (0.0%) |
| $10,000 to $24,999 | 2 (40.0%) | 1 (3.3%) |
| $25,000 to $34,999 | 0 (0.0%) | 0 (0.0%) |
| $35,000 to $49,999 | 0 (0.0%) | 0 (0.0%) |
| $50,000 to $74,999 | 3 (60.0%) | 0 (0.0%) |
| $75,000 to $99,999 | 0 (0.0%) | 4 (13.3%) |
| $100,000 to $149,999 | 0 (0.0%) | 5 (16.7%) |
| $150,000 or more | 0 (0.0%) | 20 (66.7%) |
| Total | 5 (100.0%) | 30 (100.0%) |
Property Value to Household Income Ratio in Keene
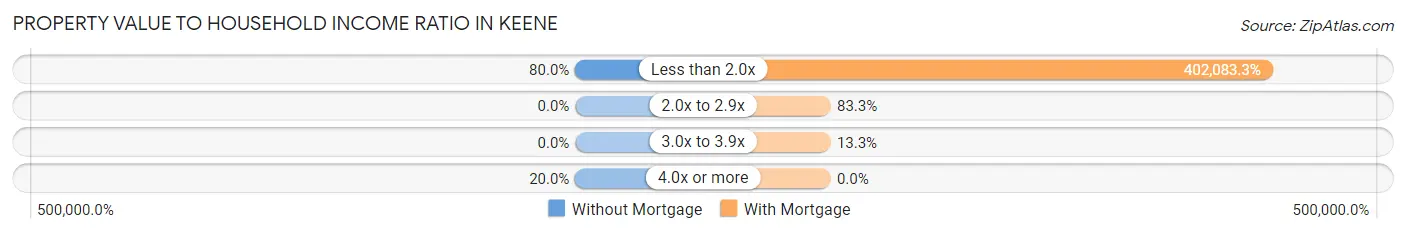
| Value-to-Income Ratio | Without Mortgage | With Mortgage |
| Less than 2.0x | 4 (80.0%) | 120,625 (402,083.3%) |
| 2.0x to 2.9x | 0 (0.0%) | 25 (83.3%) |
| 3.0x to 3.9x | 0 (0.0%) | 4 (13.3%) |
| 4.0x or more | 1 (20.0%) | 0 (0.0%) |
| Total | 5 (100.0%) | 30 (100.0%) |
Real Estate Taxes by Mortgage Status in Keene
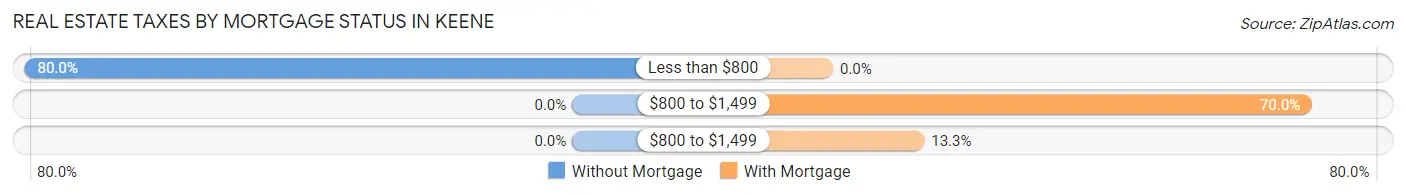
| Property Taxes | Without Mortgage | With Mortgage |
| Less than $800 | 4 (80.0%) | 0 (0.0%) |
| $800 to $1,499 | 0 (0.0%) | 21 (70.0%) |
| $800 to $1,499 | 0 (0.0%) | 4 (13.3%) |
| Total | 5 (100.0%) | 30 (100.0%) |
Health & Disability in Keene
Health Insurance Coverage by Age in Keene
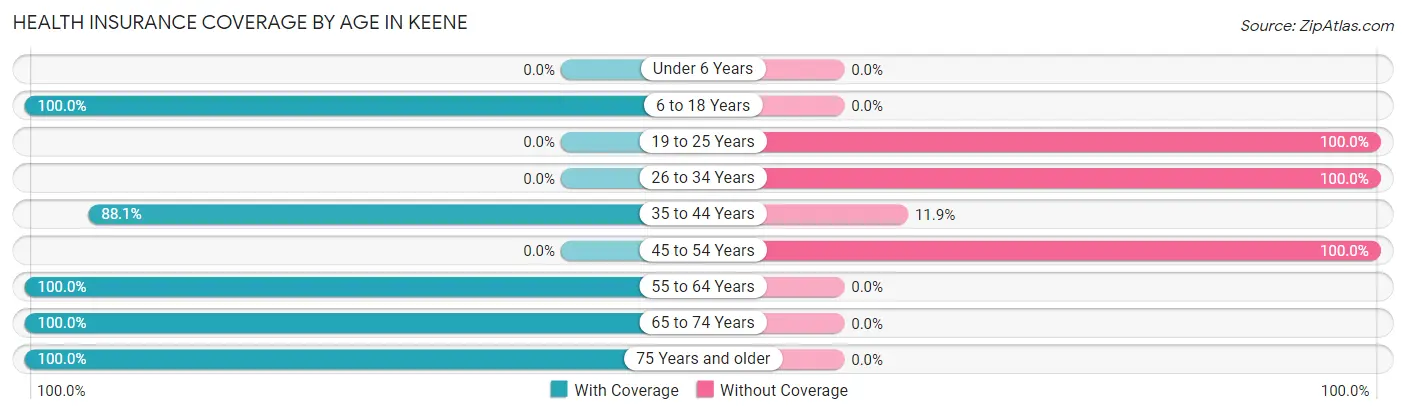
| Age Bracket | With Coverage | Without Coverage |
| Under 6 Years | 0 (0.0%) | 0 (0.0%) |
| 6 to 18 Years | 4 (100.0%) | 0 (0.0%) |
| 19 to 25 Years | 0 (0.0%) | 8 (100.0%) |
| 26 to 34 Years | 0 (0.0%) | 8 (100.0%) |
| 35 to 44 Years | 89 (88.1%) | 12 (11.9%) |
| 45 to 54 Years | 0 (0.0%) | 12 (100.0%) |
| 55 to 64 Years | 71 (100.0%) | 0 (0.0%) |
| 65 to 74 Years | 39 (100.0%) | 0 (0.0%) |
| 75 Years and older | 4 (100.0%) | 0 (0.0%) |
| Total | 207 (83.8%) | 40 (16.2%) |
Health Insurance Coverage by Citizenship Status in Keene
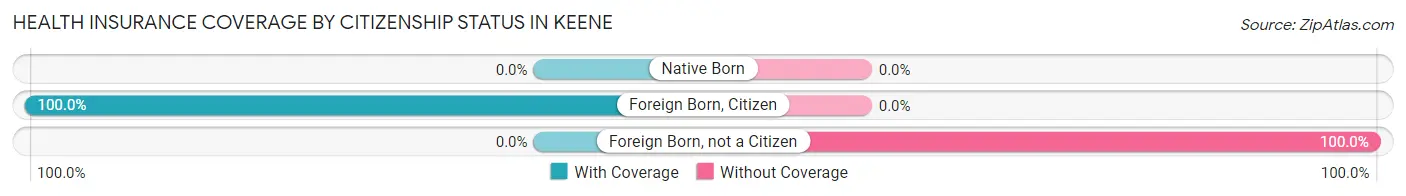
| Citizenship Status | With Coverage | Without Coverage |
| Native Born | 0 (0.0%) | 0 (0.0%) |
| Foreign Born, Citizen | 4 (100.0%) | 0 (0.0%) |
| Foreign Born, not a Citizen | 0 (0.0%) | 8 (100.0%) |
Health Insurance Coverage by Household Income in Keene
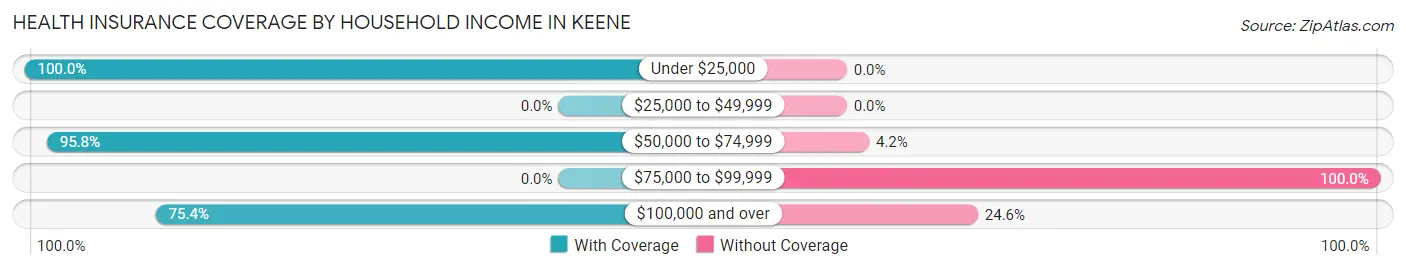
| Household Income | With Coverage | Without Coverage |
| Under $25,000 | 3 (100.0%) | 0 (0.0%) |
| $25,000 to $49,999 | 0 (0.0%) | 0 (0.0%) |
| $50,000 to $74,999 | 161 (95.8%) | 7 (4.2%) |
| $75,000 to $99,999 | 0 (0.0%) | 19 (100.0%) |
| $100,000 and over | 43 (75.4%) | 14 (24.6%) |
Public vs Private Health Insurance Coverage by Age in Keene
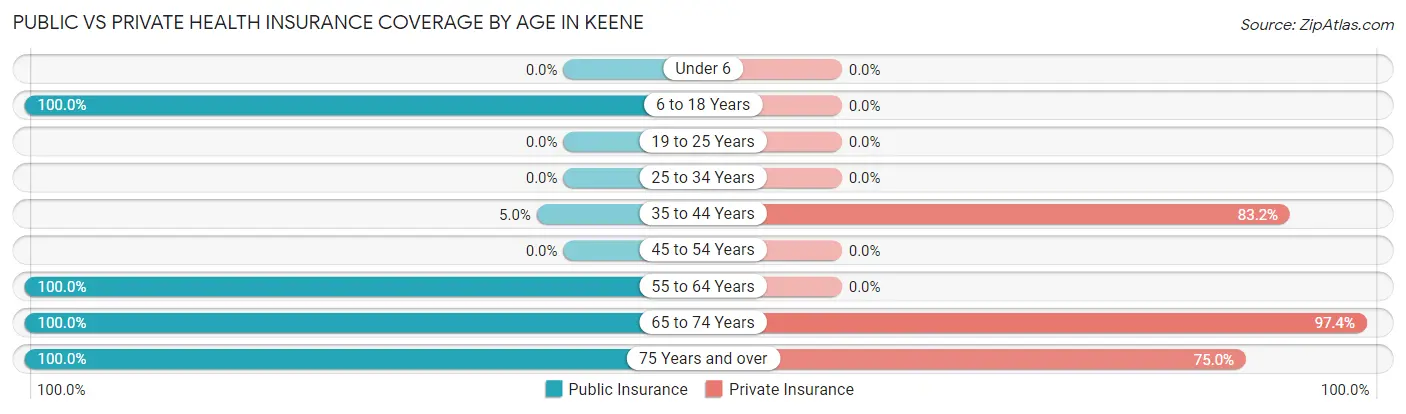
| Age Bracket | Public Insurance | Private Insurance |
| Under 6 | 0 (0.0%) | 0 (0.0%) |
| 6 to 18 Years | 4 (100.0%) | 0 (0.0%) |
| 19 to 25 Years | 0 (0.0%) | 0 (0.0%) |
| 25 to 34 Years | 0 (0.0%) | 0 (0.0%) |
| 35 to 44 Years | 5 (5.0%) | 84 (83.2%) |
| 45 to 54 Years | 0 (0.0%) | 0 (0.0%) |
| 55 to 64 Years | 71 (100.0%) | 0 (0.0%) |
| 65 to 74 Years | 39 (100.0%) | 38 (97.4%) |
| 75 Years and over | 4 (100.0%) | 3 (75.0%) |
| Total | 123 (49.8%) | 125 (50.6%) |
Disability Status by Sex by Age in Keene
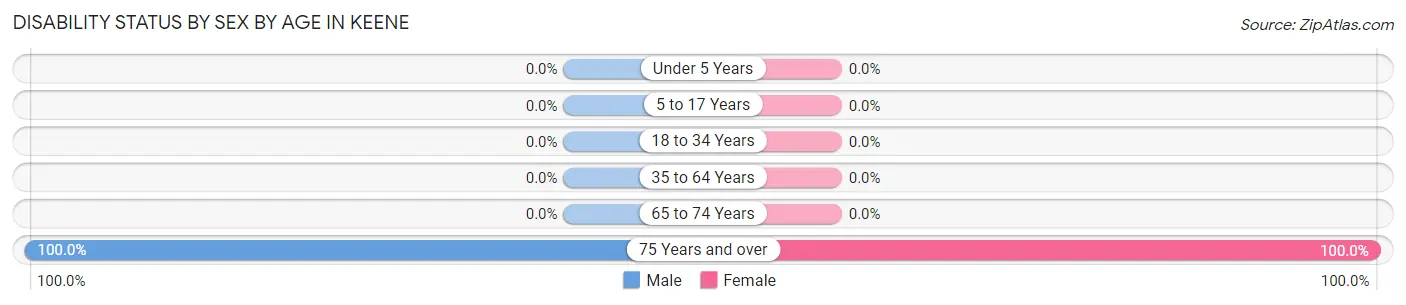
| Age Bracket | Male | Female |
| Under 5 Years | 0 (0.0%) | 0 (0.0%) |
| 5 to 17 Years | 0 (0.0%) | 0 (0.0%) |
| 18 to 34 Years | 0 (0.0%) | 0 (0.0%) |
| 35 to 64 Years | 0 (0.0%) | 0 (0.0%) |
| 65 to 74 Years | 0 (0.0%) | 0 (0.0%) |
| 75 Years and over | 3 (100.0%) | 1 (100.0%) |
Disability Class by Sex by Age in Keene
Disability Class: Hearing Difficulty
| Age Bracket | Male | Female |
| Under 5 Years | 0 (0.0%) | 0 (0.0%) |
| 5 to 17 Years | 0 (0.0%) | 0 (0.0%) |
| 18 to 34 Years | 0 (0.0%) | 0 (0.0%) |
| 35 to 64 Years | 0 (0.0%) | 0 (0.0%) |
| 65 to 74 Years | 0 (0.0%) | 0 (0.0%) |
| 75 Years and over | 0 (0.0%) | 0 (0.0%) |
Disability Class: Vision Difficulty
| Age Bracket | Male | Female |
| Under 5 Years | 0 (0.0%) | 0 (0.0%) |
| 5 to 17 Years | 0 (0.0%) | 0 (0.0%) |
| 18 to 34 Years | 0 (0.0%) | 0 (0.0%) |
| 35 to 64 Years | 0 (0.0%) | 0 (0.0%) |
| 65 to 74 Years | 0 (0.0%) | 0 (0.0%) |
| 75 Years and over | 0 (0.0%) | 0 (0.0%) |
Disability Class: Cognitive Difficulty
| Age Bracket | Male | Female |
| 5 to 17 Years | 0 (0.0%) | 0 (0.0%) |
| 18 to 34 Years | 0 (0.0%) | 0 (0.0%) |
| 35 to 64 Years | 0 (0.0%) | 0 (0.0%) |
| 65 to 74 Years | 0 (0.0%) | 0 (0.0%) |
| 75 Years and over | 0 (0.0%) | 1 (100.0%) |
Disability Class: Ambulatory Difficulty
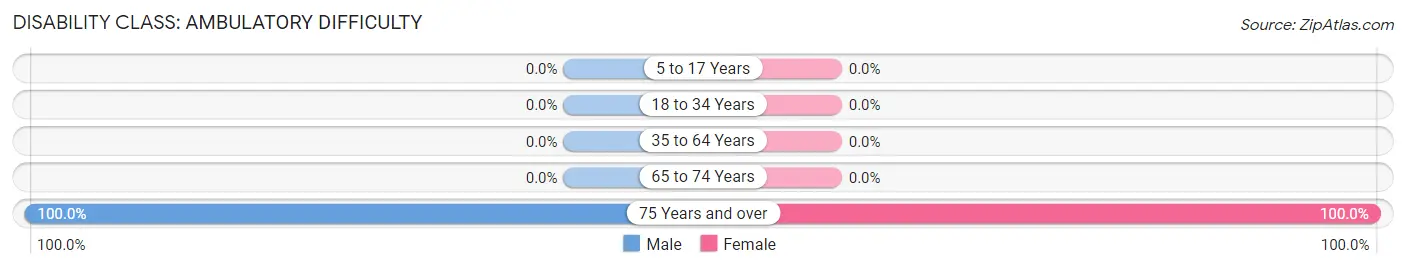
| Age Bracket | Male | Female |
| 5 to 17 Years | 0 (0.0%) | 0 (0.0%) |
| 18 to 34 Years | 0 (0.0%) | 0 (0.0%) |
| 35 to 64 Years | 0 (0.0%) | 0 (0.0%) |
| 65 to 74 Years | 0 (0.0%) | 0 (0.0%) |
| 75 Years and over | 3 (100.0%) | 1 (100.0%) |
Disability Class: Self-Care Difficulty
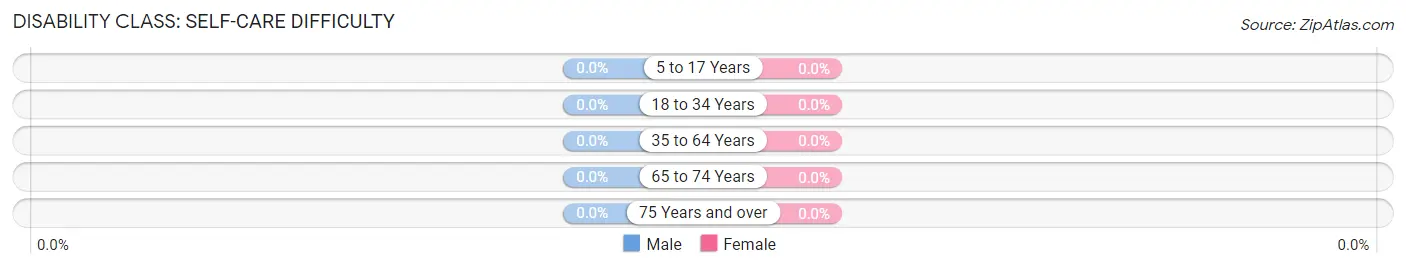
| Age Bracket | Male | Female |
| 5 to 17 Years | 0 (0.0%) | 0 (0.0%) |
| 18 to 34 Years | 0 (0.0%) | 0 (0.0%) |
| 35 to 64 Years | 0 (0.0%) | 0 (0.0%) |
| 65 to 74 Years | 0 (0.0%) | 0 (0.0%) |
| 75 Years and over | 0 (0.0%) | 0 (0.0%) |
Technology Access in Keene
Computing Device Access in Keene
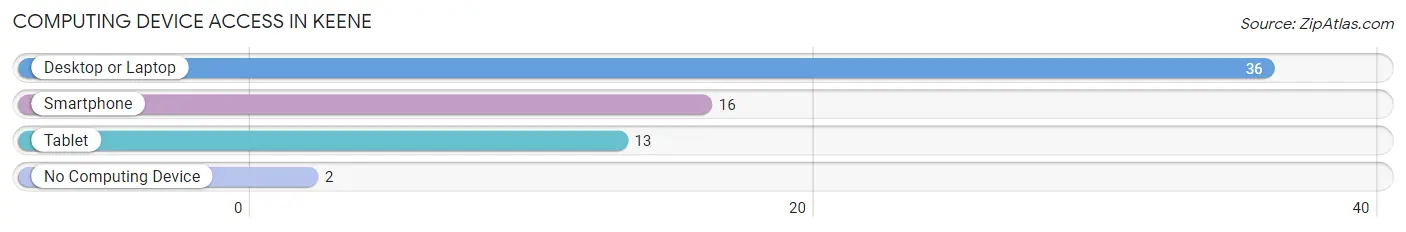
| Device Type | # Households | % Households |
| Desktop or Laptop | 36 | 87.8% |
| Smartphone | 16 | 39.0% |
| Tablet | 13 | 31.7% |
| No Computing Device | 2 | 4.9% |
| Total | 41 | 100.0% |
Internet Access in Keene
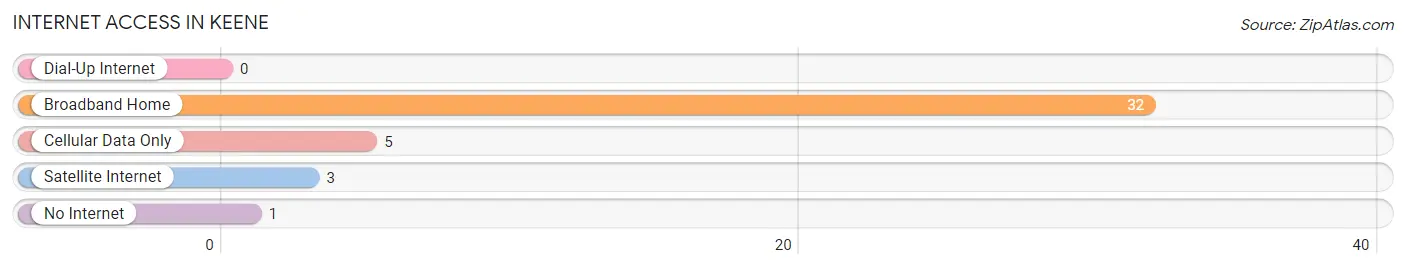
| Internet Type | # Households | % Households |
| Dial-Up Internet | 0 | 0.0% |
| Broadband Home | 32 | 78.0% |
| Cellular Data Only | 5 | 12.2% |
| Satellite Internet | 3 | 7.3% |
| No Internet | 1 | 2.4% |
| Total | 41 | 100.0% |
Keene Summary
Keene, Kentucky is a small unincorporated community located in the eastern part of the state, in the foothills of the Appalachian Mountains. It is situated in the heart of the Daniel Boone National Forest, and is surrounded by the Red River Gorge Geological Area. The community is located in the county of Wolfe, and is part of the larger Morehead-Cainesboro metropolitan area.
History
Keene was first settled in the early 1800s by a group of settlers from North Carolina. The community was named after the nearby Keene Creek, which was named after a local Native American chief. The first post office in the area was established in 1845, and the town was officially incorporated in 1848.
The town was a popular stop for travelers on the stagecoach line that ran between Lexington and Morehead. The town was also a popular destination for hunters and fishermen, as the area was known for its abundance of game and fish.
In the late 1800s, the town began to experience a period of growth and prosperity. The railroad was extended to the town in 1891, and the town was connected to the rest of the state by the completion of the Kentucky Turnpike in the early 1900s.
Geography
Keene is located in the eastern part of the state, in the foothills of the Appalachian Mountains. The town is situated in the heart of the Daniel Boone National Forest, and is surrounded by the Red River Gorge Geological Area. The town is located in the county of Wolfe, and is part of the larger Morehead-Cainesboro metropolitan area.
The town is located at an elevation of 1,000 feet above sea level, and is situated on the banks of the Red River. The town is located approximately 30 miles from Lexington, and is approximately 60 miles from the state capital of Frankfort.
Economy
The economy of Keene is largely based on tourism and outdoor recreation. The town is a popular destination for hikers, campers, and hunters, and is home to several popular tourist attractions, including the Red River Gorge Geological Area and the Daniel Boone National Forest.
The town is also home to several small businesses, including restaurants, shops, and lodging. The town is also home to a small manufacturing plant, which produces a variety of products, including furniture and clothing.
Demographics
As of the 2010 census, the population of Keene was 1,092. The racial makeup of the town was 97.3% White, 0.9% African American, 0.2% Native American, 0.2% Asian, 0.2% from other races, and 1.4% from two or more races. Hispanic or Latino of any race were 0.9% of the population.
The median household income in Keene was $30,938, and the median family income was $37,500. The per capita income for the town was $17,845. About 16.2% of families and 19.2% of the population were below the poverty line, including 25.2% of those under age 18 and 11.3% of those age 65 or over.
Common Questions
What is Per Capita Income in Keene?
Per Capita income in Keene is $34,041.
What is the Median Family Income in Keene?
Median Family Income in Keene is $120,875.
What is the Median Household income in Keene?
Median Household Income in Keene is $120,688.
What is Income or Wage Gap in Keene?
Income or Wage Gap in Keene is 85.0%.
Women in Keene earn 15.0 cents for every dollar earned by a man.
What is Inequality or Gini Index in Keene?
Inequality or Gini Index in Keene is 0.26.
What is the Total Population of Keene?
Total Population of Keene is 247.
What is the Total Male Population of Keene?
Total Male Population of Keene is 141.
What is the Total Female Population of Keene?
Total Female Population of Keene is 106.
What is the Ratio of Males per 100 Females in Keene?
There are 133.02 Males per 100 Females in Keene.
What is the Ratio of Females per 100 Males in Keene?
There are 75.18 Females per 100 Males in Keene.
What is the Median Population Age in Keene?
Median Population Age in Keene is 48.4 Years.
What is the Average Family Size in Keene
Average Family Size in Keene is 4.2 People.
What is the Average Household Size in Keene
Average Household Size in Keene is 6.0 People.
How Large is the Labor Force in Keene?
There are 209 People in the Labor Forcein in Keene.
What is the Percentage of People in the Labor Force in Keene?
84.6% of People are in the Labor Force in Keene.